Embed Size (px)
Citation preview
Biomedical Component 2014
Student & Teacher Summer Institute Results

Student Results

Program Highlights
• Significant differences found between this year and last year’s camp in following areas:
– AFFILIATION WITH FACULTY AND STAY ON CAMPUS INCREASING INTEREST IN ATTENDING COLLEGE.
– INCREASED INTEREST IN SCIENCE AND MATH– LEARNING EXPERIENCES

Has your affiliation and interaction with university faculty members increased your interest in attending college?
2014N=1352013 = 92.5% (N=161) T-test between %’s t-statistic=3.469; df=294Two-tailed prob. =.0006
Yes79%
No21%

Has your week long stay at a university campus influenced your decision to attend college?
2014N= 1362013 = 83% (N=161) T-test between %’s t-statistic=2.654; df=295 Two-tailed prob. =.0084
70%
30%

Has participating in the Biomed HSTA Summer Institute increased your interest in science?
2014 N = 1362013 = 85% (N=158)
t-statistic = 1.955df=292 Two-tailed prob.=.0515
0%
10%
20%
30%
40%
50%
60%
70%
80%Yes; 76%
No; 24%
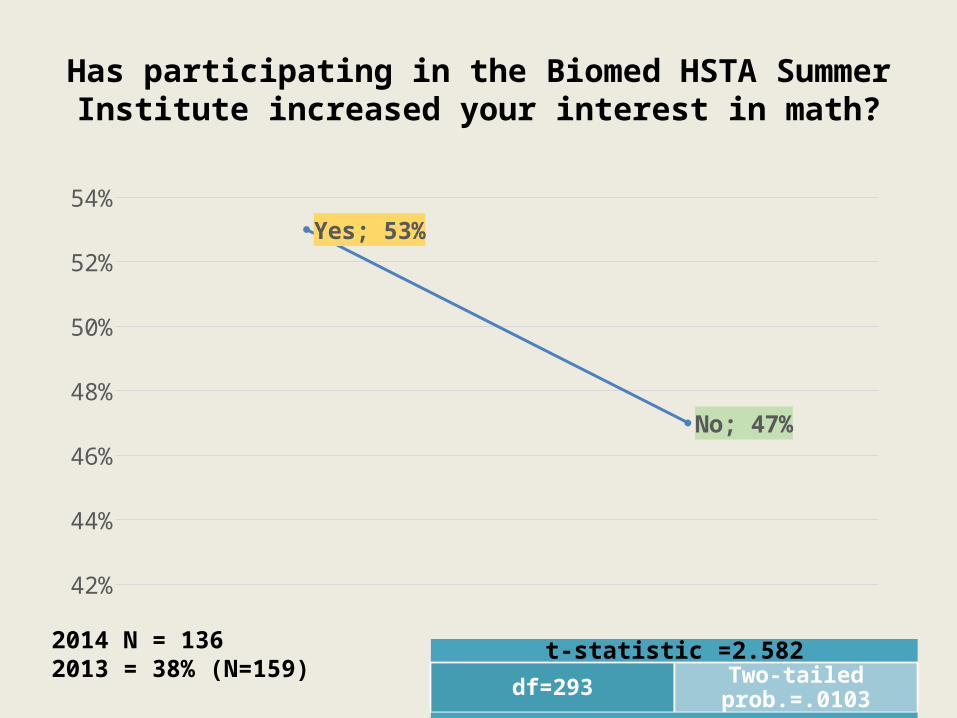
Has participating in the Biomed HSTA Summer Institute increased your interest in math?
2014 N = 1362013 = 38% (N=159)
t-statistic =2.582df=293 Two-tailed prob.=.0103
42%
44%
46%
48%
50%
52%
54%Yes; 53%
No; 47%

How comfortable do you feel using Experimental Design (Research Methods and the Scientific Method)?
Week 1: t-statistic =10.550df=153 Two-tailed prob.=.000
Week 1 (2014) Week 1 (2013) Week 2 (2014) Week 2 (2013)0
0.5
1
1.5
2
2.5
3
3.5
4
4.5m=3.83 sd=0.82
N=76
m=2.63 sd=0.58
N=79
m=3.86sd=1.09
N=57
m=2.59sd=0.57
N=81
Week 2: t-statistic =8.906df=136 Two-tailed prob.=000
1 to 5 Likert Scale(1) Not At All Comfortable; (2) A Little Comfortable; (3) Moderately Comfortable; (4) Comfortable; (5) Very Comfortable

How comfortable do you feel using Community Based Participatory Research/Community Engagement?
Week 1: t-statistic =2.854
df=155 Two-tailed probability=.005
Week 1 (2014) Week 1 (2013) Week 2 (2014) Week 2 (2013)3
3.2
3.4
3.6
3.8
4
4.2
m=3.96sd=0.97
N=78
m=3.48sd=1.13
N=79
m=4.10sd=0.87
N=58
m=3.68sd=0.93
N=82
Week 2: t-statistic =2.703
df=138 Two-tailed probability=.008
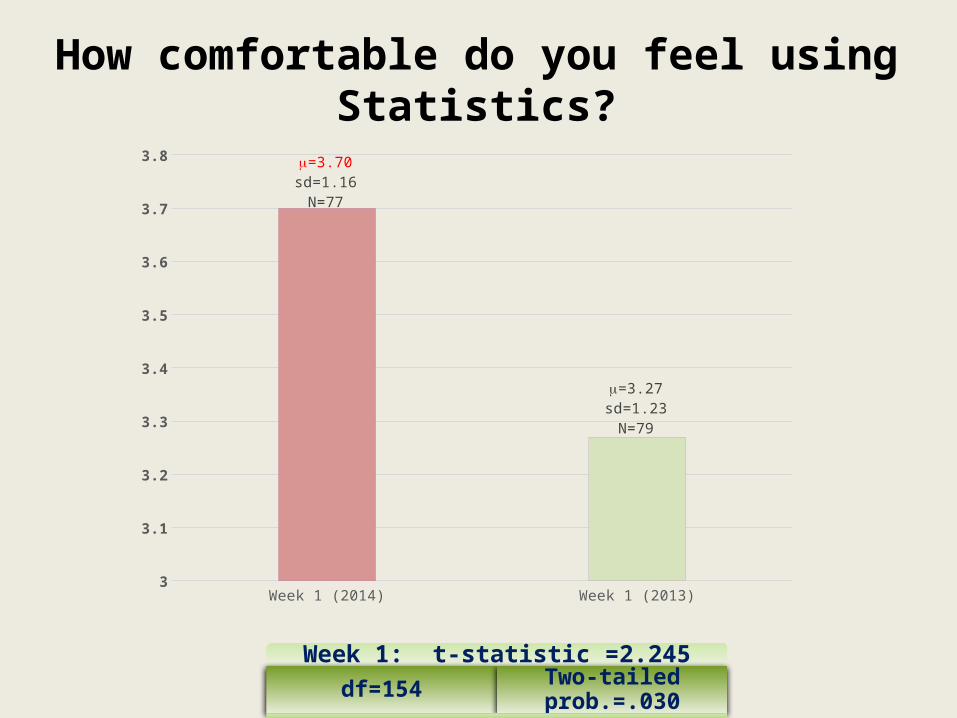
How comfortable do you feel using Statistics?
Week 1: t-statistic =2.245df=154 Two-tailed prob.=.030
Week 1 (2014) Week 1 (2013)3
3.1
3.2
3.3
3.4
3.5
3.6
3.7
3.8m=3.70sd=1.16
N=77
m=3.27sd=1.23
N=79
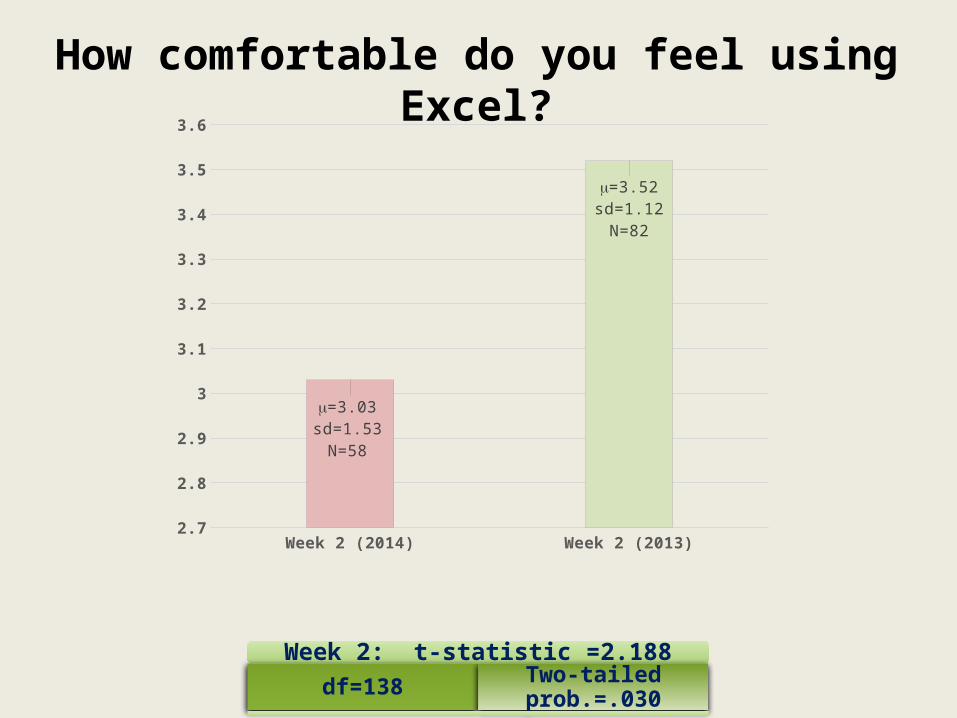
How comfortable do you feel using Excel?
Week 2: t-statistic =2.188df=138 Two-tailed prob.=.030
Week 2 (2014) Week 2 (2013)2.7
2.8
2.9
3
3.1
3.2
3.3
3.4
3.5
3.6
m=3.03sd=1.53
N=58
m=3.52sd=1.12
N=82

Do you plan to use Experimental Design during the upcoming year?
Yes Unsure No0%
10%
20%
30%
40%
50%
60%
70%
80%
72%
24%
4%
54%
41%
5%
Week 1 (2014) Week 1 (2013)
Week 1: t-statistic between %s=2.385
df=152 two-tailed probability=.0183

The laboratory experiences helped me to better understand what “metabolic syndrome” is.
Week 2: t-statistic=2.479
df=137
two-tailed probability=.014
Week 1 (2014) (N=78)
Week 1 (2013) (N=78)
Week 2 (2014) (N=57)
Week 2 (2013) (N=82)
0
0.5
1
1.5
2
2.5
3
3.5
4
4.5
5
m=3.86m=4.23
m=3.88m=4.29
SD=1.15SD=0.85
SD=1.13SD=0.82
Mean SD
Week 1: t-statistic=2.285
df=154 two-tailed probability=.024
1 to 5 Likert Scale(1) Not At All; (2) Very Little; (3) Moderately; (4) Quite A Bit; (5) A Lot

The laboratory experiences helped me to better understand health problems in my community.
Week 2: t-statistic=2.385 df=137
two-tailed probability=.019
Week 2: 2014 (N=58) Week 2: 2013 (N=81)0
0.5
1
1.5
2
2.5
3
3.5
4
4.5
5
m=4.00
m=4.37
SD=1.06SD=0.77

How much did you enjoy the College Fair (talking with professionals about potential careers and/or programs?
Week 2: 2014 (N=57)
Week 2: 2013 (N=82)
0 0.5 1 1.5 2 2.5 3 3.5 4 4.5
Mean, 4.35
Mean, 3.99
SD, 0.95
SD, 0.92
Week 2: t-statistic=2.239 df=137
two-tailed probability=.027

Participated in My First Patient Screenings
Helpfulness of Goal Setting Session in Developing Personal Goal
Yes90%
No10%
4%4%
25%
34%
33%
Very Unhelpful (1) Not Helpful (2) Somewhat Helpful (3)
Helpful (4) Very Helpful (5)
Combined Weeks: N=134
Mean=3.86SD=1.12
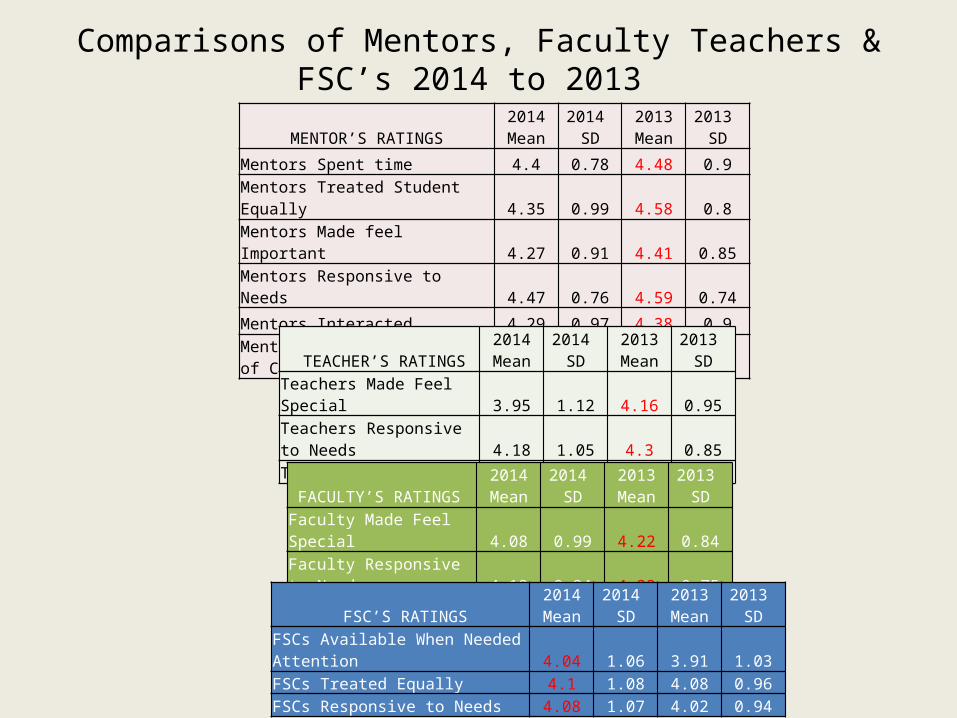
Comparisons of Mentors, Faculty Teachers & FSC’s 2014 to 2013
MENTOR’S RATINGS2014 Mean
2014 SD
2013 Mean
2013 SD
Mentors Spent time 4.4 0.78 4.48 0.9
Mentors Treated Student Equally 4.35 0.99 4.58 0.8
Mentors Made feel Important 4.27 0.91 4.41 0.85
Mentors Responsive to Needs 4.47 0.76 4.59 0.74
Mentors Interacted 4.29 0.97 4.38 0.9
Mentors Provided Overview of College 4.53 0.83 4.65 0.6
TEACHER’S RATINGS2014 Mean
2014 SD
2013 Mean
2013 SD
Teachers Made Feel Special 3.95 1.12 4.16 0.95Teachers Responsive to Needs 4.18 1.05 4.3 0.85Teachers Interacted 4.02 1.13 4.2 0.89
FACULTY’S RATINGS2014 Mean
2014 SD
2013 Mean
2013 SD
Faculty Made Feel Special 4.08 0.99 4.22 0.84Faculty Responsive to Needs 4.19 0.94 4.32 0.75Faculty Interacted 4.01 1.07 4.23 0.84
FSC’S RATINGS2014 Mean
2014 SD
2013 Mean
2013 SD
FSCs Available When Needed Attention 4.04 1.06 3.91 1.03FSCs Treated Equally 4.1 1.08 4.08 0.96FSCs Responsive to Needs 4.08 1.07 4.02 0.94

Key Quotes on Improving Summer Institute
• LESS LECTURES MORE LABS!!!!!!! • have better food at WVUor allow HSTA students to order food from
other places • Make sure the faculty does not just talk at the students. Make the
students get involved by doing some activities.• I feel that they did a good job over all but it needed to be a little more
organized and be more helpful to people specific needs. Yes we do need to meet new people and i understand that they want us to room with others from different counties but i feel that the first day they should let everyone get to know each other and pick a roommate from a different county. Someone that you know that you would feel comfortable. thank you :)
• More time with the people other than those in the group you are assigned.
• Do more evening activities.• Make the rules more clear at the beginning and give more trust to the
students.

What did you like Most about the Summer Institute?
• Mentors (Jay, Lakiah, Joe, Kara, Ryan, Jen)
• Cadaver Lab
• Hands on Activities (The Learning)
– “you get the chance to meet a lot of medical students and talk to them about their experience. you also get to talk to a lot of college students which helps give you more information on what to expect when you get to college”
– “My favorite thing about Biomed was all of the people that I had the pleasure of meeting. Everyone was interesting and exceptional and a pleasure to be around. The mentors were helpful and approachable and really helped to guide me over the week. The lesson that I participated in with Dr. Klink was engaging and interesting and well done and sparked an interest in me that I didn't know that I had. Biomed was overall an incredible experience in my life that I will remember for years to come.”
– “The videos that we made in the Social Behavior & Public Health class that my group was in. I really enjoyed the experience and the people that it was shared with.”
– “ I liked the hands on experience of the cadaver and getting an idea of what types of things I will possibly do in my college courses, if I do decide to pursue a career in health care or even science. I also enjoyed the mentor panel so I can get a more realistic perspective on college life and study specifically at WVU. I liked goal setting because it gave me a fresh sense of inspiration to go at my goals head on without hesitation.”

Final Comments
• Overall, satisfaction with Biomed SI ranged from Fairly to Extremely, (m=3.99, sd=0.91 vs. m=3.91, sd=1.15 (2013))
• Impact on increasing interest in HCCs hovered around Moderate to High, (m=3.57, sd=1.33)
• Although no significant differences between years, last year’s means were slightly higher than this year for mentors, teachers, faculty, with the exception of FSCs

TEACHER RESULTS

Program Highlights
• Significant differences found between this year and last year’s camp in following areas:
– USE OF SOCIAL NETWORKING IN UPCOMING YEAR
– BEING A HEALTH CARE ADVOCATE FOR FAMILY/COMMUNITY

Do you plan to use Social Networking upon returning to your school and community?
1 to 5 Likert Scale(1) Not At All; (2) Very Little; (3) Moderately; (4) Quite A Bit; (5) A Lot
0
0.5
1
1.5
2
2.5
3
3.5
4
4.5
2014, m=3.08 (N=13)
2013, m=4.13 (N=8)
SD=1.04 SD=0.99
Independent T-Test between Means•T-statistic = 2.287•df= 19•Two –tailed probability = .034
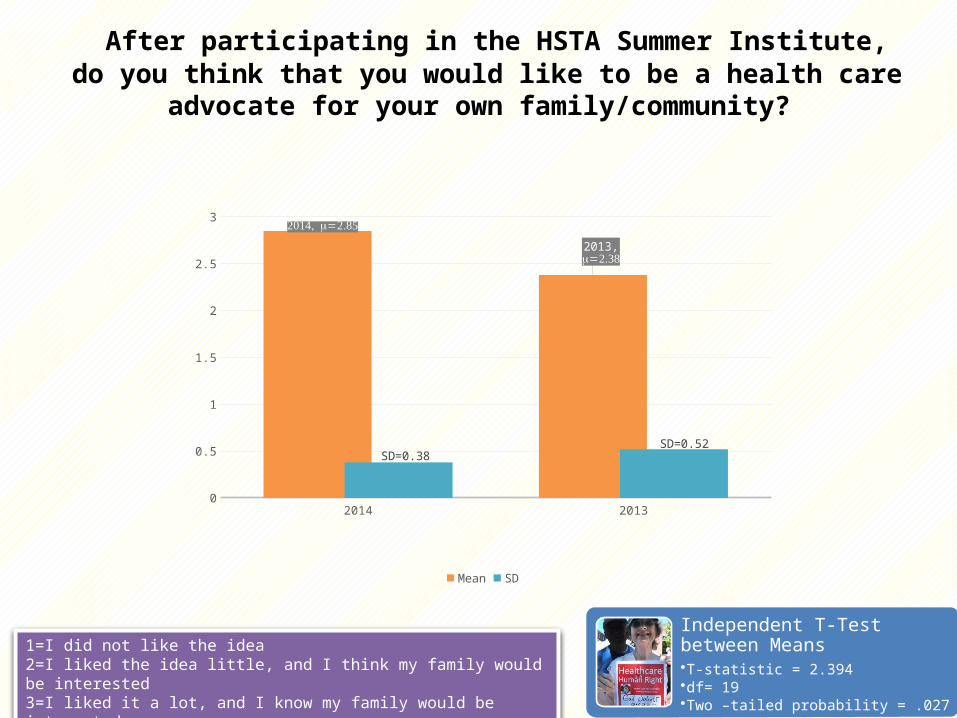
After participating in the HSTA Summer Institute, do you think that you would like to be a health care
advocate for your own family/community?
1=I did not like the idea 2=I liked the idea little, and I think my family would be interested3=I liked it a lot, and I know my family would be interested.s
Independent T-Test between Means•T-statistic = 2.394•df= 19•Two –tailed probability = .027
2014 20130
0.5
1
1.5
2
2.5
32014, =2.85m
2013,=2.38m
SD=0.38SD=0.52
Mean SD

What other professional development needs would you like to see addressed?
Not learning the same thing every year!!!
More inventive ways to present ethics, etc.
I would like to see more statistics training for all teachers. Students get too caught up in ttest, ANOVA,
and correlations. I would like to give them other options to
examine their data.
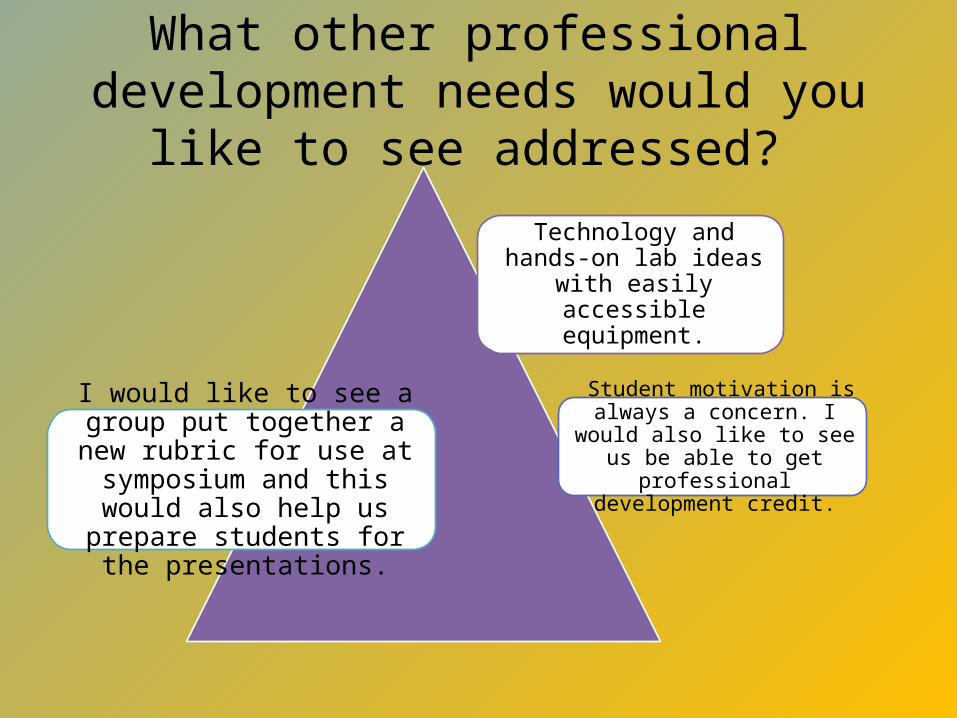
What other professional development needs would you like to see addressed?
Technology and hands-on lab ideas with easily
accessible equipment.
Student motivation is always a concern. I would also like to see
us be able to get professional development credit.
I would like to see a group put together a new rubric for use at symposium and this would also help us prepare students for the
presentations.

MOST USEFUL TECHNIQUE FOR HSTA CLUB: CBPR (61.5%)LEAST USEFUL TECHNIQUE FOR HSTA CLUB: SOCIAL NETWORKING (54.5%)
MOST USEFUL TECHNIQUE FOR CLASSROOM INSTRUCTION: EXCEL (33.3%)LEAST USEFUL TECHNIQUE FOR CLASSROOM TEACHING: SOCIAL NETWORKING (50%)
92.3% INDICATED THAT THEY GAINED IDEAS FOR HSTA CLUB PROJECTS. ALL TEACHERS INDICATED THAT THEY WERE PREPARED OR EXTREMELY PREPARED TO
HELP STUDENTS CONCEIVE AND CARRY OUT PROJECTS. (2014 =4.23m (N=13) VS. 2013 =4.63m (N=8)
TEACHER INDICATED THAT THEY WERE EITHER GOOD OR EXPERT IN: *INCOPORATING RESEARCH PRINCIPLES INTO THEIR CLUBS (2014 m=3.15)
*CONFIDENT IN TEACHING STUDENTS ABOUT RESEARCH (2014 =3.08)m
Program Highlights

THE MAJORITY OF TEACHERS EITHER AGREED OR STRONGLY AGREED THAT THE SUMMER INSTITUTE CONTRIBUTED TO THEIR SCIENCE CONTENT KNOWLEDGE
(2014 m=4.46 (N=13) VS. 2013 m=4.14 (N=7)
THE MAJORITY FEEL COMFORTABLE OR EXTREMELY COMFORTABLE WITH THE TEACHING METHODS.
HIGHEST RATING: EXPERIMENTAL DESIGN (2014 m=4.85 (N=13) VS. 2013 m=4.63 (N=8)LOWEST RATING: STATISTICS (2014 m=4.23 (N=13) VS. 2013 m=4.25 (N=8)
MAJORITY OF TEACHERS REPORTED THAT THEY WILL USE A LOT , QUITE A BIT, OR MODERATELY THE TEACHING METHODS.
HIGHEST RATING: EXPERIMENTAL DESIGN (2014 m=4.15 (N=13) VS. 2013 m=4.25 (N=8)LOWEST RATING: SOCIAL NETWORKING (2014 m=3.08 (N=13) VS. 2013 m=4.13 (N=8)**
THE MAJORITY OF TEACHERS FAIRLY TO STRONGLY AGREED THAT THE SUMMER INSTITUTE CONTRIBUTED TO THEIR MATH CONTENT KNOWLEDGE
(2014 m=3.83 (N=12) VS. 2013 m=3.63 (N=8)
Program Highlights
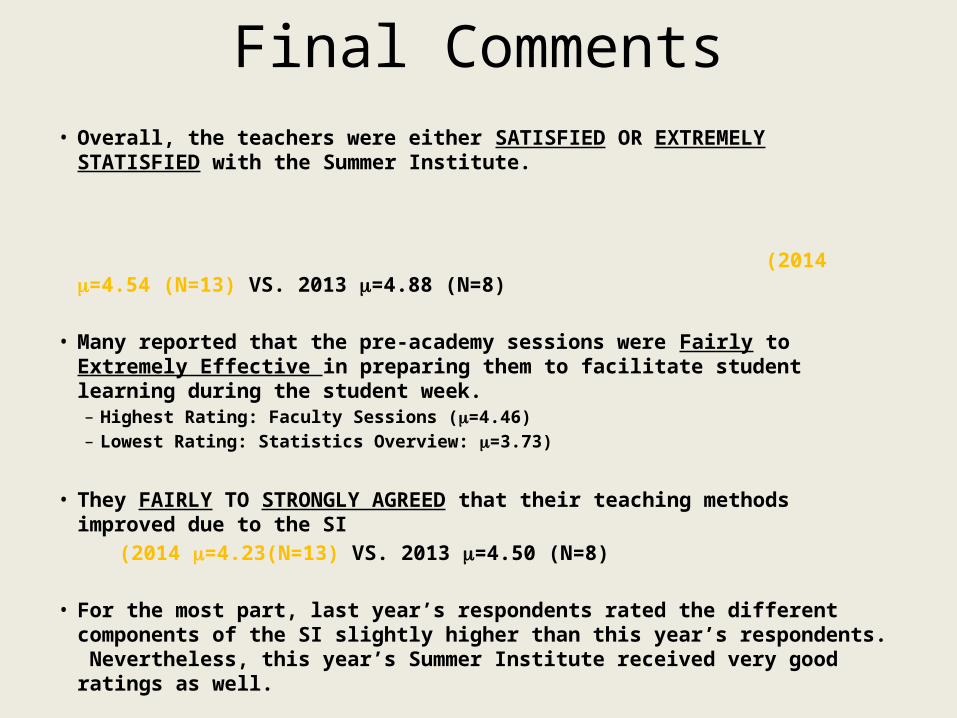
Final Comments• Overall, the teachers were either SATISFIED OR EXTREMELY STATISFIED with
the Summer Institute. (2014 m=4.54 (N=13) VS. 2013 m=4.88 (N=8)
• Many reported that the pre-academy sessions were Fairly to Extremely Effective in preparing them to facilitate student learning during the student week.– Highest Rating: Faculty Sessions (m=4.46) – Lowest Rating: Statistics Overview: m=3.73)
• They FAIRLY TO STRONGLY AGREED that their teaching methods improved due to the SI
(2014 m=4.23(N=13) VS. 2013 m=4.50 (N=8)
• For the most part, last year’s respondents rated the different components of the SI slightly higher than this year’s respondents. Nevertheless, this year’s Summer Institute received very good ratings as well.