Embed Size (px)
Citation preview
The Journal of Nutrition
Supplement: Biomarkers of Nutrition for Development (BOND) Expert Panel Reviews, Part 2
Biomarkers of Nutrition for Development—Folate Review1–5
Lynn B Bailey,6* Patrick J Stover,7 Helene McNulty,8 Michael F Fenech,9 Jesse F Gregory III,10
James L Mills,11 Christine M Pfeiffer,12 Zia Fazili,12 Mindy Zhang,12 Per M Ueland,13 Anne M Molloy,14
Marie A Caudill,7 Barry Shane,15 Robert J Berry,16 Regan L Bailey,17 Dorothy B Hausman,6
Ramkripa Raghavan,11 and Daniel J Raiten11*
6Department of Foods and Nutrition, University of Georgia, Athens, GA; 7Division of Nutritional Sciences, Cornell University, Ithaca, NY;8Northern Ireland Centre for Food and Health, Biomedical Sciences Research Institute, University of Ulster, Londonderry, United Kingdom;9Genome Health Nutrigenomics Laboratory, Food, Nutrition, and Bioproducts Flagship, Commonwealth Scientific and Industrial Research
Organization, Adelaide, Australia; 10Food Science and Human Nutrition Department, University of Florida, Gainesville, FL; 11Eunice Kennedy
Shriver National Institute of Child Health and Human Development, NIH, Bethesda, MD; 12National Center for Environmental Health, CDC,
Atlanta, GA; 13Department of Clinical Science, Univeristy of Bergen, Bergen, Norway; 14Institute of Molecular Medicine, Trinity College,
Dublin, Ireland; 15Department of Nutritional Sciences and Toxicology, University of California–Berkeley, Berkeley, CA; 16National Center on
Birth Defects and Developmental Disabilities, CDC, Atlanta, GA; and 17Office of Dietary Supplements, NIH, Bethesda, MD
Abstract
The Biomarkers of Nutrition for Development (BOND) project is designed to provide evidence-based advice to anyone with an
interest in the role of nutrition in health. Specifically, the BOND program provides state-of-the-art information and service with
regard to selection, use, and interpretation of biomarkers of nutrient exposure, status, function, and effect. To accomplish this
objective, expert panels are recruited to evaluate the literature and to draft comprehensive reports on the current state of the art
with regard to specific nutrient biology and available biomarkers for assessing nutrients in body tissues at the individual and
population level. Phase I of the BONDproject includes the evaluation of biomarkers for 6 nutrients: iodine, iron, zinc, folate, vitamin
A, and vitamin B-12. This review represents the second in the series of reviews and covers all relevant aspects of folate biology
and biomarkers. The article is organized to provide the reader with a full appreciation of folate�s history as a public health issue, its
biology, and an overview of available biomarkers (serum folate, RBC folate, and plasma homocysteine concentrations) and their
interpretation across a range of clinical and population-based uses. The article also includes a list of priority research needs for
advancing the area of folate biomarkers related to nutritional health status and development. J Nutr 2015;145:1636S–80S.
Keywords: BOND, folate biomarkers, serum folate, RBC folate, homocysteine
Introduction
Folate�s key role in ensuring normal development, growth, andmaintenance of optimal health is the focus of the backgroundsection of this article, which begins with historical highlights
and continues with capstones of clinical, chronic disease, anddevelopmental disorder considerations. Public health applica-tions follow with global intake recommendations coupled with
1 Published in a supplement to The Journal of Nutrition. The Biomarkers of Nutrition
for Development (BOND) project was developed by the nutrition program staff of the
Eunice Kennedy Shriver National Institute of Child Health and Human Development
(NICHD) of the NIH within the US Department of Health and Human Services
(DHHS). The initial 6 nutrients selected, iodine, vitamin A, iron, zinc, folate, and
vitamin B-12, were chosen for their high public health importance. Expert panels on
each nutrient were constituted and chargedwith developing comprehensive reviews
for publication in the BOND series. The BOND program received its core funding
from the Bill & Melinda Gates Foundation, PepsiCo, the Division of Nutrition
Research Coordination (DNRC, NIH), the Office of Dietary Supplements (ODS, NIH),
and the Eunice Kennedy Shriver National Institute of Child Health and Human
Development (NICHD, NIH). The Supplement Coordinators for this supplementwere
Daniel J Raiten (NICHD, NIH) and Lynn B Bailey (University of Georgia). Supplement
Coordinators disclosures: no conflicts of interest. This supplement is the responsi-
bility of the Guest Editor towhom the Editor of The Journal of Nutrition has delegated
supervision of both technical conformity to the published regulations of The Journal
of Nutrition and general oversight of the scientific merit of each article. The Guest
Editor for this supplement was Kevin L Schalinske. Guest Editor disclosure: no
conflicts of interest. Publication costs for this supplement were defrayed in part by
the payment of page charges. This publication must therefore be hereby marked
"advertisement" in accordancewith 18 USC section 1734 solely to indicate this fact. The
opinions expressed in this publication are those of the authors and are not attributable to
the sponsors or the publisher, Editor, or Editorial Board of The Journal of Nutrition.2 The BOND project was funded in part by the Bill & Melinda Gates Foundation;
PepsiCo; the Office of Dietary Supplements (ODS, NIH); the Division of Nutrition
Research Coordination (DNRC, NIH); and the Eunice Kennedy Shriver National Institute
of Child Health and HumanDevelopment (NICHD, NIH). The Folate Reviewwaswritten
in response to an invitation from the NICHD of the NIH within the US Department of
Health andHumanServices (DHHS). This is a free access article, distributed under terms
(http://www.nutrition.org/publications/guidelines-and-policies/license/) that permit unre-
stricted noncommercial use, distribution, and reproduction in anymedium, provided the
original work is properly cited.3 Author disclosures: LB Bailey, PJ Stover, H McNulty, MF Fenech, JF Gregory III, JL
Mills, CMPfeiffer, Z Fazili, M Zhang, PMUeland, AMMolloy, MA Caudill, B Shane, RJ
Berry, RL Bailey, DB Hausman, R Raghavan, and DJ Raiten, no conflicts of interest.4 The content represents the views of the Folate Expert Panel and other invited
contributors and does not necessarily represent the official views or positions of the NIH,
the CDC/Agency for Toxic Substances and Disease Registry, or the DHHS. In addition,
individual members of the expert panel may not endorse all statements in this report.
ã 2015 American Society for Nutrition.
1636S Manuscript received November 3, 2014. Initial review completed December 11, 2014. Revision accepted April 14, 2015.
First published online June 3, 2015; doi:10.3945/jn.114.206599.
by guest on May 26, 2016
jn.nutrition.orgD
ownloaded from
9.DCSupplemental.html http://jn.nutrition.org/content/suppl/2015/06/03/jn.114.20659Supplemental Material can be found at:

status estimates and the impact of fortification with a focus onneural tube defect (NTD)18 risk reduction. An overview offolate�s chemistry, metabolism, and critically important role inone-carbon metabolism precedes the biomarker-specific sectionsof the review. After the identification of ‘‘priority’’ biomarkersfor folate status assessment, the characteristics of pertinentanalytical methods and technical considerations of each arepresented (in general in the body of the article and in detail inSupplemental Table 1). Assay-specific issues are addressed for eachpriority biomarker and advantages and disadvantages summarized.Guidance to themost appropriate choice ofmethod for the purposeand setting including laboratory infrastructure is provided inconjunction with how best to optimize specific analytical methods.In addition to analytical considerations, the review addresses theimportant issues on interpretation of folate status assessment datawith the use of defined cutoff values determined by specificmethods. After the method-specific sections, new directions andtechnologies, including the use of technology as research tools, areaddressed. Concluding the review is a summary of research gapsand needs that present challenges and opportunities for researchscientists with the interest and expertise to advance the field relatedto folate biomarkers for nutrition and development.
Background
Historical overviewBeginning with the observations by Lucy Wills in 1931 (1) of afactor in marmite that produces a cure of macrocytic anemia inpregnant women, a number of events have occurred to reinforcethe role of folate as a key nutrient for human health (Table 1).This review will cover what we have learned over the yearsabout this role and how best to assess folate status of humansacross a range of developmental and environmental circum-stances. The recent reviews by Shane (8) and Pfeiffer et al. (9)provide a perspective of the evolution of methods used to assessfolate in both physiologic fluids and foods.
Clinical considerations and the role of folate in healthand diseaseClinical stages of folate insufficiency. Because the Bio-markers of Nutrition for Development (BOND) project is
intended to serve the breadth of users involved in the nutritionenterprise, including clinicians, it is useful to appreciate theclinical stages of folate insufficiency in order to inform thatcommunity. Inadequate intake is a leading cause of folatedeficiency. Other major causes include increased requirementsdue to pregnancy or neoplastic diseases, malabsorptive condi-tions, and antifolate drugs or other metabolic inhibitors (10, 11).InWestern societies, alcoholism (which affects both folate intakeand absorption) is a common cause of low folate status, whereasin developing countries malabsorptive conditions such astropical sprue are more common causative factors (10). Bodystores of folate generally represent a 2- to 3-mo supply, andfolate deficiency can develop in persons of any age with aninadequate intake and/or increased requirement for the vitamin(11). The clinical presentation of folate deficiency covers a widerange of symptoms, the basic progression of which is highlightedin Table 2.
Increased folate requirements for maternal health and
fetal development. Although essential throughout life, folate isparticularly critical during early stages of human development.Since the first report of amelioration of macrocytic anemia byexposure to folate-rich food sources (1), pregnancy has beenrecognized as a time when folate requirements are increased tosustain the demand for rapid cell replication and growth of fetal,placental, and maternal tissue, relating to the critical role it playsin DNA, RNA, and protein synthesis. Maintaining an adequatefolate status throughout pregnancy is important not only for themother�s health but also for the developing infant because folateinadequacy in pregnancy has been associated with a number ofadverse outcomes (21). These include folate-responsive NTDsand neural crest disorders (e.g., congenital heart defects), fetalgrowth retardation, low birth weight, preterm delivery, andneonatal folate deficiency. It is also notable that folate require-ments are increased during lactation in order to meet bothmaternal and neonatal needs (21).
Folate and disease. Increased folate requirements in clinicalsettings have been linked with some anemias, malignancy, and inpatients undergoing renal dialysis (22). In addition, folate statusmay become an issue in the context of therapeutic drug useincluding the following:
· anticonvulsant drugs (phenytoin, primidone);
· sulfasalazine (used in the treatment of inflammatory boweldisease);
· triamterene (a diuretic); and
·metformin (used in type 2 diabetes).
Some malabsorptive conditions can lead to folate deficiency(22). These include extensive inflammatory bowel disease(Crohn disease and ulcerative colitis), tropical sprue, and celiacdisease, a genetically determined chronic inflammatory intesti-nal condition involving gluten-sensitive enteropathy and asso-ciated deficiency of iron, folate and other vitamins due toimpaired absorption. In this condition, megaloblastic anemia iscommonly encountered at the time of diagnosis, and subclinicaldeficiency is found in patients reported to have persistent mucosaldamage (23).
Chronic alcoholism is associated with severe folate defi-ciency linked to poor dietary intake, intestinal malabsorp-tion, impaired hepatic uptake with reduced storage of endogenousfolates, and increased renal excretion (24). Hepatic methi-onine metabolism is also impaired in chronic alcoholism(24).
5 Supplemental Tables 1 and 2 are available from the ��Online SupportingMaterial�� link inthe online posting of the article and from the same link in the online table of contents at
http://jn.nutrition.org.18 Abbreviations used: apABG, para-acetaminobenzoylglutamate; BOND, Biomarkers of
Nutrition for Development; DBS, dried blood spot; DFE, dietary folate equivalent;
DHF, dihydrofolate; dTMP, deoxythymidine monophosphate (deoxythymidylate);
dTTP, deoxythymidine triphosphate; dUMP, deoxyuridine monophosphate (deoxy-
uridylate); dUTP, deoxyuridine triphosphate; FBP, folate-binding protein; GC-MS;
gas chromatography–mass spectrometry; GCPII, glutamate carboxypeptidase II;
hmTHF, 4a-hydroxy-5-methyltetrahydrofolate; IOM, Institute of Medicine;
LC-MS/MS, liquid chromatography–tandem mass spectrometry; LINE-1, long
interspersed nucelotide elements-1; LSD1, lysine-specific demethylase 1; MBA,
microbiological assay; MeFox, pyrazino-s-triazine derivative of hmTHF; MTHFD,
methylenetetrahydrofolate dehydrogenase; MTHFR, methylenetetrahydrofolate re-
ductase; MTR, methionine synthase; MVM, multivitamin/mineral; NIST, National
Institute of Standards and Technology; NTD, neural tube defect; pABG,
para-aminobenzoylglutamate; PBA, protein-binding assay; PCFT, proton coupled
folate transporter; QA, quality assessment; QC, quality control; RFC, reduced folate
carrier; SAH, S-adenosylhomocysteine; SAM, S-adenosylmethionine; SPE,
solid-phase extraction; SRM, standard reference material; THF, tetrahydrofolate;
TYMS, thymidylate synthase; UDG, uracil glycosylase; USPHS, US Public Health
Service; 5-formyl-THF, 5-formyltetrahydrofolate (folinic acid); 5-methyl-5,6-DHF,
5-methyl-5,6-dihydrofolate; 5-methyl-THF, 5-methyltetrahydrofolate; 5,10-methylene-THF,
5,10-methylenetetrahydrofolate; 5,10-methenyl-THF, 5,10-methenyltetrahydrofolate;
10-formyl-DHF, 10-formyldihydrofolate; 10-formyl-THF, 10-formyltetrahydrofolate.
*To whom correspondence should be addressed. E-mail: [email protected]
(DJ Raiten), [email protected] (LB Bailey).
Biomarkers of nutrition for development—folate review 1637S
by guest on May 26, 2016
jn.nutrition.orgD
ownloaded from

Role of folate in chronic disease risk. Metabolic changesassociated with impaired folate status have been linked toincreased risk of chronic diseases including cancer and cardio-vascular disease and cognitive dysfunction. As described indetail later in the review, folate is required for remethylationof homocysteine to methionine and DNA synthesis and cellproliferation in addition to methylation reactions that affectcritical processes such as methylation of cytosine in DNA forcontrol of gene expression and neurotransmitter synthesis. Thetypes of chronic diseases linked to folate status and folate-relatedmetabolic abnormalities are summarized below.
Cancer. Several cancers such as leukemia, lymphoma, andcolorectal, breast, and prostate cancer have been associatedepidemiologically with low folate status (25–28). Carcinogen-esis has been linked with poor folate status because of theinduction of DNA breaks by uracil incorporation in DNA (29).These deleterious genomic events lead to chromosome fragmen-tation and rearrangements, causing the generation of cells withaberrant karyotypes and altered gene dosage fromwhich cancershave a higher probability of evolving (30). Hypomethylation ofDNA associated with poor folate status may lead to inappro-priate expression of genes that potentially predispose to cancer(e.g., uncontrolled expression of proto-oncogenes) (31). Al-though the prevention of folate deficiency has been linked todiminished cancer initiation, it has been hypothesized thatexcessive folate intake may fuel the growth of initiated cancers(32, 33). A recent meta-analysis with data on 50,000 individualsconcluded that folic acid supplementation does not significantlyincrease or decrease site-specific cancer during the first 5 y oftreatment (34).
Cardiovascular disease. As outlined later, one of the keyfolate-dependent pathways is associated with the generation ofhomocysteine. Hyperhomocysteinemia, which may result frompoor folate intake or impaired folate metabolism as well asvitamin B-12 deficiency, has been associated with an increasedrisk of hypertension, cardiovascular disease, and cerebrovascu-lar disease in epidemiologic studies (35–38). Although theseobservational findings do not support a causal effect, severalmechanisms have been proposed by which hyperhomocysteine-mia may mediate the risk of these diseases (38, 39).
Results of placebo-controlled intervention studies of folicacid supplementation, with or without vitamin B-12, have not
yielded evidence of a strong protective effect against theincidence or progression of cardiovascular disease or cerebro-vascular disease in the short term (<2 y). The evidence from theseintervention studies does not support the previously hypothe-sized causal relation between homocysteine and cardiovasculardisease that was based on observational studies.
Neurological conditions. Recent trials with longer inter-vention time frames using multiple B vitamins including folic acidsuggest potential benefits against stroke, brain shrinkage, cogni-tive decline, and depression, particularly in those with above-average concentrations of homocysteine within the cohortsstudied (40–43). In contrast, a recent meta-analysis of 11 trialson the effects of homocysteine lowering with B vitamins foundno significant effect on individual cognitive domains or globalcognitive function or on cognitive aging (44). However, meta-analyses on the effect of B vitamins on cognition (44, 45) includedtrials in which any effect would be difficult to detect because ofthe low sample size, short trial duration, or inclusion of healthysubjects not experiencing cognitive decline, subjects with alreadyexcellent B vitamin status, or severely demented patients in whomthe treatment comes too late for any meaningful effect.
TABLE 1 Landmark events in folate history and critical points in assessment
Landmark events
· 1931, Lucy Wills, working in India, published an article on ``The treatment of ``pernicious anemia of pregnancy ``and ``tropical anemia ````in which she reported curing tropical
macrocytic anemia with marmite. She was not able to identify the specific factor that produced the cure, noting that ``at present it is only possible to state that in marmite, and
probably in other yeast extracts, there appears to be a curative agent for this dread disease.. ``(1)
· 1941 Mitchell et al. (2) described ``folic acid ``extracted from 4 tons of spinach. The name was derived from the Latin word folium for leaf. They also noted that ``folic acid ``
stimulated the growth of Lactobacillus casei.
· 1945 Spies (3) demonstrated that folic acid produced a prompt hematologic response in macrocytic anemia; among the patients he treated were some patients with pernicious
anemia, providing one of the first reports of masking of pernicious anemia by folic acid.
Critical points in folate assessment (4)
· Assessing folate status is complicated by the large number of folate forms that may be readily interconverted.
· Microbiological assays have been used for many decades due to the ability of some bacteria to grow in the presence of many different forms of folate (e.g., L. casei, now known as
Lactobacillus rhamnosus, responds to all active monoglutamate forms). Microbiological assays are viewed by many researchers as the ``gold standard. ``
· Subsequently, assays using competitive protein binding became common because of their simplicity (4).
· In recent years the use of LC-MS/MS1 has been recommended to quantitate individual folate forms which may be useful to:
o Characterize metabolic alterations due to the common polymorphism in methylenetetrahydrofolate reductase (677 C.T) capable of reducing blood folate (5) and causing
alterations in the proportion of folate forms in RBCs (6).
o Identify blood folic acid resulting from food fortification and use of folic acid containing supplements.
1 LC-MS/MS, liquid chromatography–tandem mass spectrometry.
TABLE 2 Stages of folate insufficiency
· Events in the blood (12)
o a decrease in plasma folate concentration followed by
o an increase in plasma homocysteine concentration and
o a reduction in RBC folate
· At the morphologic level, megaloblastic changes in the bone marrow and other rapidly
dividing tissues becomes evident (13)
· Megaloblastic cells are abnormally large cells with large nuclei (characterized by a
finely stippled lacy pattern of nuclear chromatin) and apparently normal cytoplasm,
which give rise to the classic morphologic finding of nuclear-cytoplasmic dissociation
· Other abnormal nuclear changes may also occur: these include hypersegmentation of
nuclei in neutrophils or generation of micronuclei in lymphocytes, which are a
biomarker of chromosome breakage or loss; when found in RBCs, these are also known
as Howell-Jolly bodies (14–18)
· The incapacitation of erythroblast replication results in reduced and abnormal
erythrocyte production leading to anemia and reduced oxygen-carrying capacity of the
blood, which may lead to symptoms of weakness, fatigue, irritability, and shortness of
breath (19, 20)
1638S Supplement
by guest on May 26, 2016
jn.nutrition.orgD
ownloaded from

Genetic considerations. An emerging body of evidence andresearch effort point to the potential for genetics to significantlyaffect folate metabolism and disease risk. Common polymor-phisms in genes that code for proteins/enzymes required forfolate uptake [e.g., glutamate carboxypeptidase II (GCPII; 1561C>T), reduced folate carrier (RFC; 80 G>A)] and metabolism[e.g., methylenetetrahydrofolate reductase (MTHFR; 677C>T),methionine synthase (MTR; 2756 A>G)] have been shown toalter the catalytic activity or expression of these proteins, whichcan have a substantial influence on developmental or degener-ative disease risk, providing further support for the central roleof this key vitamin in health maintenance (46). Because some ofthese enzymes require other dietary cofactors for their function(e.g., vitamin B-12 and riboflavin as cofactors for MTR andMTHFR, respectively), it is important to take into account notonly nutrient-gene interactions but also interactions of folatewith other nutrients on health effects.
Role of folate in birth defects. A major driver of much of therecent public health attention to the importance of folate hasbeen its link to a specific set of serious development disordersassociated with defects in the closure of the neural tube. Thesedisorders lead to an extremely serious set of disorders called‘‘neural tube defects.’’ Although considerable epidemiologic andexperimental evidence links folate status to NTD risk, occur-rence, and recurrence (47), the metabolic mechanisms by whichfolate promotes neural tube closure and reduces NTD risk areyet to be delineated. Because folate functions as an essentialcofactor for the de novo synthesis of purine and thymidinenucleotides and for the remethylation of homocysteine tomethionine, it has been suggested that folate can influenceNTD risk by impairing nucleotide biosynthesis and cell division,elevating homocysteine, or altering the cellular methylationpotential and gene expression (48). However, it is unlikely thatone mechanism will suffice to explain the link between folatestatus and NTD risk. It is more likely to be an outcome ofthe complex interactions between folate nutriture, genetic, andenvironmental factors (49, 50).
Despite our lack of clarity with regard to the etiology ofNTDs, a series of reports culminating in 2 landmark clinicaltrials that showed that folic acid taken periconceptionally coulddramatically reduce the risk of NTDs (51, 52) led the US PublicHealth Service (USPHS) to recommend that all women of child-bearing age capable of becoming pregnant take 400 mg folicacid daily (53). The approach and impact of this decision will becovered in greater detail in the section below.
Public health approachesLow dietary intake remains the most common cause of folateinadequacy, both in developed and developing countries, andgenerally those of lower socioeconomic status do not consumehigh-folate-content foods. Furthermore, although the diets ofmany people worldwide may be adequate in preventing clinicaldeficiency (i.e., megaloblastic anemia), they may be insufficientto achieve a biomarker status of folate that is associated withoptimal health and fetal development (i.e., NTD risk reduc-tion). Accordingly, folate intakes of such diets would beconsidered suboptimal. This widespread underprovision offolate is generally attributed to the poor stability and incom-plete bioavailability of natural food folates when comparedwith the synthetic vitamin folic acid (54). As a consequence, alarge public health effort has gone into addressing the folateneeds of the global population. The following is coverage of thekey elements of those efforts.
Folate intake recommendationsTable 3 provides select examples of the folate intake recom-mendations across the world, including the US Institute ofMedicine�s (IOM�s) DRIs. The FAO/WHO Expert Consultationadopted the RDAs set by the IOM (55) as the basis for theRecommended Nutrient Intakes (56). Other countries/regionswith specific guidance include the following: Australia and NewZealand (57); the United Kingdom (58); Ireland (59); Germany,Austria, and Switzerland (60); The Netherlands (61); Denmark,Sweden, Norway, Iceland, and Finland (62); and Southeast Asia,encompassing Indonesia, Malaysia, The Philippines, Singapore,Thailand, and Vietnam (63). The basis of these recommenda-tions and how they compare with the IOM DRIs have beenreviewed (65).
The IOM recommendations consist of several categories (55).Of most relevance to folate are the following:
· Estimated Average Requirement: the median usual intake ofthe nutrient that meets the requirements of 50% of thepopulation
· RDA: based on the Estimated Average Requirement, correctedfor population variance, and represents the average dailydietary intake level sufficient to meet the nutrient requirementof ;98% of the population
· Adequate Intake: the quantity of a nutrient consumed by agroup with no evidence of inadequacy
· Tolerable Upper Intake Level: defined as the ‘‘maximumdaily intake levels at which no risk of adverse health effectsis expected for almost all individuals in the generalpopulation, including sensitive individuals, when the nutri-ent is consumed over long periods of time’’ (66)
Table 4 provides some key points with regard to the derivationof DRIs for folate.
Folic acid intake recommendation for NTD risk reduction.
For NTD risk reduction, the IOM (55) recommends that allwomen capable of becoming pregnant consume 400 mg folicacid/d from supplements or fortified foods in addition to folatefrom a varied diet. This recommended intake for NTD riskreduction is consistent with that of the USPHS (53) and is not thesame as the RDA (400 mg dietary folate equivalents (DFEs),equivalent to 235 mg folic acid), a common misconception. Theimplications and impact of this policy are discussed in detailin the section below entitled ‘‘A case study in public healthintervention: folic acid and NTDs.’’
Folate/folic acid intake and adequacy in the United States.
The USDA Food and Nutrient Database for Dietary Studies (69)can be used to estimate dietary folate intake (mg/d) in specificcategories including the following:
· naturally occurring food folate;
· folic acid, including that in enriched cereal-grain products(140 mg/100 g flour) and in folic acid–fortified ready-to-eatcereals, including those with ;100 to 400 mg/serving (70);
· total folate in mg/d; and
· total folate in mg/d DFEs.
Yang et al. (71) estimated folic acid intake provided by differentfood intake categories for the nonpregnant adult US populationaged $19 y from NHANES 2003–2004 and 2005–2006. Theseresults confirmed those of other studies that consumption ofready-to-eat cereals and/or supplements contributes significantly tointakes of folic acid. Table 5 provides some additional detailwith regard to folic acid exposure in the United States.
Biomarkers of nutrition for development—folate review 1639S
by guest on May 26, 2016
jn.nutrition.orgD
ownloaded from

TABLE
3Selectedexamplesoffolate
intakerecommendationsworldwide1
UnitedStates
andCa
nada
(55),
mg/dDFE
FAO/W
HO(56),
mg/dDFE
Australia,New
Zealand(57),
mg/dDFE
United
Kingdom
(58),
mg/dfolate
Ireland(59),
mg/dfolate
Germany,
Switzerland,
Austria
(60),
mg/dDFE
TheNetherla
nds(61),
mg/dDFE
Nordiccountries(62),
mg/dfolate
SoutheastA
sia(63),
mg/dfolate
Category
RDA/AI
RNI
RDI/A
IRN
IRD
ARI
RDA/AI
RIRD
A
Infants
0–6mo
652
8065
250
50(,
4mo)60
(0–5
mo)50
2Noneset
(0–5
mo)80
7–12
mo
802
8080
250
50(4–11mo)80
(6–11mo)60
250
(6–11mo)80
Children
1–3y
150
160
150
70100
(1–4
y)200
852
(12–23
mo)60
160
4–8y
200
(4–6
y)200;(7–9
y)300
200
(4–6
y)100;(7–10y)150
(4–10y)200
(4–9
y)300
1502
(2–5
y)80;(6–9y)130
(4–6
y)200;(7–9
y)300
Males 9–13
y300
($10
y)400
300
($11
y)200
($11
y)300
($10
y)400
2252
(10–13
y)200
($10
y)400
$14
y400
400
(14–18
y)3002;($19
y)300
($14
y)300
Females
9–13
y300
($10
y)400
300
($11
y)200
($11
y)300
($10
y)400
2252
(10–13
y)200
($10
y)400
$14
y400
400
(14–18
y)3002;($19
y)300
(14–17
y)300;(18–30
y)400;($
30y)300
Pregnancy
(allages)
600
600
600
300
(Secondhalf)
500
600
4002
500
600
Lactation
(allages)
500
500
500
260
(First6mo)500
600
4002
500
(First6mo)500;(second6mo)500
1Note
thatunitsusedto
expressintakerecommendationsdifferamongcountries.AI,Adequate
Intake;DFE,dietary
folate
equivalent;RI,recommendedintake;RNI,recommendednutritionintake.Adaptedfrom
reference64withperm
ission.
2IndicatesAI,whichis
believedto
covertheneedsofallindividuals
inthegroup,butlackofdata
oruncertainty
inthedata
prevents
beingable
tospecifywithconfidencethepercentageofindividuals
coveredbythis
intake.
1640S Supplement
by guest on May 26, 2016
jn.nutrition.orgD
ownloaded from

Folate status estimatesFolate status in the United States based on specified
biomarkers and the effect of fortification.
Serum and RBC folate. Serum and RBC folate have beenassessed for the US population as part of the NHANES, first(1988–2006) with the Bio-Rad radioassay, and later (2007–2010) with the microbiological assay (MBA) (4). Population-based reference data for serum and RBC folate concentrationsfrom the 2003–2006 NHANES were recently summarized (72)(Figures 1–3, Table 6). In the most recent NHANES folate statusreport of the 2007–2010 time period, previously published datagenerated with the Bio-Rad assay (1988–2006) were adjustedby using statistical models to a microbiologic equivalent valueto bridge known assay differences, thus enabling time trendevaluations (73) (Table 6).
Homocysteine. Because of its reputed impact on health,as discussed above, plasma homocysteine was assessed as anonspecific ‘‘functional’’ indicator of folate status in NHANES(72). Elevated plasma homocysteine concentrations (>13 mmol/L)were found in ;8% of the population aged $20 y and in 19%of persons aged $60 y participating in NHANES 2003–2006(72). Pfeiffer et al. (74) estimated a 10% decrease in plasmahomocysteine when comparing prefortification (1991–1994)to postfortification (1999–2004) concentrations in a nationalsample of the US population.
Folate status in countries other than the United States
based on specified biomarkers and guidelines in current
use. Because folic acid in foods is more stable and bioavailablethan naturally occurring food folates, the biomarker status offolate tends to be highest in countries with mandatory folic acidfortification, followed by those countries with voluntary fortifi-cation. Voluntary fortification of a wide variety of foods ispracticed in many countries worldwide (75, 76). Because of thevariability in the number of foods fortified and subsequentlyconsumed, folate status (and related health outcomes) in countrieswith voluntary fortification is more disparate than in countrieswith mandatory fortification (77). Mandatory fortification maynot reach all women of reproductive age adequately; however, thelowest folate status in population groups is found in thosecountries without access to folic acid–fortified foods, even on avoluntary basis (78). As of November 2012, 75 countries havepassed regulations for mandatory fortification of staple foods
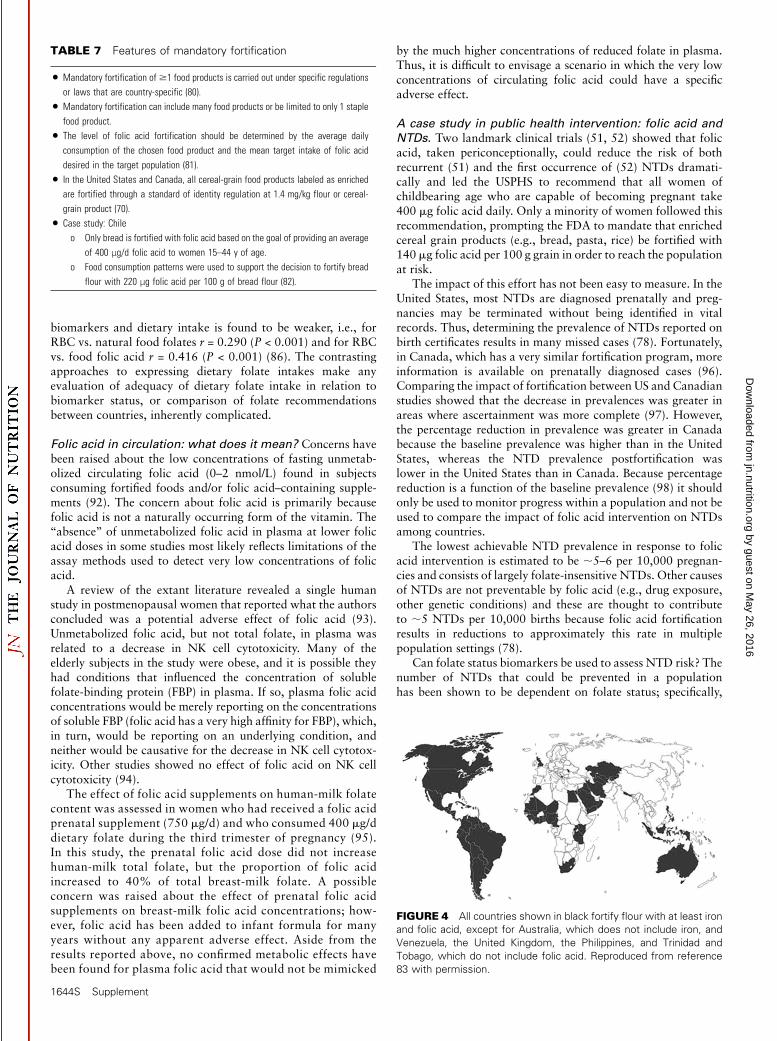
with folic acid and iron (79). Features of the mandatoryfortification can be found in Table 7. Figure 4 shows a map ofthe global efforts to actualize folic acid fortification of foods.
Folate status—a global perspective. The ability to developglobal, regional, or national consensus on folate status ofpopulations at risk is contingent on having reliable andcomparable data. Challenges to this goal include the use ofdifferent analytical methods and/or different biomarker cutoffpoints applied to define the severity of deficiency in differentcountries. Moreover, meeting a particular criterion or preva-lence estimate of folate deficiency in a given population (e.g.,>5% with a folate biomarker value falling outside a cutoff pointindicative of deficiency) does not mean that folate status isoptimal in the ‘‘nondeficient’’ portion of the population. In fact,in many settings, although folate deficiency may be relativelyrare, suboptimal folate status with accompanying implicationsfor health may be common.
TABLE 5 Folic acid intake in the United States1
· Based on NHANES data (2003–2004 and 2005–2006), the estimated usual median
folic acid (μg/d) intakes provided by different food intake categories were as follows:
o 138 from ECGPs only,
o 274 from ECGPs plus RTECs,
o 479 from ECGPs plus supplements, and
o 635 from ECGPs + RTECs + supplements (71).
· An estimated 60% of US adults consumed folic acid from RTECs and/or supplements
and 15% from both (71).
· Regular consumption of RTECs with folic acid was associated with an;100% higher
usual intake.
· Use of folic acid–containing supplements was associated with.200% higher intake
compared with consumption of ECGPs only (71).
· Folic acid intake exceeding the UL was reported in NHANES (71).
o Overall, ,3% of US adults exceeded the UL.
o Among the 60% of adults who did not take supplements postfortification
(NHANES 2003–2004 and 2005–2006), 0% exceeded the UL for folic acid.
o Among the 34% and 6% of adults who consumed supplements with an
average of #400 or .400 μg/d folic acid, ,1% and 47.8% (95% CI: 39.6%,
56.0%) consumed more than the UL, respectively.
1 ECGP, enriched cereal grain product; RTEC, ready-to-eat cereal; UL, Tolerable Upper
Intake Level.
TABLE 4 Key points with regard to IOM folate recommendations1
· Primary biomarker used for DRI was RBC folate concentration, an index of tissue stores and long-term status.
· Ancillary biomarkers included serum folate and Hcy concentrations.
· The EAR for adults was based primarily on data from controlled metabolic studies in which folate response to defined diets was determined.
· Additional supporting evidence included data from epidemiologic studies in which folate intake was estimated in conjunction with status indicators.
· The DRIs are expressed in DFEs, defined as micrograms of naturally occurring food folate plus 1.7 times the micrograms of synthetic folic acid. The use of DFEs is intended to
o account for differences in bioavailability between synthetic folic acid in fortified foods and naturally occurring dietary folate and
o establish equivalency of all forms of folate, including folic acid in fortified foods.
The 1.7 multiplier for converting micrograms of folic acid to DFEs was based on the assumption that added folic acid (consumed with a meal) is;85% available (67) and food folate
is ;50% available (68); thus, the ratio 85:50 yielded the multiplier of 1.7 in the DFE calculation.
· UL for adults ($19 y) for folic acid is 1000 μg/d. There is no UL for naturally occurring food folate.
· UL for folic acid is based on case reports in patients treated for vitamin B-12 deficiency treated with high doses of folic acid ($5 mg/d in most cases) and the observation that
hematologic but not neurological symptoms were reversed in the majority of cases with the folic acid treatment.
· UL for children
o No direct data available for children aged 1–18 y
o Used adult UL and adjusted by weight: 300–800 μg/d, depending on the age group
o No UL established for infants
1 DFE, dietary folate equivalent; EAR, Estimated Average Requirement; Hcy, total homocysteine; IOM, Institute of Medicine; UL, Tolerable Upper Intake Level. Adapted from
reference 55 with permission.
Biomarkers of nutrition for development—folate review 1641S
by guest on May 26, 2016
jn.nutrition.orgD
ownloaded from

A recent review of folate deficiency worldwide comparedsurveys of folate status published between 1995 and 2005 (84)and highlighted many of the challenges confronting the globalcommunity (Table 8). The overall conclusion of the report wasthat to gain a better understanding of the magnitude of folatedeficiency worldwide, there was a need for more population-basedstudies specifically designed to assess folate status, consensus onthe best indicators for assessing folate status, and agreement onthe appropriate biomarker cutoff point to define the severity ofdeficiency (84).
The European Community has been addressing this issue in avariety of ways and several points can be made about these efforts:
· Although nationally representative dietary surveys areavailable for several European countries (85), such surveysare often conducted without the inclusion of correspondingblood samples for determination of biomarker status,thereby preventing biomarker concentrations to be exam-ined in relation to population intakes of folate.
·Observed variability in folate status among Europeancountries is primarily due to differences in exposure to folicacid–fortified foods:
o National fortification policy varies considerably throughoutthe European Union.
o Many European countries (e.g., the United Kingdom andIreland) permit the addition of folic acid and other nutrients
to foods on a voluntary basis (i.e., at the manufacturer�sdiscretion); others (e.g., Denmark) prohibit fortification of
any kind or specifically limit fortification with folic acid
(e.g., The Netherlands).o The United Kingdom and Ireland have voluntary, relativelyliberal, fortification policies that permit folic acid and other
micronutrients to be added to various foods (e.g., breakfast
cereals), thus allowing the consumer to have ready access to
fortified foods. Under these conditions, studies show that
typically ;75% of the population will consume fortified
foods on a regular basis.
·The impact of voluntary fortification was examined in aconvenience sample of 441 healthy adults aged 18–92 y who
were not taking folic acid supplements in Northern Ireland
(86):o Fortified foods were associated with significantly higher totalfolate and folic acid intakes.
FIGURE 1 Serum folate concentrations by age group in the US population aged$1 y stratified by sex and race/ethnicity: NHANES 2003–2006.
Values are geometric means; error bars represent 95% CIs. To convert mg/L to nmol/L, multiply by 2.266. MA, Mexican American; NHB, Non-
Hispanic Black; NHW, Non-Hispanic White. Adapted from reference 72 with permission.
1642S Supplement
by guest on May 26, 2016
jn.nutrition.orgD
ownloaded from

o RBC folate concentrations were 387 nmol/L higher, andplasma homocysteine concentrations were 2 mmol/L lower,in the group in the highest tertile of fortified food intake(median intake of 208 mg/d folic acid) compared withnonconsumers of fortified foods (0 mg/d folic acid).
Although a comprehensive review of efforts to address folatestatus globally is beyond the scope of this article, a comparisonof folate intake recommendations by different countries pro-vides insight into global efforts to establish folate intakerecommendations to maintain adequate folate status. Table 3presents a comparison of these country- or region-specific folateintake recommendations, which have been previously reviewed(65).
Folate status in children. As will be discussed in further detailbelow, folate biology and subsequent requirements are develop-mentally sensitive. As noted, the bulk of surveillance has focused
on the folate status of adults. However, some effort has gone intothe assessment of status of children. Two prime examples arepublished data from population-based surveys conducted in theUnited Kingdom (87) (Figure 5) and the United States (88). Bothreports describe a decline in folate status biomarkers with agefrom childhood to adolescence; these observations in British andAmerican children are consistent with findings from Belgian,Dutch, and Greek children (albeit not population-based cohortsbut convenience samples) (89–91), also showing age-relateddecreases in folate concentrations. Of particular note, wheredietary intakes were also measured by using validated method-ologies (87, 88, 91), the data showed that dietary folate intakesin general compared favorably with dietary reference valuesacross all age groups and were not lower in the older childrenafter adjustment for total energy. The mechanism for the declinein folate status biomarkers with age in children and adolescents,despite no corresponding decline in dietary folate intakes, is notclear but may be an indication that folate requirements of olderchildren are increased due to higher metabolic demands forgrowth from childhood to adolescence (Table 9).
Major causes of folate inadequacy in developed and
underdeveloped countries. Folate inadequacy is not uncom-mon, even in otherwise well-nourished populations. As with anynutrient, a low or deficient status of folate can arise in anysituation in which requirements are increased or availability isdecreased or both, with the clinical manifestation of folatedeficiency (i.e., megaloblastic anemia) more likely to be presentwhen both occur simultaneously. The major causes of folateinadequacy are shown in Table 9. The biology of folate, includingincreased demands from a life stage and clinical perspective, willbe covered in the subsequent sections. The assessment of thesefactors linked to folate inadequacy requires accurate and reliablemeasures of folate exposure. The following section addressesour current tools to evaluate that need.
Determining adequacy of folate intake/status. As discussedin greater detail below, RBC folate, widely considered the mostrobust biomarker of long-term status, is found to be moderatelycorrelated with habitual folate intake when the latter isexpressed as DFEs (as is done in the United States), thus ac-counting for the greater bioavailability of folic acid comparedwith naturally occurring food folates (86) (Figure 6). Thisconversion factor is not applied in most European countries,where folate intakes are expressed as total folate in microgramsper day (Table 3). As a result, the relation between folate
FIGURE 3 RBC folate in the US population aged $4 y stratified by
sex or race/ethnicity: NHANES 1988–2006. Values are age-adjusted
geometric means; error bars represent 95% CIs. Within a demo-
graphic group, bars not sharing a common letter differ (P , 0.05). To
convert mg/L to nmol/L, multiply by 2.266. Adapted from reference 72
with permission.
TABLE 6 Summary of key findings of folate status in the USpopulation after initiation of mandatory fortification in 1998
· Serum and RBC folate concentrations followed a U-shaped age pattern, with the
lowest concentrations seen in adolescents and young adults, respectively (Figure 1)
(72).
· Serum folate concentrations more than doubled and RBC folate concentrations
increased by ;50% (Figures 2 and 3) (72).
· Small decreases (,10%) in serum and RBC folate concentrations were observed
from the earlier (1999–2002) to the later (2003–2006) postfortification period
(Figures 2 and 3) (72).
· Based on microbiologically equivalent blood folate data for 6 prefortification (1988–
1994) and 12 postfortification (1999–2010) years, the prevalence of low serum (,10
nmol/L) or RBC (,340 nmol/L) folate concentrations was #1% postfortification,
regardless of demographic subgroup, compared with 24% for serum folate and 3.5%
for RBC folate prefortification (72).
FIGURE 2 Serum folate concentrations in the US population aged
$4 y stratified by sex or race/ethnicity: NHANES 1988–2006. Values
are age-adjusted geometric means; error bars represent 95% CIs.
Within a demographic group, bars not sharing a common letter differ
(P , 0.05). To convert mg/L to nmol/L, multiply by 2.266. Adapted
from reference 72 with permission.
Biomarkers of nutrition for development—folate review 1643S
by guest on May 26, 2016
jn.nutrition.orgD
ownloaded from
biomarkers and dietary intake is found to be weaker, i.e., forRBC vs. natural food folates r = 0.290 (P < 0.001) and for RBCvs. food folic acid r = 0.416 (P < 0.001) (86). The contrastingapproaches to expressing dietary folate intakes make anyevaluation of adequacy of dietary folate intake in relation tobiomarker status, or comparison of folate recommendationsbetween countries, inherently complicated.
Folic acid in circulation: what does it mean? Concerns havebeen raised about the low concentrations of fasting unmetab-olized circulating folic acid (0–2 nmol/L) found in subjectsconsuming fortified foods and/or folic acid–containing supple-ments (92). The concern about folic acid is primarily becausefolic acid is not a naturally occurring form of the vitamin. The‘‘absence’’ of unmetabolized folic acid in plasma at lower folicacid doses in some studies most likely reflects limitations of theassay methods used to detect very low concentrations of folicacid.
A review of the extant literature revealed a single humanstudy in postmenopausal women that reported what the authorsconcluded was a potential adverse effect of folic acid (93).Unmetabolized folic acid, but not total folate, in plasma wasrelated to a decrease in NK cell cytotoxicity. Many of theelderly subjects in the study were obese, and it is possible theyhad conditions that influenced the concentration of solublefolate-binding protein (FBP) in plasma. If so, plasma folic acidconcentrations would be merely reporting on the concentrationsof soluble FBP (folic acid has a very high affinity for FBP), which,in turn, would be reporting on an underlying condition, andneither would be causative for the decrease in NK cell cytotox-icity. Other studies showed no effect of folic acid on NK cellcytotoxicity (94).
The effect of folic acid supplements on human-milk folatecontent was assessed in women who had received a folic acidprenatal supplement (750 mg/d) and who consumed 400 mg/ddietary folate during the third trimester of pregnancy (95).In this study, the prenatal folic acid dose did not increasehuman-milk total folate, but the proportion of folic acidincreased to 40% of total breast-milk folate. A possibleconcern was raised about the effect of prenatal folic acidsupplements on breast-milk folic acid concentrations; how-ever, folic acid has been added to infant formula for manyyears without any apparent adverse effect. Aside from theresults reported above, no confirmed metabolic effects havebeen found for plasma folic acid that would not be mimicked
by the much higher concentrations of reduced folate in plasma.Thus, it is difficult to envisage a scenario in which the very lowconcentrations of circulating folic acid could have a specificadverse effect.
A case study in public health intervention: folic acid and
NTDs. Two landmark clinical trials (51, 52) showed that folicacid, taken periconceptionally, could reduce the risk of bothrecurrent (51) and the first occurrence of (52) NTDs dramati-cally and led the USPHS to recommend that all women ofchildbearing age who are capable of becoming pregnant take400 mg folic acid daily. Only a minority of women followed thisrecommendation, prompting the FDA to mandate that enrichedcereal grain products (e.g., bread, pasta, rice) be fortified with140 mg folic acid per 100 g grain in order to reach the populationat risk.
The impact of this effort has not been easy to measure. In theUnited States, most NTDs are diagnosed prenatally and preg-nancies may be terminated without being identified in vitalrecords. Thus, determining the prevalence of NTDs reported onbirth certificates results in many missed cases (78). Fortunately,in Canada, which has a very similar fortification program, moreinformation is available on prenatally diagnosed cases (96).Comparing the impact of fortification between US and Canadianstudies showed that the decrease in prevalences was greater inareas where ascertainment was more complete (97). However,the percentage reduction in prevalence was greater in Canadabecause the baseline prevalence was higher than in the UnitedStates, whereas the NTD prevalence postfortification waslower in the United States than in Canada. Because percentagereduction is a function of the baseline prevalence (98) it shouldonly be used to monitor progress within a population and not beused to compare the impact of folic acid intervention on NTDsamong countries.
The lowest achievable NTD prevalence in response to folicacid intervention is estimated to be ;5–6 per 10,000 pregnan-cies and consists of largely folate-insensitive NTDs. Other causesof NTDs are not preventable by folic acid (e.g., drug exposure,other genetic conditions) and these are thought to contributeto ;5 NTDs per 10,000 births because folic acid fortificationresults in reductions to approximately this rate in multiplepopulation settings (78).
Can folate status biomarkers be used to assess NTD risk? Thenumber of NTDs that could be prevented in a populationhas been shown to be dependent on folate status; specifically,
TABLE 7 Features of mandatory fortification
· Mandatory fortification of$1 food products is carried out under specific regulations
or laws that are country-specific (80).
· Mandatory fortification can include many food products or be limited to only 1 staple
food product.
· The level of folic acid fortification should be determined by the average daily
consumption of the chosen food product and the mean target intake of folic acid
desired in the target population (81).
· In the United States and Canada, all cereal-grain food products labeled as enriched
are fortified through a standard of identity regulation at 1.4 mg/kg flour or cereal-
grain product (70).
· Case study: Chile
o Only bread is fortified with folic acid based on the goal of providing an average
of 400 μg/d folic acid to women 15–44 y of age.
o Food consumption patterns were used to support the decision to fortify bread
flour with 220 μg folic acid per 100 g of bread flour (82).
FIGURE 4 All countries shown in black fortify flour with at least iron
and folic acid, except for Australia, which does not include iron, and
Venezuela, the United Kingdom, the Philippines, and Trinidad and
Tobago, which do not include folic acid. Reproduced from reference
83 with permission.
1644S Supplement
by guest on May 26, 2016
jn.nutrition.orgD
ownloaded from

RBC folate concentration has been shown to be a reasonablebiomarker of NTD risk (99, 100). Daly et al. (100) found thatthe prevalence of NTD in an Irish population was <8 per 10,000when RBC folate concentrations were $906 nmol/L. The dose-response between RBC folate concentrations and NTD risk inthe Irish study (100) agreed with data modeled from Chinesefolic acid intervention studies by Crider et al. (99). Crider et al.(99) reported that the NTD risk was substantially attenuated atRBC folate concentrations >1000 nmol/L. Their results indi-cated that an RBC folate concentration of ;1000–1300 nmol/Lmay achieve optimal prevention of folate-sensitive NTDs, with aresulting overall risk of NTDs of ;6 per 10,000 births. On thebasis of distributions of RBC folate concentration (88, 99), theUS population level of NTDs prefortification was estimated tobe 10.1–16.4 per 10,000 births and postfortification prevalenceto be in the range of 4.2–7.7 per 10,000 births (99). The WHOhas developed new guidelines for optimal RBC folate concen-trations associated with NTD risk reduction on the basis ofpublished findings (101).
Has food fortification with folic acid prevented all folate-related NTDs in the United States? In 2 studies (102, 103),investigators collected data on folate/folic acid exposurein women who had NTD pregnancies and women who hadunaffected pregnancies. They found that women who had anaffected child were not significantly less likely to have usedfolic acid supplements. The data from these 2 epidemiologicstudies suggest that because folic acid supplement use was notdetermined to significantly affect NTD risk, the amount offolic acid in fortified food alone in the United States may besufficient to prevent a large percentage of folate-related NTDs.Conclusions from these studies are not definitive because thenumbers of affected cases may have been insufficient to detecta true difference. The small sample sizes prevented subgroupanalysis, which may have revealed racial/ethnic differencesbecause a smaller decline in NTDs was detected in Hispanicsduring the postfortification period relative to non-Hispanicwhites. In addition, recall bias cannot be ruled out because ofthe long period of time between interview and neural tubeformation (up to 3 y).
A subgroup of US women who are non–supplement usersmay still be at increased risk of folic acid–preventable NTDs.This conclusion is based on the following facts: 1) folic acidsupplements are taken infrequently by women of childbearingage in the United States (;30%) (104), 2) there is a high rate ofunplanned pregnancies in the United States (;50%) (105), and
3) the neural tube closes by day 28 of gestation, before mostwomen know they are pregnant (106).
Because NTDs are known to have a strong genetic compo-nent, there has been an extensive search for folate gene variantsthat increase the risk of NTDs. The results have been mixed,which may relate to the mitigating effect that folic acid intakehas on genetic risk. Thus, although many genetic variants infolate enzyme genes have been identified, a relatively smallnumber have been shown to influence folate or homocysteineconcentrations (107). Nonetheless, MTHFR 677 C>T has beenshown to be a risk factor for NTDs in most studies and in a largemeta-analysis (108).
The question of whether birth abnormalities other thanNTDs are significantly affected by maternal folic acid in-take has been investigated (109–113). There is, however,a lack of consistent evidence that the risk of birth defectsother than NTDs is positively affected by folic acid in theamount consumed in supplements and/or fortified foods(109–113).
TABLE 8 Key points regarding the extant global folate surveydata1
· Folate status was most frequently assessed in
o women of reproductive age (34 countries) and
o in adults generally (27 countries).
· Surveys of preschool-aged children and pregnant women, those likely to be at
greatest risk of deficiency, are greatly lacking.
· The majority of the 145 studies examined (78%) assessed folate status by serum (or
plasma) folate; far fewer reported RBC folate (45%).
· Few nationally representative studies were available for investigation; but, on the
basis of evidence from countries with such survey data, deficient folate status (i.e.,
.5% of the population with a serum folate value below the normal range) was
identified in specific age groups in 6 of 8 countries, most notably in preschool-aged
children in Venezuela, pregnant women in Costa Rica (before mandatory fortification)
and Venezuela, and the elderly in the United Kingdom.
1 Data from reference 84.
FIGURE 5 RBC folate and plasma homocysteine concentrations in
a representative sample of British children aged 4–18 y. Differences
between groups were assessed by using 1-factor ANOVA (with
Tukey�s post hoc test), adjusted for sex, smoking, breakfast cereal
consumption, and supplement use (ANCOVA: P , 0.05). Bars not
sharing a common letter differ, P , 0.05. Adapted from reference 87
with permission.
Biomarkers of nutrition for development—folate review 1645S
by guest on May 26, 2016
jn.nutrition.orgD
ownloaded from

Folate Biology and Homeostasis
The ability to discover and develop biomarkers, particularlythose reflecting nutrient function or effect, is contingent on anappreciation of the role of nutrients within relevant biologicalsystems. To provide some perspective on the folate expert panelrecommendations, the following sections describe the specificroles and interrelations of the folates.
Current understanding of the biology: dependentsystemsStructure, function, and absorption. The tetrahydrofolates(THFs), a family of structurally related, water-soluble vitaminscomposed of a fully reduced pterin ring, a p-aminobenzoylgroup, and a polyglutamate peptide containing up to 9 gluta-mate residues linked by unusual g-peptide linkages, have beenwell described (114) and are represented in Figure 7. The keyelements of folate metabolism are highlighted in Table 10.
Overview of folate-mediated one-carbon metabolism. Theintracellular functions of folate are interconnected throughcompetition for a limiting pool of folate cofactors within thenetwork, because the concentration of folate enzymes exceedsintracellular folate concentrations (114). More recent studiesindicate that the activity of these pathways is also regulatedby dynamic physical compartmentation and formation ofmultienzyme complexes that are required for pathway func-tion. The dynamic assembly of metabolic complexes addsadditional dimensions and complexity to the regulation ofthese pathways, including the necessity for regulated traf-ficking of folate cofactors among compartmentalized path-ways (115). Figure 8 summarizes the essential components ofTHF-related pathways. The key elements of those pathwaysare as follows:
· In the mammalian cell, one-carbonmetabolism occurs in thecytosol, mitochondria, and nucleus.
· THF polyglutamates are found in the lysosome where theyare converted to THF monoglutamates through the activityof g-glutamyl hydrolase (121).
· Folate-mediated one-carbon metabolism in the cytosol isa network of 3 interdependent biosynthetic pathways thatcatalyze the de novo synthesis of purine nucleotides, deoxy-thymidylate (dTMP), and remethylation of homocysteine tomethionine.
· In the nucleus, THF is required for the synthesis ofthymidylate at the replication fork (122) and may functionin histone demethylation catalyzed by lysine-specific de-methylase 1 (LSD1) (123).
· Formate is the primary source of one-carbon units fornuclear and cytosolic one-carbon metabolism and is gener-ated through mitochondrial one-carbon metabolism (120),although one-carbons carried by THF can be deriveddirectly in the cytosol from the catabolism of histidine,purines, and serine (114).
Methionine. The importance of these folate-dependent path-ways is exemplified by the role of methionine in numerouspathways including serving as a precursor for protein biosyn-thesis. Methionine can be converted to S-adenosylmethionine(SAM), which, in the decarboxylated form, participates inpolyamine synthesis and can serve as a cofactor and methylgroup donor for numerous methylation reactions including themethylation of chromatin (CpG islands in DNA) and histoneproteins, RNA, and numerous proteins and synthesis of neuro-transmitters, phosphatidylcholine, and other small molecules.SAM-dependent methylation regulates fundamental biologicalprocesses including nuclear transcription, mRNA translation,cell signaling (124), protein localization (125), and the degra-dation of small molecules (126). The essential elements of the 3primary folate-dependent pathways are shown in Figure 8 andFigure 9 and are described in Table 11.
Each of these pathways highlights the important role offolates in critical metabolic systems. Although the purinepathway has no folate relevant biomarkers, the other 2 offerimplications for potential biomarkers to assess folate. In thecontext of thymidylate biosynthesis, uracil accumulation inDNA is a biomarker of impaired de novo thymidylate biosyn-thesis (131). Uracil has been suggested to be a biomarker offolate (132) and vitamin B-12 status (133), but not all studiesagree (134). In mice, distinct tissues have different levels ofuracil incorporation into DNA (135).
Implications of homocysteine remethylation for folateassessment/biomarkers include the following:
· Biomarkers of impaired homocysteine remethylation in-clude depressed SAM concentrations and elevations inplasma homocysteine and S-adenosylhomocysteine (SAH)concentrations (136, 137), leading to hypomethylated DNA
TABLE 9 Primary causes of folate inadequacy
· Reduced dietary intake (e.g., low intake of folic acid–fortified foods, dark-green leafy
vegetables, legumes, select fruit such as orange juice)
· Increased requirement
o Increased physiologic requirement (e.g., pregnancy, lactation, rapid growth in
adolescence; see section on folate status in children)
o Pathological conditions (e.g., malignancy, inflammatory conditions, certain
anemias)
o Drugs (e.g., anticonvulsants, methotrexate, sulfasalazine)
· Decreased availability
o Impaired folate absorption (e.g., celiac disease, use of drugs such as
sulfasalazine)
FIGURE 6 Relation between dietary intake and biomarker status of
folate. Correlations were carried out on log-transformed data and were
calculated by using Pearson correlation coefficients (r). Correlations for
which P , 0.05 were considered significant. Total folate intake was
expressed as DFEs, which were introduced in the United States
to account for the higher bioavailability of synthetic folic acid added
to food compared with natural food folate. DFEs were calculated
as micrograms of natural folate plus 1.7 3 mg added folic acid. DFE,
dietary folate equivalent. Adapted from reference 86 with permission.
1646S Supplement
by guest on May 26, 2016
jn.nutrition.orgD
ownloaded from

and protein (including histones), which affect gene expres-sion and DNA stability (138–141).
· Folate-dependent homocysteine remethylation and plasmahomocysteine concentrations can be affected by both geneticvariation as well as other B-vitamin nutrient deficienciesincluding vitamin B-12.
· Because the MTHFR-catalyzed generation of 5-methyltet-rahydrofolate (5-methyl-THF) is irreversible in vivo, 5-methyl-THF accumulates in the cell and cannot be utilizedduring severe vitamin B-12 deficiency due to lack of MTRactivity, resulting in a folate ‘‘methyl trap,’’ which can impairpurine and thymidylate de novo biosynthesis (142).
One-carbon metabolism in mitochondria. THF monoglu-tamates are transported into mitochondria by the mitochon-drial folate transporter (143), where they constitute as muchas 40% of total cellular folate (144, 145). Folate monogluta-mates must be converted to THF polyglutamates to be retainedin mitochondria and become a distinct cofactor pool that isnot in equilibrium with THF polyglutamates in the cytosol(145). One-carbon metabolism in mitochondria is essential forglycine synthesis from serine, N-formylmethionine–transferRNA synthesis for mitochondrial protein synthesis initiationand the generation of formate from the amino acids serine,glycine, dimethylglycine, and sarcosine for cytosolic one-carbon metabolism (120) (Figure 9). Mitochondria-derivedformate traverses to the cytosol where it is a major source ofone-carbon units for cytosolic one-carbon metabolism. Morerecently, mitochondria have been shown to synthesize dTMPfor mitochondrial DNA replication (146). Whereas synthesisof dTMP for nuclear DNA replication is cell cycle regulated,mitochondrial DNA replication is not linked to cell cycleor nuclear DNA replication and occurs in proliferating andnonproliferating cells (147).
All mammalian cells, with the exception of RBCs, canconvert serine to glycine and formate, whereas the generation offormate from glycine, sarcosine, and dimethylglycine is re-stricted to liver, kidney, and stem cells and other undifferentiatedcell types. The disruption of glycine cleavage to formate, as wellas the generation of formate from 10-formyltetrahydrofolate(10-formyl-THF) catalyzed by methylene-THF dehydrogenase
(MTHFD) 1L, in mouse models and human subjects is associ-ated with increased risk of NTD-affected pregnancies (148–150). The THF-dependent catabolism of amino acids generates5,10-methylenetetrahydrofolate (5,10-methylene-THF), whichis oxidized to 10-formyl-THF by the bifunctional enzymesMTHFD2 (151, 152) and MTHFD2L (153). MTHFD1Lhydrolyzes 10-formyl-THF to formate in an ATP-generatingreaction (154, 155). Formate traverses to the cytosol forcytosolic and nuclear one-carbon metabolism (120). Thereare no established biomarkers for impaired mitochondrial one-carbon metabolism.
Homeostatic control of metabolism/nutrient-nutrientinteractionsOverview—homeostatic controls of one-carbon metabo-
lism. Research over the past ;10 y has shown that stronghomeostatic controls exist to reduce fluctuation in folate-dependent metabolic processes (8, 115). Were it not forhomeostatic controls, the rates of many of these biochemicalreactions would be very sensitive to fluctuation in dietary intakesof folate, vitamins B-6 and B-12, and choline and to postpran-dial fluctuations in cellular concentrations of macronutrientsubstrates such as serine, glycine, and methionine. Elements offolate homeostasis are described in Table 11. These regulatoryprocesses have been investigated by mathematical modelingstudies (127, 156–160) and by many biochemical and geneticapproaches. Controlled nutritional studies that use stable-isotopic tracers also have provided evidence of strong homeo-static regulation (161–167). Severe deficiency of folate andvitamin B-12 as well as genetic disorders clearly lead to impairedhomeostasis of one-carbon metabolism with reduced thymidy-late and purine synthesis, impaired homocysteine remethylation,and decreased SAM:SAH ratio associated with reduced methylationcapacity.
FIGURE 7 Structure of 10-formyltetrahydrofolate diglutamate.
pABG, para-aminobenzoylglutamate. Reproduced from reference
115 with permission.
TABLE 10 Essentials of folate absorption and metabolism1
· THF polyglutamates are the form of the vitamin present in cells and in food from
natural sources.
· THF polyglutamates must be hydrolyzed to THF monoglutamates in the gastroin-
testinal tract before absorption across the intestinal epithelium of the duodenum by
the PCFT (116).
· THF monoglutamates circulate in serum and are transported into cells through either
the reduced folate carrier or through receptor-mediated endocytosis of the folate
receptors (117, 118).
· Intracellular THF monoglutamates are processed into functional metabolic cofactors
through the re-establishment of the polyglutamate peptide (119).
· The glutamate polypeptide is essential to retain the vitamin within cells and to
increase its affinity for folate-dependent enzymes (114).
· Folic acid, a chemically stable and fully oxidized pro-vitamin that is found in fortified
foods and vitamin supplements
o is readily transported across the intestinal epithelium by PCFT,
o must be reduced to THF by the enzyme dihydrofolate reductase, and
o converted to a polyglutamate form to function as a metabolic cofactor.
· There are 5 one-carbon substituted forms of THF cofactors in cells. The one-carbon
moiety is covalently attached at the N5 and/or N10 position of the cofactor at the
oxidation level of formate (e.g., 10-formyl-THF), formaldehyde (5,10-methylene-THF)
or methanol (5-methyl-THF) (Figure 7).
· Intracellular THF cofactors function as a family of metabolic cofactors that chemically
activate and either accept or donate single carbons for a network of interconnected
metabolic pathways referred to as one-carbon metabolism (114, 120) (Figure 8).
1 PCFT, proton coupled folate transporter; THF, tetrahydrofolate.
Biomarkers of nutrition for development—folate review 1647S
by guest on May 26, 2016
jn.nutrition.orgD
ownloaded from

Other nutrient linkages with folate. As outlined above,folate�s role in a myriad of critical biochemical pathways occursin close association with other essential nutrient cofactors. Thepotential for interactions among these nutrients demands anappreciation of these interrelations and their implications. Table12 summarizes the nature of these interactions.
Specific considerations about absorption and metabolism
of folic acid. As discussed earlier (Table 10), folic acid is notnaturally found in food but is the more stable form of thevitamin used in food fortification and supplements. In light ofthe extent of its use, a brief review of essential components offolic acid absorption and metabolism is warranted, particularly
in light of unknown implications of circulating free folic acid.Most of the folic acid absorbed in the gut is rapidly converted toreduced folates, primarily 5-methyl-THF during its passageacross the intestinal mucosa and during first-pass metabolismin the liver. Some folic acid may appear in the peripheralcirculation, the amount depending on the dose. Folate retentionby tissues requires their conversion to long-chain-length poly-glutamate forms. Folic acid and 5-methyl-THF are poorsubstrates for conversion to retainable polyglutamates. Incom-plete conversion to polyglutamates by tissues such as intestinalmucosa and liver leads to the release of folate, mainly asmethylfolate, into plasma. The utilization of folic acid differsfrom that of dietary folates primarily in that it has to be reduced
FIGURE 8 Folate- and vitamin B-12–mediated one-carbon metabolism. One-carbon metabolism is required for the synthesis of purines,
thymidylate (dTMP), and methionine. The hydroxymethyl group of serine is a major source of one-carbon units, which are generated in the
mitochondria in the form of formate via SHMT2 or in the cytosol through the activity of SHMT1 or SHMT2a. Mitochondria-derived formate can
enter the cytoplasm and function as a one-carbon unit for folate metabolism. The synthesis of dTMP occurs in the nucleus and mitochondria.
At the S phase, the enzymes of the thymidylate (dTMP) synthesis pathway undergo SUMO-dependent translocation to the nucleus. The
remethylation of homocysteine to methionine by MTR requires vitamin B-12. The one-carbon is labeled in bold type. The inset shows the
thymidylate synthesis cycle, which involves the enzymes SHMT1, SHMT2a, TYMS, and DHFR. AdoHcy, S-adenosylhomocysteine; AdoMet,
S-adenosylmethionine; AICAR Tfase, glycinamide ribonucleotide transformylase and aminoimidazolecarboxamide ribonucleotide transformylase;
DHF, dihydrofolate; DHFR, dihydrofolate reductase; dTMP, deoxythymidine monophosphate; dUMP, deoxyuridine monophosphate; GAR Tfase,
glycinamide ribonucleotide transformylase; GCS, glycine cleavage system; MTHFD1, methylenetetrahydrofolate dehydrogenase 1; MTHFR,
methylenetetrahydrofolate reductase; MTR, methionine synthase; SARDH, sarcosine dehydrogenase; SHMT, serine hydroxymethyltransferase;
Sumo, small ubiquitin-like molecule; THF, tetrahydrofolate; TYMS, thymidylate synthase. Adapted from reference 115 with permission.
1648S Supplement
by guest on May 26, 2016
jn.nutrition.orgD
ownloaded from

to THF via dihydrofolate (DHF) by DHF reductase (DHFR)(Figure 10). The first step, the reduction of folic acid to DHF, isquite slow and may be influenced by individual variations inDHFR activity (221). Folic acid would be poorly transported bymany peripheral tissues. The limited peripheral tissue uptakemay be explained by folic acid�s very poor affinity for theRFC transporter, so transport would primarily be into tissuesthat express the proton coupled folate transporter (PCFT) andthe limited number of tissues that express folate receptors(membrane-associated FBPs). The clearance of folate fromplasma is very fast. After a single oral dose of folic acid, plasmafolate (which would be mainly 5-methyl-THF) peaks after ;2 hand then falls, with a mean residence time of ;10 min (222).Plasma folate concentrations decrease with a similar half-lifeafter an intravenous injection of folic acid (223). This rapidclearance indicates that fasting plasma folate concentrationsprimarily reflect reduced folates released by tissues. Whyunmetabolized folic acid should still be present in plasma afterfasting is less clear.
The concentrations of unmetabolized folic acid in fastingplasma are very low, representing at most a small percentage oftotal folate, and, somewhat unexpectedly, are poorly correlatedwith total folate (7, 92). These folic acid concentrations are verysimilar to those reported for soluble FBP in serum (224, 225).Folic acid has a very high affinity for FBP and binding to thisprotein would explain the persistence of low concentrations offolic acid in plasma in the fasted state. Human serum containsprimarily FBP-g, derived from neutrophil granulocytes, andsome FBP-a, with total concentrations ranging from 0.5 to1.5 nmol/L (225). Early studies, before the identification of FBP,indicated a high-affinity folic acid binder in serum that wasincreased in folate deficiency (up to 1 nmol/L), pregnancy, and insome cancers (226). These early studies probably measuredunligated FBP rather than total binding capacity. There is littleknown about conditions that influence the concentrations ofsoluble plasma FBP.
As stated above, the Folate Expert Panel is not aware of anytoxic or abnormal effects of circulating folic acid. Folic acid hasbeen added to supplements for many years and in larger amountsthan are obtained by food fortification in the United Stateswithout any apparent adverse effects.
Clearly, the family of folates is intimately and inextricablyinvolved in numerous biological systems with significant impli-cation for health and disease. As we learn more about theseinterrelations the need for better tools to assess folate statusassumes even greater importance. The following section onfolate biomarker overview summarizes the Folate Expert Panel�sevaluation of the currently available biomarkers of folatecovering a range of uses.
Folate Biomarker Overview
The usefulness, advantages, disadvantages, and analytical con-siderations for the folate priority biomarkers (serum, RBCfolate, and homocysteine) have been summarized for all users bythe Folate Expert Panel (Table 13). Later sections and Supple-mental Table 1 include specific details for the priority bio-markers identified by the Folate Expert Panel as being mostuseful for the range of uses covered by the BOND community.
Biomarker-Specific Issues
This section is an overview of the conclusions of the FolateExpert Panel with regard to those biomarkers that were deemed
FIGURE 9 Schematic representation of
one-carbon metabolic pathways and their
homeostatic regulation. Black lines designate
enzymatic reactions. Light lines with rounded
ends designate stimulation, and dark lines
with rounded ends indicate inhibition. BHMT,
betaine:homosysteine methyltransferase;
CBS, cystatione-b-synthase; GDC, glycine
decarboxylase complex; GNMT, glycine N-
methyltransferase; MAT, methionine adeno-
syltransferase; MS, methionine synthase;
MTHFR, methylenetetrahydrofolate reduc-
tase; SAH, S-adenosylhomocysteine; SAHH,
S-adenosylhomocysteine hydrolase; SAM, S-
adenosylmethionine; SHMT, serine hydrox-
ymethyltransferase; THF, tetrahydrofolate; X,
indicates DNA, protein, or other compound
involved in methylation reaction. Adapted
from reference 127 with permission.
TABLE 11 Homeostatic controls of folate metabolism1
· SAM, an allosteric activator of cystathionine b-synthase and an allosteric inhibitor of
MTHFR.
· 5-Methyl-THF (in polyglutamyl form), which inhibits GNMT and the use of SAM and
glycine to produce sarcosine (N-methylglycine) and SAH.
· Homeostatic regulation also occurs under conditions of high folate intake and the
accompanying high intracellular folate concentration.
· Many of the folate-dependent enzymes also exhibit inhibition by nonsubstrate
polyglutamyl forms of THFs such as THF, 5-methyl-THF, and 5-formyl-THF (128–130).
· Shifts in the concentration of certain metabolites tend to maintain flux through
metabolic pathways. These concurrent effects strongly support homeostasis
(Figure 9).
1 GNMT, glycine N-methyltransferase; MTHFR, methylenetetrahydrofolate reductase;
SAH, S-adenosylhomocysteine; SAM, S-adenosylmethionine; THF, tetrahydrofolate.
Biomarkers of nutrition for development—folate review 1649S
by guest on May 26, 2016
jn.nutrition.orgD
ownloaded from

TABLE
12
Summary
offolate:nutrientinteractions1
Nutrie
ntImplicated
enzymes/metabolic
pathways
Keyfeatures
ofinteractions
Effect
ofnutrient
deficiencyon
folate
biom
arkers
VitaminB-12
(cobalam
in)·Vit
amin
B-12
(asmethylcobalam
in)serves
asa
coenzymeinthemethioninesynthase
reaction.·Via
itsroleinmethioninesynthase,vitaminB-12
isintim
atelyassociated
with
the
functionof
folate-dependent
one-carbon
metabolism
needed
forhomocysteine
regulation,cellularmethylationreactions,and
nucleotidesynthesis.
·BecausevitaminB-12
isrequiredforfolateretentionindeveloping
RBCs,RBC
folate
concentra
tions
aredependentonvitaminB-12
aswellasfolateavailability,andlow
concentra
tions
may
reflectvitaminB-12
deficiencyas
wellasfolate
deficiency.
·Thus,vitamin
B-12
isnecessaryforthemethio-
nine
synthase–based
conversion
of5-methyl-THF
toTHFandsubsequententry
intootherphasesof
one-carbon
metabolism.
·InsufficiencyofvitaminB-12
leadstoan
accumulationofmethylmalonyl-CoA,w
hich
undergoeshydrolysistoMMA,which
provides
afunctionalbiomarkerofvitaminB-12
deficiency(169).
·Acasestudyof
apatient
with
vitaminB-12
deficiencyandtheMTHFR
C677TSN
P
indicatedhigherHcy,lowerRBCs,and
ahigherpercentage
of5-methyl-THF
inRBCs
beforeas
comparedwith
aftervitaminB-12
supplementation,providingevidence
of
``methyltrapping
``
inhuman
vitaminB-12
deficiency(172)
·Anotherproposedaspectofvitam
inB-12–dependent
homeostasisinvolves
translationalregulationof
methioninesynthase
expression
(168).
·Despite
theelevationof
MMAandhomocysteinedueto
vitamin
B-12
deficiency,
little
isknow
naboutthefunctionalimpactof
thechangesinflux.
·Vitam
inB-12
serves
intheform
ofadenosylco-
balamin
asacoenzymeformethylmalonyl-CoA
mutaseforthe
conversion
ofmethylmalonyl-CoA
tosuccinyl-CoA.Themethylmalonyl-CoA
path-
way
isinvolved
inthecatabolism
ofbranched-
chainam
inoacidsan
dod
d-chainFA
san
d
supportstheTC
Acycleby
supplyingsuccinyl-
CoA.
·Severe
vitaminB-12
deficiency,as
occursinuntre
ated
pernicious
anem
ia,perturbs
homoeostasisof
one-carbon
metabolismthroughreducedfluxof
theMSreaction.
·Ininfants,vitaminB-12
rather
than
folate
status
predictsHcy(173,174),andhigh
serumfolateisattributedtomethylfolatetra
ppingas
demonstratedby
reductionin
both
Hcyandserumfolate
aftervitaminB-12
supplementation(173).
·Becausetheonlymetabolicfunctionof
5-methyl-THF
isas
asubstra
tein
theMS
reactionforh
omocysteineremethylation,reducedMSactivity
causes
5-methyl-THF
toaccumulateinthe``m
ethyltrap
``(170,171).
·Likew
ise,adults
with
purevitam
inB-12
deficiency(pernicious
anem
ia)also
have
falsely
increasedserumfolate
concentrations,w
hich
return
tobaselineonlyaftervitaminB-12
replacem
ent(175–178).
·Because5-methyl-THF
monoglutamateisapoor
substra
teforelongationby
folate
polyglutam
atesynthetase,the
accumulated
5-methyl-THF
readily
diffu
sesfro
mthe
cell,leadingto
aprogressivereductionininvivo
folate
poolsize
andthus
indirect
inductionof
intra
cellularfolate
deficiency.
·Insufficiency
ofvitamin
B-12,folate,or
both
leads
toan
accumulation
of
homocysteine.Inpopulationgroups
who
consum
efolic
acid–fortifiedfoodsor
folic
acidsupplements,Hcyisconsidered
amorereliablebiom
arkerofvitaminB-12
status
than
offolate
status
(179).
Iron
·Both
nutrients
are
intim
atelyinvolved
inthe
erythropoiesisprocess.
·Ironisnotdirectlyinvolved
infolatemetabolismormetabolicfunctioning
associated
with
one-carbon
metabolism.H
owever,m
etabolicandphysiologicinteractions
exist
betweenironandfolate.
·Ironandfolate
deficienciesoftenoccursimultaneously,with
theprevalence
most
common
amongpregnant
wom
enandindividualssuffe
ringfro
mgastrointestinal
disordersandintestinalparasites(187).
·Hemecarrier
protein1,
also
calledthePCFT,
constitutes
aphysiologicintersectionof
ironand
folate
becausePCFT
serves
asamajor
intestinal
folate
absorptionmechanism
while
also
serving
asahemetra
nsporte
r(115).
·Insufficient
ironimpairs
hemeproduction,
whereas
folate
and/or
vitamin
B-12
deficiencyleadsto
impairednucleotidesynthesisneeded
forthe
maturationof
the
RBCs,w
hich
leadsto
macrocytic
anem
ia.
·Someinvestigatorssuggestthatirondeficiencycanalterfolatemetabolism,inducing
afunctionaldeficiency,
whereas
others
proposethat
the2conditionsdevelop
independently
(187,188).
·Ferritin
hasbeen
reporte
dto
catalyze
asingle-
turnovercleavage
of5-formyl-THF
toapterinand
para-aminobenzoylglutam
ate;
thishasbeen
pro-
posedas
amechanism
contributingto
folate
turnover
(180,181).
·Theobserved
greaterincidenceof
neutrophilhypersegmentationinirondeficiency
anem
iaconcurrent
with
folate
and/or
vitamin
B-12
deficiencyimpliesinteractive
effectson
theerythropoieticprocess(183,184).
·The
impact
ofiron
status
onfolate
biom
arkers
may
depend
oncontributing
physiologicinfluencesandseverityof
ironandfolate
deficiencies.
·Heavy-chain
ferritin
also
hasbeen
show
nto
increase
SHMTexpression
andfavorthymidylate
synthesisinculturedcells
(181),an
effectshow
n
tobe
regulatedby
aferritin-re
sponsive
internal
ribosom
eentry
sitethatisnotdependenton
iron
availability(182).
·PCFT
expression
analysissuggeststhatthePCFT
also
serves
alongwith
otherfolate
transporte
rsindeliveringfolate
totissues
such
astheplacenta
andbrain(185).
·Patientssuffe
ringfro
mirondeficiencydueto
intestinal
parasitesandgastrointes-
tinal
disordersoftenhave
noevidence
ofimpairedfolate
intake
orabsorptionbut
presentw
ithmegaloblasticdysplasiaandothersigns
ofcomprom
ised
folatestatus,
includinglow
serum
folate
butnormal
orelevated
RBCfolate
(187,188).These
symptom
s,caused
byimpairedDN
Asynthesis,canbe
reversed
byironrepletion
alone(188).
·Overexpression
offerritin
incultured
cells
lowered
the
intra
cellularfolate
concentra
tion,
although
alternativemechanism
sof
folate
breakdow
nandturnover
doexist(180,186).
·Incontrast,treatmento
funcom
plicated
irondeficiencyanem
iawith
ironalonemay
``unm
ask
``
folate
deficiency,
manifestingmorphologic
andhematologic
changes,
despite
normalserumandRBCfolate
concentra
tions
(187).
·Oxidativestress
associated
with
ironoverload
may
also
beproven
tocontributeto
nonspecific
oxidativeturnover
offolates.
·Inrodentmodels,itiswellestablishedthatmaternalirondeficiencydecreasesmilk
folate
contentandretardsneonatalgrow
th,independent
ofmaternalfolatestatus
(188).Although
theimpactofirondeficiencyon
folatestatus
duringlactationhasnot
been
wellstudiedin
humans,
astudyfro
mMexicoindicatedthat
milk
folate
secretions
werenotimpairedduringmaternalirondeficiencyassociated
with
altered
neonatalgrow
th(189).
(Continued)
1650S Supplement
by guest on May 26, 2016
jn.nutrition.orgD
ownloaded from

TABLE
12
Continued
Nutrie
ntImplicated
enzymes/metabolic
pathways
Keyfeatures
ofinteractions
Effect
ofnutrient
deficiencyon
folate
biom
arkers
Choline
·Does
notdirectly
participate
infolate
metabo-
lism,butinteractions
existwhich
affect
folate
metabolismandhomeostatis.
·Althoughtheoxidationpathway
isintim
atelylinkedto
one-carbon
metabolism,
quantitativeaspectsof
such
interactions
with
folate
homeostasisremainunclear.·Die
tarycholineinadequacy
may
also
affectbiom
arkersof
folate
status
(200).
·FAD-dependentcholinedehydrogenasecatalyzes
oxidationofcholinetobetainealdehyde,w
hich
is
furth
eroxidized
byNAD
-dependent
betaine
aldehyde
dehydrogenaseto
form
betaine(trime-
thylglycine).
·Becauseadequate
cholineintake
provides
asupplyof
betaineto
allownon–folate-
dependenthomocysteine
remethylation,
choline
can
partially
compensate
in
maintaining
methylationdespite
dietaryfolate
insufficiency
(190).
·Short-term
(,3wk)
administra
tionof
acholine-deficient
diet
torats
depleted
hepatic
folate
content,decreasedtissueconcentra
tions
ofSA
M,diminishedglobal
DNAmethylation,and/or
increasedhomocysteine(201–205).
·Betaineactsas
amethyldonor
forB
HMT,which
catalyzesafolate-independentalternativereme-
thylation
mechanism
toform
methionine
and
dimethylglycine.
·Folate,butnotcholine,modified
NTD
riskinan
Shmtknockout
mouse
model(33),
whereas
dietarycholineintake
andvariantsincholinemetabolizing
genesassociate
with
NTDsinhuman
populations
(191–193)and
theam
ountoffolateintake
hasbeen
show
nto
modulatecholinemetabolisminmice(194).
·Inchronically
(12mo)choline-deficient
rats,hepatictotalfolateconcentra
tionwas
notaltered;
however,polyglutam
ationwas
elevated,possibly
dueto
increased
conservationof
thefolate
coenzymes
(206).
·Incontrast
towidely
distributed
methionine
synthase,BH
MTexists
onlyin
theliver,kidney,
andthelens
oftheeye.
·Cholineintake
appearsto
bean
ameliorativefactor
affectinghuman
NTD
risk,but
theliteratureisnotconsistent
(191,192,195).
·Inhumans,
dietarycholineinadequacy
elevated
plasmahomocysteine(afte
ra
methionineload)but
didnotinfluence
circulatingconcentra
tions
offolate
(203).
·Dimethylglycine
isfurth
eroxidizedwith
concur-
rent
transferof
themethylg
roupsto
thefolate
cycleby
thesequentialactionofNAD
-dependent
dimethylglycine
dehydrogenaseformingN-meth-
ylglycine(sarcosine)andsarcosinedehydrogen-
aseformingglycine.Both
oftheseutilize
THFas
theone-carbon
acceptortoform
5,10-methylene-
THF.
·Common
genetic
polymorphismsof
one-carbon
metabolism
also
influence
the
susceptibilitytoeffectsoflowcholineintake
(196)and
men
with
theMTHFR
677TT
(vs.677CC)
genotype
usemorecholineas
amethyld
onor
(197).Theeffect
ofthe
MTHFD1polymorphismisstrongerthan
thatofMTHFR
andotherS
NPs
inthefolate
pathway
(196).
·Incontrolledstudies,healthyyoungadultsexhibitedno
evidence
ofimpairedfolate-
dependentrem
ethylationor
totalrem
ethylationduringeither
mild
folate
restriction
(164,198)orvitaminB-6restriction(162),andfolate-dependent
remethylation(i.e.,
viamethioninesynthase)accounted
fornearlyallofthewhole-bodyremethylation
fluxinboth
studies.
·Incontrast,population
studies
indicated
that
betaine
may
bea
significant
determinantof
plasmahomocysteine(199).
VitaminB-6
(pyridoxine)
PLP,thecoenzymeform
ofvitaminB-6,functions
asa
cofactor
in:
·Regulatory
mechanism
sexistto
buffe
rthecomponentsof
one-carbon
metabolism
againsttheeffectsof
marginalvitamin
B-6deficiency,primarily
viaincreasesin
substra
teconcentra
tions
forkeyPLP-dependentenzymes
asaresultof
reduced
activity
oftheglycinecleavage
system
,SHM
T,andcystathionineg-lyaseassociated
with
reducedintra
cellularPLPavailability(163,167,207).
·Vitam
inB-6deficiencyweaklyaffectsplasmahomocysteineconcentra
tion(208).
·theglycinecleavage
system
andSH
MT,both
ofwhich
mediate
thesupplyof
5,10-methylene-
THF
·Consequently,
thesupplyof
5,10-methylene-THF,10-fo
rmyl-THF,a
nd5-methyl-THF
remainadequate
tosupportthedemands
fornucleotidesynthesisandmethylation
overawiderangeofvitaminB-6intakes,whereas
cellularand
plasmahomocysteine
areonlyweaklyaffected
byvitaminB-6insufficiency
(208,209).
·Cellculture
studiesandmathematical
modelingsuggestthat
theproportions
of
formyl-,methyl-,
methylene-,andunsubstituted
THFs
canbe
alteredby
vitaminB-6
deficiency(211).
·thetra
nssulfurationpathway
enzymes
cysta-
thionine
b-synthaseandcystathionineg-lyase,
which
mediatethedisposalofhomocysteineand
synthesis
ofcysteine.
·Homocysteineandglycinearerelativelyweakbiom
arkersofvitaminB-6status,and
cystathionineisamoresensitive
functionalindicatoroflowvitaminB-6status
(162,
165,210).
(Continued)
Biomarkers of nutrition for development—folate review 1651S
by guest on May 26, 2016
jn.nutrition.orgD
ownloaded from
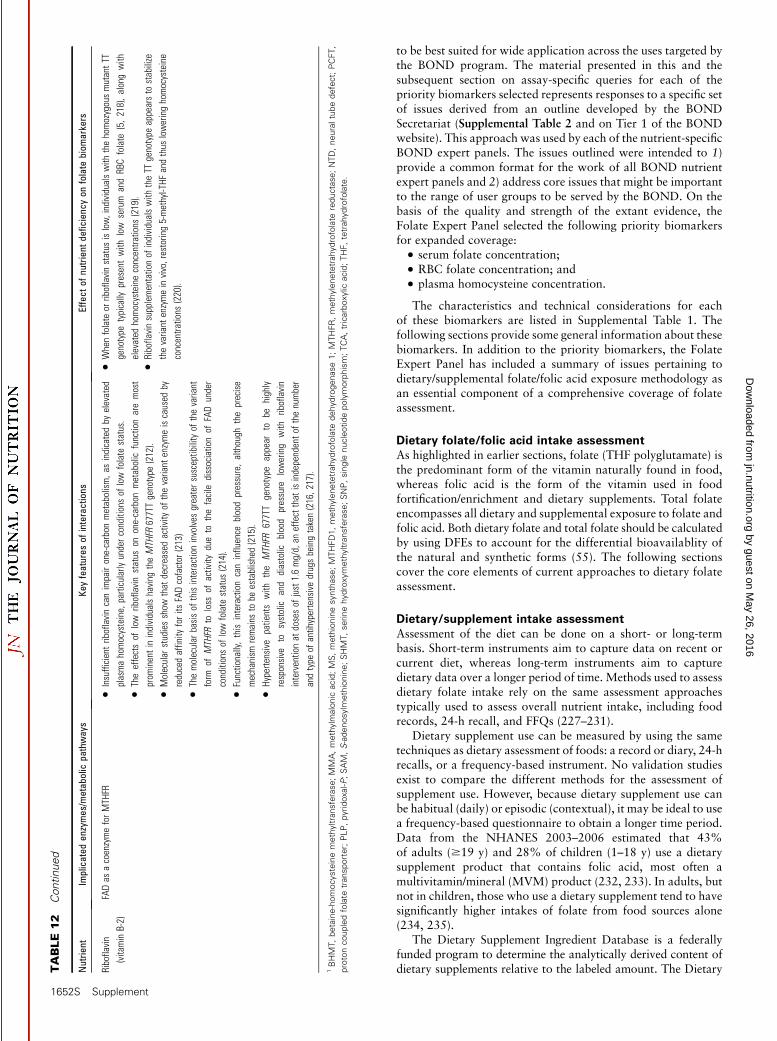
to be best suited for wide application across the uses targeted bythe BOND program. The material presented in this and thesubsequent section on assay-specific queries for each of thepriority biomarkers selected represents responses to a specific setof issues derived from an outline developed by the BONDSecretariat (Supplemental Table 2 and on Tier 1 of the BONDwebsite). This approach was used by each of the nutrient-specificBOND expert panels. The issues outlined were intended to 1)provide a common format for the work of all BOND nutrientexpert panels and 2) address core issues that might be importantto the range of user groups to be served by the BOND. On thebasis of the quality and strength of the extant evidence, theFolate Expert Panel selected the following priority biomarkersfor expanded coverage:
· serum folate concentration;
· RBC folate concentration; and
· plasma homocysteine concentration.
The characteristics and technical considerations for eachof these biomarkers are listed in Supplemental Table 1. Thefollowing sections provide some general information about thesebiomarkers. In addition to the priority biomarkers, the FolateExpert Panel has included a summary of issues pertaining todietary/supplemental folate/folic acid exposure methodology asan essential component of a comprehensive coverage of folateassessment.
Dietary folate/folic acid intake assessmentAs highlighted in earlier sections, folate (THF polyglutamate) isthe predominant form of the vitamin naturally found in food,whereas folic acid is the form of the vitamin used in foodfortification/enrichment and dietary supplements. Total folateencompasses all dietary and supplemental exposure to folate andfolic acid. Both dietary folate and total folate should be calculatedby using DFEs to account for the differential bioavailablity ofthe natural and synthetic forms (55). The following sectionscover the core elements of current approaches to dietary folateassessment.
Dietary/supplement intake assessmentAssessment of the diet can be done on a short- or long-termbasis. Short-term instruments aim to capture data on recent orcurrent diet, whereas long-term instruments aim to capturedietary data over a longer period of time. Methods used to assessdietary folate intake rely on the same assessment approachestypically used to assess overall nutrient intake, including foodrecords, 24-h recall, and FFQs (227–231).
Dietary supplement use can be measured by using the sametechniques as dietary assessment of foods: a record or diary, 24-hrecalls, or a frequency-based instrument. No validation studiesexist to compare the different methods for the assessment ofsupplement use. However, because dietary supplement use canbe habitual (daily) or episodic (contextual), it may be ideal to usea frequency-based questionnaire to obtain a longer time period.Data from the NHANES 2003–2006 estimated that 43%of adults ($19 y) and 28% of children (1–18 y) use a dietarysupplement product that contains folic acid, most often amultivitamin/mineral (MVM) product (232, 233). In adults, butnot in children, those who use a dietary supplement tend to havesignificantly higher intakes of folate from food sources alone(234, 235).
The Dietary Supplement Ingredient Database is a federallyfunded program to determine the analytically derived content ofdietary supplements relative to the labeled amount. The DietaryT
ABLE
12
Continued
Nutrie
ntImplicated
enzymes/metabolic
pathways
Keyfeatures
ofinteractions
Effect
ofnutrient
deficiencyon
folate
biom
arkers
Riboflavin
(vitaminB-2)
FADas
acoenzymeforMTHFR
·Insufficient
riboflavincanimpairone-carbon
metabolism,a
sindicatedby
elevated
plasmahomocysteine,particularly
underconditionsof
lowfolate
status.
·When
folate
orriboflavinstatus
islow,individualswith
thehomozygousmutantT
T
genotype
typically
presentwith
low
serum
andRBCfolate
(5,218),alongwith
elevated
homocysteineconcentra
tions
(219).
·Theeffectsof
low
riboflavinstatus
onone-carbon
metabolic
functionaremost
prom
inentinindividualshaving
theMTHFR
677TTgenotype
(212).
·Molecularstudiesshow
that
decreasedactivity
ofthevariant
enzymeiscaused
by
reducedaffinity
forits
FADcofactor
(213)
·Riboflavinsupplementationof
individualswith
theTT
genotype
appearsto
stabilize
thevariant
enzymeinvivo,restoring5-methyl-THF
andthus
loweringhomocysteine
concentra
tions
(220).
·Themolecular
basisof
thisinteractioninvolves
greatersusceptibilityof
thevariant
form
ofMTHFR
toloss
ofactivity
dueto
thefacile
dissociationof
FADunder
conditionsof
lowfolate
status
(214).
·Functionally,this
interactioncaninfluence
bloodpressure,although
theprecise
mechanism
remains
tobe
established(215).
·Hyperte
nsive
patientswith
the
MTHFR
677TT
genotype
appear
tobe
highly
responsive
tosystolic
and
diastolic
blood
pressure
lowering
with
riboflavin
interventionat
dosesof
just1.6mg/d,an
effectthat
isindependentof
thenumber
andtype
ofantihypertensivedrugsbeingtaken(216,217).
1BHMT,betaine-homocysteinemethyltransferase;MMA,methylm
alonic
acid;MS,methioninesynthase;MTHFD1,methylenetetrahydrofolate
dehydrogenase1;MTHFR,methylenetetrahydrofolate
reductase
;NTD,neuraltubedefect;PCFT,
protoncoupledfolate
transporter;PLP,pyridoxal-P;SAM,S-adenosylm
ethionine;SHMT,serinehydroxymethyltransferase;SNP,single
nucleotidepolymorphism;TCA,tricarboxylic
acid;THF,tetrahydrofolate.
1652S Supplement
by guest on May 26, 2016
jn.nutrition.orgD
ownloaded from

Supplement Ingredient Database uses a complex sampling pro-gram to ensure that products represent the US market forproducts. The folic acid content in children�s and adults� MVMproducts was determined by using an MBA with the NationalInstitute of Standards and Technology (NIST) standard referencematerial (SRM) 3280 to evaluate product content for folic acid.For both children ($4 y) and adults, the most common label doseof folic acid in an MVM product is 400 mg, and the measuredcontent was ;13% higher in the supplement than on the label.For products intended for children aged 1 to <4 y, the mostcommon labeled dose of folic acid was 200 mg and the actualcontent was ;16% higher in the supplement than on the label.
Usual dietary and total intakes. Dietary recommendations areintended to be met over time (236). Many procedures have beendescribed to adjust the dietary estimates from 24-h recalls toreduce within-person variation to produce usual intakes (237–241). To produce total usual intakes, it is recommended to firstadjust the dietary folate estimates by using one of these methodsand then add the daily estimate of folic acid from dietarysupplements to the usual dietary intakes (242).
Food-composition tables. The most current national databasefor the folate/folic acid content of foods is the USDA NationalNutrient Database for Standard Reference, release 25. TheStandard Reference values are the basis for USDA Food andNutrient Database for Dietary Studies values. The NationalFood and Nutrient Analysis Program is a federally fundedresearch program to enhance the analytical estimates of thenutrient content of foods and dietary supplements. The folatecontent of foods is determined by a tri-enzyme microbiologicalprocedure (243), which is appropriate for the estimation of totalfolate content, not the specific forms. To determine the amountof folic acid added to foods, an additional microbiologicalprocedure without enzymes is used to estimate the amount ofadded folic acid; food folate then is assumed to be the remainderafter the folic acid contribution is subtracted from the total(243). The DFE is then calculated by multiplying the amount offolic acid by 1.7 and adding that to the value for food folate.There are 7042 foods with values for total folate and 6381 foodswith values for DFEs present in the Standard Release 25.
Measuring the folate/folic acid content in foods. Estimatesof dietary intakes rely on the accuracy of the food-composition
databases. Estimates of the folate and folic acid content of foodscan be determined by MBAs and by LC . The MBAwith enzymeextraction is unable to differentiate among the various forms offolate in foods. The LC techniques can differentiate among thefolate forms but have been reported to have difficulties measur-ing all folates [summarized in (244)]. The variability in resultsobtained for folate/folic acid in foods can be attributed toagricultural variability, heat processing, pH, food matrix,extraction procedure, failure to account for all or different folatevitamers, incubation time, and number of enzyme extractions(244, 245).
Priority folate biomarkersSerum folate concentration. The measurement of serumfolate is the earliest indicator of altered folate exposure andreflects recent dietary intake (i.e., short-term status) (9). How-ever, recurrent measures of serum folate in the same individualover time can reveal chronic folate deficiency. Serum folate ishighly responsive to intervention with folic acid, with naturalfood folates typically resulting in a poorer serum folate response.Likewise, population data show that irrespective of whetherthey are from regions with mandatory or voluntary fortification,serum folate concentrations are highly reflective of exposure tofolic acid, with the highest concentrations observed in personswho consume folic acid in both supplements and fortified foods(71, 246, 247).
RBC concentration. RBC folate is a sensitive indicator of long-term folate status, which represents the amount of folate thataccumulates in RBCs during erythropoiesis, thereby reflectingfolate status during the preceding 120 d (i.e., the half-life of RBCs)(248, 249). Moreover, RBC folate parallels liver concentrations(accounting for;50%of total body folate) and is thus consideredto reflect tissue folate stores (250). Similar to serum folate, RBCfolate is highly responsive to intervention with folic acid, withnatural food folates typically resulting in a poorer RBC folateresponse than folic acid at similar intervention amounts. Like-wise, population data show that RBC folate concentrations arehighly reflective of exposure to folic acid, with the highestconcentrations observed in persons who consume folic acid inboth supplements and fortified foods, in regions with mandatoryor voluntary-only fortification (71, 99, 247).
Plasma homocysteine concentration. The measurement ofplasma homocysteine provides a sensitive functional biomarkerof folate status. As described in detail in the section on FolateBiology and Homeostasis, folate-mediated one-carbon metabo-lism is a network of 3 interdependent biosynthetic pathwaysincluding the remethylation of homocysteine to methionine.When the status of folate is low or deficient, plasma homocys-teine is invariably found to be elevated. However, the folate-dependent remethylation of homocysteine to methionine iscatalyzed by the vitamin B-12–dependent enzyme MTR andinvolves a number of other nutritional cofactors. Thus, plasmahomocysteine is not a specific marker of folate status, because itwill also be elevated with other B-vitamin deficiencies, lifestylefactors, renal insufficiency, and drug treatments (179, 251). Inpopulation groups who consume folic acid–fortified foods orfolic acid supplements, homocysteine is considered to be a morereliable biomarker of vitamin B-12 than folate status (179).
Plasma homocysteine is inversely related to folate status(whether measured as serum or RBC folate). Plasma homocys-teine is also highly responsive to intervention with folate, aloneor in combination with the other methyl donors involved in
FIGURE 10 Transport of folic acid and 5-methyl-THF into tissues
and their metabolism to retainable polyglutamate forms. DHF,
dihydrofolate; DHFR, dihydrofolate reductase; FPGS, folylpolygluta-
mate synthase; MS, methionine synthase; MTHFR, methylenetetra-
hydrofolate reductase; PCFT, proton coupled folate transporter;
polyglu, polyglutamate; RFC, reduced folate carrier; THF, tetrahydro-
folate.
Biomarkers of nutrition for development—folate review 1653S
by guest on May 26, 2016
jn.nutrition.orgD
ownloaded from

TABLE
13
Relativestrengthsandweaknessesoffolate
biomarkers
1
Biomarkername
Populationgroups
Usefulnessforpurpose
Advantages
Disadvantages
Analytical
considerations
Serumfolate
Allindividuals
Measurementof
serum
folate
provides
informa-
tion
onthe
short-term
folate
status
ofthe
individual.
Serumfolate
istheearliestindicatorof
altered
folate
exposure,will
reflect
recent
dietary
intake,a
ndishighlyresponsive
tointerven-
tion.
Naturalfood
folatestypically
resultinapoorer
serumfolateresponse
than
does
folic
acidat
similarinterventionlevels.
Measurementofserum
folatecannotbe
done
in
thefieldandrequiresat
minimum
amidlevel
laboratory
infra
structurewith
uninterru
pted
electricalpow
er.
Theinconsistent
useof
cutoffvalues
over
time
toassess
theproportionof
thepopulation
with
lowserumfolateconcentra
tions
hasled
toconfusion.
Methods
toassess
serum
folate
have
notyet
reachedthepointwhere
they
producesuffi-
ciently
comparableresults
across
methods
or
laboratories.
Contrastingapproaches
toexpressing
dietary
folate
intakes
makes
any
evaluation
of
adequacy
ofdietaryfolate
intake
inrelation
tobiom
arkerstatus,o
rcomparison
offolate
recommendations
betweencountries,inher-
ently
complicated.
Folate
istheleaststable
oftheBvitamins;
carefulsamplehandlinganduseof
anti-
oxidants
arerequire
dto
maintainsample
integrity.
Populationdata
indicate
that
serum
folate
con-
centratio
nsarehighlyrefle
ctiveof
exposure
tofolic
acid,w
iththehighestconcentratio
ns
observed
inpersonswho
consum
efolic
acid
inboth
supplements
andfortified
foods.
Serum
folate
requiresless
processing
atthe
timeof
bloodcollectionvs.R
BCfolate.
Themeasurementof
folate
formscirculatingin
serummay
furth
erelucidatetheroleoffolate
vitamersrelativeto
various
health
outcom
es;
however,todate,nocutoffvalues
foreither
lowor
high
concentrations
ordesirableranges
have
been
identified.
Because
RBCs
contain
much
higher
folate
concentra
tions
than
serum,thepresence
of
hemolysis
will
inflate
serum
folate
values,
regardless
oftechniqueused
formeasure-
ment.
Fastingbloodsamples
arerecommendedwhen
usingserumfolate
toassess
folate
status.
RBCfolate
Allindividuals
RBCfolate
isasensitive
indicatorof
long-te
rm
folate
status.
RBCfolate
ishighly
corre
latedwith
habitual
folate
intake
whenthelatte
risexpressedas
DFEs.
Naturalfood
folatestypically
resultinapoorer
RBCfolate
response
than
does
folic
acid
at
similarinterventionlevels.Ifthe
DFEconver-
sion
isnotm
ade,therelationbetweenfolate
intake
andstatus
isweak.
Measurementof
RBCfolate
cannot
bedone
in
thefieldandrequiresat
minimum
amidlevel
laboratory
infra
structurewith
uninterru
pted
electricalpow
er.
RBCfolate
represents
theam
ount
offolate
that
accumulates
inbloodcells
duringerythropoiesis
andreflectsfolate
status
duringthepreceding
120d,i.e.,thehalf-lifeof
RBCs.
Contrastingapproaches
toexpressing
dietary
folate
intakes
makes
any
evaluation
of
adequacy
ofdietaryfolate
intake
inrelation
tobiom
arkerstatus,o
rcomparison
offolate
recommendations
betweencountries,inher-
ently
complicated.
Asforserum
folate,methods
toassess
RBC
folate
have
notyetreachedthepointwhere
they
producesufficiently
comparableresults
across
methods
orlaboratories.Thecompa-
rabilityof
RBCfolate
methods
isworse
than
that
ofserumfolate
methods.
RBCfolate
parallelsliver
concentra
tions
(account-
ingfor;50%
oftotalbodyfolate)and
isthus
considered
toreflecttissuefolate
stores.
Themeasurementof
folate
formspresentin
RBCs
may
furth
erelucidatetheroleof
folate
vitamersrelativeto
various
health
outcom
es;
however,todate,nocutoffvalues
foreither
low
orhigh
concentra
tions
ordesirable
ranges
have
been
identified.
Themeasurementof
RBCfolate
iseven
more
complex
than
thatofserumfolate,because
of
the
need
toconvert
polyglutam
ates
to
monoglutamates
before
analysis.
Populationdata
indicate
that
RBCfolate
concen-
trations
arehighlyreflectiveofexposuretofolic
acid,w
iththehighestconcentrations
inpersons
who
consum
efolic
acid
inboth
supplements
andfortifiedfoods.
(Continued)
1654S Supplement
by guest on May 26, 2016
jn.nutrition.orgD
ownloaded from

one-carbon metabolism: vitamins B-12, B-6, and B-2 (riboflavin)and betaine (or choline). Plasma homocysteine responds within3–4 wk of folate depletion (increases) and subsequent repletion(declines) in healthy subjects (251). The fast response probablyreflects that methyl groups for homocysteine remethylation aredependent on ‘‘small’’ folate pool(s) with a fast turnover rate (186).
Other biomarkers—general descriptionsAlthough the focus of this section is on a detailed coverage of thekey issues specific to the priority biomarkers selected, the FolateExpert Panel concluded that it would be useful to provide briefsummaries of those biomarkers that, although not chosen aspriorities for immediate widespread use, nevertheless offer either1) some utility under defined circumstances or 2) potential foreventual widespread application.
Serum folic acid. As discussed in earlier sections, unmetabo-lized folic acid in serum or plasma may be considered as abiomarker of exposure, status, function, and/or effect. Theappearance and quantity of unmetabolized folic acid in circu-lation have been associated with folic acid exposure via fortifiedfoods, dietary supplements, and a combination of both (7, 252,253). Greater concentrations of unmetabolized folic acid areassociated with higher serum folate concentrations (7, 254),suggesting that the amount of folic acid in blood is related towhole-body folate status. However, there is large variation infolic acid concentrations and the dose response relation betweenfolic acid exposure and unmetabolized folic acid in circulation isnot entirely clear. Any effect of unmetabolized folic acid in bloodon cellular function and/or health remains to be elucidated.
Urinary folate/folic acid. Although not commonly used, inresearch settings 24-h urinary folate excretion in combinationwith serum or RBC folate can provide unique information aboutfolate status and metabolism. Twenty-four-hour urinary folateexcretion captures the rise and fall of circulating folate concen-trations in response to feeding and fasting and thus may beconsidered an indicator of ‘‘average’’ folate exposure and statusover that 24-h period (95). Although responsive to folate intake(255, 256), urinary folate excretion exhibits a large degreeof inter- and intraindividual variability (257). Because of thisvariability and because little intact folate is excreted at doses upto the RDA, urinary folate would not be a sensitive biomarkerfor folate intake or status.
Urinary and serum para-aminobenzoylglutamate and
para-acetamidobenzoylglutamate. The oxidative folatecatabolites para-aminobenzoylglutamate (pABG) and para-acetamidobenzoylglutamate (apABG) are biomarkers of folatestatus and turnover. Although pABG and apABG are found inblood, urinary pABG and apABG are studied most often.Urinary pABG and apABG reflect turnover in endogenous folatepools (258). Total urinary catabolite excretion is positivelycorrelated with serum total folate, RBC folate, and folateintake (259); however, it is not as sensitive to folate intake asurinary folate excretion (260), serum folate (261), and plasmahomocysteine (261).
Genomic biomarkers of folate status. The following genomicbiomarkers for folate status are used exclusively in researchsettings and are associated with problems due to lack of specificity,equivocal results, and methodologic challenges.
DNA cytosine methylation. Folate plays an important rolein DNA metabolism because it is required as a methyl donor forT
ABLE
13
Continued
Biomarkername
Populationgroups
Usefulnessforpurpose
Advantages
Disadvantages
Analytical
considerations
Hcy
Allindividuals
Measurementof
plasmaHcyprovides
asensitive
functionalbiomarkerof
folate
status.
Whenfolate
status
islow
ordeficient,p
lasm
a
Hcyisinvariablyfoundto
beelevated.
The
remethylation
ofHcy
tomethionine
is
catalyzed
bythe
vitamin
B-12–dependent
enzymeMTR
andinvolves
anumbero
fother
nutritionalcofactors.Thus,plasmaHcyisnot
aspecificmarkero
ffolatestatus.Itw
illalso
beelevated
with
otherB-vitamindeficiencies,
lifestylefactors,renalinsufficiency,anddrug
treatments.
Requiresspecialized
laboratory
equipm
entand
trained
technicians.
PlasmaHcyishighlyresponsive
tointervention
with
folate,alone
orincontributionwith
the
othermethyldonors
involved
inone-carbon
metabolism:vitamin
B-12,vitamin
B-6,
vita-
minB-2,andbetaine(orcholine).
Inpopulationgroups
who
consum
efolic
acid–
fortifiedfoodsor
folic
acidsupplements,H
cy
isconsidered
amorereliablebiom
arkerof
vitaminB-12
status
than
folate
status.
MeasurementofH
cyproduces
fairlycomparable
results
across
diffe
rent
methodtypes
PlasmaHcyresponds
within
3–4wkof
folate
depletion(increases)
andsubsequent
reple-
tion(declines)inhealthysubjects.
PlasmaHcyisavery
stableanalyteas
long
as
theplasmaisseparatedfro
mtheRBCs
within
1hof
bloodcollection(orw
ithin,8hifthe
wholebloodiskept
onice)(179).
1DFE,dietary
folate
equivalent;Hcy,totalhomocysteine;MTR,methioninesynthase.
Biomarkers of nutrition for development—folate review 1655S
by guest on May 26, 2016
jn.nutrition.orgD
ownloaded from

the synthesis of methionine and SAM and for the synthesis ofphosphorylated nucleotides such as deoxythymidine triphos-phate (dTTP) (262). SAM is required as a methyl donor for themaintenance or induction of cytosine methylation, which isessential for silencing of genes or structural integrity of specificregions of the chromosomes (131, 263). When SAM is depletedand/or the enzyme DNA methyltransferase is defective, itbecomes increasingly probable that the maintenance of DNAmethylation is compromised, leading to hypomethylation ofcytosine and structural changes in chromatin (264). Somestudies suggest that global DNA methylation status is reducedwhen folate is deficient and plasma homocysteine is elevated(265–272). However, folate depletion-repletion studies haveproduced differing results with regard to DNA methylation(273–276).
Uracil misincorporation into DNA. Uracil content in DNAhas been explored as a biomarker of folate deficiency. dTTPsynthesis requires adequate amounts of 5,10-methylene-THF todonate methyl groups to deoxyuridine monophosphate (deox-yuridylate; dUMP). If 5,10-methylene-THF is limiting as asubstrate of thymidylate synthase (TYMS) and/or TYMS isdefective, dUMP accumulates, the deoxyuridine triphosphate(dUTP):dTTP ratio increases, and it becomes more probable thaturacil is incorporated into DNA instead of thymidine duringDNA synthesis (131, 262). The conversion of dUMP to dTTP isentirely dependent on one-carbon donation by 5,10-methylene-THF. In contrast, methylation of CpG is dependent on the supplyof SAM and its precursor methionine, the synthesis of which isinfluenced not only by folate but also by the availability ofcholine and methionine (131, 262). Therefore, uracil accu-mulation into DNA may be more specific than DNA cytosinemethylation as a potential genomic biomarker of folatestatus.
Micronuclei. Excessive uracil incorporation into DNA andhypomethylation of pericentromeric DNA can lead to laggingchromosomes or chromosome fragments that form micronuclei(14, 131, 132, 277). Micronuclei have the same morphologicfeatures as normal nuclei with the exception that they are muchsmaller, usually one-third to one-sixteenth in diameter. Cross-sectional studies have shown that micronuclei in lymphocytes orin erythrocytes are inversely associated with dietary folate intakeand/or RBC folate and positively with plasma homocysteine(132, 278–285). Four intervention studies (284–287) reportedon the effect of folic acid supplementation on micronuclei inlymphocytes, 3 of which showed a significant reduction inmicronuclei frequency.
Because micronuclei frequency is also associated with intakesof other vitamins and minerals (279, 282) and exposure tolifestyle or environmental genotoxins (288, 289), it is not specificto folate status and therefore cannot be used on its own as anindicator of folate deficiency. It is, however, very sensitive tofolate deficiency within the physiologic range and in combina-tion with uracil and DNA methylation measurements has thepotential to provide a reliable assessment of genome pathologyresulting from inadequate folate. It is also important to note thatit is now possible to score micronuclei automatically and reliablyby using a wide range of image cytometry platforms (290, 291),making this technique amenable to mass screening.
Assay-Specific Queries
The previous section covered the physiologic aspects of eachbiomarker reviewed by the Folate Expert Panel. This section is
focused principally on the priority biomarkers and in particularincludes the following:
· an overview of the analytical methods;
· tools used to ensure the quality of the biomarker measure-ment; and
· a coverage of preanalytical considerations relevant to samplecollection, processing, and storage.
Because the technical issues for serum and RBC folate aregenerally similar, these 2 biomarkers are presented together,pointing out differences where appropriate. Information onplasma homocysteine is presented separately.
Measurement of serum and RBC folateIntroduction. The essentials of folate as pertains to its mea-surement in serum/RBCs are outlined in Table 14. Folates aresusceptible to interconversions and oxidative degradation(Figure 11) (295, 296), and their oxidation and breakdownproducts can also be found in serum. Some of these products nolonger exhibit folate activity, yet one needs to ensure that they donot interfere with the measurement of folate vitamers. Under-standing folate interconversions and degradations helps to betterunderstand what different methods measure.
· 5-Methyl-THF is relatively stable at different pH values,with and without heat treatment, but it can undergomild reversible oxidation to 5-methyl-5,6-dihydrofolate (5-methyl-5,6-DHF). This compound undergoes spontaneouscleavage of the C9-N10 bond in acidic solution (297). Underprolonged or severe oxidative conditions, 5-methyl-THF or5-methyl-5,6-DHF can convert to 4a-hydroxy-5-methyl-THF, an intermediate product also called 4a-hydroxy-5-methyltetrahydrofolate (hmTHF) (298). In the absence of areducing agent, hmTHF undergoes structural rearrange-ment to form a pyrazino-s-triazine derivative, which is nolonger biologically active (299). This stable oxidationproduct of 5-methyl-THF is also known as pyrazino-s-triazine derivative of hmTHF (MeFox) (293, 300).
· Under heat and/or low pH conditions, THF can oxidize tofolic acid via the highly unstable DHF intermediate. Assaysmeasuring unmetabolized folic acid in serum should there-fore verify that this compound is not an artifactual result ofTHF oxidation due to analytical steps. THF and DHF canalso degrade to the biologically inactive catabolite pABG(301).
· There is a pH-driven equilibrium between 3 majorformyl-folate vitamers: 10-formyl-THF is present atneutral and alkaline pH, folinic acid (5-formyl-THF) atslightly acidic pH, and 5,10-methenyl-THF at acidic pH.Heat accelerates the conversion of 10-formyl-THF to5-formyl-THF at slightly acidic pH. Both 5-formyl-THFand 10-formyl-THF cyclize to 5,10-methenyl-THF atacidic pH. If the pH changes from acidic to slightly acidicor neutral, the equilibrium is pushed toward 10-formyl-THF (302).
· 10-Formyl-THF is readily oxidized to 10-formyl-folic acid(via 10-formyl-DHF), a stable form of the vitamin that wasshown to exhibit folate activity (303).
· 5,10-methylene-THF is only stable at pH 10 and disso-ciates to formaldehyde and THF at physiologic pH values.On the other hand, heating samples in ascorbate-containingbuffers in the absence of other reducing agent can alsocause THF conversion to 5,10-methylene-THF via for-maldehyde generated by the breakdown of ascorbate(295).
1656S Supplement
by guest on May 26, 2016
jn.nutrition.orgD
ownloaded from

Analytical methods. Over the past 50 y, methods to assessserum and RBC folate concentrations have been continuouslyimproved; however, they have not yet reached the point wherethey produce sufficiently comparable results across methodsor laboratories. A comprehensive review article of analyticalapproaches and related issues (9) and 2 articles discussing issuespertaining to folate measurements in NHANES (4, 304) provide awealth of information on this topic. Table 15 is a summary of the3 main method types and their advantages and disadvantages.
MBAs. Historically considered the ‘‘gold standard’’ mea-surement procedure for serum and RBC total folate becauseit ‘‘fully measures the multiple forms of folate species thatexhibit folate vitamin activity and does not measure folatespecies that lack vitamin activity’’ (304), the underlying principleof the MBA is that a folate-dependent microorganism, namelyLactobacillus rhamnosus (formerly called Lactobacillus casei),grows proportionally to the amount of folate present in serum orwhole blood and that the folate concentration can be quantifiedby measuring the turbidity of the inoculated medium after anearly 2-d incubation at 37�C. Some of the key advantages anddisadvantages are itemized in Table 15. However, a few pointsare worth highlighting. The MBA has received renewed interestduring the past decade because of improvements in efficiencyand robustness, so that the assay can be reliably used in a high-throughput routine setting such as NHANES (305, 306).Important improvements introduced in the 1970s and 1980sincluded the development of a chloramphenicol-resistant strainof L. rhamnosus (307), the ability to cryopreserve the inocu-lum (308), and the introduction of automated microtiter platetechnology (309).
As a result, the need for sterilization or aseptic addition waseliminated, growth curves could be reproduced with muchhigher precision for hundreds of assays, and the assay wasminiaturized by using disposable labware such as 96-well plates.Since then, 2 ‘‘variants’’ of the MBA have been adopted: 1)continued use of the wild-type organism (American TypeCulture Collection 7469), but incorporation of the 96-wellplate technology and cryopreservation, and 2) use of thechloramphenicol-resistant organism [American Type CultureCollection 27773 or National Collection of Industrial and
Marine Bacteria (NCIMB) 10463] as well as incorporation ofthe 96-well plate technology and cryopreservation (310–312). Arecent method comparison showed less than optimum correla-tion between these 2 ‘‘variants’’ (serum: r ;0.8; whole blood:r ;0.7) but very good correlation between 2 laboratories usingthe chloramphenicol-resistant organism (serum and whole blood:r > 0.9) (305).
The sensitivity of the MBA is a particular advantage whenonly small-sample volume is available, such as for samplescollected from a fingerstick or as a dried blood spot (DBS).To date, no other folate assessment method has been appliedsuccessfully to DBS. The MBA method for DBS developed byO�Broin et al. (313, 314) and implemented at the CDC (315) is asuitable tool to assess folate status in a population when novenous sample can be collected (9). Despite the limitationsoutlined in Table 15, based on data from thousands of samplesfrom NHANES, CDC analysts reported <1% of samplesexhibited a pattern of interference due to the potential presenceof antibiotics or antifolates (9). Some of the key factors that helpto successfully perform the MBA are outlined in Table 16.
Protein-binding assays. Protein-binding assays (PBAs)were developed with the clinical laboratory in mind, to enablethe diagnosis of folate deficiency. These assays use the highlyspecific FBP (mainly from milk or milk fractions, sometimesfrom porcine plasma or kidney) to ‘‘extract’’ folate from thesample. The strengths and weaknesses of PBAs are outlined inTable 15 and were recently reviewed by Pfeiffer et al. (9). A fewkey issues are highlighted below.
· PBA specificity comes with its own problems (9, 316),including that the various folate forms have differentaffinities to FBP (317) and slight deviations from theoptimal pH of 9.3 (where folic acid and 5-methyl-THFshow equivalent binding affinity to FBP) or in the proteincontent of the sample can lead to inaccurate measurements.
· PBAs are not sensitive to antibiotics, but they are influencedby certain antifolates such as methotrexate.
· If a person has consumed a diastereoisomeric supplement[e.g., (6R,S)-5-methyl-THF], the 6R form will readily bindto the FBP and the assay will give a spurious result (as willchromatographic assays because they also cannot distin-guish between diastereoisomers).
· Folate polyglutamates generally exhibit a higher responsethan do monoglutamates, requiring a complete deconjuga-tion of RBC folates (317). The conditions for the deconjugationstep vary across assays and the preparation of whole-bloodhemolysates needs to be performed off-line, potentially con-tributing to the larger assay differences noted for RBC folatethan for serum folate (9).
· Additional shortcomings of PBAs are related to their limiteddynamic range:
o Potential problems with inaccurate dilution linearity, partic-ularly if dilutions are not conducted in sample matrix.
o Need to dilute and reanalyze a high percentage of samplesfrom populations who are exposed to folic acid fortification,if the purpose of the analysis is to describe the distributionof folate concentrations.
·Other characteristics of PBAs include the following:o Different types of analyte binding: competitive (i.e., the
sample and the labeled folate conjugate are mixed before theintroduction of a limited amount of FBP, ensuring compe-tition for the binding sites) or noncompetitive (i.e., an excesscapacity of FBP is incubated with the sample before theaddition of the labeled folate conjugate).
TABLE 14 Folate essentials1
· Serum folate represents the sum of several folate vitamers circulating in the blood
stream, often referred to as ``total folate. ``
o The analysis of these compounds is complicated by their appearance as
pteroylmonoglutamates with variations in the oxidation state of the pteridine
moiety and in the one-carbon substituent group at the N-5 and/or N-10
positions.
o The main circulating folate vitamer is 5-methyl-THF (292),
o Unmetabolized folic acid can be present in varying concentrations (7).
o Reduced folate vitamers such as THF and formyl-folates (5- or 10-formyl-THF,
sometimes 5,10-methenyl-THF) may also be present, albeit in very small
concentrations (293, 294).
· RBC folate
o RBCs contain much higher folate concentrations than serum.
o 5-Methyl-THF polyglutamates are the main folate forms (292).
o In persons with the MTHFR 677 C.T polymorphism, a portion of the 5-methyl-
THF polyglutamates is replaced by formyl-folates (6).
o The measurement of RBC folate is even more complex than that of serum
folate, because of the need to convert polyglutamates to monoglutamates
before analysis.
1 MTHFR, methylenetetrahydrofolate reductase; THF, tetrahydrofolate.
Biomarkers of nutrition for development—folate review 1657S
by guest on May 26, 2016
jn.nutrition.orgD
ownloaded from

o Different types of sample preparation: heterogeneous (i.e.,excess unbound analyte or excess reaction components haveto be removed, requiring that either the FBP or the folateconjugate be immobilized to a solid support) or homoge-neous (i.e., no separation step is required).
Most current PBAs are competitive and heterogeneous.Generally, a pretreatment step on the instrument with alkalinereagent and antioxidant ensures the release of folate fromendogenous FBP and its stabilization to prevent oxidation.
Chromatography-based assays. Chromatography-basedmethods provide information on individual folate forms and arebased on either measurement of intact folates via HPLC ormeasurement of folate breakdown products as an indicator fortotal folate via GC. General characteristics of these 2 approachesare listed in Table 17.
Over the past decade, tandemmass spectrometers have becomemore affordable and user-friendly and smaller in footprint, andtheir performance in terms of sensitivity and linear dynamic rangehas greatly improved. They are now considered to be the preferreddetectors for HPLC-based methods, at least for specializedlaboratories. General characteristics of LC-tandem mass spec-trometry (LC-MS/MS) are outlined in Table 18.
Assay calibration for chromatographic assays. Ensuringaccurate calibration is a big task for chromatography-basedmethods, partially due to the number of folate forms, but alsobecause of their instability. General recommendations and detailedprocedures for the preparation and handling of folate standardsare described elsewhere (9, 254). Fazili and Pfeiffer (293) recentlyreported that high-concentration stock solutions of 5-methyl-THF(100 mg/L) were stable for up to 9 y if stored at –70�C in thepresence of 1% ascorbic acid. However, mixed working calibra-tors have to be prepared freshly from frozen individual folate stocksolutions for each analytical run and discarded after use.
Key principles in sample extraction and preparation for
chromotographic assays. Chromatography-based analyticalmethods require sample extraction and cleanup, and somemethods also use a sample concentration step to enable detectionof minor folate forms. Pfeiffer et al. (9) provided a detailed tablethat summarizes features of LC-MS/MS methods used tomeasure serum and RBC folates. Most newer methods perform
sample cleanup by use of solid-phase extraction (SPE) as anefficient way that can be easily automated for high throughput.Newer generation 96-probe SPE instruments allow fast samplecleanup (<1 h) with excellent folate recovery (300). Generally,reversed-phase cartridges are used in the SPE step, but stronganion-exchange cartridges have also been used. Because thelatter require elution buffers with high salt content that cancause ion suppression and negatively influence analyte sensitiv-ity, they are less favored by MS-based methods. Solid-phaseaffinity chromatography using FBP has also been used forsample cleanup by some methods. It has been shown that aslong as the pH of the sample is low enough (<3.5) to preventrebinding of 5-methyl-THF to the native proteins in the sample,the SPE step is sufficient, alleviating the need for a manualprotein precipitation step (321). Yet, some investigators prefer touse heat, acid, or an organic solvent to precipitate proteins fromeither serum or whole blood. Regardless, internal standardsshould be added at the earliest possible time to account forprocedural losses, and antioxidants have to be added toextraction buffers and reagents to protect labile reduced folates.
The extraction of folate polyglutamates from whole blood iscomplex and requires the hemolysis of erythrocytes (typicallyby diluting whole blood with ascorbic acid) as well as thedeconjugation of polyglutamates to monoglutamates (typicallythrough the action of the endogenous plasma conjugase at aslightly acidic pH and incubation at 37�C). Research is stillongoing to optimize conditions such that the LC-MS/MSmethodgenerates whole-blood total folate concentrations comparable tothe MBA or to explain why the MBA measures;20% higher (4).An alternative approach to the extraction of whole-blood folatesat an acidic pH is to inactivate the endogenous plasma conjugaseby heat in a high-pH borate buffer and to conduct in-line FBPaffinity chromatography and HPLC-electrochemical detectionanalysis at a neutral pH (320). Although this preserves the folatepolyglutamate pattern and prevents folate interconversions, itrequires the quantitation of a large number of folate compounds,some of which have no commercially available calibratormaterials. Furthermore, there are no appropriate internal stan-dards available for this procedure and it is presently not amenableto LC-MS/MS.
FIGURE 11 Folate interconversions
and degradation. DHF, dihydrofolate;
FA, folic acid; hmTHF, 4a-hydroxy-5-
methyltetrahydrofolate; MeFox, pyrazino-
s-triazine derivative of hmTHF; pABG,
para-aminobenzoylglutamate; THF, tetra-
hydrofolate. Adapted from reference 295
with permission.
1658S Supplement
by guest on May 26, 2016
jn.nutrition.orgD
ownloaded from

As mentioned earlier, folates are susceptible to oxidativedegradation during preanalytical sample handling and storageprocesses. Two recent LC-MS/MS methods showed that anoxidation product of 5-methyl-THF known as MeFox is presentin serum at low concentrations and can interfere with thequantitation of 5-formyl-THF because it is an isobaric com-pound of 5-formyl-THF (293, 322). This shows that even thehighly specific LC-MS/MS methods are not immune frominterference problems.
Choice of method. The choice of method is contingent on thepurpose and setting. For example, the aim of clinical laborato-ries is to determine whether a patient is folate deficient. As aresult, clinical laboratories require inexpensive, automated, andhigh-throughput assays to be able to report results within a dayor less of receiving a sample. They prefer ready-to-use reagentsand supplies and generally do not have the technical staff todevelop, validate, improve, or troubleshoot assays. Therefore,for clinical settings, PBAs meet these criteria. However, asexemplified in the report by Raiten and Fisher (323), kit assayscan change over time as a result of manufacturer recalibration orreformulation and may not be a good choice for a public healthlaboratory that needs to monitor trends in folate concentrationdistributions in a population over time.
Public health laboratories require stable assays, preferablywhere the method performance can be verified and controlledin-house. Either the MBA or LC-MS/MS may be suitablemethods depending on the availability of resources (financialas well as staffing and instrumentation) and sample volume andwhether total folate only or information on individual folateforms is of interest. By contrast, advantages of the MBA assayfor low-resource settings include its relative low cost, its calibra-tion and long-term performance can be controlled in-house, and it
generates results that are generally in good agreement with higher-order LC-MS/MS methods. For the research setting, chromat-ographic assays that allow the determination of individualfolate forms may be of greatest interest, but depending on theresearch question, other analytical approaches may also beappropriate.
Serum/RBC cutoff values and interpretation of data. Themeasurement of total folate provides information on the folatestatus of the individual, either short-term through serum folateor long-term through RBC folate. The inconsistent use of cutoffvalues over time to assess the proportion of the population withlow blood folate concentrations has led to confusion. Somehistorical perspectives on the use of folate cutoffs are presentedin Table 19. What unifies the various folate cutoff values is thefact that most were derived from data generated with the MBA.What is less clear is how the older MBA methods compare totoday�s MBA.
Crider et al. (99) estimated that a reasonable cutoff foroptimal prevention of NTDs would be population RBC folateconcentrations of;1000 nmol/L, which is in agreement with theonly prospective study that has been conducted to date (100),which found that the prevalence of NTD in an Irish populationwas lowest when RBC folate concentrations were $906 nmol/L(400 mg/L) (100). The WHO has estimated that the RBC folateconcentration should be >400 mg/L (906 nmol/L) in women ofreproductive age to achieve the greatest NTD risk reduction(101).
The presence of unmetabolized folic acid in serum is a resultof folic acid intake from supplements or fortified foods in excessof ;200 mg/meal, which exceeds the capacity of the DHFRenzyme to reduce folic acid during intestinal absorption to thebioactive folate vitamer THF (328). The measurement of folate
TABLE 15 Main analytical method types used for the measurement of serum and RBC folate1
Method Advantages Disadvantages
MBA for total folate · Great sensitivity; small sample volume needed (;50 μL) · Manual assay; relatively laborious unless automated liquid
handling is introduced· Measures all biologically active forms approximately equally
· Lengthy assay; limited throughput (can only be performed 3 d/wk)· Inexpensive, simple instrumentation,
suited for low-resource settings · Precision is relatively low (need for replicates)
· In-house control of performance · Limited linear range (need multiple dilutions)
· Can be used with dried blood spot samples · Not standardized (use of different calibrators, microorganisms)
· Prone to contamination issues
· Inhibited by presence of antibiotics or antifolates
PBA for total folate · High sample throughput · Folate forms have different affinities to the folate binding protein
· Quick turnaround time to first result · Questionable accuracy when mixtures of folate are present
· Available in commercial kit form · Limited linear range
· Minimum operator involvement · Matrix effects when sample is diluted
· Good precision for some assays · No control over lot-to-lot variability or assay recalibration/
reformulation· Relatively low reagent cost
Chromatography-based MS/MS
assay for folate vitamers· Provides information on folate vitamers · Requires expensive instrumentation, experienced operator, fre-
quent technical service· Use of stable-isotope-labeled internal standards
compensates for procedural losses · Manual assay; relatively laborious unless automated liquid
handling is introduced· Highly selective and specific
· Complex sample extraction/cleanup· Good sensitivity
· Interconversions of folate forms need to be considered in the
interpretation of data· Good precision
· Conversion of erythrocyte polyglutamates to monoglutamates
needed for RBC folate
· In-house control of performance
· Summation of folate forms to total folate
1 MBA, microbiological assay; MS/MS, tandem mass spectrometry; PBA, protein-binding assay.
Biomarkers of nutrition for development—folate review 1659S
by guest on May 26, 2016
jn.nutrition.orgD
ownloaded from

TABLE
16
Keysto
optimizingperform
anceofMBAs1
Suggestion
Rationale
Comment
Useofaliquidhandlertodiluteand
dispense
samples
andreagents
Improves
assayprecision.
With
manualpipettingfour96-wellplatescanbe
handledby
anexperienced
analystinan
analyticalrunandthepipetting
stepstake
;3h.
Reducesmanuallabor
andincreasesefficiency.
Ifaliquidhandlerisused,the
analyticalruncanbe
increasedto
seven96-wellplates/dandthepipetting
stepsonlytake
halfthetim
e.Thisisimporta
ntbecausetheMBA
canonlybe
setup3d/wktoavoidreadingtheplates
ontheweekend.
Selectan
appropriate
calibrator
Because5-methyl-THF
constitutes
thelargestp
ortionof
totalfolateinboth
serumand
whole-blood
samples,itwas
recommendedto
usethisfolate
form
asacalibrator
(305).
Traditionally,
mostM
BAshave
used
folic
acidas
acalibratorforconveniencebecauseofthegreaterstabilityofthisfolate
form
comparedto
reducedfolates.
Theresponse
ofthechloramphenicol-re
sistantL.rhamnosushasrecentlybeen
show
nto
beslightlygreaterfor
5-methyl-THF
than
forfolicacid,resultinginlower
calculated
concentra
tions
by;20%
(9,305).Because5-methyl-THF
constitutes
thelargest
portion
oftotalfolateinbothserumandwhole-blood
samples,itw
asrecommended
tousethisfolate
form
asacalibrator(305).
Folic
acidisprobablypreferableforanovice
laboratoryuntil
itestablishesgood
proficiencywith
theassay.
Mostof
thesynthetic
5-methyl-THF
formscommerciallyavailableare6-R,Sdiastereoisomericmixtures.Becausein
vivo
vitaminactivity
ofTHFsandinvitro
coenzymaticactivity
areonlyobserved
with
the(6S)-THF
isom
ers,theMBA
willshow
50%
activity.
Handlecalibratorwith
greatcare
5-Methyl-THF
issensitive
tooxidation;
therefore,
stocksolutions
should
beprepared
with
greatcare
(use
ofantioxidants,purgingsolutions
with
nitro
gen).
Theconcentra
tionoftheprimarystocksolutionshouldbe
determined
spectro
photom
etrically,and
secondarystocksolutions
shouldbe
stored
insm
allsingle-usealiquotsat
270�C
(9).
Prepareready-to-use
reagents
Toreduce
daily
workload(e.g.,preparationof
additionalreagentsto
beaddedto
the
medium).
Intermediateready-to-use
reagentscanbe
prepared
andstored
at270�C
forupto6moandeasilyaddedtothemediumat
thetim
eof
preparation.
Toreduce
thechance
ofcontam
ination.
Generate
a``sensitive
``
Lactobacillus
rham
nosus
inoculum
Toensure
good
assaysensitivity(growth
response
peru
nitof
folate).
Measure
theturbidity
ofthecultureregularly
toidentifythelogphasegrow
th(usuallyat;20
h),stopthegrow
thatthat
point,andfre
ezemanyinoculum
aliquotsat
270�C
forsubsequent
sampleanalysis.
Create
each
new
inoculum
from
theoriginal
culture
(freeze-driedorganism
);however,avoidgeneratingmorethan
2
subsequent
inoculitoavoidpotentialchanges
intheorganism
.
Testthenewinoculum
before
usingitforsam
pleanalysis.U
seanegativecontrol(mediumwithoutthe
additionoffolate)
whenpreparingtheinoculum
toensure
that
noorganism
isgrow
ingintheabsenceof
folate.
Useappropriate
sampledilution
Therequiredsampledilutionfactorvarieswith
thefolateconcentra
tions
foundinserum
andwhole-blood
samples.
Samples
from
apopulationexposedto
folic
acid
fortificationrequire
higher
dilution(e.g.,1/100forserum,1/140for
hemolysate)than
samples
fromafolate-deficient
population(e.g.,1/20
forserum,1/40forhemolysate).
Adilutionlinearitytestover
arelativelywiderange(includinglower
andhigher
dilutionthan
typically
needed)shouldbe
carried
outperiodically
toverifythat
theassayrecovery(100
615%)and
precision(CV#15%)are
adequate.
Preventcontam
ination
Toensure
accurate
results
andminimize
timeto
troubleshootassayproblems.
Useseparate
areasforthepreparationof
calibratorstocksolutions
andfortheanalysisof
samples
orpreparationof
reagentsto
avoidcross-contam
ination.
Usedisposablesupplieswhenpossible.
Thoroughlycleandurablesuppliesanddedicate
theiruseto
thesamepurposeto
avoidcross-contam
ination.
Followpre-establishedsampleand
runQC
criteria
Toensure
objectivedata
review
.Ifan
assaycalls
for4replicates
(from
2diffe
rent
dilutions)tocalculatethefinal
folate
concentra
tionforeach
sample:
accept
results
ifn=4andCV
#15%
orifn=3andCV
#10%;rejectaresultifn#
2andrepeat
sample.
Toallow
forautomated
(rule-based)resultacceptance,rejection,
andrepeat
analysis
determination.
Iftheresultisoutsidethecalibrationrange,repeat
sampleat
higher
orlower
than
regulardilutions.
IfrunQC
isoutsideof
pre-establishedlim
its,repeatentirerun.
Conductregularcalibrationverifi-
cationandinstrumentchecks
Verifycalibrationaccuracy
ofpipette
sandautomaticliquidhandler.
Ensure
proper
wavelengthcalibrationof
themicroplatereader.
Monitortemperature
oftheincubator,refrigerator,andfre
ezer.
1MBA,microbiologicalassay;QC,qualitycontrol;THF,tetrahydrofolate
1660S Supplement
by guest on May 26, 2016
jn.nutrition.orgD
ownloaded from

forms circulating in serum or present in RBCs may furtherelucidate the functional role of folate vitamers relative to varioushealth outcomes; however, cutoff values for low or high concen-trations or desirable ranges have yet to be identified. In conclusion,irrespective of what cutoff values are used, an earlier expert paneltasked to assess the folate methodology used in the NHANES IIIcame to the still valid conclusion that ‘‘there is an inherentinadequacy in the reliance of single indices as sole determinants ofinadequate folate nutriture’’ (323).
Laboratory infrastructure. Because of the technical andcapacity requirements, measurements of serum and RBC folatecannot be conducted in the field. Table 20 outlines specific needsfor each of the methods described above for assessment ofserum/RBC folate.
Measurement of plasma total homocysteineIntroduction. Relevant information regarding homocysteine isitemized in Table 21.
Analytical methods. As described in detail by Ducros et al.(332) and Refsum et al. (179), various method types areavailable for homocysteine determination, from fully automatedcommercial kits (immunoassay or enzymatic method) to chro-matographic assays with MS detection, overall providing com-parable results and good assay performance. Table 22 presents asummary of the main method types and their advantages anddisadvantages.
All methods require the reduction of the disulfide bondsto allow measurement of homocysteine (sum of the variousdisulfide forms and the reduced homocysteine form). Thegeneral characteristics and some specific features of commonly
available methodologies for homocysteine assessment are out-lined in Table 23.
Choice of method. Because the measurement of homocysteineproduces fairly comparable results across different methodtypes, the choice of method is mainly dependent on theavailability of instrumentation and technical expertise. Thefollowing may help to inform this decision:
· The use of commercial kits (either immunoassay or enzy-matic assay) on a fully automated clinical analyzer willprovide the highest throughput and quickest turnaroundtime with the least effort; however, the relatively highreagent costs can make the measurements quite expensive,particularly for a large number of samples.
· If an HPLC system with fluorescence detector is available,setting up a manual assay may be the least expensiveapproach, particularly in settings with low labor costs.
· The disadvantage of the manual HPLC assay is the numberof samples that can be run, likely limited to 50–70 unknownsamples per analytical run.
· If a laboratory has access to an LC-MS/MS system and therequired technical know-how, homocysteine can be mea-sured in a high-throughput semiautomated manner, withquite low reagent costs.
· Because of the high initial cost, an LC-MS/MS systemis economical only if a large number of samples are mea-sured regularly.
· For the research setting, where other thiols besides homo-cysteine may be of interest, chromatographic assays are themethod of choice.
· Gas chromotography–mass spectrometry (GC-MS) orGC-tandem MS (GC-MS/MS) have also been used in high-throughput research settings, particularly when the deter-mination of both methylmalonic acid and methionine is ofinterest (343).
TABLE 17 General characteristics of chromatography-basedassays
HPLC-based methods
· Older methods were HPLC-based and used fairly inexpensive detectors, such as
UV, diode array, fluorescence, or electrochemical (295).
· Folates were separated mainly on RP stationary materials.
· To facilitate retention of negatively charged folates on RP columns, it was
common to use low pH (,4.0) mobile phases (phosphate buffer) with organic
modifiers (typically acetonitrile), so-called ion suppression chromatography (318).
· Due to the acidic mobile phase, this approach led to some folate interconversion
of formyl forms.
· Alternatively, folate forms were separated at a neutral pH after forming ion pairs
with cationic surfactants (e.g., tetrabutylammonium phosphate), so-called ion-pair
chromatography (319).
· However, ion-pairing reagents were generally not used with electrochemical
detection (320) and may negatively affect the robustness of the chromatography.
· Both isocratic (typically shorter run times) and gradient (more flexible in resolving
coeluting folate forms) elution methods were used.
· Aside from having limited specificity, these methods also suffered from the lack of
appropriate internal standards to correct for procedural losses (9).
GC-based methods
· Developed for whole-blood samples before the availability of HPLC coupled to
tandem MS (LC-MS/MS)
· Used acid hydrolysis to break folate to pABA and used stable-isotope-labeled
pABA as an internal standard for the MS detection.
· Required lengthy multistep preparation and were not widely used.
1 LC-MS/MS, liquid chromatography–tandem mass spectrometry; pABA, para-amino-
benzoic acid; RP, reversed-phase.
TABLE 18 General characteristics of LC-MS/MS1
· Aside from offering great sensitivity, selectivity, and specificity, LC-MS/MS can also
offer high throughput for routine measurements as long as the chromatographic
separation is rapid and the sample preparation is mostly automated.
· Sample preparation and automation can be facilitated by using UPLC, a technique
that is becoming more established, but requires specific instrumentation and
columns to withstand the higher pressure.
· UPLC columns are less rugged than ordinary HPLC columns, requiring more frequent
replacement.
· An important advantage of LC-MS/MS compared with HPLC with conventional
detection is that it can use stable-isotope-labeled internal standards that improve
the accuracy and precision of the method by
o behaving almost identically to the analyte of interest and
o correcting for procedural losses, sample-to-sample ionization variations, and
ion suppression issues (9).
· Isotope dilution LC-MS/MS is now considered a state-of-the-art technology and is
used by higher-order reference methods (4).
· Most recent LC-MS/MS methods have used ESI (a softer ionization form preferred
for folate analysis) and positive ion mode.
· To enhance sample evaporation and ionization, MS-based methods require a mobile
phase with high organic (acetonitrile or methanol) and low salt content.
· Acid modifiers (acetic or formic acid) are most often used for positive ion mode,
whereas volatile buffers (ammonium acetate or formate) are used for negative ion
mode.
1 ESI, electrospray ionization; LC-MS/MS, liquid chromatography–tandem mass
spectrometry; UPLC, ultra-high pressure liquid chromatography.
Biomarkers of nutrition for development—folate review 1661S
by guest on May 26, 2016
jn.nutrition.orgD
ownloaded from

· GC-based methods provide better precision, higher resolu-tion, and longer column life than do LC-based methods andare not subject to ion suppression issues, which can be aproblem in LC-MS/MS methods.
Interpretation of data. As discussed above, abnormal plasmahomocysteine concentrations are not specific for folate deficiency.They are found in persons whose folate and vitamin B-12, B-6,and or B-2 status is suboptimal (208, 344) and in persons withimpaired renal function regardless of their B-vitamin status (345).Although elevated plasma homocysteine concentrations areassociated with an increased risk of cardiovascular disease,clinical trials have shown that reducing homocysteine is notassociated with a decrease in recurrence of cardiovascular disease(346). Furthermore, a recent meta-analysis on overall results fromlarge unpublished data sets showed that lifelong moderatehomocysteine elevation had little or no effect on coronary heartdisease and that results from previously published studies mayreflect publication bias or methodologic problems (347). The2009 US National Academy of Clinical Biochemistry LaboratoryMedicine Practice Guidelines on ‘‘Emerging Biomarkers ofCardiovascular Disease and Stroke’’ categorized homocysteineconcentrations (mmol/L) derived from standardized assays asfollows: desirable, #10; intermediate (low to high), >10 to <15;high, $15 to <30; and very high, $30 (348).
Laboratory infrastructure. Measurements of homocysteinehave to be conducted in a laboratory with uninterruptedelectrical power supply for analytical instrumentation, freezers,refrigerators, and a water purification system for deionizedwater. Issues mentioned for folate PBAs, such as the need for acertified service engineer to handle repairs and more complexmaintenance, analyzers often operating on a closed-channelbasis, and calibrators and reagents typically being purchased in aready-to-use form, are also true for homocysteine immunoassaysor enzymatic assays. In general, immunoanalyzers are moreexpensive than basic clinical chemistry analyzers that canconduct colorimetric tests.
Most research laboratories have access to an HPLC systemand although a fluorescence detector is more expensive than astandard UVA detector, the cost is still much lower than for anymass spectrometer. An autosampler (preferably with a thermostat),
column oven, computer, and software are part of standard HPLCpackages. The protein precipitation step requires a centrifuge,whereas the derivatization reaction may require a heating block.Regardless of the method specifics, the laboratory needs to haveaccess to a number of basic instruments, such as a precisionbalance, pH meter, various adjustable air displacement pipettes,vortex mixer, stirring plate, and ideally a barcode scanner. The useof a liquid handler to automate the pipetting steps can greatlyincrease the throughput of the method; however, some steps stillhave to be handled manually by the operator (e.g., centrifugationstep, derivatization step). The laboratory has to purchase chem-icals and prepare calibrators, buffers, mobile phase, and otherreagents on a regular basis. Most of this is true for LC-MS/MS andGC-MS/MS assays, with the additional need for staff with relevanttechnical expertise, a good understanding of instrument softwareand hardware, and much more frequent access to a serviceengineer for repairs and maintenance than for HPLC and GCinstrumentation.
General principles in quality assessmentQuality assessment (QA) ensures that the laboratory results areaccurate and of highest quality and is designed to address thefollowing:
· avoidance of mistakes;
· consistency of performance;
· data integrity; and
· full staff participation in opportunities for training, which isneeded to achieve high-quality results.
The basic components of a QA system are listed in Table 24.Before the quality and consistency of a laboratory method
can be monitored, prospect methods must be validated (foraccuracy, precision, sensitivity, and ruggedness) and verifiedperiodically (verification of assay calibration, verification ofaccuracy of pipettes, instruments). For a more detailed descrip-tion of each QA system component, an example of a minimumQA system for a low-resource setting, and instructions on howto prepare, characterize, and use quality-control (QC) materials,the reader is referred to the Survey Toolkit for NutritionalAssessment, Laboratory and Field section, Quality Control andQuality Assurance subsection, developed by the CDC andhosted by the Micronutrient Initiative (349).
For convenience, some users prefer to purchase commercialQC materials. Unless one obtains the same batch of material, thispractice may not be advisable for use over longer periods of timebecause frequent lot changes may prevent an assessment of assayshifts. In-house preparation of large batches of QC pools has theadvantages of being more cost-efficient and being able to closelymonitor assay performance. It is advisable to prepare 2 (normaland abnormal) or 3 (low, medium, and high) levels of QC pools,characterize them over the course of 20 individual analytical runsto establish target values and assay-associated variability, andthen include them in every analytical run together with theunknown samples to judge whether the run is in control.
Although participation in proficiency testing programs isrequired to comply with certain laboratory certifications as wellas recommended for good laboratory practice to allow externalverification of results, the limitations of proficiency testingprograms should be recognized and include the following:
·Most proficiency testing programs use method means (so-called peer-group means) to evaluate laboratories, makingit difficult to identify methods with unsatisfactory perfor-mance or even monitor method shifts over time due to thelack of a stable reference point.
TABLE 19 Historical perspectives on folate cutoffs
· During the late 1960s, cutoff values for sequential stages of folate deficiency were
established through depletion/repletion experiments.
· A serum folate concentration ,7 nmol/L (3 μg/L) indicated negative folate balance
at the time the blood sample was drawn (324).
· For RBC folate, concentrations of
o ,363 nmol/L (160 μg/L) indicated the onset of folate depletion,
o ,272 nmol/L (120 μg/L) marked the beginning of folate-deficient erythropoi-
esis, and
o ,227 nmol/L (100 μg/L) marked folate-deficient anemia (324).
· More commonly, investigators used a single cutoff value of,317 nmol/L (140 μg/L)
for RBC folate to designate deficiency (325).
· More recently, cutoff values for folate deficiency (serum folate,10 nmol/L and RBC
folate ,340 nmol/L) were defined on the basis of a metabolic indicator (increased
plasma total homocysteine) (326). These cutoff values were derived from NHANES III
data generated with the Bio-Rad radioassay and have been recommended by the
2005 WHO Technical Consultation on folate and vitamin B-12 deficiencies for the
assessment of folate status of populations (327).
1662S Supplement
by guest on May 26, 2016
jn.nutrition.orgD
ownloaded from

· Proficiency testing samples are often modified (e.g., addingpreservatives or other additives, supplementing materialswith nonnative forms of analyte, using animal plasma oroutdated human plasma from blood banks), potentiallychanging their behavior in the assay compared with fresh-frozen samples. This may lead to commutability problemswith proficiency testing materials (350).
· As a result, information gained from the proficiency testingprogram may not be used to adjust assays.
Serum and RBC folate. To date, no formal standardizationprogram exists for folate measurements, which may explain whyconsiderable differences exist among laboratories and methods,particularly for RBC folate (9). A 2010 expert roundtableadvising on folate biomarkers and methods for future NHANESsurveys came to the conclusion that the close agreementobtained for serum folate results between the MBA andLC-MS/MS supported the introduction of the LC-MS/MSprocedure for future NHANES (4). This allows for the
measurement of individual folate vitamers, including unmetab-olized folic acid, and calculation of total folate by summation ofthe individual vitamers. However, because theMBA gave;25%higher concentrations than the LC-MS/MS procedure for RBCfolate, NHANES retained theMBA for the measurement of RBCfolate (4).
NIST has developed higher-order reference measurementprocedures mainly for the measurement of serum 5-methyl-THF; these methods compared well with the CDC�s LC-MS/MSmethod (351). Serum-based international reference materialsproduced by NIST (351) and the UK National Institute forBiological Standards and Control (352) have been available forseveral years; unfortunately, certified concentrations are pro-vided for 5-methyl-THF only. No whole-blood reference mate-rials are currently available with certified concentrations forany folate form or total folate. Table 25 provides additionalinformation on currently available reference materials andgives a selected list of proficiency testing programs for folate.Although there are no accuracy-based proficiency testing
TABLE 20 Requirements for laboratory analysis of serum/RBC folate1
Method Requirements
Serum or RBC folate (general) · A midlevel laboratory infrastructure that guarantees uninterrupted electrical power supply for freezers, refrigerators, and the operation of
analytical instrumentation.
· A water purification system that provides deionized water.
· Protection of samples and particularly folate calibrators from direct sunlight and artificial light is highly recommended.
PBA methods · A suitable immunoanalyzer to measure folate with commercial kit assays; however, the cost for such an instrument is relatively expensive
and most analyzers operate on a closed-channel basis allowing only reagents from 1 particular manufacturer to be used.
· Calibrators and reagents are typically purchased from the manufacturer in a ready-to-use form or they require minimal handling.
MBA · Several, albeit comparatively less expensive, pieces of instrumentation, including the following:
o microplate reader;
o 37�C incubator;
o stirring hotplate;
o vortex mixer; balance accurate to at least 2, preferably 3, decimal points (0.001 g);
o UV/Vis spectrophotometer to determine the concentration of the folate calibrator; and
o various adjustable air displacement pipettes including an 8-channel pipettor and a repeater pipettor.
· Specific chemicals, calibrator preparation, and reagents such as the growth medium.
· A plate rotor can help to carefully mix the whole-blood hemolysates without causing foaming of the sample.
· Throughput of this method can be increased by use of a liquid handler to automate the various pipetting steps including the dilution of
serum and whole-blood hemolysates, which is fairly laborious and can take several hours if conducted manually.
· A computer-based sample tracking system can speed up sample log-in and avoid transcription errors by using a barcode scanner.
Chromatography-based · Highly specialized instrumentation.
· Staff with technical expertise in analytical chemistry and a good understanding of instrument software and hardware, regular access to a
service engineer who performs repairs and more complex maintenance, generally as part of an annual service agreement.
· LC-MS/MS instrumentation is very expensive and considerably more maintenance-intensive than HPLC coupled to other forms of
detection such as UV, fluorescence, or electrochemical.
· Because most methods rely on some form of solid-phase extraction for sample extraction and cleanup, at least a manual vacuum manifold
is needed.
· Automated solid-phase extraction and automated sample pipetting using a liquid handler are required to achieve high throughput/volume.
· Depending on the method, other instrumentation may be needed, such as a sample evaporator (either through centrifugation in the
presence of vacuum or through application of heat and/or the flow of an inert gas).
· Regardless of the method specifics, the laboratory requires access to a number of basic instruments such as precision balance, UV/Vis
spectrophotometer, pH meter, various adjustable air displacement pipettes, vortex mixer, stirring plate, and ideally a barcode scanner.
· Chromatography-based assays produce a large amount of data that cannot be easily handled without an appropriate laboratory
information management system; consideration has to be given to the time needed for data review and how the data will be stored so that
it can be retrieved later; good access to IT services is essential.
· The laboratory has to purchase numerous chemicals and prepare calibrators, buffers, mobile phase, and other reagents on a regular basis.
· LC-MS/MS methods require stable-isotope-labeled internal standards, which are comparatively more expensive than unlabeled folate
calibrators and only available from limited commercial sources (9); although certain folate polyglutamates (folic acid, 5-methyl-THF, and
5-formyl-THF) are commercially available, other reduced folate polyglutamates need to be custom synthesized (9).
1 IT, information technology; LC-MS/MS, liquid chromatography–tandem mass spectrometry; MBA, microbiolgical assay; PBA, protein-binding assay; THF, tetrahydrofolate;
UV/Vis, ultraviolet/visible.
Biomarkers of nutrition for development—folate review 1663S
by guest on May 26, 2016
jn.nutrition.orgD
ownloaded from

programs available for folate, the UK National External QualityAssessment Service Haematinics Survey recently showed thatthe all-laboratory consensus mean (instead of the method mean)proved to be sufficiently accurate (compared with LC-MS/MSassigned values) and stable to be used as the target for monitor-ing laboratory performance for serum folate (355).
Plasma total homocysteine. Although no formal standardi-zation program exists for plasma homocysteine measurements,results obtained with common methods generally compare well(356–358) and the assays display good performance, such asaccuracy, precision, and linearity (356). Several proficiencytesting programs are available for homocysteine and NISThas developed higher-order reference measurement proceduresfor the measurement of homocysteine (359, 360) and assignedcertified concentrations for homocysteine to 2 serum-basedinternational SRMs: SRM 1955 (351) and SRM 1950 (Table25). NIST has also conducted a commutability study for SRM1955, which showed that this material was commutable for themajority of immunoassays available at the time (361). As part of
the 2009 National Academy of Clinical Biochemistry Labora-tory Medicine Practice Guidelines on ‘‘Emerging Biomarkers ofCardiovascular Disease and Stroke,’’ analytical performancegoals for the clinical usefulness of homocysteine measurementshave been set to <10% for bias, <5% for precision, and <18%for total error (348). The guidelines also recommended thatmanufacturers of diagnostic assays for homocysteine shouldfollow approved value transfer protocols to ensure that stan-dardized assays are used for vascular risk assessment.
Preanalytical factorsSerum and RBC folate. Folate is the least stable of the Bvitamins; careful sample handling and use of antioxidants arerequired to maintain sample integrity. Table 26 provides anoverview of sample collection and processing requirements,storage, and freeze/thaw stability. Most of the informationfor serum and RBC folate is described in greater detail in acomprehensive review article on analytical approaches andrelated issues by Pfeiffer et al. (9); however, newly availableinformation has been added as appropriate.
· Variables related to the subject. Data from several thousandUS adults participating in NHANES 2003–2006 showedthat samples from fasted ($8 h, no dietary supplementconsumed during the fast) participants had, on average,significantly lower serum (10%) and RBC folate (5%)concentrations than samples from nonfasted (<3 h) partic-ipants, but the difference was relatively small, indicatingthat fasting may not be essential when assessing the folatestatus of populations (362). However, in the individual,serum folate concentrations can increase drastically as aresult of folate intake (either with food or as a dietarysupplement), reaching a peak concentration ;1–2 h afterthe dose and depending on the size of the dose, the baseline
TABLE 21 Homocysteine essentials
· Homocysteine is a thiol-containing amino acid found in normal human plasma.
· Only a very small portion (1–2%) occurs as the thiol, whereas the remaining amount
is in the form of various disulfides, such as homocystine and homocysteine-cysteine
disulfide, and minor amounts of other mixed disulfides (329, 330).
· The sum of these forms is called homocysteine.
· The majority of the total (;75%) is bound to protein (mainly albumin), whereas the
remainder occurs in nonprotein-bound ``free ``forms.
· In patients with abnormally elevated homocysteine concentrations, the relative
contribution of the thiol homocysteine to the total increases to 10–25% (331).
TABLE 22 Main analytical method types used for the measurement of plasma total homocysteine1
Method Advantages Disadvantages
Immunoassay (FPIA, ICL, EIA) · High sample throughput · Limited linear range (up to 50 μmol/L)
· Quick turnaround time to first result · Relatively high reagent cost
· Available in commercial kit form · No control over lot-to-lot variability or assay recalibration/
reformulation· Minimum operator involvement
· Requires patented antibody· Good precision
· Small sample volume needed (#50 μL)
Enzymatic assay · Very small sample volume needed (#20 μL) · Manual pretreatment of samples needed
· Can be performed on basic clinical chemistry analyzer or manually
on a microplate reader· Background determination of D-amino acids needed
Chromatography-based assay
(HPLC-FD, LC-MS/MS, GC-MS)· Can provide information on other thiols · GC-MS and LC-MS/MS methods require expensive instrumenta-
tion, experienced operator, and frequent technical service and are
therefore limited to specialized laboratories· GC-MS methods can simultaneously determine methylmalonic acid,
methionine, and other compounds of the transsulfuration pathway
· Manual assay; several pipetting steps unless automated liquid
handling is introduced· HPLC-FD instrumentation commonly available
· Complex sample extraction for most GC-MS methods because they
require ion exchange chromatography step to separate amino acids
· Use of internal standard (stable-isotope labeled for MS-based
methods; other compounds for non-MS methods) compensates for
procedural losses
· Derivatization is needed for all methods but LC-MS/MS, making
full automation difficult· Highly selective and specific
· Good precision, in particular GC-MS
· In-house control of performance
Capillary electrophoresis
(with laser-induced fluorescence)· Good peak resolution · Requires specialized expensive instrumentation not commonly
available and experienced operator· Short analysis time
· Manual assay, complex sample extraction, derivatization needed· No use of organic solvents
· Ease of automation
1 EIA, enzyme immunoassay; FPIA, fluorescence polarization immunoassay; GC-MS, gas chromatography–mass spectrometry; HPLC-FD, HPLC with fluorescence detection; ICL,
immunochemiluminescence; LC-MS/MS, liquid chromatography–tandem mass spectrometry.
1664S Supplement
by guest on May 26, 2016
jn.nutrition.orgD
ownloaded from

TABLE 23 Characteristics of methodologies used for homocysteine assessment1
Method Characteristics
Immunoassays · Rapid, fully automated immunoassay methods providing high sample throughput were developed in the 1990s due to the increasing
clinical interest in Hcy as a potential risk factor for cardiovascular disease.
· They were adapted for various clinical analyzer platforms and the majority of clinical laboratories still use this approach. The common
principle of all assays is the enzymatic conversion of free Hcy to S-adenosyl-L-homocysteine by the action of S-adenosyl-L-
homocysteine hydrolase (333).
· The distinguishing feature of the assays is the detection mode, mainly including FPIA, ICL, and EIA.
· The FPIA assay has been used in the continuous NHANES survey from 1999 to 2006 (334) and compares well with a rapid and simple
HPLC assay with fluorescence detection (335).
· The EIA assay, carried out on microtiter plates with a microplate reader,
o has the potential for high throughput without the need for an expensive clinical analyzer;
o however, the imprecision of this assay is somewhat higher than that of fully automated immunoassays (243) and
o is not commonly used by laboratories participating currently in proficiency testing programs.
Enzymatic assays · Enzymatic colorimetric assays do not require an immunoanalyzer; they can be performed on simpler clinical chemistry analyzers or
manually using a microplate reader to record the colorimetric reaction.
· Various commercial assays have been developed:
o the A/C Diagnostics (San Diego, California) single-enzyme assay using homocysteine a,g-lyase (336), which can now also be
performed on a small portable fluorescence reader (337);
o the Catch (Bio-Pacific Diagnostics, Inc; Bellevue, Washington) homogeneous enzymic assay based on pyruvate detection (338); and
o the Diazyme (Diazyme Laboratories, Poway, California) enzymic cycling assay based on ammonia detection (339).
Capillary electrophoresis assays · This analytical approach seemed once an interesting alternative to HPLC methods; however, the emergence of simpler and more
powerful LC-MS/MS methods has made this approach less attractive.
Chromatography-based assays · This method type comprises a wide spectrum from the less expensive HPLC assays using mostly fluorescence detection (some
methods use electrochemical or photometric detection) to the more cumbersome and less used GC-MS methods and to the newer and
simpler LC-MS/MS methods that no longer require derivatization but rely on expensive tandem mass spectrometer instrumentation.
· Main advantages are as follows:
o they allow simultaneous measurement of other thiols in the same sample and
o the laboratory has in-house control of the assay performance and is not faced with unpredictable assay recalibration or
reformulation by the manufacturer.
· All of these methods require the same first 2 steps:
o the conversion of the disulfide forms to reduced Hcy and
o the precipitation of proteins.
· A number of reducing reagents have been used (332): sulfhydryl agents such as dithiothreitol, dithioerythreitol, or 2-mercaptoethanol;
sodium or potassium borohydride; phosphine agents such as TBP and TCEP.
o TCEP has emerged as the reducing reagent with most advantages:
n it is nonvolatile,
n stable, and
n soluble in aqueous solutions (335).
Subtype HPLC · Less expensive.
· Uses mostly fluorescence detection (some methods use electrochemical or photometric detection).
· HPLC methods with fluorescence detection require a derivatization step; a number of reagents have been used: monobromobimane;
halogenoslfonylbenzofurazans (SBD-F and ABD-F; o-phthaldialdehyde) (332).
o SBD-F and ABD-F seem to have some important practical advantages:
n they are not fluorescent;
n their thiol adducts are stable (no fluorescent degradation products), allowing the application of a simple isocratic chromatography
(with shorter retention times for SBD-F compared with ABD-F);
n they are thiol-specific;
n however, the derivatization needs to be performed at elevated temperature.
Subtype GC-MS · More cumbersome and less commonly used than other methods in this class. Generally better precision than LC-MS/MS.
Subtype LC-MS/MS · Superior analytical specificity and sensitivity.
· Expensive tandem mass spectrometer instrumentation.
· No longer require a derivatization step.
· Has also been adapted for dried blood spots (340, 341).
· A commercial kit specifically designed for LC-MS/MS has also been recently reported (342).
· Can incorporate the inexpensive deuterium-labeled Hcy as an internal standard to control for procedural losses and are considered
higher-order reference methods.
· If only Hcy is of interest, the chromatographic run can be very short (#2 min) and the data processing can be quick and easy.
1 ABD-F, 4-(Aminosulfonyl)-7-fluoro-2,1,3-benzoxadiazole; EIA, enzyme immunoassay; FPIA, fluorescence polarization immunoassay; GC-MS, gas chromatography–mass
spectrometry; Hcy, homocysteine; ICL, immunochemiluminescence; LC-MS/MS, liquid chromatocraphy–tandem mass spectrometry; SBD-F, 7-Fluorobenzofurazan sulfonic acid;
TBP, tri-n-butylphosphine; TCEP, tris(2-caroboxyl-ethyl) phosphine.
Biomarkers of nutrition for development—folate review 1665S
by guest on May 26, 2016
jn.nutrition.orgD
ownloaded from

folate status, and the vehicle in which folate was adminis-tered. The within-person variability for serum folate [CV(CVw) = 21.5%] is about twice that for RBC folate (9.1%)(370). It has been recommended that the method impreci-sion should be less than one-half of the CVw. Although thiscan be achieved with most current serum folate methods,RBC folate methods are nowhere near to achieving themuch tighter requirement.
· Variables related to the sample collection. Although mostlaboratories prefer serum over plasma, both matrices gener-ally produce comparable results for serum total folate (300,363, 364), as long as the sample processing is not delayed(367).
· Variables related to the sample processing. Blood should beprocessed and frozen promptly. If delays in processing areunavoidable, the sample should be protected from light andkept cool; it should be processed no later than a few daysafter collection. Intact whole blood shows better folatestability than hemolysate (313, 364).
· Variables related to the sample storage.Generally, the lowerthe storage temperature, the better the folate stability. Folatein serum and hemolysates (but not in whole blood) canwithstand a few short freeze/thawing cycles, particularlyif the vials are closed most of the time to minimize theexposure of the sample to air (313, 366, 369). Folate inserum/plasma degrades rapidly at room temperature, par-ticularly in the presence of EDTA (300, 367, 371). WhenHannisdal et al. (367) kept matched serum and plasmasamples at room temperature in the dark for up to 192 h,
they did not find sample type differences at baseline (bloodprocessed within <1 h and frozen immediately at 280�C)and 5-methyl-THF concentrations were essentially stablefor 48 h in serum. However, in EDTA plasma, 5-methyl-THF decreased and MeFox (tentatively termed hmTHFin earlier publications) increased at a rate of 1.92%/h and25.7%/h, respectively, during the first phase of rapidchange. In serum, the reduction in 5-methyl-THF wastotally recovered as MeFox after 96 h, whereas in EDTAplasma a smaller percentage of 5-methyl-THF was recov-ered as MeFox. Therefore, moderately degraded folate canbe quantitatively recovered as MeFox. However, in serumsamples stored for decades in biobanks, folate is degradedbeyond MeFox but can be recovered as pABG equivalentsafter oxidation and mild acid hydrolysis of the folate species(372). These recovery strategies are useful for the assessmentof folate status in epidemiologic studies, in which serum/plasma was processed, transported, and stored in biobanksunder conditions that did not stabilize folate (i.e., in theabsence of ascorbic acid).
Plasma total homocysteine. Plasma homocysteine is a verystable analyte as long as the plasma is separated from the RBCswithin 1 h of blood collection (or within <8 h if the whole bloodis kept on ice) (179) (Table 26). The within-person variabilityCVw for plasma homocysteine is 12.2% (370). Most currenthomocysteine methods have an imprecision of between 5% and10% and therefore could likely achieve a method imprecision ofless than one-half of the CVw.
Other biomarker methods.
Urinary folate/folic acid. Although urine contains somefolate derivatives, the bulk of the excretion products in humansare folate cleavage products. A small and variable amount of afolate dose is recovered as intact folate derivatives in urine in thefirst 24 after the dose. Folate is freely filtered at the glomerulusand is reabsorbed in the proximal renal tubule. The net effect isthat most of the secreted folate is reabsorbed (292). When largefolate doses are given, more of the folate is excreted in the urine(373, 374) and the amount excreted depends on the type of
TABLE 24 Basic components of QA1
· Internal QC through the use of bench and blind QC samples
· External QA via participation in proficiency testing programs
· Equipment monitoring and maintenance
· Documentation of policies and procedures
· Proper staff training
· Laboratory audits
1 QA, quality assessment; QC, quality control.
TABLE 25 Available reference materials and proficiency testing programs for folate status biomarkers1
Biomarker Reference materials Selected list of proficiency testing programs
Serum folate NIST SRM 1955 (human serum, frozen; 3 levels; certified values for 5-
methyl-THF, reference values for FA, information values for total
folate and 5-formyl-THF) (353)
CAP Ligand Assay General Survey
NIST SRM 1950 (human plasma, frozen; 1 level; certified value for 5-
methyl-THF, reference value for FA) (353)
CAP Cal V/L Survey
NIBSC RM 03/178 (human serum, freeze-dried; 1 level; LC-MS/MS
values for 5-methyl-THF, FA, 5-formyl-THF, and total folate) 354
UK NEQAS Haematinics Survey
Whole-blood folate NIBSC RM 95/528 (human whole-blood hemolysate, freeze-dried;
1 level; consensus value) (354)
CAP Ligand Assay General Survey
CAP Cal V/L Survey
UK NEQAS Haematinics Survey
Plasma Hcy NIST SRM 1955 (human serum, frozen; 3 levels; certified values) (353) CAP Homocysteine Survey
NIST SRM 1950 (human plasma, frozen; 1 level; certified value) (353) CAP Cal V/L Survey
NY State Department of Health Wadsworth Center General Clinical
Chemistry
DEKS
1 Cal V/L, Calibration Verification and Linearity Survey; CAP, College of American Pathologists; DEKS, Danish External Quality Assessment Program; FA, folic acid; Hcy, total
homocysteine; NEQAS, National External Quality Assessment Scheme; NIBSC, National Institute for Biological Standards and Control; NIST, National Institute of Standards and
Technology; SRM, standard reference material; THF, tetrahydrofolate; UK, United Kingdom.
1666S Supplement
by guest on May 26, 2016
jn.nutrition.orgD
ownloaded from

folate given as well as the dose. Humans have limited abilityto reduce large doses of folic acid (221, 375, 376). More folicacid is excreted than 5-methyl-THF when large doses are given.Urinary folates can be measured by chromatography-basedmethods, which were discussed previously in the section onanalytical methods under measurement of serum and RBCfolate. Because folates occur as monoglutamates in urine, nodeconjugation is necessary and the sample can be cleaned up byaffinity chromatography, which requires no additional extrac-tion step (377).
Serum folic acid. The main circulating folate vitamer is 5-methyl-THF (292), but unmetabolized folic acid can be presentin varying concentrations (7, 294). This vitamer is measured bychromatography-based methods that provide information onindividual folate forms and that were discussed previously in thesection on analytical methods under measurement of serum andRBC folate. More recent methods have used tandem MS as thedetector (300), but electrochemical detection (378) and MBA offolic acid–containing HPLC fractions (379, 380) have been usedas well. It is important to note that under heat and/or low-pHconditions, THF can oxidize to folic acid via the highly unstableDHF intermediate. Assays measuring unmetabolized folic acidin serum should therefore verify that this compound is not anartifactual result of THF oxidation due to analytical steps.
Urinary and serum pABG and apABG. The oxidativefolate catabolites pABG and apABG, biomarkers of folate statusand turnover, are found in both urine and blood. Urinary pABGand apABG, which reflect turnover in endogenous folate pools,are frequently measured by chromatography-based methods(HPLC, GC-MS) after preanalytical passage through immobi-lized FBP affinity columns to remove potential interferencefrom intact folate (258, 381). More recent studies reportedthe development of faster and highly sensitive LC-MS/MSprocedures for the quantification of pABG and apABG inurine (382, 383) and the use of this procedure for quantifyingthese catabolites in fasted spot urine as a noninvasive alternativeto 24-h urine analysis (384). pABG and apABG in serum canalso be measured by LC-MS/MS by using procedures developedfor the selective and simultaneous quantification of pABG andapABG and other folate species (5-methyl-THF, 5-formyl-THF,hmTHF, folic acid) (367). In serum samples stored for decades inbiobanks, degraded folate can be recovered as pABG equivalentsafter oxidation and mild acid hydrolysis of the folate species(372). As indicated earlier, this recovery strategy can be usefulfor the assessment of folate status in epidemiologic studies inwhich serum/plasma was processed, transported, and storedin biobanks under conditions that did not stabilize folate (i.e., inthe absence of ascorbic acid).
Genetic markers.DNA methylation. One can examine cytosine methylation
across all cytosines in the genome or in specific regions of thegenome such as long interspersed nucleotide elements-1 (LINE-1) repetitive sequences or promoter sequences of single genes.The most commonly used methods require that DNA is isolatedfrom cells to perform DNA methylation analysis (264, 385);however, it is possible to visualize methylated cytosine in thenuclei or chromosomes by using labeled antibodies (386). DNAmethylation in human epidemiologic studies is usually measuredin DNA from isolated lymphocytes or in DNA from wholeblood. The preferred approach is to use DNA from isolatedlymphocytes because DNA methylation status may vary be-tween leukocyte subsets (387, 388) and leukocyte subset ratiosmay differ significantly between individuals depending on theirage, sex, health, level of physical exercise, and lifestyle or
nutritional status (389–391), which may then make interpreta-tion of data difficult.
One of the earlier most utilized techniques in folate-relatedDNA methylation research is the CpG methyl transferase Sss1(from Spiroplasma sp. strain) methyl acceptance assay in whichDNA is incubated with the Sss1 enzyme with SAM containinga tritiated methyl group (392). The capacity of the DNA toaccept tritiated methyl groups from SAM is then calculatedfrom the degree of its radioactivity after isolation from thereaction mixture. A higher degree of radioactivity reflects ahigher capacity to accept methyl groups and therefore indicatesthe extent to which the DNA�s cytosines at CpG sites wereinitially hypomethylated. Another method that has been usedsuccessfully is based on the initial digestion of isolated DNA tosingle bases and subsequent measurement of the abundance ofcytosine and 5-methylcytosine by LC in combination with UVAdetection (393) or MS (139). The 5-methylcytosine:(cytosine +5-methylcytosine) ratio provides a measure of global cytosinemethylation.
The LINE-1 retrotransposon is a mobile parasitic geneticelement that is abundant in the human genome, representing;17% of the total human DNA (394). Methylation of LINE-1 sequences is essential for suppressing its expression, which ifleft unchecked, can multiply rapidly and insert itself randomlyinto the human genome, disrupting normal gene expression andcausing chromosomal instability (264, 394). Several investiga-tors are now measuring LINE-1 methylation in relation to folatestatus and folate metabolism gene polymorphisms by pyrose-quencing of bisulfited DNA (395, 396). The DNA of interest isextracted and treated with bisulfite to convert unmethylatedcytosines into uracils. After PCR amplification, by which alluracils result in thymidine, the sample is denatured to formsingle-stranded DNA. The single-stranded DNA is then se-quenced and the degree of methylation at each CpG position in asequence is determined from the ratio of Tand C at that position.
Uracil misincorporation. Initially indirect methods wereused to measure folate status of cells by determining either theirresistance to incorporate tritiated thymidine when supplied withdeoxyuridine (deoxyuridine suppression test) (397) or theiruptake and metabolism of tritiated deoxyuridine by measuringradiolabeled uracil or thymidine in DNA, which reflected thecells� capacity to synthesize dTTP (398).
Other indirect methods involve the treatment of either nucleior isolated DNAwith uracil glycosylase (UDG), which convertsuracil in DNA into an abasic site. In the former case, it is possibleto use the comet assay under alkaline conditions (pH 13) tomeasure double-strand breaks in nuclei resulting from abasicsites that are either occurring spontaneously or are inducedby UDG (399). The difference between the 2 measures thenprovides an estimate of the presence of uracil in DNA. In the caseof isolated DNA, one can measure spontaneous and UDG-induced abasic sites by using labeled aldehyde reactive probeand ELISA detection (400); similarly, the difference betweenthese 2 parameters provides a measure of uracil in DNA. Moredirect and quantitative measurement of uracil in DNA can beachieved by HPLC (401) or GC-MS analysis (402) of abundanceof each base in hydrolyzed DNA. An alternative approach is tospecifically release the uracil in DNA by UDG digestion andthen analyze uracil extracted from the reaction mixture byGC-MS (403, 404).
Micronuclei. Micronuclei are best scored in once-dividedcells because only cells that complete nuclear division canefficiently express micronuclei. Usually, micronuclei in humansare measured in mitogen-stimulated lymphocytes cultured ex
Biomarkers of nutrition for development—folate review 1667S
by guest on May 26, 2016
jn.nutrition.orgD
ownloaded from

TABLE
26
Preanalyticalfactors
influencingbiochemicalindicators
offolate
status1
Varia
bles
Serum
folate
RBCfolate
PlasmaHcy
Subject
Fasting
Essentialforindividualbutprobablynotforpopulation(;
10%average
diffe
rencebetweenovernightfasted
and,3hfasted)(362)
Not
required(362)
Generally
notrequired(179);variations
inHcyinresponse
toahigh-
proteinmeal(332)
Biologicalvariation,2%
Within-person
21.5
9.1
12.2
Between-person
48.7
35.8
37.1
Samplecollection
Venous
vs.capillaryblood
Nodata
Nonvolumetrically
prepared
capillary
blood
samples
(finger-stick)
comparedwellto
venous
bloodsamples
iffolate
concentra
tion
was
normalizedto
hemoglobin(313)
Nodata
Influence
ofanticoagulants
Serum
preferred
over
plasma
(might
contain
fibrinogen
clots);
generally
both
matrices
providesimilarresults
(300,363,364)
EDTA
wholebloodisused;other
anticoagulantsarenotcustom
ary
EDTA
plasmapreferredover
serumbecausetheevacuatedtubescan
beimmediatelycentrifuged.
Sampleprocessing
Generalrequirements
Protectevacuatedtubeswith
whole
bloodfro
mlight
andkeep
cool
(avoidfre
ezingtokeep
RBCs
intact);prom
ptprocessing
andfre
ezing
ofserumrecommended
Protectevacuatedtubeswith
anticoagulatedEDTA
wholebloodfro
m
light
andkeep
cool
(avoid
freezingto
keep
RBCintact);prom
pt
processing
andfre
ezingof
hemolysaterecommended;
Ithasbeen
recommendedthat
Hcybe
measuredinplasmabecause
thesamplecanbe
processedimmediately;toobtainserum,onthe
otherh
and,abloodsamplehasto
beleftat
room
temperature
for
30–60
min
toallow
coagulation,
which
leadsto
anartificial
increase
inHcyduetoan
ongoingreleaseofHcyfro
mRBCs.Serum
concentra
tions
will
therefore
be;5–10%
higher
than
those
obtained
inoptim
allyprepared
plasma.Separate
plasmafro
mRBC
within1hof
collectionto
avoidartificialincreaseinHcy[ongoing
releaseofHcyfro
mRBCs;;
1μmol/(L
3h)atroom
temperature]
(179).
Measure
hematocrit
tocorre
ctforpacked
cells;p
repare
hemolysate
with
ascorbicacid(1%
wt:vol)byusingaccurate
pipetting;use
of
serumfolate
concentra
tionincalculationof
RBCfolate
concentra
-
tionpreferred
Delayedprocessing
Prepareserum
within
1d,
butno
laterthan
within
2–3dof
blood
collection
Preparehemolysatewith
ascorbicacid(1%
wt:vol)w
ithin1d,butn
o
laterthanwithin4dofbloodcollection(folaterecoveryis.90%
at
4�C(313,364)]
Alternatively,keep
evacuatedtubeswith
anticoagulatedEDTA
whole
blood
onice
for,8
hbefore
preparation
ofplasma
(179).
Adenosineanalogs(e.g.,3-deazaadenosine)preventformationor
releaseof
Hcyfro
mRBCs
butarenotcompatible
with
immuno-
assays
basedon
S-adenosylhomocysteinehydrolase(179).
Storageof
unprocessedwhole
bloodat
elevated
temperature
is
unacceptable,p
articularlyifitexceedsafewhours[10–20%
loss
after6–12
hat
37�C
(365);30%
loss
after1dat
37�C
(366)]
Storageof
unprocessedwhole
bloodat
elevated
temperature
is
unacceptable
(;10%
loss
after1dat
22�C
(267);20–30%
loss
after1dat
37�C
(313,366)]
Samplestorage
Storagestability
Stable
for1–2dat
room
temperature
inserum,butnotin
EDTA
plasma;EDTA
acceleratesfolate
degradation[2%/h
(367)]
Hemolysatewith
ascorbicacid(1%
wt:vol)stableforseveralweeks
at
220�C
(313)and
afewyearsat
270�C
(9)
Stablefordays
atRT;stableforweeks
refrigerated;stableforyears
frozen(179,332)
Stablefor1wkrefrigerated(,
10%
loss)(366,368)
Stableforafewyearsat
270�C
(2)
Moderatefolate
losses
canoccurifwhole
bloodis
stored
frozen
[,20%
loss
after2yat
270�C
(369)]
Ascorbicacidcanbe
added(0.5%
wt:vol)b
eforestorageto
improve
stability
Freeze/thawstability
Littledeteriorationforat
least3
cycles
(366)
Little
deterioration
inhemolysates
forat
least3
cycles
(369);
significant
folate
loss
inwholebloodalreadyat
2cycles
(369)
Excellentstability;how
ever,thoroughmixingofsamples
requiredafter
thaw
ing(179)
Significantfolatelosses
canoccuriffrozenwholebloodissubjectedto
prolongedthaw
ingtim
es(313,369)
1Hcy,homocysteine;RT,room
temperature.
2Data
from
reference263.
1668S Supplement
by guest on May 26, 2016
jn.nutrition.orgD
ownloaded from

vivo and blocked at the binucleate stage of mitosis by usingcytochalasin B, a cytokinesis inhibitor, to identify once-dividedcells (405). Micronuclei may also be measured in erythrocytesdue to micronuclei formation in vivo in bone marrow normo-blasts from which erythrocytes are derived after enucleation.Preferably, micronuclei are measured in very young erythrocytesknown as reticulocytes, which can be identified by theirlarger size, higher RNA content, and by being positive for thetransferrin receptor (131, 132, 406).
New Directions and Technologies
Omics (genome, epigenome, transcriptome, proteome,metabolome)A biomarker may not necessarily refer to a single metabolic orgenomic indicator. Rather, it could represent a panel of markers(407, 408) that reflect physiologic patterns or disease states(407, 409). Genome-related markers have the potential to serveas functional biomarkers of folate-dependent nucleotide bio-synthesis and/or homocysteine remethylation, including thecellular methylation potential. Potential genomic biomarkersof folate status and function include alterations in chromatinmethylation (410, 411), gene expression (412, 413), nucleargenome stability, and uracil content in nuclear DNA (29, 131,414). Uracil misincorporation into nuclear DNA increasesduring folate deficiency, leading to increased levels of uracilcontent in DNA and DNA instability, but uracil accumulationin DNA is not specific to folate deficiency because vitaminB-12 and B-6 deficiency can impair folate utilization, leadingto elevated uracil in DNA. Uracil in DNA also exhibits celland tissue-type variations and has not been shown to be doseresponsive to folate supplementation, limiting its role as abiomarker. Disruption of de novo dTMP synthesis in mitochon-dria results in elevated uracil levels in mitochondrial DNA(146), but the utility of uracil in mitochondrial DNA as arobust biomarker of folate nutritional status or de novo dTMPsynthesis has yet to be established. Functional variation in folate-dependent homocysteine remethylation, which generates thecofactor SAM, includes CpG DNA methylation levels andprotein methylation (including histones), which affect geneexpression and DNA stability (138–141). However, methylationpatterns are affected by not only folate but also by vitamin B-12,choline, threonine, and other one-carbon donors (415, 416).Changes in the DNA and histone methylome can be either globalor specific to one or more genetic loci.
New technologies as research toolsHigh-throughput omics platforms for data collection.
Biomarker discovery and validation, and determination ofinterindividual variation in biomarker responses to dietaryexposures, increasingly require profiling of the metabolome,transcriptome, genetic variation, and the epigenome, includingfor quantitative profiling of biomarkers of one-carbon metab-olism (417, 418). Rates and costs of data collection are limitingfactors in biomarker discovery, validation, and use. Untargetedmetabolomic approaches have the potential to reveal unex-pected and new associations among metabolites and diseaserisks but are limited by the ability to detect low-abundancecompounds beyond what current MS technologies can provide(419, 420). This approach is vulnerable to false discovery, asshown by the reported association between prostate cancer andurinary sarcosine (421), which could not be confirmed, probablybecause of interference from alanine (422). The risk of falsediscovery can be addressed by large sample size, data splitting,
and validation cohorts (423). Therefore, candidate biomarkersidentified through untargeted approaches must be validated andtheir biological plausibility established to become true targets.
Targeted metabolic profiling may be hypothesis driven, andit may be difficult to formulate adequate hypotheses within asystem composed of complex interactive metabolic networks.However, methods can be developed and optimized to quantita-tively determine a panel of low- and high-abundance metaboliteswithin a defined metabolic pathway and the statistical problemof false discovery rate is mitigated. Last, the development andimplementation of appropriate QC systems is currently a limitingfactor in all ‘‘omics’’ research (424). Looking forward, the greatestneed and opportunity in biomarker research and development isto exploit new or existing technologies to serve as platforms forsimultaneous measurement of multiple biomarkers, particularlyin field settings. Such methods are under development and offerthe potential to assess comprehensively the nutritional status ofindividuals and populations.
Mathematical models to predict, identify, and integrate
biomarkers of impaired folate metabolism. Deterministicmathematical models of one-carbon metabolism have beenreported that describe the network including the effect of geneticvariation and nutritional status on network outputs (158, 425).These deterministic modeling approaches use ordinary differen-tial equations and represent metabolites as continuous variables(426) and serve to model system behavior from reactionvelocities, usually described in terms of Michaelis-Mentenkinetic parameters. Deterministic models have several limita-tions, the most important being that the combinatorial com-plexity of the system, when including all reactions, interactions,and gene expression data, can become a limiting factor (427).Thus, other approaches are needed to model folate metabolismand all of its interactions and regulation in the context of whole-body physiology.
Computable models can be generated for integrating andinterpreting large-scale omics data (428), including transcrip-tomic (429–431), proteomic, and metabolomic data (432, 433).These reconstructions can be incorporated into in silico modelsfor mathematical modeling to study network properties, struc-ture, and dynamics. Mathematical modeling enables simulationsand predictions of network responses to genetic and environ-mental perturbations, including drug treatments and nutritionalinterventions, and can assist in the discovery and validation ofbiomarkers that inform preventative or management treatments(159, 425). They have the potential to inform DRIs for essentialnutrients (434). As an example, Recon 1, a global reconstructionof the human metabolic network (430), was built from a humangenome sequence and the accumulated knowledge of humanmetabolism, encompassing 1496 genes, 2004 proteins, 2712metabolites, and 3311 metabolic reactions. Although still indevelopment, Recon 1 has been used to stimulate hypothesis-driven studies of human metabolism (435, 436), for computa-tional simulation to identify biomarkers for disease managementstrategies (428, 430), and to investigate the effect of dietaryinterventions on transcriptome profiles at different stages of theintervention (429), which revealed interactions between meta-bolic and inflammatory pathways on insulin sensitivity. Com-puter simulations have also led to the systematic effort to predictbiomarkers for >300 metabolic disorders (437), which were10 times higher than random chance (438). The prediction ofextracellular biomarkers in folate metabolismwill benefit from awhole-body network model that incorporates different cells andtissues (438).
Biomarkers of nutrition for development—folate review 1669S
by guest on May 26, 2016
jn.nutrition.orgD
ownloaded from

Research Gaps and Needs
Lacking are functional biomarkers that report on individualpathways within the folate-mediated one-carbon metabolicnetwork as well as validated biomarkers of risk of folate-associated pathologies including developmental anomalies,neurodegeneration, cancers, and other diseases of aging. Thereare no established blood metabolite biomarkers that are specificto impaired de novo purine or thymidylate biosynthesis. Thereare several robust biomarkers of homocysteine remethylationfunction, including plasma concentratons of SAM, homocyste-ine, and SAH. However, apart from folate, these biomarkers aresensitive to choline and vitamin B-12 status, as well as geneticvariation. Blood biomarkers that report on the activity ofmitochondrial one-carbon metabolism are also lacking. Plasmaformate concentrations may report on mitochondrial formateproduction (439) but its use as a functional biomarker has notbeen extensively investigated. Nonketotic hyperglycinemia, aninborn error of metabolism resulting in compromised folate-dependent glycine cleavage in mitochondria, results in elevatedglycine concentrations in cerebral spinal fluid, but this bio-marker is not relevant for healthy populations (440).
Recent evidence suggests that alterations in gene expressionspecific to folate deficiency (441, 442) and proteomic changes inresponse to folic acid supplementation (443) can be identified,which potentially could be used to supplement interpretation ofestablished biomarkers. Furthermore, gene expression networkanalysis was used to identify gene expression patterns associatedwith micronuclei formation under different environmentalexposure conditions such as acrylamide or nitrosamine exposure(444, 445). A similar approach could be developed to identifygene expression networks that relate to folate deficiency–induced uracil misincorporation, DNA hypomethylation, andmicronuclei and possibly also include folate deficiency–specificmicroRNAs (e.g., miR-222) in the diagnostics (446).
Future research can address all of the above but should alsoseek to consider the following:
· studies in better defined leukocyte subpopulations ratherthan total leukocytes;
· studies in easily accessible epithelial tissues, such as buccalcells and skin;
· larger studies to be able to determine the impact of genotype;
· replication studies within the same population and acrosspopulations;
· harmonization of assay protocols across laboratories;
· continuing and sustained efforts to improve assay robust-ness, cost-effectiveness, and transportability to low-resourcesettings;
· simultaneous measurement of different but complementarybiomarkers (i.e., DNA methylation, uracil in DNA, andDNA or chromosomal breaks; gene expression patterns)associated with folate deficiency or excess;
· harmonization of robust study designs to determine thegenomic effects of depletion and repletion of folate; and
· inclusion of gene expression network analysis to verifymechanisms underlying observed genomic effects.
Acknowledgments
This review is the result of deliberations and contributions ofthe Folate Expert Panel [LBB (Chair), PJS, HM, MFF, JFG, andJLM] and scientific consultants (CMP, ZF, MZ, PMU, AMM,MAC, BS, RJB, and RLB). Allyson West’s contribution to thecontent of the choline section is acknowledged.
RR summarized the deliberations of the Folate Panel andscientific consultants and coordinated preparation of the manu-script draft; LBB was responsible for assignment of Folate Panelmembers and consultants as authors of specific sections of thereview and oversight of scientific content; DBH assisted withmanuscript revisions and screened final content. DJR providedoversight to the overall BOND process. All authors read andapproved the final version of the manuscript.
References
1. Wills L. Treatment of "pernicious anaemia of pregnancy" and "tropicalanaemia" with special reference to yeast extract as a curative agent.BMJ 1931;1:1059–64.
2. Mitchell HK, Snell EE, Williams RJ. Journal of the AmericanChemical Society, vol. 63, 1941: the concentration of "folic acid" byHerschel K. Mitchell, Esmond E. Snell, and Roger J. Williams. NutrRev 1988;46:324–5.
3. Spies TD. Treatment of macrocytic anaemia with folic acid. Lancet1946;250: 225–8.
4. Yetley EA, Pfeiffer CM, Phinney KW, Fazili Z, Lacher DA, Bailey RL,Blackmore S, Bock JL, Brody LC, Carmel R, et al. Biomarkers of folatestatus in NHANES: a roundtable summary. Am J Clin Nutr 2011;94(Suppl):303S–12S.
5. Molloy AM, Daly S, Mills JL, Kirke PN, Whitehead AS, Ramsbottom D,Conley MR, Weir DG, Scott JM. Thermolabile variant of 5,10-methylenetetrahydrofolate reductase associated with low red-cell folates:implications for folate intake recommendations. Lancet 1997;349:1591–3.
6. Bagley PJ, Selhub J. A common mutation in the methylenetetrahy-drofolate reductase gene is associated with an accumulation offormylated tetrahydrofolates in red blood cells. Proc Natl Acad SciUSA 1998;95:13217–20.
7. Bailey RL, Mills JL, Yetley EA, Gahche JJ, Pfeiffer CM, Dwyer JT,Dodd KW, Sempos CT, Betz JM, Picciano MF. Unmetabolized serumfolic acid and its relation to folic acid intake from diet andsupplements in a nationally representative sample of adults aged >60 yin the United States. Am J Clin Nutr 2010;92:383–9.
8. Shane B. Folate status assessment history: implications for measurementof biomarkers in NHANES. Am J Clin Nutr 2011;94(Suppl):337S–42S.
9. Pfeiffer CM, Fazili Z, Zhang M. Folate analytical methodology. In:Bailey LB, editor. Folate in health and disease. 2nd ed. Boca Raton(FL): CRC Press, Taylor & Francis Group; 2010. p. 517–74.
10. Hillman RS, Ault KA, editors. Macrocytic anemias. In: Hematology inclinical practice, 3rd ed. New York: McGraw-Hill; 2002. p. 91–100.
11. Horne III. Nutritional deficiences. In: Rodgers GP, Young NS, editors.In: Hematology in clinical practice. 3rd ed. Philadelphia: Lippincott,Williams and Wilkins; 2005. p. 11–8.
12. Wickramasinghe SN. Diagnosis of megaloblastic anaemias. Blood Rev2006;20:299–318.
13. Aslinia F, Mazza JJ, Yale SH. Megaloblastic anemia and other causesof macrocytosis. Clin Med Res 2006;4:236–41.
14. Bull CF, Mayrhofer G, Zeegers D, Mun GLK, Hande MP, Fenech MF.Folate deficiency is associated with the formation of complex nuclearanomalies in the cytokinesis-block micronucleus cytome assay. Envi-ron Mol Mutagen 2012;53:311–23.
15. Bills T, Spatz L. Neutrophilic hypersegmentation as an indicator ofincipient folic-acid deficiency. Am J Clin Pathol 1977;68:263–7.
16. Howell WH. The life-history of the formed elements of the blood,especially the red blood corpuscles. J Morphol 1890;4:57–116.
17. Jolly JM. Sur la formation des globules rouges des mammiferes. [Onthe formation of red blood cells in mammals.] Comptes rendus de laSociete de Biologie 1905;58:528–31 (in French).
18. Lal A, Ames BN. Association of chromosome damage detected asmicronuclei with hematological diseases and micronutrient status.Mutagenesis 2011;26:57–62.
19. Higgins C. Deficiency testing for iron, vitamin B12 and folate. NursTimes 1995;91:38–9.
20. Thuesen BH, Husemoen LLN, Ovesen L, Jorgensen T, Fenger M,Gilderson G, Linneberg A. Atopy, asthma, and lung function in relationto folate and vitamin B-12 in adults. Allergy 2010;65:1446–54.
1670S Supplement
by guest on May 26, 2016
jn.nutrition.orgD
ownloaded from

21. Tamura T, Picciano MF, McGuire MK. Folate in pregnancy andlactation. In: Bailey LB, editor. Folate in health and disease, 2nded. Boca Raton (FL): CRC Press, Taylor and Francis Group; 2010.p. 111–31.
22. Stabler SP. Clinical folate deficiency. In: Bailey LB, editor. Folate inhealth and disease. 2nd ed. Boca Raton (FL): CRC Press, Taylor andFrancis Group; 2010. p. 409–28.
23. Dickey W, Ward M, Whittle CR, Kelly MT, Pentieva K, Horigan G,Patton S, McNulty H. Homocysteine and related B-vitamin status incoeliac disease: effects of gluten exclusion and histological recovery.Scand J Gastroenterol 2008;43:682–8.
24. Halsted CH, Medici V, Esfandiari F. Influence of alcohol on folatestatus and methionine metabolism in relation to alcoholic liver disease.In: Bailey LB, editor. Folate in health and disease. 2nd ed. Boca Raton(FL): CRC Press, Taylor and Francis Group; 2010. p. 429–48.
25. Tower RL, Spector LG. The epidemiology of childhood leukemia with afocus on birth weight and diet. Crit Rev Clin Lab Sci 2007;44:203–42.
26. Xu X, Chen J. One-carbon metabolism and breast cancer: anepidemiological perspective. J Genet Genomics 2009;36:203–14.
27. Kennedy DA, Stern SJ, Moretti M, Matok I, Sarkar M, Nickel C,Koren G. Folate intake and the risk of colorectal cancer: a systematicreview and meta-analysis. Cancer Epidemiol 2011;35:2–10.
28. Collin SM, Metcalfe C, Refsum H, Lewis SJ, Zuccolo L, Smith GD,Chen L, Harris R, Davis M, Marsden G, et al. Circulating folate,vitamin B12, homocysteine, vitamin B12 transport proteins, and riskof prostate cancer: a case-control study, systematic review, and meta-analysis. Cancer Epidemiol Biomarkers Prev 2010;19:1632–42.
29. Berger SH, Pittman DL, Wyatt MD. Uracil in DNA: consequencesfor carcinogenesis and chemotherapy. Biochem Pharmacol 2008;76:697–706.
30. Duthie SJ. Folate and cancer: how DNA damage, repair and methylationimpact on colon carcinogenesis. J Inherit Metab Dis 2011;34:101–9.
31. Duthie SJ. Epigenetic modifications and human pathologies: cancerand CVD. Proc Nutr Soc 2011;70:47–56.
32. Mason JB. Folate, cancer risk, and the Greek god, Proteus: a tale oftwo chameleons. Nutr Rev 2009;67:206–12.
33. Miller DR. A tribute to Sidney Farber—the father of modernchemotherapy. Br J Haematol 2006;134:20–6.
34. Vollset SE, Clarke R, Lewington S, Ebbing M, Halsey J, Lonn E,Armitage J, Manson JE, Hankey GJ, Spence JD, et al. Effects of folicacid supplementation on overall and site-specific cancer incidenceduring the randomised trials: meta-analyses of data on 50,000individuals. Lancet 2013;381:1029–36.
35. Blom HJ, Smulders Y. Overview of homocysteine and folate metab-olism: with special references to cardiovascular disease and neuraltube defects. J Inherit Metab Dis 2011;34:75–81.
36. Jacka FN, Maes M, Pasco JA, Williams LJ, Berk M. Nutrient intakesand the common mental disorders in women. J Affect Disord 2012;141:79–85.
37. Kim JM, Stewart R, Kim SW, Yang SJ, Shin IS, Yoon JS. Predictivevalue of folate, vitamin B12 and homocysteine levels in late-lifedepression. Br J Psychiatry 2008;192:268–74.
38. McCully KS. Chemical pathology of homocysteine. IV. Excitotoxicity,oxidative stress, endothelial dysfunction, and inflammation. Ann ClinLab Sci 2009;39:219–32.
39. Chou YF, Huang RF. Mitochondrial DNA deletions of bloodlymphocytes as genetic markers of low folate-related mitochondrialgenotoxicity in peripheral tissues. Eur J Nutr 2009;48:429–36.
40. Malouf R, Grimley Evans J. Folic acid with or without vitamin B12for the prevention and treatment of healthy elderly and dementedpeople. Cochrane Database Syst Rev 2008;4:CD004514.
41. Wang X, Qin X, Demirtas H, Li J, Mao G, Huo Y, Sun N, Liu L, XuX. Efficacy of folic acid supplementation in stroke prevention: a meta-analysis. Lancet 2007;369:1876–82.
42. Smith AD, Smith SM, de Jager CA, Whitbread P, Johnston C,Agacinski G, Oulhaj A, Bradley KM, Jacoby R, Refsum H.Homocysteine-lowering by B vitamins slows the rate of acceleratedbrain atrophy in mild cognitive impairment: a randomized controlledtrial. PLoS ONE 2010;5:e12244.
43. de Jager CA, Oulhaj A, Jacoby R, Refsum H, Smith AD. Cognitive andclinical outcomes of homocysteine-lowering B-vitamin treatment inmild cognitive impairment: a randomized controlled trial. Int J GeriatrPsychiatry 2012;27:592–600.
44. Clarke R, Bennett D, Parish S, Lewington S, Skeaff M, Eussen SJ,Lewerin C, Stott DJ, Armitage J, Hankey GJ, et al. Effects ofhomocysteine lowering with B vitamins on cognitive aging: meta-analysis of 11 trials with cognitive data on 22,000 individuals. Am JClin Nutr 2014;100:657–66.
45. Ford AH, Almeida OP. Effect of homocysteine lowering treatment oncognitive function: a systematic review and meta-analysis of random-ized controlled trials. J Alzheimers Dis 2012;29:133–49.
46. Stover PJ. Polymorphisms in 1-carbon metabolism, epigenetics andfolate-related pathologies. J Nutrigenet Nutrigenomics 2011;4:293–305.
47. Beaudin AE, Stover PJ. Insights into metabolic mechanisms underlyingfolate-responsive neural tube defects: a minireview. Birth Defects ResA Clin Mol Teratol 2009;85:274–84.
48. Beaudin AE, Abarinov EV, Malysheva O, Perry CA, Caudill M, StoverPJ. Dietary folate, but not choline, modifies neural tube defect risk inShmt1 knockout mice. Am J Clin Nutr 2012;95:109–14.
49. Beaudin AE, Stover PJ. Folate-mediated one-carbon metabolism andneural tube defects: balancing genome synthesis and gene expression.Birth Defects Res C Embryo Today 2007;81:183–203.
50. Copp AJ, Stanier P, Greene ND. Neural tube defects: recent advances,unsolved questions, and controversies. Lancet Neurol 2013;12:799–810.
51. MRC Vitamin Research Study Group. Prevention of neural-tubedefects—results of the Medical-Research-Council Vitamin Study. Lancet1991;338:131–7.
52. Czeizel AE, Dudas I. Prevention of the first occurrence of neural-tubedefects by periconceptional vitamin supplementation. N Engl J Med1992;327:1832–5.
53. Centers for Disease Control and Prevention, Recommendations for theuse of folic acid to reduce the number of cases of spina bifida and otherneural tube defects, Morbidity andMortality Weekly Report (MMWR)1992;41(No. RR-14):1–7.
54. McNulty HPK. Folate bioavailability. In: Bailey LB, editor. Folate inhealth and disease. 2nd ed. Boca Raton (FL): CRC Press, Taylor andFrancis Group; 2010. p. 25–47.
55. Institute of Medicine. Dietary Reference Intakes for thiamin, ribofla-vin, niacin, vitamin B6, folate, vitamin B12, pantothenic acid, biotin,and choline. Washington (DC): National Academies Press; 1998.
56. Food and Agriculture Organization; World Health Organization.Report of a joint FAO/WHO Expert Consultation. Folate and folicacid: human vitamin and mineral requirements. Rome (Italy): Foodand Agriculture Organization, World Health Organization, UnitedNations; 2004.
57. Australian Government Department of Health and Aging, National Healthand Medical Research Council. Nutrient reference values for Australia andNew Zealand including recommended dietary intakes. Canberra (Austral-ia): National Health and Medical Research Council; 2006.
58. Department of Health. Dietary reference values for food energy andnutrients for the United Kingdom. Report of the Panel on DietaryReference Values of the Committee on Medical Aspects of Food Policy.London: HMSO; 1991. Report on Health and Social Subjects No. 41.
59. Food Safety Authority of Ireland; RDAWorking Group. Recommen-ded dietary allowances for Ireland. Dublin (Ireland): Food SafetyAuthority of Ireland; 1999.
60. German Nutrition Society; Austrian Nutrition Society; Swiss Societyfor Nutrition Research; Swiss Nutrition Association. Reference valuesfor nutrient intake. 1st English ed. Frankfort/Main (Germany):Umschau Braus GmbH, German Nutrition Society; 2002.
61. Health Council of The Netherlands. Towards an optimal use of folicacid. The Hague (The Netherlands): Health Council of The Nether-lands; 2008. Publication No. 2008/02E.
62. Nordic Council of Ministers. Nordic nutrition recommendations2004: integrating nutrition and physical activity. 4th ed. Copenhagen(Denmark); 2004.
63. Barba CV, Cabrera MI. Recommended dietary allowances harmoniza-tion in Southeast Asia. Asia Pac J Clin Nutr 2008;17(Suppl 2):405–8.
64. Bailey LB, editor. Folate in health and disease. 2nd ed. Boca Raton(FL): CRC Press, Taylor and Francis Group; 2010. p. 473–4.
65. Kauwell GPA, Diaz ML, Yang Q, Bailey LB. Folate: recommendedintakes, consumption, and status. In: Bailey LB, editor. Folate in healthand disease. 2nd ed. Boca Raton (FL): CRC Press, Taylor and FrancesGroup; 2010. p. 467–90.
Biomarkers of nutrition for development—folate review 1671S
by guest on May 26, 2016
jn.nutrition.orgD
ownloaded from

66. Institute of Medicine. Using the Tolerable Upper Intake level fornutrient assessment of groups. In: Dietary Reference Intakes: appli-cations in dietary assessment. Washington (DC): National AcademiesPress; 2000. p. 113–26.
67. Pfeiffer CM, Rogers LM, Bailey LB, Gregory JF III. Absorption offolate from fortified cereal-grain products and of supplemental folateconsumed with or without food determined by using a dual-labelstable-isotope protocol. Am J Clin Nutr 1997;66:1388–97.
68. Sauberlich HE, Kretsch MJ, Skala JH, Johnson HL, Taylor PC. Folaterequirement and metabolism in nonpregnant women. Am J Clin Nutr1987;46:1016–28.
69. USDA. USDA Food and Nutrient Database for Dietary Studies.Version 1.0 [database on the Internet]. [cited 2013 Feb 25]. Availablefrom: www.ars.usda.gov/ba/bhnrc/fsrg. US Department of Agricul-ture, Agricultural Research Service; 2004.
70. FDA. Food Standards: Amendment of Standards of Identity forEnriched Grain Products to Require Addition of Folic Acid, FinalRule, 21 CFR Parts 136, 137, and 139 (1996).
71. Yang Q, Cogswell ME, Hamner HC, Carriquiry A, Bailey LB, PfeifferCM, Berry RJ. Folic acid source, usual intake, and folate and vitaminB-12 status in US adults: National Health and Nutrition ExaminationSurvey (NHANES) 2003–2006. Am J Clin Nutr 2010;91:64–72.Erratum in: Am J Clin Nutr 2010;92(4):1001.
72. Centers for Disease Control and Prevention. Second National Reporton Biochemical Indicators of Diet and Nutrition in the U.S. Popula-tion. Atlanta (GA): CDC; 2012.
73. Pfeiffer CM, Hughes JP, Durazo-Arvizu RA, Lacher DA, Sempos CT,Zhang M, Yetley EA, Johnson CL. Changes in measurement procedurefrom a radioassay to a microbiologic assay necessitate adjustment ofserum and RBC folate concentrations in the U.S. population from theNHANES 1988–2010. J Nutr 2012;142:894–900.
74. Pfeiffer CM, Osterloh JD, Kennedy-Stephenson J, Picciano MF, YetleyEA, Rader JI, Johnson CL. Trends in circulating concentrations oftotal homocysteine among US adolescents and adults: findings fromthe 1991–1994 and 1999–2004 National Health and NutritionExamination Surveys. Clin Chem 2008;54:801–13.
75. Chen LT, Rivera MA. The Costa Rican experience: reduction of neuraltube defects following food fortification programs. Nutr Rev 2004;62:S40–3.
76. Food Safety Authority of Ireland. Currently no need for mandatoryfortification—increased folate status negates mandatory folic acidfortification at this time. March 2009. [cited 2012 Nov 20]. Availablefrom: https://www.fsai.ie/details.aspx?id=7706.
77. Bower C, Miller M, Payne J, Serna P. Promotion of folate for theprevention of neural tube defects: who benefits? Paediatr PerinatEpidemiol 2005;19:435–44.
78. Crider KS, Bailey LB, Berry RJ. Folic acid food fortification-its history,effect, concerns, and future directions. Nutrients 2011;3:370–84.
79. Food Fortification Initiative. Global progress. 2012. [cited 2012 Nov 20].Available from: http://www.ffinetwork.org/global_progress/.
80. Berry R, Mullinare J, Hamner HC. Folic acid fortification: neural tubedefect risk reduction—a global perspective. In: Bailey LB, editor.Folate in health and disease. 2nd ed. Boca Raton (FL): CRC Press,Taylor and Frances Group; 2010, p. 179–204.
81. World Health Organization; Food and Agriculture Organization.Guidelines on food fortification with micronutrients, Annex 7. Geneva(Switzerland): World Health Organization, Food and AgricultureOrganization of the United Nations; 2006.
82. Hertrampf E, Cortes F. Folic acid fortification of wheat flour: Chile.Nutr Rev 2004;62(6 Pt 2):S44–8; discussion S49.
83. Food Fortification Initiative. Homepage [cited 2014 Aug 29]. Avail-able from: http://ffinetwork.org/.
84. McLean E, de Benoist B, Allen LH. Review of the magnitude of folateand vitamin B12 deficiencies worldwide. Food Nutr Bull 2008;29(2,Suppl):S38–51.
85. Flynn A, Hirvonen T, Mensink GB, Ocke MC, Serra-Majem L, Stos K,Szponar L, Tetens I, Turrini A, Fletcher R, et al. Intake of selected nutrientsfrom foods, from fortification and from supplements in various Europeancountries. Food Nutr Res 2009;53 (DOI: 10.3402/fnr.v53i0.2038).
86. Hoey L, McNulty H, Askin N, Dunne A, Ward M, Pentieva K, StrainJ, Molloy AM, Flynn CA, Scott JM. Effect of a voluntary foodfortification policy on folate, related B vitamin status, and homocys-teine in healthy adults. Am J Clin Nutr 2007;86:1405–13.
87. Kerr MA, Livingstone B, Bates CJ, Bradbury I, Scott JM, Ward M,Pentieva K, Mansoor MA, McNulty H. Folate, related B vitamins, andhomocysteine in childhood and adolescence: potential implications fordisease risk in later life. Pediatrics 2009;123:627–35.
88. Pfeiffer CM, Hughes JP, Lacher DA, Bailey RL, Berry RJ, Zhang M,Yetley EA, Rader JI, Sempos CT, Johnson CL. Estimation of trendsin serum and RBC folate in the U.S. population from pre- topostfortification using assay-adjusted data from the NHANES 1988–2010. J Nutr 2012;142:886–93.
89. De Laet C, Wautrecht JC, Brasseur D, Dramaix M, Boeynaems JM,Decuyper J, Kahn A. Plasma homocysteine concentration in a Belgianschool-age population. Am J Clin Nutr 1999;69:968–72.
90. van Beynum IM, den Heijer M, Thomas CM, Afman L, Oppenraay-van Emmerzaal D, Blom HJ. Total homocysteine and its predictors inDutch children. Am J Clin Nutr 2005;81:1110–6.
91. Papandreou D, Mavromichalis I, Makedou A, Rousso I, ArvanitidouM. Reference range of total serum homocysteine level and dietaryindexes in healthy Greek schoolchildren aged 6–15 years. Br J Nutr2006;96:719–24.
92. Sweeney MR, Staines A, Daly L, Traynor A, Daly S, Bailey SW,Alverson PB, Ayling JE, Scott JM. Persistent circulating unmetabolisedfolic acid in a setting of liberal voluntary folic acid fortification:implications for further mandatory fortification? BMC Public Health2009;9:295.
93. Troen AM, Mitchell B, Sorensen B, Wener MH, Johnston A, Wood B,Selhub J, McTiernan A, Yasui Y, Oral E, et al. Unmetabolized folicacid in plasma is associated with reduced natural killer cell cytotox-icity among postmenopausal women. J Nutr 2006;136:189–94.
94. Hirsch S, Miranda D, Munoz E, Montoya M, Ronco AM, de la MazaMP, Bunout D. Natural killer cell cytotoxicity is not regulated by folicacid in vitro. Nutrition 2013;29:772–6.
95. West AA, Yan J, Perry CA, Jiang X, Malysheva OV, Caudill MA.Folate-status response to a controlled folate intake in nonpregnant,pregnant, and lactating women. Am J Clin Nutr 2012;96:789–800.
96. Berry RJ, Bailey L, Mulinare J, Bower C, Grp FAW. Fortification offlour with folic acid. Food Nutr Bull 2010;31:S22–35.
97. Mills JL, Signore C. Neural tube defect rates before and after foodfortification with folic acid. Birth Defects Res A Clin Mol Teratol2004;70(11):844–5.
98. Berry RJ, Li Z, Erickson JD, Li S, Moore CA, Wang H, Mulinare J,Zhao P, Wong LY, Gindler J, et al. Prevention of neural-tube defectswith folic acid in China. China-U.S. Collaborative Project for NeuralTube Defect Prevention. N Engl J Med 1999;341:1485–90.
99. Crider KS, Devine O, Hao L, Dowling NF, Li S, Molloy AM, Li Z,Zhu J, Berry RJ. Population red blood cell folate concentrations forprevention of neural tube defects: Bayesian model. BMJ 2014;349:g4554.
100. Daly LE, Kirke PN, Molloy A, Weir DG, Scott JM. Folate levels andneural tube defects: implications for prevention. JAMA 1995;274:1698–702.
101. World Health Organization. Guidelines for optimal serum and redblood cell folate concentrations in women of reproductive age forprevention of neural tube defects. Geneva (Switzerland): World HealthOrganization; 2015.
102. Mosley BS, Cleves MA, Siega-Riz AM, Shaw GM, Canfield MA,Waller DK, Werler MM, Hobbs CA, Stud NBDP. Neural tube defectsand maternal folate intake among pregnancies conceived after folicacid fortification in the United States. Am J Epidemiol 2009;169:9–17.
103. Ahrens K, Yazdy MM, Mitchell AA, Werler MM. Folic acid intakeand spina bifida in the era of dietary folic acid fortification.Epidemiology 2011;22:731–7.
104. Tinker SC, Cogswell ME, Devine O, Berry RJ. Folic acid intake amongU.S. women aged 15–44 years, National Health and NutritionExamination Survey, 2003–2006. Am J Prev Med 2010;38:534–42.
105. Finer LB, Zolna MR. Unintended pregnancy in the United States:incidence and disparities, 2006. Contraception 2011;84:478–85.
106. Botto LD, Moore CA, Khoury MJ, Erickson JD. Neural-tube defects.N Engl J Med 1999;341:1509–19.
107. West AA, Caudill MA. Genetic variation: impact on folate (andcholine) bioefficacy. Int J Vitam Nutr Res 2010;80:319–29.
108. Botto LD, Yang QH. 5,10-Methylenetetrahydrofolate reductase genevariants and congenital anomalies: a HuGE review. Am J Epidemiol2000;151:862–77.
1672S Supplement
by guest on May 26, 2016
jn.nutrition.orgD
ownloaded from

109. Lopez-Camelo JS, Castilla EE, Orioli IM, Instituto Nacional deGenetica Medica Populacional, Estudio Colaborative LatinoAmericano de Malformaciones Congenitas. Folic acid flour forti-fication: impact on the frequencies of 52 congenital anomaly typesin three South American countries. Am J Med Genet A 2010;152A:2444–58.
110. Canfield MA, Collins JS, Botto LD, Williams LJ, Mai CT, Kirby RS,Pearson K, Devine O, Mulinare J, National Birth Prevention Network.Changes in the birth prevalence of selected birth defects after grainfortification with folic acid in the United States: findings from a multi-state population-based study. Birth Defects Res A Clin Mol Teratol2005;73(10):679–89.
111. Botto LD, Lisi A, Bower C, Canfield MA, Dattani N, De Vigan C, DeWalle H, Erickson DJ, Halliday J, Irgens LM, et al. Trends of selectedmalformations in relation to folic acid recommendations and fortifi-cation: an international assessment. Birth Defects Res A Clin MolTeratol 2006;76(10):693–705.
112. Ionescu-Ittu R, Marelli AJ, Mackie AS, Pilote L. Prevalence of severecongenital heart disease after folic acid fortification of grain products:time trend analysis in Quebec, Canada. BMJ 2009;338:b1673.
113. Godwin KA, Sibbald B, Bedard T, Kuzejevic B, Lowry RB, Arbour L.Changes in frequencies of select congenital anomalies since the onsetof folic acid fortification in a Canadian birth defect registry. Can JPublic Health 2008;99:271–5.
114. Fox JT, Stover PJ. Folate-mediated one-carbon metabolism. VitamHorm 2008;79:1–44.
115. Stover PJ, Field MS. Trafficking of intracellular folates. Adv Nutr2011;2:325–31.
116. Qiu A, Jansen M, Sakaris A, Min SH, Chattopadhyay S, Tsai E,Sandoval C, Zhao R, Akabas MH, Goldman ID. Identification of anintestinal folate transporter and the molecular basis for hereditaryfolate malabsorption. Cell 2006;127:917–28.
117. Zhao R, Matherly LH, Goldman ID. Membrane transporters andfolate homeostasis: intestinal absorption and transport into systemiccompartments and tissues. Expert Rev Mol Med 2009;11:e4.
118. Low PS, Kularatne SA. Folate-targeted therapeutic and imaging agentsfor cancer. Curr Opin Chem Biol 2009;13:256–62.
119. Shane B, Garrow T, Brenner A, Chen L, Choi YJ, Hsu JC, Stover P.Folylpoly-gamma-glutamate synthetase. Adv Exp Med Biol 1993;338:629–34.
120. Tibbetts AS, Appling DR. Compartmentalization of mammalian folate-mediated one-carbon metabolism. Annu Rev Nutr 2010;30:57–81.
121. Panetta JC, Wall A, Pui CH, Relling MV, Evans WE. Methotrexateintracellular disposition in acute lymphoblastic leukemia: a mathe-matical model of gamma-glutamyl hydrolase activity. Clin Cancer Res2002;8:2423–9.
122. Anderson DD, Woeller CF, Chiang EP, Shane B, Stover PJ. Serinehydroxymethyltransferase anchors de novo thymidylate synthesispathway to nuclear lamina for DNA synthesis. J Biol Chem 2012;287:7051–62.
123. Luka Z, Moss F, Loukachevitch LV, Bornhop DJ, Wagner C. Histonedemethylase LSD1 is a folate-binding protein. Biochemistry 2011;50:4750–6.
124. Miranda TB, Jones PA. DNA methylation: the nuts and bolts ofrepression. J Cell Physiol 2007;213:384–90.
125. Winter-Vann AM, Kamen BA, Bergo MO, Young SG, Melnyk S, JamesSJ, Casey PJ. Targeting Ras signaling through inhibition of carboxylmethylation: an unexpected property of methotrexate. Proc Natl AcadSci USA 2003;100:6529–34.
126. Stead LM, Jacobs RL, Brosnan ME, Brosnan JT. Methylation demandand homocysteine metabolism. Adv Enzyme Regul 2004;44:321–33.
127. Nijhout HF, Reed MC, Anderson DF, Mattingly JC, James SJ, UlrichCM. Long-range allosteric interactions between the folate andmethionine cycles stabilize DNA methylation reaction rate. Epige-netics 2006;1:81–7.
128. Wagner C. Symposium on the subcellular compartmentation of folatemetabolism. J Nutr 1996;126(4, Suppl):1228S–34S.
129. Min H, Shane B, Stokstad EL. Identification of 10-formyltetrahydro-folate dehydrogenase-hydrolase as a major folate binding protein inliver cytosol. Biochim Biophys Acta 1988;967:348–53.
130. Stover P, Schirch V. 5-Formyltetrahydrofolate polyglutamates are slowtight binding inhibitors of serine hydroxymethyltransferase. J BiolChem 1991;266:1543–50.
131. Fenech M. Folate (vitamin B9) and vitamin B12 and their function inthe maintenance of nuclear and mitochondrial genome integrity.Mutat Res 2012;733:21–33.
132. Blount BC, Mack MM, Wehr CM, MacGregor JT, Hiatt RA, Wang G,Wickramasinghe SN, Everson RB, Ames BN. Folate deficiency causesuracil misincorporation into human DNA and chromosome breakage:implications for cancer and neuronal damage. Proc Natl Acad Sci USA1997;94:3290–5.
133. Kapiszewska M, Kalemba M, Wojciech U, Milewicz T. Uracilmisincorporation into DNA of leukocytes of young women withpositive folate balance depends on plasma vitamin B12 concentrationsand methylenetetrahydrofolate reductase polymorphisms: a pilotstudy. J Nutr Biochem 2005;16:467–78.
134. van den Donk M, Pellis L, Crott JW, van Engeland M, Friederich P,Nagengast FM, van Bergeijk JD, de Boer SY, Mason JB, Kok FJ, et al.Folic acid and vitamin B-12 supplementation does not favorablyinfluence uracil incorporation and promoter methylation in rectalmucosa DNA of subjects with previous colorectal adenomas. J Nutr2007;137:2114–20.
135. Nilsen H, Stamp G, Andersen S, Hrivnak G, Krokan HE, Lindahl T,Barnes DE. Gene-targeted mice lacking the Ung uracil-DNA glyco-sylase develop B-cell lymphomas. Oncogene 2003;22:5381–6.
136. Clarke S, Banfield K. S-adenosylmethionine-dependent methyltrans-ferases. In: Carmel R, Jacobson DW, editors. Homocysteine in healthand disease. Cambridge (United Kingdom): Cambridge Press; 2001. p.63–78.
137. Herbig K, Chiang EP, Lee LR, Hills J, Shane B, Stover PJ. Cytoplasmicserine hydroxymethyltransferase mediates competition between folate-dependent deoxyribonucleotide and S-adenosylmethionine biosyntheses.J Biol Chem 2002;277:38381–9.
138. Friso S, Choi SW, Girelli D, Mason JB, Dolnikowski GG, Bagley PJ,Olivieri O, Jacques PF, Rosenberg IH, Corrocher R, et al. A commonmutation in the 5,10-methylenetetrahydrofolate reductase gene affectsgenomic DNA methylation through an interaction with folate status.Proc Natl Acad Sci USA 2002;99:5606–11.
139. Friso S, Choi SW, Dolnikowski GG, Selhub J. A method to assess genomicDNA methylation using high-performance liquid chromatography/electrospray ionization mass spectrometry. Anal Chem 2002;74:4526–31.
140. Jaenisch R, Bird A. Epigenetic regulation of gene expression: how thegenome integrates intrinsic and environmental signals. Nat Genet2003;33(Suppl):245–54.
141. Huang C, Sloan EA, Boerkoel CF. Chromatin remodeling and humandisease. Curr Opin Genet Dev 2003;13:246–52.
142. Hoffbrand AV, Herbert V. Nutritional anemias. Semin Hematol1999;36(4, Suppl 7):13–23.
143. McCarthy EA, Titus SA, Taylor SM, Jackson-Cook C, Moran RG. Amutation inactivating the mitochondrial inner membrane folatetransporter creates a glycine requirement for survival of chinesehamster cells. J Biol Chem 2004;279:33829–36.
144. Shin YS, Chan C, Vidal AJ, Brody T, Stokstad EL. Subcellularlocalization of gamma-glutamyl carboxypeptidase and of folates.Biochim Biophys Acta 1976;444:794–801.
145. Lin BF, Huang RF, Shane B. Regulation of folate and one-carbonmetabolism in mammalian cells. III. Role of mitochondrial folylpoly-gamma-glutamate synthetase. J Biol Chem 1993;268:21674–9.
146. Anderson DD, Quintero CM, Stover PJ. Identification of a de novothymidylate biosynthesis pathway in mammalian mitochondria. ProcNatl Acad Sci USA 2011;108:15163–8.
147. Bogenhagen D, Clayton DA. Mouse L cell mitochondrial DNAmolecules are selected randomly for replication throughout the cellcycle. Cell 1977;11:719–27.
148. Momb J, Lewandowski JP, Bryant JD, Fitch R, Surman DR, Vokes SA,Appling DR. Deletion of Mthfd1l causes embryonic lethality andneural tube and craniofacial defects in mice. Proc Natl Acad Sci USA2013;110:549–54.
149. Parle-McDermott A, Pangilinan F, O’Brien KK, Mills JL, Magee AM,Troendle J, Sutton M, Scott JM, Kirke PN, Molloy AM, et al. Acommon variant in MTHFD1L is associated with neural tube defectsand mRNA splicing efficiency. Hum Mutat 2009;30:1650–6.
150. Narisawa A, Komatsuzaki S, Kikuchi A, Niihori T, Aoki Y, FujiwaraK, Tanemura M, Hata A, Suzuki Y, Relton CL, et al. Mutations ingenes encoding the glycine cleavage system predispose to neural tubedefects in mice and humans. Hum Mol Genet 2012;21:1496–503.
Biomarkers of nutrition for development—folate review 1673S
by guest on May 26, 2016
jn.nutrition.orgD
ownloaded from

151. Di Pietro E, Sirois J, Tremblay ML, MacKenzie RE. MitochondrialNAD-dependent methylenetetrahydrofolate dehydrogenase-methenyltetrahydrofolate cyclohydrolase is essential for embryonicdevelopment. Mol Cell Biol 2002;22:4158–66.
152. Di Pietro E, Wang XL, MacKenzie RE. The expression of mitochondrialmethylenetetrahydrofolate dehydrogenase-cyclohydrolase supports arole in rapid cell growth. Biochim Biophys Acta 2004;1674:78–84.
153. Bolusani S, Young BA, Cole NA, Tibbetts AS, Momb J, Bryant JD,Solmonson A, Appling DR. Mammalian MTHFD2L encodes amitochondrial methylenetetrahydrofolate dehydrogenase isozyme ex-pressed in adult tissues. J Biol Chem 2011;286:5166–74.
154. Pike ST, Rajendra R, Artzt K, Appling DR. Mitochondrial C1-tetrahydrofolate synthase (MTHFD1L) supports the flow of mito-chondrial one-carbon units into the methyl cycle in embryos. J BiolChem 2010;285:4612–20.
155. Christensen KE, MacKenzie RE. Mitochondrial one-carbon metabo-lism is adapted to the specific needs of yeast, plants and mammals.BioEssays 2006;28:595–605.
156. Reed MC, Nijhout HF, Neuhouser ML, Gregory JF III, Shane B, JamesSJ, Boynton A, Ulrich CM. A mathematical model gives insights intonutritional and genetic aspects of folate-mediated one-carbon metab-olism. J Nutr 2006;136:2653–61.
157. Nijhout HF, Reed MC, Lam SL, Shane B, Gregory JF III, Ulrich CM.In silico experimentation with a model of hepatic mitochondrial folatemetabolism. Theor Biol Med Model 2006;3:40.
158. Nijhout HF, Reed MC, Budu P, Ulrich CM. A mathematical model ofthe folate cycle: new insights into folate homeostasis. J Biol Chem2004;279:55008–16.
159. Nijhout HF, Gregory JF, Fitzpatrick C, Cho E, Lamers KY, Ulrich CM,Reed MC. A mathematical model gives insights into the effectsof vitamin B-6 deficiency on 1-carbon and glutathione metabolism.J Nutr 2009;139:784–91.
160. Martinov MV, Vitvitsky VM, Banerjee R, Ataullakhanov FI. The logicof the hepatic methionine metabolic cycle. Biochim Biophys Acta2010;1804:89–96.
161. Cuskelly GJ, Stacpoole PW, Williamson J, Baumgartner TG, GregoryJF III. Deficiencies of folate and vitamin B(6) exert distinct effects onhomocysteine, serine, and methionine kinetics. Am J Physiol Endo-crinol Metab 2001;281:E1182–90.
162. Davis SR, Scheer JB, Quinlivan EP, Coats BS, Stacpoole PW, GregoryJF III. Dietary vitamin B-6 restriction does not alter rates ofhomocysteine remethylation or synthesis in healthy young womenand men. Am J Clin Nutr 2005;81:648–55.
163. Lima CP, Davis SR, Mackey AD, Scheer JB, Williamson J, Gregory JFIII. Vitamin B-6 deficiency suppresses the hepatic transsulfurationpathway but increases glutathione concentration in rats fed AIN-76Aor AIN-93G diets. J Nutr 2006;136:2141–7.
164. Davis SR, Quinlivan EP, Shelnutt KP, Ghandour H, Capdevila A,Coats BS, Wagner C, Shane B, Selhub J, Bailey LB, et al. Homocysteinesynthesis is elevated but total remethylation is unchanged by themethylenetetrahydrofolate reductase 677C->T polymorphism and bydietary folate restriction in young women. J Nutr 2005;135:1045–50.
165. Lamers Y, Coats B, Ralat M, Quinlivan EP, Stacpoole PW, Gregory JFIII. Moderate vitamin B-6 restriction does not alter postprandialmethionine cycle rates of remethylation, transmethylation, and totaltranssulfuration but increases the fractional synthesis rate of cystathi-onine in healthy young men and women. J Nutr 2011;141:835–42.
166. Lamers Y, Williamson J, Gilbert LR, Stacpoole PW, Gregory JF III.Glycine turnover and decarboxylation rate quantified in healthy menand women using primed, constant infusions of [1,2-(13)C2]glycineand [(2)H3]leucine. J Nutr 2007;137:2647–52.
167. Lamers Y, Williamson J, Ralat M, Quinlivan EP, Gilbert LR, KeelingC, Stevens RD, Newgard CB, Ueland PM, Meyer K, et al. Moderatedietary vitamin B-6 restriction raises plasma glycine and cystathionineconcentrations while minimally affecting the rates of glycine turnoverand glycine cleavage in healthy men and women. J Nutr 2009;139:452–60.
168. Oltean S, Banerjee R. Nutritional modulation of gene expression andhomocysteine utilization by vitamin B12. J Biol Chem 2003;278:20778–84.
169. Savage DG, Lindenbaum J, Stabler SP, Allen RH. Sensitivity of serummethylmalonic acid and total homocysteine determinations fordiagnosing cobalamin and folate deficiencies. Am J Med 1994;96:239–46.
170. Shane B, Stokstad EL. Vitamin B12-folate interrelationships. AnnuRev Nutr 1985;5:115–41.
171. Molloy AM. Folate-vitamin B12 interrelationships: links to diseaserisk. In: Bailey LB, editor. Folate in health and disease. 2nd ed. BocaRaton (FL): CRC Press, Taylor and Francis Group; 2010, p. 381–408.
172. Smulders YM, Smith DE, Kok RM, Teerlink T, Swinkels DW,Stehouwer CD, Jakobs C. Cellular folate vitamer distribution duringand after correction of vitamin B12 deficiency: a case for themethylfolate trap. Br J Haematol 2006;132:623–9.
173. Bjørke-Monsen AL, Torsvik I, Saetran H, Markestad T, Ueland PM.Common metabolic profile in infants indicating impaired cobalaminstatus responds to cobalamin supplementation. Pediatrics 2008;122:83–91.
174. Hure AJ, Collins CE, Smith R. A longitudinal study of maternal folateand vitamin B12 status in pregnancy and postpartum, with the sameinfant markers at 6 months of age. Matern Child Health J 2012;16:792–801.
175. Herbert V, Zalusky R. Interrelations of vitamin B12 and folic acidmetabolism: folic acid clearance studies. J Clin Invest 1962;41:1263–76.
176. Waters AH, Mollin DL. Observations on the metabolism of folic acidin pernicious anaemia. Br J Haematol 1963;9:319–27.
177. Cooper BA, Lowenstein L. Relative folate deficiency of erythrocytes inpernicious anemia and its correction with cyanocobalamin. Blood1964;24:502–21.
178. Nixon PF, Bertino JR. Impaired utilization of serum folate inpernicious anemia. A study with radiolabeled 5-methyltetrahydrofo-late. J Clin Invest 1972;51:1431–9.
179. Refsum H, Smith AD, Ueland PM, Nexo E, Clarke R, McPartlin J,Johnston C, Engbaek F, Schneede J, McPartlin C, et al. Facts andrecommendations about total homocysteine determinations: an expertopinion. Clin Chem 2004;50:3–32.
180. Suh JR, Oppenheim EW, Girgis S, Stover PJ. Purification andproperties of a folate-catabolizing enzyme. J Biol Chem 2000;275:35646–55.
181. Oppenheim EW, Adelman C, Liu X, Stover PJ. Heavy chain ferritinenhances serine hydroxymethyltransferase expression and de novothymidine biosynthesis. J Biol Chem 2001;276:19855–61.
182. Woeller CF, Fox JT, Perry C, Stover PJ. A ferritin-responsive internalribosome entry site regulates folate metabolism. J Biol Chem2007;282:29927–35.
183. Westerman DA, Evans D, Metz J. Neutrophil hypersegmentation iniron deficiency anaemia: a case-control study. Br J Haematol 1999;107:512–5.
184. Metz J. A high prevalence of biochemical evidence of vitamin B12 orfolate deficiency does not translate into a comparable prevalence ofanemia. Food Nutr Bull 2008;29(2, Suppl):S74–85.
185. Zhao R, Diop-Bove N, Visentin M, Goldman ID. Mechanisms ofmembrane transport of folates into cells and across epithelia. AnnuRev Nutr 2011;31:177–201.
186. Gregory JF III, Quinlivan EP. In vivo kinetics of folate metabolism.Annu Rev Nutr 2002;22:199–220.
187. O’Connor DL. Interaction of iron and folate during reproduction.Prog Food Nutr Sci 1991;15:231–54.
188. Herbig AK, Stover P. Regulation of folate metabolism by iron. In:Massaro EJ, Rogers JM, editors. Folate and human development.Clinton (NJ): Humana Press; 2002. p. 241–62.
189. Khambalia A, Latulippe ME, Campos C, Merlos C, Villalpando S,Picciano MF, O’Connor DL. Milk folate secretion is not impairedduring iron deficiency in humans. J Nutr 2006;136:2617–24.
190. Shin W, Yan J, Abratte CM, Vermeylen F, Caudill MA. Choline intakeexceeding current dietary recommendations preserves markers ofcellular methylation in a genetic subgroup of folate-compromisedmen. J Nutr 2010;140:975–80.
191. Shaw GM, Carmichael SL, Yang W, Selvin S, Schaffer DM.Periconceptional dietary intake of choline and betaine and neuraltube defects in offspring. Am J Epidemiol 2004;160:102–9.
192. Shaw GM, Finnell RH, Blom HJ, Carmichael SL, Vollset SE, Yang W,Ueland PM. Choline and risk of neural tube defects in a folate-fortifiedpopulation. Epidemiology 2009;20:714–9.
193. Enaw JO, Zhu H, Yang W, Lu W, Shaw GM, Lammer EJ, Finnell RH.CHKA and PCYT1A gene polymorphisms, choline intake and spinabifida risk in a California population. BMC Med 2006;4:36.
1674S Supplement
by guest on May 26, 2016
jn.nutrition.orgD
ownloaded from
194. Chew TW, Jiang X, Yan J, Wang W, Lusa AL, Carrier BJ, West AA,Malysheva OV, Brenna JT, Gregory JF III, et al. Folate intake,MTHFR genotype, and sex modulate choline metabolism in mice. JNutr 2011;141:1475–81.
195. Carmichael SL, Yang W, Shaw GM. Periconceptional nutrient intakesand risks of neural tube defects in California. Birth Defects Res A ClinMol Teratol 2010;88:670–8.
196. Kohlmeier M, da Costa KA, Fischer LM, Zeisel SH. Genetic variation offolate-mediated one-carbon transfer pathway predicts susceptibility tocholine deficiency in humans. Proc Natl Acad Sci USA 2005;102:16025–30.
197. Yan J, Wang W, Gregory JF III, Malysheva O, Brenna JT, Stabler SP,Allen RH, Caudill MA. MTHFR C677T genotype influences theisotopic enrichment of one-carbon metabolites in folate-compromisedmen consuming d9-choline. Am J Clin Nutr 2011;93:348–55.
198. Davis SR, Quinlivan EP, Shelnutt KP, Maneval DR, Ghandour H,Capdevila A, Coats BS, Wagner C, Selhub J, Bailey LB, et al. Themethylenetetrahydrofolate reductase 677C->T polymorphism anddietary folate restriction affect plasma one-carbon metabolites andred blood cell folate concentrations and distribution in women. J Nutr2005;135:1040–4.
199. Ueland PM, Holm PI, Hustad S. Betaine: a key modulator of one-carbon metabolism and homocysteine status. Clin Chem Lab Med2005;43:1069–75.
200. Caudill MA. Folate and choline interrelationships: metabolic andpotential health implications. In: Bailey LB, editor. Folate in healthand disease. 2nd ed. Boca Raton (FL): CRC Press, Taylor and FrancisGroup; 2009. p. 449–65.
201. Selhub J, Seyoum E, Pomfret EA, Zeisel SH. Effects of cholinedeficiency and methotrexate treatment upon liver folate content anddistribution. Cancer Res 1991;51:16–21.
202. Varela-Moreiras G, Ragel C, Perez de Miguelsanz J. Choline deficiencyand methotrexate treatment induces marked but reversible changes inhepatic folate concentrations, serum homocysteine and DNA methyl-ation rates in rats. J Am Coll Nutr 1995;14:480–5.
203. da Costa KA, Gaffney CE, Fischer LM, Zeisel SH. Choline deficiency inmice and humans is associated with increased plasma homocysteineconcentration after a methionine load. Am J Clin Nutr 2005;81:440–4.
204. Svardal AM, Ueland PM, Berge RK, Aarsland A, Aarsaether N,Lonning PE, Refsum H. Effect of methotrexate on homocysteine andother sulfur compounds in tissues of rats fed a normal or a defined,choline-deficient diet. Cancer Chemother Pharmacol 1988;21:313–8.
205. Pomfret EA, daCosta KA, Zeisel SH. Effects of choline deficiency andmethotrexate treatment upon rat liver. J Nutr Biochem 1990;1:533–41.
206. Varelamoreiras G, Selhub J, Dacosta KA, Zeisel SH. Effect of chroniccholine deficiency in rats on liver folate content and distribution.J Nutr Biochem 1992;3:519–22.
207. Scheer JB, Mackey AD, Gregory JF III. Activities of hepatic cytosolicand mitochondrial forms of serine hydroxymethyltransferase andhepatic glycine concentration are affected by vitamin B-6 intakein rats. J Nutr 2005;135:233–8.
208. Selhub J, Jacques PF, Wilson PW, Rush D, Rosenberg IH. Vitaminstatus and intake as primary determinants of homocysteinemia in anelderly population. JAMA 1993;270:2693–8.
209. Miller JW, Ribaya-Mercado JD, Russell RM, Shepard DC, MorrowFD, Cochary EF, Sadowski JA, Gershoff SN, Selhub J. Effect ofvitamin B-6 deficiency on fasting plasma homocysteine concentra-tions. Am J Clin Nutr 1992;55:1154–60.
210. Davis SR, Quinlivan EP, Stacpoole PW, Gregory JF III. Plasmaglutathione and cystathionine concentrations are elevated but cysteineflux is unchanged by dietary vitamin B-6 restriction in young menand women. J Nutr 2006;136:373–8.
211. da Silva VR, Ralat MA, Quinlivan EP, DeRatt BN, Garrett TJ, Chi YY,Frederik Nijhout H, Reed MC, Gregory JF III. Targeted metabolomicsand mathematical modeling demonstrate that vitamin B-6 restrictionalters one-carbon metabolism in cultured HepG2 cells. Am J PhysiolEndocrinol Metab 2014;307:E93–101.
212. Hustad S, Midttun O, Schneede J, Vollset SE, Grotmol T, Ueland PM.The methylenetetrahydrofolate reductase 677C/T polymorphism asa modulator of a B vitamin network with major effects on homocys-teine metabolism. Am J Hum Genet 2007;80:846–55.
213. Yamada K, Chen Z, Rozen R, Matthews RG. Effects of commonpolymorphisms on the properties of recombinant human methylenete-trahydrofolate reductase. Proc Natl Acad Sci USA 2001;98:14853–8.
214. Pejchal R, Campbell E, Guenther BD, Lennon BW, Matthews RG,Ludwig ML. Structural perturbations in the Ala / Val polymorphismof methylenetetrahydrofolate reductase: how binding of folates mayprotect against inactivation. Biochemistry 2006;45:4808–18.
215. Ward M, Wilson CP, Strain JJ, Horigan G, Scott JM, McNulty H. B-vitamins, methylenetetrahydrofolate reductase (MTHFR) and hyper-tension. Int J Vitam Nutr Res 2011;81:240–4.
216. Horigan G, McNulty H, Ward M, Strain JJ, Purvis J, Scott JM.Riboflavin lowers blood pressure in cardiovascular disease patientshomozygous for the 677C/T polymorphism in MTHFR. J Hypertens2010;28:478–86.
217. Wilson CP, McNulty H, Ward M, Strain JJ, Trouton TG, Hoeft BA,Weber P, Roos FF, Horigan G, McAnena L, et al. Blood pressure intreated hypertensive individuals with the MTHFR 677TT genotype isresponsive to intervention with riboflavin: findings of a targetedrandomized trial. Hypertension 2013;61:1302–8.
218. Jacques PF, Bostom AG, Williams RR, Ellison RC, Eckfeldt JH,Rosenberg IH, Selhub J, Rozen R. Relation between folate status, acommon mutation in methylenetetrahydrofolate reductase, andplasma homocysteine concentrations. Circulation 1996;93:7–9.
219. Frosst P, Blom HJ, Milos R, Goyette P, Sheppard CA, Matthews RG,Boers GJ, den Heijer M, Kluijtmans LA, van den Heuvel LP, et al. Acandidate genetic risk factor for vascular disease: a common mutationin methylenetetrahydrofolate reductase. Nat Genet 1995;10:111–3.
220. McNulty H, Dowey le RC, Strain JJ, Dunne A, Ward M, Molloy AM,McAnena LB, Hughes JP, Hannon-Fletcher M, Scott JM. Riboflavinlowers homocysteine in individuals homozygous for the MTHFR677C->T polymorphism. Circulation 2006;113:74–80.
221. Bailey SW, Ayling JE. The extremely slow and variable activity ofdihydrofolate reductase in human liver and its implications for highfolic acid intake. Proc Natl Acad Sci USA 2009;106:15424–9.
222. Lin Y, Dueker SR, Follett JR, Fadel JG, Arjomand A, Schneider PD,Miller JW, Green R, Buchholz BA, Vogel JS, et al. Quantitation of invivo human folate metabolism. Am J Clin Nutr 2004;80:680–91.
223. Metz J, Stevens K, Krawitz S, Brandt V. The plasma clearance ofinjected doses of folic acid as an index of folic acid deficiency. J ClinPathol 1961;14:622–5.
224. Zettner A, Duly PE. New evidence for a binding principle specific forfolates as a normal constituent of human serum. Clin Chem1974;20:1313–9.
225. Høier-Madsen M, Holm J, Hansen SI. alpha Isoforms of soluble andmembrane-linked folate-binding protein in human blood. Biosci Rep2008;28:153–60.
226. Waxman S, Schreiber C. Measurement of serum folate levels andserum folic acid-binding protein by 3H-PGA radioassay. Blood1973;42:281–90.
227. Thompson FE, Byers T. Dietary assessment resource manual. J Nutr1994;124(Suppl):2245S–317S.
228. Campbell VA, Dodds ML. Collecting dietary information from groupsof older people. J Am Diet Assoc 1967;51:29–33.
229. Marr JW, Heady JA. Within- and between-person variation in dietarysurveys: number of days needed to classify individuals. Hum NutrAppl Nutr 1986;40:347–64.
230. Heady JA. Diets of bank clerks—development of a method ofclassifying the diets of individuals for use in epidemiological studies.J R Stat Soc Ser A Stat Soc 1961;124(3):336–61.
231. Subar AF, Kipnis V, Troiano RP, Midthune D, Schoeller DA, Bingham S,Sharbaugh CO, Trabulsi J, Runswick S, Ballard-Barbash R, et al. Usingintake biomarkers to evaluate the extent of dietary misreporting in a largesample of adults: the OPEN study. Am J Epidemiol 2003;158:1–13.
232. Bailey RL, Dodd KW, Gahche JJ, Dwyer JT, McDowell MA, YetleyEA, Sempos CA, Burt VL, Radimer KL, Picciano MF. Total folate andfolic acid intake from foods and dietary supplements in the UnitedStates: 2003–2006. Am J Clin Nutr 2010;91:231–7.
233. Bailey RL, McDowell MA, Dodd KW, Gahche JJ, Dwyer JT, Picciano MF.Total folate and folic acid intakes from foods and dietary supplements of USchildren aged 1–13 y. Am J Clin Nutr 2010;92:353–8.
234. Bailey RL, Fulgoni VL, Keast DR, Dwyer JT. Examination of vitaminintakes among US adults by dietary supplement use. J Acad Nutr Diet2012;112:657–63.
235. Bailey RL, Fulgoni VL, Keast DR, Lentino CV, Dwyer JT. Do dietarysupplements improve micronutrient sufficiency in children and ado-lescents? J Pediatr 2012;161:837.
Biomarkers of nutrition for development—folate review 1675S
by guest on May 26, 2016
jn.nutrition.orgD
ownloaded from

236. National Cancer Institute. Measurement error webinar series [cited2014 Aug 29]. Available from: http://appliedresearch.cancer.gov/measurementerror/.
237. Dodd KW, Guenther PM, Freedman LS, Subar AF, Kipnis V, MidthuneD, Tooze JA, Krebs-Smith SM. Statistical methods for estimating usualintake of nutrients and foods: a review of the theory. J Am Diet Assoc2006;106:1640–50.
238. National Research Council. Nutrient adequacy. Washington (DC):National Academies Press; 1986.
239. Nusser SM, Carriquiry AL, Dodd KW, Fuller WA. A semiparametrictransformation approach to estimating usual daily intake distribu-tions. J Am Stat Assoc 1996;91:1440–9.
240. Subar AF, Dodd KW, Guenther PM, Kipnis V, Midthune D, McDowellM, Tooze JA, Freedman LS, Krebs-Smith SM. The Food PropensityQuestionnaire: concept, development, and validation for use as acovariate in a model to estimate usual food intake. J Am Diet Assoc2006;106:1556–63.
241. Tooze JA, Midthune D, Dodd KW, Freedman LS, Krebs-Smith SM,Subar AF, Guenther PM, Carroll RJ, Kipnis V. A new statisticalmethod for estimating the usual intake of episodically consumed foodswith application to their distribution. J Am Diet Assoc 2006;106:1575–87.
242. Carriquiry AL. Estimation of usual intake distributions of nutrientsand foods. J Nutr 2003;133(Suppl):601S–8S.
243. USDA. Composition of foods raw, processed, prepared. USDANational Nutrient Database for Standard Reference, release 25.Washington (DC): USDA; 2012.
244. Koontz JL, Phillips KM, Wunderiach KM, Exler J, Holden JM,Gebhardt SE, Haytowitz DB. Comparison of total folate concentrationsin foods determined by microbiological assay at several experienced UScommercial laboratories. J AOAC Int 2005;88:805–13.
245. Hyun TH, Tamura T. Trienzyme extraction in combination withmicrobiologic assay in food folate analysis: an updated review. ExpBiol Med (Maywood) 2005;230:444–54.
246. Yeung L, Yang Q, Berry RJ. Contributions of total daily intake of folicacid to serum folate concentrations. JAMA 2008;300:2486–7.
247. Hopkins SM, McNulty BA, Walton J, Flynn A, Molloy AM, Scott JM,McNulty H, Nugent AP, Gibney MJ. Impact of voluntary fortificationand supplement use on dietary intakes of folate and status in an Irishadult population. Proc Nutr Soc 2012;71:E38.
248. Mason JB. Biomarkers of nutrient exposure and status in one-carbon(methyl) metabolism. J Nutr 2003;133(Suppl 3):941S–7S.
249. Clifford AJ, Noceti EM, Block-Joy A, Block T, Block G. Erythrocytefolate and its response to folic acid supplementation is assaydependent in women. J Nutr 2005;135:137–43.
250. Wu A, Chanarin I, Slavin G, Levi AJ. Folate deficiency in thealcoholic–its relationship to clinical and haematological abnormali-ties, liver disease and folate stores. Br J Haematol 1975;29:469–78.
251. Jacob RA, Wu MM, Henning SM, Swendseid ME. Homocysteineincreases as folate decreases in plasma of healthy men during short-term dietary folate and methyl group restriction. J Nutr 1994;124:1072–80.
252. Kalmbach RD, Choumenkovitch SF, Troen AM, D’Agostino R,Jacques PF, Selhub J. Circulating folic acid in plasma: relation to folicacid fortification. Am J Clin Nutr 2008;88:763–8.
253. Obeid R, Kirsch SH, Kasoha M, Eckert R, Herrmann W. Concen-trations of unmetabolized folic acid and primary folate forms inplasma after folic acid treatment in older adults. Metabolism 2011;60:673–80.
254. Pfeiffer CM, Fazili Z, McCoy L, Zhang M, Gunter EW. Determinationof folate vitamers in human serum by stable-isotope-dilution tandemmass spectrometry and comparison with radioassay and microbiologicassay. Clin Chem 2004;50:423–32.
255. Guinotte CL, Burns MG, Axume JA, Hata H, Urrutia TF, Alamilla A,McCabe D, Singgih A, Cogger EA, Caudill MA. Methylenetetrahydro-folate reductase 677C/T variant modulates folate status response tocontrolled folate intakes in young women. J Nutr 2003;133:1272–80.
256. Fukuwatari T, Shibata K. Urinary water-soluble vitamins and theirmetabolite contents as nutritional markers for evaluating vitaminintakes in young Japanese women. J Nutr Sci Vitaminol (Tokyo)2008;54:223–9.
257. Gregory JF III. Case study: folate bioavailability. J Nutr 2001;131(4,Suppl):1376S–82S.
258. Caudill MA, Bailey LB, Gregory JF III. Consumption of the folatebreakdown product para-aminobenzoylglutamate contributes mini-mally to urinary folate catabolite excretion in humans: investigationusing [(13)C(5)]para-aminobenzoylglutamate. J Nutr 2002;132:2613–6.
259. Wolfe JM, Bailey LB, Herrlinger-Garcia K, Theriaque DW, Gregory JFIII, Kauwell GP. Folate catabolite excretion is responsive to changesin dietary folate intake in elderly women. Am J Clin Nutr 2003;77:919–23.
260. Kownacki-Brown PA, Wang C, Bailey LB, Toth JP, Gregory JF III.Urinary excretion of deuterium-labeled folate and the metabolitep-aminobenzoylglutamate in humans. J Nutr 1993;123:1101–8.
261. Gregory JF III, Swendseid ME, Jacob RA. Urinary excretion of folatecatabolites responds to changes in folate intake more slowly thanplasma folate and homocysteine concentrations and lymphocyte DNAmethylation in postmenopausal women. J Nutr 2000;130:2949–52.
262. Stover PJ. One-carbon metabolism-genome interactions in folate-associated pathologies. J Nutr 2009;139:2402–5.
263. Yehezkel S, Shaked R, Sagie S, Berkovitz R, Shachar-Bener H, Segev Y,Selig S. Characterization and rescue of telomeric abnormalities in ICFsyndrome type I fibroblasts. Front Oncol 2013;3:35.
264. Jones PA. Functions of DNA methylation: islands, start sites, genebodies and beyond. Nat Rev Genet 2012;13:484–92.
265. Kim YI. Nutritional epigenetics: impact of folate deficiency on DNAmethylation and colon cancer susceptibility. J Nutr 2005;135:2703–9.
266. McGlynn AP, Wasson GR, O’Reilly SL, McNulty H, Downes CS,Chang CK, Hoey L, Molloy AM, Ward M, Strain JJ, et al. Lowcolonocyte folate is associated with uracil misincorporation and globalDNA hypomethylation in human colorectum. J Nutr 2013;143:27–33.
267. Liu J, Hesson LB, Meagher AP, Bourke MJ, Hawkins NJ, Rand KN,Molloy PL, Pimanda JE, Ward RL. Relative distribution of folatespecies is associated with global DNA methylation in human colorec-tal mucosa. Cancer Prev Res (Phila) 2012;5:921–9.
268. Crider KS, Yang TP, Berry RJ, Bailey LB. Folate and DNA methyl-ation: a review of molecular mechanisms and the evidence of folate’srole. Adv Nutr 2012;3:21–38.
269. Kraunz KS, Hsiung D, McClean MD, Liu M, Osanyingbemi J, NelsonHH, Kelsey KT. Dietary folate is associated with p16(INK4A)methylation in head and neck squamous cell carcinoma. Int J Cancer2006;119:1553–7.
270. Duthie SJ, Narayanan S, Blum S, Pirie L, Brand GM. Folate deficiencyin vitro induces uracil misincorporation and DNA hypomethylationand inhibits DNA excision repair in immortalized normal humancolon epithelial cells. Nutr Cancer 2000;37:245–51.
271. Piyathilake CJ, Johanning GL, Macaluso M, Whiteside M, Oelschl-ager DK, Heimburger DC, Grizzle WE. Localized folate and vitaminB-12 deficiency in squamous cell lung cancer is associated with globalDNA hypomethylation. Nutr Cancer 2000;37:99–107.
272. Stern LL, Mason JB, Selhub J, Choi SW. Genomic DNA hypomethy-lation, a characteristic of most cancers, is present in peripheralleukocytes of individuals who are homozygous for the C677Tpolymorphism in the methylenetetrahydrofolate reductase gene. Can-cer Epidemiol Biomarkers Prev 2000;9:849–53.
273. Rampersaud GC, Kauwell GP, Hutson AD, Cerda JJ, Bailey LB.Genomic DNA methylation decreases in response to moderate folatedepletion in elderly women. Am J Clin Nutr 2000;72:998–1003.
274. Jacob RA, Gretz DM, Taylor PC, James SJ, Pogribny IP, Miller BJ,Henning SM, Swendseid ME. Moderate folate depletion increasesplasma homocysteine and decreases lymphocyte DNA methylation inpostmenopausal women. J Nutr 1998;128:1204–12.
275. Axume J, Smith SS, Pogribny IP, Moriarty DJ, Caudill MA. Globalleukocyte DNA methylation is similar in African American andCaucasian women under conditions of controlled folate intake.Epigenetics 2007;2:66–8.
276. Shelnutt KP, Kauwell GP, Gregory JF III, Maneval DR, Quinlivan EP,Theriaque DW, Henderson GN, Bailey LB. Methylenetetrahydrofolatereductase 677C/T polymorphism affects DNA methylation inresponse to controlled folate intake in young women. J Nutr Biochem2004;15:554–60.
277. Fenech M, Crott JW. Micronuclei, nucleoplasmic bridges and nuclearbuds induced in folic acid deficient human lymphocytes—evidence forbreakage-fusion-bridge cycles in the cytokinesis-block micronucleusassay. Mutat Res 2002;504:131–6.
1676S Supplement
by guest on May 26, 2016
jn.nutrition.orgD
ownloaded from

278. Fenech M, Rinaldi J. The relationship between micronuclei in human-lymphocytes and plasma-levels of vitamin-C, vitamin-E, vitamin-B-12and folic-acid. Carcinogenesis 1994;15:1405–11.
279. Fenech M, Baghurst P, Luderer W, Turner J, Record S, Ceppi M,Bonassi S. Low intake of calcium, folate, nicotinic acid, vitamin E,retinol, beta-carotene and high intake of pantothenic acid, biotin andriboflavin are significantly associated with increased genome instabil-ity—results from a dietary intake and micronucleus index survey inSouth Australia. Carcinogenesis 2005;26:991–9.
280. Andreassi MG, Botto N, Cocci F, Battaglia D, Antonioli E, Masetti S,Manfredi S, Colombo MG, Biagini A, Clerico A. Methylenetetrahy-drofolate reductase gene C677T polymorphism, homocysteine, vita-min B12, and DNA damage in coronary artery disease. Hum Genet2003;112:171–7.
281. Fenech M. Micronucleus frequency in human lymphocytes is relatedto plasma vitamin B12 and homocysteine. Mutat Res 1999;428:299–304.
282. MacGregor JT, Wehr CM, Hiatt RA, Peters B, Tucker JD, LangloisRG, Jacob RA, Jensen RH, Yager JW, Shigenaga MK, et al. ’Spon-taneous’ genetic damage in man: evaluation of interindividual varia-bility, relationship among markers of damage, and influence ofnutritional status. Mutat Res 1997;377:125–35.
283. Kliemann M, Pra D, Muller LL, Hermes L, Horta JA, Reckziegel MB,Burgos MS, Maluf SW, Franke SIR, da Silva J. DNA damage inchildren and adolescents with cardiovascular disease risk factors. AnAcad Bras Cienc 2012;84:833–40.
284. Fenech MF, Dreosti IE, Rinaldi JR. Folate, vitamin B12, homocysteinestatus and chromosome damage rate in lymphocytes of older men.Carcinogenesis 1997;18:1329–36.
285. Fenech M, Aitken C, Rinaldi J. Folate, vitamin B12, homocysteinestatus and DNA damage in young Australian adults. Carcinogenesis1998;19:1163–71.
286. Titenko-Holland N, Jacob RA, Shang N, Balaraman A, Smith MT.Micronuclei in lymphocytes and exfoliated buccal cells of postmen-opausal women with dietary changes in folate. Mutat Res 1998;417:101–14.
287. Stopper H, Treutlein AT, Bahner U, Schupp N, Schmid U, Brink A,Perna A, Heidland A. Reduction of the genomic damage level inhaemodialysis patients by folic acid and vitamin B12 supplementation.Nephrol Dial Transplant 2008;23:3272–9.
288. Fenech M, Bonassi S. The effect of age, gender, diet and lifestyle onDNA damage measured using micronucleus frequency in humanperipheral blood lymphocytes. Mutagenesis 2011;26:43–9.
289. Fenech M, Holland N, Chang WP, Zeiger E, Bonassi S. The HUmanMicroNucleus Project—an international collaborative study on theuse of the micronucleus technique for measuring DNA damage inhumans. Mutat Res 1999;428:271–83.
290. Rossnerova A, Spatova M, Schunck C, Sram RJ. Automated scoring oflymphocyte micronuclei by the MetaSystems Metafer image cytometrysystem and its application in studies of human mutagen sensitivity andbiodosimetry of genotoxin exposure. Mutagenesis 2011;26:169–75.
291. Decordier I, Papine A, Vande Loock K, Plas G, Soussaline F, Kirsch-Volders M. Automated image analysis of micronuclei by IMSTAR forbiomonitoring. Mutagenesis 2011;26:163–8.
292. Shane B. Folate chemistry and metabolism. In: Bailey LB, editor.Folate in health and disease. 2nd ed. Boca Raton (FL): CRC Press,Taylor and Francis Group; 2010. p. 1–24.
293. Fazili Z, Pfeiffer CM. Accounting for an isobaric interference allowscorrect determination of folate vitamers in serum by isotope dilution-liquid chromatography-tandem MS. J Nutr 2013;143:108–13.
294. Fazili Z, Pfeiffer CM, Zhang M. Comparison of serum folate speciesanalyzed by LC-MS/MS with total folate measured by microbiologicassay and Bio-Rad radioassay. Clin Chem 2007;53:781–4.
295. De Brouwer V, Zhang GF, Storozhenko S, Straeten DV, Lambert WE.pH stability of individual folates during critical sample preparationsteps in prevision of the analysis of plant folates. Phytochem Anal2007;18:496–508.
296. Gregory JF III. Chemical and nutritional aspects of folate research:analytical procedures, methods of folate synthesis, stability, andbioavailability of dietary folates. Adv Food Nutr Res 1989;33:1–101.
297. Foo SK, Cichowicz DJ, Shane B. Cleavage of naturally-occurringfolates to unsubstituted para-aminobenzoylpoly-gamma-glutamates.Anal Biochem 1980;107:109–15.
298. Gapski GR, Whiteley JM, Huennekens FM. Hydroxylated derivativesof 5-methyl-5,6,7,8-tetrahydrofolate. Biochemistry 1971;10:2930–4.
299. Jongejan JAMH, Berends W. Autoxidation of 5-alkyl-tetrahydropteridinesthe oxidation product of 5-methyl-THF. In: Proceedings of the SixthInternational Symposium on the Chemistry and Biology of Pteridines;1978 Sep 25–28; La Jolla, CA. New York: Elsevier/North-Holland;1979.
300. Fazili Z, Whitehead RD Jr., Paladugula N, Pfeiffer CM. A high-throughput LC-MS/MS method suitable for population biomonitoringmeasures five serum folate vitamers and one oxidation product. AnalBioanal Chem 2013;405:4549–60.
301. Reed LS, Archer MC. Oxidation of tetrahydrofolic acid by air. J AgricFood Chem 1980;28:801–5.
302. Robinson DR. The nonenzymatic hydrolysis of N5,N10-methenyltetrahydrofolic acid and related reactions. In: Chytil F,editor. Methods in enzymology. New York: Academic Press; 1971.p. 716–25.
303. Gregory JF, Ristow KA, Sartain DB, Damron BL. Biological-activity ofthe folacin oxidation-products 10-formylfolic acid and 5-methyl-5,6-dihydrofolic acid. J Agric Food Chem 1984;32:1337–42.
304. Yetley EA, Johnson CL. Folate and vitamin B-12 biomarkers inNHANES: history of their measurement and use. Am J Clin Nutr2011;94(Suppl):322S–31S.
305. Pfeiffer CM, Zhang M, Lacher DA, Molloy AM, Tamura T, Yetley EA,Picciano MF, Johnson CL. Comparison of serum and red blood cellfolate microbiologic assays for national population surveys. J Nutr2011;141:1402–9.
306. Centers for Disease Control and Prevention; National Center forHealth Statistics. Serum and red blood cell folate [cited 2014 Aug 29].Available from: http://www.cdc.gov/nchs/nhanes/nhanes2009–2010/FOLATE_F.htm.
307. Davis RE, Nicol DJ, Kelly A. An automated method for measurementof folate activity. J Clin Pathol 1970;23:47–53.
308. Grossowicz N, Waxman S, Schreiber C. Cryoprotected lactobacillus-casei—an approach to standardization of microbiological assay offolic-acid in serum. Clin Chem 1981;27:745–7.
309. Newman EM, Tsai JF. Microbiological analysis of 5-formyltetrahy-drofolic acid and other folates using an automatic 96-well plate reader.Anal Biochem 1986;154:509–15.
310. Horne DW. Microbiological assay of folates in 96-well microtiterplates. Vitamins and Coenzymes. Pt K 1997;281:38–43.
311. Molloy AM, Scott JM. Microbiological assay for serum, plasma, andred cell folate using cryopreserved, microtiter plate method. MethodsEnzymol 1997;281:43–53.
312. O’Broin S, Kelleher B. Microbiological assay on microtitre plates offolate in serum and red-cells. J Clin Pathol 1992;45:344–7.
313. O’Broin SD, Kelleher BP, Davoren A, Gunter EW. Field-studyscreening of blood folate concentrations: specimen stability andfinger-stick sampling. Am J Clin Nutr 1997;66:1398–405.
314. O’Broin SD, Gunter EW. Screening of folate status with use of driedblood spots on filter paper. Am J Clin Nutr 1999;70:359–67.
315. Rabinowitz DJ, Zhang M, Paladugula N, LaVoie DJ, Pfeiffer CM. Afresh look at the folate microbiological assay, including dried bloodspots and preanalytical conditions for whole blood samples. ClinChem 2009;55:A227–8.
316. Wilson DH, Williams G, Herrmann R, Wiesner D, Brookhart P. Issuesin immunoassay standardization: the ARCHITECT folate model forintermethod harmonization. Clin Chem 2005;51:684–7.
317. Shane B, Tamura T, Stokstad ELR. Folate assay—comparison ofradioassay and microbiological methods. Clin Chim Acta 1980;100:13–9.
318. Gregory JF, Sartain DB, Day BPF. Fluorometric determination offolacin in biological materials using high-performance liquid chroma-tography. J Nutr 1984;114:341–53.
319. Bagley PJ, Selhub J. Analysis of folates using combined affinity andion-pair chromatography. Methods Enzymol 1997;281:16–25.
320. Bagley PJ, Selhub J. Analysis of folate form distribution by affinityfollowed by reversed-phase chromatography with electrical detection.Clin Chem 2000;46:404–11.
321. Nelson BC, Pfeiffer CM, Margolis SA, Nelson CP. Solid-phaseextraction-electrospray ionization mass spectrometry for the quanti-fication of folate in human plasma or serum. Anal Biochem 2004;325:41–51.
Biomarkers of nutrition for development—folate review 1677S
by guest on May 26, 2016
jn.nutrition.orgD
ownloaded from

322. Hannisdal R, Ueland PM, Svardal A. Liquid chromatography-tandemmass spectrometry analysis of folate and folate catabolites in humanserum. Clin Chem 2009;55:1147–54.
323. Raiten DJ, Fisher KD. Assessment of folate methodology used in theThird National Health and Nutrition Examination Survey (NHANESIII, 1988–1994). J Nutr 1995;125:1371S–98S.
324. Herbert V. Making sense of laboratory tests of folate status: folaterequirements to sustain normality. Am J Hematol 1987;26:199–207.
325. Gibson RS. Principles of nutritional assessment. 2nd ed. New York:Oxford Press; 2005.
326. Selhub J, Jacques PF, Dallal G, Choumenkovitch S, Rogers G. The useof blood concentrations of vitamins and their respective functionalindicators to define folate and vitamin B12 status. Food Nutr Bull2008;29(2, Suppl):S67–73.
327. de Benoist B. Conclusions of a WHO Technical Consultation on folateand vitamin B12 deficiencies. Food Nutr Bull 2008;29(2, Suppl):S238–44.
328. Kelly P, McPartlin J, Goggins M, Weir DG, Scott JM. Unmetabolizedfolic acid in serum: acute studies in subjects consuming fortified foodand supplements. Am J Clin Nutr 1997;65:1790–5.
329. Mansoor MA, Svardal AM, Ueland PM. Determination of the in vivoredox status of cysteine, cysteinylglycine, homocysteine, and glutathi-one in human plasma. Anal Biochem 1992;200:218–29.
330. Mudd SH, Finkelstein JD, Refsum H, Ueland PM, Malinow MR,Lentz SR, Jacobsen DW, Brattstrom L, Wilcken B, Wilcken DE, et al.Homocysteine and its disulfide derivatives: a suggested consensusterminology. Arterioscler Thromb Vasc Biol 2000;20:1704–6.
331. Mansoor MA, Ueland PM, Aarsland A, Svardal AM. Redox status andprotein binding of plasma homocysteine and other aminothiols inpatients with homocystinuria. Metabolism 1993;42:1481–5.
332. Ducros V, Demuth K, Sauvant MP, Quillard M, Causse E,Candito M, Read MH, Drai J, Garcia I, Gerhardt MF, et al.Methods for homocysteine analysis and biological relevance ofthe results. J Chromatogr B Analyt Technol Biomed Life Sci2002;781:207–26.
333. Shipchandler MT, Moore EG. Rapid, fully automated measurement ofplasma homocyst(e)ine with the Abbott IMx analyzer. Clin Chem1995;41:991–4.
334. Yetley EA, Pfeiffer CM, Phinney KW, Bailey RL, Blackmore S, Bock JL,Brody LC, Carmel R, Curtin LR, Durazo-Arvizu RA, et al. Biomarkersof vitamin B-12 status in NHANES: a roundtable summary. Am J ClinNutr 2011;94(Suppl):313S–21S.
335. Pfeiffer CM, Huff DL, Gunter EW. Rapid and accurate HPLC assayfor plasma total homocysteine and cysteine in a clinical laboratorysetting. Clin Chem 1999;45:290–2.
336. Tan Y, Tang L, Sun X, Zhang N, Han Q, Xu M, Baranov E, Tan X,Tan X, Rashidi B, et al. Total-homocysteine enzymatic assay. ClinChem 2000;46:1686–8.
337. Tan Y, Hoffman RM. A highly sensitive single-enzyme homocysteineassay. Nat Protoc 2008;3:1388–94.
338. Kellogg MD, Parker R, Ricupero A, Rifai N. Evaluation of anenzymatic homocysteine assay for the Hitachi series chemistryanalyzer. Clin Chim Acta 2005;354:117–22.
339. Dou C, Xia D, Zhang L, Chen X, Flores P, Datta A, Yuan C.Development of a novel enzymatic cycling assay for total homocys-teine. Clin Chem 2005;51:1987–9.
340. Gempel K, Gerbitz KD, Casetta B, Bauer MF. Rapid determination oftotal homocysteine in blood spots by liquid chromatography-electrospray ionization-tandem mass spectrometry. Clin Chem2000;46:122–3.
341. Turgeon CT, Magera MJ, Cuthbert CD, Loken PR, Gavrilov DK,Tortorelli S, Raymond KM, Oglesbee D, Rinaldo P, Matern D.Determination of total homocysteine, methylmalonic acid, and 2-methylcitric acid in dried blood spots by tandem mass spectrometry.Clin Chem 2010;56:1686–95.
342. Casetta B. Determination of total homocysteine in plasma using liquidchromatography coupled to tandem mass spectrometry (LC/MS/MS).Methods Mol Biol 2010;603:253–60.
343. Windelberg A, Arseth O, Kvalheim G, Ueland PM. Automated assayfor the determination of methylmalonic acid, total homocysteine, andrelated amino acids in human serum or plasma by means ofmethylchloroformate derivatization and gas chromatography-massspectrometry. Clin Chem 2005;51:2103–9.
344. Hustad S, Ueland PM, Vollset SE, Zhang Y, Bjorke-Monsen AL,Schneede J. Riboflavin as a determinant of plasma total homocysteine:effect modification by the methylenetetrahydrofolate reductase C677Tpolymorphism. Clin Chem 2000;46:1065–71.
345. Wollesen F, Brattstrom L, Refsum H, Ueland PM, Berglund L, BerneC. Plasma total homocysteine and cysteine in relation to glomerularfiltration rate in diabetes mellitus. Kidney Int 1999;55:1028–35.
346. Clarke R, Halsey J, Lewington S, Lonn E, Armitage J, Manson JE,Bonaa KH, Spence JD, Nygard O, Jamison R, et al. Effects of loweringhomocysteine levels with B vitamins on cardiovascular disease, cancer,and cause-specific mortality: meta-analysis of 8 randomized trialsinvolving 37 485 individuals. Arch Intern Med 2010;170:1622–31.
347. Clarke R, Bennett DA, Parish S, Verhoef P, Dotsch-Klerk M, LathropM, Xu P, Nordestgaard BG, Holm H, Hopewell JC, et al. Homocys-teine and coronary heart disease: meta-analysis of MTHFR case-control studies, avoiding publication bias. PLoS Med 2012;9:e1001177.
348. Myers GL, Christenson RH, Cushman M, Ballantyne CM, CooperGR, Pfeiffer CM, Grundy SM, Labarthe DR, Levy D, Rifai N, et al.National Academy of Clinical Biochemistry Laboratory MedicinePractice guidelines: emerging biomarkers for primary prevention ofcardiovascular disease. Clin Chem 2009;55:378–84.
349. Centers for Disease Control and Prevention. Survey toolkit fornutritional assessment. Hosted by the Micronutrient Initiative. Avail-able from: http://www.micronutrient.org/nutritiontoolkit/.
350. Bock JL, Endres DB, Elin RJ, Wang E, Rosenzweig B, Klee GG.Comparison of fresh frozen serum to traditional proficiency testingmaterial in a College of American Pathologists survey for ferritin,folate, and vitamin B12. Arch Pathol Lab Med 2005;129:323–7.
351. Satterfield MB, Sniegoski LT, Sharpless KE, Welch MJ, Hornikova A,Zhang NF, Pfeiffer CM, Fazili Z, Zhang M, Nelson BC. Developmentof a new standard reference material: SRM 1955 (homocysteine andfolate in human serum). Anal Bioanal Chem 2006;385:612–22.
352. Thorpe SJ, Heath A, Blackmore S, Lee A, Hamilton M, O’Broin S,Nelson BC, Pfeiffer C. International standard for serum vitamin B(12)and serum folate: international collaborative study to evaluate a batchof lyophilised serum for B(12) and folate content. Clin Chem Lab Med2007;45:380–6.
353. US National Institute of Standards and Technology. Standard refer-ence materials [cited 2013 Aug 23]. Available from: http://www.nist.gov/srm/index.cfm.
354. UK National Institute for Biological Standards and Control. Biologicalreference materials and reagents [cited 2013 Aug 23]. Available from:http://www.nibsc.org/products/biological_reference_materials.aspx.
355. Blackmore S, Pfeiffer CM, Lee A, Fazili Z, Hamilton MS. Isotopedilution-LC-MS/MS reference method assessment of serum folateassay accuracy and proficiency testing consensus mean. Clin Chem2011;57:986–94.
356. La’ulu SL, Rawlins ML, Pfeiffer CM, Zhang M, Roberts WL.Performance characteristics of six homocysteine assays. Am J ClinPathol 2008;130:969–75.
357. Hanson NQ, Eckfeldt JH, Schwichtenberg K, Aras O, Tsai MY.Interlaboratory variation of plasma total homocysteine measurements:results of three successive homocysteine proficiency testing surveys.Clin Chem 2002;48:1539–45.
358. Pfeiffer CM, Huff DL, Smith SJ, Miller DT, Gunter EW. Comparisonof plasma total homocysteine measurements in 14 laboratories: aninternational study. Clin Chem 1999;45:1261–8.
359. Nelson BC, Pfeiffer CM, Sniegoski LT, Satterfield MB. Developmentand evaluation of an isotope dilution LC/MS method for thedetermination of total homocysteine in human plasma. Anal Chem2003;75:775–84.
360. Nelson BC, Satterfield MB, Sniegoski LT, Welch MJ. Simultaneousquantification of homocysteine and folate in human serum or plasmausing liquid chromatography/tandem mass spectrometry. Anal Chem2005;77:3586–93.
361. Nelson BC, Pfeiffer CM, Zhang M, Duewer DL, Sharpless KE, LippaKA. Commutability of NIST SRM 1955 Homocysteine and Folate inFrozen Human Serum with selected total homocysteine immunoassaysand enzymatic assays. Clin Chim Acta 2008;395:99–105.
362. Haynes BM, Pfeiffer CM, Sternberg MR, Schleicher RL. Selectedphysiologic variables are weakly to moderately associated with 29biomarkers of diet and nutrition, NHANES 2003–2006. J Nutr2013;143(Suppl):1001S–10S.
1678S Supplement
by guest on May 26, 2016
jn.nutrition.orgD
ownloaded from

363. Fazili Z, Pfeiffer CM. Measurement of folates in serum and conven-tionally prepared whole blood lysates: application of an automated96-well plate isotope-dilution tandem mass spectrometry method. ClinChem 2004;50:2378–81.
364. O’Broin JD, Temperley IJ, Scott JM. Erythrocyte, plasma, and serumfolate: specimen stability before microbiological assay. Clin Chem1980;26:522–4.
365. Zhang DJ, Elswick RK, Miller WG, Bailey JL. Effect of serum-clotcontact time on clinical chemistry laboratory results. Clin Chem1998;44:1325–33.
366. Drammeh BS, Schleicher RL, Pfeiffer CM, Jain RB, Zhang M, NguyenPH. Effects of delayed sample processing and freezing on serumconcentrations of selected nutritional indicators. Clin Chem 2008;54:1883–91.
367. Hannisdal R, Ueland PM, Eussen SJ, Svardal A, Hustad S. Analyticalrecovery of folate degradation products formed in human serum andplasma at room temperature. J Nutr 2009;139:1415–8.
368. Clement NF, Kendall BS. Effect of light on vitamin B12 and folate.Labmedicine 2009;40:657–9.
369. Fazili Z, Sternberg MR, Pfeiffer CM. Assessing the influence of 5,10-methylenetetrahydrofolate reductase polymorphism on folate stabilityduring long-term frozen storage, thawing, and repeated freeze/thawingof whole blood. Clin Chim Acta 2012;413:966–72.
370. Lacher DAHJ, Carroll MD. Biological variation of laboratory analytesbased on the 1999–2002 National Health and Nutrition ExaminationSurvey. Hyattsville (MD): National Center for Health Statistics; 2010.National Health Statistics Report No. 21.
371. Hustad S, Eussen S, Midttun O, Ulvik A, van de Kant PM, Morkrid L,Gislefoss R, Ueland PM. Kinetic modeling of storage effects onbiomarkers related to B vitamin status and one-carbon metabolism.Clin Chem 2012;58:402–10.
372. Hannisdal R, Gislefoss RE, Grimsrud TK, Hustad S, Morkrid L,Ueland PM. Analytical recovery of folate and its degradation productsin human serum stored at -25 degrees C for up to 29 years. J Nutr2010;140:522–6.
373. Whitehead VM. Pharmacokinetics and physiological disposition offolate and its derivatives. In: Blakley RL, Whitehead VM, editors.Folates and pterins. New York: Wiley; 1986. p. 177–206.
374. Scott JM, Weir DG. Excretion of folates, pterins, and their metabolicproducts. In: Blakley RL, Whitehead VM, editors. Folates and pterins.New York: Wiley; 1986. p. 297–324.
375. Whitehead VM, Kamen BA, Beaulieu D. Levels of dihydrofolatereductase in livers of birds, animals, primates, and man. Cancer DrugDeliv 1987;4:185–9.
376. Lucock MD, Wild J, Smithells RW, Hartley R. In vivo characterizationof the absorption and biotransformation of pteroylmonoglutamic acidin man: a model for future studies. Biochem Med Metab Biol1989;42:30–42.
377. Gregory JF III, Toth JP. Chemical synthesis of deuterated folatemonoglutamate and in vivo assessment of urinary excretion ofdeuterated folates in man. Anal Biochem 1988;170:94–104.
378. Kalmbach R, Paul L, Selhub J. Determination of unmetabolized folicacid in human plasma using affinity HPLC. Am J Clin Nutr2011;94:343S–7S.
379. Kelly P, McPartlin J, Scott J. A combined high-performance liquidchromatographic-microbiological assay for serum folic acid. AnalBiochem 1996;238:179–83.
380. Sweeney MR, McPartlin J, Weir DG, Scott JM. Measurements of sub-nanomolar concentrations of unmetabolised folic acid in serum.J Chromatogr B Analyt Technol Biomed Life Sci 2003;788:187–91.
381. Caudill MA, Gregory JF, Hutson AD, Bailey LB. Folate catabolismin pregnant and nonpregnant women with controlled folate intakes.J Nutr 1998;128:204–8.
382. Sokoro AA, Etter ML, Lepage J, Weist B, Eichhorst J, Lehotay DC. Simplemethod for the quantitative analysis of endogenous folate catabolitesp-aminobenzoylglutamate (pABG) and its acetamido (apABG) derivativein human serum and urine by liquid chromatography-tandemmass spectrometry. J Chromatogr B Analyt Technol Biomed Life Sci2006;832:9–16.
383. Niesser M, Harder U, Koletzko B, Peissner W. Quantification ofurinary folate catabolites using liquid chromatography-tandem massspectrometry. J Chromatogr B Analyt Technol Biomed Life Sci 2013;929:116–24.
384. Niesser M, Demmelmair H, Weith T, Moretti D, Rauh-Pfeiffer A, vanLipzig M, Vaes W, Koletzko B, Peissner W. Folate catabolites in spoturine as non-invasive biomarkers of folate status during habitualintake and folic acid supplementation. PLoS ONE 2013;8:e56194.
385. Torano EG, Petrus S, Fernandez AF, Fraga MF. Global DNAhypomethylation in cancer: review of validated methods and clinicalsignificance. Clin Chem Lab Med 2012;50:1733–42.
386. Pfarr W, Webersinke G, Paar C, Wechselberger C. Immunodetection of5 ’-methylcytosine on Giemsa-stained chromosomes. Biotechniques2005;38:527–8, 530.
387. Nakkuntod J, Avihingsanon Y, Mutirangura A, Hirankarn N.Hypomethylation of LINE-1 but not Alu in lymphocyte subsets ofsystemic lupus erythematosus patients. Clin Chim Acta 2011;412:1457–61.
388. Li Y, Chen GB, Ma LN, Ohms SJ, Sun C, Shannon MF, Fan JY.Plasticity of DNA methylation in mouse T cell activation anddifferentiation. BMC Mol Biol 2012;13:16.
389. Kramer TR, Moore RJ, Shippee RL, Friedl KE, Martinez Lopez L,Chan MM, Askew EW. Effects of food restriction in military trainingon T-lymphocyte responses. Int J Sports Med 1997;18:S84–90.
390. Garcıa-Dabrio MC, Pujol-Moix N, Martinez-Perez A, Fontcuberta J,Souto JC, Soria JM, Nomdedeu JF. Influence of age, gender andlifestyle in lymphocyte subsets: report from the Spanish Gait-2 Study.Acta Haematol 2012;127:244–9.
391. Li Q, Morimoto K, Nakadai A, Qu TL, Matsushima H, Katsumata M,Shimizu T, Inagaki H, Hirata Y, Hirata K, et al. Healthy lifestyles areassociated with higher levels of perforin, granulysin and granzymes A/B-expressing cells in peripheral blood lymphocytes. Prev Med2007;44:117–23.
392. Balaghi M, Wagner C. DNA methylation in folate-deficiency—use ofCpg methylase. Biochem Biophys Res Commun 1993;193:1184–90.
393. Sandhu J, Kaur B, Armstrong C, Talbot CJ, Steward WP, Farmer PB,Singh R. Determination of 5-methyl-2 ’-deoxycytidine in genomicDNA using high performance liquid chromatography-ultravioletdetection. J Chromatogr B Analyt Technol Biomed Life Sci 2009;877:1957–61.
394. Beck CR, Garcia-Perez JL, Badge RM, Moran JV. LINE-1 elementsin structural variation and disease. Annu Rev Genomics Hum2011;12:187–215.
395. Yang AS, Estecio MRH, Doshi K, Kondo Y, Tajara EH, Issa JPJ. Asimple method for estimating global DNA methylation using bisulfitePCR of repetitive DNA elements. Nucleic Acids Res 2004;32:e38.
396. Tost J, Gut IG. DNA methylation analysis by pyrosequencing. NatProtoc 2007;2:2265–75.
397. Metz J. The deoxyuridine suppression test. Crit Rev Clin Lab Sci1984;20:205–41.
398. Wickramasinghe SN, Fida S. Bone marrow cells from vitamin B12-and folate-deficient patients misincorporate uracil into DNA. Blood1994;83:1656–61.
399. Duthie SJ, Hawdon A. DNA instability (strand breakage, uracilmisincorporation, and defective repair) is increased by folic aciddepletion in human lymphocytes in vitro. FASEB J 1998;12:1491–7.
400. Atamna H, Cheung I, Ames BN. A method for detecting abasic sites inliving cells: age-dependent changes in base excision repair. Proc NatlAcad Sci USA 2000;97:686–91.
401. de Korte D, Haverkort WA, Vangennip AH, Roos D. Nucleotideprofiles of normal human-blood cells determined by high-performanceliquid-chromatography. Anal Biochem 1985;147:197–209.
402. Blount BC, Ames BN. Analysis of uracil in DNA by gaschromatography-mass spectrometry. Anal Biochem 1994;219:195–200.
403. Mashiyama ST, Hansen CM, Roitman E, Sarmiento S, Leklem JE,Shultz TD, Ames BN. An assay for uracil in human DNA at baseline:effect of marginal vitamin B6 deficiency. Anal Biochem 2008;372:21–31.
404. Crott JW, Mashiyama ST, Ames BN, Fenech M. The effect of folic aciddeficiency and MTHFR C677T polymorphism on chromosomedamage in human lymphocytes in vitro. Cancer Epidemiol BiomarkersPrev 2001;10:1089–96.
405. Fenech M. Cytokinesis-block micronucleus cytome assay. Nat Protoc2007;2:1084–104.
406. Dawson DW, Bury HPR. Significance of Howell-Jolly bodies and giantmetamyelocytes in marrow smears. J Clin Pathol 1961;14:374–80.
Biomarkers of nutrition for development—folate review 1679S
by guest on May 26, 2016
jn.nutrition.orgD
ownloaded from

407. Kouskoumvekaki I, Panagiotou G. Navigating the human metabo-lome for biomarker identification and design of pharmaceuticalmolecules. J Biomed Biotechnol 2011;2011 pii 25497.
408. Weljie AM, Dowlatabadi R, Miller BJ, Vogel HJ, Jirik FR. Aninflammatory arthritis-associated metabolite biomarker pattern re-vealed by H-1 NMR spectroscopy. J Proteome Res 2007;6:3456–64.
409. Mamas M, Dunn WB, Neyses L, Goodacre R. The role of metabolitesand metabolomics in clinically applicable biomarkers of disease. ArchToxicol 2011;85:5–17.
410. LaSalle JM. A genomic point-of-view on environmental factorsinfluencing the human brain methylome. Epigenetics 2011;6:862–9.
411. Parle-McDermott A, Ozaki M. The impact of nutrition on differentialmethylated regions of the genome. Adv Nutr 2011;2:463–71.
412. Caldwell PT, Manziello A, Howard J, Palbykin B, Runyan RB, SelminO. Gene expression profiling in the fetal cardiac tissue after folate andlow-dose trichloroethylene exposure. Birth Defects Res A Clin MolTeratol 2010;88(2):111–27.
413. van Oostrom O, de Kleijn DPV, Fledderus JO, Pescatori M, Stubbs A,Tuinenburg A, Lim SK, Verhaar MC. Folic acid supplementationnormalizes the endothelial progenitor cell transcriptome of patientswith type 1 diabetes: a case-control pilot study. Cardiovasc Diabetol2009;8:47.
414. Dhillon VS, Thomas P, Iarmarcovai G, Kirsch-Volders M, Bonassi S,Fenech M. Genetic polymorphisms of genes involved in DNA repairand metabolism influence micronucleus frequencies in human periph-eral blood lymphocytes. Mutagenesis 2011;26:33–42.
415. Blusztajn JK, Mellott TJ. Choline nutrition programs brain develop-ment via DNA and histone methylation. Cent Nerv Syst Agents MedChem 2012;12:82–94.
416. Shyh-Chang N, Locasale JW, Lyssiotis CA, Zheng YX, Teo RY,Ratanasirintrawoot S, Zhang J, Onder T, Unternaehrer JJ, Zhu H,et al. Influence of threonine metabolism on S-adenosylmethionine andhistone methylation. Science 2013;339:222–6.
417. Fredriksen A, Meyer K, Ueland PM, Vollset SE, Grotmol T, SchneedeJ. Large-scale population-based metabolic phenotyping of thirteengenetic polymorphisms related to one-carbon metabolism. HumMutat 2007;28:856–65.
418. Midttun Ø, Hustad S, Ueland PM. Quantitative profiling of bio-markers related to B-vitamin status, tryptophan metabolism andinflammation in human plasma by liquid chromatography/tandemmass spectrometry. Rapid Commun Mass Spectrom 2009;23:1371–9.
419. Gibney MJ, Walsh M, Brennan L, Roche HM, German B, van OmmenB. Metabolomics in human nutrition: opportunities and challenges.Am J Clin Nutr 2005;82:497–503.
420. Rezzi S, Ramadan Z, Fay LB, Kochhar S. Nutritional metabonomics:applications and perspectives. J Proteome Res 2007;6:513–25.
421. Sreekumar A, Poisson LM, Rajendiran TM, Khan AP, Cao Q, Yu JD,Laxman B, Mehra R, Lonigro RJ, Li Y, et al. Metabolomic profilesdelineate potential role for sarcosine in prostate cancer progression.Nature 2009;457:910–4.
422. Meyer TE, Fox SD, Issaq HJ, Xu X, Chu LW, Veenstra TD, Hsing AW.A reproducible and high-throughput HPLC/MS method to separatesarcosine from alpha- and beta-alanine and to quantify sarcosine inhuman serum and urine. Anal Chem 2011;83:5735–40.
423. Dahl FA, Grotle M, Benth JS, Natvig B. Data splitting as acountermeasure against hypothesis fishing: with a case study ofpredictors for low back pain. Eur J Epidemiol 2008;23:237–42.
424. Gika HG, Theodoridis GA, Earll M, Wilson ID. A QC approach to thedetermination of day-to-day reproducibility and robustness of LC-MSmethods for global metabolite profiling in metabonomics/metabolo-mics. Bioanalysis 2012;4:2239–47.
425. Reed MC, Thomas RL, Pavisic J, James SJ, Ulrich CM, Nijhout HF. Amathematical model of glutathione metabolism. Theor Biol MedModel 2008;5:8.
426. Ullah M, Schmidt H, Cho KH, Wolkenhauer O. Deterministicmodelling and stochastic simulation of biochemical pathways usingMATLAB. IEE Proc Syst Biol 2006;153:53–60.
427. Bachman JA, Sorger P. New approaches to modeling complexbiochemistry. Nat Methods 2011;8:130–1.
428. Bordbar A, Palsson BO. Using the reconstructed genome-scale humanmetabolic network to study physiology and pathology. J Intern Med2012;271:131–41.
429. Capel F, Klimcakova E, Viguerie N, Roussel B, Vitkova M,Kovacikova M, Polak J, Kovacova Z, Galitzky J, Maoret JJ, et al.Macrophages and adipocytes in human obesity: adipose tissue geneexpression and insulin sensitivity during calorie restriction and weightstabilization. Diabetes 2009;58:1558–67.
430. Duarte NC, Becker SA, Jamshidi N, Thiele I, Mo ML, Vo TD, SrivasR, Palsson BO. Global reconstruction of the human metabolicnetwork based on genomic and bibliomic data. Proc Natl Acad SciUSA 2007;104:1777–82.
431. Zelezniak A, Pers TH, Soares S, Patti ME, Patil KR. Metabolicnetwork topology reveals transcriptional regulatory signatures of type2 diabetes. PLOS Comput Biol 2010;6:e1000729.
432. Deo RC, Hunter L, Lewis GD, Pare G, Vasan RS, Chasman D, WangTJ, Gerszten RE, Roth FP. Interpreting metabolomic profiles usingunbiased pathway models. PLOS Comput Biol 2010;6:e1000692.
433. Vo TD, Paul Lee WN, Palsson BO. Systems analysis of energymetabolism elucidates the affected respiratory chain complex inLeigh’s syndrome. Mol Genet Metab 2007;91:15–22.
434. Stover PJ. Nutritional genomics. Physiol Genomics 2004;16:161–5.
435. Heinemann M, Sauer U. Systems biology of microbial metabolism.Curr Opin Microbiol 2010;13:337–43.
436. Orth JD, Palsson BO. Systematizing the generation of missingmetabolic knowledge. Biotechnol Bioeng 2010;107:403–12.
437. Shlomi T, Benyamini T, Gottlieb E, Sharan R, Ruppin E. Genome-scalemetabolic modeling elucidates the role of proliferative adaptation incausing the Warburg effect. PLOS Comput Biol 2011;7:e1002018.
438. Shlomi T, Cabili MN, Ruppin E. Predicting metabolic biomarkers ofhuman inborn errors of metabolism. Mol Syst Biol 2009;5:263.
439. Lamarre SG, Molloy AM, Reinke SN, Sykes BD, Brosnan ME,Brosnan JT. Formate can differentiate between hyperhomocysteinemiadue to impaired remethylation and impaired transsulfuration. Am JPhysiol Endocrinol Metab 2012;302:E61–7.
440. Van Hove JL, Lazeyras F, Zeisel SH, Bottiglieri T, Hyland K, CharlesHC, Gray L, Jaeken J, Kahler SG. One-methyl group metabolism innon-ketotic hyperglycinaemia: mildly elevated cerebrospinal fluidhomocysteine levels. J Inherit Metab Dis 1998;21:799–811.
441. Crott JW, Liu Z, Keyes MK, Choi SW, Jang H, Moyer MP, Mason JB.Moderate folate depletion modulates the expression of selected genesinvolved in cell cycle, intracellular signaling and folate uptake inhuman colonic epithelial cell lines. J Nutr Biochem 2008;19:328–35.
442. Chango A, Nour AA, Bousserouel S, Eveillard D, Anton PM, GueantJL. Time course gene expression in the one-carbon metabolismnetwork using HepG2 cell line grown in folate-deficient medium.J Nutr Biochem 2009;20:312–20.
443. Duthie SJ, Horgan G, de Roos B, Rucklidge G, Reid M, Duncan G,Pirie L, Basten GP, Powers HJ. Blood folate status and expression ofproteins involved in immune function, inflammation, and coagulation:biochemical and proteomic changes in the plasma of humans inresponse to long-term synthetic folic acid supplementation. J ProteomeRes 2010;9:1941–50.
444. Hebels DGAJ, Jennen DGJ, van Herwijnen MHM, Moonen EJC,Pedersen M, Knudsen LE, Kleinjans JCS, de Kok TMCM. Whole-genome gene expression modifications associated with nitrosamineexposure and micronucleus frequency in human blood cells. Muta-genesis 2011;26:753–61.
445. Hochstenbach K, van Leeuwen DM, Gmuender H, Gottschalk RW,Lovik M, Granum B, Nygaard U, Namork E, Kirsch-Volders M,Decordier I, et al. Global gene expression analysis in cord bloodreveals gender-specific differences in response to carcinogenic expo-sure in utero. Cancer Epidemiol Biomarkers Prev 2012;21:1756–67.
446. Marsit CJ, Eddy K, Kelsey KT. MicroRNA responses to cellular stress.Cancer Res 2006;66:10843–8.
1680S Supplement
by guest on May 26, 2016
jn.nutrition.orgD
ownloaded from