Embed Size (px)
Citation preview
Biological Wastewater Treatment
II – MBBR Processes
DISCLAIMER:
All course materials available on this website are not to be construed as a representation or warranty on the part of Online-PDH, or other persons
and/or organizations named herein. All course literature is for reference purposes only, and should not be used as a substitute for competent,
professional engineering council. Use or application of any information herein, should be done so at the discretion of a licensed professional
engineer in that given field of expertise. Any person(s) making use of this information, herein, does so at their own risk and assumes any and all
liabilities arising therefrom.
Copyright © 2009 Online-PDH - All Rights Reserved
1265 San Juan Dr. - Merritt Island, FL 32952
Phone: 321-501-5601
Online Continuing Education for Professional Engineers
Since 2009
PDH Credits:
4 PDH
Course No.:
MBR101
Publication Source:
Original Courseware by Harlan Bengtson, PhD, PE
Biological Wastewater Treatment II – MBBR Processes
Harlan H. Bengtson, PhD, P.E.
COURSE CONTENT
1. Introduction Biological wastewater treatment is very widely used for removal of biodegradable
materials from wastewater. The first course in this sequence, Biological Wastewater
Treatment I – Activated Sludge, starts with a discussion of the biochemical oxygen
demand that is created by biodegradable materials in water and the reason why such
materials must be removed from wastewater. This course is about the Moving Bed
Biofilm Reactor (MBBR) wastewater treatment process, including background
information about the process and a description of the process, as well as process
design calculations for several different configurations of the MBBR process and
numerous example calculations.
2. Learning Objectives
At the conclusion of this course, the student will
Know the differences between attached growth and suspended growth biological
wastewater treatment processes
Be familiar with the components and general configuration of an MBBR
wastewater treatment process
Be able to calculate the loading rate of a wastewater constituent to an MBBR
process (in lb/day and g/day) for a specified wastewater flow rate and constituent
concentration
Be able to calculate the required carrier surface area for an MBBR wastewater
treatment process for a specified SALR and loading rate
Be able to calculate the required MBBR tank volume for specified carrier surface
area, carrier specific surface area, and the carrier fill %.
Be able to calculate the liquid volume in an MBBR tank for known tank volume,
carrier volume and carrier % void space
Be able to calculate the BOD, NH3-N, or NO3-N removal rate for known values of
the surface area removal rate (SARR) and design carrier surface area
Be able to calculate an estimated effluent BOD, NH3-N, or NO3-N concentration
based on known values of the appropriate loading rate, estimated removal rate,
and design wastewater flow rate
Be able to make process design calculations for a post-Anoxic denitrification
MBBR process, including required tank sizes, estimated effluent concentrations,
alkalinity requirement and carbon source requirement
Be able to make process design calculations for a pre-anoxic denitrification
MBBR process, including required tank sizes, estimated effluent concentrations,
and alkalinity requirements
3. Topics Covered in this Course I. Description of the MBBR (Moving Bed Biofilm Reactor) Process II. Single Stage BOD Removal MBBR Process Design Calculations III. Two-Stage BOD Removal MBBR Process Design Calculations IV. Single Stage Nitrification MBBR Process Design Calculations V. Two-Stage BOD Removal and Nitrification MBBR Process Design Calculations VI. Denitrification Background Information VII. Post-Anoxic Denitrification MBBR Process Design Calculations VIII. Pre-Anoxic Denitrification MBBR Process Design Calculations
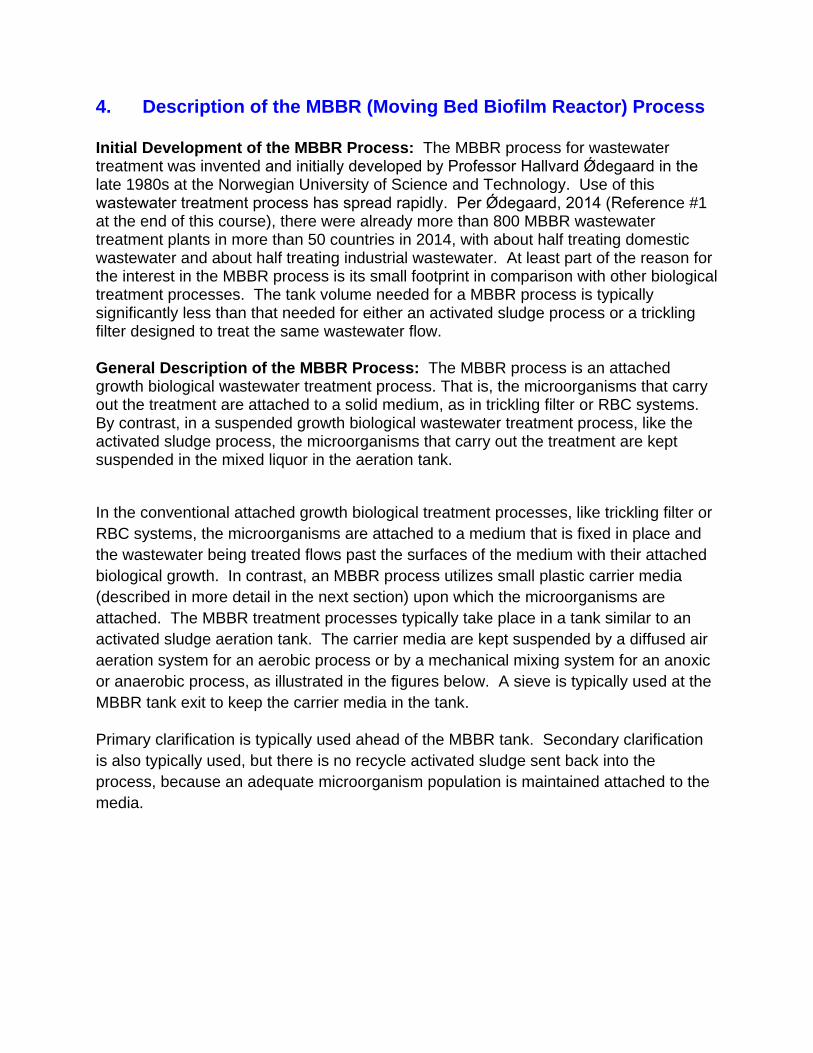
4. Description of the MBBR (Moving Bed Biofilm Reactor) Process Initial Development of the MBBR Process: The MBBR process for wastewater treatment was invented and initially developed by Professor Hallvard Ǿdegaard in the late 1980s at the Norwegian University of Science and Technology. Use of this wastewater treatment process has spread rapidly. Per Ǿdegaard, 2014 (Reference #1 at the end of this course), there were already more than 800 MBBR wastewater treatment plants in more than 50 countries in 2014, with about half treating domestic wastewater and about half treating industrial wastewater. At least part of the reason for the interest in the MBBR process is its small footprint in comparison with other biological treatment processes. The tank volume needed for a MBBR process is typically significantly less than that needed for either an activated sludge process or a trickling filter designed to treat the same wastewater flow. General Description of the MBBR Process: The MBBR process is an attached growth biological wastewater treatment process. That is, the microorganisms that carry out the treatment are attached to a solid medium, as in trickling filter or RBC systems. By contrast, in a suspended growth biological wastewater treatment process, like the activated sludge process, the microorganisms that carry out the treatment are kept suspended in the mixed liquor in the aeration tank.
In the conventional attached growth biological treatment processes, like trickling filter or
RBC systems, the microorganisms are attached to a medium that is fixed in place and
the wastewater being treated flows past the surfaces of the medium with their attached
biological growth. In contrast, an MBBR process utilizes small plastic carrier media
(described in more detail in the next section) upon which the microorganisms are
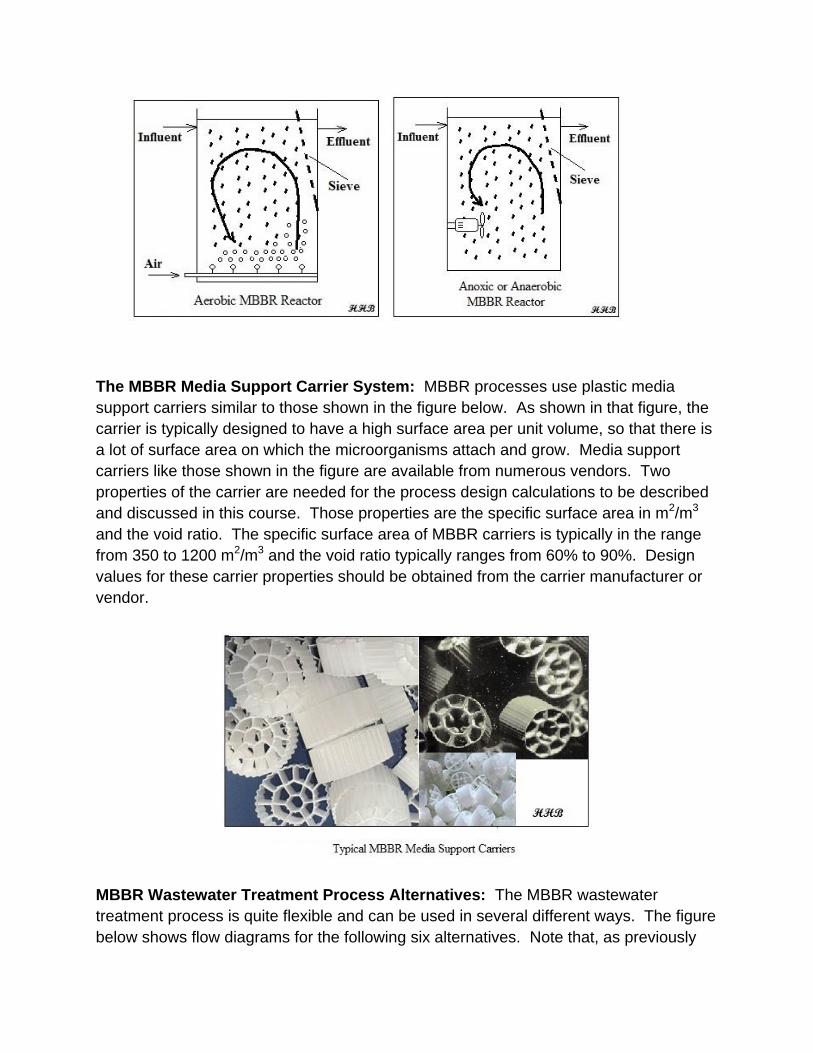
attached. The MBBR treatment processes typically take place in a tank similar to an
activated sludge aeration tank. The carrier media are kept suspended by a diffused air
aeration system for an aerobic process or by a mechanical mixing system for an anoxic
or anaerobic process, as illustrated in the figures below. A sieve is typically used at the
MBBR tank exit to keep the carrier media in the tank.
Primary clarification is typically used ahead of the MBBR tank. Secondary clarification
is also typically used, but there is no recycle activated sludge sent back into the
process, because an adequate microorganism population is maintained attached to the
media.
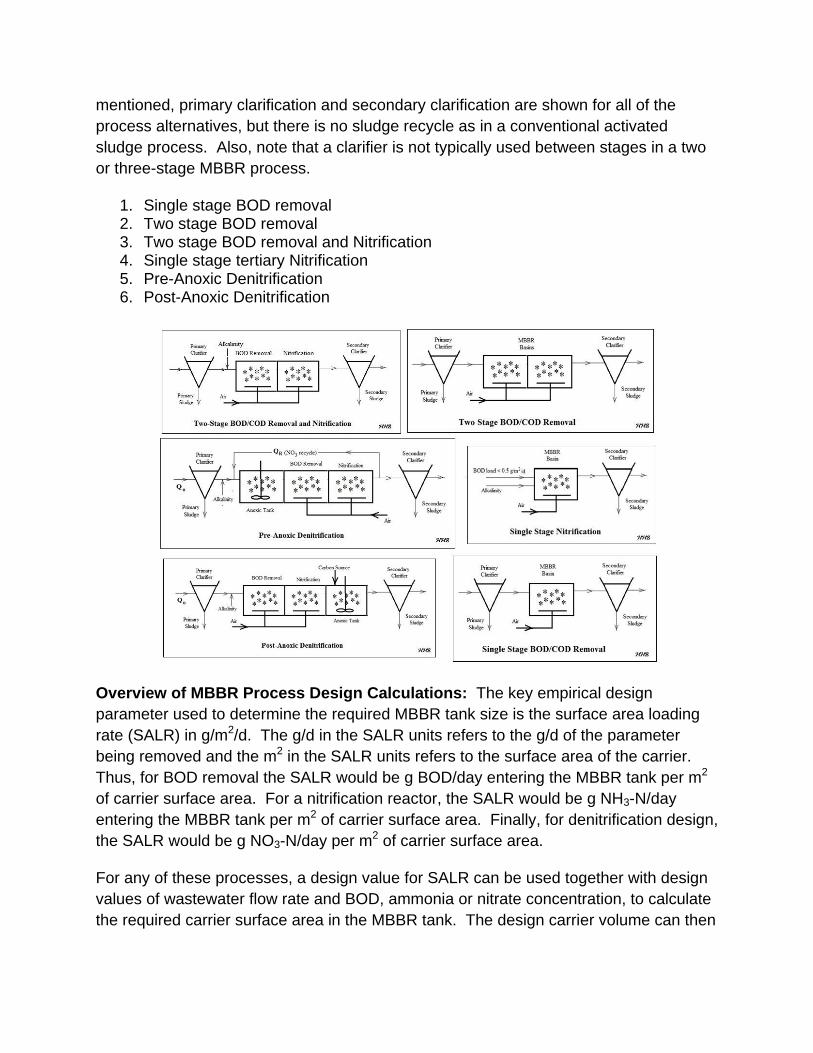
The MBBR Media Support Carrier System: MBBR processes use plastic media
support carriers similar to those shown in the figure below. As shown in that figure, the
carrier is typically designed to have a high surface area per unit volume, so that there is
a lot of surface area on which the microorganisms attach and grow. Media support
carriers like those shown in the figure are available from numerous vendors. Two
properties of the carrier are needed for the process design calculations to be described
and discussed in this course. Those properties are the specific surface area in m2/m3
and the void ratio. The specific surface area of MBBR carriers is typically in the range
from 350 to 1200 m2/m3 and the void ratio typically ranges from 60% to 90%. Design
values for these carrier properties should be obtained from the carrier manufacturer or
vendor.
MBBR Wastewater Treatment Process Alternatives: The MBBR wastewater
treatment process is quite flexible and can be used in several different ways. The figure
below shows flow diagrams for the following six alternatives. Note that, as previously
mentioned, primary clarification and secondary clarification are shown for all of the
process alternatives, but there is no sludge recycle as in a conventional activated
sludge process. Also, note that a clarifier is not typically used between stages in a two
or three-stage MBBR process.
1. Single stage BOD removal 2. Two stage BOD removal 3. Two stage BOD removal and Nitrification 4. Single stage tertiary Nitrification 5. Pre-Anoxic Denitrification 6. Post-Anoxic Denitrification
Overview of MBBR Process Design Calculations: The key empirical design
parameter used to determine the required MBBR tank size is the surface area loading
rate (SALR) in g/m2/d. The g/d in the SALR units refers to the g/d of the parameter
being removed and the m2 in the SALR units refers to the surface area of the carrier.
Thus, for BOD removal the SALR would be g BOD/day entering the MBBR tank per m2
of carrier surface area. For a nitrification reactor, the SALR would be g NH3-N/day
entering the MBBR tank per m2 of carrier surface area. Finally, for denitrification design,
the SALR would be g NO3-N/day per m2 of carrier surface area.
For any of these processes, a design value for SALR can be used together with design
values of wastewater flow rate and BOD, ammonia or nitrate concentration, to calculate
the required carrier surface area in the MBBR tank. The design carrier volume can then

be calculated using a known value for the carrier specific surface area (m2/m3). Finally,
a design value for the carrier fill % can be used to calculate the required tank volume.
Process design calculations for each of the process alternatives shown in the figure
above will be covered in the next several sections.
5. Single Stage BOD Removal MBBR Process Design Calculations
An MBBR single stage BOD removal process may be used as a free-standing secondary treatment process or as a roughing treatment prior to another secondary treatment process, in some cases to relieve overloading of an existing secondary treatment process. In either case the key design parameter for sizing the MBBR tank is the surface area loading rate (SALR), typically with units of g/m2/day, that is g/day of BOD coming into the MBBR tank per m2 of carrier surface area. Using design values for wastewater flow rate and BOD concentration entering the MBBR tank, the loading rate in g BOD/day can be calculated. Then dividing BOD loading rate in g/day by the SALR in g/m2/day gives the required carrier surface area in m2. The carrier fill %, carrier specific surface area, and carrier % void space can then be used to calculate the required carrier volume, tank volume and the volume of liquid in the reactor. A typical flow diagram for a single stage MBBR process for BOD removal is shown in the figure below.
The equations for making those calculations are as follows:
1. BOD loading rate = Q*So*8.34*453.59
where: Q is the wastewater flow rate into the MBBR reactor in MGD
So is the BOD concentration in that influent flow in mg/L 8.34 is the conversion factor from mg/L to lb/MG 453.59 is the conversion factor from lb to g The calculated BOD loading rate will be in g/day.

2. required carrier surf. area = BOD Loading Rate/SALR
where: BOD Loading Rate is in g/day
SALR is the design surface area loading rate in g/m2/day The calculated required carrier surface area will be in m2.
3. required carrier volume = required carrier surf. area/carrier specific surf. area
where: required carrier surface Area is in m2 carrier specific surface Area is in m2/m3 The calculated required carrier volume will be in m3.
4. required tank volume = required carrier volume/carrier fill %
where: required tank volume will be in the same units as required carrier volume.
5. liquid volume in tank = required tank volume – [required carrier volume(1 – carrier % void space)]
where: all three volumes will be in the same units.
Note that volumes calculated in m3 can be converted to ft3 by multiplying by 3.28083 ft3/m3.
Although hydraulic retention time (HRT) is not typically used as a primary design parameter for MBBR reactors, it can be calculated at the design wastewater flow rate, if the liquid volume in the tank is known. Also, if a design peak hour factor is specified, then the HRT at peak hourly flow can be calculated as well. The equations for calculating HRT are as follows:
1. Ave. HRTdes ave = liquid vol. in tank*7.48)/[Q*106/(24*60)]
where: liquid vol. in tank is in ft3 Q is in MGD 7.48 is the conversion factor for ft3 to gal 106 is the conversion factor for MG to gal 24*60 is the conversion factor for days to min Ave. HRTdes ave will be in min
2. Ave. HRTpeak hr = Ave. HRTdes ave/Peak Hour Factor
where: Ave. HRTpeak hr will also be in min
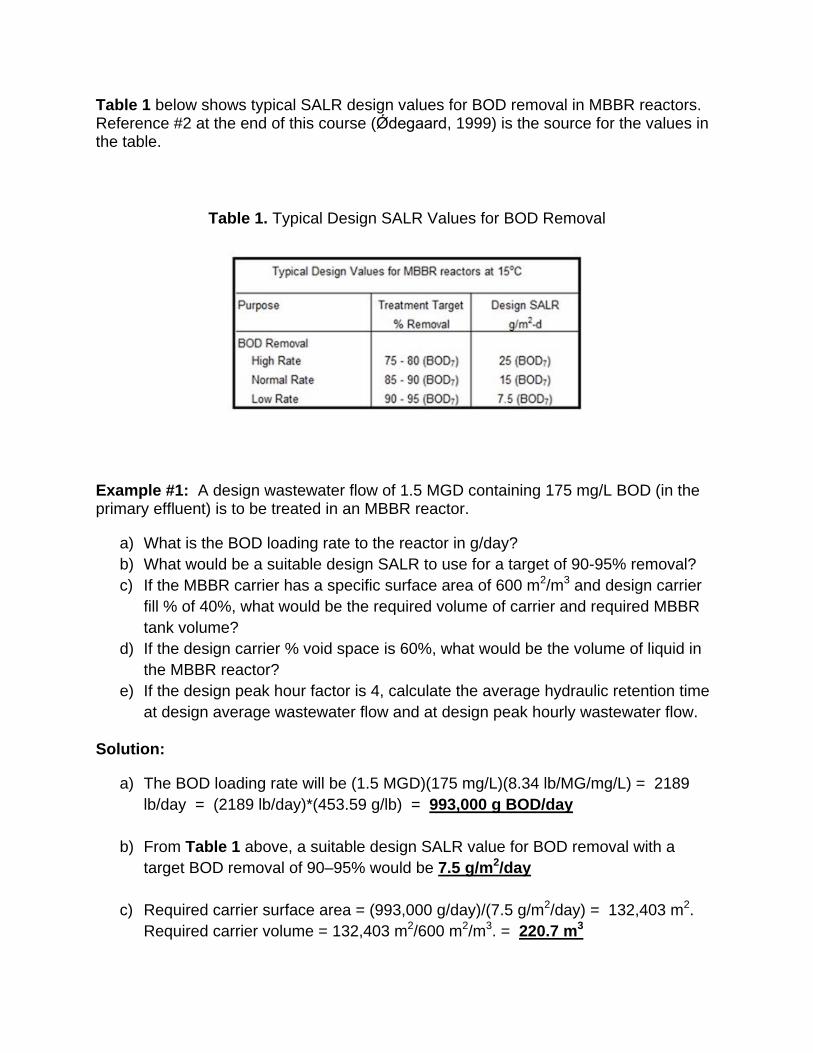
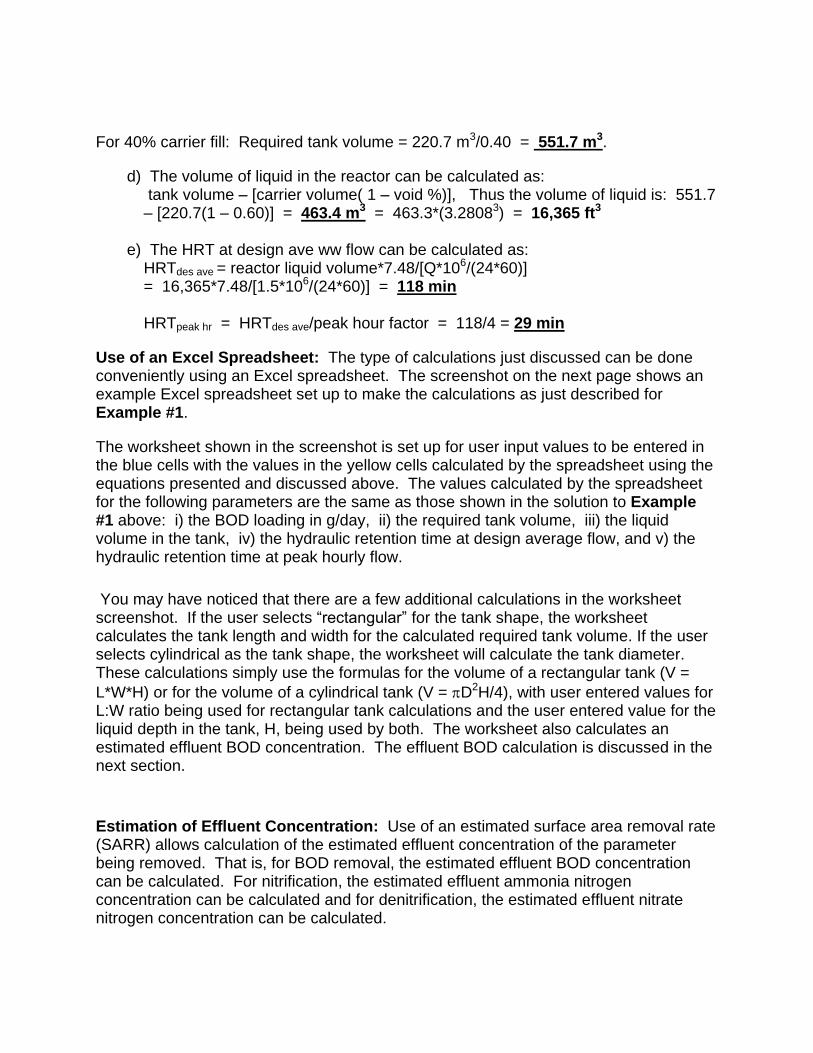
Table 1 below shows typical SALR design values for BOD removal in MBBR reactors. Reference #2 at the end of this course (Ǿdegaard, 1999) is the source for the values in the table.
Table 1. Typical Design SALR Values for BOD Removal
Example #1: A design wastewater flow of 1.5 MGD containing 175 mg/L BOD (in the primary effluent) is to be treated in an MBBR reactor.
a) What is the BOD loading rate to the reactor in g/day?
b) What would be a suitable design SALR to use for a target of 90-95% removal?
c) If the MBBR carrier has a specific surface area of 600 m2/m3 and design carrier
fill % of 40%, what would be the required volume of carrier and required MBBR
tank volume?
d) If the design carrier % void space is 60%, what would be the volume of liquid in
the MBBR reactor?
e) If the design peak hour factor is 4, calculate the average hydraulic retention time
at design average wastewater flow and at design peak hourly wastewater flow.
Solution:
a) The BOD loading rate will be (1.5 MGD)(175 mg/L)(8.34 lb/MG/mg/L) = 2189
lb/day = (2189 lb/day)*(453.59 g/lb) = 993,000 g BOD/day
b) From Table 1 above, a suitable design SALR value for BOD removal with a
target BOD removal of 90–95% would be 7.5 g/m2/day
c) Required carrier surface area = (993,000 g/day)/(7.5 g/m2/day) = 132,403 m2.
Required carrier volume = 132,403 m2/600 m2/m3. = 220.7 m3
For 40% carrier fill: Required tank volume = 220.7 m3/0.40 = 551.7 m3.
d) The volume of liquid in the reactor can be calculated as: tank volume – [carrier volume( 1 – void %)], Thus the volume of liquid is: 551.7 – [220.7(1 – 0.60)] = 463.4 m3 = 463.3*(3.28083) = 16,365 ft3
e) The HRT at design ave ww flow can be calculated as: HRTdes ave = reactor liquid volume*7.48/[Q*106/(24*60)] = 16,365*7.48/[1.5*106/(24*60)] = 118 min HRTpeak hr = HRTdes ave/peak hour factor = 118/4 = 29 min
Use of an Excel Spreadsheet: The type of calculations just discussed can be done conveniently using an Excel spreadsheet. The screenshot on the next page shows an example Excel spreadsheet set up to make the calculations as just described for Example #1.
The worksheet shown in the screenshot is set up for user input values to be entered in the blue cells with the values in the yellow cells calculated by the spreadsheet using the equations presented and discussed above. The values calculated by the spreadsheet for the following parameters are the same as those shown in the solution to Example #1 above: i) the BOD loading in g/day, ii) the required tank volume, iii) the liquid volume in the tank, iv) the hydraulic retention time at design average flow, and v) the hydraulic retention time at peak hourly flow.
You may have noticed that there are a few additional calculations in the worksheet screenshot. If the user selects “rectangular” for the tank shape, the worksheet calculates the tank length and width for the calculated required tank volume. If the user selects cylindrical as the tank shape, the worksheet will calculate the tank diameter. These calculations simply use the formulas for the volume of a rectangular tank (V =
L*W*H) or for the volume of a cylindrical tank (V = D2H/4), with user entered values for L:W ratio being used for rectangular tank calculations and the user entered value for the liquid depth in the tank, H, being used by both. The worksheet also calculates an estimated effluent BOD concentration. The effluent BOD calculation is discussed in the next section.
Estimation of Effluent Concentration: Use of an estimated surface area removal rate (SARR) allows calculation of the estimated effluent concentration of the parameter being removed. That is, for BOD removal, the estimated effluent BOD concentration can be calculated. For nitrification, the estimated effluent ammonia nitrogen concentration can be calculated and for denitrification, the estimated effluent nitrate nitrogen concentration can be calculated.
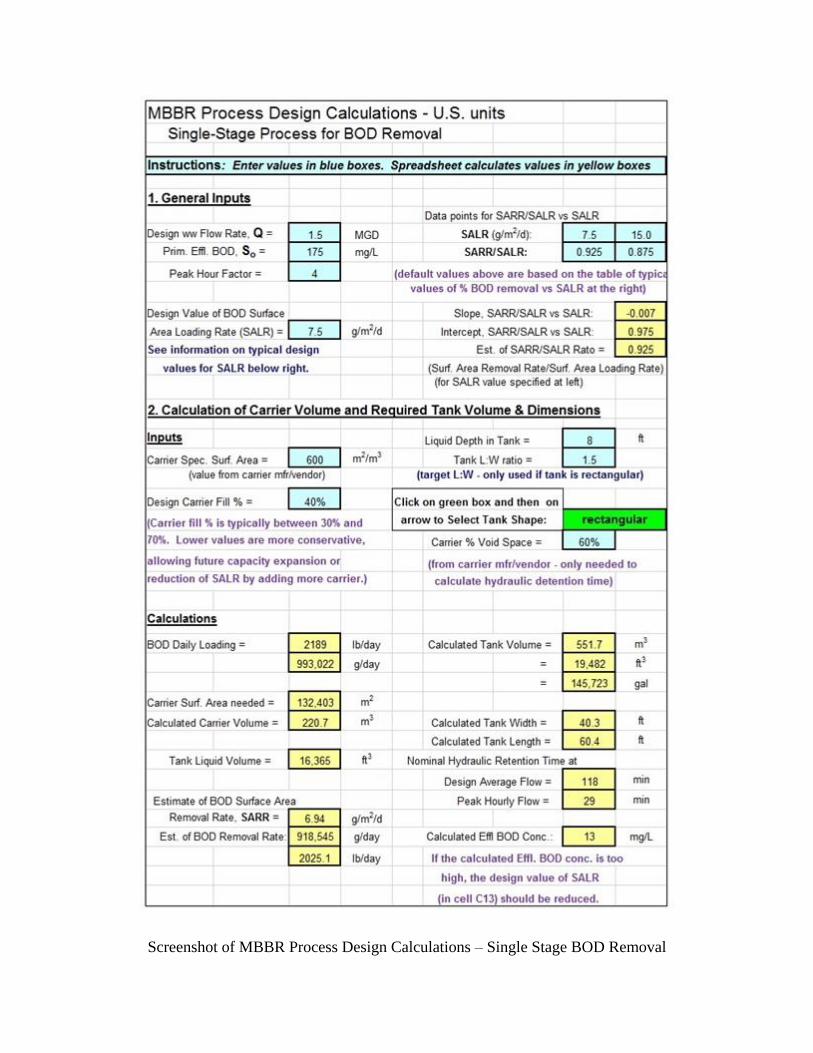
Screenshot of MBBR Process Design Calculations – Single Stage BOD Removal

Based on graphs and tables provided in several of the references at the end of this document, the SARR/SALR ratio for all of the different types of MBBR treatment being covered in this course ranges from about 0.8 to nearly 1.0 over the range of SALR values typically used. The SARR/SALR ratio is nearly one at very low SALR values and decreases as the SALR value increases.
The upper right portion of the screenshot on the previous page illustrates an approach for estimating a value for the SARR/SALR ratio for a specified design value of SALR. In the four blue cells at the upper right, two sets of values for SARR/SALR and SALR are entered. In this case they are based on the typical values of % BOD removal vs SALR in Table 1 above. In the yellow cells below those entries, the slope and intercept of a SARR/SALR vs SALR straight line are calculated using the Excel SLOPE and INTERCEPT functions. Then the SARR/SALR ratio is calculated for the specified design value of SALR.
Note that the ratio SARR/SALR is equal to the % BOD removal expressed as a fraction. This can be shown as follows:
BOD removal rate in g/day = (SARR in g/m2/d)(Carrier Surf. Area in m2)
BOD rate into plant in g/day = (SALR in g/m2/d)(Carrier Surf. Area in m2)
% BOD removal = (BOD removal rate/BOD rate into plant)*100%
= (100%)(SARR* Carrier Surf Area)/(SALR*Carrier Surf Area)
= (SARR/SALR)100%
Thus, the value of 0.925 for the SARR/SALR ratio at SALR = 7.5 g/m2/d was obtained
from Table 1 above as the midpoint of the 90-95% estimated % BOD removal for SALR
= 7.5 g/m2/d. Similarly, the value of 0.875 for the SARR/SALR ratio at SALR = 15
g/m2/d was obtained from Table 1 above as the midpoint of the 85-90% estimated %
BOD removal for SALR = 15 g/m2/d.
At the bottom of the screenshot worksheet, the estimated value of the surface area
removal rate (SARR) is calculated. It is used to calculate an estimated BOD removal
rate in g BOD/day and lb BOD/day. Then an estimate of the effluent BOD concentration
is calculated. The equations for these calculations are as follows:
1. estimated SARR = (calculated SARR/SALR)(design value of SALR)
2. estimated BOD removal rate = (estimated SARR)(carrier surface area)
3. estimated effluent BOD conc. = [(BOD loading rate - estimated BOD removal rate)/Qo]/8.34

Example #2: Calculate the estimated effluent BOD concentration for the wastewater flow described in Example #1 being treated in the MBBR reactor sized in Example #1.
Solution: The solution is included in the spreadsheet screenshot that was used for the solution to Example #1 above. The pair of points for SARR/SALR vs SALR that were discussed above and are shown on the screenshot lead to the following values for the slope and intercept for the SARR/SALR vs SALR line: Slope = -0.007, Intercept = 0.975.
Thus the estimated SARR/SALR ratio for the given SALR value of 7.5 g/m2/d would be calculated as: SARR/SALR = - (0.007)(7.5) + 0.975 = 0.925
The SARR value can be calculated as:
SARR = (SARR/SALR)(SALR) = (0.925)(7.5) = 6.94 g/m2/d
Then, the estimated BOD removal rate can be calculated as:
est BOD removal rate = (est SARR)(carrier surface area)
= (6.94 g/m2/d)(132,403 m2) = 918,545 g/d = 918,545/453.59 lb/day
est BOD removal rate = 2025.1 lb/day
The estimated effluent BOD concentration can then be calculated from the equation:
est effluent BOD conc. = [(BOD loading rate - est BOD removal rate)/Qo]/8.34
Substituting calculated and given values:
Est. effluent BOD conc. = [(2189 – 2026.1)/1.5]/8.34 = 13 mg/L
Note that this 13 mg/L value for the estimated effluent BOD concentration is shown near the bottom of the spreadsheet screenshot.
6. Two-Stage BOD Removal MBBR Process Design Calculations A two stage MBBR BOD removal process may be used instead of a single stage process. In this case, a high SALR “roughing” treatment will typically be used for the first stage and a lower SALR will typically be used for the second stage. This will result in less total tank volume needed for a two-stage process than for a single stage process. Also, a two-stage MBBR process can typically achieve a lower effluent BOD concentration than a single stage MBBR process. A typical flow diagram for a two-stage MBBR process for BOD removal is shown in the figure below.

Two Stage MBBR Process for BOD/COD Removal
The process design calculations for a two stage MBBR process are essentially the same for each of the stages as for the single stage process, as described in the previous section. These calculations are illustrated in Example #3.
Example #3: A design wastewater flow of 1.5 MGD containing 175 mg/L BOD (in the primary effluent) is to be treated for BOD removal in a two-stage MBBR reactor. The SALR for the first stage is to be 25 g/m2/d and the design SALR for the second stage is to be 7.5 g/m2/d.
a) For the first stage calculate each of the following:
i) The BOD loading ii) The required carrier volume for a carrier with specific surface area of 600
m2/m3 iii) The required MBBR tank volume for a design carrier fill % of 40% iv) The volume of liquid in the MBBR reactor for design carrier % void space of
60%. v) The average hydraulic retention time at design average wastewater flow and
at design peak hourly flow if the design peak hour factor is 4. vi) The estimated effluent BOD concentration from the first stage.
b) Calculate the same parameters for the second stage.
Solution: The solution as calculated with an Excel spreadsheet is shown in the spreadsheet screenshot in the next two figures below.. The first screenshot below which is the top part of the spreadsheet, shows primarily the user input values. It also includes the calculation of the slope and intercept for the SARR/SALR vs SALR equation and the calculation of the estimated SARR for each stage. These calculations and the resulting SARR/SALR values are the same as those discussed above for the single-stage BOD removal MBBR process. The resulting values for SARR/SALR are 0.775 for the first stage with SALR = 25, and 0.925 for the second stage with SALR = 7.5.
The second screenshot figure below is the bottom part of the spreadsheet and shows the calculated values as follows.

a) For the first stage:
i) The BOD loading rate will be (1.5 MGD)(175 mg/L)(8.34 lb/MG/mg/L) = 2189 lb/day = (2189 lb/day)*(453.59 g/lb) = 993,022 g BOD/day
ii) Required carrier surface area = (993,022 g/day)/(25 g/m2/day) = 39,721 m2.
Required carrier volume = 39,721 m2/600 m2/m3. = 66.20 m3
iii) For 40% carrier fill: Required tank volume = 66.2 m3/0.40 = 165,5 m3.
iv) The volume of liquid in the reactor can be calculated as:
tank volume – [carrier volume(1 – void %)], Thus the volume of liquid is: 165.5 – [66.20(1 – 0.60)] = 139.02 m3. = 139.02(3.28083) = 4910 ft3
v) The HRT at design ave ww flow can be calculated as:
HRTdes ave = reactor liquid volume*7.48/[Q*106/(24*60)] = 4910*7.48/[1.5*106/(24*60)] = 35 min HRTpeak hr = HRTdes ave/peak hour factor = 35/4 = 9 min
vi) Calculation of the estimated effluent BOD concentration from the first stage
as shown above for the single stage process gives a value of 39 mg/L.
b) For the second stage:
i) The BOD loading rate will be (1.5 MGD)(39 mg/L)(8.34 lb/MG/mg/L) = 492.6 lb/day = (492.6 lb/day)*(453.59 g/lb) = 223,430 g BOD/day
ii) Required carrier surface area = (223,430 g/day)/(7.5 g/m2/day) = 29,791 m2.
Required carrier volume = 29,791 m2/600 m2/m3. = 49.65 m3
iii) For 40% carrier fill: Required tank volume = 49.65 m3/0.40 = 124.1 m3.
iv) The volume of liquid in the reactor can be calculated as:
tank volume – [carrier volume( 1 – void %)], Thus the volume of liquid is: 124.1 – [49.65(1 – 0.60)] = 104.3 m3 = 104.3(3.28083) = 3682 ft3
v) The HRT at design ave ww flow can be calculated as: HRTdes ave = reactor liquid volume*7.48/[Q*106/(24*60)] = 3682*7.48/[1.5*106/(24*60)] = 26 min HRTpeak hr = HRTdes ave/peak hour factor = 26/4 = 7 min

Calculation of the estimated effluent BOD concentration from the second stage using the calculation procedure shown above for the single stage process gives a value of 3.0 mg/L.
Screenshot of MBBR Process Design Calculations - Two Stage BOD Removal – Part 1
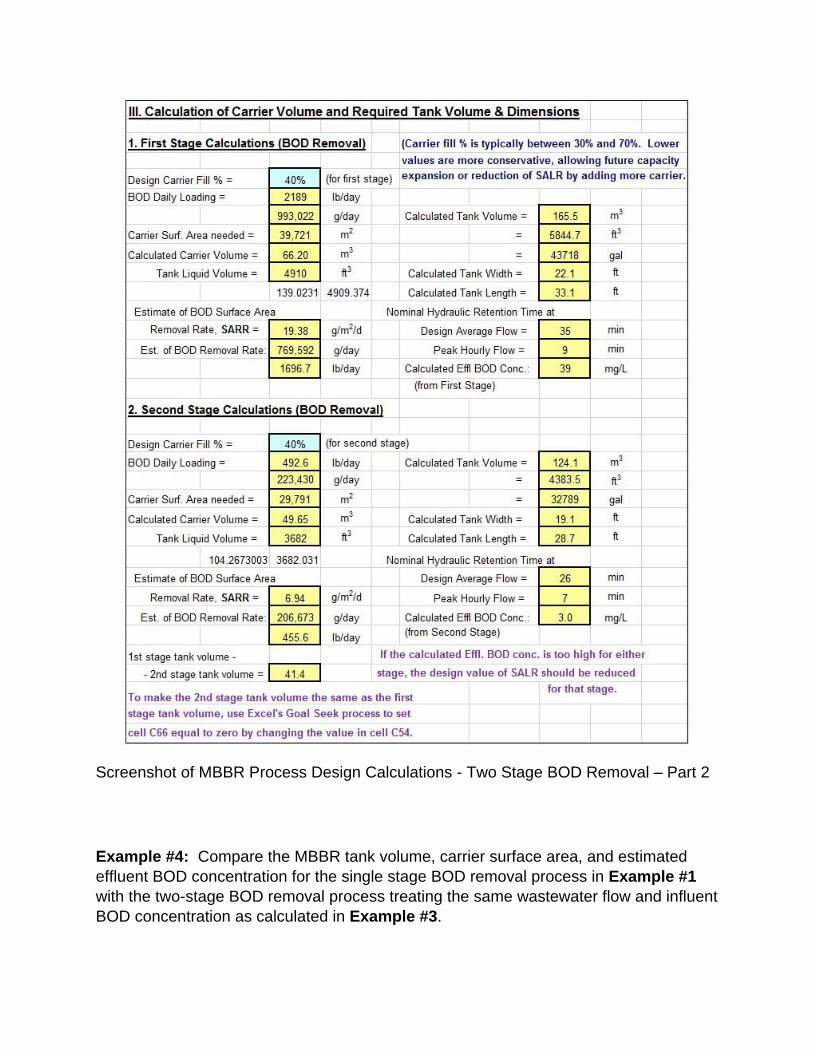
Screenshot of MBBR Process Design Calculations - Two Stage BOD Removal – Part 2
Example #4: Compare the MBBR tank volume, carrier surface area, and estimated
effluent BOD concentration for the single stage BOD removal process in Example #1
with the two-stage BOD removal process treating the same wastewater flow and influent
BOD concentration as calculated in Example #3.

Solution: The results are summarized below:
Single Stage Process Two-Stage Process
MBBR Volume: 19,482 ft3 10,228 ft3
Carrier Surf. Area: 132,403 m2 69,512 m2
Est. Effl. BOD: 13 mg/L 3 mg/L
Note that the two-stage process requires only about half of the tank volume and half of
the carrier quantity in comparison with the single stage process, while achieving a
significantly lower estimated effluent BOD.
7. Single Stage Nitrification MBBR Process Design Calculations An MBBR single stage nitrification process would typically be used as a tertiary treatment process following some type of secondary treatment that reduced the BOD to a suitable level. A typical flow diagram for a single stage MBBR process for nitrification is shown in the figure below. As shown on the diagram, the BOD level should be low enough so that the BOD load to the nitrification process is less than 0.5 g/m2/day. Note that alkalinity is used in the nitrification process and thus alkalinity addition is typically required.
Single Stage MBBR Process for Nitrification
The process design calculations for this single stage MBBR process are similar to those used for the BOD removal processes, but the design SALR value for nitrification can be calculated rather than being selected from a table of typical values, as was done for BOD removal. The design SALR can be calculated using a kinetic model for the surface area removal rate (SARR) as a function of the dissolved oxygen concentration in the MBBR reactor and the bulk liquid ammonia nitrogen concentration, which is equal

to the effluent ammonia nitrogen concentration assuming completely mixed conditions in the MBBR tank.
The kinetic model to be discussed here is from Metcalf and Eddy (2014), Figure 9-25 [ attributed to Odegaard (2006) ] and Equation 9-48. This figure and equation will now be shown and discussed briefly. The figure below was prepared based on Metcalf and Eddy’s Figure 9-25 and their Equation 9-48 (shown below). Note that the figure and equation are for operation at 15oC. Correction of the SARR and SALR for some other
operational temperature can be done with the equation: SARRT = SARR15(T – 15)
where T is the design operational temperature in oC. From Salvetti, et.al (2006): =
1.058 for D.O. limited conditions and = 1.098 if ammonia nitrogen concentration is the limiting factor.
Equation 9-48 from Metcalf and Eddy (2014) is:
SARR = [ Ne/(2.2 + Ne)]*3.3 , Ne = effluent ammonia N conc.
This is the equation for the curved portion at the left in the graph below, which is for ammonia N concentration limiting conditions.
Adapted from Metcalf & Eddy (2014), Fig 9-25
The horizontal lines in the figure above show the nitrification SARR under D.O. limiting conditions for each of the D.O. levels shown. The SARR will be D.O. limited when the NH3-N concentration is above the value at the left end of the horizontal line for each D.O. level. When the NH3-N concentration is below that value, then the SARR is ammonia concentration limited and the SARR is a function of the effluent NH3-N concentration (Ne) per the equation: SARR = [ Ne/(2.2 + Ne)]*3.3.
As shown in Section 5 for BOD removal, SALR/SARR = % BOD removal. Similarly, for nitrification, SALR/SARR = % NH3-N removal. After the SARR has been determined, the SALR can be calculated as: SALR = SARR/% removal.
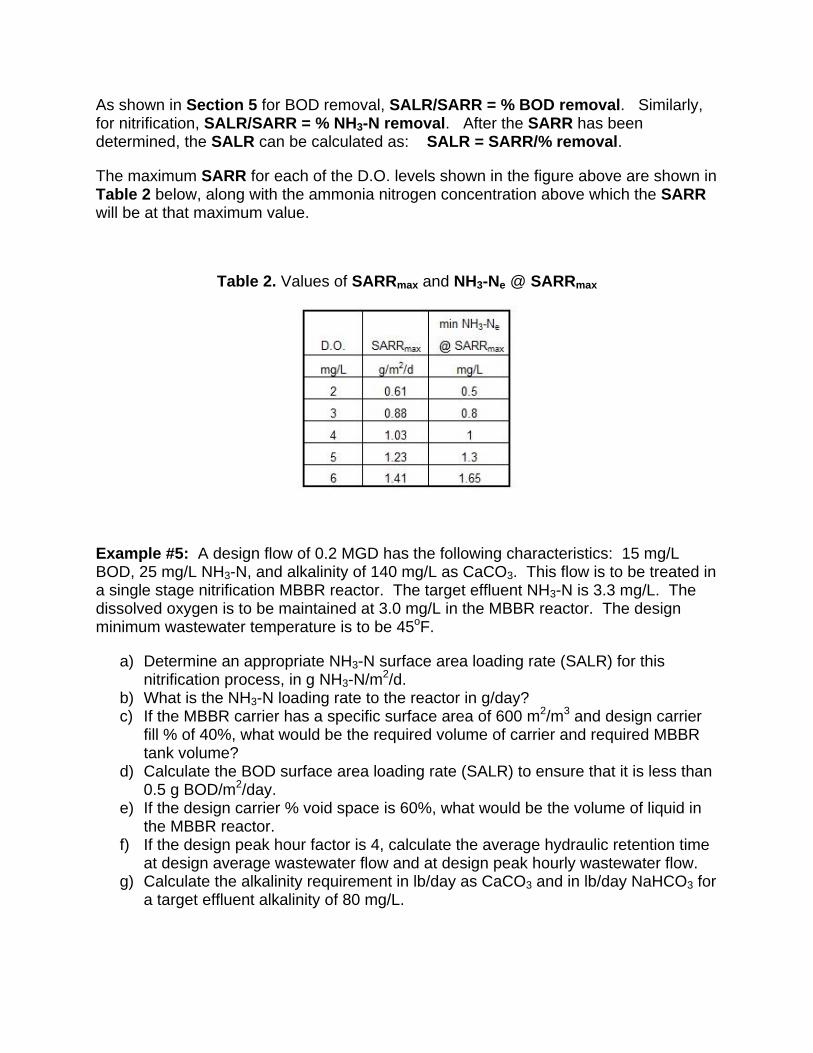
The maximum SARR for each of the D.O. levels shown in the figure above are shown in Table 2 below, along with the ammonia nitrogen concentration above which the SARR will be at that maximum value.
Table 2. Values of SARRmax and NH3-Ne @ SARRmax
Example #5: A design flow of 0.2 MGD has the following characteristics: 15 mg/L BOD, 25 mg/L NH3-N, and alkalinity of 140 mg/L as CaCO3. This flow is to be treated in a single stage nitrification MBBR reactor. The target effluent NH3-N is 3.3 mg/L. The dissolved oxygen is to be maintained at 3.0 mg/L in the MBBR reactor. The design minimum wastewater temperature is to be 45oF.
a) Determine an appropriate NH3-N surface area loading rate (SALR) for this nitrification process, in g NH3-N/m2/d.
b) What is the NH3-N loading rate to the reactor in g/day? c) If the MBBR carrier has a specific surface area of 600 m2/m3 and design carrier
fill % of 40%, what would be the required volume of carrier and required MBBR tank volume?
d) Calculate the BOD surface area loading rate (SALR) to ensure that it is less than 0.5 g BOD/m2/day.
e) If the design carrier % void space is 60%, what would be the volume of liquid in the MBBR reactor.
f) If the design peak hour factor is 4, calculate the average hydraulic retention time at design average wastewater flow and at design peak hourly wastewater flow.
g) Calculate the alkalinity requirement in lb/day as CaCO3 and in lb/day NaHCO3 for a target effluent alkalinity of 80 mg/L.

Solution:
The solution is shown in the spreadsheet screenshots below. A summary of the calculations is as follows:
a) The D.O. limited SARR can be obtained as SARRmax from Table 2 for the specified D.O level, and the minimum ammonia nitrogen concentration for that SARR value can be obtained from the same table. The values from Table 2, for a D.O. of 3.0 are: SARRmax = 0.88 g/m2/d and minimum NH3-Ne for that value of SARRmax = 0.80 mg/L. (in the worksheet shown in the first screenshot below, these two values are obtained using Excel’s VLOOKUP function from a table like Table 2, above that is on the worksheet.
The SARR for the design D.O. and ammonia nitrogen removal at 15oC will then be equal to SARRmax if the target effluent ammonia nitrogen concentration is greater than the 0.80 mg/L value determined above. If the target effluent ammonia nitrogen concentration is less than 0.80 mg/L, then the SARR needs to be calculated using Metcalf & Eddy’s equation 9-48. In this case, the target effluent NH3-N of 3.3 mg/L is greater than 0.8 mg/L, so the SARR at 15oC is 0.88 g/m2/d.
The design value for the SARR at the design minimum wastewater temperature
can then be calculated as: SARRT = SARR15(T – 15), where the WW
temperature must be in oC. Since this case has D.O. limited conditions, = 1.058. Carrying out this calculation gives: design value of SALR = 0.65 g/m2/d.
b) The ammonia nitrogen loading rate will be (0.2 MGD)(25 mg/L)(8.34 lb/MG/mg/L)
= 41.7 lb/day = (41.7 lb/day)*(453.59 g/lb) = 18,915 g NH3-N/day
c) Required carrier surface area = (18,915 g/day)/(0.65 g/m2/day) = 28,925 m2. Required carrier volume = 28,925 m2/600 m2/m3. = 48.209 m3 = (48.209 m3)(3.28083 ft3/m3) = 1702 ft3. For 40% carrier fill: Required tank volume = 1702 ft3/0.40 = 4256 ft3.
d) The BOD SALR will be (0.2 MGD)(15 mg/L)(8.34 lb/MG/mg/L)(453.59)/(28925
m2) = 0.39 g/m2/day (Note that this is less than 0.5 g/m2/day as required.)
e) The volume of liquid in the reactor can be calculated as: tank volume – [carrier volume( 1 – void %)], Thus the volume of liquid is: 4256 – [1702(1 – 0.60)] = 3575 ft3.

f) The HRT at design ave ww flow can be calculated as: HRTdes ave = reactor liquid volume*7.48/[Q*106/(24*60)] = 3575*7.48/[0.2*106/(24*60)] = 193 min HRTpeak hr = HRTdes ave/peak hour factor = 193/4 = 48 min
g) Calculation of the alkalinity requirement is shown in the second screenshot below. The alkalinity needed for nitrification is 7.14 g CaCO3/g NH3-N removed. Thus, the alkalinity to be added in mg/L can be calculated as: 7.14(mg/L NH3-N removed) + target effl. Alkalinity – influent alkalinity For the given input values, this becomes: 7.14(25 – 3.3) + 80 – 140 = 94.9 mg/L as CaCO3
The rate of alkalinity addition needed can then be calculated as: (0.2 MGD)(94.9 mg/L)*8.34 = 158.4 lb/day as CaCO3. Multiplying this by the ratio of the equivalent weight of NaHCO3 (84) to the equivalent weight of CaCO3 (50) gives the daily NaHCO3 requirement as 266.0 lb/day NaHCO3.

Screenshot of MBBR Process Design Calculations – Single Stage Nitrification – Part 1
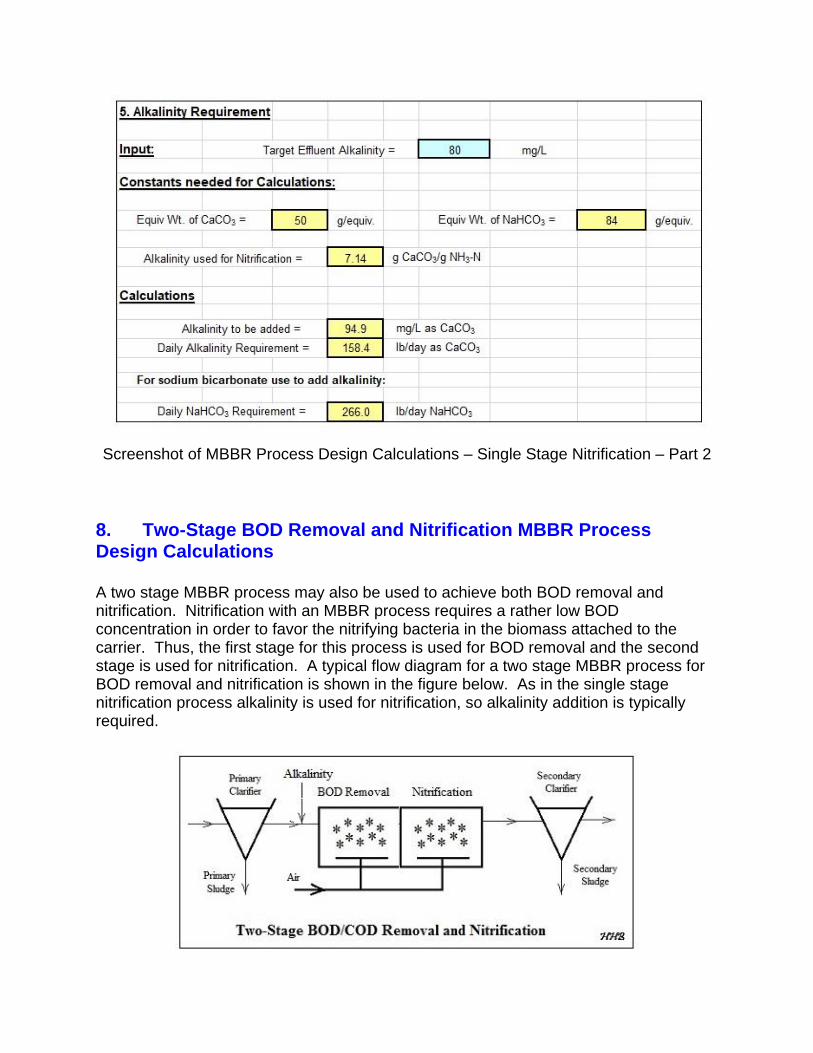
Screenshot of MBBR Process Design Calculations – Single Stage Nitrification – Part 2
8. Two-Stage BOD Removal and Nitrification MBBR Process Design Calculations A two stage MBBR process may also be used to achieve both BOD removal and nitrification. Nitrification with an MBBR process requires a rather low BOD concentration in order to favor the nitrifying bacteria in the biomass attached to the carrier. Thus, the first stage for this process is used for BOD removal and the second stage is used for nitrification. A typical flow diagram for a two stage MBBR process for BOD removal and nitrification is shown in the figure below. As in the single stage nitrification process alkalinity is used for nitrification, so alkalinity addition is typically required.
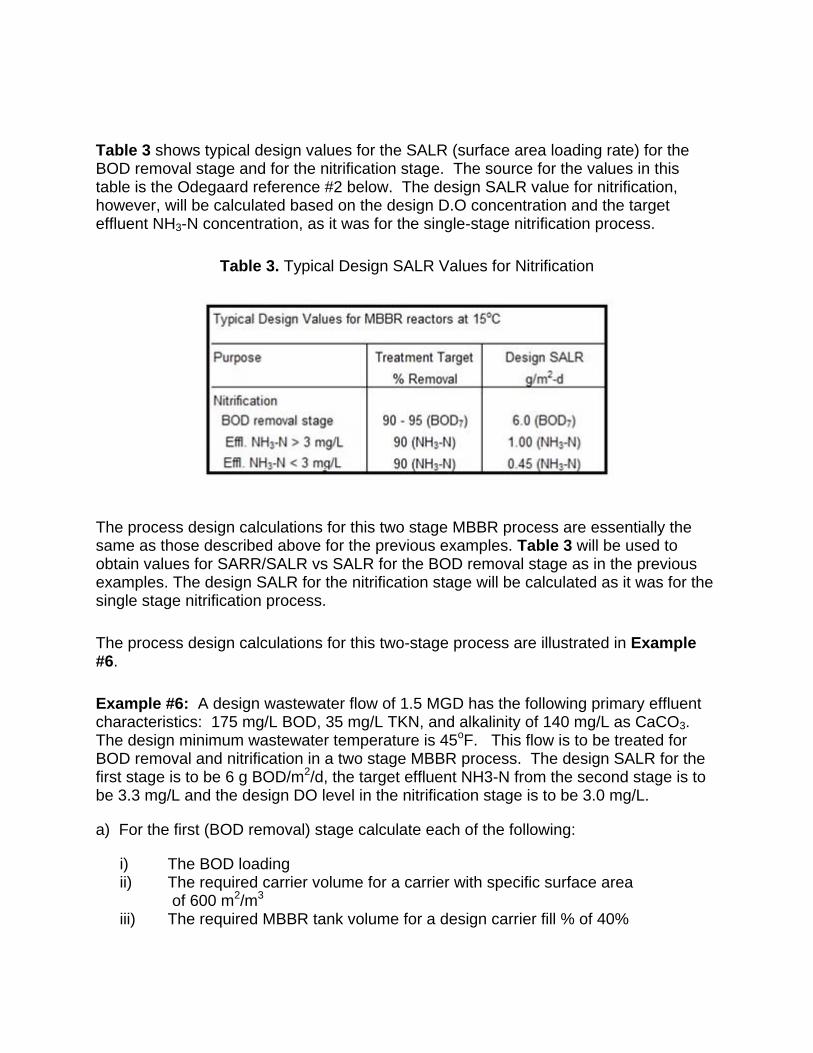
Table 3 shows typical design values for the SALR (surface area loading rate) for the BOD removal stage and for the nitrification stage. The source for the values in this table is the Odegaard reference #2 below. The design SALR value for nitrification, however, will be calculated based on the design D.O concentration and the target effluent NH3-N concentration, as it was for the single-stage nitrification process.
Table 3. Typical Design SALR Values for Nitrification
The process design calculations for this two stage MBBR process are essentially the same as those described above for the previous examples. Table 3 will be used to obtain values for SARR/SALR vs SALR for the BOD removal stage as in the previous examples. The design SALR for the nitrification stage will be calculated as it was for the single stage nitrification process.
The process design calculations for this two-stage process are illustrated in Example #6.
Example #6: A design wastewater flow of 1.5 MGD has the following primary effluent characteristics: 175 mg/L BOD, 35 mg/L TKN, and alkalinity of 140 mg/L as CaCO3. The design minimum wastewater temperature is 45oF. This flow is to be treated for BOD removal and nitrification in a two stage MBBR process. The design SALR for the first stage is to be 6 g BOD/m2/d, the target effluent NH3-N from the second stage is to be 3.3 mg/L and the design DO level in the nitrification stage is to be 3.0 mg/L.
a) For the first (BOD removal) stage calculate each of the following:
i) The BOD loading ii) The required carrier volume for a carrier with specific surface area
of 600 m2/m3 iii) The required MBBR tank volume for a design carrier fill % of 40%

iv) The volume of liquid in the MBBR reactor for design carrier % void space of 60%.
v) The average hydraulic retention time at design average wastewater flow and at design peak hourly flow if the design peak hour factor is 4.
vi) The estimated effluent BOD concentration from the first stage.
b) For the second (Nitrification) stage calculate each of the following:
i) An appropriate NH3-N surface area loading rate (SALR) to be used for this nitrification process, in g NH3-N/m2/d.
ii) The nitrate loading iii) The required carrier volume for a carrier with specific surface area of 600
m2/m3 iv) The required MBBR tank volume for a design carrier fill % of 40% v) The volume of liquid in the MBBR reactor for design carrier void space of
60%. vi) The average hydraulic retention time at design average wastewater flow and
at design peak hourly flow if the design peak hour factor is 4. vii) The alkalinity requirement in lb/day as CaCO3 and in lb/day NaHCO3.
Solution: The solution, as calculated with an Excel spreadsheet, is shown in the three spreadsheet screenshots on the next several pages. The first screenshot, which is the top part of the spreadsheet, shows primarily the user input values. It includes the calculation of the slope and intercept for the SARR/SALR vs SALR equation and the calculation of the estimated SARR for the BOD removal stage. It also includes calculation of the design SALR value for the nitrification stage. These calculations are carried out as discussed above for the single-stage BOD removal and nitrification MBBR processes. The resulting values for SARR/SALR are 0.935 for the first stage with SALR = 6 g BOD/m2/d, and 0.63 g/m2/d for the second stage (nitrification) SALR.
The second screenshot is the bottom part of the spreadsheet and shows the calculated values as follows.
a) For the first stage:
i) The BOD loading rate will be (1.5 MGD)(175 mg/L)(8.34 lb/MG/mg/L) = 2,189 lb/day = (2189 lb/day)*(453.59 g/lb) = 993,022 g BOD/day
ii) Required carrier surface area = (993022 g/day)/(6 g/m2/day) = 165,504 m2.
Required carrier volume = 165,504 m2/600 m2/m3. = 275.8 m3
iii) For 40% carrier fill: Required tank volume = 275.8 m3/0.40 = 689.6 m3.
iv) The volume of liquid in the reactor can be calculated as:
tank volume – [carrier volume( 1 – void %)], Thus the volume of liquid is: 689.6 – [275.8(1 – 0.60)] = 579.3 m3 = 579.3(3.28083) = 20,456 ft3.

v) The HRT at design ave ww flow can be calculated as:
HRTdes ave = reactor liquid volume*7.48/[Q*106/(24*60)] = 20,456*7.48/[1.5*106/(24*60)] = 147 min HRTpeak hr = HRTdes ave/peak hour factor = 147/4 = 37 min
Screenshot of MBBR Process Design Calculations for Two Stage BOD Removal and Nitrification – Part 1

vi) Calculation of the estimated effluent BOD concentration from the first stage as shown above for the single stage BOD removal process gives a value of 11 mg/L.
b) For the second stage:
i) The design value for the nitrification SALR is 0.63 g/m2/d, calculated in the same
way as it was for the single stage nitrification process.
Screenshot of MBBR Process Design Calculations for Two Stage BOD Removal and
Nitrification – Part 2

ii) The NH3-N loading rate will be (1.5 MGD)(35 mg/L)(8.34 lb/MG/mg/L) = 437.9 lb/day = (437.9 lb/day)*(453.59 g/lb) = 198,604 g NH3-N/day
iii) Required carrier surface area = (198,604 g/day)/(0.63 g/m2/day) = 316,914 m2.
Required carrier volume = 316914 m2/600 m2/m3. = 528.19 m3 = (528.19 m3)(3.28083 ft3/m3) = 18,652 ft3.
iv) For 40% carrier fill: Required tank volume = 18652 ft3/0.40 = 46,632 ft3. v) The volume of liquid in the reactor can be calculated as:
tank volume – [carrier volume( 1 – void %)], Thus the volume of liquid is: 46632 – [18652(1 – 0.60)] = 42,736 ft3.
vi) The HRT at design ave ww flow can be calculated as:
HRTdes ave = reactor liquid volume*7.48/[Q*106/(24*60)] = 42736*7.48/[1.5*106/(24*60)] = 307 min HRTpeak hr = HRTdes ave/peak hour factor = 307/4 = 77 min
Screenshot of MBBR Process Design Calculations for Two Stage BOD Removal and Nitrification – Part 3

vii) Calculation of the alkalinity requirement is shown in part 3 of spreadsheet
screenshot, shown above. Using the equivalent weight of CaCO3 as 50, the equivalent weight of NaHCO3 as 84, the alkalinity use for nitrification as 7.14 g CaCO3/g NH3-N and the target effluent alkalinity as 80 mg/L as CaCO3, give the calculated alkalinity requirement as 166.3 mg/L as CaCO3. The rate of alkalinity addition needed can then be calculated as: (1.5 MGD)(166.3 mg/L)*8.34 = 2080.9 lb/day as CaCO3. Multiplying this by the ratio of the equivalent weight of NaHCO3 to the equivalent weight of CaCO3 gives the daily NaHCO3 requirement as 3495.9 lb/day NaHCO3.
9. Denitrification Background Information
In order to carry out denitrification of a wastewater flow (removal of the nitrogen from the wastewater), it is necessary to first nitrify the wastewater, that is, convert the ammonia nitrogen typically present in the influent wastewater to nitrate. Nitrification will only take place at a reasonable rate in an MBBR reactor if the BOD level is quite low. Thus, an MBBR denitrification process will need a reactor for BOD removal, one for nitrification, and one for denitrification. The nitrification reactor will always follow the BOD removal reactor, because of the need for a low BOD level in the nitrification reactor. The denitrification reactor may be either before the BOD removal reactor (called pre-anoxic denitrification) or after the nitrification reactor (called post-anoxic denitrification). Flow diagrams for these two denitrification options are shown in the figure below.
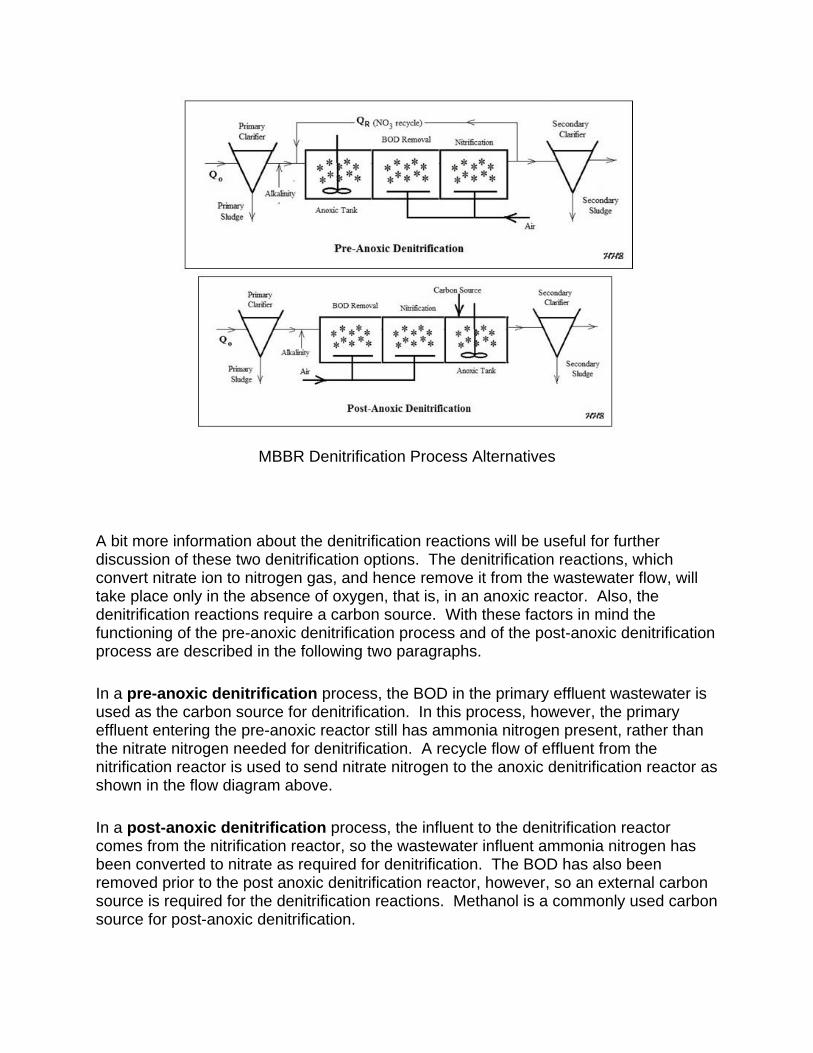
MBBR Denitrification Process Alternatives
A bit more information about the denitrification reactions will be useful for further discussion of these two denitrification options. The denitrification reactions, which convert nitrate ion to nitrogen gas, and hence remove it from the wastewater flow, will take place only in the absence of oxygen, that is, in an anoxic reactor. Also, the denitrification reactions require a carbon source. With these factors in mind the functioning of the pre-anoxic denitrification process and of the post-anoxic denitrification process are described in the following two paragraphs.
In a pre-anoxic denitrification process, the BOD in the primary effluent wastewater is used as the carbon source for denitrification. In this process, however, the primary effluent entering the pre-anoxic reactor still has ammonia nitrogen present, rather than the nitrate nitrogen needed for denitrification. A recycle flow of effluent from the nitrification reactor is used to send nitrate nitrogen to the anoxic denitrification reactor as shown in the flow diagram above.
In a post-anoxic denitrification process, the influent to the denitrification reactor comes from the nitrification reactor, so the wastewater influent ammonia nitrogen has been converted to nitrate as required for denitrification. The BOD has also been removed prior to the post anoxic denitrification reactor, however, so an external carbon source is required for the denitrification reactions. Methanol is a commonly used carbon source for post-anoxic denitrification.
The pre-anoxic denitrification process has the advantage of not requiring an external carbon source and it reduces the BOD load to the BOD removal part of the process, because BOD is used in the denitrification reactions. However, the pre-anoxic process requires an influent C/N ratio greater than 4, where C/N is taken to be BOD/TKN, and the post-anoxic process can achieve a more complete nitrogen removal.
From the Odegaard references (#5 and #6 at the end of the course) suitable criteria for determining whether to use pre- or post-anoxic denitrification are as follows:
1. Pre-anoxic denitrification is suitable if C/N > 4 and target % Removal of N < 75%
2. Post-anoxic denitrification should be used if C/N < 4 or target % Removal of N > 75%
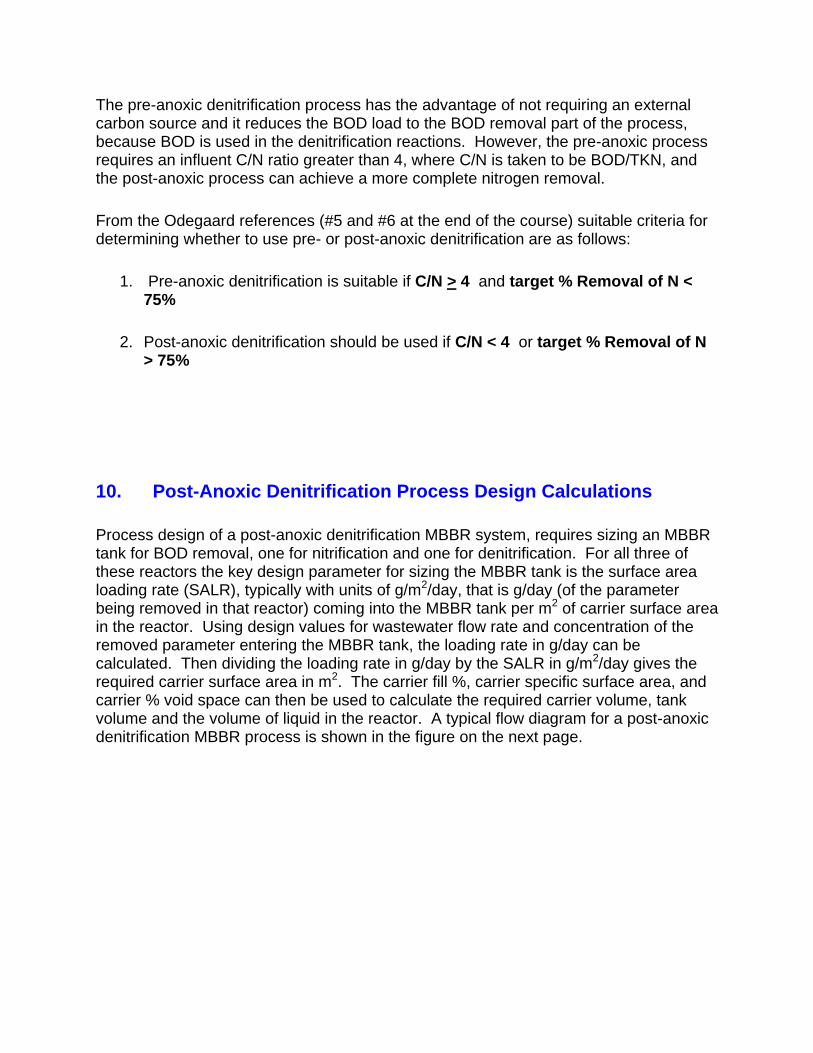
10. Post-Anoxic Denitrification Process Design Calculations
Process design of a post-anoxic denitrification MBBR system, requires sizing an MBBR tank for BOD removal, one for nitrification and one for denitrification. For all three of these reactors the key design parameter for sizing the MBBR tank is the surface area loading rate (SALR), typically with units of g/m2/day, that is g/day (of the parameter being removed in that reactor) coming into the MBBR tank per m2 of carrier surface area in the reactor. Using design values for wastewater flow rate and concentration of the removed parameter entering the MBBR tank, the loading rate in g/day can be calculated. Then dividing the loading rate in g/day by the SALR in g/m2/day gives the required carrier surface area in m2. The carrier fill %, carrier specific surface area, and carrier % void space can then be used to calculate the required carrier volume, tank volume and the volume of liquid in the reactor. A typical flow diagram for a post-anoxic denitrification MBBR process is shown in the figure on the next page.

MBBR Flow Diagram for Post-Anoxic Denitrification
Process design calculations for the BOD removal stage and the nitrification stage will be done just as described in Section 8, Two-Stage BOD Removal and Nitrification Process Design Calculations, and illustrated with the examples in that section. The process design calculations for denitrification, which is the third stage in a post-anoxic denitrification process, are similar to those previously discussed and illustrated for the BOD removal stage and the nitrification stage. The graph shown in the figure below (prepared using values from a similar graph in Rusten and Paulsrud’s presentation in Ref #4 at the end of this course) will be used to obtain values for SARR/SALR vs SALR for the denitrification stage.
SARR vs SALR for Post-Anoxic Denitrification
Table 4 below shows typical SALR design values for pre-anoxic denitrification and post-anoxic denitrification in MBBR reactors. Reference #2 at the end of this book is the source for the values in Table 4.

Table 4. Typical Design SALR Values for Denitrification
Example #7: A design wastewater flow of 1.5 MGD containing 175 mg/L BOD, 35 mg/L TKN, and alkalinity of 140 mg/L as CaCO3 (in the primary effluent) is to be treated in a post-anoxic denitrification MBBR process. The design SALR for the first stage is to be 6 g BOD/m2/d. For the second stage, the SALR should be calculated for a target effluent NH4-N conc. of 3.3 mg/L, min. design temperature of 45oF, and D.O. in reactor of 3.0 mg/L. For the post-anoxic stage, the SALR is to be 2 g NO3-N/m2/d and the target effluent NO3-N conc. is to be 5.0 mg/L.
For the third (Denitrification) stage calculate each of the following:
i) The nitrate loading ii) The required carrier volume for a carrier with specific surface area of 600
m2/m3 iii) The required MBBR tank volume for a design carrier fill % of 40% iv) The volume of liquid in the MBBR reactor for design carrier % void space of
60%. v) The average hydraulic retention time at design average wastewater flow and
at design peak hourly flow if the design peak hour factor is 4. vi) The estimated effluent NO3-N concentration from the denitrification stage. vii) The alkalinity requirement in lb/day as CaCO3 and in lb/day NaHCO3, for
target effluent alkalinity of 80 mg/L as CaCO3.
viii) The methanol requirement in lb/day for methanol use as the carbon source.
Note that the process design calculations for the BOD removal stage and the nitrification stage of this process will be the same as those used in Example #6 in the section on a two-stage BOD removal and nitrification process.
Solution - The solution is shown in the three figures on the next several pages, which are screenshots of different parts of an Excel worksheet used to carry out the calculations for this example. The first figure is from the top part of the worksheet and shows the user inputs and the calculation of the estimated SARR/SALR ratio for the

nitrification stage, resulting in a value of SARR/SALR = 0.85. The second figure is from the middle of the worksheet and shows the answers for parts i) through vi), as follows:
i) The NO3-N loading rate will be (1.5 MGD)(35 – 3.3 mg/L)(8.34 lb/MG/mg/L) = 396.6 lb/day = (396.6 lb/day)*(453.59 g/lb) = 179,879 g NO3-N/day
ii) Required carrier surface area = (179,879 g/day)/(2 g/m2/day) = 89,939 m2.
Required carrier volume = 89,939 m2/600 m2/m3. = 149.90 m3
iii) For 40% carrier fill: Required tank volume = 149.90 m3/0.40 = 374.75 m3.
iv) The volume of liquid in the reactor can be calculated as:
tank volume – [carrier volume( 1 – void %)], Thus the volume of liquid is: 374.75 – [149.90(1 – 0.60)] = 314.79 m3 = 314.79*3.28083 = 11,117 ft3.
v) The HRT at design ave ww flow can be calculated as:
HRTdes ave = reactor liquid volume*7.48/[Q*106/(24*60)] = 11,117*7.48/[1.5*106/(24*60)] = 80 min HRTpeak hr = HRTdes ave/peak hour factor = 80/4 = 20 min
vi) Calculation of the estimated effluent NO3-N concentration from the second
stage, as shown above for the BOD removal process, is shown in the screenshot below and gives a value of 4.8 mg/L,
vii) Calculation of the alkalinity requirement is shown in the third spreadsheet screenshot below. Using the equivalent weight of CaCO3 as 50, the equivalent weight of NaHCO3 as 84, the alkalinity use for nitrification as 7.14 g CaCO3/g NH3-N, the alkalinity produced by denitrification as 3.56 g CaCO3/g NO3-N denitrified, and the target effluent alkalinity as 80 mg/L as CaCO3, give the calculated alkalinity requirement as 81.9 mg/L as CaCO3. The rate of alkalinity addition needed can then be calculated as: (1.5 MGD)(81.9 mg/L)*8.34 = 1024.9 lb/day as CaCO3. Multiplying this by the ratio of the equivalent weight of NaHCO3 to the equivalent weight of CaCO3 gives the daily NaHCO3 requirement as 1721.8 lb/day NaHCO3.
viii) Calculation of the methanol requirement in lb/day is shown at the bottom of the third screenshot below. As shown, the calculations use the constants, 4.6 lb COD/lb NO3-N removed and 1.5 lb COD/lb Methanol. The required methanol dosage is then calculated as: 4.6/1.5 = 3.1 lb methanol /lb NO3-N removed. The methanol requirement in lb/day is then equal to 3.1 times the previously calculated NO3-N removal rate of 337.1 lb/day, or 1033.7 lb/day.

Screenshot – Post-Anoxic Denitrification Design Calculations – Part 1
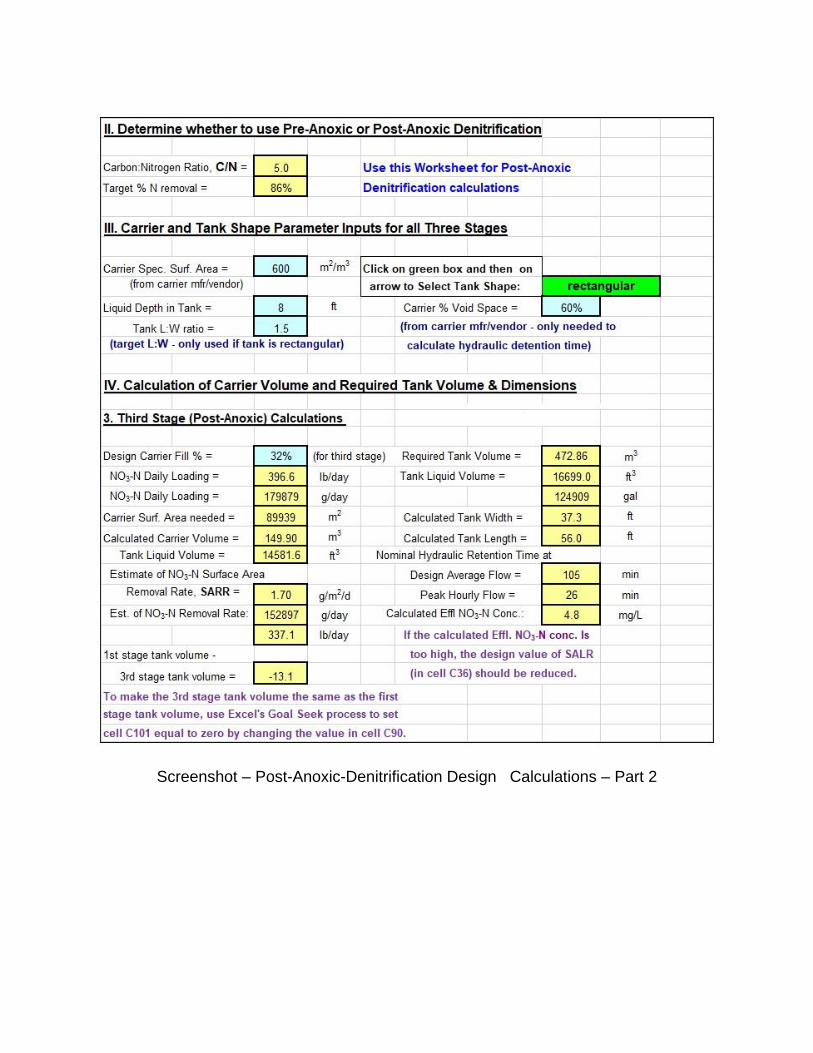
Screenshot – Post-Anoxic-Denitrification Design Calculations – Part 2

Screenshot – Post-Anoxic Denitrification Design Calculations – Part 3
11. Pre-Anoxic Denitrification Process Design Calculations The process design calculations for pre-anoxic denitrification, are similar to those just discussed for a post-anoxic denitrification process. The graph shown in the figure below (prepared using values from a similar graph in Rusten and Paulsrud’s presentation in Ref #4 at the end of this course) will be used to obtain values for SARR/SALR vs SALR for the pre-anoxic denitrification stage.

SARR vs SALR for Pre-Anoxic Denitrification
A typical flow diagram for a pre-anoxic denitrification MBBR process is shown in the figure below. As discussed previously for a post-anoxic denitrification MBBR system, process design of a pre-anoxic denitrification MBBR system also requires sizing an MBBR tank for BOD removal, one for nitrification and one for denitrification. Process design for the nitrification stage is essentially the same as just discussed for the post-anoxic denitrification process.
MBBR Flow Diagram for Pre-Anoxic Denitrification

Process Design calculations for the BOD removal stage will be a bit different from those for the BOD removal stage in the post-anoxic process, because some of the incoming BOD is used as the carbon source for the denitrification reactions in the pre-anoxic tank. For the pre-anoxic process, the BOD loading rate (in lb/day) should be calculated as:
BOD Daily Loading = (Qo*So*8.34) - (0.67*(20/7)*NO3-N removal rate)
The second term is the estimated BOD removal rate in the anoxic reactor through its use in the denitrification reactions. This gives a lower BOD loading rate than that for the post-anoxic process with the same primary clarifier effluent coming in. Hence, the required tank size for BOD removal will be smaller for the pre-anoxic process.
The main difference from the post-anoxic denitrification process design calculations is for the denitrification stage, which will be discussed and illustrated with Example #8 calculations below.
Example #8: Carry out the process design as described below for the denitrification stage of a pre-anoxic denitrification process with the wastewater flow and concentrations given in Example #7. [1.5 MGD containing 175 mg/L BOD and 35 mg/L TKN (in the primary effluent)]. Consider that the primary effluent alkalinity is 140 mg/L as CaCO3 and the design SALR for the denitrification stage is to be 0.9 g NO3-N/m2/d. The nitrification stage was designed for an effluent NH3-N concentration of 3.3 mg/L, a D.O. of 3.0 mg/L, and a minimum WW temperature of 45oF.
For the first stage (denitrification) calculate each of the following:
i) The nitrate loading rate ii) The required carrier volume for a carrier with specific surface area of 600
m2/m3 iii) The required MBBR tank volume for a design carrier fill % of 40% iv) The volume of liquid in the MBBR reactor for design carrier % void space of
60%. v) The average hydraulic retention time at design average wastewater flow and
at design peak hourly flow if the design peak hour factor is 4. vi) The required NO3-N recycle rate needed to achieve a target effluent NO3-N
concentration of 9 mg/L. vii) The alkalinity requirement in lb/day as CaCO3 and in lb/day NaHCO3, for a
target effluent alkalinity of 80 mg/L as CaCO3. Solution - The solution is shown in the three figures on the next several pages, which are screenshots of different parts of an Excel worksheet used to carry out the calculations for this example. The first figure below is from the top part of the worksheet and shows the user inputs and the calculation of the estimated SARR/SALR ratio for the denitrification stage (calculated to be 0.927). Note also that a user input value is needed for the estimated NO3-N recycle ratio. This initial estimated value is used in an iterative calculation farther down on the worksheet (in the second screenshot below) to
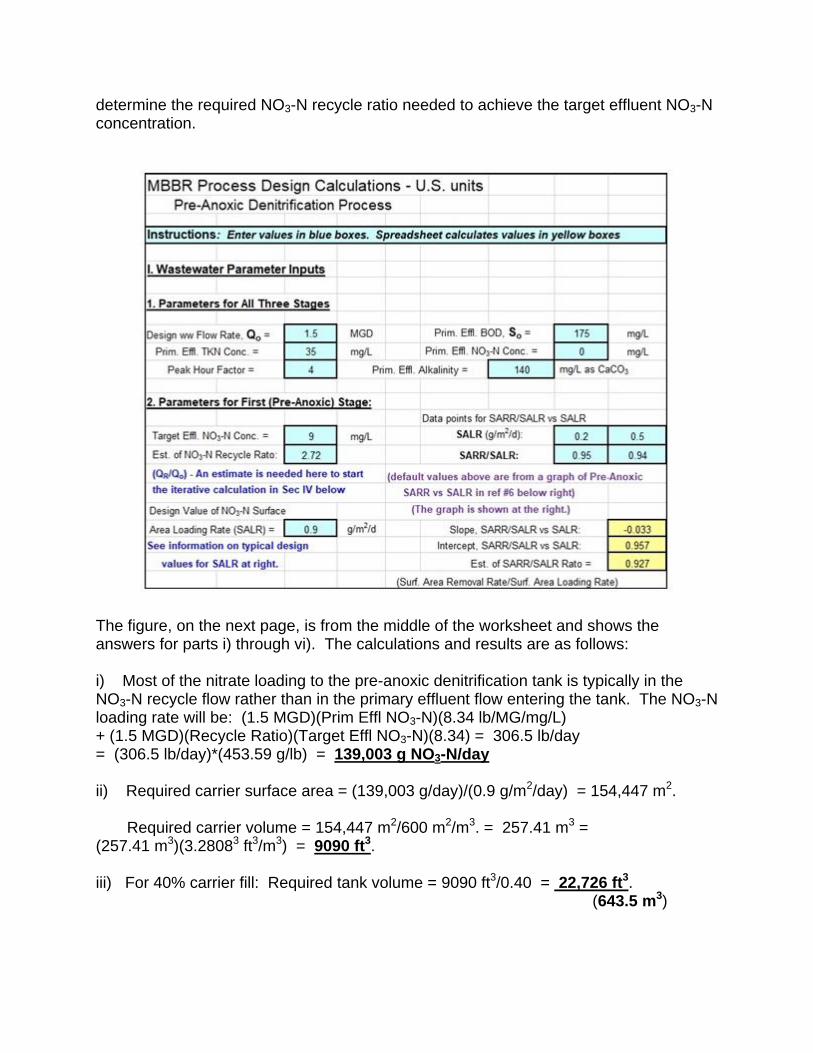
determine the required NO3-N recycle ratio needed to achieve the target effluent NO3-N concentration.
The figure, on the next page, is from the middle of the worksheet and shows the answers for parts i) through vi). The calculations and results are as follows: i) Most of the nitrate loading to the pre-anoxic denitrification tank is typically in the NO3-N recycle flow rather than in the primary effluent flow entering the tank. The NO3-N loading rate will be: (1.5 MGD)(Prim Effl NO3-N)(8.34 lb/MG/mg/L) + (1.5 MGD)(Recycle Ratio)(Target Effl NO3-N)(8.34) = 306.5 lb/day = (306.5 lb/day)*(453.59 g/lb) = 139,003 g NO3-N/day ii) Required carrier surface area = (139,003 g/day)/(0.9 g/m2/day) = 154,447 m2.
Required carrier volume = 154,447 m2/600 m2/m3. = 257.41 m3 = (257.41 m3)(3.28083 ft3/m3) = 9090 ft3. iii) For 40% carrier fill: Required tank volume = 9090 ft3/0.40 = 22,726 ft3. (643.5 m3)
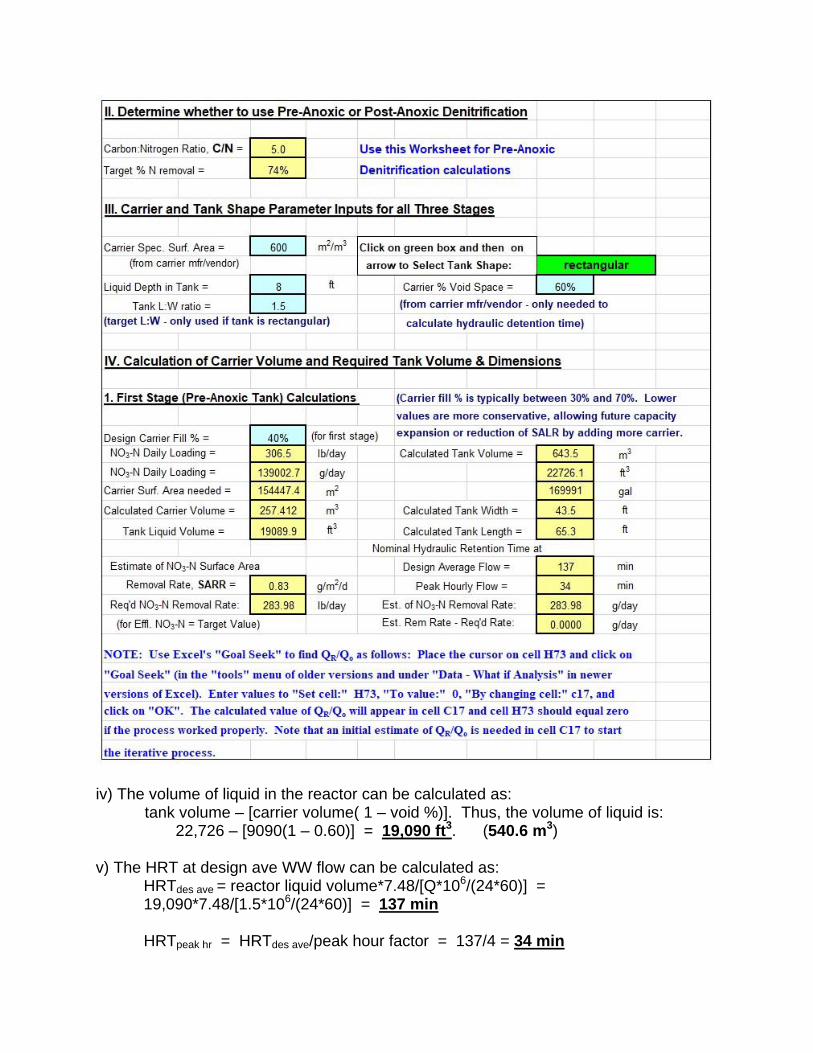
iv) The volume of liquid in the reactor can be calculated as: tank volume – [carrier volume( 1 – void %)]. Thus, the volume of liquid is: 22,726 – [9090(1 – 0.60)] = 19,090 ft3. (540.6 m3) v) The HRT at design ave WW flow can be calculated as:
HRTdes ave = reactor liquid volume*7.48/[Q*106/(24*60)] = 19,090*7.48/[1.5*106/(24*60)] = 137 min HRTpeak hr = HRTdes ave/peak hour factor = 137/4 = 34 min
vi) The required NO3-N recycle ratio is calculated with the iterative process described in blue at the bottom of the last figure above. For this iterative process, the NO3-N removal rate is calculated two different ways, one using the estimated SARR and the carrier surface area while the other uses the wastewater flow rate times the influent TKN concentration minus the sum of the effluent nitrate and ammonia nitrogen concentrations. Excel’s Goal Seek process is then used to set the difference between the two different calculations equal to zero by changing the estimated value of the NO3-N recycle ratio. This process results in the required NO3-N recycle ratio calculated to be 2.72.
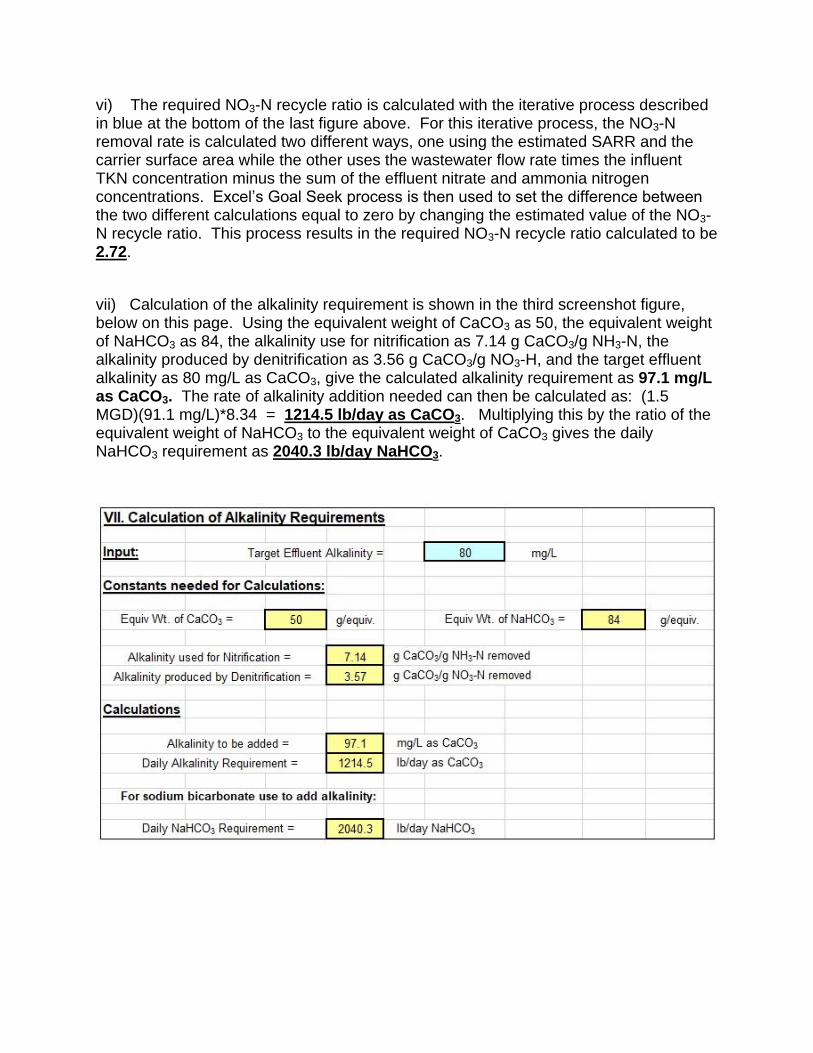
vii) Calculation of the alkalinity requirement is shown in the third screenshot figure, below on this page. Using the equivalent weight of CaCO3 as 50, the equivalent weight of NaHCO3 as 84, the alkalinity use for nitrification as 7.14 g CaCO3/g NH3-N, the alkalinity produced by denitrification as 3.56 g CaCO3/g NO3-H, and the target effluent alkalinity as 80 mg/L as CaCO3, give the calculated alkalinity requirement as 97.1 mg/L as CaCO3. The rate of alkalinity addition needed can then be calculated as: (1.5 MGD)(91.1 mg/L)*8.34 = 1214.5 lb/day as CaCO3. Multiplying this by the ratio of the equivalent weight of NaHCO3 to the equivalent weight of CaCO3 gives the daily NaHCO3 requirement as 2040.3 lb/day NaHCO3.

12. Summary
The MBBR (moving bed biofilm reactor) process is an attached growth process that uses plastic carriers to provide a surface on which biofilm grows. The plastic carriers are kept suspended in the aeration tank by an aerator for an aerobic process or by mechanical mixing for an anoxic or anaerobic process. The plastic carriers are kept in the system by a sieve at the outlet of the tank. The MBBR process doesn’t require sludge recycle, because the biomass remains in the system attached to the plastic carriers. The required reactor size for an MBBR process is typically significantly smaller than that for an activated sludge process treating the same wastewater flow, or for other common attached growth processes like the RBC or trickling filter. It can be used for BOD removal, biological nitrification, biological denitrification, and biological phosphorus removal.
This course provides discussion of and detailed examples of process design calculations for a single stage BOD removal MBBR system, a two-stage BOD removal MBBR system, a single stage tertiary nitrification MBBR system, a two-stage BOD removal/Nitrification MBBR system a post-anoxic denitrification MBBR system and a pre-anoxic denitrification MBBR system.
13. References
1. Odegaard, Hallvard, “Compact Wastewater Treatment with MBBR,” DSD
International Conference, Hong Kong, 12, 11-14-2014.
2. Odegaard, H., “The Moving Bed Biofilm Reactor,” in Igrarashi, T, Watanabe, Y,
Asano, T, and Tambo N., “Water Environmental Engineering and Reuse of
Water,” Hokkaido Press 1999, p 250-305.
3. Steichen, M. & Phillips, H., Black & Veach, “Process and Practical
Considerations for IFAS and MBBR Technologies,” Headworks International
Presentation, 03/18/2010.
4. Rusten, B. and Paulsrud, B, Improved Nutrient Removal with Biofilm Reactors,
Aquateam – Norwegian Water Technology Center, Oslo, Norway.
5. McQuarrie, J.P. and Boltz, J.Pl, Moving Bed Biofilm Reactor Technology:
Process Applications, Design and Performance, Water Environment Research,
Vol 83, No. 6, June 2011.

6. Bengtson, Harlan H., “MBBR Wastewater Treatment Design Spreadsheet,” An
online article at www.EngineeringExcelSpreadsheets.com, 2015.
7. Bengtson, Harlan H., “Spreadsheets for MBBR Wastewater Treatment Process
Design Calculations,” available as a paperback or as an Amazon Kindle e-book,
2017.
8. Bengtson, Harlan H., “Spreadsheets for MBBR Denitrification Design
Calculations,” an Amazon Kindle e-book, 2017.
9. Bengtson, Harlan H., “Biological Wastewater Treatment Process Design Calculations,” available as an Amazon Kindle e-book or as a paperback book, 2017.