Embed Size (px)
Citation preview
B I O L O G I C A L C O N S E R V A T I O N 1 3 0 ( 2 0 0 6 ) 5 1 7 – 5 2 9
. sc iencedi rec t . com
ava i lab le a t wwwjournal homepage: www.elsevier .com/ locate /b iocon
Seal–fishery operational interactions: Identifying theenvironmental and operational aspects of a trawlfishery that contribute to by-catch and mortality ofAustralian fur seals (Arctocephalus pusillus doriferus)
Derek J. Hamer*, Simon D. Goldsworthy
South Australian Research and Development Institute, Aquatic Sciences, 2 Hamra Avenue, West Beach, Adelaide,
South Australia 5024, Australia
A R T I C L E I N F O
Article history:
Received 1 June 2005
Received in revised form
11 January 2006
Accepted 16 January 2006
Available online 2 March 2006
Keywords:
Australian fur seal
Operational interactions
By-catch mortality
Trawl fishery
Fisheries management
Generalised linear modelling
0006-3207/$ - see front matter � 2006 Elsevidoi:10.1016/j.biocon.2006.01.014
* Corresponding author: Tel.: +61 8 8207 5348E-mail addresses: [email protected]
A B S T R A C T
Australian fur seals are known to interact directly (i.e. operational interactions) with trawl-
ers fishing in the winter blue grenadier trawl fishery of western Tasmania, Australia. The
purpose of this study was to identify the environmental and operational aspects of the fish-
ery that were associated with increased numbers of seals observed at the surface. The inci-
dence of net entry was determined in order to establish the effectiveness of the currently
used Seal Exclusion Device (SED) at reducing by-catch and mortalities. In addition, the
stage and depth at which seals were at greatest risk of entering the net at depth and
becoming by-catch were also identified.
An increase in seal numbers observed at the surface is assumed to be proportional to the
increased risk of by-catch and mortality incidences at trawlers. The most important subset
of environmental and operational factors for predicting the number of seals observed at the
surface both in the fishing ground in general and during fishing operations were identified
using Generalised Linear Modelling. The final model yielded a significant result (R2 = 0.63,
P < 0.01, n = 149) and indicated that the number of seals observed increased when weather
conditions deteriorated, particularly when barometric pressure decreased and when swell
height and visibility increased. Vessel operations also influenced the number of seals
observed; seal numbers increased when the number of nearby vessels and trawl frequency
increased, but decreased when vessel speed increased. Seal numbers also increased as the
distance from the nearest breeding colony and haul-out site decreased.
Seal numbers at the surface generally increased steadily during trawling operations
(n = 475), although brief declines were noted during shooting and hauling phases. Sub-surface
net interactions were also examined using a submersible video camera unit. Seal activity at
depth was converse to that observed at the surface, with increased seal numbers noted during
shooting and hauling, suggesting that seals dived to forage on fish in the submerged net.
All seal by-catch occurred during the day and almost half occurred during shooting. Mortal-
ities were significantly higher during shooting compared with hauling (Fishers exact test:
coef. = 0.65, P < 0.05). However, mortality rates were similar between tows with the Seal Exclu-
sion Device (SED) attached and those without (Fishers exact test: coef. = 0.07, P < 0.99). Only
one seal was detected entering and exiting the net mouth during monitored tows, suggesting
that the recently observed reduction in by-catch levels (and mortalities) may not necessarily
er Ltd. All rights reserved.
; fax: +61 8 8207 5406..gov.au (D.J. Hamer), [email protected] (S.D. Goldsworthy).
518 B I O L O G I C A L C O N S E R V A T I O N 1 3 0 ( 2 0 0 6 ) 5 1 7 – 5 2 9
be attributed to the introduction of the Seal Exclusion Device. Seal by-catch recorded during
hauling typically occurred when haul speeds exceeded minimum average swimming speeds
for fur seals.
Recommendations based on these findings have been made to assist with the future man-
agement of fur seal populations that interact with trawl fisheries.
� 2006 Elsevier Ltd. All rights reserved.
1. Introduction
1.1. Operational interactions between seals andcommercial trawl fisheries
The unintentional catch of non-target or ‘‘by-catch’’ species
has been detected in almost all fisheries, accounting for be-
tween 17% and 39% of the catch (Alverson et al., 1994; Wic-
kens, 1995; Alverson, 1999). In some fisheries, by-catch rates
are of similar or higher proportions to the species targeted
(Carbonell et al., 2003). In the past, many fisheries have re-
garded non-target species as economically unimportant,
partly explaining the historical absence of by-catch manage-
ment plans (Alverson, 1999; Harris and Ward, 1999; Bunting,
2002; Bache, 2003). Consequently, the importance of by-catch
in the conservation and management of marine mammal
populations in particular and the ecologically sustainable
development of commercial fisheries that interact with them
has only recently become a major management issue (Hall
et al., 2000; Goldsworthy et al., 2003).
The occurrence of operational interactions between seals
and fisheries, resulting in by-catch and associated mortali-
ties, is now globally widespread. The recent recovery of seal
species after the cessation of commercial sealing in most
countries, plus the concomitant increases in fishing technol-
ogy over the last five decades has likely contributed to the
marked increase of this problem (Beverton, 1985; Wickens,
1995; Shaughnessy et al., 2003). Global reviews of seal–fishery
interactions demonstrate an increase from 16 affected seal
species in the early 1980s (Northridge, 1984, 1991; Woodley
and Lavigne, 1991), to 36 in the early 1990s (Wickens, 1995),
although these figures may in part be explained by a general
increasing in awareness. With the advent of the conservation
movement over the last four decades, seals have become
‘charismatic’ animals in the public domain, with perceptions
and attitudes subsequently evolving from that of consump-
tive exploitation to conservation and welfare (Alverson
et al., 1994; Hall et al., 2000; Bache, 2003).
Seals and commercial fisheries often target the same food
resource. These consumer groups inevitably come together at
a retracted spatial and temporal scale, thus leading to ‘opera-
tional interactions’ (Beverton, 1985; Shaughnessy et al., 2003;
Tilzey et al., 2004). Operational interactions between seals
and fisheries occur when seals come into direct contact with
fishing gear, due to the spatially retracted abundance of fish
(Northridge, 1991; Woodley and Lavigne, 1991; Wickens et al.,
1992; Pemberton et al., 1994; Wickens, 1995; Fraker and Mate,
1999; Northridge and Hofman, 1999; Shaughnessy et al., 2003).
These foraging opportunities at or near the surface are an
advantage for seals, because they negate the requirement for
deep foraging dives that are energetically expensive (Huckstadt
and Antezana, 2003; National Marine Fisheries Service, 1992;
Williams et al., 2004). However, there are disadvantages to both
the fishery and the seals; target fish are often discouraged from
entering the net when seals are present and seals may risk in-
jury or death if they also become caught (Shaughnessy, 1985;
Loughlin and Nelson, 1986; Wickens et al., 1992; Wickens,
1994; Pemberton et al., 1994; Shaughnessy et al., 2003; Wilkin-
son et al., 2003; Tilzey et al., 2004). The extent of seal–fishery
operational interactions and the associated risk of seals becom-
ing by-catch may be dependent on the biology, ecology and
behaviour of the seal species involved and the type, location
and nature of the fishery concerned (Northridge, 1984).
1.1.1. Environmental and operational variables associatedwith seal interactionsAlthough extensive information has been compiled on seal
by-catch rates in a number of fisheries, little is known about
the environmental and operational variables most closely
associated with the numbers of seals observed from fishing
vessels. A number of variables that might be important deter-
minants include the prevalence of animals naturally occurring
in the fishing area, the time of day, the trawl duration and haul
speed, although none of these have been quantitatively sup-
ported (Waring et al., 1990; Morizur et al., 1999; Shaughnessy
et al., 2003). Interactions between the southern sea lion (Otaria
flavescens) and the central Chilean purse-seine fishery indi-
cated that the number of seals observed were generally posi-
tively correlated with the duration of fishing operations, the
number of vessels in the fishing ground, commercial catch
rates and the distance to the closest haul-out site (Huckstadt
and Antezana, 2003; Huckstadt and Krautz, 2004). Catch
weight and the presence of specific by-catch species may also
influence the numbers of seals observed at the fishing vessel
(Manly et al., 2002; Tilzey et al., 2004).
Determining the circumstances under which seal numbers
increase at fishing vessels may be crucial for predicting when
seal–fishery operational interactions are more likely to occur.
Moreover, identifying a subset of important variables associ-
ated with increased numbers of seals at trawlers will facilitate
a more directed management approach for mitigating future
seal–fishery interactions.
1.2. Seal by-catch in the winter blue grenadier fishery ofwestern Tasmania
Commercial quantities of blue grenadier (Macruronus novaeze-
landiae) are caught off western Tasmania, Australia (Fig. 1).
However, only 46% (5734 metric tonnes) of the total allowable
catch (TAC) of 12 409 metric tonnes was caught in 1998 (Aus-

Fig. 1 – Approximate location of the winter blue grenadier
fishery off western Tasmania during 2003. The location of
Australian fur seal breeding and haul-out locations is also
provided.
Fig. 2 – Schematic of seal exclusion device (SED)
configuration used in trawl nets by factory trawlers off
western Tasmania. Courtesy: Hoki Fishery Management
Company NZ.
B I O L O G I C A L C O N S E R V A T I O N 1 3 0 ( 2 0 0 6 ) 5 1 7 – 5 2 9 519
tralian Fisheries Management Authority, 1999). Notwith-
standing, a strong pulse of sexually mature blue grenadier
was predicted to enter the spawning stock in 1999, prompting
the decision by the Australian Fisheries Management Author-
ity (AFMA) to allow factory trawlers into the fishery to ensure
the full utilisation of the total allowable catch (Australian
Fisheries Management Authority, 1999).
Factory trawlers experienced a high Australian fur seal
(Arctocephalus pusillus doriferus) by-catch mortality rate in their
first year of operation, with 89 seals caught from 665 trawl
events (Australian Fisheries Management Authority, 1999; Til-
zey, 2002; Tilzey et al., 2004). In response, the Australian Fish-
eries Management Authority required factory trawlers to
include the seal exclusion device (SED) in trawl nets as the
principal gear modification for mitigating seal by-catch (Til-
zey, 2002). The seal exclusion device comprises a stainless
steel grid placed in front of the cod-end and an escape hatch
some 5 m ahead of the grid (Tilzey, 2002; Wilkinson et al.,
2003) (Fig. 2). In principal, the seal exclusion device allows
the uninterrupted passage of fish through to the cod-end
while prohibiting the entry and facilitating the escape of
seals, subsequently reducing the risk to seals of drowning.
1.2.1. The effectiveness of the seal exclusion device forreducing seal by-catchThe inclusion of seal exclusion devices in fishing gear used by
factory trawlers in this fishery and the concomitant reduction
in the Australian fur seal by-catch rate over three fishing sea-
sons between 2000 and 2002 has lead to the conclusion that
Seal Exclusion Devices are responsible for the observed reduc-
tion of seal by-catch and mortality on factory trawlers (Tilzey,
2002; Tilzey et al., 2004). However, the incidence rate of sub-
surface net entry is not available, making a quantitative deter-
mination impossible. The reduction in by-catch incidence
may instead be due to the removal of habituated individuals
through previous by-catch mortality, or changes in unidenti-
fied environmental variables leading to an overall reduction
in the numbers of animals present in the region of the fishery.
The concomitant reduction in the incidence of sub-surface net
entry that would be expected outcomes of these two circum-
stances cannot be discounted as the cause for reduced seal
mortalities, rather than the presence of the seal exclusion de-
vices alone. Therefore, the perceived success of the seal exclu-
sion devices must be validated. This may be achieved firstly by
quantifying the incidence of sub-surface net entry by fur seals
and secondly by comparing the incidence of by-catch and
mortality that occurred during trawl events that had the seal
exclusion device attached with those that did not.
1.2.2. Stage and depth of net entry by sealsIt is difficult to determine at what stage or depth a seal is at
greatest risk of becoming caught in trawl nets, although it is
generally accepted that they become caught in the net during
hauling while foraging on the catch. However, seal mortalities
in trawl nets may also occur when the net is deployed at the
beginning of the trawling event (Shaughnessy and Payne,
1979), but this has not been conclusively demonstrated.
Therefore, determining when seals enter the trawl net may
be useful to the further improvement of fishing practices to
mitigate seal by-catch.
Blue grenadier is predominantly caught at depths between
300 m and 600 m (Smith, 1994; Tilzey, 1994). Dive data for Aus-
tralian fur seals are limited, although a single record of 102 m
maximum depth for an adult male (Hindell and Pemberton,
1997) and 164 m mean max depth for adult females (Arnould
and Hindell, 2001) suggest that they are unlikely to forage nat-
urally on blue grenadier due to the lack of vertical overlap.
However, blue grenadier may become available during fishing
operations, when they are hauled into the upper water
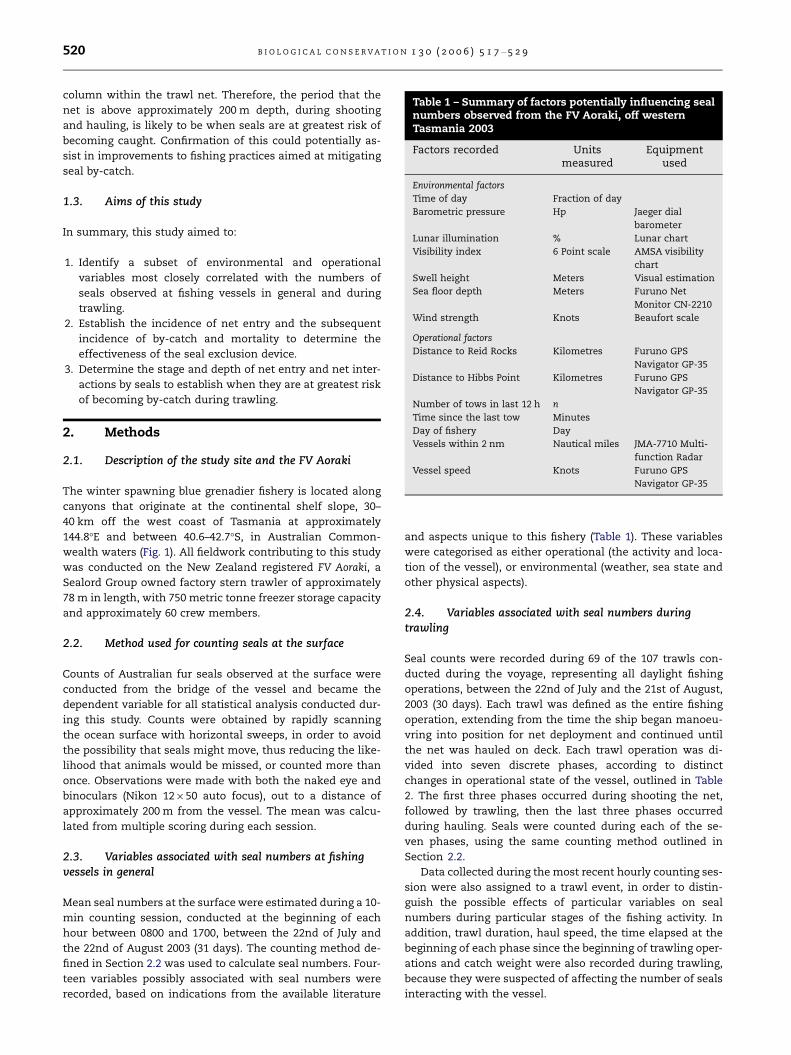
Table 1 – Summary of factors potentially influencing sealnumbers observed from the FV Aoraki, off westernTasmania 2003
Factors recorded Unitsmeasured
Equipmentused
Environmental factors
Time of day Fraction of day
Barometric pressure Hp Jaeger dial
barometer
Lunar illumination % Lunar chart
Visibility index 6 Point scale AMSA visibility
chart
Swell height Meters Visual estimation
Sea floor depth Meters Furuno Net
Monitor CN-2210
Wind strength Knots Beaufort scale
Operational factors
Distance to Reid Rocks Kilometres Furuno GPS
Navigator GP-35
Distance to Hibbs Point Kilometres Furuno GPS
Navigator GP-35
Number of tows in last 12 h n
Time since the last tow Minutes
Day of fishery Day
Vessels within 2 nm Nautical miles JMA-7710 Multi-
function Radar
Vessel speed Knots Furuno GPS
Navigator GP-35
520 B I O L O G I C A L C O N S E R V A T I O N 1 3 0 ( 2 0 0 6 ) 5 1 7 – 5 2 9
column within the trawl net. Therefore, the period that the
net is above approximately 200 m depth, during shooting
and hauling, is likely to be when seals are at greatest risk of
becoming caught. Confirmation of this could potentially as-
sist in improvements to fishing practices aimed at mitigating
seal by-catch.
1.3. Aims of this study
In summary, this study aimed to:
1. Identify a subset of environmental and operational
variables most closely correlated with the numbers of
seals observed at fishing vessels in general and during
trawling.
2. Establish the incidence of net entry and the subsequent
incidence of by-catch and mortality to determine the
effectiveness of the seal exclusion device.
3. Determine the stage and depth of net entry and net inter-
actions by seals to establish when they are at greatest risk
of becoming by-catch during trawling.
2. Methods
2.1. Description of the study site and the FV Aoraki
The winter spawning blue grenadier fishery is located along
canyons that originate at the continental shelf slope, 30–
40 km off the west coast of Tasmania at approximately
144.8�E and between 40.6–42.7�S, in Australian Common-
wealth waters (Fig. 1). All fieldwork contributing to this study
was conducted on the New Zealand registered FV Aoraki, a
Sealord Group owned factory stern trawler of approximately
78 m in length, with 750 metric tonne freezer storage capacity
and approximately 60 crew members.
2.2. Method used for counting seals at the surface
Counts of Australian fur seals observed at the surface were
conducted from the bridge of the vessel and became the
dependent variable for all statistical analysis conducted dur-
ing this study. Counts were obtained by rapidly scanning
the ocean surface with horizontal sweeps, in order to avoid
the possibility that seals might move, thus reducing the like-
lihood that animals would be missed, or counted more than
once. Observations were made with both the naked eye and
binoculars (Nikon 12 · 50 auto focus), out to a distance of
approximately 200 m from the vessel. The mean was calcu-
lated from multiple scoring during each session.
2.3. Variables associated with seal numbers at fishingvessels in general
Mean seal numbers at the surface were estimated during a 10-
min counting session, conducted at the beginning of each
hour between 0800 and 1700, between the 22nd of July and
the 22nd of August 2003 (31 days). The counting method de-
fined in Section 2.2 was used to calculate seal numbers. Four-
teen variables possibly associated with seal numbers were
recorded, based on indications from the available literature
and aspects unique to this fishery (Table 1). These variables
were categorised as either operational (the activity and loca-
tion of the vessel), or environmental (weather, sea state and
other physical aspects).
2.4. Variables associated with seal numbers duringtrawling
Seal counts were recorded during 69 of the 107 trawls con-
ducted during the voyage, representing all daylight fishing
operations, between the 22nd of July and the 21st of August,
2003 (30 days). Each trawl was defined as the entire fishing
operation, extending from the time the ship began manoeu-
vring into position for net deployment and continued until
the net was hauled on deck. Each trawl operation was di-
vided into seven discrete phases, according to distinct
changes in operational state of the vessel, outlined in Table
2. The first three phases occurred during shooting the net,
followed by trawling, then the last three phases occurred
during hauling. Seals were counted during each of the se-
ven phases, using the same counting method outlined in
Section 2.2.
Data collected during the most recent hourly counting ses-
sion were also assigned to a trawl event, in order to distin-
guish the possible effects of particular variables on seal
numbers during particular stages of the fishing activity. In
addition, trawl duration, haul speed, the time elapsed at the
beginning of each phase since the beginning of trawling oper-
ations and catch weight were also recorded during trawling,
because they were suspected of affecting the number of seals
interacting with the vessel.
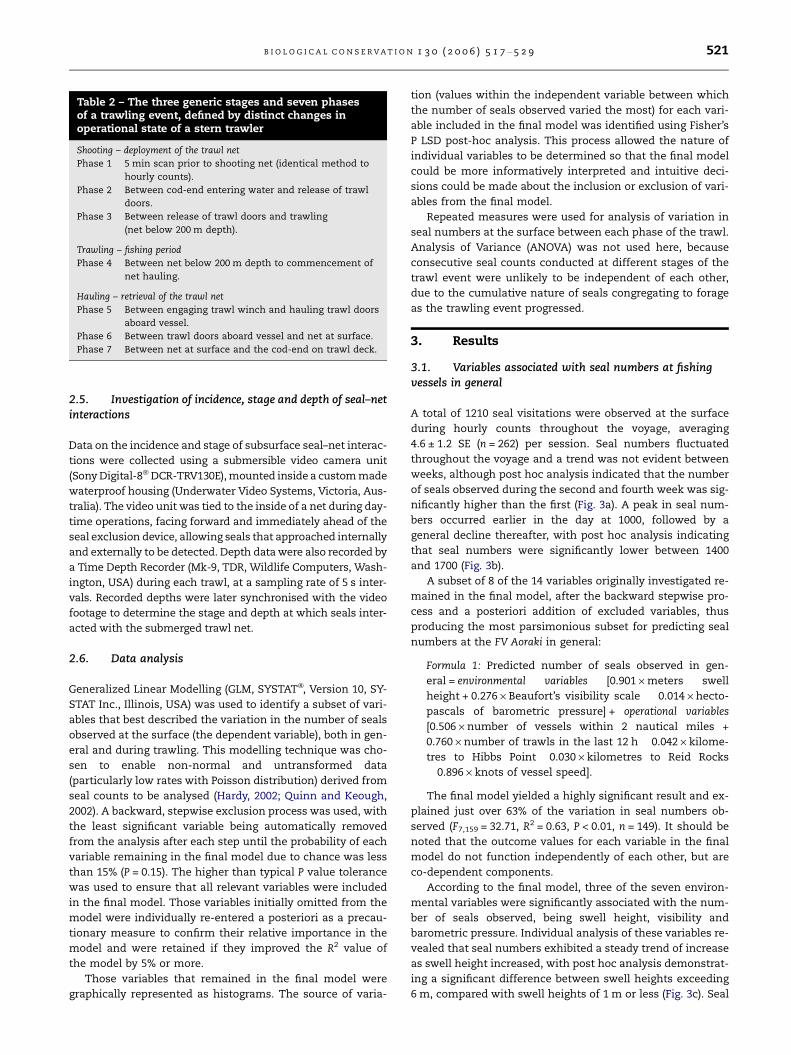
Table 2 – The three generic stages and seven phasesof a trawling event, defined by distinct changes inoperational state of a stern trawler
Shooting – deployment of the trawl net
Phase 1 5 min scan prior to shooting net (identical method to
hourly counts).
Phase 2 Between cod-end entering water and release of trawl
doors.
Phase 3 Between release of trawl doors and trawling
(net below 200 m depth).
Trawling – fishing period
Phase 4 Between net below 200 m depth to commencement of
net hauling.
Hauling – retrieval of the trawl net
Phase 5 Between engaging trawl winch and hauling trawl doors
aboard vessel.
Phase 6 Between trawl doors aboard vessel and net at surface.
Phase 7 Between net at surface and the cod-end on trawl deck.
B I O L O G I C A L C O N S E R V A T I O N 1 3 0 ( 2 0 0 6 ) 5 1 7 – 5 2 9 521
2.5. Investigation of incidence, stage and depth of seal–netinteractions
Data on the incidence and stage of subsurface seal–net interac-
tions were collected using a submersible video camera unit
(Sony Digital-8� DCR-TRV130E), mounted inside a custom made
waterproof housing (Underwater Video Systems, Victoria, Aus-
tralia). The video unit was tied to the inside of a net during day-
time operations, facing forward and immediately ahead of the
seal exclusion device, allowing seals that approached internally
and externally to be detected. Depth data were also recorded by
a Time Depth Recorder (Mk-9, TDR, Wildlife Computers, Wash-
ington, USA) during each trawl, at a sampling rate of 5 s inter-
vals. Recorded depths were later synchronised with the video
footage to determine the stage and depth at which seals inter-
acted with the submerged trawl net.
2.6. Data analysis
Generalized Linear Modelling (GLM, SYSTAT�, Version 10, SY-
STAT Inc., Illinois, USA) was used to identify a subset of vari-
ables that best described the variation in the number of seals
observed at the surface (the dependent variable), both in gen-
eral and during trawling. This modelling technique was cho-
sen to enable non-normal and untransformed data
(particularly low rates with Poisson distribution) derived from
seal counts to be analysed (Hardy, 2002; Quinn and Keough,
2002). A backward, stepwise exclusion process was used, with
the least significant variable being automatically removed
from the analysis after each step until the probability of each
variable remaining in the final model due to chance was less
than 15% (P = 0.15). The higher than typical P value tolerance
was used to ensure that all relevant variables were included
in the final model. Those variables initially omitted from the
model were individually re-entered a posteriori as a precau-
tionary measure to confirm their relative importance in the
model and were retained if they improved the R2 value of
the model by 5% or more.
Those variables that remained in the final model were
graphically represented as histograms. The source of varia-
tion (values within the independent variable between which
the number of seals observed varied the most) for each vari-
able included in the final model was identified using Fisher’s
P LSD post-hoc analysis. This process allowed the nature of
individual variables to be determined so that the final model
could be more informatively interpreted and intuitive deci-
sions could be made about the inclusion or exclusion of vari-
ables from the final model.
Repeated measures were used for analysis of variation in
seal numbers at the surface between each phase of the trawl.
Analysis of Variance (ANOVA) was not used here, because
consecutive seal counts conducted at different stages of the
trawl event were unlikely to be independent of each other,
due to the cumulative nature of seals congregating to forage
as the trawling event progressed.
3. Results
3.1. Variables associated with seal numbers at fishingvessels in general
A total of 1210 seal visitations were observed at the surface
during hourly counts throughout the voyage, averaging
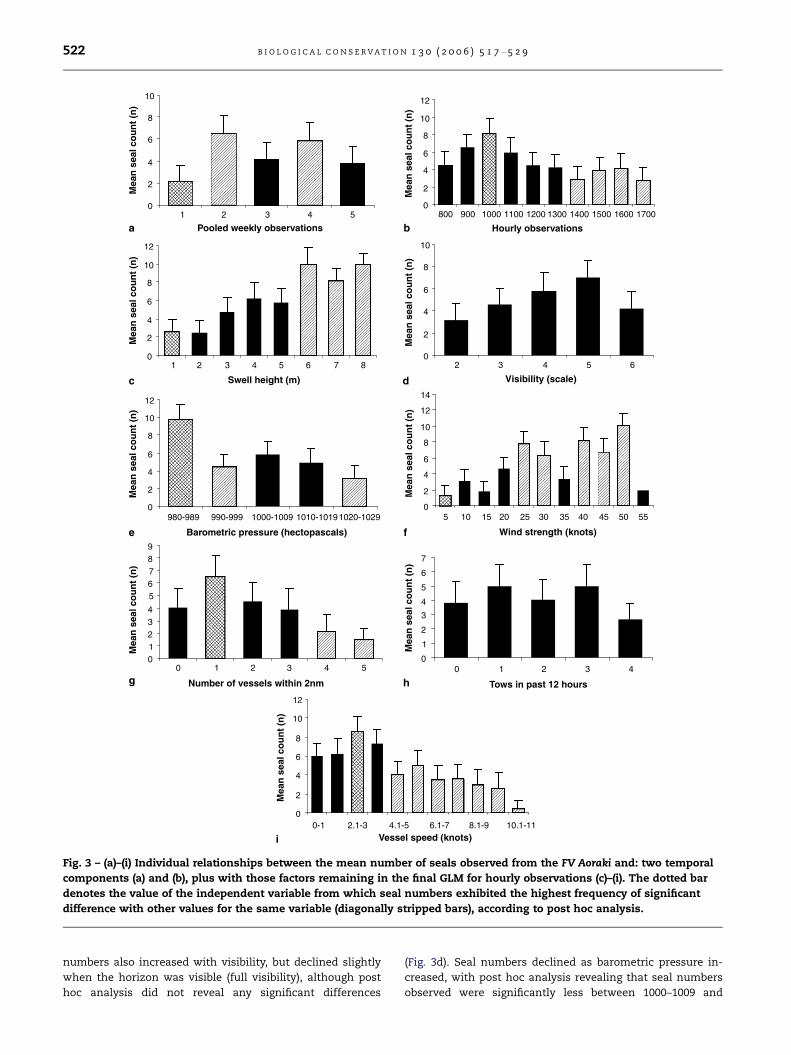
4.6 ± 1.2 SE (n = 262) per session. Seal numbers fluctuated
throughout the voyage and a trend was not evident between
weeks, although post hoc analysis indicated that the number
of seals observed during the second and fourth week was sig-
nificantly higher than the first (Fig. 3a). A peak in seal num-
bers occurred earlier in the day at 1000, followed by a
general decline thereafter, with post hoc analysis indicating
that seal numbers were significantly lower between 1400
and 1700 (Fig. 3b).
A subset of 8 of the 14 variables originally investigated re-
mained in the final model, after the backward stepwise pro-
cess and a posteriori addition of excluded variables, thus
producing the most parsimonious subset for predicting seal
numbers at the FV Aoraki in general:
Formula 1: Predicted number of seals observed in gen-
eral = environmental variables [0.901 · meters swell
height + 0.276 · Beaufort’s visibility scale � 0.014 · hecto-
pascals of barometric pressure] + operational variables
[0.506 · number of vessels within 2 nautical miles +
0.760 · number of trawls in the last 12 h � 0.042 · kilome-
tres to Hibbs Point � 0.030 · kilometres to Reid Rocks
� 0.896 · knots of vessel speed].
The final model yielded a highly significant result and ex-
plained just over 63% of the variation in seal numbers ob-
served (F7,159 = 32.71, R2 = 0.63, P < 0.01, n = 149). It should be
noted that the outcome values for each variable in the final
model do not function independently of each other, but are
co-dependent components.
According to the final model, three of the seven environ-
mental variables were significantly associated with the num-
ber of seals observed, being swell height, visibility and
barometric pressure. Individual analysis of these variables re-
vealed that seal numbers exhibited a steady trend of increase
as swell height increased, with post hoc analysis demonstrat-
ing a significant difference between swell heights exceeding
6 m, compared with swell heights of 1 m or less (Fig. 3c). Seal
0
2
4
6
8
10
1
a
c
e
g
i
h
f
d
b2 3 4 5
Pooled weekly observations
0
2
4
6
8
10
12
800 900 1000 1100 1200 1300 1400 1500 1600 1700
Hourly observations
0
2
4
6
8
10
12
1 2 3 4 5 6 7 8
Swell height (m)
0
2
4
6
8
10
2 3 4 5 6
Visibility (scale)
0
2
4
6
8
10
12
980-989 990-999 1000-1009 1010-10191020-1029
Barometric pressure (hectopascals)
0
2
4
6
8
10
12
14
5 10 15 20 25 30 35 40 45 50 55
Wind strength (knots)
01234
56789
0 1 2 3 4 5
Number of vessels within 2nm
0
1
2
3
4
5
6
7
0 1 2 3 4
Tows in past 12 hours
0
2
4
6
8
10
12
0-1 2.1-3 4.1-5 6.1-7 8.1-9 10.1-11Vessel speed (knots)
Mea
n s
eal c
ou
nt
(n)
Mea
n s
eal c
ou
nt
(n)
Mea
n s
eal c
ou
nt
(n)
Mea
n s
eal c
ou
nt
(n)
Mea
n s
eal c
ou
nt
(n)
Mea
n s
eal c
ou
nt
(n)
Mea
n s
eal c
ou
nt
(n)
Mea
n s
eal c
ou
nt
(n)
Mea
n s
eal c
ou
nt
(n)
Fig. 3 – (a)–(i) Individual relationships between the mean number of seals observed from the FV Aoraki and: two temporal
components (a) and (b), plus with those factors remaining in the final GLM for hourly observations (c)–(i). The dotted bar
denotes the value of the independent variable from which seal numbers exhibited the highest frequency of significant
difference with other values for the same variable (diagonally stripped bars), according to post hoc analysis.
522 B I O L O G I C A L C O N S E R V A T I O N 1 3 0 ( 2 0 0 6 ) 5 1 7 – 5 2 9
numbers also increased with visibility, but declined slightly
when the horizon was visible (full visibility), although post
hoc analysis did not reveal any significant differences
(Fig. 3d). Seal numbers declined as barometric pressure in-
creased, with post hoc analysis revealing that seal numbers
observed were significantly less between 1000–1009 and

B I O L O G I C A L C O N S E R V A T I O N 1 3 0 ( 2 0 0 6 ) 5 1 7 – 5 2 9 523
1020–1029 hectopascals compared with 980–989 hectopascals
(Fig. 3e). Interestingly, it was also noted that seal numbers in-
creased with wind strength (Fig. 3f), even though it was not
included in the final model, with post hoc analysis revealing
that seal numbers increased significantly above 5 knots. Wind
strength, combined with the three environmental variables
included in the final model depicted a general deterioration
in weather conditions associated with increased numbers of
seals observed.
Five of the seven operational variables also remained in
the final model, being the number of vessels within 2 nautical
miles, the number of trawls in the last 12 h, the distance to
Reid Rocks and Hibbs Point and vessel speed. Seal numbers
increased with the number of vessels within 2 nm, although
a decline was noted when viewed in isolation to other vari-
ables (Fig. 3g), which may be the result of autocorrelation.
Seal numbers were significantly fewer when more than 4 ves-
sels were present, compared to when only one was present.
Although the number of trawls within the previous 12 hours
was included in the final model, an obvious trend was not evi-
dent and post hoc analysis did not reveal a source of variation
(Fig. 3h). Finally, seal numbers increased from stationary to
2.1–3 knots, but then declined steadily as vessel speed ex-
ceeded this (Fig. 3i). Post hoc analysis showed that observed
seal numbers were significantly less for vessel speeds above
4.1 knots, compared with the peak at 2.1–3 knots. According
to the final model, vessel speed had the strongest influence
over seal numbers observed compared with other operational
factors.
The combined effect of the distance between Hibbs Point
(an important haul-out site adjacent to the fishery) and Reid
Rocks (the closest breeding colony, to the north in Bass Strait)
on seal numbers observed at the surface was investigated
independently of all other variables. The longitudinal position
of the fishery was fixed at 144.8�E (east–west longitudinal var-
iation was negligible in the fishery) and the coefficients for all
other variables were held constant at their respective mean
values within the final model, while the latitude of the vessel
was varied according to latitudinal position, allowing the
number of seals to be predicted in relation to the combined
effect of the distance from Hibbs Point and Reid Rocks:
0
1
2
3
4
5
6
-40.6 -40.8 -41 -41.2 -41.4 -41.6 -41.8 -42 -42.2 -42.4 -42.6 -42.8 -43
Latitude (decimal degrees)
Mea
n s
eal c
ou
nt
(n)
Reid Rocks -40.25o. ~270km
Hibbs Point-42.63o
Fig. 4 – Bi-variate plot of mean numbers of Australian fur
seals observed at the surface from the FV Aoraki in response
to the combined effect of distance from both Hibbs Point and
Reid Rocks.
Formula 2: Predicted number of seals observed in relation
to the combined effect of distance from Hibbs Point colony
and Reid Rocks = [0.901(swell height coef.) · 3.081(swell
height av.)] + [0.276(visibility coef.) · 5.676(visibility av.)] �[0.014(barometric pressure coef.) · 1013.929(barometric
pressure av.)] + [0.506(vessels within 2 nm coef.) ·0.776(vessels within 2 nm av.)] + [0.760(trawls in the last
12 h coef.) · 1.321(trawls in the last 12 h av.)] + [�0.896(ves-
sel speed coef.) · 6.138(vessel speed av.)] + [�0.042(dis-
tance to Hibbs Point coef.) · XHP] + [�0.030(distance to
Reid Rocks coef.) · XRR].
where coef. is the coefficient value for each variable gener-
ated by final model, av. is the mean value of all observations
for variable, XHP is the specified distance to Hibbs Point (km)
and XRR is the specified distance to Reid Rocks (km).
The resultant bi-variate plot indicated that seal numbers
increased as the vessel moved southward, away from Reid
Rocks and toward Hibbs Point. Seal numbers observed peaked
at a latitude of 42.3�S, approximately 44 km north of Hibbs
Point (Fig. 4). The decline in seal numbers to the south of
the peak was much more rapid compared to the decline to
the north of the peak. These results indicate that while the
breeding colony at Reid Rocks may exert some influence on
the numbers of seals to the north, the proximity of the
haul-out site at Hibbs Point appears to have a much greater
influence on the number of seals observed.
3.2. Variables associated with seal numbers duringtrawling
A total of 1620 seals were observed at the surface during
trawls (n = 475). An average of 2.4 ± 1.4 SE (n = 138) fur seals
were observed during shooting, 5.6 ± 1.5 SE (n = 207) during
trawling and 7.1 ± 1.6 SE (n = 130) during hauling. Seal num-
bers varied significantly between the three stages (repeated
measures: F2,474 = 22.15, P < 0.01) and post-hoc analysis dem-
onstrated that seal numbers increased significantly between
shooting and trawling, but not between trawling and hauling.
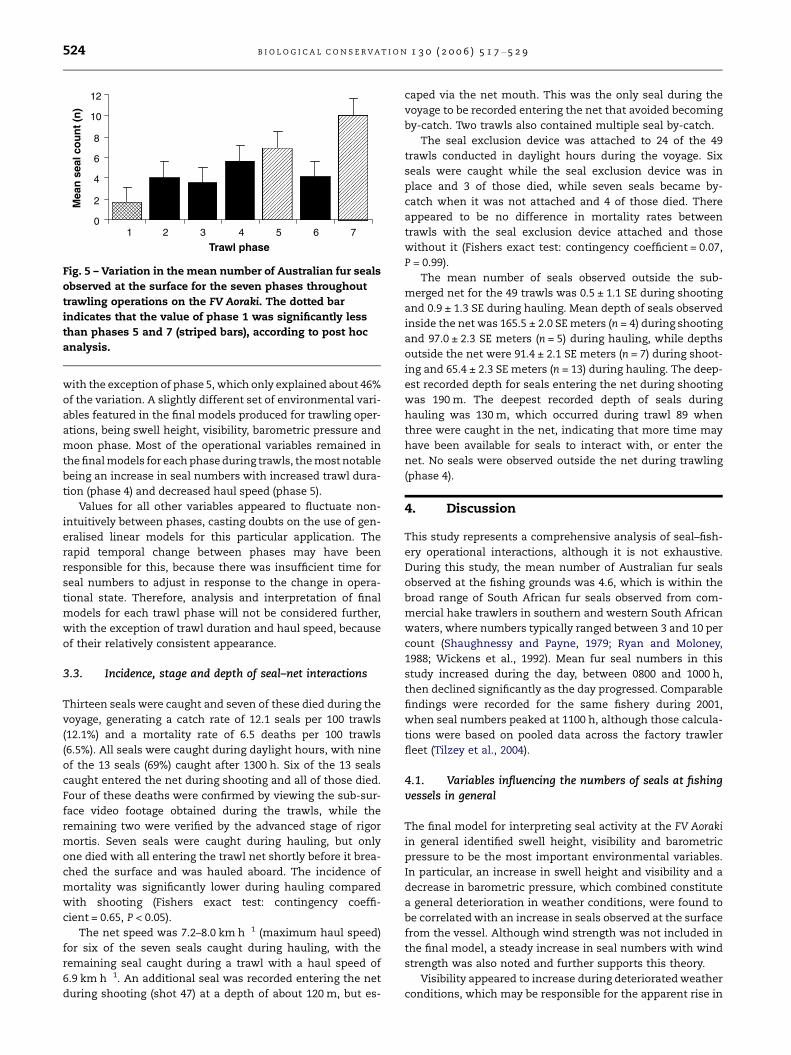
More specifically, the numbers of seals observed also var-
ied significantly between the seven phases of the trawl (re-
peated measures: F6,474 = 19.68, P < 0.01), with post-hoc
analysis demonstrating a significant increase in the number
of seals observed from phase 1 compared with phase 5 and
7 (Fig. 5). In general, an overall trend of increase occurred
throughout the trawl, although a small decrease in seal num-
bers occurred during phase 3, and a marked decrease oc-
curred during phase 6, before increasing again in phase 7.
During shooting, the amount of time that the net was open
above 200 m (phase 3) ranged between 5 and 15 min, averag-
ing 7.6 min (n = 49). During hauling, the net was also open
above 200 m (phase 5) for between 5 and 15 min, averaging
9.2 min (n = 49). The combined total time that seals were at
risk of becoming caught in the trawl net during shooting
was 370 min and during hauling was 448 min.
Trawl data were also examined using Generalised Linear
Models for each phase to determine which variables were most
closely associated to the number of seals observed at the sur-
face. Highly significant models were produced for all phases,
explaining between 70% and 99% of the variation observed,
0
2
4
6
8
10
12
1 2 3 4 5 6 7
Trawl phase
Mea
n s
eal c
ou
nt
(n)
Fig. 5 – Variation in the mean number of Australian fur seals
observed at the surface for the seven phases throughout
trawling operations on the FV Aoraki. The dotted bar
indicates that the value of phase 1 was significantly less
than phases 5 and 7 (striped bars), according to post hoc
analysis.
524 B I O L O G I C A L C O N S E R V A T I O N 1 3 0 ( 2 0 0 6 ) 5 1 7 – 5 2 9
with the exception of phase 5, which only explained about 46%
of the variation. A slightly different set of environmental vari-
ables featured in the final models produced for trawling oper-
ations, being swell height, visibility, barometric pressure and
moon phase. Most of the operational variables remained in
the final models for each phase during trawls, the most notable
being an increase in seal numbers with increased trawl dura-
tion (phase 4) and decreased haul speed (phase 5).
Values for all other variables appeared to fluctuate non-
intuitively between phases, casting doubts on the use of gen-
eralised linear models for this particular application. The
rapid temporal change between phases may have been
responsible for this, because there was insufficient time for
seal numbers to adjust in response to the change in opera-
tional state. Therefore, analysis and interpretation of final
models for each trawl phase will not be considered further,
with the exception of trawl duration and haul speed, because
of their relatively consistent appearance.
3.3. Incidence, stage and depth of seal–net interactions
Thirteen seals were caught and seven of these died during the
voyage, generating a catch rate of 12.1 seals per 100 trawls
(12.1%) and a mortality rate of 6.5 deaths per 100 trawls
(6.5%). All seals were caught during daylight hours, with nine
of the 13 seals (69%) caught after 1300 h. Six of the 13 seals
caught entered the net during shooting and all of those died.
Four of these deaths were confirmed by viewing the sub-sur-
face video footage obtained during the trawls, while the
remaining two were verified by the advanced stage of rigor
mortis. Seven seals were caught during hauling, but only
one died with all entering the trawl net shortly before it brea-
ched the surface and was hauled aboard. The incidence of
mortality was significantly lower during hauling compared
with shooting (Fishers exact test: contingency coeffi-
cient = 0.65, P < 0.05).
The net speed was 7.2–8.0 km h�1 (maximum haul speed)
for six of the seven seals caught during hauling, with the
remaining seal caught during a trawl with a haul speed of
6.9 km h�1. An additional seal was recorded entering the net
during shooting (shot 47) at a depth of about 120 m, but es-
caped via the net mouth. This was the only seal during the
voyage to be recorded entering the net that avoided becoming
by-catch. Two trawls also contained multiple seal by-catch.
The seal exclusion device was attached to 24 of the 49
trawls conducted in daylight hours during the voyage. Six
seals were caught while the seal exclusion device was in
place and 3 of those died, while seven seals became by-
catch when it was not attached and 4 of those died. There
appeared to be no difference in mortality rates between
trawls with the seal exclusion device attached and those
without it (Fishers exact test: contingency coefficient = 0.07,
P = 0.99).
The mean number of seals observed outside the sub-
merged net for the 49 trawls was 0.5 ± 1.1 SE during shooting
and 0.9 ± 1.3 SE during hauling. Mean depth of seals observed
inside the net was 165.5 ± 2.0 SE meters (n = 4) during shooting
and 97.0 ± 2.3 SE meters (n = 5) during hauling, while depths
outside the net were 91.4 ± 2.1 SE meters (n = 7) during shoot-
ing and 65.4 ± 2.3 SE meters (n = 13) during hauling. The deep-
est recorded depth for seals entering the net during shooting
was 190 m. The deepest recorded depth of seals during
hauling was 130 m, which occurred during trawl 89 when
three were caught in the net, indicating that more time may
have been available for seals to interact with, or enter the
net. No seals were observed outside the net during trawling
(phase 4).
4. Discussion
This study represents a comprehensive analysis of seal–fish-
ery operational interactions, although it is not exhaustive.
During this study, the mean number of Australian fur seals
observed at the fishing grounds was 4.6, which is within the
broad range of South African fur seals observed from com-
mercial hake trawlers in southern and western South African
waters, where numbers typically ranged between 3 and 10 per
count (Shaughnessy and Payne, 1979; Ryan and Moloney,
1988; Wickens et al., 1992). Mean fur seal numbers in this
study increased during the day, between 0800 and 1000 h,
then declined significantly as the day progressed. Comparable
findings were recorded for the same fishery during 2001,
when seal numbers peaked at 1100 h, although those calcula-
tions were based on pooled data across the factory trawler
fleet (Tilzey et al., 2004).
4.1. Variables influencing the numbers of seals at fishingvessels in general
The final model for interpreting seal activity at the FV Aoraki
in general identified swell height, visibility and barometric
pressure to be the most important environmental variables.
In particular, an increase in swell height and visibility and a
decrease in barometric pressure, which combined constitute
a general deterioration in weather conditions, were found to
be correlated with an increase in seals observed at the surface
from the vessel. Although wind strength was not included in
the final model, a steady increase in seal numbers with wind
strength was also noted and further supports this theory.
Visibility appeared to increase during deteriorated weather
conditions, which may be responsible for the apparent rise in

B I O L O G I C A L C O N S E R V A T I O N 1 3 0 ( 2 0 0 6 ) 5 1 7 – 5 2 9 525
seal numbers observed at the surface (Wilkinson et al., 2003).
Animals at greater distances would be more visible during
clearer conditions and thus included in counts, compared
with observations undertaken during calm conditions when
sea mists enveloped the vessel more frequently. Alternatively,
the rise in seal numbers during rough conditions may be due
to a real influx of seals into the commercial fishing grounds. It
is likely that seals attain a considerable energetic advantage
by utilising shallow dives to forage from fishing gear, thus
avoiding deep dives and the associated recovery time at the
surface (Huckstadt and Antezana, 2003; Williams et al.,
2004). Although untested, foraging from trawlers may be a
particularly attractive option during rough weather, because
foraging close to the benthos in shallow waters may become
difficult due to reduced prey availability and increased turbid-
ity (Dunstone and O’Connor, 1979). However, before causation
can be attributed to this theory, the at-sea movements of Aus-
tralian fur seals that forage in the region of this fishery need
to be determined during fine and rough weather conditions.
Several operational variables were also found to be associ-
ated with the number of seals observed at the vessel. Seal
numbers at the surface increased with the number of shots
in the last 12 h, the number of vessels within 2 nautical miles
and with declining distance from Reid Rocks breeding colony
and Hibbs Point haul-out site. However, seal numbers de-
clined when vessel speed increased above 5.6 km h�1 (3
knots), possibly influenced by the maximum swimming
capacity of fur seals. The only published study of Australian
fur seal swimming activity reported an average speed of
2.2 km h�1 (1.2 knots) over a 243 h period, although maximum
sprint speeds and periods when the animal remained station-
ary were not taken into account (Hindell and Pemberton,
1997). Notwithstanding, an average optimal swimming speed
of 7.2 km h�1 (3.9 knots) has been calculated for Antarctic fur
seals (A. gazella) and Galapagos fur seals (A. galapagoensis)
(Gentry et al., 1986; Williams and Worthy, 2002), indicating
that Australian fur seals may be capable of faster speeds.
Seals may also attain sprint speeds of up to 12.6 km h�1 (6.8
knots) over short distances (Williams and Kooyman, 1985;
Williams and Worthy, 2002), which may partly explain why
seals continued to be observed at higher vessel speeds. Alter-
natively, the vessel may have passed stationary seals and
seals following other vessels nearby were also included in
counts. Therefore, future studies may benefit from only
counting seals that are in active pursuit of the vessel and
within a prescribed distance.
The proximity of the vessel to Reid Rocks and Hibbs Point
also influenced the number of seals observed, with a marked
decline occurring with distance from Hibbs Point in particular
(Fig. 4). In support of these findings, a recent study revealed
that animals originating from Bass Strait breeding colonies
and captured at the FV Aoraki (using a large, baited dip net)
regularly use Hibbs Point as a haul-out site when the com-
mercial blue grenadier season is operating (Simon Goldswor-
thy and Roger Kirkwood, unpublished data).
Previous studies provide conflicting findings with regard to
the effect of distance to colonies on the number of animals
observed. Similar to this study, seal numbers observed at sal-
mon farms in south-eastern Tasmania in the early 1990s were
shown to decline with increasing distance from haul-out sites
(Pemberton and Shaughnessy, 1993). However, anecdotal re-
ports suggest that this relationship later diminished as large
numbers of seals became habituated to foraging in associa-
tion with the salmon farms.
Contrary to this study, South American sea lions observed
in a central Chilean fishery increased with distance to colo-
nies (Huckstadt and Antezana, 2003). The authors indicated
that the sea lions travelled to the most distant commercial
fishing grounds due to a greater abundance of fish stocks, or
greater opportunity to forage at those locations. This observa-
tion is consistent with the principle that a foraging predator
should travel greater distances in search of food if those
patches offer a net gain in energy above the added cost of get-
ting there (Hassell and May, 1974; Krebs, 1978). In doing so, the
individual should forage minimally in transit, which may ex-
plain why fewer animals were observed when closer to Reid
Rocks, compared with Hibbs Point.
Seal numbers increased as the number of trawls in the
previous 12 h (i.e. fishing intensity) increased. Factory trawl-
ers operating in the South East Fishery are able to achieve
continuity of processing operations and minimal spoiling of
fish when approximately three trawls are conducted every
24 h (Tilzey et al., 2004). Notwithstanding, more trawls were
conducted when less fish were caught per trawl, thus provid-
ing increased opportunities for seals to forage on the net in
the upper water column.
As the numbers of vessels within 2 nautical miles in-
creased, the number of seals also increased according to the
final model, although graphical representation of this variable
in isolation showed the contrary (Fig. 3g). More vessels may
provide improved foraging opportunities for seals, thus
adhering to the theories proposed by Stevens and Krebs
(1986), which suggest that more seals should be present dur-
ing times of increased fishing intensity. A similar trend oc-
curred between South American sea lions and purse-seine
vessels in Chile, although the relationship was not statisti-
cally significant (Huckstadt and Antezana, 2003).
4.2. Variables influencing the numbers of seals at thesurface during trawls
Due to the foraging opportunities presented to seals during
trawling operations, mean seal numbers observed increased
from 4.6 during times when no fishing activity was taking
place to 5.6 during trawls. The use of Generalised Linear Mod-
elling for each phase of the trawl proved problematic, due to
the short and variable time periods within each phase. In par-
ticular, the short amount of time taken to complete the three
phases during shooting and three phases during hauling (as
little as 5 min for each) made it difficult to interpret seal activ-
ity in response to the changes in operational state of the ves-
sel. However, two operational variables included in the final
models for each phase, namely trawl duration and haul
speed, may be important for determining seal numbers pres-
ent at fishing vessels in general during fishing.
Seal numbers increased significantly as the trawl pro-
gressed. The typically well developed directional hearing abil-
ity of fur seals (Gentry, 1967; Riedman, 1990) is likely to enable
them to detect the low pitched noise produced by fishing ves-
sels from considerable distances, particularly when the
526 B I O L O G I C A L C O N S E R V A T I O N 1 3 0 ( 2 0 0 6 ) 5 1 7 – 5 2 9
hydraulic pumps are in operation during fishing activity. This
theory supports anecdotal evidence that Australian fur seals
interacting with this fishery are attracted by distinctive
sounds emitted by vessels during fishing operations (Tilzey
et al., 2004).
The speed of the trawl net through the water as it was
hauled from trawling depth was also important throughout
trawl operations according to the models produced, with seal
numbers typically decreasing as haul speed increased. Haul
duration ranged from 5 to 15 min, thus providing marked var-
iation in the time available for seals to arrive astern of the
vessel. Assuming that Australian fur seals were capable of
attaining swimming speeds of 7.2–12.6 km h�1 (3.9–6.8 knots)
(Williams and Worthy, 2002), individual seals should have
been able to cover between 600 and 3150 m for the combined
range of hauling speeds and times recorded. Therefore, with
less time available during faster hauls, fewer seals were able
to reach the stern of the vessel.
The speed of the trawl net during hauling also appeared to
influence the likelihood of seal by-catch. Haul speeds typi-
cally ranged between 3.3 and 8.0 km h�1 (1.8–4.3 knots) and
it is likely that higher haul speeds make it more difficult for
seals to outswim the net as it moves through the water col-
umn, thus increasing the probability of seals that are present
inside the net becoming by-catch. Interestingly, on 4 of the 5
occasions when seals became by-catch during hauling, the
haul speed was in excess of 7.2 km h�1 (minimum average
fur seal swimming speed), while the remaining seal by-catch
incident occurred when the net was hauled at 6.9 km h�1. The
importance of haul speed for determining seal by-catch has
not been investigated prior to this study, although its poten-
tial importance has been acknowledged (Waring et al., 1990;
Morizur et al., 1999; Shaughnessy et al., 2003).
4.2.1. Seal numbers observed at the surfaceA significant reduction in seal numbers at the surface was ob-
served during shooting, coinciding with the release of the
trawl doors and the descent of the net below the surface
(phase 3). Video footage confirmed that seals dived to forage
on ‘stickers’ caught in the meshes of the descending trawl
net from the previous trawl events. Although not addressed
during this study, the removal of stickers (and the food
source) may help to reduce the number of seals that put
themselves at risk of becoming by-catch, because they would
be less inclined to dive on the net to forage. Furthermore, the
fishery endorsed Code of Fishing Practice recommends the re-
moval of stickers, thus highlighting the need to review the
effectiveness of sticker removal to assist in the reduction of
interactions with seals. The occurrence of seals diving on
trawl nets during net deployment has only been reported
once before, for South African fur seals interacting with trawl
fisheries, based on the advanced stage of rigor mortis of dead
animals (Shaughnessy and Payne, 1979), rather than video-
graphic confirmation.
Seal numbers also reduced significantly in phase 6 during
hauling. This was preceded by seals congregating approxi-
mately 150m astern and in the wake of the vessel during
phase 5, possibly in response to the markedly increased noise
produced by the hydraulic trawl winches, which may act as
an audio cue for seals to move to the position where the
cod-end typically breaches the surface. Similar behaviour
was noted for harp seals in the Grand Banks cod trawl fishery
and was attributed to ‘prior learning’ that the net (and thus
fish) would eventually surface at a specific distance astern
of the vessel soon after the winches began operating (Pember-
ton et al., 1994). During phase 6, the trawl doors of the FV Aor-
aki (weighing approximately eight tonnes) were hauled out of
the water, emitting a loud noise as they came into contact
with the ‘bash plates’ at the stern of the vessel. The resultant
audio cue likely signified that the ascending net was within
the diving range of the seals, prompting synchronous diving
on the net by the fur seals (again confirmed by video footage)
and a reduction in the number of seals visible at the
surface.
The mean depth of the headline (the top of the net
mouth) was 96 m at the time of the audio cue, while the
mean depth of all diving seals observed during hauling was
81 m. The depth difference indicates that seals did not typi-
cally reach the ascending net until shortly after the trawl
doors were aboard, accounting for the time taken for the
seals to leave the surface and reach the net. Pemberton
et al. (1994) also noted that harp seals used the audio cue
produced by trawl doors in a similar way, diving on the net
in synchrony as the net ascended toward the surface during
hauling.
4.2.2. Fur seal by-catchAll seal by-catch occurred during the day, even though about
half the trawl events occurred at night. These findings are in
accordance with the weakly inverted diurnal foraging pat-
terns reported for Australian fur seals (Hindell and Pember-
ton, 1997; Arnould and Hindell, 2001). Most by-catch on the
FV Aoraki occurred during the late afternoon, even though
seal numbers were higher in the morning, suggesting that
the numbers of seals observed on the surface may not reflect
a direct relationship with seal by-catch. Thirteen fur seals
were taken as by-catch, six of which were taken during shoot-
ing, confirming the assumption by Shaughnessy and Payne
(1979) that seals are able to enter the net at the beginning of
the trawl event. Mortality rates were significantly higher dur-
ing shooting compared with hauling, with 6 seals dying dur-
ing shooting, compared with only one during hauling,
because seals caught at the end of the trawl event were able
to breath through the net at the surface.
A similar by-catch incidence occurred between trawls with
the seal exclusion device attached and those without, being 6
and 7 respectively. This result does not support findings by
Tilzey et al. (2004) that seal exclusion devices reduced seal
by-catch and mortalities by-catch by 6.9%, indicating that
the current design may be ineffective, or unutilised by those
seals entering the net. Instead, the low incidence of net entry
by seals indicated in the video footage and the fact that only
one seal was detected exiting the net without becoming by-
catch during video monitored trawls suggests that a reduced
incidence of net entry by seals, rather than successful escape
through seal exclusion devices may explain a reduction in
seal by-catch over the last few years. Notwithstanding, the
incidence of net entry by seals and the number of trawls ob-
served was low, making it difficult to quantitatively establish
if these findings are truly representative.
B I O L O G I C A L C O N S E R V A T I O N 1 3 0 ( 2 0 0 6 ) 5 1 7 – 5 2 9 527
4.3. Recommendations
These results highlight the need for additional modifications
to fishing practices conducted by factory trawlers in this fish-
ery. In particular, we recommend that commercial fishing
activity cease during rough weather when seal numbers ap-
pear to be greatest, particularly if the number of seals ob-
served at the surface is considered as a reliable surrogate
indicator of the number of animals potentially interacting
with the trawl net beneath the surface. A buffer zone that
prohibits or restricts fishing activity within a specified prox-
imity to Hibbs Point should also be considered as a precau-
tionary approach, although it is impossible to determine
from this investigation what an appropriate distance would
be.
Even though a reduction in seal by-catch has been re-
corded in the factory trawler component of this fishery since
1999, attributing this to the introduction of seal exclusion
devices seems unlikely considering that all but one net entry
resulted in by-catch. During this study, the reduction in seal
by-catch was more likely due to the a reduction in the inci-
dence of seal–net interactions. Nonetheless, the seal exclu-
sion device has become the principal seal by-catch
mitigation tool on factory trawlers in the winter blue grena-
dier fishery and the possibility of introducing them to the
wet-boat fleet in the South East Fishery has also been pro-
posed (Knuckey et al., 2002). We recommend that further tri-
als of seal exclusion devices effectiveness be conducted in
conjunction with sub-surface video equipment, so that the
incidence of net entry can be directly compared with seal
by-catch and mortalities in order to calculate rates.
This study confirmed that seal by-catch mortality on the FV
Aoraki also occurs during shooting and is likely to be represen-
tative of trawl fishing activity in the South East Fishery in gen-
eral. Most previous studies have assumed that seal by-catch
occurs exclusively during hauling, because seals are attracted
to the catch at the end of the trawl event. While this study
indicates that seals are equally as likely to become caught in
the trawl net during shooting, the low incidence of by-catch
recorded emphasises the need to continue investigating sub-
surface interactions. Nonetheless, we recommend that future
research should also focus on seal by-catch reduction during
shooting, by trialling devices that hold the net mouth closed
until the net reaches the fishing depth.
This study suggests that seal by-catch is reduced when haul
speeds are kept low, which contravenes the recommendation
in the Code of Fishing Practice, that the net should be hauled as
quickly as possible to reduce the time that it remains within
the diving range of fur seals (South East Trawl Fishing Industry
Association, 2000). The results of this study suggest that net
hauling should be as fast as possible below the maximum dive
depth of the seals (about 200 m) to reduce the length of time
available for Australian fur seals to reach the vessel, but should
then proceed at speeds that are slower that the minimum aver-
age swimming speeds for fur seals (about 7.2 km h�1) to reduce
the likelihood of seals becoming by-catch in the upper water
column. In order to facilitate this hauling procedure, an im-
proved method of determining net velocity through the water
column is also necessary. However, changes to the Code of Fish-
ing Practice would be unwise until a dedicated investigation of
the relationship between haul speed and seal by-catch
incidence is undertaken.
Acknowledgements
Firstly, our sincere thanks is extended to the Petuna Seafood/
Sealord cooperative for permitting access to the FV Aoraki and
also to Garry Courtney (master) and the crew for their assis-
tance during the voyage. We also wish to thank Richard Tilzey
(Bureau of Resource Sciences) for accommodating this work
within a broader project aimed at mitigating seal by-catch
in the same fishery. Thanks are also extended to Peter
Shaughnessy, Roger Kirkwood and Martin Cawthorn for edit-
ing manuscripts and providing advice.
R E F E R E N C E S
Alverson, D.L., 1999. Some observations on the science of bycatch.Marine Technology Society Journal 33 (2), 6–12.
Alverson, D.L., Freeberg, M.H., Murawski, S.A., Pope, J.G., 1994. Aglobal assessment of fisheries bycatch and discards, FAOFisheries Technical Paper, vol. 339.
Arnould, J.P.Y., Hindell, M.A., 2001. Dive behaviour, foraginglocations and maternal-attendance patterns of Australian furseals (Arctocephalus pusillus doriferus). Canadian Journal ofZoology 79, 35–48.
Australian Fisheries Management Authority (AFMA), 1999.Australian South East Trawl Fishery: inquiry into incidentalseal bycatch. Australian Fisheries Management Authority,Canberra. 21pp.
Bache, S.J., 2003. Marine wildlife bycatch mitigation: global trends,international action and the challenges for Australia. OceanPublications, Wollongong.
Beverton, R.J.H., 1985. Analysis of marine mammal-fisheriesinteractions. In: Beddington, J.R., Beverton, R.J.H., Lavigne,D.M. (Eds.), Marine Mammals and Fisheries. George Allen andUnwin, Sydney.
Bunting, J., 2002. Draft bycatch action plan for the Shark Bayprawn managed fishery (full report). Fisheries ManagementPaper No. 147. Department of Fisheries, Government ofWestern Australia, April, 2002. 82pp.
Carbonell, A., Alemany, F., Merella, P., Quetglas, A., Roman, E.,2003. The by-catch of sharks in the western Mediterranean(Baltic Islands) trawl fishery. Fisheries Research 61, 7–18.
Dunstone, N., O’Connor, R.J., 1979. Optimal foraging in theamphibious mammal. I. The aqualung effect. AnimalBehaviour 27, 1182–1194.
Fraker, M.A., Mate, B.R, 1999. Seals, sea lions and salmon in thePacific northwest. In: Twiss, J.R., Reeves, R.R. (Eds.),Conservation and management of marine mammals.Melbourne University Press, Melbourne.
Gentry, R.L., 1967. Underwater auditory localization in theCalifornia sea lion (Zalophus californianus). Journal of AuditoryResearch 7, 187–193.
Gentry, R.L., Costa, D.P., Croxall, J.P., David, J.H.M., Davis, R.W.,Kooyman, G.L., Majluf, P., McCann, T.S., Trillmich, F., 1986.Synthesis and conclusions. In: Gentry, R.L., Kooyman, G.L.(Eds.), Fur seals: maternal strategies on land and at sea.Princeton University Press, Princeton.
Goldsworthy, S.D., Bulman, C., He, X., Larcombe, J., Littnan, C.,2003. Trophic interactions between marine mammals andAustralian fisheries: an ecosystem approach. In: Gales, N.J.,Hindell, M.A., Kirkwood, R. (Eds.), Marine Mammals: Fisheries,
528 B I O L O G I C A L C O N S E R V A T I O N 1 3 0 ( 2 0 0 6 ) 5 1 7 – 5 2 9
Tourism and Management Issues. CSIRO Publishing,Melbourne.
Hall, M.A., Alverson, D.L., Metuzals, K.I., 2000. By-catch: problemsand solutions. Marine Pollution Bulletin 41, 204–219.
Hardy, I.C.W., 2002. Sex Ratios: concepts and research methods.Cambridge University Press, Cambridge.
Harris, A., Ward, P., 1999. Non-target Species in Australia’sCommonwealth Fisheries: A Critical Review. Bureau of RuralSciences, Canberra.
Hassell, M.P., May, R.M., 1974. Aggregation of predators and insectparasites and its effect on stability. Journal of Animal Ecology43, 567–594.
Hindell, M.A., Pemberton, D., 1997. Successful use of atranslocation program to investigate diving behavior in a maleAustralian fur seal, Arctocephalus pusillus doriferus. MarineMammal Science 13 (2), 219–228.
Huckstadt, L.A., Antezana, T., 2003. Behaviour of the southern sealion (Otaria flavescens) and consumption of the catch duringpurse-seining for jack mackerel (Trachurus symmetricus) offcentral Chile. Journal of Marine Science 60, 1003–1011.
Huckstadt, L.A., Krautz, M.C., 2004. Interaction between southernsea lions Otaria flavescens and jack mackerel Trachurussymmetricus commercial fishery off Central Chile: ageostatistical approach. Marine Ecology Progress Series 282,285–294.
Knuckey, I.A., Eayrs, S., Bosschietter, B., 2002. Options for reducingincidental catch of seals on wet-boats in the SETF: apreliminary report. Marine and Freshwater ResourcesInstitute. Report to the Australian Fisheries ManagementAuthority. ARF Project R01/0887. 59pp.
Krebs, J.B., 1978. Optimal foraging: decision rules for predators. In:Krebs, J.B., Davies, N.B. (Eds.), Behavioral ecology: anevolutionary approach. Sinaur, Massachusetts.
Loughlin, T.R., Nelson, R., 1986. Incidental mortality of northernsea lions in the Shelikov Strait, Alaska. Marine MammalScience 2, 14–33.
Manly, B.F.J., Seyb, A., Fletcher, D.J., 2002. Bycatch of fur seals(Arctocephalus forsteri) in New Zealand fisheries, 1990/91–1995/96, and observer coverage. Department of Conservation (DOC)Science Internal Series 41, Department of Conservartion,Wellington. 40pp.
Morizur, Y., Berrow, S.D., Tregenza, N.J.C., Couperus, A.S.,Pouvereau, S., 1999. Incidental catches of marine-mammals inpelagic trawl fisheries of the northeast Atlantic. FisheriesResearch 41, 297–307.
National Marine Fisheries Service (NMFS), 1992. Final recoveryplan for Steller sea lions Eumetopias jubatus. National MarineFisheries Service internal report, National Oceanic andAtmospheric Administration. Silver Spring, Maryland. 29pp.
Northridge, S.P., 1984. World review of interactions betweenmarine mammals and fisheries. FAO Fisheries TechnicalPaper, vol. 251. 190pp.
Northridge, S.P., 1991. An updated world review of interactionsbetween marine mammals and fisheries. FAO FisheriesTechnical Paper, vol. 251(Suppl. 1). 58pp.
Northridge, S.P., Hofman, R.J., 1999. Marine mammal interactionswith fisheries. In: Twiss, J.R., Reeves, R.R. (Eds.), Conservationand Management of Marine Mammals. Melbourne UniversityPress, Melbourne.
Pemberton, D., Merdsoy, B., Gales, R., Renouf, D., 1994. Theinteraction between offshore cod trawlers and harp Phocagroenlandica and hooded Cystophora cristata seals offNewfoundland, Canada. Biological Conservation 68,123–127.
Pemberton, D., Shaughnessy, P.D., 1993. Interaction between sealsand marine fish-farms in Tasmania, and management of theproblem. Aquatic Conservation 3, 149–158.
Quinn, G.P., Keough, M.J., 2002. Experimental Design and DataAnalysis for Biologists. Cambridge University Press, Melbourne.
Riedman, M., 1990. The Pinnipeds: Seals, Sea Lions and Walruses.University of California Press, London.
Ryan, P.G., Moloney, C.L., 1988. Effect of trawling on bird and sealdistributions in the southern Benguela region. Marine EcologyProgress Series 45 (1), 1–11.
Shaughnessy, P.D., 1985. Interactions between fisheries and Capefur seals in southern Africa. In: Beddington, J.R., Beverton,R.J.H., Lavigne, D.M. (Eds.), Marine Mammals and Fisheries.George Allen and Unwin, Sydney.
Shaughnessy, P.D., Kirkwood, R., Cawthorn, M., Kemper, C.,Pemberton, D., 2003. Pinnipeds, cetaceans and fisheries inAustralia: a review of operational interactions. In: Gales, N.J.,Hindell, M.A., Kirkwood, R. (Eds.), Marine Mammals: Fisheries,Tourism and Management Issues. CSIRO Publishing,Melbourne.
Shaughnessy, P.D., Payne, A.I.L., 1979. Incidental mortality of capefur seals during trawl fishing activities in South Africanwasters. Fisheries Bulletin, South Africa 12, 20–24.
Smith, A.D.M., 1994. Blue grenadier Macruronus novaezelandiae. In:Tilzey, R.D.J. (Ed.), The South East Fishery: A Scientific Reviewwith Reference to Quota Management. Bureau of Rural Sciences(BRS). Australian Government Publishing Service, Canberra.
South East Trawl Fishing Industry Association (SETFIA), 2000.Code of fishing practice to minimise incidental by-catch ofmarine mammals in the South East Trawl Fishery, South EastTrawl Fishing Industry Association, Canberra. 16pp.
Stevens, D.W., Krebs, J.R, 1986. Foraging theory. PrincetonUniversity Press, Princeton.
Tilzey, R.D.J., 1994. Introduction. In: Tilzey, R.D.J. (Ed.), The SouthEast Fishery: A Scientific Review with Regard to QuotaManagement. Bureau of Resource Science (BRS). AustralianGovernment Publishing Service, Canberra.
Tilzey, R.D.J., 2002. Interim report to FRDC on seal exclusiondevice trials in the winter 2002 blue grenadier fishery program.Bureau of Resource Sciences (BRS), Canberra.
Tilzey, R.D.J., Goldsworthy, S.D., Cawthorn, M., Calvert, N., Hamer,D.J., Kirkwood, R., Russell, S., Shaughnessy, P.D., Wize, B., 2004.Assessment of seal–fishery interactions in the winter bluegrenadier fishery off west Tasmania and the development offishing practices and Seal Exclusion Devices to mitigate sealbycatch by factory trawlers. Report to the Fisheries Researchand Development Corporation (FR & DC), Project no. 2001/008,May 2004. 61pp.
Waring, G.T., Gerior, P., Payne, M.P., Parry, B.L., Nicolas, J.R., 1990.Incidental take of marine mammals in foreign fisheryactivities off the northeast United States, 1977–1988. FisheriesBulletin 88, 347–360.
Wickens, P., 1994. Interactions between South African fur sealsand the purse-seine fishery. Marine Mammal Science 10,442–457.
Wickens, P., 1995. A review of operational interactions betweenpinnipeds and fisheries. FAO Fisheries Technical Paper, vol.346, 86pp.
Wickens, P., Japp, D.W., Shelton, P.A., Kriel, F., Goosen, P.C., Rose,B., Augustyn, C.J., Bross, C.A.R., Penney, A.J., Krohn, R.G., 1992.Seals and fisheries in South Africa – competition and conflict.South African Journal of Marine Science 12, 773–789.
Wilkinson, I., Burgess, J., Cawthorn, M., 2003. New Zealand sealions and squid: managing impacts on a threatened marinemammal. In: Gales, N.J., Hindell, M.A., Kirkwood, R. (Eds.),Marine Mammals: Fisheries, Tourism and Management Issues.CSIRO Publishing, Melbourne.
Williams, T.M., Fuiman, L.A., Horning, M., Davis, R.W., 2004. Thecost of foraging by a marine predator, the Weddell sealLeptonychotes weddellii: pricing by the stroke. Journal ofExperimental Biology 207 (6), 973–982.

B I O L O G I C A L C O N S E R V A T I O N 1 3 0 ( 2 0 0 6 ) 5 1 7 – 5 2 9 529
Williams, T.M., Kooyman, G.L., 1985. Swimming performance andhydrodynamic characteristics of harbor seals Phoca vitulina.Physiological Zoology 58, 576–589.
Williams, T.M., Worthy, G.A.J., 2002. Anatomy andphysiology: the challenge of aquatic living. In: Hoelzel,
A.R. (Ed.), Marine Mammal Biology. Blackwell Publishing,Oxford.
Woodley, T.H., Lavigne, D.M., 1991. The incidental capture ofpinnipeds in commercial fishing gear. International MarineMammal Association Inc., Technical Report 91–01. 51pp.