Embed Size (px)
Citation preview
9FACILITATING CONSERVATION AND SUSTAINABLE USE OF BIOLOGICAL DIVERSITYAbstracts of poster presentations on protected areasand technology transfer and cooperationat the ninth meeting of the Subsidiary Body on Scientific, Technical and Technological Advice
CBD Technical Series No.Secretariat of the Convention onBiological Diversity
ALSO AVAILABLE
Issue 1: Review of The Efficiency and Efficacy of Existing Legal Instruments Applicable to Invasive Alien Species
Issue 2: Assessment and Management of Alien Species that Threaten Ecosystems, Habitats and Species
Issue 3: Assessment Conservation and Sustainable Use of Forest Biodiversity
Issue 4: The Value of Forest Ecosystems
Issue 5: Impacts of Human-Caused Fires on Biodiversity and Ecosystem Functioning, and Their Causes in Tropical, Temperate and Boreal Forest Biomes
Issue 6: Sustainable Management of Non-Timber Forest Resources
Issue 7: Review of the Status and Trends of, and Major Threats to, Forest Biological Diversity
Issue 8: Status and trends of, and threats to, mountain biodiversity, marine, coastal and inland water ecosystems: abstracts of poster presentations at the eighth meeting of the Subsidiary Body on Scientific, Technical and Technological Advice of the Convention on Biological Diversity
CBD Technical Series No. 9
Facilitating conservation and sustainable use of biological diversity
Abstracts of poster presentations on protected areasand technology transfer and cooperation
at the ninth meeting of the Subsidiary Body on Scientific, Technical and Technological Advice
Montreal 2003
007419 CDG Interieur_no9 11/3/03 6:12 PM Page 1
The designations employed and the presentation of material in this publication do not imply the expressionof any opinion whatsoever on the part of the Secretariat of the Convention on Biological Diversity concern-ing the legal status of any country, territory, city or area or of its authorities, or concerning the delimitation ofits frontiers or boundaries.
The views expressed in this publication are those of the authors and do not necessarily reflect those of theSecretariat of the Convention on Biological Diversity.
This publication may be reproduced for educational or non-profit purposes without special permission fromthe copyright holders, provided acknowledgement of the source is made. The Secretariat of the Conventionwould appreciate receiving a copy of any publications that uses this document as a source.
© Secretariat of the Convention on Biological Diversity
ISBN 92-807-2376-6
For more information or additional copies, please contact:
The Secretariat of the Convention on Biological DiversityWorld Trade Centre, 393 St. Jacques Street, Suite 300,Montreal, Quebec, Canada H2Y 1N9Tel : + 1 (514) 288 2220Fax: + 1 (514) 288 6588E-mail: [email protected]: http://www.biodiv.org
Facilitating conservation and sustainable use of biological diversity. Abstracts of poster presentations on protected areas and technology transfer and cooperation at the ninth meeting of the Subsidiary Body on Scientific, Technical and Technological Advice.
2
007419 CDG Interieur_no9 11/3/03 6:12 PM Page 2
FOREWORD
Technology transfer and cooperation and protected areas are the main themes of the ninth meeting of theSubsidiary Body on Scientific, Technical and Technological Advice (SBSTTA) in November 2003, and of theseventh meeting of the Conference of the Parties to the Convention on Biological Diversity, in February 2004.For this reason, the poster session organized in the margins of the ninth meeting of SBSTTA will focus onthese two issues.
Protected areas are vital for the conservation of the world’s natural and cultural resources and for achievingthe three objectives of the Convention. They also have an essential role to play in achieving the target of sig-nificantly reducing the rate of biodiversity loss by 2010. Their values range from the protection of naturalhabitats and associated flora and fauna, to providing essential ecosystem services and goods. Protected areascan contribute to poverty alleviation and sustainable development, thereby supporting the objectives of theStrategic Plan of the Convention, the Plan of Implementation of the World Summit on SustainableDevelopment and the Millennium Development Goals. There is, however, a need to exchange informationand experience in the planning, establishment and management of protected areas.
Science and technology have long been recognized as essential driving forces in the development process. Withthe adoption of the Convention, countries have emphasized the need to advance its crucial technology trans-fer provisions. Technology transfer under the Convention provides both opportunities and challenges forinternational cooperation. To achieve an effective transfer of technology there is a need to overcome manytechnical, economic, political, cultural, social, and/or institutional barriers at national, regional and interna-tional levels. Scientific and technological capacity-building in developing countries continues to be a matterof great urgency under the Convention. New institutional and practical arrangements need to be made toexplore ways of helping facilitate the transfer of new technologies, including biotechnology, and to promoteand advance priority access to the results and benefits arising from technology especially for developing coun-tries.
It is a pleasure to provide you with the ninth issue of the CBD Technical Series. This issue compiles theabstracts presented during the ninth meeting of the Subsidiary Body on Scientific, Technical andTechnological Advice as a way of sharing information and experiences on technology transfer and coopera-tion, and on the planning, establishment and management of protected areas.
I thank all who contributed their ideas and expertise to this endeavour.
Hamdallah ZedanExecutive Secretary
3
Facilitating conservation and sustainable use of biological diversity. Abstracts of poster presentations on protected areas and technology transfer and cooperation at the ninth meeting of the Subsidiary Body on Scientific, Technical and Technological Advice.
007419 CDG Interieur_no9 11/3/03 6:12 PM Page 3

Facilitating conservation and sustainable use of biological diversity. Abstracts of poster presentations on protected areas and technology transfer and cooperation at the ninth meeting of the Subsidiary Body on Scientific, Technical and Technological Advice.
4
007419 CDG Interieur_no9 11/3/03 6:12 PM Page 4
CONTENTS
Foreward 3
Protected Areas 9
1 APPLYING THE ECOSYSTEM APPROACH IN PROTECTED AREAS IN GERMANYAxel Paulsch, Cornelia Dziedzioch, Thomas Plän 10
2 A VISION FOR A WEB OF CONSERVATION LANDS ACROSS CANADA’S FORESTNatural Resources Canada 13
3 BIODIVERSITY: A NATURAL PATRIMONY THREATENED IN SANTA CATARINA’S COAST, BRAZILMarta Emma Piñero Verdinelli , Jonatha Sancho, Natasha Curllin Japp, Miguel Angel Verdinelli 15
4 BIODIVERSITY CONSERVATION IN A WORKING LANDSCAPE: AN OVERVIEWOF COOPERATION IN THE MIXED GRASS PRAIRIE OF SOUTHWESTERN SASKATCHEWAN, CANADA 17Merle Boyle, Pat Fargey, Tom Harrison, Bill Houston, Gerry Luciuk, Sue Michalsky, Glenn Sutter
5 BIODIVERSITY OF MARINE FISH LARVAE AT THE SOUTHERN TIP OF PENINSULAR INDIA, NEEDS CONSERVATION AND FURTHER STUDIESVincent, S.G, S.G.P Vincent 20
6 CONSERVATION OF BIODIVERSITY IN THE PROTECTED AREA NETWORK OF IRANAsghar M. Fazel, Mahboobe Tohidi 21
7 CORRIDOR DEVELOPMENT FOR BIODIVERSITY LANDSCAPE CONSERVATIONEklabya Sharma, Nakul Chettri 23
8 ECOSYSTEMS AND HUMAN WELL-BEING: A FRAMEWORK FOR ASSESSMENTNicolas Lucas 25
9 EVALUATING THE POWER OF TIME OF SERIES OF LINE TRANSECT SURVEYS TO DETECT CHANGE IN POPULATION OF DORCAS GAZELLE (GAZELLA DORCAS)IN SOUTH SINAI EGYPTHusam El Alqamy, John Harwood 27
10 FACTORS THAT INFLUENCE THE MANAGEMENT OF PROTECTED FOREST SUMACO, CANTON LORETO - ECUADORAlvaro Cañadas, Oleg Nenadic 30
5
Facilitating conservation and sustainable use of biological diversity. Abstracts of poster presentations on protected areas and technology transfer and cooperation at the ninth meeting of the Subsidiary Body on Scientific, Technical and Technological Advice.
007419 CDG Interieur_no9 11/3/03 6:12 PM Page 5
Facilitating conservation and sustainable use of biological diversity. Abstracts of poster presentations on protected areas and technology transfer and cooperation at the ninth meeting of the Subsidiary Body on Scientific, Technical and Technological Advice.
6
11 IMPORTANT BIODIVERSITY RESEARCH ISSUES IN PROTECTED AREASEuropean Platform for Biodiversity Research Strategy (EPBRS) 33
12 PEOPLE PROTECTED AREA INTERFACE: SOME LESSONS IN POLICY- MAKING AND PRACTICE FROM PROTECTED AREAS IN CHINA AND INDIANeela Mukherjee, Amitava Mukherjee 35
13 REPORTING ON DESIGNATED AREAS AT EUROPEAN LEVEL: THE COMMON DATABASE ON DESIGNATED AREAS (CDDA)Dominique Richard, Marc Roekaerts, Lauri Klein, Ulla Pinborg, Jeremy Harrison, S. Chape,Eladio Fernandez Galiano 37
14 STATUS AND EFFECTIVENESS OF PROTECTED AREAS IN CANTON LORETO - ECUADORAlvaro Cañadas, Oleg Nenadic 39
15 SUPPORTING NATIONAL PROTECTED AREA SYSTEMS INTERNATIONALLY - THE GLOBAL ENVIRONMENT FACILITY AS A MECHANISM OF TRANSFEROliver Deke 43
16 TRANSBOUNDARY COOPERATION IN THE EVEREST MOUNTAIN ECOSYSTEMNatural Resource Management Programme 46
Technology Transfer 49
17 BIODIVERSITY AND RANGELAND IN CANADA - THE EVOLUTION OF BENEFICIALMANAGEMENT PRACTICES (BMPS)Ted Weins, Brant Kirychuk 50
18 BIOPROSPECCIÓN, TRANSFERENCIA DE TECNOLOGÍA Y CONSERVACIÓN DE LA BIODIVERSIDAD: LA EXPERIENCIA DE INBIO - COSTA RICAAna Lorena Guevara F. 52
19 BIOSYSTEMATICS IN FORESTRY: INVASIVE PESTS AND NATIVE BIODIVERSITYJ. T. Huber, P.T. Dang 55
20 CANADIAN COLLECTION OF FUNGAL CULTURES (CCFC/DAOM) MICROBIAL GENETIC RESOURCESC.E. Babcock 57
21 NEW APPROACHES TO TECHNOLOGY TRANSFER AT THE AAFC PLANT COLLECTIONPaul Catling, Jacques Cayouette, Gisèle Mitrow, Lynn Black 58
007419 CDG Interieur_no9 11/3/03 6:12 PM Page 6
22 PROVIDING INCENTIVES FOR BIODIVERSITY CONSERVATION BY THE RURAL POOR IN UNIQUE HABITATS (NAMIBIA)Elias. S. Shanyengana 62
23 TECHNOLOGY TRANSFER: DIALOGUE BETWEEN SCIENCE AND POLICYEuropean Platform for Biodiversity Research Strategy (EPBRS) 64
24 TECHNOLOGY TRANSFER FOR PLANT CONSERVATIONClare Tenner, Colin Clubbe, Justin Moat, Margaret Ramsay, Paul Smith 66
Index by authors 68
Index by keywords 69
7
Facilitating conservation and sustainable use of biological diversity. Abstracts of poster presentations on protected areas and technology transfer and cooperation at the ninth meeting of the Subsidiary Body on Scientific, Technical and Technological Advice.
007419 CDG Interieur_no9 11/3/03 6:12 PM Page 7

Facilitating conservation and sustainable use of biological diversity. Abstracts of poster presentations on protected areas and technology transfer and cooperation at the ninth meeting of the Subsidiary Body on Scientific, Technical and Technological Advice.
8
007419 CDG Interieur_no9 11/3/03 6:12 PM Page 8

9
Protected Areas
Protected Areas
007419 CDG Interieur_no9 11/3/03 6:12 PM Page 9
APPLYING THE ECOSYSTEM APPROACH IN PROTECTED AREAS IN GERMANY
Axel Paulsch, Cornelia Dziedzioch, Thomas PlänInstitute for Biodiversity, Dr. Johann-Maierstr. 4, D-93049 Regensburg, Germany
Keywords: protected areas, sustainable use, implementation, management of biodiversity
Introduction
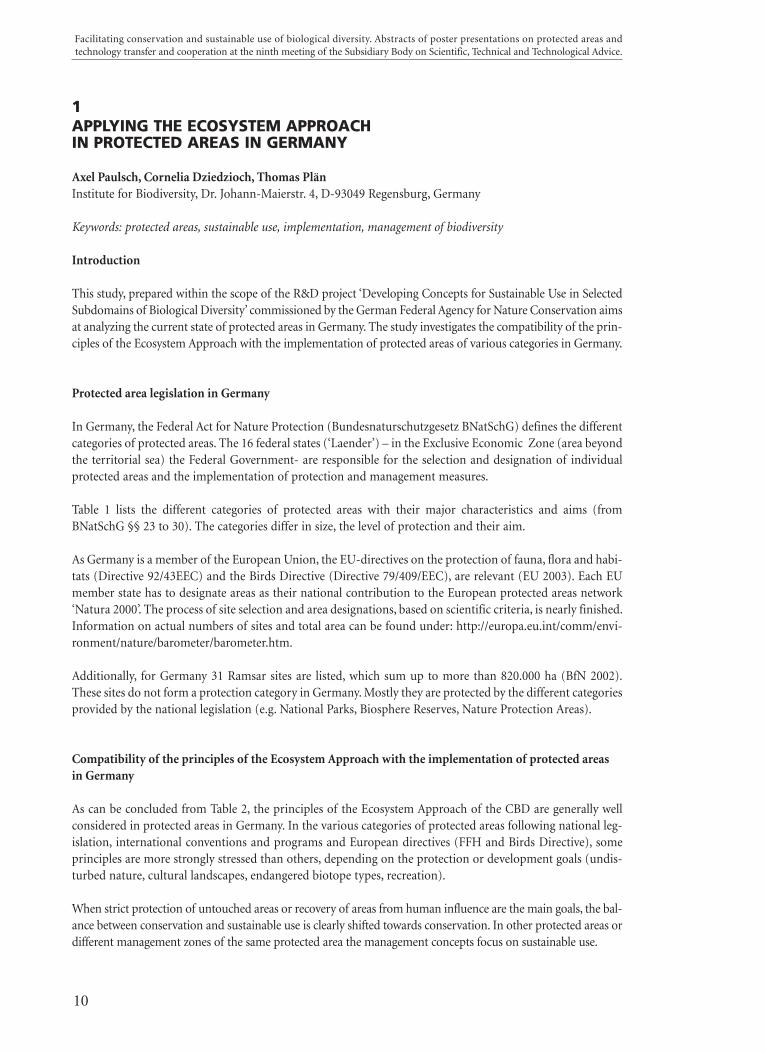
This study, prepared within the scope of the R&D project ‘Developing Concepts for Sustainable Use in SelectedSubdomains of Biological Diversity’ commissioned by the German Federal Agency for Nature Conservation aimsat analyzing the current state of protected areas in Germany. The study investigates the compatibility of the prin-ciples of the Ecosystem Approach with the implementation of protected areas of various categories in Germany.
Protected area legislation in Germany
In Germany, the Federal Act for Nature Protection (Bundesnaturschutzgesetz BNatSchG) defines the differentcategories of protected areas. The 16 federal states (‘Laender’) – in the Exclusive Economic Zone (area beyondthe territorial sea) the Federal Government- are responsible for the selection and designation of individualprotected areas and the implementation of protection and management measures.
Table 1 lists the different categories of protected areas with their major characteristics and aims (fromBNatSchG §§ 23 to 30). The categories differ in size, the level of protection and their aim.
As Germany is a member of the European Union, the EU-directives on the protection of fauna, flora and habi-tats (Directive 92/43EEC) and the Birds Directive (Directive 79/409/EEC), are relevant (EU 2003). Each EUmember state has to designate areas as their national contribution to the European protected areas network‘Natura 2000’. The process of site selection and area designations, based on scientific criteria, is nearly finished.Information on actual numbers of sites and total area can be found under: http://europa.eu.int/comm/envi-ronment/nature/barometer/barometer.htm.
Additionally, for Germany 31 Ramsar sites are listed, which sum up to more than 820.000 ha (BfN 2002).These sites do not form a protection category in Germany. Mostly they are protected by the different categoriesprovided by the national legislation (e.g. National Parks, Biosphere Reserves, Nature Protection Areas).
Compatibility of the principles of the Ecosystem Approach with the implementation of protected areasin Germany
As can be concluded from Table 2, the principles of the Ecosystem Approach of the CBD are generally wellconsidered in protected areas in Germany. In the various categories of protected areas following national leg-islation, international conventions and programs and European directives (FFH and Birds Directive), someprinciples are more strongly stressed than others, depending on the protection or development goals (undis-turbed nature, cultural landscapes, endangered biotope types, recreation).
When strict protection of untouched areas or recovery of areas from human influence are the main goals, the bal-ance between conservation and sustainable use is clearly shifted towards conservation. In other protected areas ordifferent management zones of the same protected area the management concepts focus on sustainable use.
Facilitating conservation and sustainable use of biological diversity. Abstracts of poster presentations on protected areas and technology transfer and cooperation at the ninth meeting of the Subsidiary Body on Scientific, Technical and Technological Advice.
10
1
007419 CDG Interieur_no9 11/3/03 6:12 PM Page 10
The wide range of possible conservation categories (ranging from strict protection to sustainable developmentand the permission of non-destructive economic activities) provides a good basis to save the variety of ecosys-tems in Germany for future generations. Many principles of the ecosystem approach are already implement-ed in the different area conservation categories. Due to individual circumstances it may not be possible toimplement all principles of the Ecosystem Approach in each protected area equally.
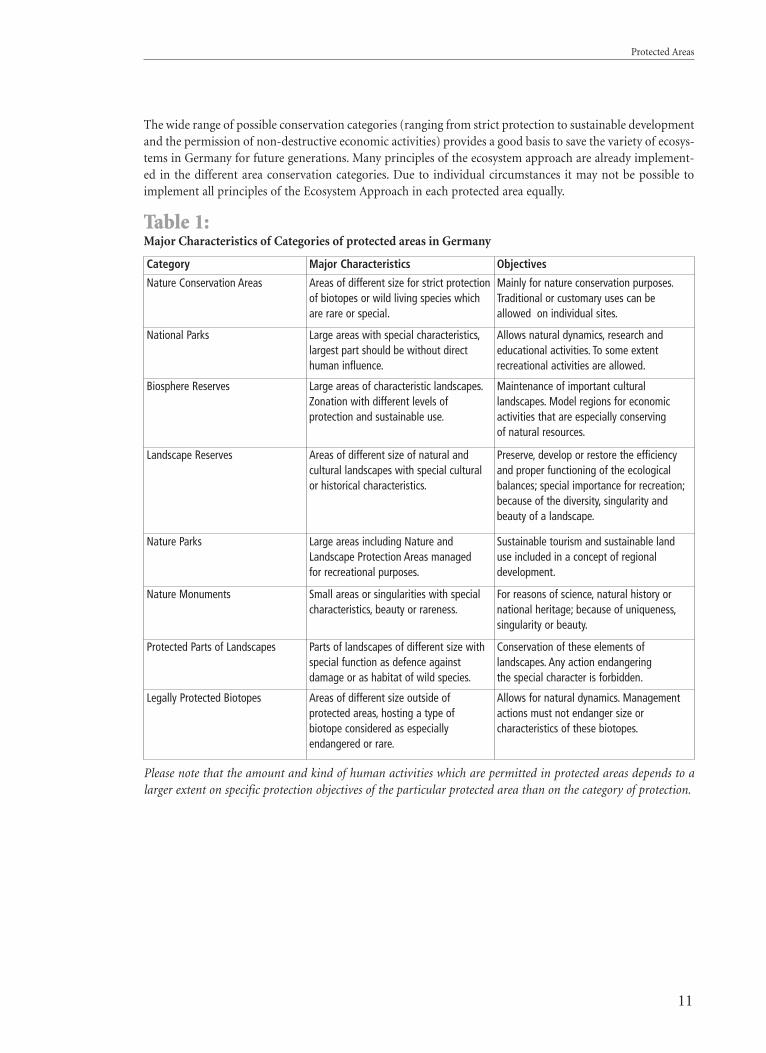
Table 1:Major Characteristics of Categories of protected areas in Germany
Please note that the amount and kind of human activities which are permitted in protected areas depends to alarger extent on specific protection objectives of the particular protected area than on the category of protection.
11
Protected Areas
Category Major Characteristics Objectives
Nature Conservation Areas Areas of different size for strict protectionof biotopes or wild living species whichare rare or special.
Mainly for nature conservation purposes.Traditional or customary uses can beallowed on individual sites.
National Parks Large areas with special characteristics,largest part should be without directhuman influence.
Allows natural dynamics, research and educational activities. To some extent recreational activities are allowed.
Biosphere Reserves Large areas of characteristic landscapes.Zonation with different levels of protection and sustainable use.
Maintenance of important cultural landscapes. Model regions for economic activities that are especially conserving of natural resources.
Landscape Reserves Areas of different size of natural and cultural landscapes with special culturalor historical characteristics.
Preserve, develop or restore the efficiencyand proper functioning of the ecological balances; special importance for recreation;because of the diversity, singularity andbeauty of a landscape.
Nature Parks Large areas including Nature andLandscape Protection Areas managed for recreational purposes.
Sustainable tourism and sustainable landuse included in a concept of regional development.
Nature Monuments Small areas or singularities with specialcharacteristics, beauty or rareness.
For reasons of science, natural history ornational heritage; because of uniqueness,singularity or beauty.
Protected Parts of Landscapes Parts of landscapes of different size withspecial function as defence against damage or as habitat of wild species.
Conservation of these elements of landscapes. Any action endangering the special character is forbidden.
Legally Protected Biotopes Areas of different size outside of protected areas, hosting a type of biotope considered as especially endangered or rare.
Allows for natural dynamics. Managementactions must not endanger size or characteristics of these biotopes.
007419 CDG Interieur_no9 11/3/03 6:12 PM Page 11
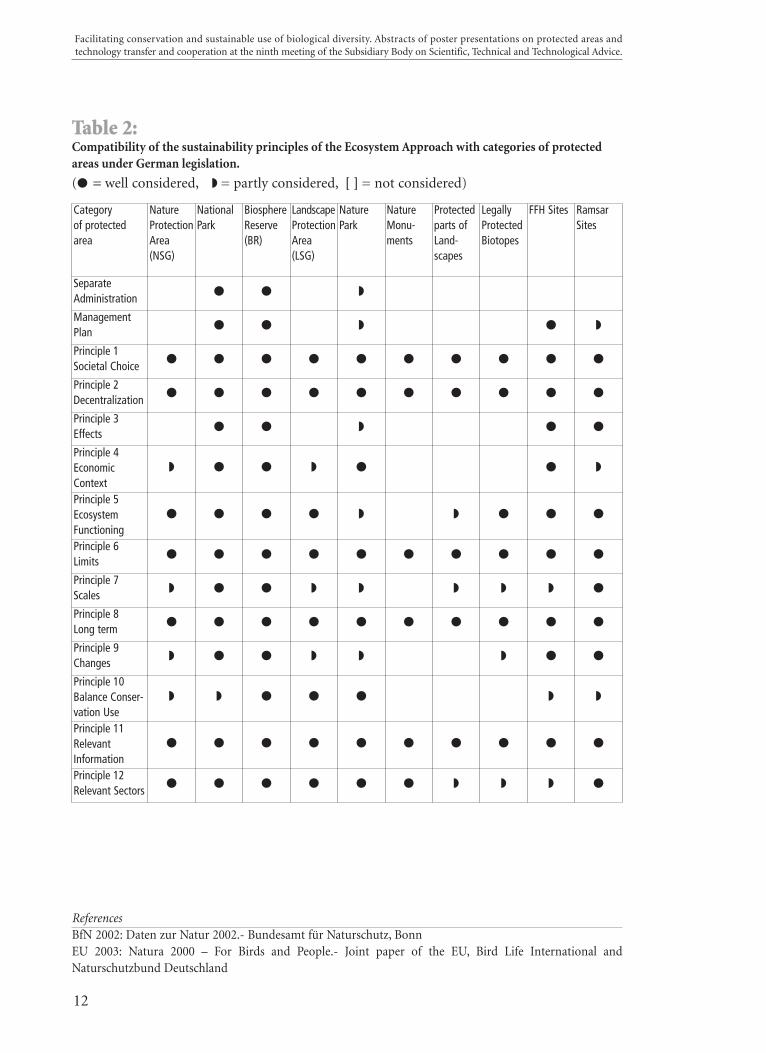
Table 2:Compatibility of the sustainability principles of the Ecosystem Approach with categories of protectedareas under German legislation.
(● = well considered, ◗ = partly considered, [ ] = not considered)
ReferencesBfN 2002: Daten zur Natur 2002.- Bundesamt für Naturschutz, BonnEU 2003: Natura 2000 – For Birds and People.- Joint paper of the EU, Bird Life International andNaturschutzbund Deutschland
Facilitating conservation and sustainable use of biological diversity. Abstracts of poster presentations on protected areas and technology transfer and cooperation at the ninth meeting of the Subsidiary Body on Scientific, Technical and Technological Advice.
12
Categoryof protectedarea
NatureProtectionArea(NSG)
NationalPark
BiosphereReserve(BR)
LandscapeProtectionArea(LSG)
NaturePark
NatureMonu-ments
Protectedparts ofLand-scapes
LegallyProtectedBiotopes
FFH Sites RamsarSites
SeparateAdministration ● ● ◗
ManagementPlan ● ● ◗ ● ◗
Principle 1Societal Choice ● ● ● ● ● ● ● ● ● ●
Principle 2Decentralization ● ● ● ● ● ● ● ● ● ●
Principle 3Effects ● ● ◗ ● ●
Principle 4EconomicContext
◗ ● ● ◗ ● ● ◗
Principle 5EcosystemFunctioning
● ● ● ● ◗ ◗ ● ● ●
Principle 6Limits ● ● ● ● ● ● ● ● ● ●
Principle 7Scales ◗ ● ● ◗ ◗ ◗ ◗ ◗ ●
Principle 8 Long term ● ● ● ● ● ● ● ● ● ●
Principle 9Changes ◗ ● ● ◗ ◗ ◗ ● ●
Principle 10Balance Conser-vation Use
◗ ◗ ● ● ● ◗ ◗
Principle 11Relevant Information
● ● ● ● ● ● ● ● ● ●
Principle 12Relevant Sectors ● ● ● ● ● ● ◗ ◗ ◗ ●
007419 CDG Interieur_no9 11/3/03 6:12 PM Page 12
A VISION FOR A WEB OF CONSERVATION LANDS ACROSS CANADA’SFOREST
Natural Resources CanadaCanadian Forest Service,580 Booth St, Ottawa, Ontario K1A 0E4Canada
Keywords: conservation lands, web of conservation lands, sustainable forest management
Approaches to conservation of forest biodiversity
Approximately two thirds of Canada’s wildlife species occur in forest ecosystems. Conservation of forest bio-diversity is a Canadian priority and forests play an important role in our commitment under the Conventionon Biological Diversity (CBD) and its Canadian counterpart the Canadian Biodiversity Strategy (CBS) for theconservation and sustainable use of biodiversity. Currently in Canada, two distinct but additive strategies areused to conserve forest biodiversity. The first strategy involves the setting aside of parcels of land to provideappropriate protection to environmentally sensitive areas as well as to ensure representation through conven-tional protected areas. The classification system developed by The World Conservation Union (IUCN) hasbeen widely used by countries to report on protected areas, with various degrees of success and consistency.The second approach to biodiversity conservation practiced in Canada considers those activities within a sus-tainable forest management framework that contribute to the maintenance of biodiversity. Harvesting guide-lines for the retention of wildlife trees, snags and coarse woody debris, spatial and temporal considerationswith regard to species composition and age class distribution and areas in the operational forest that are con-sidered non-timber productive are examples of such activities.
Areas where these two strategies are achieved, either singly or combined, using any of a broad array of poli-cies, legal instruments and targeted management practices are referred to as Conservation Lands.
Determination of the conservation status of an area
A series of 12 guiding questions were developed to assist in the determination of the conservation status of agiven area. The questions largely reflect the IUCN eligibility criteria while focusing on goals for biodiversityconservation (representation, ecological integrity, connectivity and ecological management to maintain bio-logical diversity) and the need for appropriate management actions that serve as guidance for the recognitionof the conservation status of a given area.
Five classes of conservation lands can be distinguished based on their management priorities. A framework,defining these classes, outlining the associated conservation activities with their management priorities andidentifying links to international reporting mechanisms has been developed for planning and reporting. Theframework reflects an integrated ecological approach to conservation of biodiversity and considers the grow-ing recognition, within the scientific and conservation communities, that the cumulative impact of all con-servation mechanisms are required to ensure ecological functioning in forest ecosystems. Wilderness areas(Class 1), Nature Reserves (Class 2), Environmentally Significant Areas (Class 3), and ConservationManagement Areas (Class 4) are types of conservation areas, designated through legal or policy mechanisms,where the conservation target is determined through management objectives. The Conservation Landscape(Class 5) is a mosaic of areas that collectively maintains biodiversity across the landscape.
13
Protected Areas
2
007419 CDG Interieur_no9 11/3/03 6:12 PM Page 13
The Web of Conservation Lands
Each Canadian province is responsible for retaining the integrity of its forests using different tools (and ter-minology) related to the diversity of forest types across the country. Assuring the resilience of forest ecosys-tems and the life support services they provide requires spatial and temporal planning for the maintenance of:
• the full spectrum of major ecosystem types (representation);• natural disturbance regimes (ecological integrity); and,• links between natural areas (connectivity across landscapes).
To be effective, these conservation goals should be framed within an ecological approach to management(ecological management action).
Parks, ecological reserves, wilderness areas and other dedicated conservation areas are identifiable areas acrossthe forested landscape that can be mapped, assessed and evaluated for biodiversity conservation. These con-servation lands (Classes 1-4) are the individual components that when strategically linked extend to form aWeb of Conservation Lands across the country. In addition to these conservation lands, there are also spe-cific activities, within both managed portions of the commercial forest and the non-timber productive por-tion of the commercial forest which, while outside of legally protected areas, are critical to the conservation ofbiodiversity, but are not easily quantified. When biodiversity management planning and objectives are strate-gically linked with the components of the Web of Conservation Lands, a Conservation Landscape (Class 5)can be achieved and recognized for its contribution to biodiversity conservation.
Facilitating conservation and sustainable use of biological diversity. Abstracts of poster presentations on protected areas and technology transfer and cooperation at the ninth meeting of the Subsidiary Body on Scientific, Technical and Technological Advice.
14
007419 CDG Interieur_no9 11/3/03 6:12 PM Page 14
BIODIVERSITY: A NATURAL PATRIMONY THREATENED INSANTA CATARINA’S COAST, BRAZIL
Marta Emma Piñero Verdinelli *, Jonatha Sancho, Natasha Curllin Japp, Miguel Angel VerdinelliUniversidade do Vale do Itajaí - UNIVALICentro de Ciencias Tecnológicas da Terra e do Mar - CTTMarRua Uruguai 458, Itajaí – SC, Brazil CEP 88302-202E-mail: [email protected]
Keywords: coastal zone, antropic pressure, Zimbros’ reservation
Introduction
The Brazilian biodiversity is so rich as ignored; nevertheless, Brazil is denominated the country of the megadiversity. It has 357 thousand hectares of tropical forests, representing 30% of that forest type in the planet. Itcounts with the most several flora of the world, having 55.000 described species. The vertebrates are repre-sented thoroughly with 394 species of mammals, 1.622 of birds, 516 of reptiles, 502 of amphibians and morethan 3.000 species of fish. The arthropods are counted in more than 2.500.000 species.
Atlantic forest
In this universe of extensive exploration of the natural resources, the forest is had as one of the biomes withlarger biodiversity indexes in the world and it occupies the second place among the threatened tropical forests.Today it has an extension of approximately 52.000 km2, corresponding at 5% of its original covering.Although reduced and very broken into fragments, the remainders have a significant social and environmen-tal importance. Almost 70% of the Brazilian population lives in its domains and they depend on the flows ofthe springs that exist in it. From the forest it makes sure the fertility of the soil and the control of the region-al climate and local microclimate. It protects against the erosion and from the collapses the scarps and theslopes of the mountain. The Atlantic Forest is part of the fifteen areas globally identified as hotpots (areas withhigh biodiversity, discharge endemism rates and, at the same time, with high antropic pressure). And for thatit occupies a priority position in the world efforts for the conservation of the biodiversity. This took UNESCOto declare, in 1991, the remainders of this Brazilian biome, as Natural Patrimony of the Humanity. Rizzini(1997) stands out some numbers from what has survived, just considering the group of the angiosperms; thereare about 20.000 species, being 50% of those endemic ones to the biome. The avifauna surpasses 680 species,where 199 are had endemic and 144 in extinction menace (ROSARIO, 1996).
Characterization of the Place of Study
The study area, Coastal of Zimbros, includes a belt of forest of 30 km2. It is a remainder of the Atlantic Forestthat forms the divisor of waters in the limit between the municipal districts of Bombinhas and Porto Belo inSanta Catarina’s State. It is formed by several fisiographics environment as slopes, valleys, shores and beaches,exposed to an intense predation. It is influenced by a mesotermic semi-humid climate, without stations ofdroughts, with hot summers and annual medium temperature of 18ºC, with maximum of 38ºC and mini-mum of 10ºC and annual medium pluviosity of 1.500 mm (RIZZINI, 1997).
The study involved interdisciplinary methodologies, including Geomorphology, Edafology, Hydrology,Climatology and Biology, among other, seeking the scientific knowledge to develop the use and maintainablehandling of this coastal area. The results of a first phase try to relate the information obtained with the han-dling tools, subsidizing the taking of decisions. In relation to the biological aspects, in Zimbros Coastal the
15
Protected Areas
3
007419 CDG Interieur_no9 11/3/03 6:12 PM Page 15
qualitative composition of the biodiversity of superior vertebrates was characterized and of the flora, lookingfor to esteem the distribution and relative frequency of the species and its variations. It was also tried to com-pare the importance of the only unit of conservation in that area, the of the Natural Patrimony Hill ofZimbros’ Reservation, that takes twenty years of conservation and regeneration of an area of 50 ha, approxi-mately. The Reservation was used for agro pasture and, in more recent times, it suffered hunters’ invasion andillegal extractives. At the present time it has the recognition of the legal environmental organs as ParticularReservation of the Natural Patrimony and, starting from it, was transmitted to the inhabitants of the area therespect and the importance of preserving, what doesn’t happen with the remaining of the area.
Final considerations
The agriculture is co-responsible for extensive cut down of the native forest in the area, followed by the realstate speculation. The phenomenon of loss of the biodiversity is noticed mainly in the less structured nucleiand isolated as in different points of the Coastal of Zimbros. The researchers’ efforts, however, is not enoughto stop the degradation of the forest. To minimize that problem, it urges the need to deepen the knowledgeabout the forest and its functionality, objectifying the creation of alternatives for the preservation. Thedescribed scenery sketches the urgency and the importance of the studies on characterization, evaluation ofthe impacts and maintainable development. The presence in the area of a Particular Reservation of the NaturalPatrimony serves as a reference mark for the local inhabitants and for the tourists that visit the coastal zone ofthe Municipal districts of Bombinhas and Porto Belo. Besides the educational aspects, the Reservation alsocontributes as reservoir to the flora maintenance and autochthonous fauna.
ReferencesCIMARDI, A. V.; 1996. Mamíferos de Santa Catarina. Florianópolis: FATMA, 302 p.KLEIN, R. M.; 1990. Espécies raras ou ameaçadas de extinção do Estado de Santa Catarina. Rio de Janeiro:IBGE.MARQUES, O. A. V.; 2001. Serpentes da Mata Atlântica - guia ilustrado para Serra do Mar. Ribeirão Preto:Holos, 184 p.RIZZINI, C. T.; 1997. Tratado de Fitogeografia do Brasil: aspectos ecológicos, sociológicos e florísticos. Rio deJaneiro: Âmbito Cultural Edições LTDA, 746 p.(2º ed.).ROSÁRIO, l. a.; 1996. Aves em Santa Catarina: distribuição geográfica e meio ambiente. Florianópolis:FATMA, 326 p.sick, h.; 1997. Ornitologia Brasileira. Rio de Janeiro: Nova Fronteira, 862 p.ZIMMERMANN, C. E.; 2000. Avifauna de um fragmento de floresta Atlântica em Blumenau, Santa Catarina.Revista de Estudos Ambientais, Blumenau-SC, 1(3): 101-113.
Facilitating conservation and sustainable use of biological diversity. Abstracts of poster presentations on protected areas and technology transfer and cooperation at the ninth meeting of the Subsidiary Body on Scientific, Technical and Technological Advice.
16
007419 CDG Interieur_no9 11/3/03 6:12 PM Page 16
17
Protected Areas
4BIODIVERSITY CONSERVATION IN A WORKING LANDSCAPE: AN OVERVIEW OF COOPERATION IN THE MIXED GRASS PRAIRIE OF SOUTHWESTERN SASKATCHEWAN, CANADA
Authors: Merle Boyle1, Pat Fargey2, Tom Harrison3, Bill Houston1, Gerry Luciuk1, Sue Michalsky4, Glenn Sutter5
Contributors: Karyn Scalise6, Robert Sissons2, Karin Smith-Fargey4
*1Agriculture and Agri-Food Canada, Prairie Farm Rehabilitation Administration, 1800 Hamilton St, Regina,SK, S4P 4L2; 2Parks Canada, Grasslands National Park, Box 74, Val Marie, SK, S0N 2T0; 3SaskatchewanWatershed Authority, 101-2022 Cornwall St, Regina, SK, S4P 2K5; 4Nature Conservancy of Canada, Box 448,Eastend, SK, S0N 0T0; 5Royal Saskatchewan Museum, 2340 Albert St, Regina, SK, S4P 3V7; 6SaskatchewanPrairie Conservation Action Plan, Box 4752, Regina, S4P 3Y4 E-mail: [email protected]
Keywords: biodiversity conservation, grassland, ranching, rangeland, working landscape
Introduction
Land owners, lessees, interest groups, and government agencies have formed cooperative relationships toadvance biodiversity conservation in the southwest region of the Province of Saskatchewan, Canada. Thesenetworks, which extend into neighboring jurisdictions, share an appreciation for the inherent value of theprairie landscape, the importance of biodiversity reach and monitoring and land management approachesaimed at social, economic, and environmental sustainability.
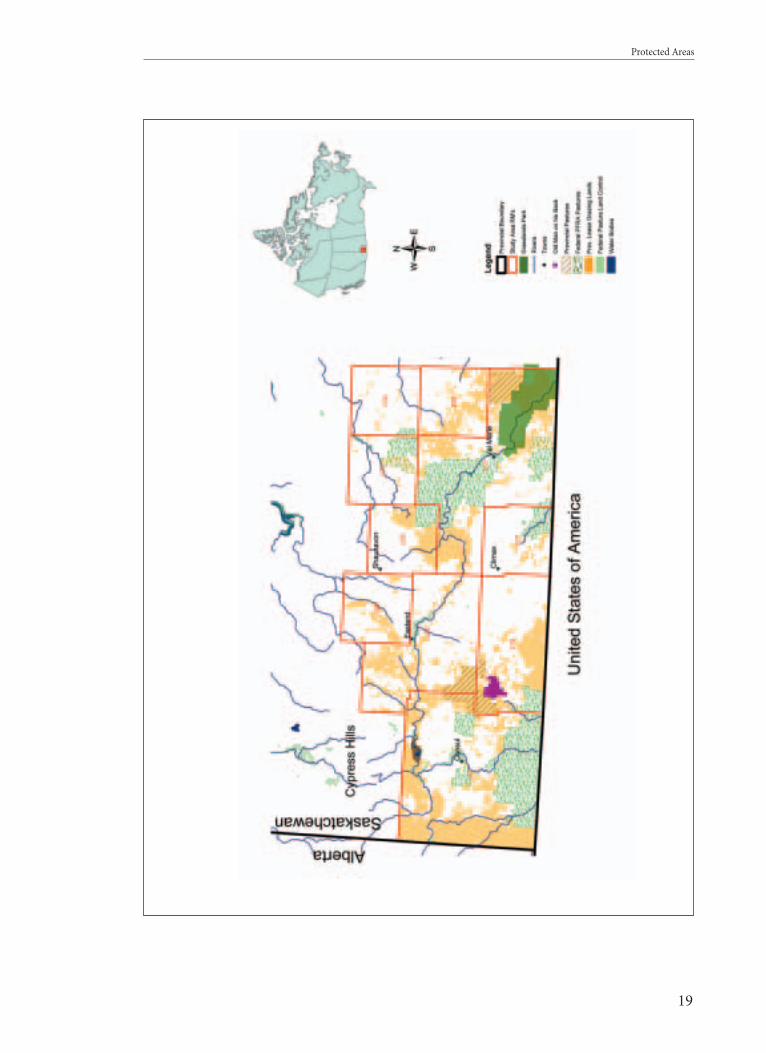
Dominated by Brown Chernozemic soils and a semiarid climate, southwest Saskatchewan lies in the centre ofthe Prairie Ecozone and is part of the Mixed Grassland Ecoregion of North America. Major features includethe Frenchman River and Battle Creek valleys, and 46% of the landscape is publicly owned rangeland inGrasslands National Park, federal Prairie Farm Rehabilitation Administration (PFRA) Community Pastures,and Saskatchewan’s Community Pastures and grazing leases (Figure 1). Of the publicly owned lands, about87% are managed cooperatively with private interests, for cattle production and wildlife habitat. Significanteffects due to climate change are predicted for the area.
The human population is relatively sparse and is in decline, and there are few communities in this ‘workinglandscape. The area’s ranching history pre-dates Saskatchewan’s entry into the Canadian Confederation in1905, and the ranching way of life continues, despite relentless hardships. About 60% of the land is managedfor cattle ranching, and 40% is cultivated for annual crops. Federal and provincial government initiativesencourage the conversion of marginal cultivated land to forage and pasture.
Significant Cooperative Efforts for Biodiversity Conservation
Voluntary and cooperative approaches to land management have evolved in this area, to the benefit of all part-ners. Ranching has helped to conserve the prairie against fragmentation, because large blocks of land are need-ed due to low productivity. Private and leased lands managed as single units, with long ranching histories andmulti-generational lease tenures, are proving to be crucial to the maintenance of the remaining prairie ecosys-tems. Biodiversity is one indicator of land management performance. Experience shows that Mid-Good RangeCondition provides the optimum resource for livestock grazing, and conservation of biodiversity. For thisregion, the rangeland is mostly in the Good or Excellent range condition classes.
Canada’s Habitat Stewardship Program for Species at Risk is an effective catalyst in fostering cooperation andpromoting biodiversity conservation in this priority landscape. Ranchers are involved in stewardship activitiesthrough the Saskatchewan Prairie Conservation Action Plan (PCAP) and the Saskatchewan WatershedAuthority. The PCAP is action-oriented, driven by 25 partners, and chaired by the Saskatchewan StockGrowers Association. The vision is a native prairie sustained in a healthy state in which natural and human
007419 CDG Interieur_no9 11/3/03 6:12 PM Page 17
values are respected. Other examples of cooperative stewardship actions include: Nature Saskatchewan’sOperation Burrowing Owl, the Nature Conservancy of Canada and the Frenchman River Biodiversity Projectbeing developed by the Royal Saskatchewan Museum and the Canadian Museum of Nature.
Grasslands National Park is one of the only intact prairie landscapes that invites all Canadians to connect tograssland ecosystems. Upon completion, the Park will encompass 906 km2 and protect some of NorthAmerica’s most endangered habitats. More than 400 plant species are found in the Park, including 36 that arerare in the province. Species at risk include: Black-tailed Prairie Dog, Sage Grouse, Burrowing Owl,Ferruginous Hawk, Sprague’s Pipit, Prairie Rattlesnake and Eastern Short-horned Lizard. The Park’s manage-ment plan outlines a role for grazing and prescribes the use of bison and, when necessary, domestic livestock.The intent is to complement the management of surrounding rangelands and increase the ecological integrityof the whole region by brief and less frequent periods of intensive grazing. This will represent the range ofdisturbance patterns that led to the evolution of prairie ecosystems. The Park works in partnership with a varietyof conservation initiatives, including the PCAP, the Nature Conservancy of Canada, the Frenchman RiverBiodiversity Project and species at risk recovery strategies.
Canada’s PFRA Community Pasture Program has operated in this area since the 1930s to rehabilitate and con-serve severely eroded and drought-prone lands. This program represents Canada’s largest management efforton native prairie. PFRA cooperatively manages 207 890 hectares in the region, of which 87% is native vegeta-tion. These pastures offer large, contiguous blocks of native prairie and contribute to a mix of managementapproaches and grazing intensities at the landscape level. Govenlock, Nashlyn and Battle Creek pastures havebeen awarded Important Bird Area designations for the presence of birds and their intact natural environments.
Nature Conservancy of Canada’s (NCC) primary focus in southwest Saskatchewan is to work with landownerswho wish to enter into conservation easement agreements on their privately owned grassland. NCC also ownsand manages, with the Saskatchewan Government, the Old Man on His Back Prairie and Heritage ConservationArea - a project designed to showcase the positive relationship of sustainable agriculture and grassland conser-vation. Also, NCC is a key sponsor of the Northern Mixed Grass Conservation Planning initiative.
Summary
Southwest Saskatchewan is a valuable landscape for the conservation of biodiversity in the northern mixedgrass prairie. Cooperative approaches to land management support both private and public interests, partlythrough the maintenance of large contiguous blocks of native prairie in good condition. Actions aimed at thesocial, economic and environment sustainability of this working landscape face the challenges of declininghuman populations, development interests, income issues, and the potential effects of climate change.
Facilitating conservation and sustainable use of biological diversity. Abstracts of poster presentations on protected areas and technology transfer and cooperation at the ninth meeting of the Subsidiary Body on Scientific, Technical and Technological Advice.
18
007419 CDG Interieur_no9 11/3/03 6:12 PM Page 18
19
Protected Areas
007419 CDG Interieur_no9 11/3/03 6:12 PM Page 19
BIODIVERSITY OF MARINE FISH LARVAE AT THE SOUTHERN TIP OFPENINSULAR INDIA, NEEDS CONSERVATION AND FURTHER STUDIES
Vincent, S.G, S.G.P Vincent* Institute for Fish Eggs and Larvae Studies, Centre for Biodiversity, Trituapuram, Kuzhithurai, K.K.Dist, TN, INDIA*Marine Biotechnology Laboratory, Centre for Marine Science and Technology, Manonmaniam SundaranarUniversity, Rajakamangalam, K.K.Dist, TN, INDIA / [email protected]
Keywords: marine fish larvae, conservation, marine protected area, hot spot
The magnitude of marine biodiversity is large and much studies has to be carried out to get an understanding ofthe life in the Oceans. Only about 7% of the Oceans has been sampled. India is one of the mega biodiversitycountries. The marine diversity in India is large and specific measures needs to be taken to conserve it. Fisherytechnology is getting modernized day by day, and also the harvesting of marine fishes. Since very less attentionis paid to conservation, the danger of fish stocks being eliminated is eminent if conservation is not put into force.
The southern most tip of India is surrounded by the Bay of Bengal in the east, Indian ocean in the south andthe Arabian sea in the west. The kannyakumari to Trivandrum coast (76o55` to 77o35`E and 08o5` to 08o30`N)is rich in marine biodiversity, especially the fish species belonging to it. Every year, during November to March(post North East Monsoon period) post larvae of hundreds of species occur abundantly in the inshore watersof the above coast of India. Samples of young fishes were collected for identification during an extended peri-od of time of more than two decades.
Post larval stages of 72 bony fish families represented by 243 species were collected during this study.Lutjanidae ranked first comprising 32 species followed by Serranidae 26 sps., Carangidae 19 sps., Engraulidae13 sps., Sciaenidae 9 sps., Pomacentridae and Platycephalidae represents each 8 sps., Leiognathidae and Bothidaerepresent 7 sps. each, Apogonidae and Nemipteridae represents 6 sps. each, Siganidae, Sphyraenidae andTunnidae represented 5 sps each. All the other families represented below 5 sps. each.
The most important species of post larval stages of fishes which regularly occur every year in this region areScomberomorus commerson, S.guttatus, S. lineolatus, Auxis thazard, A. thynnoides, Sarda orientalis, Euthynnusaffinis, Neothunnus macropterus, Rostrelliger kanagurta, Sphyraena jello, S. piguda, S. obtusata, Lutjanus spp,Epinephelus spp ,Siganus spp, Caranx spp etc. The spawners and spent specimens of the above occur in the fish-ery. The full life history stages of Trichiurus lepturus and Lepturacanthus savala collected from this region bythe authors were studied (unpublished). During November to January every year the traditional fisherman ofthe locality are engaged in “Nonna” fishery. The post larvae of Engraulidae, Dussumieridae, Clupeidae andSynodontidae occur in several tonnes at the near shore waters and constitute “Nonna” fishery.
An assessment of the diversity of fauna & flora of this fragile system is important. The resources and habitatsof this area has to be thoroughly studied before being depleted. The abundance of young fish assemblage atthese area clearly indicate the quality of water prevailing at the inshore waters of South west coast of India. Anestimated 60 percent of the global population lives within roughly 100 kilometers of the shore. This means thatabout 3.4 billion people rely heavily on marine habitats and resources for food. IUCN World Commission onProtected Areas (WCPA) considers that perhaps as many as two-thirds of all marine species have yet to be cat-alogued, establishing representative protected spaces seems essential. Considerable efforts are also being direct-ed worldwide to establishing marine protected areas (MPAs). Studies such as identification of breeding groundsof the mature females, studies on the breeding habitat ecology, studies on the larval nutrition, ecological param-eters which keep the plankton abundance and diversity for the fish larvae to feed, mapping of the sea bottometc has to be undertaken to understand this region in its full aspect. These would pave way for conservation ofthe biodiversity of fishes in the kannyakumari and Trivandrum region of the southern tip of peninsular Indiaand would make way for making it a Marine Protected Area/Hot Spot for fish eggs and larvae.
Facilitating conservation and sustainable use of biological diversity. Abstracts of poster presentations on protected areas and technology transfer and cooperation at the ninth meeting of the Subsidiary Body on Scientific, Technical and Technological Advice.
20
5
007419 CDG Interieur_no9 11/3/03 6:12 PM Page 20
21
Protected Areas
6CONSERVATION OF BIODIVERSITY IN THE PROTECTED AREA NETWORK OF IRAN
Asghar M. Fazel*NBSAP National Project Manager Environmental Research CenterPardisan Eco-Park – Hemmat Highway - Tehran - I.R.Iran Tel: (+98-21) 882 4513 - Fax: (+98-21) 883 1297 E-mail: [email protected] – URL: www.environment.ir Mahboobe TohidiBiodiversity Project OfficerNBSAP Secretariat - National Museum of Natural History No.9 - Gha’em Magham Ave. - Tehran 15899 - I.R.Iran Tel: (+98-21) 884 3498-9 - Fax: (+98-21) 883 1297 E-mail: [email protected] – URL: www.biodiversity.ir
Keywords: biodiversity, conservation, protected area, Iran
Geographical and Land Characteristics
The Islamic Republic of Iran comprises a land area of 1.64 million km2. It lies in the northern part of the tem-perate zone, between latitudes 25o 03’ and 39o 47’ north and longitudes 44o 14’ and 63o 20’ east. The averagealtitude is over 1200 m. Iran is bordered by Turkmenistan, the Caspian Sea (over 900 km of coastline),Azerbaijan, and Armenia in the north, Afghanistan and Pakistan in the east, the Persian Gulf and the Sea ofOman in the south, and Iraq and Turkey in the west.
Iran has a varied but generally harsh climate - arid with large temperature fluctuations. Many species andvarieties are adapted to surviving in these harsh conditions (Graph 1).
The Iranian habitat supports over 8,000 recorded species of plants (of which almost 2,500 are endemic), over500 species of birds, 160 mammals, 164 reptiles (26 endemic species), and 375 species of butterflies. A largenumber of the plant and animal species indigenous to Iran are the wild relatives of commercial species, con-firming Iran’s status as a center of genetic biodiversity. Also, a large number of Iran’s plant and tree specieshave traditional medicinal, aromatic and pigment uses.
The National Protected Area System
The protected areas and reserve systems provide the core areas for biodiversity conservation. This reserve sys-tem is not sufficient in itself for long-term conservation, and must be harmonized with conservation effortsin other areas and land-uses. In Iran, areas protected by the Department of Environment (DoE) cover almost12 million hectares that covering over 8% of the national land area (Map 1).
In order to preserve domestic biodiversity throughout the vast territory of Iran, the DoE-managed areas havebeen classified as: “National Parks,” “Wildlife Refuges,” “Protected Areas” and “National Natural Monuments”.
In addition, until now there are more than 100 non-hunting areas under management of the Department ofEnvironment, with a total area of more than 5 million hectares. Iran participates in the UNESCO Man and theBiosphere Programme, and designated 9 Biosphere Reserves covering a total area of 1.9 million hectares. Alsothere are 21 Ramsar Sites and several Important Bird Wintering Areas in the country. Four of these BiosphereReserves (Arjan, Hara, Uromieh and Miankaleh) contain internationally important wetlands. The Departmentof Environment’s goal is to increase this proportion to 10% of the national land area. It is a priority to makethis network Comprehensive, Adequate and Representative (CAR).
007419 CDG Interieur_no9 11/3/03 6:12 PM Page 21
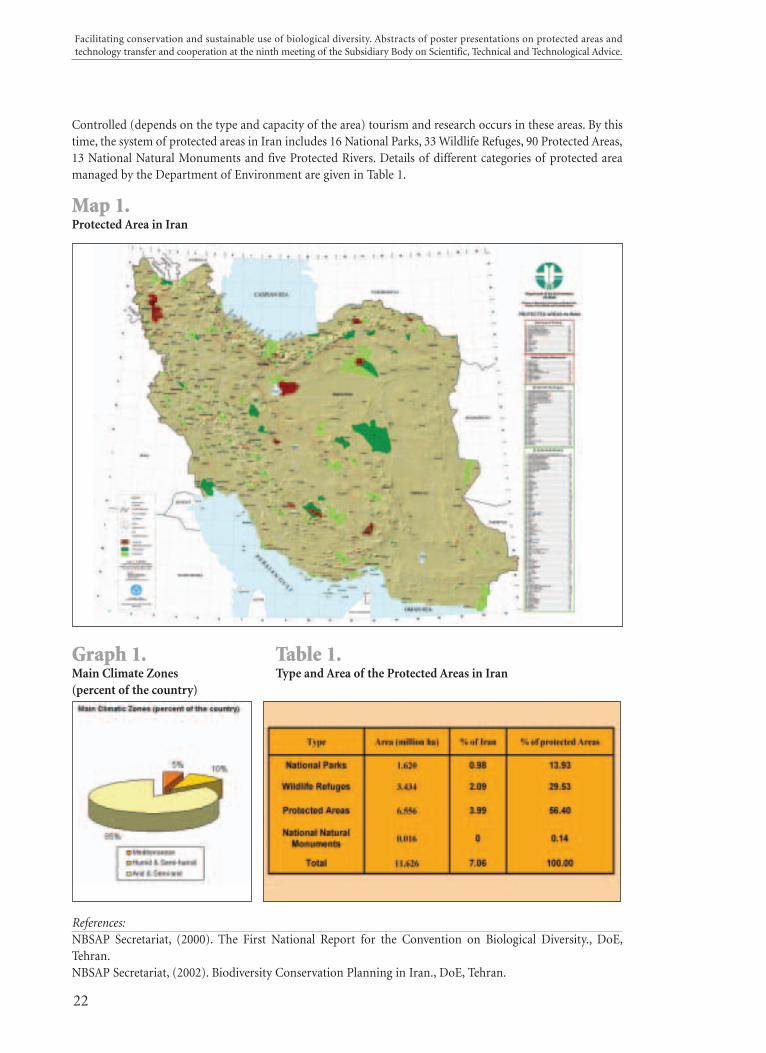
Controlled (depends on the type and capacity of the area) tourism and research occurs in these areas. By thistime, the system of protected areas in Iran includes 16 National Parks, 33 Wildlife Refuges, 90 Protected Areas,13 National Natural Monuments and five Protected Rivers. Details of different categories of protected areamanaged by the Department of Environment are given in Table 1.
Map 1.Protected Area in Iran
Graph 1. Table 1.Main Climate Zones Type and Area of the Protected Areas in Iran(percent of the country)
References:NBSAP Secretariat, (2000). The First National Report for the Convention on Biological Diversity., DoE,Tehran.NBSAP Secretariat, (2002). Biodiversity Conservation Planning in Iran., DoE, Tehran.
Facilitating conservation and sustainable use of biological diversity. Abstracts of poster presentations on protected areas and technology transfer and cooperation at the ninth meeting of the Subsidiary Body on Scientific, Technical and Technological Advice.
22
007419 CDG Interieur_no9 11/3/03 6:12 PM Page 22
CORRIDOR DEVELOPMENT FOR BIODIVERSITY LANDSCAPE CONSERVATION
Eklabya Sharma, Nakul ChettriNatural Resource Management ProgrammeInternational Center for Integrated Mountain DevelopmentG.P.O. Box 3226Kathmandu, Nepal.
Keywords: transboundary, participatory, protected-areas, corridors, conservation
Kanchenjunga Conservation Landscape
The landscape surrounding Mount Kanchenjunga spreads over a wide spectrum of ecological zones in east-ern Nepal, Darjeeling and Sikkim Himalaya (India) and western Bhutan. It has nine important protected areascovering about 10,000 sq km. The area is considered as part of one of the 25 Biodiversity Hotspots of the world(Myers, 2000). It has a unique situation where within 100 km N-S stretch covers tropical to alpine vegetation.Considering the importance of the landscape, biodiversity conservation has been made as top priority in thenational agendas for Nepal, India and Bhutan. India has brought the Kanchenjunga area under a protectedarea network by managing it as Kanchenjunga Biosphere Reserve and other five wildlife Sanctuaries in Sikkim;Singhalila National Park, Senchel Wildlife Sanctuary, Mahananda Wildlife Sanctuary and Neora ValleyNational Park in Darjeeling; Kanchenjunga Conservation Area in Nepal and Toorsa Strict Nature Reserve, andJigme Dorji National Park in western Bhutan. The area has contiguity on the habitat of many umbrella speciessuch as Snow Leopard, Takin, Tigers and Elephants which otherwise are restricted in the individual existingprotected areas. It is among one of the 169 complexes of two or more adjoining protected areas that are divid-ed by international boundaries (Sandwith et. al., 2001). Therefore, transboundary cooperation helps countriesto meet their obligations under international agreements such as the Convention on Migratory Species andthe Convention on Biological Diversity (Shengji and Sharma, 1998).
Despite of the ecological importance of the landscape, they have been subjected to great stress and continueto face multiple threats (Brooks et al., 2002). Connecting these PAs with corridors has important role on bothvertical (altitudinal) and horizontal coverage for conservation in this important landscape. To address thiscritical issue, ICIMOD with its past experience from Mt Everest Ecosystem (see Sherpa et al, 2003) has initi-ated the work on developing corridors between the existing PAs in southern half of the Kanchenjunga land-scape.
Project goals and processes
Sustainable participatory conservation of globally significant biodiversity area by developing strategies, plansand linkages to establish corridors between protected areas in southern half of Kanchenjunga landscape.
Activities to be carried out
Identification of potential corridors Identified corridors of legitimate biodiversity links between protected areas in mountainous terrains of theKanchenjunga landscape covering parts of Nepal, India and Bhutan through participatory processes involvingall tiers of stakeholders.
23
Protected Areas
7
007419 CDG Interieur_no9 11/3/03 6:12 PM Page 23
Landscape elements and tenures Information on different landscape elements and tenures such as protected areas, community forests, naturalforests; agroforestry, rangelands, agricultural lands and tea-gardens are generated for each of the identifiedcorridors.
Develop participatory strategy and action plans Strategies and action plans for effective conservation of biodiversity in the identified corridors and options forsocio-economic development of the people living therein are identified.
Policy analysis in transboundary issuesIssues and recommendations on local and transboundary policy that could facilitate effective transboundarycooperation on participatory biodiversity conservation to be provided to each of the member countries.
Capacity building Capacity of the local communities and organizations on optional micro-enterprises developed through train-ings, demonstrations and exposure visits.
Information sharing to member countries The information generated through the processes shared among the developmental agencies, conservationorganizations and policy makers through consultative workshops in local, national and regional levels.
Develop participatory corridor plan A comprehensive landscape level corridor development plan will be prepared and facilitate communities andlocal development agencies to bring the action plans into implementation.
Expected outcomes
Transboundary biodiversity conservation landscape development through capacity building and corridormanagement plans and mutual trust among Nepal, India and Bhutan.
ReferencesBrooks, T. M; Mittermeier, R.A.; Mittermeier, C.G.; da Fonseca, G.A.B.; Rylands, A.B.; Konstant, W.R.; Flick,P.; Pilgrim, J.; Oldfield, S.; Magin, G. and Hilton-Taylor, C. (2002) Habitat Lost and Extinction in the Hotspotsof Biodiversity. Conservation Biology. 16(4): 909-923.Myers, N., Mittermiler, R.A., Mittermiler, C.G., Gustava A.B. da Foseca and Kent J. (2000). Biodiversityhotspots for conservation priorities. Nature 403(24): 853-858.Sandwith, T., Shine, C., Hamilton, L. and Sheppard, D. (2001). Transboundary Protected Areas for Peace andCooperation. IUCN, Gland, Switzerland and Cambridge, UK.Shengji, P. and Sharma, U. R. (1998). Transboundary Biodiversity Conservation in the Himalayas. InEcoregional Cooperation for Biodiversity Conservation in the Himalayas. United Nations DevelopmentProgramme, New York, USA.Sherpa, L.N., Peniston, B., Lama, W. and Richard, C. (2003). Hands Around Everest: Transboundary Cooperationfor Conservation and Sustainable Livelihoods. International Centre for Integrated Mountain Development,Kathmandu, Nepal.
Facilitating conservation and sustainable use of biological diversity. Abstracts of poster presentations on protected areas and technology transfer and cooperation at the ninth meeting of the Subsidiary Body on Scientific, Technical and Technological Advice.
24
007419 CDG Interieur_no9 11/3/03 6:12 PM Page 24
ECOSYSTEMS AND HUMAN WELL-BEING: A FRAMEWORK FOR ASSESSMENT
*Nicolas LucasMillennium Ecosystem AssessmentWorld Resources Institute, 10 G Street, NE, Washington, DC 20002, USA
Keywords: ecosystems, well-being, assessment, framework, scale
Ecosystems and Human Well-being: A Framework for Assessment is the first product of the MillenniumEcosystem Assessment (MA), a four-year international work program designed to meet the needs of decision-makers for scientific information on the links between ecosystem change and human well-being. It waslaunched by United Nations Secretary-General Kofi Annan in June 2001, and the principal assessment reportswill be released in 2005.
The MA focuses on ecosystem services (the benefits people obtain from ecosystems), how changes in ecosys-tem services have affected human well-being, how ecosystem changes may affect people in future decades, andresponse options that might be adopted at local, national, or global scales to improve ecosystem managementand thereby contribute to human well-being and poverty alleviation. The specific issues being addressed bythe assessment have been defined through consultation with the MA users.
The MA will:• Identify priorities for action;• Provide tools for planning and management;• Provide foresight concerning the consequences of decisions affecting ecosystems;• Identify response options to achieve human development and sustainability goals; and• Help build individual and institutional capacity to undertake integrated ecosystem assessments and to act
on their findings.
The MA synthesizes information from the scientific literature, datasets, and scientific models, and makes useof knowledge held by the private sector, practitioners, local communities and indigenous peoples. All of theMA findings undergo rigorous peer review. The MA is governed by a Board comprised of representatives ofinternational conventions, UN agencies, scientific organizations and leaders from the private sector, civil soci-ety, and indigenous organizations. A 13-member Assessment Panel of leading social and natural scientistsoversees the technical work of the assessment supported by a secretariat with offices in Europe, NorthAmerica, Asia, and Africa and coordinated by the United Nations Environment Programme. More than 500authors are involved in four expert working groups preparing the global assessment and hundreds more areundertaking more than a dozen sub-global assessments.
The first report of the Millennium Ecosystem Assessment describes the conceptual framework that is beingused in the MA. It is not a formal assessment of the literature, but rather a scientifically informed presenta-tion of the choices made by the assessment team in structuring the analysis and framing the issues. The con-ceptual framework elaborated in this report describes the approach and assumptions that will underlie theanalysis conducted in the Millennium Ecosystem Assessment. The framework was developed through inter-actions among the experts involved in the MA as well as stakeholders who will use its findings. It representsone means of examining the linkages between ecosystems and human well-being that is both scientificallycredible and relevant to decision-makers. This framework for analysis and decision-making should be of useto a wide array of individuals and institutions in government, the private sector, and civil society that seek toincorporate considerations of ecosystem services in their assessments, plans, and actions.
The conceptual framework for the MA places human well-being as the central focus for assessment, while rec-
25
Protected Areas
8
007419 CDG Interieur_no9 11/3/03 6:12 PM Page 25
ognizing that biodiversity and ecosystems also have intrinsic value and that people take decisions concerningecosystems based on considerations of well-being as well as intrinsic value (See Figure 1.).
The assessment framework developed for the MA offers decision-makers a mechanism to:
• Identify options that can better achieve core human development and sustainability goals.• Better understand the trade-offs involved—across sectors and stakeholders—in decisions concerning
the environment.• Align response options with the level of governance where they can be most effective.
With its focus on ecosystem services and human well-being, the MA framework can be useful for decision-mak-ers faced with choices concerning protected areas, and can help countries to assert the important contributionsof their protected areas to global agenda on sustainable development. As the recent Vth World Parks Congressin Durban affirmed, protected areas can not be isolated from their surroundings or from the economic activi-ties in and around them. The MA framework provides the mechanisms needed to assess exiting conservationand management strategies for protected areas, and can provide information needed for the design of newplans. The conceptual framework also serves as a useful tool to help identify new areas for protection based oninformation that it will provide about biodiversity, habitats and ecological processes across multiple scales.
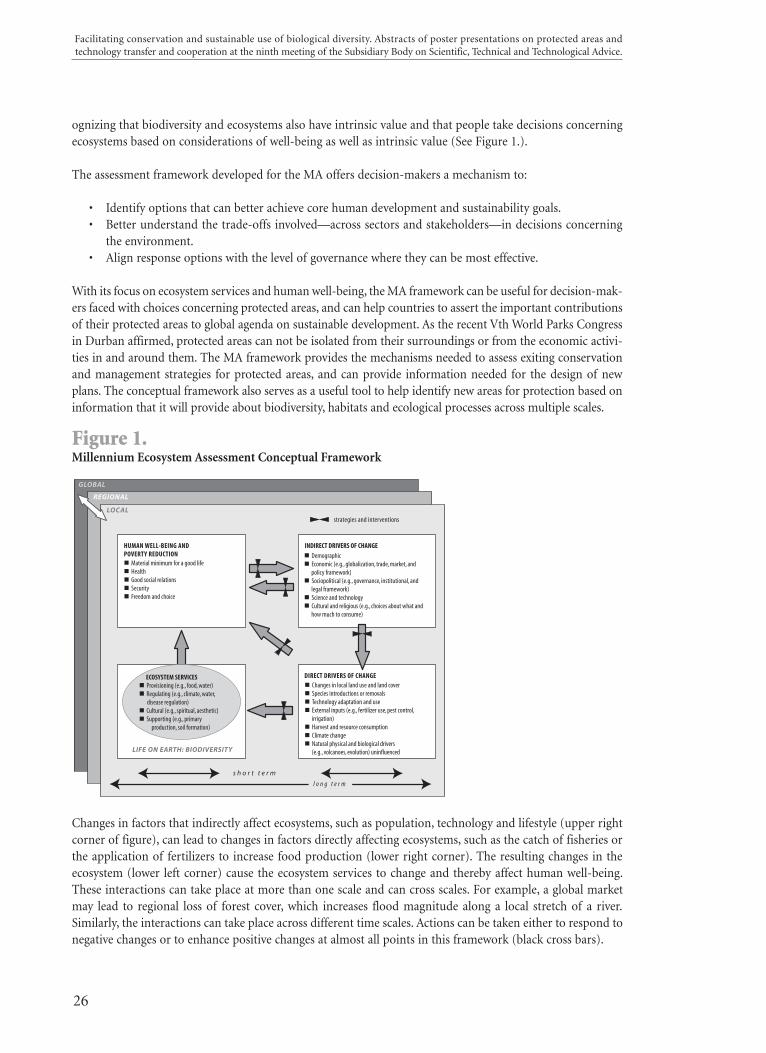
Figure 1.Millennium Ecosystem Assessment Conceptual Framework
Changes in factors that indirectly affect ecosystems, such as population, technology and lifestyle (upper rightcorner of figure), can lead to changes in factors directly affecting ecosystems, such as the catch of fisheries orthe application of fertilizers to increase food production (lower right corner). The resulting changes in theecosystem (lower left corner) cause the ecosystem services to change and thereby affect human well-being.These interactions can take place at more than one scale and can cross scales. For example, a global marketmay lead to regional loss of forest cover, which increases flood magnitude along a local stretch of a river.Similarly, the interactions can take place across different time scales. Actions can be taken either to respond tonegative changes or to enhance positive changes at almost all points in this framework (black cross bars).
Facilitating conservation and sustainable use of biological diversity. Abstracts of poster presentations on protected areas and technology transfer and cooperation at the ninth meeting of the Subsidiary Body on Scientific, Technical and Technological Advice.
26
007419 CDG Interieur_no9 11/3/03 6:12 PM Page 26
EVALUATING THE POWER OF TIME OF SERIES OF LINE TRANSECT SURVEYS TO DETECT CHANGE IN POPULATION OF DORCAS GAZELLE(GAZELLA DORCAS) IN SOUTH SINAI EGYPT
Husam El Alqamy1*, John Harwood2
1St. Katherine Protectorate, Nature Conservation Sector, Egyptian Environmental Affairs Agency,South Sinai, Egypt. [email protected] Mammals Research Unit, School of Biology, University of St. Andrews, Scotland, UK.
Keywords: dorcas gazelle, population trend, statistical power
Introduction
Population of dorcas gazelle (Gazella dorcas) has suffered a decline in numbers and shrinkage of range anddistribution all over Egypt through the 80s and the early 90s (Saleh, 1987). Current efforts of conserving thespecies in its Egyptian range involved many procedures including protecting the species by law, and declaringprotected areas where the species is known still to occur (ex, Wadie El Rayan 1988, Gabal Elba Protected Area1982, Nabaq Protected area 1996, St. Katherine Protectorate 1996 and Siwa Protected area declared in 2002).A systematic survey with annual estimates of gazelle population was put in place to monitor the gazelle pop-ulation in south Sinai using line transects since 1999. The current work utilizes these data sets to assess thepower of this program to detect change (increase or decrease) of this population.
Methods
In general, for any statistical test, power is a function of sample size (n), the probability of Type I error �, andthe magnitude of the difference between the null hypothesis and reality (the effects size) (Cohen 1988). Inpopulation studies, the effect to be measured is often the change in population size (r), which may be nega-tive or positive. In ecological studies, population size cannot be measured precisely, and a practical power cal-culation must account for the amount of uncertainty in estimating abundance. This uncertainty is quantifiedby the coefficient of variation (CV).
For the purpose of calculating power in population and abundance studies Gerrodette (1987) formulated sixequations that define the relationship between r, n, �, CV and power. These equations can be used to calculatethe value of any one of these parameters if the other four are known. However, certain assumptions must befulfilled. It should be known whether the trend under consideration is linear or exponential to choose the rightfamily of equations. In addition, the trend should be uniform over the whole study period. Using these equa-tions several vital questions about the design of field study programme (such as how many samples arerequired? how precise should they be?) can be answered. A more frequently asked question is how preciselycan a certain trend be detected by a particular programme?
Link and Hatfield (1990) suggested that the t-distribution rather than the z-distribution should be used as theunderlying model for estimating the power of the linear regression to detect a trend in population size. Theyshowed that assuming the variance of the abundance estimate is normally distributed may cause overestima-tion of the power, especially for small sample size (n<20). They suggested that the t-distribution providesmore appropriate values for the 97.5th percentile to be used in estimating. When =0.05, the t-distributionyields 97.5th percentiles of 3.182, 2.306 and 2.101 for n = 5,10 and 20 respectively, whereas the equivalentvalue for the z-distribution is 1.96 for all values of n. Also, the t-distribution is more correct, because it pro-vides a better approximation of the distribution of the test statistic under the alternative hypothesis and it doesnot involve the assumption that the variance is known, which the z distribution does.
27
Protected Areas
9
007419 CDG Interieur_no9 11/3/03 6:12 PM Page 27
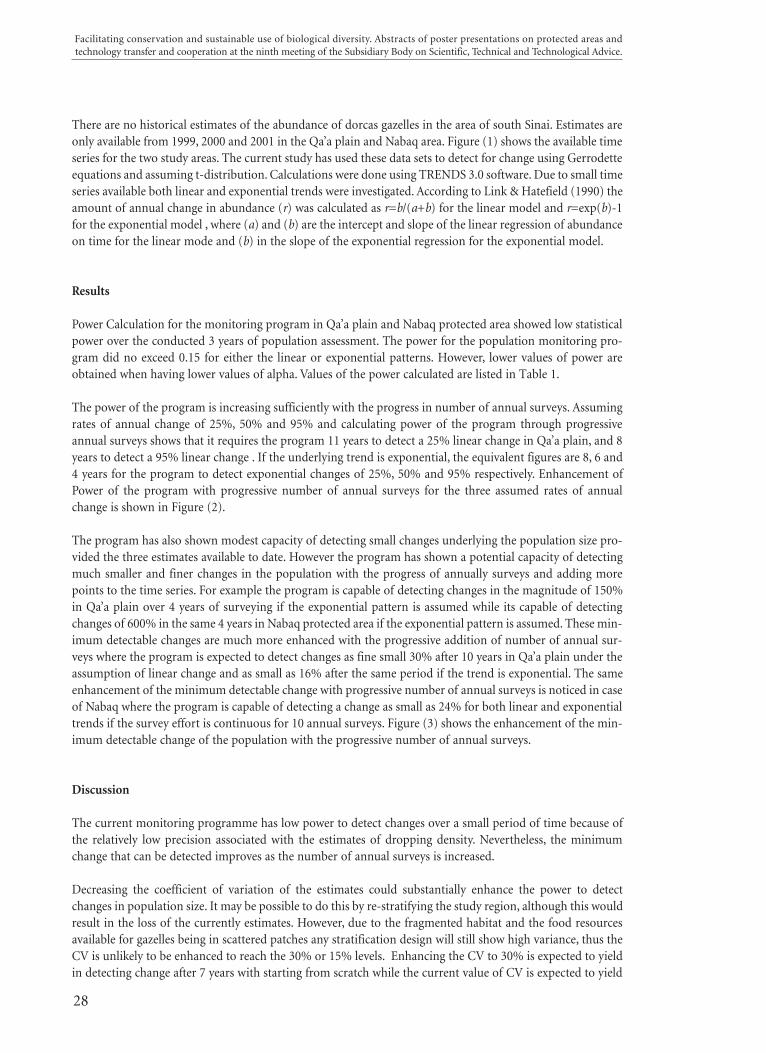
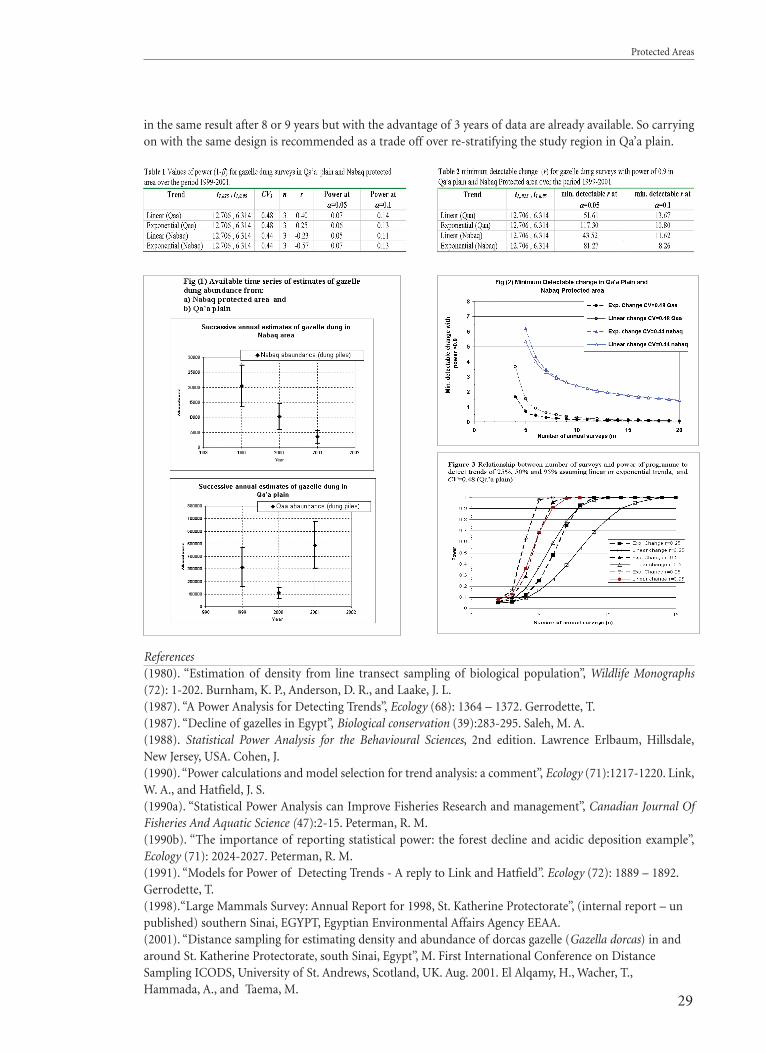
There are no historical estimates of the abundance of dorcas gazelles in the area of south Sinai. Estimates areonly available from 1999, 2000 and 2001 in the Qa’a plain and Nabaq area. Figure (1) shows the available timeseries for the two study areas. The current study has used these data sets to detect for change using Gerrodetteequations and assuming t-distribution. Calculations were done using TRENDS 3.0 software. Due to small timeseries available both linear and exponential trends were investigated. According to Link & Hatefield (1990) theamount of annual change in abundance (r) was calculated as r=b/(a+b) for the linear model and r=exp(b)-1for the exponential model , where (a) and (b) are the intercept and slope of the linear regression of abundanceon time for the linear mode and (b) in the slope of the exponential regression for the exponential model.
Results
Power Calculation for the monitoring program in Qa’a plain and Nabaq protected area showed low statisticalpower over the conducted 3 years of population assessment. The power for the population monitoring pro-gram did no exceed 0.15 for either the linear or exponential patterns. However, lower values of power areobtained when having lower values of alpha. Values of the power calculated are listed in Table 1.
The power of the program is increasing sufficiently with the progress in number of annual surveys. Assumingrates of annual change of 25%, 50% and 95% and calculating power of the program through progressiveannual surveys shows that it requires the program 11 years to detect a 25% linear change in Qa’a plain, and 8years to detect a 95% linear change . If the underlying trend is exponential, the equivalent figures are 8, 6 and4 years for the program to detect exponential changes of 25%, 50% and 95% respectively. Enhancement ofPower of the program with progressive number of annual surveys for the three assumed rates of annualchange is shown in Figure (2).
The program has also shown modest capacity of detecting small changes underlying the population size pro-vided the three estimates available to date. However the program has shown a potential capacity of detectingmuch smaller and finer changes in the population with the progress of annually surveys and adding morepoints to the time series. For example the program is capable of detecting changes in the magnitude of 150%in Qa’a plain over 4 years of surveying if the exponential pattern is assumed while its capable of detectingchanges of 600% in the same 4 years in Nabaq protected area if the exponential pattern is assumed. These min-imum detectable changes are much more enhanced with the progressive addition of number of annual sur-veys where the program is expected to detect changes as fine small 30% after 10 years in Qa’a plain under theassumption of linear change and as small as 16% after the same period if the trend is exponential. The sameenhancement of the minimum detectable change with progressive number of annual surveys is noticed in caseof Nabaq where the program is capable of detecting a change as small as 24% for both linear and exponentialtrends if the survey effort is continuous for 10 annual surveys. Figure (3) shows the enhancement of the min-imum detectable change of the population with the progressive number of annual surveys.
Discussion
The current monitoring programme has low power to detect changes over a small period of time because ofthe relatively low precision associated with the estimates of dropping density. Nevertheless, the minimumchange that can be detected improves as the number of annual surveys is increased.
Decreasing the coefficient of variation of the estimates could substantially enhance the power to detectchanges in population size. It may be possible to do this by re-stratifying the study region, although this wouldresult in the loss of the currently estimates. However, due to the fragmented habitat and the food resourcesavailable for gazelles being in scattered patches any stratification design will still show high variance, thus theCV is unlikely to be enhanced to reach the 30% or 15% levels. Enhancing the CV to 30% is expected to yieldin detecting change after 7 years with starting from scratch while the current value of CV is expected to yield
Facilitating conservation and sustainable use of biological diversity. Abstracts of poster presentations on protected areas and technology transfer and cooperation at the ninth meeting of the Subsidiary Body on Scientific, Technical and Technological Advice.
28
007419 CDG Interieur_no9 11/3/03 6:12 PM Page 28
in the same result after 8 or 9 years but with the advantage of 3 years of data are already available. So carryingon with the same design is recommended as a trade off over re-stratifying the study region in Qa’a plain.
References(1980). “Estimation of density from line transect sampling of biological population”, Wildlife Monographs(72): 1-202. Burnham, K. P., Anderson, D. R., and Laake, J. L.(1987). “A Power Analysis for Detecting Trends”, Ecology (68): 1364 – 1372. Gerrodette, T.(1987). “Decline of gazelles in Egypt”, Biological conservation (39):283-295. Saleh, M. A.(1988). Statistical Power Analysis for the Behavioural Sciences, 2nd edition. Lawrence Erlbaum, Hillsdale,New Jersey, USA. Cohen, J.(1990). “Power calculations and model selection for trend analysis: a comment”, Ecology (71):1217-1220. Link,W. A., and Hatfield, J. S.(1990a). “Statistical Power Analysis can Improve Fisheries Research and management”, Canadian Journal OfFisheries And Aquatic Science (47):2-15. Peterman, R. M.(1990b). “The importance of reporting statistical power: the forest decline and acidic deposition example”,Ecology (71): 2024-2027. Peterman, R. M.(1991). “Models for Power of Detecting Trends - A reply to Link and Hatfield”. Ecology (72): 1889 – 1892.Gerrodette, T.(1998).“Large Mammals Survey: Annual Report for 1998, St. Katherine Protectorate”, (internal report – unpublished) southern Sinai, EGYPT, Egyptian Environmental Affairs Agency EEAA.(2001). “Distance sampling for estimating density and abundance of dorcas gazelle (Gazella dorcas) in andaround St. Katherine Protectorate, south Sinai, Egypt”, M. First International Conference on DistanceSampling ICODS, University of St. Andrews, Scotland, UK. Aug. 2001. El Alqamy, H., Wacher, T.,Hammada, A., and Taema, M.
29
Protected Areas
007419 CDG Interieur_no9 11/3/03 10:50 PM Page 29
FACTORS THAT INFLUENCE THE MANAGEMENT OF PROTECTED FORESTSUMACO, CANTON LORETO - ECUADOR
Alvaro Cañadas*1, Oleg Nenadic2
1 Georg August Universität Göttingen, Institute of Forest Management, Büsgenweg 5, 37077 Göttingen,Germany. [email protected] Georg August Universität Göttingen, Institut für Statistik und Ökonometrie, Platz der Göttinger Sieben 5,37073 Göttingen.
Keywords: correspondence analysis, demographic structure, dynamic of land use, land tenure, Ecuador
Introduction
Forest resources share attributes with many other resource systems that aggravate their governance and man-agement in a sustainable, efficient and equitable manner (ORSTROM, 1999). Destruction or degradation offorest resources is most likely to occur in open access forests where effective governance has not been estab-lished. Nevertheless, state property is generally the tenure from that is most severely exposed to degradationand, if the land can be claimed for property, to deforestation, sometimes regardless of any formal protectionstatus it may have. State enforcement of forest tenure and access rules tend to be less efficient and more cost-ly (LEACH and MEARNS, 1988). This research is trying to determinate, what factors have an influence on therelative efficiency of the management of Protected Forest in the canton Loreto – Ecuador.
Materials and Methods
A map of the Instituto Nacional de Desarrollo Agropecuario INDA 1995 at scale 1:100,000 was digitalized usingthe program ARC/INFO for the analysis of the tenancy of the different areas in the Protected Forest Sumaco.The satellite image LANDSAT of CLIRSEN dated October 1995 and September 1997 was used to determinatethe dynamic of the land use in the Protected Forest Sumaco. Correspondence analysis was applied to deter-minate the development of the dynamic of land use. The census was realized to obtain demographic struc-tures of the community 10 de Agosto by groups of ages and sex in 2000 (CAÑADAS, 2001).
Results and Discussion
Land tenure of the Protected Forest SumacoIn spite of the limitations of the land use within the Protected Forest anticipated in the law (M.A., 1999), theProtected Forest Sumaco was divided into communities. The organization of the communities consist ofSocios (Partners). The title to this land is held communally, but the usufruct is individually allocated. It is nec-essary to point out that landholding in the Protected Forest Sumaco is characterized by different levels of landaccess: The Socios, who have land, voice and vote in the community; candidates, who are usually children ofthe Socios who try to gain access to the land reserve of the community; and the individuals that are familieswho live in the community but are not members of it, and therefore they do not have any right on territories.This structure has imposed a class – structure – with radical access to land and institutional resources.
The effective distribution of the land is represented by an accumulated curve showing the percentage of thearea of the Protected Forest that is received by the Socios of the communities, according to the surface of theircommunities within the protected forest (Lorenz curve). In Figure 1 it is shown that more than 50% of thepartners of the communities have received less than 22% of the area of the protected forest. The coefficient ofGINI was calculated with a value 0.6. This fact shows a clear inequality with reference to the distribution ofland in the Protected Forest Sumaco.
Facilitating conservation and sustainable use of biological diversity. Abstracts of poster presentations on protected areas and technology transfer and cooperation at the ninth meeting of the Subsidiary Body on Scientific, Technical and Technological Advice.
30
10
007419 CDG Interieur_no9 11/3/03 6:12 PM Page 30
Demographic structures of the community 10 de Agosto in the buffer zone of the National Park SumacoThe combined effect of population growth and the gradual impoverishment have exerted pressure on thestructures of possession of land. An example is found in the community of 10 de Agosto as well as in othercommunities with land distribution problems.
According to the data obtained in 1996 by GARCES and WRAY (1997), 565 persons represented the total pop-ulation in the community 10 de Agosto. In 2001 the registered number of inhabitants living in the communi-ty was 683 (CAÑADAS, 2001). The distribution of this population by age and sex is shown in Figure 2. TheKichwa community 10 de Agosto does not have land reserves and cannot solve the access necessities to the landfor the future generation between 1-15 years old, which represents more than 49% of the inhabitants. Thealternative for the young groups is to invade lands of other communities, which is knows for the case of com-munity Alto Chacayacu and/or of the National Park Sumaco Napo - Galeras.
The annual growth rate in the community 10 de Agosto was 4.8%. This rate can be compared to the numberspresented by RIVADENEIRA (1997) with an annual growth of 5.8% and THAPA et. al. (1996) with 6.7%. Itis necessary to establish a relation between the surface of the territory and the population in order to deter-mine the possible pressure of the population for natural resources. The number of the population was cal-culated using the formula of compound interest:
The results of this pro-jection are summarized in Table 1. The gradual decrease of land disposition was obtained and is presumed tobe 5 ha per inhabitant in 2004. As rule of thumb, Myers 1980, (cited in WCMC 1992) suggests a populationdensity of 5 inhabitants per km2 of tropical moist forest as the upper limit for a sustainable shifting cultiva-tion system. The obtained results show that the inhabitants exert pressure on the natural resources of the com-munity. It has a direct relation to the loss of biodiversity and genetic erosion. But on the other hand, oneimportant aspect, which calls the attention of ethnologists, namely a type of migration. It characterizes theKichwas nations, which leave their towns of origin, and go further into the forest (MOYA 1997).
Development of the dynamic land use of the communities of Protected Forest SumacoThe result of correspondence analysis which illustrate the different endowments in the canton Loreto aredepicted in Figure 3 and 4. This explains the stimulation of inter regional trade and production specializationaccording to a region´s comparative advantage. First, the weather condition improves the production ofnaranjilla (Solanum quitoense). Secondly, livestock production clearly proves to be the best return. During thatperiod prices rose relatively more and remained more stable. Thirdly, cheap coffee production through fullproletarianization of family work and the increase of coffee prices. Furthermore, it has a great developmentpotential and provides a powerful reason for forest loss.
Conclusions
The GINI coefficient 0.6 shows a clear inequality with reference to the distribution of land in the ProtectedForest Sumaco. An annual growth rate of 4.8% with a typical pyramid about 49% between 1–15 years old isgeneralized in the Amazon region of Ecuador. Under these conditions the forest resources are polarized. Somecommunities like 10 de Agosto without any land reserves have too scarce and deteriorated resources. The onlyalternative for young people is to invade lands from other communities or from the National Park, which isleft to open access. The complete inexistence of management plans in order to legalize its position of the landand a lack of participation directly influences the scarce degree of autonomy and organizational experience.The actual law is only generating a strong opposition from the settled population in the Protected ForestSumaco, since it has not shown any practical benefits for Sumaco so far. This fact has a negative influence onthe common understanding and trust between communities and the Ministry of Environment. Finally, thedynamic and growing society cannot be expected to live with static land use patterns.
31
Protected Areas
QX
Q=0
(1+ i) , where QX
= Population in the year x ,n
Q0
= Population Base, i = Rate of Population Growth and n = Projection a year n.
007419 CDG Interieur_no9 11/3/03 6:12 PM Page 31
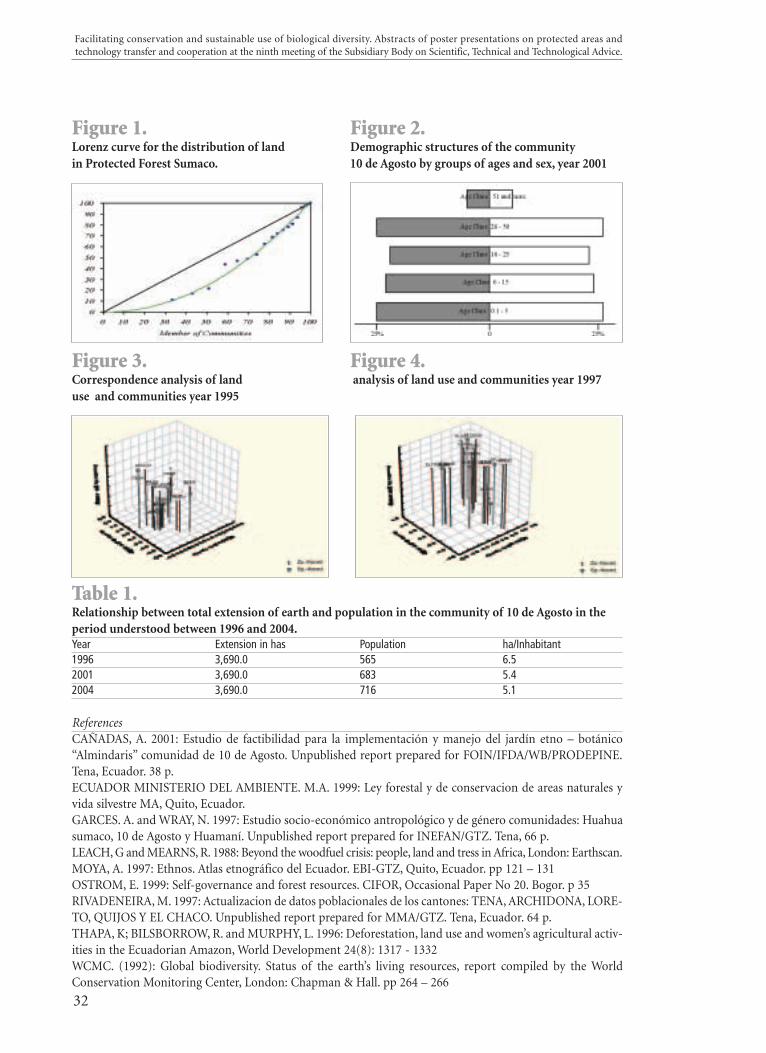
Figure 1. Figure 2.Lorenz curve for the distribution of land Demographic structures of the community in Protected Forest Sumaco. 10 de Agosto by groups of ages and sex, year 2001
Figure 3. Figure 4.Correspondence analysis of land analysis of land use and communities year 1997use and communities year 1995
Table 1.Relationship between total extension of earth and population in the community of 10 de Agosto in theperiod understood between 1996 and 2004.Year Extension in has Population ha/Inhabitant1996 3,690.0 565 6.52001 3,690.0 683 5.42004 3,690.0 716 5.1
ReferencesCAÑADAS, A. 2001: Estudio de factibilidad para la implementación y manejo del jardín etno – botánico“Almindaris” comunidad de 10 de Agosto. Unpublished report prepared for FOIN/IFDA/WB/PRODEPINE.Tena, Ecuador. 38 p.ECUADOR MINISTERIO DEL AMBIENTE. M.A. 1999: Ley forestal y de conservacion de areas naturales yvida silvestre MA, Quito, Ecuador.GARCES. A. and WRAY, N. 1997: Estudio socio-económico antropológico y de género comunidades: Huahuasumaco, 10 de Agosto y Huamaní. Unpublished report prepared for INEFAN/GTZ. Tena, 66 p.LEACH, G and MEARNS, R. 1988: Beyond the woodfuel crisis: people, land and tress in Africa, London: Earthscan.MOYA, A. 1997: Ethnos. Atlas etnográfico del Ecuador. EBI-GTZ, Quito, Ecuador. pp 121 – 131OSTROM, E. 1999: Self-governance and forest resources. CIFOR, Occasional Paper No 20. Bogor. p 35RIVADENEIRA, M. 1997: Actualizacion de datos poblacionales de los cantones: TENA, ARCHIDONA, LORE-TO, QUIJOS Y EL CHACO. Unpublished report prepared for MMA/GTZ. Tena, Ecuador. 64 p.THAPA, K; BILSBORROW, R. and MURPHY, L. 1996: Deforestation, land use and women’s agricultural activ-ities in the Ecuadorian Amazon, World Development 24(8): 1317 - 1332WCMC. (1992): Global biodiversity. Status of the earth’s living resources, report compiled by the WorldConservation Monitoring Center, London: Chapman & Hall. pp 264 – 266
Facilitating conservation and sustainable use of biological diversity. Abstracts of poster presentations on protected areas and technology transfer and cooperation at the ninth meeting of the Subsidiary Body on Scientific, Technical and Technological Advice.
32
007419 CDG Interieur_no9 11/3/03 6:12 PM Page 32
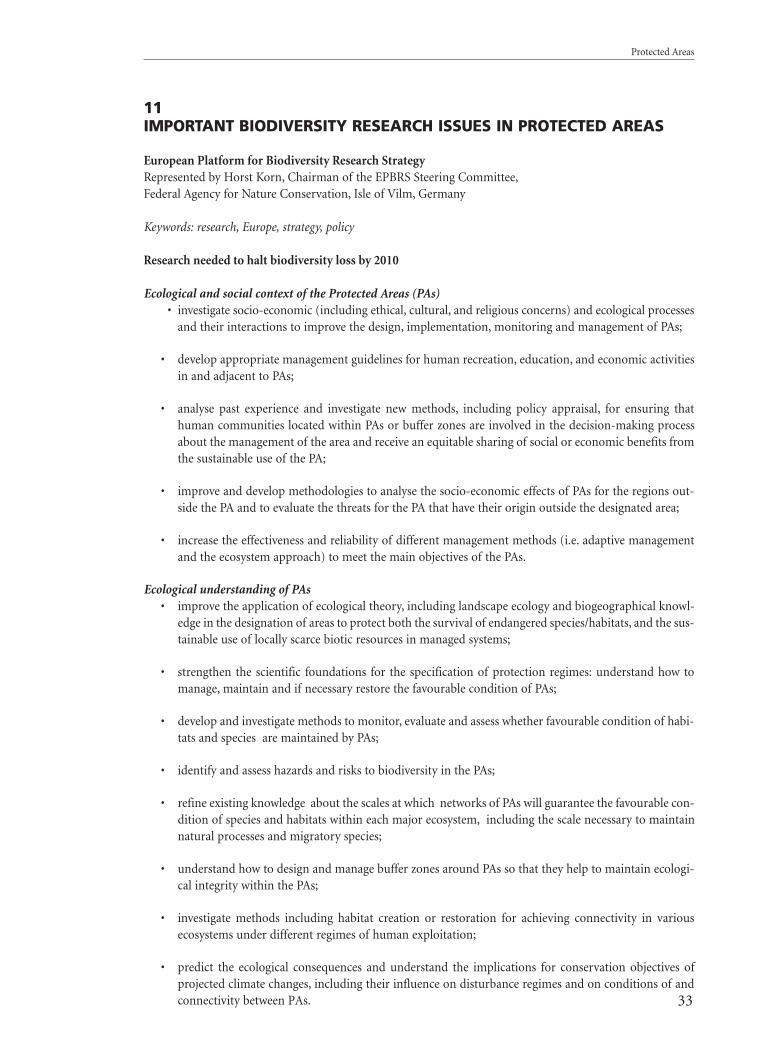
33
Protected Areas
IMPORTANT BIODIVERSITY RESEARCH ISSUES IN PROTECTED AREAS
European Platform for Biodiversity Research StrategyRepresented by Horst Korn, Chairman of the EPBRS Steering Committee,Federal Agency for Nature Conservation, Isle of Vilm, Germany
Keywords: research, Europe, strategy, policy
Research needed to halt biodiversity loss by 2010
Ecological and social context of the Protected Areas (PAs) • investigate socio-economic (including ethical, cultural, and religious concerns) and ecological processes
and their interactions to improve the design, implementation, monitoring and management of PAs;
• develop appropriate management guidelines for human recreation, education, and economic activitiesin and adjacent to PAs;
• analyse past experience and investigate new methods, including policy appraisal, for ensuring thathuman communities located within PAs or buffer zones are involved in the decision-making processabout the management of the area and receive an equitable sharing of social or economic benefits fromthe sustainable use of the PA;
• improve and develop methodologies to analyse the socio-economic effects of PAs for the regions out-side the PA and to evaluate the threats for the PA that have their origin outside the designated area;
• increase the effectiveness and reliability of different management methods (i.e. adaptive managementand the ecosystem approach) to meet the main objectives of the PAs.
Ecological understanding of PAs• improve the application of ecological theory, including landscape ecology and biogeographical knowl-
edge in the designation of areas to protect both the survival of endangered species/habitats, and the sus-tainable use of locally scarce biotic resources in managed systems;
• strengthen the scientific foundations for the specification of protection regimes: understand how tomanage, maintain and if necessary restore the favourable condition of PAs;
• develop and investigate methods to monitor, evaluate and assess whether favourable condition of habi-tats and species are maintained by PAs;
• identify and assess hazards and risks to biodiversity in the PAs;
• refine existing knowledge about the scales at which networks of PAs will guarantee the favourable con-dition of species and habitats within each major ecosystem, including the scale necessary to maintainnatural processes and migratory species;
• understand how to design and manage buffer zones around PAs so that they help to maintain ecologi-cal integrity within the PAs;
• investigate methods including habitat creation or restoration for achieving connectivity in variousecosystems under different regimes of human exploitation;
• predict the ecological consequences and understand the implications for conservation objectives ofprojected climate changes, including their influence on disturbance regimes and on conditions of andconnectivity between PAs.
11
007419 CDG Interieur_no9 11/3/03 6:12 PM Page 33
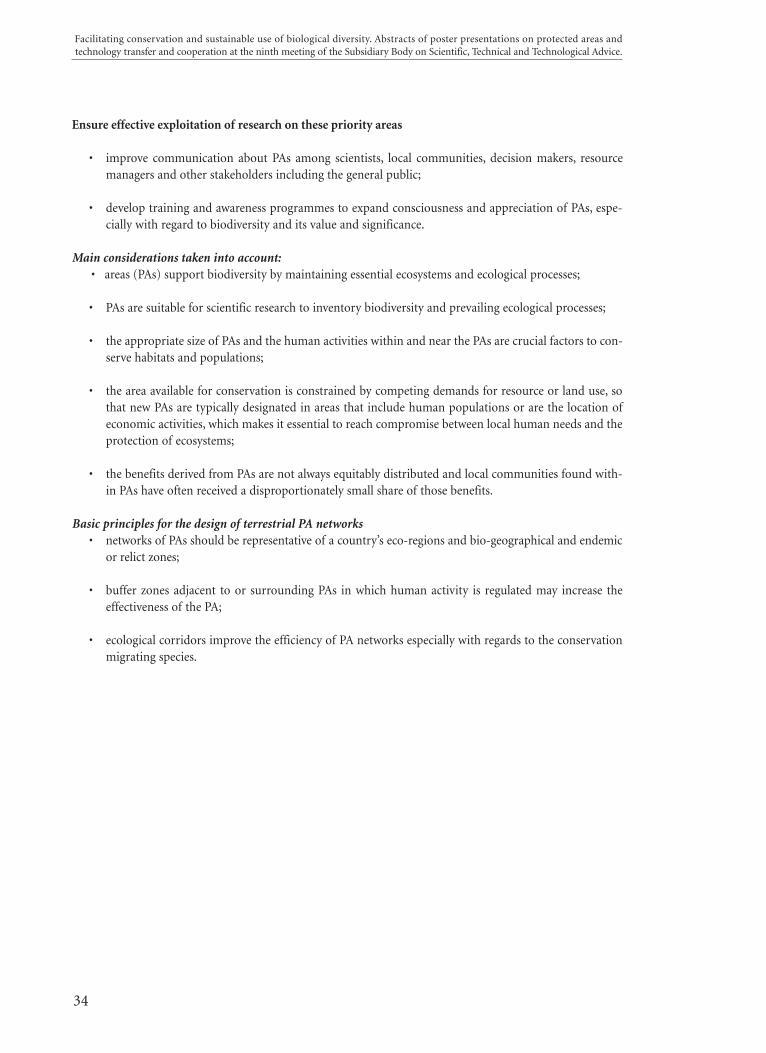
Ensure effective exploitation of research on these priority areas
• improve communication about PAs among scientists, local communities, decision makers, resourcemanagers and other stakeholders including the general public;
• develop training and awareness programmes to expand consciousness and appreciation of PAs, espe-cially with regard to biodiversity and its value and significance.
Main considerations taken into account:• areas (PAs) support biodiversity by maintaining essential ecosystems and ecological processes;
• PAs are suitable for scientific research to inventory biodiversity and prevailing ecological processes;
• the appropriate size of PAs and the human activities within and near the PAs are crucial factors to con-serve habitats and populations;
• the area available for conservation is constrained by competing demands for resource or land use, sothat new PAs are typically designated in areas that include human populations or are the location ofeconomic activities, which makes it essential to reach compromise between local human needs and theprotection of ecosystems;
• the benefits derived from PAs are not always equitably distributed and local communities found with-in PAs have often received a disproportionately small share of those benefits.
Basic principles for the design of terrestrial PA networks• networks of PAs should be representative of a country’s eco-regions and bio-geographical and endemic
or relict zones;
• buffer zones adjacent to or surrounding PAs in which human activity is regulated may increase theeffectiveness of the PA;
• ecological corridors improve the efficiency of PA networks especially with regards to the conservationmigrating species.
Facilitating conservation and sustainable use of biological diversity. Abstracts of poster presentations on protected areas and technology transfer and cooperation at the ninth meeting of the Subsidiary Body on Scientific, Technical and Technological Advice.
34
007419 CDG Interieur_no9 11/3/03 6:12 PM Page 34
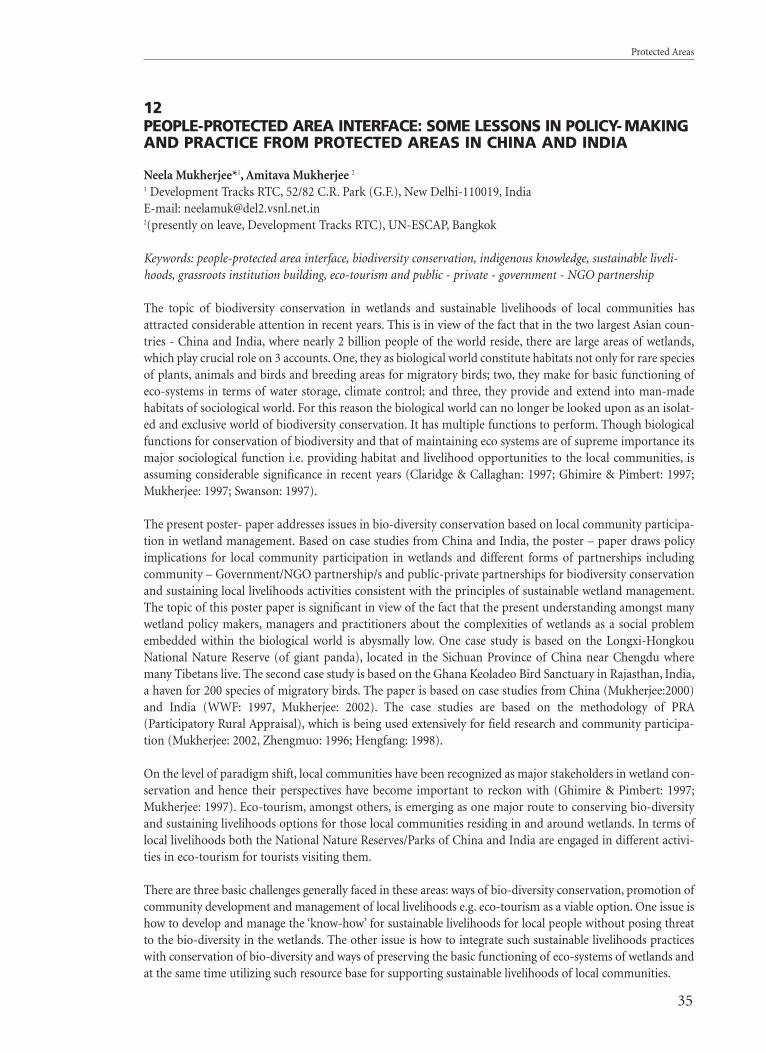
PEOPLE-PROTECTED AREA INTERFACE: SOME LESSONS IN POLICY- MAKINGAND PRACTICE FROM PROTECTED AREAS IN CHINA AND INDIA
Neela Mukherjee*1, Amitava Mukherjee 2
1 Development Tracks RTC, 52/82 C.R. Park (G.F.), New Delhi-110019, India E-mail: [email protected] 2(presently on leave, Development Tracks RTC), UN-ESCAP, Bangkok
Keywords: people-protected area interface, biodiversity conservation, indigenous knowledge, sustainable liveli-hoods, grassroots institution building, eco-tourism and public - private - government - NGO partnership
The topic of biodiversity conservation in wetlands and sustainable livelihoods of local communities hasattracted considerable attention in recent years. This is in view of the fact that in the two largest Asian coun-tries - China and India, where nearly 2 billion people of the world reside, there are large areas of wetlands,which play crucial role on 3 accounts. One, they as biological world constitute habitats not only for rare speciesof plants, animals and birds and breeding areas for migratory birds; two, they make for basic functioning ofeco-systems in terms of water storage, climate control; and three, they provide and extend into man-madehabitats of sociological world. For this reason the biological world can no longer be looked upon as an isolat-ed and exclusive world of biodiversity conservation. It has multiple functions to perform. Though biologicalfunctions for conservation of biodiversity and that of maintaining eco systems are of supreme importance itsmajor sociological function i.e. providing habitat and livelihood opportunities to the local communities, isassuming considerable significance in recent years (Claridge & Callaghan: 1997; Ghimire & Pimbert: 1997;Mukherjee: 1997; Swanson: 1997).
The present poster- paper addresses issues in bio-diversity conservation based on local community participa-tion in wetland management. Based on case studies from China and India, the poster – paper draws policyimplications for local community participation in wetlands and different forms of partnerships includingcommunity – Government/NGO partnership/s and public-private partnerships for biodiversity conservationand sustaining local livelihoods activities consistent with the principles of sustainable wetland management.The topic of this poster paper is significant in view of the fact that the present understanding amongst manywetland policy makers, managers and practitioners about the complexities of wetlands as a social problemembedded within the biological world is abysmally low. One case study is based on the Longxi-HongkouNational Nature Reserve (of giant panda), located in the Sichuan Province of China near Chengdu wheremany Tibetans live. The second case study is based on the Ghana Keoladeo Bird Sanctuary in Rajasthan, India,a haven for 200 species of migratory birds. The paper is based on case studies from China (Mukherjee:2000)and India (WWF: 1997, Mukherjee: 2002). The case studies are based on the methodology of PRA(Participatory Rural Appraisal), which is being used extensively for field research and community participa-tion (Mukherjee: 2002, Zhengmuo: 1996; Hengfang: 1998).
On the level of paradigm shift, local communities have been recognized as major stakeholders in wetland con-servation and hence their perspectives have become important to reckon with (Ghimire & Pimbert: 1997;Mukherjee: 1997). Eco-tourism, amongst others, is emerging as one major route to conserving bio-diversityand sustaining livelihoods options for those local communities residing in and around wetlands. In terms oflocal livelihoods both the National Nature Reserves/Parks of China and India are engaged in different activi-ties in eco-tourism for tourists visiting them.
There are three basic challenges generally faced in these areas: ways of bio-diversity conservation, promotion ofcommunity development and management of local livelihoods e.g. eco-tourism as a viable option. One issue ishow to develop and manage the ‘know-how’ for sustainable livelihoods for local people without posing threatto the bio-diversity in the wetlands. The other issue is how to integrate such sustainable livelihoods practiceswith conservation of bio-diversity and ways of preserving the basic functioning of eco-systems of wetlands andat the same time utilizing such resource base for supporting sustainable livelihoods of local communities.
35
Protected Areas
12
007419 CDG Interieur_no9 11/3/03 6:12 PM Page 35
Drawing lessons from the case studies from China (Mukherjee:2000) and India (Mukherjee: 2002), the papershows the need to integrate wetlands functions, eco-tourism and sustainable livelihoods for which capacitybuilding at the local and other levels is a critical factor. However, these are necessary conditions though notsufficient for there are policy issues at the national and global level, which also need synchronization with sin-cere efforts at the local level.
Wetland-based livelihoods activities depend on their carrying capacities and ways in which opportunitiesare exploited in a sustainable manner. For any collaborative arrangement with local communities in wet-lands it is important to identify mutual benefits and costs and negotiate on that basis for a win-win situa-tion. Awareness building on best environmental practices is an integral part of the whole process.Opportunities for partnerships are immense where National Parks and Nature Reserves can collaboratewith local communities for sustainable livelihoods –related activities and also create space for nurturingother types of partnerships such as public-private partnerships, partnerships with NGOs etc. on a mutuallybeneficial basis for supporting bio-diversity conservation activities and sustainable livelihoods.
ReferencesClaridge, Gordon and Bernard O’ Callaghan (1997), Community Involvement in Wetland Management: Lessonsfrom the Field, Wetlands International.Ghimire, K. B. and Michel Pimbert (ed.) (1997), Social Change and Conservation, Earthscan Publications,London.Hengfang, Zou (1998), “Participatory Methodologies in the Planning and Design of Forestry Projects”,Forestry and Society Newsletter, November.Mukherjee, Amitava (2001),“People’s Participation in Keoladeo Ghana Bird Sanctuary, Rajasthan” , typescript.Mukherjee, Neela, (2000) “Training Needs Assessment Report for Sanjiang Plain in Heilongjiang Province,November, Mission Report, Wetland Biodiversity Conservation and Sustainable Use in China, ProjectNumber: CPR/98/G32.Mukherjee, Neela (1997), Participatory Appraisal of Natural Resources, Concept Publishing Company, New Delhi.Mukherjee, Neela (2002), Participatory Learning and Action: With 100 Field Methods, Concept PublishingCompany, Delhi.Swanson Timothy (1996),Global Action for Biodiversity, Earthscan Publications, London, 1997.WWF and Keoladeo National Park, Participatory Management Planning for Keoladeo National Park, WWFInternational, New Delhi.Zhengmuo, Guo, “Farmer Participation in the Management and Policy-making of Forestry Projects”, Forestryand Society Newsletter, Vol.4, No.2, November 1996.
Facilitating conservation and sustainable use of biological diversity. Abstracts of poster presentations on protected areas and technology transfer and cooperation at the ninth meeting of the Subsidiary Body on Scientific, Technical and Technological Advice.
36
007419 CDG Interieur_no9 11/3/03 6:12 PM Page 36
REPORTING ON DESIGNATED AREAS AT EUROPEAN LEVEL:THE COMMON DATABASE ON DESIGNATED AREAS (CDDA)
Dominique Richard, Marc Roekaerts, Lauri Klein, Ulla Pinborg1*,Jeremy Harrison, S. Chape2,Eladio Fernandez Galiano3
1European Environment Agency, Kongens Nytorv, 6, DK-1050 Copenhagen2UNEP-WCMC, 219 Huntingdon Road, Cambridge CB3 0DL, UK3Council of Europe, avenue Europe, F-67 000 Strasbourg
Keywords: designated areas, reporting, harmonization, data flow, coordination
Reporting on designated areas in Europe, a need for co-ordination
It is estimated that Europe as a whole accounts for about 65 000 designated areas. The picture is getting moreand more complex as, beyond national initiatives, various protective instruments are been applied at interna-tional, European, regional as well as at the specific European Union level.
Three major organisations acting in Europe, the European Environment Agency, UNEP-WCMC and theCouncil of Europe, had started to compile information on designated areas, each one according to its ownagenda. Since 1995 however, the collaborative project on a Common Database on Designated Areas (CDDA),has been jointly launched. It aims at better co-ordinating and streamlining information on designated areasresulting from these various legal frameworks. The initiative is in line with priority action 27 of the IUCN“Parks for Life” report on Action for protected Areas in Europe.
Why, What and How ?
Why streamlining the reporting on designated areas?While avoiding duplication in requests to countries, streamlining the reporting on Designated areas in a co-ordinated way serves different purposes:
• Designated areas are considered as a “Response indicator”• As such, data have been regularly published by OECD, EUROSTAT• Regular publication of the UNList of Protected Areas at the global level• With the development of regional conventions (Barcelona, Alpine, Helsinki, OSPAR…), need to gather
data on designated areas on a supra-national basis• “Protected Forest Areas” is one of the indicators for Sustainable Forest Management selected within the
Ministerial Process for the Protection of Forests in Europe (MCPFE)• Various requests are addressed by country representatives on comparisons between a national system of
designations and others in Europe
37
Protected Areas
13
1 The European Environment Agency is a European Union organisation involved in gathering environmental data for all Europe, includingdata on designated areas2 UNEP-WCMC is a UNEP body in charge for gathering biodiversity data world-wide3 The Council of Europe is an intergovernmental organisation with 45 states, covering all democratic states of Europe
007419 CDG Interieur_no9 11/3/03 6:12 PM Page 37
What is taken into consideration?There are basically three broad categories of designations to report upon:
• legal country commitment in the framework of international or regional conventions and programmes(Ramsar, World Heritage, UNESCO Biosphere Reserves, Bern, Barcelona, Helsinki conventions;)
• legal country commitment under European Union Directives (Birds and Habitats Directives)• specific national designations, with considerable variability in designation-types from one country to
another (National parks, nature reserves, regional parks etc…)
Very often, the same site is designated totally or partially, under several legal frameworks, often with differentboundaries and surface areas. Thus, if site designations are not identified individually in a database, generalstatistics on designated areas in Europe are wrong, with many overlaps and double-counting. On the otherhand the CDDA approach allows analysis on multiple designations.
Information collected on each designated area relates to:
• Site code (CDDA: international) ; Site code (national: link with national data base); Area name;Designation type; Surface area; Site co-ordinates; IUCN category; Year of establishment;
and progressively on:
• habitat types in designated areas; altitude and digitised boundaries.
Collection of information is shared among the three partners of the CDDA
Depending on the type of designations, specific mechanisms are in place to collect the information:
• International and regional designations: through the Secretariats of corresponding conventions andprogrammes, via UNEP-WCMC, as well as Council of Europe for Pan-European designations
• Community designations: European Environment Agency through the European Commission• National designations: European Environment Agency for the 35 European countries which participate
in the European Information and Observation Network (EIONET) and UNEP-WCMC for otherEuropean countries
Main resultsThe most significant work achieved relates to collection of information on Nationally Designated Areas. Amajor sub-product of the CDDA is the identification of the various national designation types specific to eachEuropean country. Out of 45 000 Nationally designated sites recorded so far, 600 different national designa-tion-types have been recognised and entered into the database.
Data flow on nationally designated areas is streamlined through a well-organised intranet reporting systemwhich involves all 35 European countries member of the European Environment Agency. An update is organ-ised on a yearly basis.
For international, regional and European Union designations, the issue is to collaborate with conventions sec-retariats for a regular update.
Referenceshttp://nature.eionet.eu.int/activities/products/EUNIS/cddahttp://www.unep-wcmc.org/protected_areas/data/nat2.htmhttp://www.coe.int/t/e/Cultural_Co-operation/Environment/Nature_and_biological_diversity
Facilitating conservation and sustainable use of biological diversity. Abstracts of poster presentations on protected areas and technology transfer and cooperation at the ninth meeting of the Subsidiary Body on Scientific, Technical and Technological Advice.
38
007419 CDG Interieur_no9 11/3/03 6:12 PM Page 38
39
Protected Areas
14STATUS AND EFFECTIVENESS OF PROTECTED AREAS IN CANTON LORETO - ECUADOR
Alvaro Cañadas1*, Oleg Nenadic2
1 Georg August Universität Göttingen, Institute of Forest Management, Büsgenweg 5, 37077 Göttingen,Germany. * [email protected] Georg August Universität Göttingen, Institut für Statistik und Ökonometrie, Platz der Göttinger Sieben 5,37073 Göttingen.
Keywords: classification of slope, GIS, monitoring of land use, spatial model, Ecuador
Introduction
According to BUSTAMANTE and VIDAL (1999) most of the protected areas in Ecuador are created with asocial burden. These areas have often been declared without the people’s knowledge and without consideringthe costs of the declaration. For these reasons, most of the protected areas are created with a deficit of gen-uineness and a social debt. On the other hand, several authors (WHITE and MALDONADO, 1991; PER-REAULT, 1996; WUNDER, 1996 and WUNDER and SAYER, 2000) mention that this type of planning fromabove, by the Ministry of Environment, has been severely criticized, because of a lack of objectivity, budgetand analysis of the necessities of the people settled in these areas. It requires a legal revision of park – dweller’land tenure (AMEND and AMEND, 1995). Furthermore, a new field of sustainability science is emerging,which seeks to understand the fundamental character of interactions between nature and society. Such anunderstanding must encompass the interaction of global processes with the ecological and social characteris-tic of particular places and sectors (WBGU, 1997).
Because of the dynamic population, a monitoring of the current situation in protected areas is still insufficientin the canton Loreto. The aim of the present study was to adapt the classification of the slopes to the condi-tions of the Ecuadorian Amazon region in the canton Loreto. Using this toll, the different management areassuch as the National Park Sumaco Napo-Galeras and the Protected Forest Sumaco were analysed. In addition,the changes of the land use in the Protective Forest Sumaco and the current situation of the Patrimony ofForest State were determined.
Materials and MethodsThe topographic maps of the Geographic Military Institute were digitalized through the programARC/INFO. By using the program ARC/VIEW the digital landscape model and the classification of theslopes were obtained. A map of the Instituto Nacional de Desarrollo Agropecuario INDA at the scale1:100,000 was digitalized through the program ARC/INFO for the analysis of the tenancy of the differentareas in the Canton Loreto. The satellite image LANDSAT of CLIRSEN dated October 1995 and September1997 was used to determinate the dynamic of the land use in the Protected Forest Sumaco. A supervisedclassification of land use was carried out using our knowledge of land use and of the Participative RapidAppraisal (PRA) method. PRA was used with a 45% intensity of samples of total communities living in theProtected Forest Sumaco and the Patrimony Forest of State.
Results and DiscussionThe protected areas, which belong to the Ministry of Environment in the canton Loreto, are presented in Fig1. The National Park consists of 16.1% of the Protective Forest Sumaco –and of 16.4% of the Forest Patrimonyof the States -1.5% of the total territory.
007419 CDG Interieur_no9 11/4/03 9:17 AM Page 39
National ParkThe area of the National Park Sumaco Napo - Galleras in the canton Loreto covers 35.273,7 hectares.According to GUTIERREZ (1999) and CAÑADAS (2000) some areas of the forest have been invaded by“Colonos” (small farmer immigrants) as well by Indian people in the sectors of Copales del Suno, San José dePayamino and the reserve Juan Montalvo. The law prohibits any activity within the national park. It is neces-sary to point out that the National Park Galeras is under military control, through the existence of aerial mon-itoring antennas. But according to the classification of the slopes in the National Park Sumaco, Class IV andVI comprise 51.4% of the area. This territory has strong limitations as far the agricultural use is concerned,which confirms the possibility that it can be protected by itself. Class I, II and III consist of 48.6% of theNational Park (Table 1). These areas are extremely appropriate for agricultural use. Without any doubt, thispart of the National Park is and can be the potential access of the land for the inhabitants of the communitieswho lack reservation lands.
Protective ForestThe division of the capacity of land use within the Protective Forest is presented in Table 2. Classes I – IV cor-respond to 93.3 % of the Protective Forest and only 6,7% is left for the territories of Class V and Class VI.According to the law the areas of Class V and VI are areas of permanent protection and therefore they cannotbe used. This data clearly shows that only 6,7% of the Protective Forest meet the requirements, described bylaw and needs, to be declared as a type of protected area. On the other hand, in article 15 of the ProtectedForest law states that: “the only activities allowed inside the forests and vegetation protectors, previous author-ization of the forest national program, will be the following ones: a.-the opening of fringes short fire;b.- Fitosanitary control; c.-Fomentation of the flora and wild fauna; d.-Execution of high-priority consideredpublic works; and e.-Spacing out, low control and supervision of the forest national program; and, f.- Science,touristy and recreation”(M.A., 1999).
The changes of land use in the Protective Forest Sumaco observed in 1995 and 1997 are presented in Table 2.The transformation of forest cover to agriculture use is evident. (agriculture with a rate of 8.2% p.a. and cat-tle ranch with a rate of 4.4% p.a.. The rate of deforestation has been 6.2% p.a., with total contradiction to thelaw of the Protected Forest. Nevertheless, it is necessary to point out that the observed increase of secondaryforest areas was small, at about 0.1% p.a.. It demonstrates the expansive character of land use in the ProtectedForest Sumaco. The sale of agricultural works (Venta de trabajos), especially, for new immigrants is verypopular in the colonos communities.
Forest patrimony of the StateThe forest patrimony, a native timber, is an important area of the country controlled by state, but both its con-tribution to the economy and the production is non-existent. There is only the demand of expenses to thenational treasury. At present the areas of the Forest Patrimony of the State in the canton Loreto are possessedby the indigenous groups.
Facilitating conservation and sustainable use of biological diversity. Abstracts of poster presentations on protected areas and technology transfer and cooperation at the ninth meeting of the Subsidiary Body on Scientific, Technical and Technological Advice.
40
007419 CDG Interieur_no9 11/3/03 6:12 PM Page 40
Conclusions
In the canton Loreto 33,8% of the total land area belongs to the state. 16,1% has been declared as a NationalPark, 16,4% as a Protected Forest and 1,5% of the total land is declared as a Forest Patrimony of the State.Almost 40% of the National Park appear to be suitable for agriculture, and the surrounding communitiescould consider the Park as a potential area for colonization. Only about 6% of the Sumaco Protected Forestfulfill what is stipulated in the Forest Law and deforestation rate of 6% p.a. , which totally contradicts theForest Law. The Forest Patrimony of State has been invaded by indigenous communities. The establishmentof a monitoring system could give the possibility of reviewing the inappropriate politics at a national level,which often causes the most serious threats to biodiversity.
ReferencesAMEND, S. and AMEND, T. (Eds) 1995: National parks without people? The South American experience,IUCN/Parques Nacionales y Conservación Ambiental. No. 5, Quito, Ecuador.BUSTAMANTE, T. und VIDAL, S. 1999: Los proyectos integrados de conservación y desarrollo para las zonasde amortiguamiento y las áreas protegidas. Unpublished report prepared for FLACSO. Quito. Ecuador. 14 p.CAÑADAS, A. 2000: Diagnóstico socioeconómico participativo del Cantón Loreto, con fines de determinarlos potenciales de cooperación en un programa de manejo sostenible del bosque primario y/o intensificaciónagroforestal. Unpublished report prepared for MMA/GTZ. Tena, Ecuador. 44 p.ECUADOR MINISTERIO DEL AMBIENTE. M.A. 1999: Ley forestal y de conservacion de areas naturales yvida silvestre MA, Quito, Ecuador.GUTIERREZ, F. 1999: Estudio socioeconómico del sector Noreste del Parque Nacional Sumaco. Unpublishedreport prepared for MMA/GTZ. Tena, Ecuador. 30 p.PERREAULT, T. 1996: Nature preserves and community conflict: A case study in highland Ecuador. MountainResearch and Development 16 (2): 167 – 175.WBGU. 1997: World in transition: The Research Challenge. www.wbgu.de/wbgu_publication.htmlWHITE, S. and MALDONADO, F. 1991: The use and conservation of natural resources in the Andes ofSouthern Ecuador. Mountain Research and Development 11 (1): 37 – 55WUNDER, S. 1996: Deforestation and the uses of wood in the Ecuadorian Andes. Mountain Research andDevelopment 16 (4): 367 - 382WUNDER, S. and SAYER, J. 2000: The Economics of Deforestation. The Example of Ecuador. ST. MARTIN´SPRESS. New Y. 249 p.
41
Protected Areas
007419 CDG Interieur_no9 11/3/03 6:12 PM Page 41
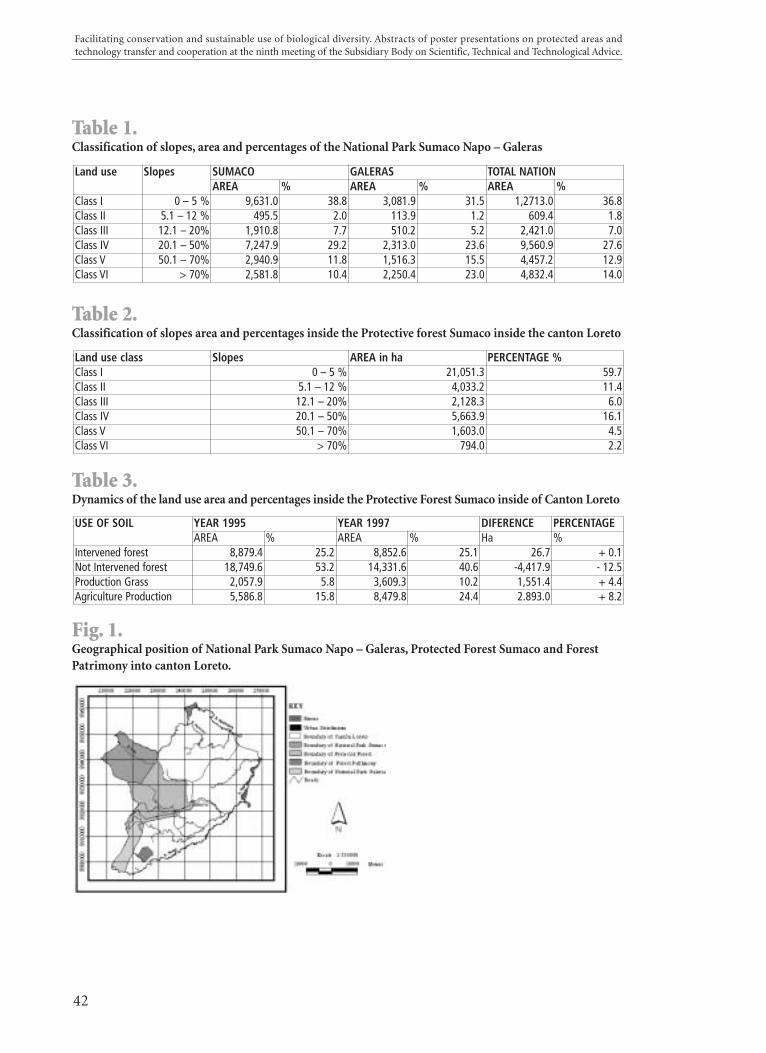
Table 1.Classification of slopes, area and percentages of the National Park Sumaco Napo – Galeras
Table 2.Classification of slopes area and percentages inside the Protective forest Sumaco inside the canton Loreto
Table 3.Dynamics of the land use area and percentages inside the Protective Forest Sumaco inside of Canton Loreto
Fig. 1.Geographical position of National Park Sumaco Napo – Galeras, Protected Forest Sumaco and ForestPatrimony into canton Loreto.
Facilitating conservation and sustainable use of biological diversity. Abstracts of poster presentations on protected areas and technology transfer and cooperation at the ninth meeting of the Subsidiary Body on Scientific, Technical and Technological Advice.
42
USE OF SOIL YEAR 1995 YEAR 1997 DIFERENCE PERCENTAGE AREA % AREA % Ha %
Intervened forest 8,879.4 25.2 8,852.6 25.1 26.7 + 0.1Not Intervened forest 18,749.6 53.2 14,331.6 40.6 -4,417.9 - 12.5Production Grass 2,057.9 5.8 3,609.3 10.2 1,551.4 + 4.4Agriculture Production 5,586.8 15.8 8,479.8 24.4 2.893.0 + 8.2
Land use class Slopes AREA in ha PERCENTAGE %Class I 0 – 5 % 21,051.3 59.7Class II 5.1 – 12 % 4,033.2 11.4Class III 12.1 – 20% 2,128.3 6.0Class IV 20.1 – 50% 5,663.9 16.1Class V 50.1 – 70% 1,603.0 4.5Class VI > 70% 794.0 2.2
Land useclass
Slopes SUMACO GALERAS TOTAL NATIONAL PARKAREA % AREA % AREA %
Class I 0 – 5 % 9,631.0 38.8 3,081.9 31.5 1,2713.0 36.8Class II 5.1 – 12 % 495.5 2.0 113.9 1.2 609.4 1.8Class III 12.1 – 20% 1,910.8 7.7 510.2 5.2 2,421.0 7.0Class IV 20.1 – 50% 7,247.9 29.2 2,313.0 23.6 9,560.9 27.6Class V 50.1 – 70% 2,940.9 11.8 1,516.3 15.5 4,457.2 12.9Class VI > 70% 2,581.8 10.4 2,250.4 23.0 4,832.4 14.0
007419 CDG Interieur_no9 11/3/03 6:12 PM Page 42
SUPPORTING NATIONAL PROTECTED AREA SYSTEMS INTERNATIONALLY - THE GLOBAL ENVIRONMENT FACILITY AS A MECHANISM OF TRANSFER
Oliver DekeDep. Environmental and Resource Economics, Institute for World Economics (IfW),Kiel, Germany, [email protected]
Keywords: Global Environment Facility, international coordination, protected areas, transfer
Global benefits from national protected area systems
Valuable biological diversity can sometimes be preserved only if sensitive natural areas as their carriers arewithheld from land development. Such a protection of natural areas is in the interest of the individual stateand has led to the establishment of national protected area systems in most states. However, national policiesin this regard also create significant benefits at the global level, in particular when ecosystems in economical-ly less developed states which typically host great parts of global biological diversity within their territories areprotected. In attempting to bring forward economic development, these states often have limited interest inthe protection and do not want to relinquish the use of natural areas. In this respect, there is a need for a suit-able incentive mechanism which revokes cases of land development leading to a loss of biological diversity thatis undesirable from a global perspective and organizes protection on behalf of the community of states by rec-onciling national and international interests with respect to the protection of biological diversity.
For this purpose, the traditional protected area approach with its conventional definition has to be endorsedby mechanisms which provide transfers as a compensation for the forgone land development. Examples forsuch mechanisms that are currently in practice are Debt for Nature-Swaps but also mechanisms of transferwhich are associated with international environmental agreements like the Ramsar Small Grant Fund, theWorld Heritage Fund or the Global Environment Facility (GEF). The latter is of particular interest since itserves as the mechanism of the CBD. Considering recent claims for a spatial expansion of protected area sys-tems worldwide, mechanisms of transfer are of growing importance. To evaluate the practices and to identifyor formulate potential improvements, there is a need for a precise understanding of the functioning of the cur-rent mechanisms of transfer, in particular of the GEF.
An empirical analysis of the Global Environment Facility (GEF) as a mechanisms of transfer
The funds the GEF is able to spend as transfers is provided by several industrialized and developing countrieswhereas the major industrialized states (G-7) provide more than three quarter of the total funds. Since theGEF represents a sinking fund, its resources have to be replenished from time to time. In 2002, the donors haveagreed on a third replenishment of the GEF of US$ 2.9 billion for the period until 2006. In the preceded peri-ods, about 40% of the GEF’s total funds have been spent on the focal area of ‘biodiversity’. Funds are provid-ed conditionally on proposed protection actions which are summarized in projects. Since 1991, the GEF hassupported more than 500 biodiversity projects.
For the empirical analysis, data on 541 projects approved during 1991 to 2002 has been taken from the GEF’sonline “Project Database” as well as from Project Documents published by the GEF and the ImplementingAgencies, i.e. World Bank, UNDP and UNEP. The total project cost summed over all these projects amountsto US$ 4.4 billion. Thereof, US$ 1.5 billion has been recovered by the GEF.
Concerning the natural areas which are covered by the projects, it has been shown that only about one half ofthe projects addresses the protection of natural areas in a narrow sense. In the remaining projects, the focus is
43
Protected Areas
15
007419 CDG Interieur_no9 11/3/03 6:12 PM Page 43
on the support of sustainable management in already modified ecosystems or on the establishment of insti-tutional capacities which may favor protected area policies only indirectly. Furthermore, projects on protect-ed areas have in effect attracted the larger part of funds in the GEF biodiversity portfolio. They have primari-ly been implemented in economically less developed states in sub-tropic and tropic regions but also in EasternEuropean and Continental Asian countries with economies in transition. Considering the proposed activities,a spatial expansion of protected areas has only been a project goal in some cases. In the majority of the proj-ects, the focus has been on the establishment of an effective management system in (at least legally) alreadyestablished protected areas. Expenditures for managing the protected areas address one-time investment liketraining or infrastructure development and recurrent tasks like guarding the areas. In this context, it has beenfound that on average substantially larger project funds are spent on investments than on the recovery of therecurrent management costs.
According to the incremental cost principle, the provision of funds by the GEF aims at fundingthose parts of the project activities which are essential for generating ecosystem services of global importance.In this regard, the contribution by the GEF adds to efforts of the recipient state in preserving its own naturalendowments of biological diversity. Considering the funding sources in the projects with protected area meas-ures, it is shown that, in addition to contributions by domestic governmental institutions and the paymentsby the GEF, co-financing by bilateral and multilateral donors plays an important role. Depending on the socio-economic and ecological environments, the percentage shares of the different funding sources vary signifi-cantly between the projects. The average share for each funding source are indicated in Figure 1. “The fundingof GEF projects with protected area components.”
Concluding remarks
The results of the empirical analysis indicate that the current funding by the GEF mechanism is rather direct-ed to the management of existing protected areas than to the expansion of protected area systems. In thisregard, the provided GEF grants in most cases do not serve as compensations for private or public landown-ers for forgone payoffs from land development but for remunerating capital and labor inputs which would nothave been employed in the protection of natural areas if a contract between the GEF and the host state hadnot been concluded.
It can be observed that investments as components of the GEF projects often aim at establishing facilities (inparticular with regard to ecotourism) that generate income from protected areas which can be used to recov-er management costs. Since projects usually run only for 3-7 years, a further question is whether this incomegenerally suffices to ensure a sustainable funding of the recurrent management tasks and accordingly enablean effective long-term management. If this was not the case, there would be an ongoing demand for resourcesin existing protected areas. This again would imply that future GEF payments as well cannot be allocated to aspatial expansion of protected area systems but will have to be bound to the existing areas if the managementquality and accordingly the level of protection in these areas should not diminish.
ReferencesDeke, O. (2003) “Internalizing global externalities from biodiversity – protected areas and multilateral mech-anisms of transfer”. Kiel Working Paper. Kiel Institute for World Economics. mimeo.
Deke, O. (2003) “The Global Environmental Facility – An empirical analysis of a mechanism of transfer andaddressed protected area measures”. Kiel Working Paper. Kiel Institute for World Economics. Kiel, mimeo.
Facilitating conservation and sustainable use of biological diversity. Abstracts of poster presentations on protected areas and technology transfer and cooperation at the ninth meeting of the Subsidiary Body on Scientific, Technical and Technological Advice.
44
007419 CDG Interieur_no9 11/3/03 6:12 PM Page 44
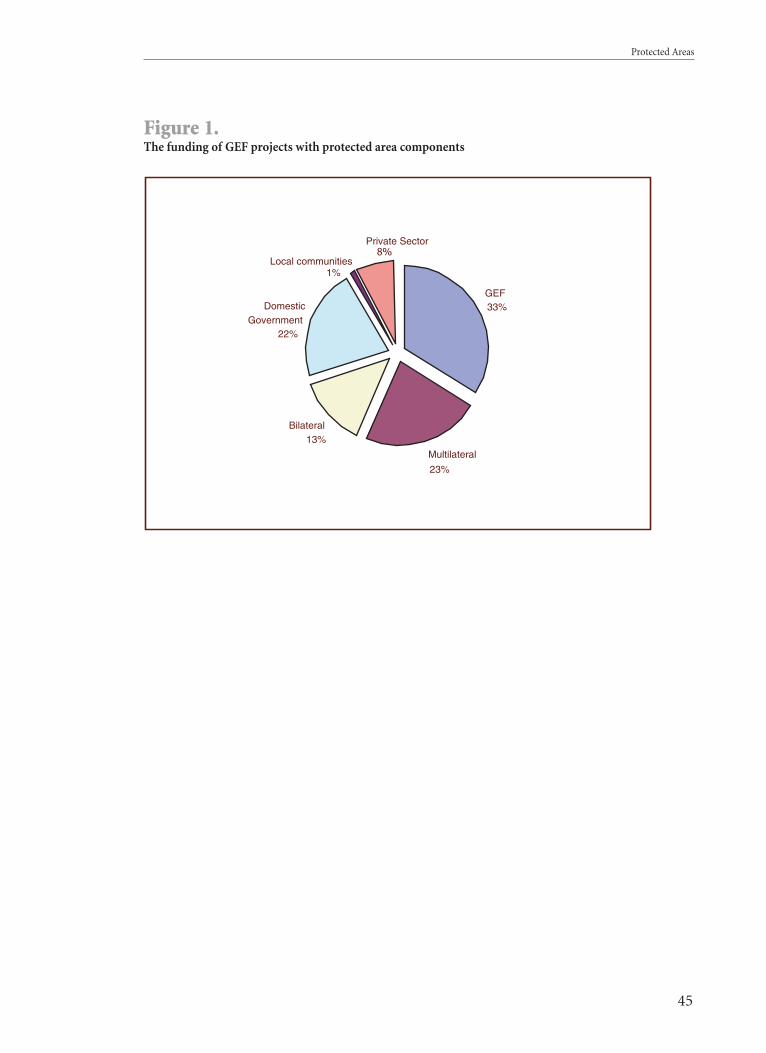
Figure 1.The funding of GEF projects with protected area components
45
Protected Areas
GEF33%
Multilateral
23%
Bilateral13%
DomesticGovernment
22%
Private Sector8%
Local communities1%
007419 CDG Interieur_no9 11/3/03 6:12 PM Page 45
TRANSBOUNDARY COOPERATION IN THE EVEREST MOUNTAIN ECOSYSTEM
Natural Resource Management ProgrammeInternational Center for Integrated Mountain DevelopmentG.P.O. Box 3226 Kathmandu, Nepal
Keywords: transboundary, cooperation, conservation, sustainability, mountain
Mount Everest Ecosystem
The Everest Mountain ecosystem, occurring in the Himalayan range, is one of the Earth’s most sensitivemountain landscapes. It lies in the border region between Nepal and the Tibet Autonomous Region (TAR) ofChina; and the highest mountain, Mount Everest – Sagarmatha in Nepal and Qomolangma in TAR – formsthe natural barrier. But ecosystems existed long before national jurisdictions, and species and communities ofplants and animals are not limited by political boundaries and landscapes. As a result of the remote, moun-tainous landscape and high altitude environment, the people living in this region are some of the most isolat-ed and poorest in the world. These two areas have more in common naturally and culturally than either areadoes with its adjacent lowland areas. Thus, there arises the need of transboundary cooperation to conserve thebiodiversity as well as to find ways for sustainable development i.e., reconciling the needs of these local com-munities with conservation of ecosystem and biodiversity. Further, transboundary cooperation helps coun-tries meet their obligations under international agreements such as the Convention on Migratory Species andthe Convention on Biological Diversity (Shengji and Sharma, 1998).
The activities towards transboundary cooperation started in 1994/1995 by The Mountain Institute (TMI),International Center for Integrated Mountain Development (ICIMOD), and the Governments of Nepal andChina, under TMI’s ‘Transboundary Biodiversity Conservation in the Eastern Himalayas Programme’ andICIMOD’s ‘Programme on Regional Collaboration for Biodiversity Management in the Eastern Himalayas’,which were both funded by the MacArthur Foundation.
Protected areas
Both governments have independently established protected areas around Mount Everest and nearby – TheQomolangma Nature Preserve (QNP) in Tibet; and Sagarmatha National Park (SNP), Makalu Barun NationalPark (MBNP) and Langtang National Park (LNP) in Nepal. Together these form a contiguous system of pro-tected areas that conserve a large, continuous ecosystem and rich cultural and natural heritages on both sidesof the Himalayas. It is among one of the 169 complexes of two or more adjoining protected areas that aredivided by international boundaries (Sandwith et. al., 2001).
Transboundary Issues
The transboundary issues were identified during the official meeting of representatives of the Protected areas;endorsed by the government representatives; and these were also at the center of the discussion in the jointparticipatory study carried out in the five border villages. The four main transboundary issues that are mostin need of cooperation are: 1. Illegal Poaching and Trade in Endangered Species; 2. Cross-border Spread ofForest Fires; 3. Cross-border Spread of Livestock Disease; and 4. Improving Local Livelihoods.
Facilitating conservation and sustainable use of biological diversity. Abstracts of poster presentations on protected areas and technology transfer and cooperation at the ninth meeting of the Subsidiary Body on Scientific, Technical and Technological Advice.
46
16
007419 CDG Interieur_no9 11/3/03 6:12 PM Page 46

The Path Forward
Achievements
Promoting transboundary eco-tourism opportunities TMI’s Langtang Ecotourism Project and LNP collaborated for three years to plan and promote community-based ecotourism in the Langtang area. In a participatory workshop, officials and community members fromKyirong on the Tibet side, began collecting information and planning for cross-border ecotourism, if the bor-der were to open. The opening of cross border trekking routes is supported by the QNP Tourism Master PlanStudy and suggests four sites including Kyirong-Langtang area.
Coordination between different programmesWith the coordination between TMI’s Qomolangma Conservation Programme and Peak EnterpriseProgramme, and ICIMOD’s Natural Resource Management Programme, all these three programmes give con-servation education along with options for improving local livelihoods.
Challenges
The challenges that hinder transboundary collaboration are Travel across border, Communication, Follow-through and broad-level participation in exchanges.
Recommendations
The main recommendation was to consolidate and expand transboundary activities, specifically by consoli-dating and regularizing the interaction and communication of protected area professionals and managers andfollowing up on the recommendations for activities at the community level. Also recommended were pro-moting joint World Heritage site designation for QNP, expanding transboundary cooperation beyond QNPand expanding transboundary activities to contiguous valley that are not included in the protected areas.Immediate activities that were suggested include - offering incentives for information on poaching activities,training in the identification of species that are traded illegally, providing veterinary services for livestock andconducting a workshop on forest fire management.
ReferencesSandwith, T., Shine, C., Hamilton, L. and Sheppard, D. (2001). Transboundary Protected Areas for Peace andCooperation. IUCN, Gland, Switzerland and Cambridge, UK. Shengji, P. and Sharma, U. R. (1998).Transboundary Biodiversity Conservation in the Himalayas. In Ecoregional Cooperation for BiodiversityConservation in the Himalayas. United Nations Development Programme, New York, USA. Sherpa, L.N.,Peniston, B., Lama, W. and Richard, C. (2003). Hands Around Everest: Transboundary Cooperation forConservation and Sustainable Livelihoods. International Centre for Integrated Mountain development,Kathmandu, Nepal.
47
Protected Areas
007419 CDG Interieur_no9 11/3/03 6:12 PM Page 47

Facilitating conservation and sustainable use of biological diversity. Abstracts of poster presentations on protected areas and technology transfer and cooperation at the ninth meeting of the Subsidiary Body on Scientific, Technical and Technological Advice.
48
007419 CDG Interieur_no9 11/3/03 6:12 PM Page 48

Technology Transfer
49
Technology Transfer
007419 CDG Interieur_no9 11/3/03 6:12 PM Page 49
BIODIVERSITY AND RANGELAND IN CANADA – THE EVOLUTION OF BENEFICIAL MANAGEMENT PRACTICES (BMPS)
*Ted Weins1, Brant Kirychuk1,E-mail: [email protected]: Merle Boyle1, Bill Bristol1, Karyn Scalise2, Glenn Sutter3,1Agriculture and Agri-Food Canada, Prairie Farm Rehabilitation Administration, Room 4031800 Hamilton St, Regina, SK, S4P 4L2; 2Saskatchewan Prairie Conservation Action Plan, Box 4752, Regina,S4P 3Y4; 3Royal Saskatchewan Museum, 2340 Albert St, Regina, SK, S4P 3V7.
Keywords: best management practices, BMPs, rangeland biodiversity, agriculture, Canada
Background
The Canadian Biodiversity Strategy (1995) recognizes that Canada’s 346 000 farmers and ranchers are address-ing the issues of soil erosion, water contamination, wildlife habitat destruction, energy efficiency, pollutionand waste management. The Strategy encourages producers “through research, training and technology trans-fer, to facilitate the further adoption of environmentally sustainable farm practices…”. The Strategy alsoencourages “the sharing of experiences and expertise among farmers to promote BMPs that favour the con-servation of biodiversity and the sustainable use of biological resources.”
Recent History of Agricultural Environmental Programs in Canada
The late 1970s and early 1980s ushered in a new environmental awareness in agriculture with a focus on soilconservation. In 1989, Canada initiated the National Soil Conservation Program and the Permanent CoverProgram. From 1990-1997, Canada’s Green Plan expanded environmental sustainability in the agriculture sec-tor and sponsored projects on grazing systems and grazing BMPs. In addition, core research on rangeland sus-tainability expanded. In June 2002, Canada announced the Agricultural Policy Framework (APF) designed tomake the agriculture sector a world leader in food safety and quality, environmentally responsible production,and innovation.
Rangeland Biodiversity in Canada
There are significant pressures on biodiversity in Canada’s remaining 20 million hectares of tame and nativerangeland. These include: depressed net incomes, land use conversion, fire suppression, invasion by woodyand alien species, long term idling, grazing management designed for domestic livestock, residential andindustrial developments, linear developments such as roads and pipelines and climate change. The overallimpacts are reduction and fragmentation, and impaired natural ecosystem functions. Conserving biodiversi-ty comes at a cost, and most producers using rangelands cannot capture economic returns for many biodi-versity-friendly actions. Experience shows that the key to conserving biodiversity, is to work with producersto develop cooperative, incentive-based solutions, where the BMP can save time or money and contribute tohealthy rangeland.
Five Beneficial (Best/Better/Good) Management Practices on Rangeland
Planned Grazing ManagementCanadian livestock producers use various approaches to manage grazing and developing a management planis the first step. The plan should incorporate accepted range management practices such as timing, duration,
Facilitating conservation and sustainable use of biological diversity. Abstracts of poster presentations on protected areas and technology transfer and cooperation at the ninth meeting of the Subsidiary Body on Scientific, Technical and Technological Advice.
50
17
007419 CDG Interieur_no9 11/3/03 6:12 PM Page 50
intensity of grazing, and rest/recovery of the range. The plan controls livestock impact and therefore influencesbiodiversity, economic benefits, and range health and function. One, or a combination of several grazing sys-tems, are often applied, including complementary, twice over, deferred, rest-rotation, or other regimes.
Riparian ManagementAgriculture and human settlement have also had a large impact on Canada’s waterways. Effective manage-ment of riparian systems benefits biodiversity conservation, erosion control, water quality, ecosystem health,and forage production. BMPs improve riparian health and include: installing remote watering systems to helpmanage livestock; enhancing natural riparian buffers by planting native, non-invasive grasses, shrubs or trees;noxious weed control; and fencing to manage livestock access. Streambank and water quality degradation, sed-imentation, nutrients and pathogens, and herd health problems can be minimized through relocation of live-stock away from sensitive areas. Producers using riparian conservation practices are reporting improved car-rying capacity and herd health, higher calf weight gains, and better cattle condition.
Exotic Invasive Plant Management Invasive plant species threaten rangeland health and biodiversity, while diminishing economic potential. Forexample, leafy spurge on the Canadian Prairies and purple loosestrife around wetlands can completely dis-place native vegetation, reducing biodiversity values and forage production. Damage can be minimizedthrough one or a combination of the following BMPs:
• Cultural Methods -grazing rotations, grazing intensity and timing, planting competitive forages• Mechanical Methods- mowing, hand-picking, burning• Biological Methods - enhancing or introducing natural herbivores, parasites, pathogens• Integrated Approaches -combining above BMPs
Establishing or Restoring Native RangelandDepending on a producer’s particular management goals, this BMP can improve ecological integrity throughseeding or transplanting native species. These plantings will reduce habitat fragmentation, and provide greaterhabitat patch size — by joining native habitats, and widening both riparian areas and associated adjacentupland vegetation).
Conversion of Marginal Cropland to RangelandBiodiversity and range sustainability remain at risk because a significant amount of environmentally sensitivelands in Canada (about 4.5 million ha) remains under annual cultivation. From 1989 to 1992, Canada’sPermanent Cover Programs (PCP I and II) encouraged landowners to grow perennial vegetation on more than400 000 ha where annual cultivation was causing soil degradation. These PCP lands continue to be used foragricultural production through grazing and haying but are also enhancing biodiversity. Studies show thatPCP lands provide a richer and more diverse community of grassland birds than cropland. Canada’s APF willencourage more conversion to pasture and hayland through cash incentives to do so, plus provide technicalassistance, greater riparian management, and more shelterbelt plantings. In addition, reseeded marginal landsprovide a conservation buffer around native prairie, protecting against future cultivation.
Outlook for Biodiversity Conservation on Canada’s Rangeland
Even though only 23% (15 391 000 ha) of Canada’s agricultural land remains in Natural Pasture (StatisticsCanada, 2003), the outlook for biodiversity conservation on these rangelands appears to be improving. Recentinitiatives such as: the Habitat Stewardship Program for species at risk; the Canadian Ecological GiftsProgram; the Agricultural Policy Framework; Provincial Protected Area Strategies; - and increasing steward-ship initiatives by thousands of Canadian landowners and land managers – will help conserve and enhanceCanada’s natural biodiversity.
51
Technology Transfer
007419 CDG Interieur_no9 11/3/03 6:12 PM Page 51
BIOPROSPECCIÓN, TRANSFERENCIA DE TECNOLOGÍA Y CONSERVACIÓNDE LA BIODIVERSIDAD: LA EXPERIENCIA DE INBIO-COSTA RICA
Ana Lorena Guevara F.Gerente Unidad de Bioprospección, Instituto Nacional de Biodiversidad, Heredia, Costa RicaE-mail: [email protected], www.inbio.ac.cr
Palabras clave: bioprospección, uso sostenible, compensación, transferencia de tecnología
INBio: su misión y actividades
El Instituto Nacional de Biodiversidad (INBio), es una organización no gubernamental de interés público cuyamisión es “promover una mayor conciencia sobre el valor de la biodiversidad, como un medio para lograr suconservación y mejorar la calidad de vida del ser humano”. Las actividades del INBio se realizan de acuerdo aun proceso medular que involucra la captura y generación de información sobre biodiversidad, su proce-samiento y sistematización y su transferencia a la sociedad. A través de estas actividades la institución buscaapoyar la estrategia nacional de conservación de la biodiversidad costarricense que se fundamenta en tresprincipios: salvar, conocer y usar (Fig. 1).
INBio está organizado en unidades estratégicas de acción que desarrollan actividades en cinco grandes áreastemáticas:
• El inventario nacional de biodiversidad que es responsable de la generación de información sobre lasespecies, su taxonomía y distribución geográfica en las áreas protegidas del país, así como algunos ele-mentos de su historia natural.
• Bioinformática que busca ordenar la información proveniente del inventario y de otras fuentes, uti-lizando tecnología informática, para ponerla en diferentes formatos según sean los distintos usuarios,tanto a lo interno como a lo externo de la institución.
• Gestión social que fomenta la bioalfabetización, divulgando y utilizando la información sobre biodi-versidad del país para fines intelectuales y espirituales, poniéndola en diferentes formatos para distin-tas audiencias, principalmente niños y estudiantes universitarios, utilizando para ello materiales desar-rollados para estos fines y distintas metodologías educativas y recreativas.
• Gestión de la conservación que promueve el desarrollo de procesos de planificación tanto en el ámbitonacional como institucional en materia de conservación y manejo de biodiversidad y coordina proce-sos conjuntos entre el INBio y el Sistema Nacional de Áreas de Conservación del Ministerio delAmbiente y Energía (MINAE).
• Bioprospección que promueve el desarrollo de usos sostenibles, novedosos y rentables de recursos de labiodiversidad, mediante investigaciones científicas desarrolladas en colaboración con otras entidadesacadémicas estatales y del sector privado, nacionales y extranjeras.
La interrelación de las actividades y productos generados por cada una de las unidades del INBio es lo que hapermitido el éxito alcanzado y sobretodo el proveer valiosos aportes y beneficios a la sociedad costarricense.
Prospección de la biodiversidad
En el campo de la bioprospección el Instituto ha sido considerado pionero y líder, sobretodo en los aspectostécnicos, legales y contractuales que llevan al establecimiento de una alianza Norte-Sur de beneficio mutuo yque involucra acceso, uso y distribución de beneficios. Este proceso se inició en INBio en 1990 cuando noexistía un marco de política y de legislación nacional o internacional que le diera sustento. Lo que medió enla primera e histórica negociación con la empresa Merck & Co, fue la lógica y el apego a la justicia y la equidad.Desde ese momento INBio opta por compartir en partes iguales los beneficios económicos que pudieran sur-
Facilitating conservation and sustainable use of biological diversity. Abstracts of poster presentations on protected areas and technology transfer and cooperation at the ninth meeting of the Subsidiary Body on Scientific, Technical and Technological Advice.
52
18
007419 CDG Interieur_no9 11/3/03 6:12 PM Page 52
gir con el Estado y por asegurar que los beneficios futuros por el uso de los recursos de la biodiversidad se des-tinen en su totalidad al conocimiento y a la conservación de la biodiversidad (Gámez, 1999).
En las negociaciones con la industria INBio actúa como socio en los proyectos de investigación conjunta y nocomo proveedor o suplidor de materia prima. Es decir, procura agregar valor a los elementos biológicos que uti-liza, el cual debe ser reconocido por el socio al momento de establecer el esquema de distribución de beneficios.
Para el acceso a los elementos genéticos y bioquímicos de la biodiversidad costarricense y para garantizar unajusta y equitativa distribución de beneficios, INBio desarrolla sus actividades de investigación con la industriasólo en áreas protegidas del Estado, cumpliendo para esto con los requisitos exigidos por la legislación vigenteen esta materia. La sostenibilidad del recurso se garantiza negociando con la industria un acceso limitado entiempo y en cantidad de muestras a evaluar.
La compensación por el acceso a la biodiversidad costarricense comprende tanto beneficios monetarios comono monetarios. Los contratos establecen que las empresas interesadas deben cubrir los costos de investigacióny compensar monetariamente al Estado y al INBio, pagando un 10 % del presupuesto de investigación que seestablezca, para ser trasladado directamente al fondo de parques nacionales; así como un porcentaje deregalías y de “pagos por avance” (“milestone payments”) que se repartirían en partes iguales entre INBio y elMINAE, en caso de que un producto avance en la línea de investigación o de que llegue al mercado. Esto conel objetivo de continuar la investigación en este campo y de seguir apoyando la gestión del Estado en la con-servación de la biodiversidad costarricense. Al año 2002 cerca de $ 600 000 se han trasladado al MINAE pro-ducto del 10 % de los presupuestos de investigación establecidos.
Transferencia de tecnología para la conservación y el desarrollo
El equipamiento, la transferencia de tecnología y el entrenamiento del recurso humano han sido los benefi-cios no monetarios más importantes que ha recibido el INBio, producto de su relación con la industria.Actualmente se cuenta con laboratorios de investigación debidamente equipados para ejecutar proyectos deprospección química y biotecnológica, incluso para realizar un “highthrouthput screening” para la búsquedade compuestos químicos a partir de fracciones obtenidas de diversas muestras de la biodiversidad. Además laindustria ha capacitado a los investigadores y ha transferido al Instituto tecnologías propietarias, amparadas acláusulas de confidencialidad, que pueden ser utilizadas por el INBio para el desarrollo de sus propios proyec-tos.
Actualmente la tecnología transferida y el know how están siendo aprovechados para el desarrollo de proyec-tos de investigación con la pequeña industria nacional, cuyo objetivo es obtener productos innovadores o conmayor valor agregado a partir de la biodiversidad costarricense. El esquema contractual de acceso y uso es elmismo que se sigue con las compañías extranjeras, de modo que se garantice la sostenibilidad por el usoeconómico del recurso y que haya una justa compensación monetaria para las áreas protegidas que proveyeronel recurso. De esta forma se está apoyando el desarrollo nacional, se están abriendo oportunidades a la indus-tria costarricense y se está contribuyendo a la conservación de la biodiversidad.
Las tecnologías transferidas están permitiendo también generar un mayor conocimiento científico sobre losusos potenciales de los recursos genéticos y bioquímicos del país, información esencial para continuar intere-sando a la industria en el mercado de productos naturales y para brindar a la sociedad nacional e internacionallos elementos necesarios para que sigan conservando su biodiversidad, no sólo por su valor de existencia sinopor la fuente de riqueza y bienestar que representa.
ReferenciasGámez, R. 1999. De biodiversidad, gentes y utopías: reflexiones en los 10 años del INBio, Santo Domingo deHeredia, INBio. 144 p
53
Technology Transfer
007419 CDG Interieur_no9 11/3/03 6:12 PM Page 53
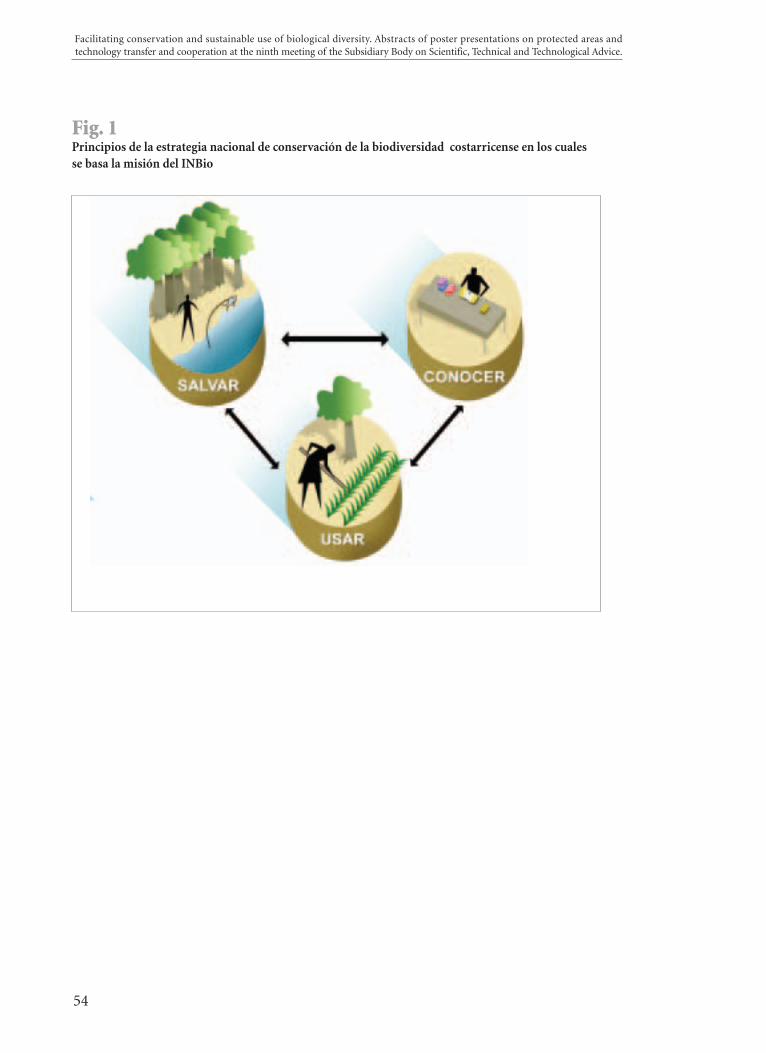
Fig. 1 Principios de la estrategia nacional de conservación de la biodiversidad costarricense en los cuales se basa la misión del INBio
Facilitating conservation and sustainable use of biological diversity. Abstracts of poster presentations on protected areas and technology transfer and cooperation at the ninth meeting of the Subsidiary Body on Scientific, Technical and Technological Advice.
54
007419 CDG Interieur_no9 11/3/03 6:12 PM Page 54
BIOSYSTEMATICS IN FORESTRY: INVASIVE PESTS AND NATIVE BIODIVERSITY
J. T. Huber*, P.T. DangNatural Resources Canada, Canadian Forest Service,K.W. Neatby Building, 960 Carling Ave., Ottawa, ON, Canada, K1A 0C6
Keywords: alien species, biodiversity, biosystematics, quarantine
INTRODUCTION
The introduction of alien species is inevitable, because of today’s worldwide trade and travel. Some aliensbecome invasive, with devastating impacts on our forests, native species, and economy in general (Scudder2002). But how do you know whether a species is foreign? A comprehensive knowledge of the native fauna andflora of a country is a prerequisite to answering this question. A quarantine program may prevent entry ofundesirable exotic organisms, but its effectiveness depends on rapid, accurate, and reliable identification ofintroductions. Taxonomists, supported by comprehensive biological collections and associated literature, areessential to providing reliable species identifications.
BIOSYSTEMATICS
Biosystematics is the science of identifying, describing, naming, classifying, and cataloguing species.Taxonomic research provides basic support for various biological disciplines by providing the correct scien-tific name of a species (Huber et al. 2002). Identifications provided by qualified taxonomists are used inforestry, agriculture, and human and animal health to retrieve the relevant biological literature on a species.The biology of undescribed species may be correctly inferred by comparison with known species, providedthat the biological classifications are well founded. If the classifications are poorly founded, i.e., species arenot grouped together correctly into higher categories such as genera, then incorrect inferences will be madeabout the biology of new species that are misclassified with species whose biology is known.
BIOLOGICAL COLLECTIONS
Biological Collections such as the Canadian National Collection of Insects and Arachnids in Ottawa, and col-lections held by the Canadian Forest Service, Universities, and Provincial Museums are essential for biosys-tematics research. The specimens and associated data are the physical evidence (voucher specimens) for aspecies occurrence at any given time and place and are used to validate taxonomic, faunistic and ecologicalresearch, including the earliest collection records of alien species (Wheeler 2003).
CONCLUSIONS
Sufficient numbers of biosystematists (taxonomists) are needed if a county wishes to understand its fauna andflora sufficiently to use wisely and slow down or prevent alien introductions, and communicate accurately theresults of biological research by using the correct scientific name for the organisms studied. Loss of taxonomicexpertise compromizes a country’s ability to make accurate species identifications, and reduces the effective-ness of quarantine programs. Canada needs to improve its biosystematics capacity to help meet the challengeof reducing or preventing alien species introductions.
55
Technology Transfer
19
007419 CDG Interieur_no9 11/3/03 6:12 PM Page 55
ReferencesHuber, J.T., S. Darbyshire, J. Bissett and R.G. Foottit. 2002. Taxonomy and biological control in BiologicalControl Programmes in Canada, 1981-2000, edited by P.G. Mason and J.T. Huber. CABI Publishing,Wallingford, UK.Scudder, G.G.E. 2002. Alien invaders: an introduction in Alien invaders in Canada’s waters, wetlands andforests, edited by R. Claudi, P. Nantel and E. Muckle-Jeffs. Natural Resources Canada, Canadian Forest Service,Ottawa, Canada.Wheeler,T.A. 2003. The role of voucher specimens in validating faunistic and ecological research. BiologicalSurvey of Canada (Terrestrial Arthropods, document series No. 9. Canadian Museum of Nature, Ottawa,Canada.
Facilitating conservation and sustainable use of biological diversity. Abstracts of poster presentations on protected areas and technology transfer and cooperation at the ninth meeting of the Subsidiary Body on Scientific, Technical and Technological Advice.
56
007419 CDG Interieur_no9 11/3/03 6:12 PM Page 56
CANADIAN COLLECTION OF FUNGAL CULTURES (CCFC/DAOM)MICROBIAL GENETIC RESOURCES
C.E. Babcock*Agriculture and Agri-Food Canada, Environmental Health Program, BiodiversityK.W. Neatly Building, 930 Carling Ave., Ottawa, Ontario, Canada K1A 0C6
Keywords: biodiversity, microbial genetic resources, lyophilization, cryopreservation
Introduction
The Canadian Collection of Fungal Cultures (CCFC/DAOM) maintains @12,000 plant pathogenic and woodrotting fungal cultures representing @3,000 species from the major fungal groups. This diversity is the foun-dation for research and development activities such as: plant disease resistance, identification of plantpathogens, identificaiton of invasive species, allergenic organisims, screening and bioprospecting studies, sur-veys, development of identification keys, and molecular species characterization.
The collection serves as a primary Canadian repository for research strains and functions as a gene bank forthis microbial genetic resource. Authenticated isolates are available for distribution to researchers throughoutthe world working in agriculture, forestry, medicine, private industry and biotechnology. The CCFC is sup-ported by the taxonomic expertise of one of the largest groups of systematic mycologists in North America,with internationally recognized expertise in most major taxonomic groups. Research is concentrated on solv-ing agricultural problems.
Preservation
Living cultures are preserved for the long term by at least two methods of preservation following internation-al standards and protocols. Cryopreservation provides the most reliable method of preservation for most fun-gal strains although certain organisms such as the mycorrhizal fungi are fastidious and do not survive thismethod well. The CCFC grows plate cultures, cuts plugs and uses a 10 % glycerol solution as the cryoprotec-tant. Vials are then stored in the vapour phase (-160o) of liquid nitrogen (-196o) and recovered as required.Sporulating strains are also preserved using lyophilization (freeze-drying) techniques using a 20 % skim milksolution as the protectant. Ampoules are easy to store and safe to distribute to clients. The collection main-tains extensive living slants and oil tube collections as alternate methods and backup. All methods are aimedat longevity and the stabilization of genetic properties.
Client Services
The collection provides advice and consulting services for all clients, information on preservation protocolsand deposition facilities. The collection takes a leadership role for Microbial Genetic Resources in Canada andinternationally. The CCFC/DAOM is involved jointly with the Centraalbureau voor Schimmelcultures,Utrecht, Netherlands in a yearly fungal identification course (http://res2.agr.gc.ca/ecorc/fungi/04_e.htm)available to anyone. The collection database of strains is available for viewing on the internet at the followingsite:( http://sis.agr.gc.ca/brd/ccc/). In conjunction with the culture collection, the Mycology group (6researchers) provides an identification service. Fees are charged based on the request.
57
20
Technology Transfer
007419 CDG Interieur_no9 11/3/03 6:12 PM Page 57
Facilitating conservation and sustainable use of biological diversity. Abstracts of poster presentations on protected areas and technology transfer and cooperation at the ninth meeting of the Subsidiary Body on Scientific, Technical and Technological Advice.
58
21NEW APPROACHES TO TECHNOLOGY TRANSFERAT THE AAFC PLANT COLLECTION
Paul Catling, Jacques Cayouette, Gisèle Mitrow, Lynn BlackBiodiversity, Environmental Health, Agriculture and Agri-Food Canada, Saunders Bldg., CentralExperimental Farm, Ottawa, Ontario K1A 0C6, Canada
Keywords: plant collection databases, GIS, internet mapping
Introduction
The AAFC (Agriculture and Agri-Food Canada) plant collection (i.e. the vascular plant herbarium) includesone million dried plant specimens each with collection information including location, date, habitat andsometimes much additional information. Most specimens are from Canada (62%) and Eurasia (20%).
The collection is part of an international network that serves in three general areas: (1) Classification - It is anessential resource for research on naming and determining the relationships between plants because it con-tains many thousands of exemplary specimens including over 4000 type specimens used to define names pre-cisely. (2) Identification - Expert identifications of vascular plants require reference to material in the collec-tion to help assess variation, understand identification characteristics and provide correctly identified exam-ples. Accurate identifications are needed for biocontrol research, pest management, international trade withregard to commodity contaminants, protecting Canada’s borders against possible importation of noxiousweeds, enforcement of federal regulations, and for health and safety. (3) Information - Applying import andexport regulations, developing crops, protecting biodiversity, and many other activities require information onoccurrence and characteristics of plants. The major client is Agriculture and Agri-Food Canada representing35 %. Other clients include researchers studying plant classification in universities and museums worldwiderepresenting 25 %, other Canadian Federal Agencies representing 20% and provincial and territorial agricul-ture and natural resource departments representing 20%.
Each year the herbarium processes approximately 600 information requests, and 2000-3000 identifications.There are about 1000 users annually. Information has been provided through the xeroxing or transcribing ofspecimen label data, which is time-consuming and often has to be done without any data improvement.
New approaches to technology transfer
Increased requirements for information from the collection to support biodiversity protection have stimulat-ed the development of some new and more efficient approaches to technology transfer. These new approach-es include: (1) development of databases, (2) use of GIS (Geographic Information System) technology and(3) improved access to label data using the internet. Each has had the effect of providing new information notreadily available in the collection itself, adding value to the collection and providing this information in anefficient manner. The effect is to increase the use of biological data in research and policy development.
Collection databases
The current database projects of the collection include (1) the Mustard Family (including Canola and relatedcrops) in Canada in connection with crop development, germplasm protection and classification, (2) the cat-alogue of over 4000 type specimens which are an essential reference for the correct application of plant namesand the definition and identification of plant species, (3) invasive alien species in connection with control,monitoring and predicting spread, (4) native Canadian crop relatives in connection with germplasm protec-tion in situ and ex situ, and (5) graminoid plants of the Northwest Territories and Yukon in connection with
007419 CDG Interieur_no9 11/3/03 6:12 PM Page 58
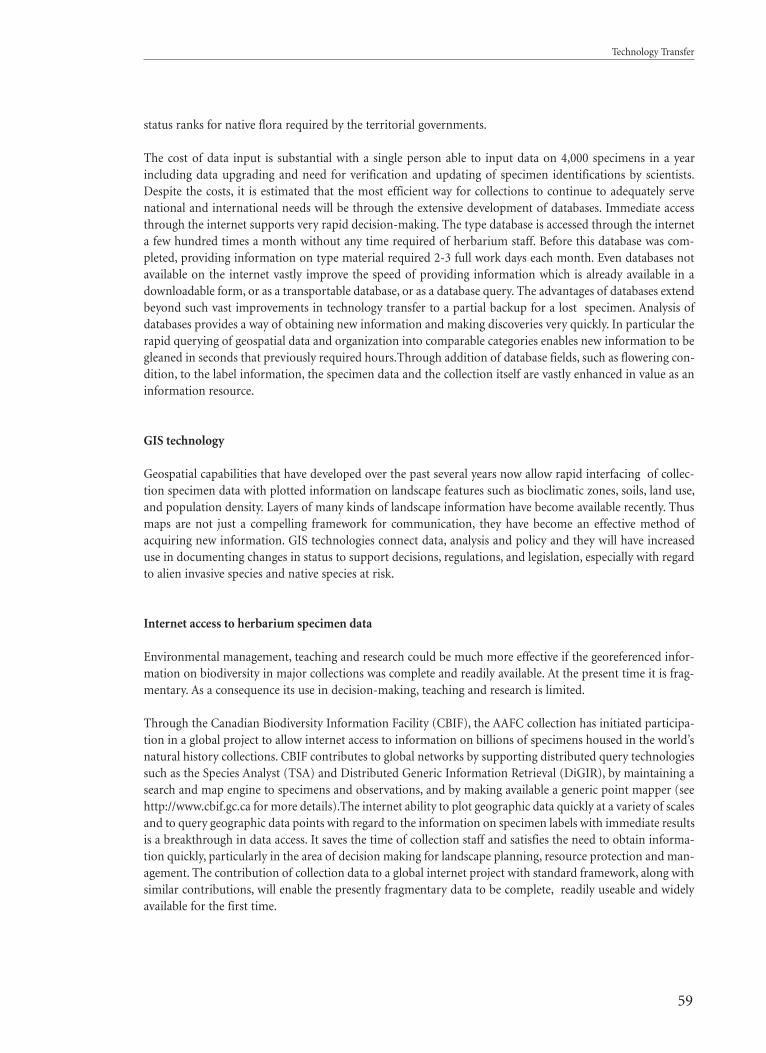
59
Technology Transfer
status ranks for native flora required by the territorial governments.
The cost of data input is substantial with a single person able to input data on 4,000 specimens in a yearincluding data upgrading and need for verification and updating of specimen identifications by scientists.Despite the costs, it is estimated that the most efficient way for collections to continue to adequately servenational and international needs will be through the extensive development of databases. Immediate accessthrough the internet supports very rapid decision-making. The type database is accessed through the interneta few hundred times a month without any time required of herbarium staff. Before this database was com-pleted, providing information on type material required 2-3 full work days each month. Even databases notavailable on the internet vastly improve the speed of providing information which is already available in adownloadable form, or as a transportable database, or as a database query. The advantages of databases extendbeyond such vast improvements in technology transfer to a partial backup for a lost specimen. Analysis ofdatabases provides a way of obtaining new information and making discoveries very quickly. In particular therapid querying of geospatial data and organization into comparable categories enables new information to begleaned in seconds that previously required hours.Through addition of database fields, such as flowering con-dition, to the label information, the specimen data and the collection itself are vastly enhanced in value as aninformation resource.
GIS technology
Geospatial capabilities that have developed over the past several years now allow rapid interfacing of collec-tion specimen data with plotted information on landscape features such as bioclimatic zones, soils, land use,and population density. Layers of many kinds of landscape information have become available recently. Thusmaps are not just a compelling framework for communication, they have become an effective method ofacquiring new information. GIS technologies connect data, analysis and policy and they will have increaseduse in documenting changes in status to support decisions, regulations, and legislation, especially with regardto alien invasive species and native species at risk.
Internet access to herbarium specimen data
Environmental management, teaching and research could be much more effective if the georeferenced infor-mation on biodiversity in major collections was complete and readily available. At the present time it is frag-mentary. As a consequence its use in decision-making, teaching and research is limited.
Through the Canadian Biodiversity Information Facility (CBIF), the AAFC collection has initiated participa-tion in a global project to allow internet access to information on billions of specimens housed in the world’snatural history collections. CBIF contributes to global networks by supporting distributed query technologiessuch as the Species Analyst (TSA) and Distributed Generic Information Retrieval (DiGIR), by maintaining asearch and map engine to specimens and observations, and by making available a generic point mapper (seehttp://www.cbif.gc.ca for more details).The internet ability to plot geographic data quickly at a variety of scalesand to query geographic data points with regard to the information on specimen labels with immediate resultsis a breakthrough in data access. It saves the time of collection staff and satisfies the need to obtain informa-tion quickly, particularly in the area of decision making for landscape planning, resource protection and man-agement. The contribution of collection data to a global internet project with standard framework, along withsimilar contributions, will enable the presently fragmentary data to be complete, readily useable and widelyavailable for the first time.
007419 CDG Interieur_no9 11/3/03 6:12 PM Page 59
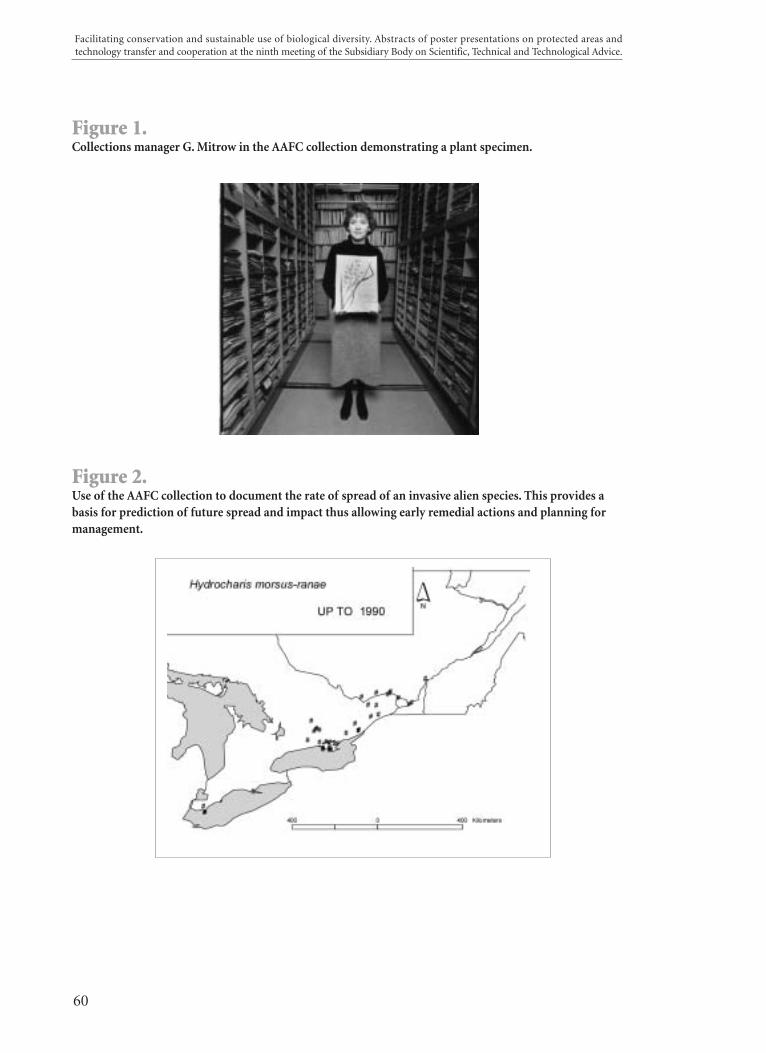
Facilitating conservation and sustainable use of biological diversity. Abstracts of poster presentations on protected areas and technology transfer and cooperation at the ninth meeting of the Subsidiary Body on Scientific, Technical and Technological Advice.
60
Figure 2.Use of the AAFC collection to document the rate of spread of an invasive alien species. This provides abasis for prediction of future spread and impact thus allowing early remedial actions and planning formanagement.
Figure 1.Collections manager G. Mitrow in the AAFC collection demonstrating a plant specimen.
007419 CDG Interieur_no9 11/3/03 6:12 PM Page 60
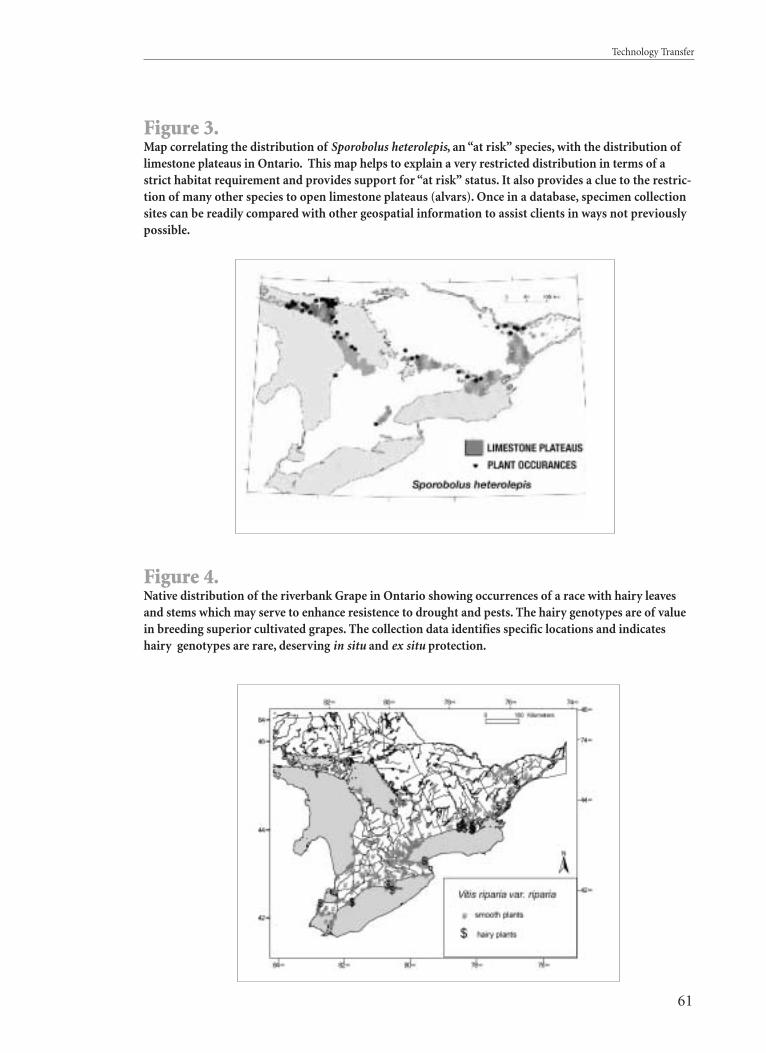
61
Technology Transfer
Figure 3.Map correlating the distribution of Sporobolus heterolepis, an ‘‘at risk” species, with the distribution oflimestone plateaus in Ontario. This map helps to explain a very restricted distribution in terms of astrict habitat requirement and provides support for ‘‘at risk” status. It also provides a clue to the restric-tion of many other species to open limestone plateaus (alvars). Once in a database, specimen collectionsites can be readily compared with other geospatial information to assist clients in ways not previouslypossible.
Figure 4.Native distribution of the riverbank Grape in Ontario showing occurrences of a race with hairy leavesand stems which may serve to enhance resistence to drought and pests. The hairy genotypes are of valuein breeding superior cultivated grapes. The collection data identifies specific locations and indicateshairy genotypes are rare, deserving in situ and ex situ protection.
007419 CDG Interieur_no9 11/3/03 6:12 PM Page 61
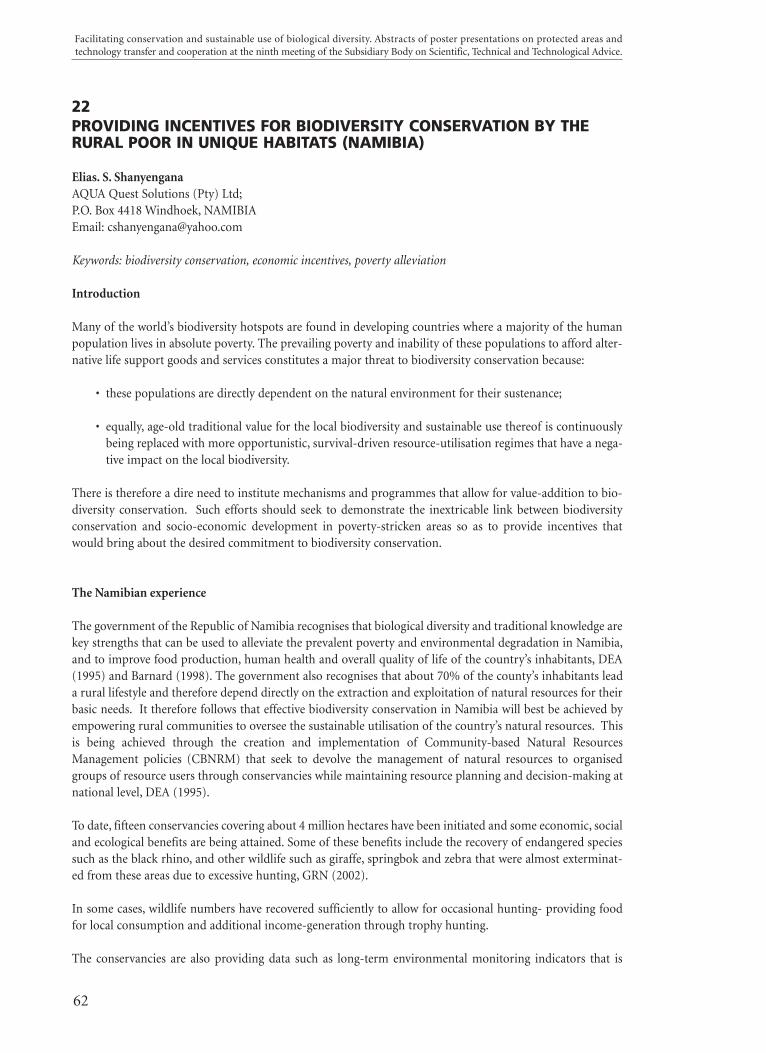
PROVIDING INCENTIVES FOR BIODIVERSITY CONSERVATION BY THERURAL POOR IN UNIQUE HABITATS (NAMIBIA)
Elias. S. ShanyenganaAQUA Quest Solutions (Pty) Ltd;P.O. Box 4418 Windhoek, NAMIBIAEmail: [email protected]
Keywords: biodiversity conservation, economic incentives, poverty alleviation
Introduction
Many of the world’s biodiversity hotspots are found in developing countries where a majority of the humanpopulation lives in absolute poverty. The prevailing poverty and inability of these populations to afford alter-native life support goods and services constitutes a major threat to biodiversity conservation because:
• these populations are directly dependent on the natural environment for their sustenance;
• equally, age-old traditional value for the local biodiversity and sustainable use thereof is continuouslybeing replaced with more opportunistic, survival-driven resource-utilisation regimes that have a nega-tive impact on the local biodiversity.
There is therefore a dire need to institute mechanisms and programmes that allow for value-addition to bio-diversity conservation. Such efforts should seek to demonstrate the inextricable link between biodiversityconservation and socio-economic development in poverty-stricken areas so as to provide incentives thatwould bring about the desired commitment to biodiversity conservation.
The Namibian experience
The government of the Republic of Namibia recognises that biological diversity and traditional knowledge arekey strengths that can be used to alleviate the prevalent poverty and environmental degradation in Namibia,and to improve food production, human health and overall quality of life of the country’s inhabitants, DEA(1995) and Barnard (1998). The government also recognises that about 70% of the county’s inhabitants leada rural lifestyle and therefore depend directly on the extraction and exploitation of natural resources for theirbasic needs. It therefore follows that effective biodiversity conservation in Namibia will best be achieved byempowering rural communities to oversee the sustainable utilisation of the country’s natural resources. Thisis being achieved through the creation and implementation of Community-based Natural ResourcesManagement policies (CBNRM) that seek to devolve the management of natural resources to organisedgroups of resource users through conservancies while maintaining resource planning and decision-making atnational level, DEA (1995).
To date, fifteen conservancies covering about 4 million hectares have been initiated and some economic, socialand ecological benefits are being attained. Some of these benefits include the recovery of endangered speciessuch as the black rhino, and other wildlife such as giraffe, springbok and zebra that were almost exterminat-ed from these areas due to excessive hunting, GRN (2002).
In some cases, wildlife numbers have recovered sufficiently to allow for occasional hunting- providing foodfor local consumption and additional income-generation through trophy hunting.
The conservancies are also providing data such as long-term environmental monitoring indicators that is
Facilitating conservation and sustainable use of biological diversity. Abstracts of poster presentations on protected areas and technology transfer and cooperation at the ninth meeting of the Subsidiary Body on Scientific, Technical and Technological Advice.
62
22
007419 CDG Interieur_no9 11/3/03 6:12 PM Page 62
being used in national and international state-of-environment programmes such as the ObservatoriesNetwork of Namibia (EONN), Environmental Monitoring and Indicators Network (EMIN) and the GlobalTerrestrial Observation System (GTOS).
The way forward
Our experiences indicate that even the poorest rural communities can be motivated to conserve biodiversity.However, it is worth noting that most of the conservancies are still dependent on government and aid agen-cies for their operational capital, and that, meaningful long-term self-sustaining biodiversity conservationwould require a more diversified approach. This is currently being investigated in some parts of the countrysuch as the Namib Desert where we are investigating potential natural resources-based industries such asdevelopment of pharmaceuticals and other evolution-based technologies to supplement the income derivedfrom tourism, Shanyengana (2002 & 2003). The latter includes, among others, the development of water col-lecting equipment that is based on the adaptations of fog-collecting beetles and development of pharmaceu-ticals and other health products from extracts of local species such as Acanthosicyos horridus. All the abovehave potential to enable realisation of a multi-million dollar natural resources-based industry similar to someof the local species such Hoodia and Devil’s claw (Harpagophytum procumbens) that are currently beingexploited in a three billion and multi-million US dollar pharmaceutical industry, respectively.
In conclusion, our experiences indicate that biodiversity conservation in poor and marginalized areas requiresa people-centred approach that goes beyond income-derivation through eco-tourism. The development ofviable products and services from local natural resources through e.g. biotechnology provides immense poten-tial for creating incentives for biodiversity conservation and as such, should be given due consideration in theCBD’s programmes.
ReferencesBarnard, P. (1998). Biological diversity in Namibia: a country study.Namibian National Biodiversity Task Force, Ministry of Environment & Tourism, Windhoek, 332 pp. http://www.dea.met.gov.na.DEA (1995). Namibia’s policy on wildlife management, utilisation and tourism in communal areas. Ministry of Environment and Tourism, 23 pp.http://www.dea.met.gov.na.GRN (2002). Biodiversity and development in Namibia: Namibia’s ten-year strategic plan of action for sustainable development through biodiversity conservation, 2001-2010. Barnard P., Shikongo S. T., Zeidler J (eds.).National Biodiversity Task Force, Windhoek, 137 pp. http://www.dea.met.gov.na.Shanyengana, E. S. (2002). Groundwater chemistry and supplementary sources offresh water in arid environments- salinization, desalination & fog collection.PhD Thesis, University of Stellenbosch. Stellenbosch, South Africa. 186 pp.Shanyengana, E.S. (2003). Development of an open-air museum & Biotechnology in the Namib Desert.Ministry of Environment & Tourism. Windhoek.
63
Technology Transfer
007419 CDG Interieur_no9 11/3/03 6:12 PM Page 63
TECHNOLOGY TRANSFER: DIALOGUE BETWEEN SCIENCE AND POLICY
European Platform for Biodiversity Research Strategy (EPBRS)Represented by Horst Korn, Chairman of the EPBRS Steering Committee,Federal Agency for Nature Conservation, Isle of Vilm, Germany
Keywords: research, policy, Europe, dialogue, strategy
The European Platform for Biodiversity Research Strategy
is a forum for scientists and policy makers to ensure that research contributes to halting the loss of biodiver-sity by 2010. It aims to achieve this by:
• focusing on aspects of science policy and science issues relevant to wider policy,• identifying policies for which biodiversity science knowledge is important,• identifying significant gaps in knowledge that reduce the effectiveness of policy,• identifying resulting issues of major importance for biodiversity science policy,• establishing priorities for biodiversity research in Europe, and• promoting communication between scientists and end-users.
Objectives
The EPBRS strives to promote strategically important biodiversity research with concern for reduction of bio-diversity loss, conservation, protection, restoration and sustainable use of the components of biodiversity. TheEPBRS is an important element in the European Research Area (ERA) for biodiversity research.
The EPBRS aims to
• be the main European forum at which prominent natural and social scientists, influential policymak-ers and stakeholders exchange views and combine forces to plan, implement and exploit the researchneeded to underpin the conservation and sustainable use of components of biodiversity in Europe.
• be widely known and its activities widely appreciated by the science community and by the sciencepolicy makers of the EU and Associated States.
• produce agreements that collectively have a significant impact in the Commission, Council andParliament on the debate on the follow-up to the 6th framework programme.
• provide helpful science policy advice for the European delegations to the CBD and to the CouncilEnvironment working group (biodiversity).
• be the natural contact point for relevant organisations with a similar mandate outside Europe, andshould provide support for a co-ordinated European contribution to international programmes suchas ICSU and initiatives such as the Millennium Ecosystem Assessment.
• be the “European voice in biodiversity science policy.”
Context
The main policy frameworks for the EPBRS are common EU policies including in particular science researchpolicy, the EU Biodiversity Strategy, the 6th Environmental Action Programme, the EU environmentalDirectives (notably the Birds, Habitats and Water Directives), the Convention on Biological Diversity and thevarious national biodiversity action plans.
Facilitating conservation and sustainable use of biological diversity. Abstracts of poster presentations on protected areas and technology transfer and cooperation at the ninth meeting of the Subsidiary Body on Scientific, Technical and Technological Advice.
64
23
007419 CDG Interieur_no9 11/3/03 6:12 PM Page 64
65
Technology Transfer
Status
The bi-annual EPBRS meetings are linked to the EU presidency. The EPBRS keeps close connections with theEU institutions, national governments, and relevant international bodies.
Since its inception in 1999, the agendas of the meetings of the EPBRS balance science and policy. The organ-isers of the successive meetings of the EPBRS set the work programme. The themes addressed in the meetingshave been chosen because they are of particular relevance to the organising country, while also having aEuropean relevance. In some cases they were also chosen because they were important items on forthcomingCBD meetings.
It approaches its topics with the aim of identifying scientific work of policy relevance that is needed to sup-port the implementation of the CBD, the EU Directives on Birds and Habitats, EU and national BiodiversityAction plans, NATURA 2000, and the EC Clearing House Mechanism.
The recommendations of successive meetings focus on the thematic issue under discussion.
The EPBRS encourages and helps to establish national biodiversity platforms for research strategy, whoseforms and functions are adapted to the needs and administrative landscape of their country. In this activityit is strongly supported by the thematic network “BioPlatform,” funded by the European Community to pro-vide scientific, logistic and financial support to the activities of the EPBRS.
Membership, organisation and funding
Membership in the EPBRS is open to all states that participate in the EU Framework Programmes and to theEuropean Union Institutions. The EPBRS is also open by invitation to organisations whose mission involvesthem in biodiversity science policy at a European scale. Other stakeholders are invited to participate at appro-priate meetings.
The EPBRS Steering Committee is responsible for discussing the political and strategic orientation and activ-ities of the EPBRS, and for making suggestions to the EPBRS to help to improve the relevance and impact ofits work.
Contacting the EPBRS
The EPBRS can be contacted via the Secretary of its Steering Committee Dr Martin Sharman Head of Sector BiodiversityResearch DG DI-4 Biodiversity and Ecosystems European CommissionLX46 2/74 B-1049 Brussels, BelgiumFax: (+32) 2 299 57 55Phone: (+32) 2 295 97 98email: [email protected]
007419 CDG Interieur_no9 11/3/03 6:12 PM Page 65
Facilitating conservation and sustainable use of biological diversity. Abstracts of poster presentations on protected areas and technology transfer and cooperation at the ninth meeting of the Subsidiary Body on Scientific, Technical and Technological Advice.
66
24TECHNOLOGY TRANSFER FOR PLANT CONSERVATION
Clare Tenner,* Colin Clubbe, Justin Moat, Margaret Ramsay, Paul Smith Royal Botanic Gardens, Kew, Richmond, Surrey, TW9 3AB, UK
Keywords: GIS, micropropagation, seed banking, herbaria
Introduction
The Royal Botanic Gardens, Kew is a scientific, amenity and educational organisation devoted to increasingknowledge and public understanding of plant and fungal diversity - how it came to be, what its current statusis, how it can be conserved for future generations, and how it can be used in sustainable ways for human ben-efit. It is recognised globally as a unique centre of excellence for the study of plant diversity - based on its largecollections and a breadth and depth of staff expertise built up over almost 250 years. A primary business aimis to support the activities of partners, both in the UK and overseas, in conservation and sustainable use ofbiodiversity through capacity building, joint research, training and advice. Last year almost 9 000 staff dayswere spent in contact with partners on these activities.
RBG Kew has developed a number of technologies for the conservation and sustainable use of, and the equi-table sharing of benefits arising from, biodiversity. These are mostly skills, processes, standards and methods- otherwise known as ‘soft’ technologies. For example, Kew’s Micropropagation Unit was set up in 1974 topropagate plants that are endangered or difficult to grow conventionally. The techniques used include in vitrolaboratory propagation and cryogenic storage techniques. Expertise has been developed in growing over 3000species, many of which have never been studied before. The techniques are being used to rapidly multiply indi-viduals and for re-establishment of species in the wild.
Facilitating Technology Tranfer
RBG Kew uses a range of means to facilitate technology transfer from simply providing advice by telephoneor email, to training courses, joint research and formal capacity building partnerships. Answering requests forhelp is a significant element: the Kew Micropropagation Unit answers about 500 enquiries for information andtechnical advice every year.
Training courses are an important vehicle for technology transfer. In particular, Kew has developed fourInternational Diploma courses covering: Herbarium Techniques, Plant Conservation Techniques, BotanicGarden Management, and Botanic Garden Education. 300 students from 98 countries have participated inthese courses. RBG Kew staff also organise and participate in a range of training courses, workshops and jointfieldwork trips, both in the UK and overseas. Whenever possible, RBG Kew hosts visitors in its departmentsfor informal, on-the-job training. Collaborative research, including the supervision on MSc and PhD researchis another important activity.
One important lesson that RBG Kew has learnt is the value of long-term commitment to technology transferactivities. For this reason contact is maintained with and between all trainees that have completed theInternational Diploma courses. In addition, in a number of cases technology transfer and co-operation com-mitments have been formalised into long-term partnerships, including the signing of agreements with part-ner organisations outlining activities and obligations for each party. In cases where the partnership involvesthe collecting and transfer of genetic resources, it is based on a legally-binding access and benefit sharingagreement which mentions elements of technology transfer and technological co-operation as benefits to beshared. This is the case for all partners of the Millennium Seed Bank Project.
007419 CDG Interieur_no9 11/3/03 6:12 PM Page 66
Madagascar Case Study
Kew scientists have worked in Madagascar for over 20 years, working with local botanists and conservationorganisations to catalogue plant species and identify conservation priorities. Over this time strong, long-termcollaborations have formed with a number of local institutes, in particular the Parc Botanique et Zoologiquede Tsimbazaza (PBZT), the University of Antananarivo, Silo National de Graines Forestières (SNGF), theAntsokay Arboretum, the Projet de Structuration des Filières Horticoles (PSFH) and the national parks serv-ice (ANGAP). Many of these partnerships are formalised under mutually agreed project documents outliningresponsibilities, including for technology transfer activities. Kew has signalled its intention to continue work-ing with these organisation by registering itself as a recognised NGO in Madagascar through the signing of anAccord de Siege. Kew also maintains a permanent office in Madagascar, and employs 7 full time staff there.
Work has particularly focused on those plant groups where Kew has greatest expertise: the palms, legumes,Rubiaceae (Coffea), orchids and succulents. Much of the activity has aimed at building capacity in taxonom-ic research, the propagation of plants and in the conservation management of living plant collections. Forexample work on orchids with PBZT set up a nursery and developed appropriate propagation methods forthreatened orchids. More recently, provision of equipment and expertise to PSFH will enable local micro-propagation of threatened orchid species, eventually leading to species being reintroduced to the wild.
Similarly the Spiny Forest Conservation project aimed to develop the Antsokay Arboretum (the best collec-tion of endemic succulent plants in Madagascar) and conserve the surrounding areas of spiny forest. Underthis project the arboretum owner took part in the Kew Plant Conservation Techniques course. In addition ahorticultural specialist spent six months at the arboretum training local staff in propagation techniques. Otheraspects were the improvement of the accessions database, and the building and establishment of a referenceherbarium.
Kew Geographical Information Systems (GIS) experts and taxonomists are currently working with ANGAP,SNGF and other partners to develop novel applications of this technology. GIS is being used to map the veg-etation of the country, and to interpret and analyse plant distribution using herbarium records. The latter partis particularly exciting as it involves the establishment of large databases of distributions within key plantgroups using records from herbaria in Antananarivo, Paris, Missouri and Kew. A suite of programmes havebeen developed to interpret this data in a way that has never been possible before, and to an extent that Kewmay now be considered a leader in this field. The results are being made available directly to SNGF to planseed collecting expeditions for the Millennium Seed Bank Project. The vegetation mapping project will pro-duce up to date digital and paper versions of a new vegetation map for Madagascar, based on latest technolo-gy. Training workshops in its use will be given to all participating organisations.
Through SNGF, Madagascar is one of 16 partner countries of Kew’s Millennium Seed Bank Project. This part-nership is based on a legally binding access and benefit sharing agreement, which includes training, technicalexpertise and scientific study as benefits to be shared. As part of this project, one trainee from SNGF has ben-efited from formal and informal training at the Millennium Seed Bank.
Since 2001, RBG Kew has funded and supported (through co-supervision and research attachments) threePhDs and four Masters students in Madagascar.
67
Technology Transfer
007419 CDG Interieur_no9 11/3/03 6:12 PM Page 67
INDEX BY AUTHOR
BBabcock, C.E. 57Black, L. 58Boyle, M. 17
CCañadas, A. 30, 39Catling, P. 58Cayouette, J. 58Chape, S. 37Chettri, N. 23Clubbe, C. 66
DDang, P.T. 55Deke, O. 43Dziedzioch, C. 10
EEl Alqamy, H. 27
FFargey, P. 17Fazel, Asghar M. 21
GGaliano, E. F. 37Guevara, A.L.F 52
HHarrison, J. 37Harrison, T. 17Harwood, J. 27Houston, B. 17Huber, J. T. 55
JJapp, N. C. 15
KKirychuk, B. 50Klein, L. 37Korn, H. 33, 64
LLucas, N. 25Luciuk, G. 17
MMichalsky, S. 17Mitrow, G. 58Moat, J. 66Mukherjee, A. 35Mukherjee, N. 35
NNenadic, O. 30, 39
PPaulsch, A. 10Pinborg, U. 37Plän, T. 10
RRamsay, M. 66Richard, D. 37Roekaerts, M. 37
SSancho, J. 15Shanyengana, E. S. 62Sharma, E. 23Smith, P. 66Sutter, G. 17
TTenner, C. 66Tohidi, Mahboobe 21
VVerdinelli, M. A. 15Verdinelli, M. E. P. 15Vincent, S.G 20Vincent, S.G.P. 20
WWeins, T. 50
Facilitating conservation and sustainable use of biological diversity. Abstracts of poster presentations on protected areas and technology transfer and cooperation at the ninth meeting of the Subsidiary Body on Scientific, Technical and Technological Advice.
68
007419 CDG Interieur_no9 11/3/03 6:12 PM Page 68
INDEX BY KEYWORDS
AAgriculture 50Alien Species 55Antropic Pressure 15Assessment 25
BBest Management Practices 50Biodiversity 21, 55, 57Biodiversity Conservation 17, 35, 62Bioprospección 52Biosystematics 55BMPs 50
CCanada 50Classification of Slope 39Coastal Zone 15Compensación 52Conservation 20, 21, 23, 46Conservation Lands 13Cooperation 46Coordination 37Correspondence Analysis 30Corridors 23Cryopreservation 57
DData Flow 37Demographic Structure 30Designated Areas 37Dialogue 64Dorcas Gazelle 27Dynamic of Land Use 30
EEconomic Incentives 62Ecosystems 25Eco-Tourism and Public-Private-Government - NGO Partnership 35Ecuador 30, 39Europe 33, 64
FFramework 25
GGIS 39, 58, 66Global Environmental Facility 43Grassland 17Grassroots Institution Building 35
HHarmonization 37Herbaria 66Hot Spot 20
IImplementation 10Indigenous Knowledge 35International Coordination 43Internet Mapping 58Iran 21
LLand Tenure 30Lyophilization 57
MManagement of Biodiversity 10Marine Fish Larvae 20Marine Protected Area 20Microbial Genetic Resources 57Micropropagation 66 Monitoring of Land Use 39Mountain 46
PParticipatory 23People- Protected Area Interface 35Plant Collection Databases 58Policy 33, 64Population Trend 27Poverty Alleviation 62Protected Area 10, 21, 23, 43
QQuarantine 55
RRanching 17Rangeland 17Rangeland Biodiversity 50Reporting 37Research 33, 64
69
Protected Areas
007419 CDG Interieur_no9 11/3/03 6:12 PM Page 69
SScale 25Seed Banking 66Spatial Model 39Statistical Power 27Strategy 33, 64Sustainability 46Sustainable Forest Management 13Sustainable Livelihoods 35Sustainable Use 10
TTransboundary 23, 46Transfer 43Transferencia de tecnología 52
UUso Sostenible 52
WWeb of conservation lands 13Well-Being 25Working Landscape 17
ZZimbros’ Reservation 15
Facilitating conservation and sustainable use of biological diversity. Abstracts of poster presentations on protected areas and technology transfer and cooperation at the ninth meeting of the Subsidiary Body on Scientific, Technical and Technological Advice.
70
007419 CDG Interieur_no9 11/3/03 6:12 PM Page 70
The Convention on Biological Diversity (CBD), negotiated under the auspices of theUnited Nations Environment Programme (UNEP), was adopted in 1992 and entered intoforce in 1993. Its aims are the conservation of biological diversity, the sustainable use ofbiological resources, and the fair and equitable sharing of benefits arising from the use ofgenetic resources. One of the major challenges facing the Convention on BiologicalDiversity is the communication of research results in a way that provides the policy makers,their advisors, the scientific community and other stakeholders with helpful insights
Major factors leading to biodiversity loss are habitat loss and degradation, invasive alienspecies, overuse of resources and pollution. Due to the complexity of these factors, variousapproaches and strategies are being used to reduce biodiversity loss. All, however, require thebest available scientific information that allows the development and implementation ofsound management strategies.
The goal of the CBD Technical Publications Series is to contribute to the dissemination ofup-to-date and accurate information on selected topics that are important for the conser-vation of biological diversity, the sustainable use of its components and the equitablesharing of its benefits. A large and growing body of evidence has clearly established theneed to disseminate synthesis publications relevant to CBD objectives and selected reportspresented at CBD meetings.
The Technical Publications Series is intended to:• Foster scientific and technical cooperation;• Improve communication between the Convention and the scientific community;• Increase awareness of current biodiversity-related problems and concerns; and• Facilitate widespread and effective use of the growing body of scientific and technical information on conserving and using biological diversity.
The CBD Technical Publications Series comes at a time when the international communi-ty through the Conference of the Parties to the Convention has committed itself toachieving tangible results in all aspects of the sustainable management of biological diversityfor social and economic purposes. We therefore believe that this series will be useful to thebroader scientific community and those concerned with biodiversity management.