Embed Size (px)
Citation preview
ABC/IAC Biofuels Workshop
may 24
Bioenergy in Brazil.
Prof. José Goldemberg

Coal140.7 EJ(27.29%)
Oil171.8 EJ(33.34%)
Gas105.2 EJ(20.42%)
Nuclear31.1 EJ(6.03%)
Large hydro10.6 EJ(2.06%)
Small hydro1.2 EJ
(0.24%)
Marine0.01EJ(0.00%)
Solar0.6 EJ
(0.11%)
Wind0.8 EJ
(0.16%)
Geothermal3.3 EJ
(0.64%)
Modern biomass9.4 EJ
(1.83%)
Traditional biomass40.7 EJ(7.90%)
World Primary Energy Supply (2008)
Shares of 516 EJ
New Renewables 15.33 EJ (2.96%)
Modern Renewables 25.94 EJ (5.03%)
Modern
BiomassEJ %
Bioethanol 1.7 0.32
Biodiesel 0.5 0.09
Bioelectricity 3.6 0.70
Heat 3.7 0.71

5
Problemas com o atual sistema
energético
i. Equidade
ii. Exaustão das reservas
iii. Segurança de abastecimento
iv. Impactos ambientais
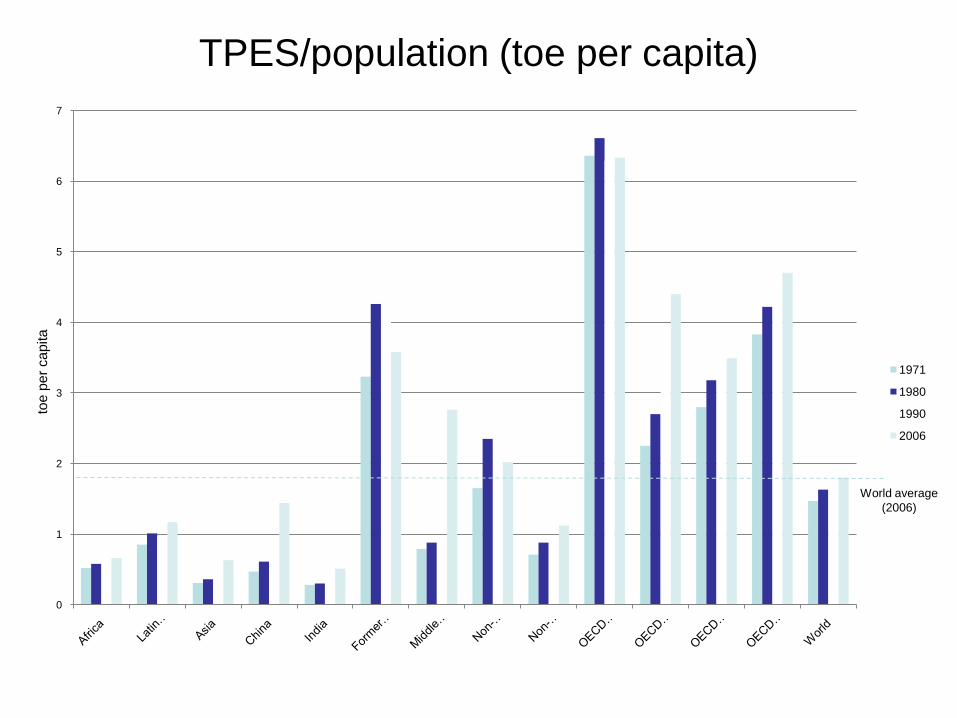
0
1
2
3
4
5
6
7
toe
pe
r ca
pita
1971
1980
1990
2006
World average
(2006)
TPES/population (toe per capita)
FACING THE CHALLENGE
• Energy efficiency at the source and end-uses
• Renewables
• New technologies


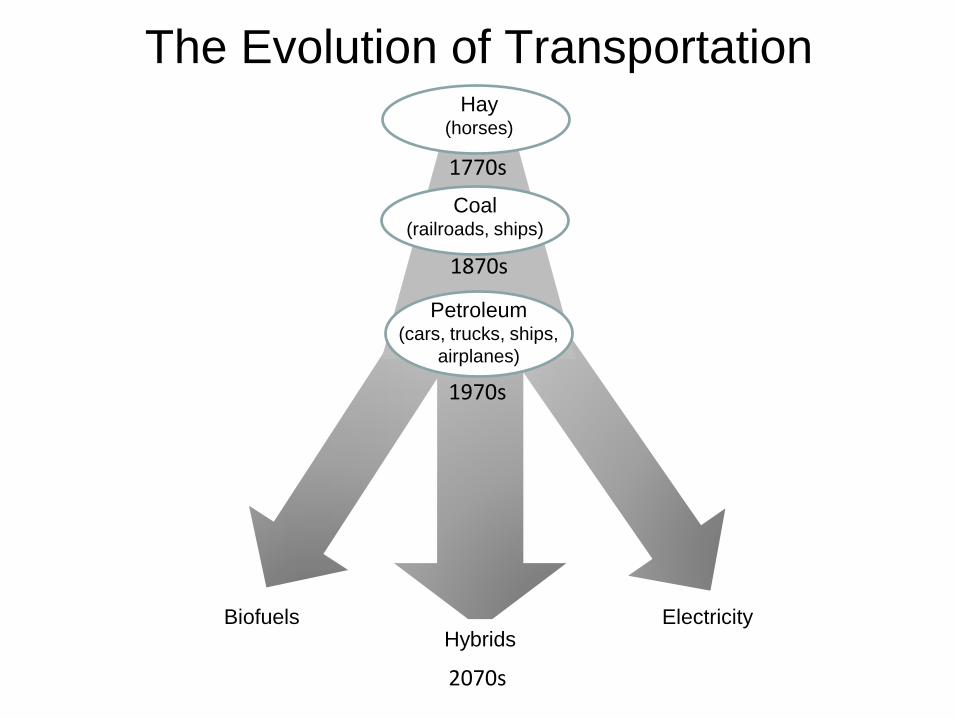
Hay(horses)
BiofuelsHybrids
Electricity
1770s
1870s
1970s
The Evolution of Transportation
Coal(railroads, ships)
Petroleum(cars, trucks, ships,
airplanes)
2070s

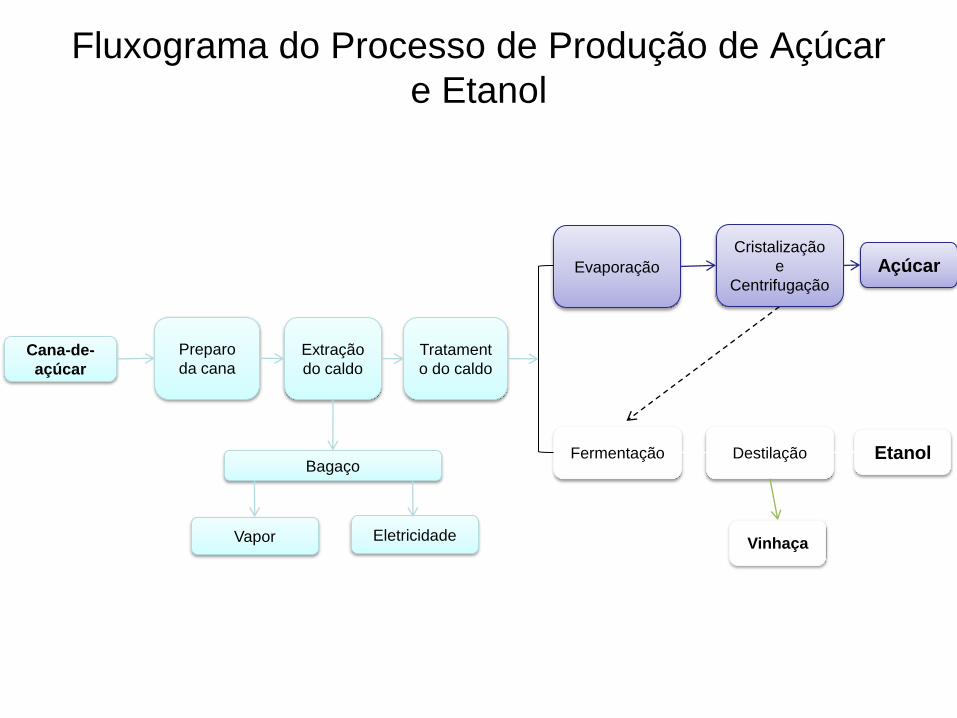
Fluxograma do Processo de Produção de Açúcar
e Etanol
Cristalização
e
CentrifugaçãoEvaporação Açúcar
Fermentação Destilação Etanol
Vinhaça
Preparo
da cana
Extração
do caldo
Tratament
o do caldo
Bagaço
Vapor Eletricidade
Cana-de-
açúcar
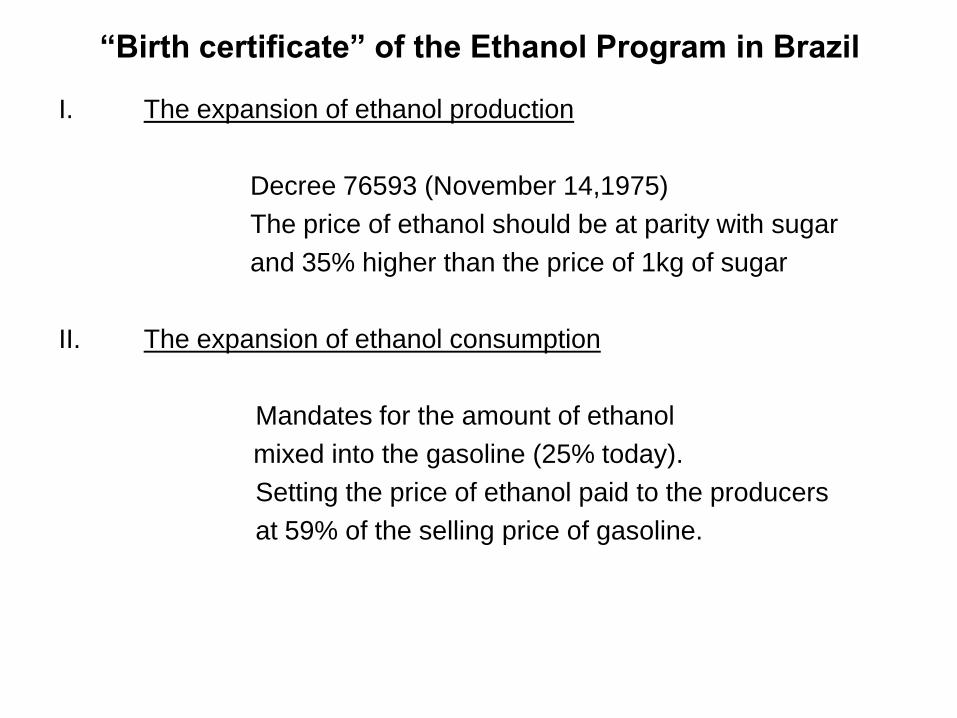
“Birth certificate” of the Ethanol Program in Brazil
I. The expansion of ethanol production
Decree 76593 (November 14,1975)
The price of ethanol should be at parity with sugar
and 35% higher than the price of 1kg of sugar
II. The expansion of ethanol consumption
Mandates for the amount of ethanol
mixed into the gasoline (25% today).
Setting the price of ethanol paid to the producers
at 59% of the selling price of gasoline.
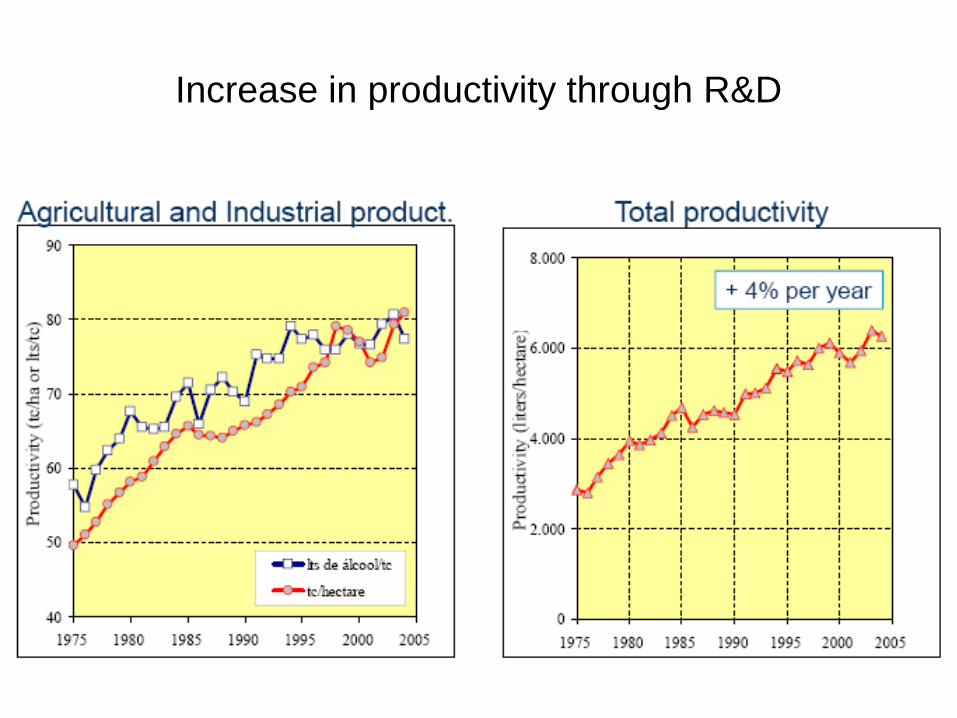
Increase in productivity through R&D
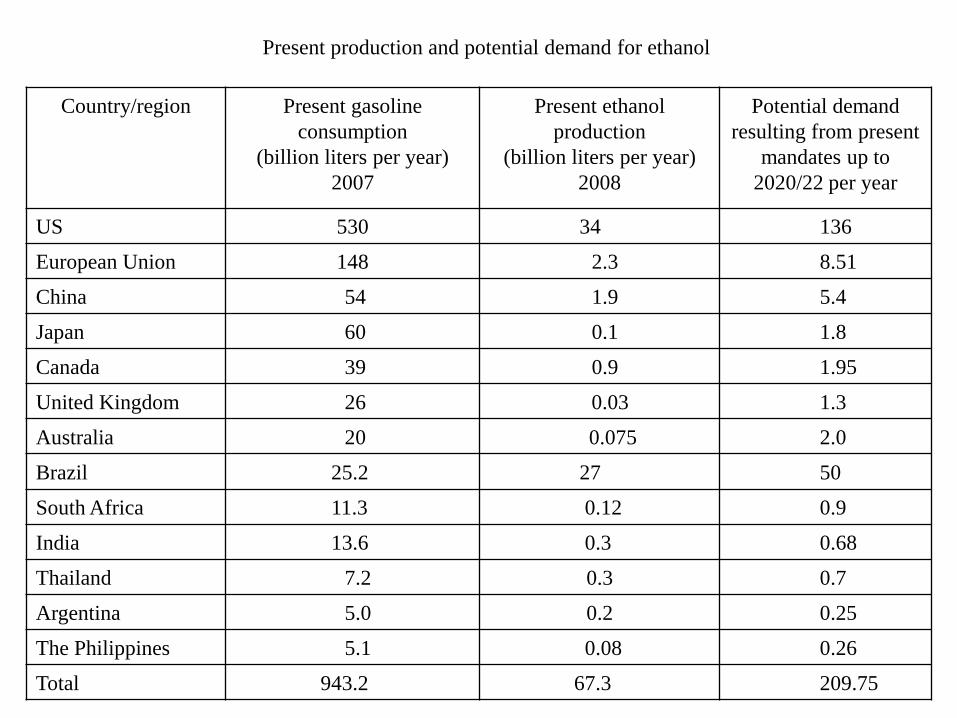
Country/region Present gasoline
consumption
(billion liters per year)
2007
Present ethanol
production
(billion liters per year)
2008
Potential demand
resulting from present
mandates up to
2020/22 per year
US 530 34 136
European Union 148 2.3 8.51
China 54 1.9 5.4
Japan 60 0.1 1.8
Canada 39 0.9 1.95
United Kingdom 26 0.03 1.3
Australia 20 0.075 2.0
Brazil 25.2 27 50
South Africa 11.3 0.12 0.9
India 13.6 0.3 0.68
Thailand 7.2 0.3 0.7
Argentina 5.0 0.2 0.25
The Philippines 5.1 0.08 0.26
Total 943.2 67.3 209.75
Present production and potential demand for ethanol
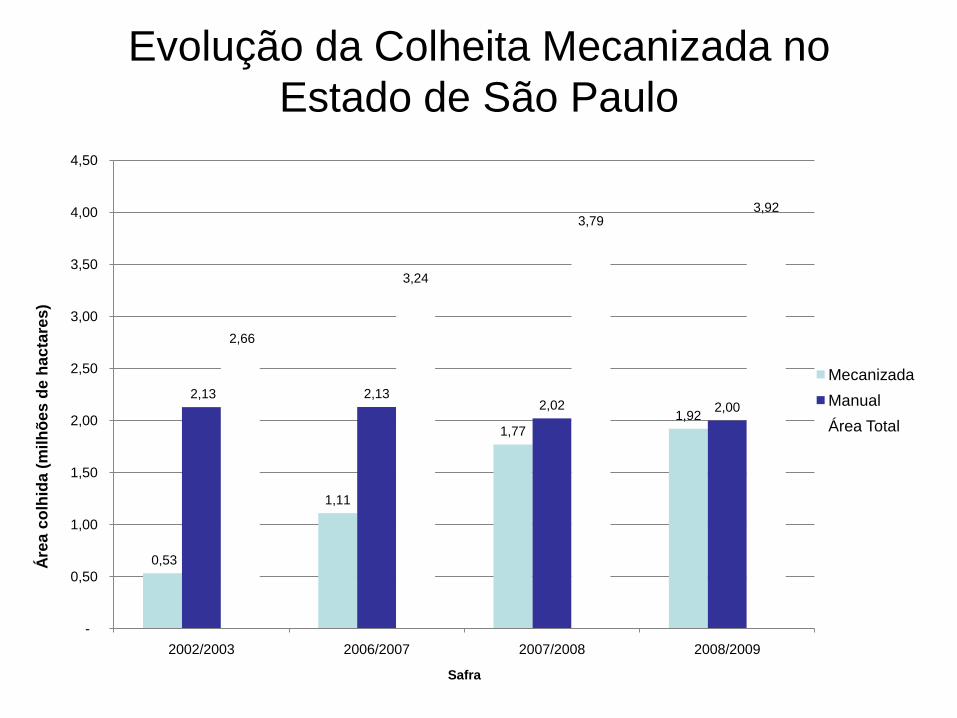
0,53
1,11
1,77
1,92
2,13 2,132,02 2,00
2,66
3,24
3,793,92
-
0,50
1,00
1,50
2,00
2,50
3,00
3,50
4,00
4,50
2002/2003 2006/2007 2007/2008 2008/2009
Áre
a c
olh
ida
(m
ilh
õe
s d
e h
ac
tare
s)
Safra
Mecanizada
Manual
Área Total
Evolução da Colheita Mecanizada no
Estado de São Paulo


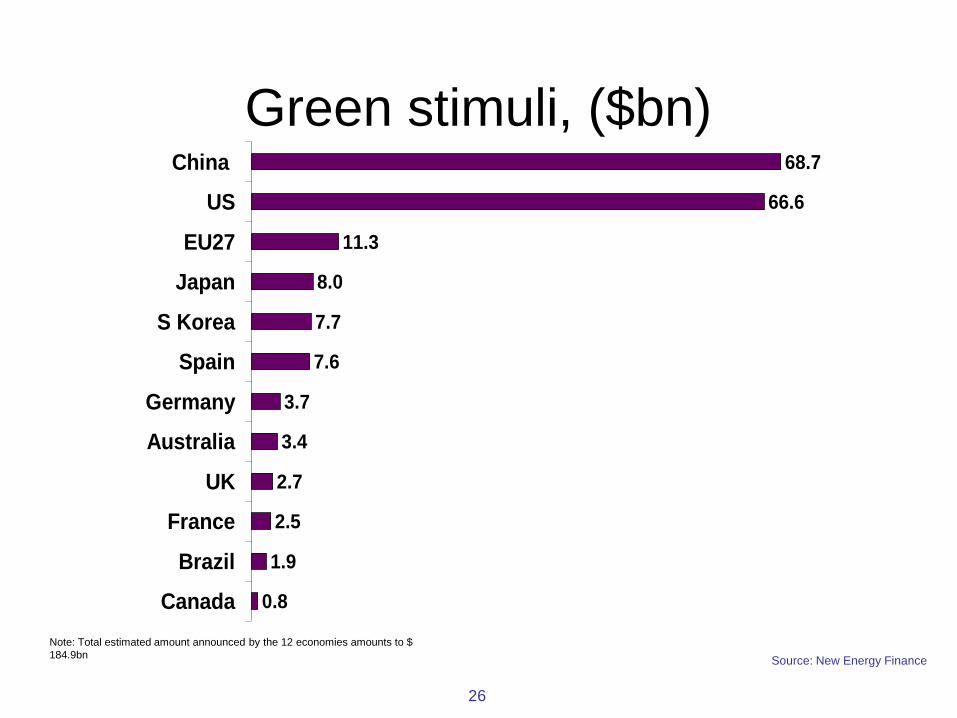
26
Source: New Energy Finance
Green stimuli, ($bn)
0.8
1.9
2.5
2.7
3.4
3.7
7.6
7.7
8.0
11.3
66.6
68.7
Canada
Brazil
France
UK
Australia
Germany
Spain
S Korea
Japan
EU27
US
China
Note: Total estimated amount announced by the 12 economies amounts to $
184.9bn

27
Source: New Energy Finance
Sector break down of global green
stimuli
36%
3%
19%5%
12%
26%
Efficiency Transportation All Renewables
Unspecified r&D grid