Embed Size (px)
Citation preview

1978
National Cancer Institute CARCINOGENESIS Technical Report Series No. 110
BIOASSAY OF IODOFORM
FOR POSSIBLE CARCINOGENICITY
CAS No. 75-47-8
NCI-CG-TR-110
U.S. DEPARTMENT OF HEALTH, EDUCATION, AND WELFARE Public Health Service National Institutes of Health


BIDASSAY OF
IODOFORM
FOR POSSIBLE CARCINOGENICITY
Carcinogenesis Testing Program Division of Cancer Cause and Prevention
National Cancer Institute National Institutes of Health
Bethesda, Maryland 20014
U.S. DEPARTMENT OF HEALTH, EDUCATION, AND WELFARE Public Health Service
National Institutes of Health
DHEW Publication No. (NIH) 78-1365


REPORT ON THE BIOASSAY OF IODOFORM FOR POSSIBLE CARCINOGEN1CITY
CARCINOGENESIS TESTING PROGRAM DIVISION OF CANCER CAUSE AND PREVENTION
NATIONAL CANCER INSTITUTE, NATIONAL INSTITUTES OF HEALTH
FOREWORD: This report presents the results of the bioassay of iodoform conducted for the Carcinogenesis Testing Program, Division of Cancer Cause and Prevention, National Cancer Institute (NCI), National Institutes of Health, Bethesda, Maryland. This is one of a series of experiments designed to determine whether selected chemicals have the capacity to produce cancer in animals. Negative results, in which the test animals do not have a significantly greater incidence of cancer than control animals, do not necessarily mean the test chemical is not a carcinogen because the experiments are conducted under a limited set of circumstances. Positive results demonstrate that the test chemical is carcinogenic for animals under the conditions of the test and indicate a potential risk to man. The actual determination of the risk to man from animal carcinogens requires a wider analysis.
CONTRIBUTORS: This bioassay of iodoform was conducted by Hazleton Laboratories America, Inc., Vienna, Virginia, initially under direct contract to the NCI and currently under a subcontract to Tracer Jitco, Inc., prime contractor for the NCI Carcinogenesis Testing Program.
The experimental design was determined by the NCI Project Officers, Dr. J. H. Weisburger (1,2) and Dr. E. K. Weisburger (1). The principal investigators for the contract were Dr. M. B. Powers (3), Dr. R. W. Voelker (3), Dr. W. A. Olson (3,4) and Dr. W. M. Weatherholtz (3). Chemical analysis was performed by Dr. C. L. Guyton (3,5) and the analytical results were reviewed by Dr. N. Zimmerman (6); the technical supervisor of animal treatment and observation was Ms. K. J. Petrovics (3).
Histopathologic examinations were performed by Dr. D. A. Banas (3) and Dr. R. H. Habermann (3) and reviewed by Dr. R. W. Voelker (3) at the Hazleton Laboratories America, Inc., and the diagnoses included in this report represent the interpretation of these pathologists. Histopathology findings and reports were reviewed by Dr. R. L. Schueler (7).
Compilation of individual animal survival, pathology, and summary tables was performed by EG&G Mason Research Institute (8); the statistical analysis was performed by Mr. W. W. Belew (6) and Dr. J.
iii

R. Joiner (7), using methods selected for the Carcinogenesis Testing Program by Dr. J. J. Gart (9).
This report was prepared at METREK, a Division of The MITRE Corporation (6) under the direction of the NCI. Those responsible for this report at METREK are the project coordinator, Dr. L. W. Thomas (6), task leader Dr. M. R. Kornreich (6), senior biologist Ms. P. Walker (6), biochemist Mr. S. C. Drill (6), and technical editor Ms. P. A. Miller (6). The final report was reviewed by members of the participating organizations.
The following other scientists at the National Cancer Institute were responsible for evaluating the bioassay experiment, interpreting the results, and reporting the findings: Dr. K. C. Chu (1), Dr. C. Cueto, Jr. (1), Dr. J. F. Douglas (1), Dr. D. G. Goodman (1), Dr. R. A. Griesemer (1), Dr. H. A. Milman (1), Dr. T. W. Orme (1), Dr. R. A. Squire (1,10), Dr. J. M. Ward (1), and Dr. C. E. Whitmire (1).
1. Carcinogenesis Testing Program, Division of Cancer Cause and Prevention, National Cancer Institute, National Institutes of Health, Bethesda, Maryland.
2. Now with the Naylor Dana Institute for Disease Prevention, American Health Foundation, Hamtnon House Road, Valhalla, New York.
3. Hazleton Laboratories America, Inc., 9200 Leesburg Turnpike, Vienna, Virginia.
4. Now with the Center for Regulatory Services, 2347 Paddock Lane, Reston, Virginia.
5. Now with Rhodia, Inc., 23 Belmont Drive, Somerset, New Jersey.
6. The MITRE Corporation, METREK Division, 1820 Dolley Madison Boulevard, McLean, Virginia.
7. Tracor Jitco, Inc., 1776 East Jefferson Street, Rockville, Maryland.
8. EG&G Mason Research Institute, 1530 East Jefferson Street, Rockville, Maryland.
9. Mathematical Statistics and Applied Mathematics Section, Biometry Branch, Field Studies and Statistics Program, Division of Cancer Cause and Prevention, National Cancer Institute, National Institutes of Health, Bethesda, Maryland.
IV

10. Now with the Division of Comparative Medicine, Johns Hopkins University, School of Medicine, Traylor Building, Baltimore, Maryland.


SUMMARY
A bioassay for possible carcinogenicity of technical-grade iodoform was conducted using Osborne-Mendel rats and B6C3F1 mice. lodoform in corn oil was administered by gavage, at either of two dosages, to groups of 50 male and 50 female animals of each species. Administration of the chemical occurred 5 days a week, for a period of 78 weeks, followed by an observation period of 34 weeks for rats and 13 or 14 weeks for mice. The high and low time-weighted average dosages of iodoform were, respectively, 142 and 71 mg/kg/day for male rats, 55 and 27 mg/kg/day for female rats, and 93 and 47 mg/kg/day for male and female mice. For each species, 20 animals of each sex were placed on test as vehicle controls. These animals were gavaged with pure corn oil at the same rate as the high dose group of the same sex. Twenty animals of each sex were placed on test as untreated controls for each species. These animals were not intubated.
A significant positive association between dosage and mortality was observed in male rats but not in female rats or in mice of either sex. Adequate numbers of animals in all groups survived sufficiently long to be at risk from late-developing tumors.
No statistical significance could be attributed to the incidences of any neoplasms in rats or mice of either sex when compared to their respective controls.
Under the conditions of this bioassay, no convincing evidence was provided for the carcinogenicity of iodoform in Osborne-Mendel rats or B6C3F1 mice.
VII


TABLE OF CONTENTS
Page
I. INTRODUCTION 1
II. MATERIALS AND METHODS 3
A. Chemicals 3 B. Dosage Preparation 3 C. Animals 3 D. Animal Maintenance 5 E. Gastric Intubation 6 F. Selection of Initial Dose Levels 7 G. Experimental Design 8 H. Clinical and Histopathologic Examinations 12 I. Data Recording and Statistical Analyses 13
III. CHRONIC TESTING RESULTS: RATS 18
A. Body Weights and Clinical Observations 18 B. Survival 20 C. Pathology 20 D. Statistical Analyses of Results 22
IV. CHRONIC TESTING RESULTS: MICE 31
A. Body Weights and Clinical Observations 31 B. Survival 31 C. Pathology 34 D. Statistical Analyses of Results 35
V. DISCUSSION 42
VI. BIBLIOGRAPHY 43
APPENDIX A SUMMARY OF THE INCIDENCE OF NEOPLASMS IN RATS TREATED WITH IODOFORM A-l
APPENDIX B SUMMARY OF THE INCIDENCE OF NEOPLASMS IN MICE TREATED WITH IODOFORM B-l
APPENDIX C SUMMARY OF THE INCIDENCE OF NONNEOPLASTIC LESIONS IN RATS TREATED WITH IODOFORM C-l
APPENDIX D SUMMARY OF THE INCIDENCE OF NONNEOPLASTIC LESIONS IN MICE TREATED WITH IODOFORM D-l
ix

Figure Number
1
2
Table Number
Al
LIST OF ILLUSTRATIONS
Page
CHEMICAL STRUCTURE OF IODOFORM 4
GROWTH CURVES FOR IODOFORM CHRONIC STUDY RATS 19
SURVIVAL COMPARISONS OF IODOFORMSTUDY RATS
CHRONIC 21
GROWTH CURVES FOR IODOFORM CHRONIC STUDY MICE 32
SURVIVAL COMPARISONS OF IODOFORM CHRONIC STUDY MICE 33
LIST OF TABLES
Page
DESIGN SUMMARY FOR OSBORNE-MENDEL RATS— IODOFORM GAVAGE EXPERIMENT 9
DESIGN SUMMARY FOR B6C3F1 MICE—IODOFORM GAVAGE EXPERIMENT 10
ANALYSES OF THE INCIDENCE OF PRIMARY TUMORS AT SPECIFIC SITES IN MALE RATS TREATED WITH IODOFORM WHICH SURVIVED AT LEAST 52 WEEKS 23
ANALYSES OF THE INCIDENCE OF PRIMARY TUMORS AT SPECIFIC SITES IN FEMALE RATS TREATED WITH IODOFORM 26
ANALYSES OF THE INCIDENCE OF PRIMARY TUMORS AT SPECIFIC SITES IN MALE MICE TREATED WITH IODOFORM 36
ANALYSES OF THE INCIDENCE OF PRIMARY TUMORS AT SPECIFIC SITES IN FEMALE MICE TREATED WITH IODOFORM 39
SUMMARY OF THE INCIDENCE OF NEOPLASMS IN MALE RATS TREATED WITH IODOFORM A-3
X

LIST OF TABLES (Concluded)
Table Number Page
A2 SUMMARY OF THE INCIDENCE OF NEOPLASMS IN FEMALE RATS TREATED WITH IODOFORM A-6
Bl SUMMARY OF THE INCIDENCE OF NEOPLASMS IN MALE MICE TREATED WITH IODOFORM B-3
B2 SUMMARY OF THE INCIDENCE OF NEOPLASMS IN FEMALE MICE TREATED WITH IODOFORM B-6
Cl SUMMARY OF THE INCIDENCE OF NONNEOPLASTIC LESIONS IN MALE RATS TREATED WITH IODOFORM C-3
C2 SUMMARY OF THE INCIDENCE OF SONNEOPLASTIC LESIONS IN FEMALE RATS TREATED WITH IODOFORM C-7
Dl SUMMARY OF THE INCIDENCE OF NONNEOPLASTIC LESIONS IN MALE MICE TREATED WITH IODOFORM D-3
D2 SUMMARY OF THE INCIDENCE OF NONNEOPLASTIC LESIONS IN FEMALE MICE TREATED WITH IODOFORM D-8
xi


I. INTRODUCTION
lodoform (NCI No. C04568), a halogenated alkane with antiseptic
and anti-infective properties, was selected for bioassay by the Na
tional Cancer Institute because of its use in pharmaceutical prepa
rations and its structural similarity to methyl iodide, which has
produced sarcomas in BD rats (Druckrey et al., 1970; Preussmann,
1968), and to chloroform, a compound which has been found to induce
hepatomas in NLC mice (Eschenbrenner, 1945; Rudali, 1967).
The Chemical Abstracts Service (CAS) Ninth Collective Index
(1977) name for this compound is triiodo-methane.
In the past, iodoform was used by humans chiefly as a topical
anti-infective (Windholz, 1976). The mild antibacterial action of
the compound results from its gradual release of elemental iodine
(Goodman and Gilman, 1970). Use of iodoform for the dressing of
wounds was fairly extensive but in recent times it has been replaced
almost altogether by more effective antiseptic agents (Goodman and
Gilman, 1970).
lodoform may still be used in veterinary medicine as an anti
septic and also as a disinfectant on superfical lesions and in the
female reproductive tract (Windholz, 1976).
Specific production figures for iodoform are not available,
lodoform is produced in two grades: technical or nonmedicinal; and
* The CAS registry number is 75-48-8.

N.F. (National Formulary). Of these, only technical-grade iodoform
is produced in commercial quantities (greater than 1000 pounds or
$1000 in value annually) in the United States (Stanford Research
Institute, 1976).
Since iodoform is no longer used to any great extent in the
treatment of humans, the potential for exposure is greatest for
workers in iodoform production facilities and for those persons using
the compound for research purposes.
Iodoform is considered moderately toxic (Sax, 1975); the lowest
published toxic dose in humans is 114 mg/kg (U.S. Department of
Health, Education, and Welfare, 1976). Poisoning, which is often the
result of absorption of iodoform through a wound, produces vomiting,
rapid pulse, sometimes accompanied by a slight fever, and all degrees
of cerebral depression or excitation (Gosselin et al., 1976). Absorp
tion of large amounts of the compound may result in depression of the
central nervous system, and damage to the kidneys, liver, and heart
(Irish, 1967).

II. MATERIALS AND METHODS
A. Chemicals
One batch of technical-grade iodoform (Figure 1) (triiodomethane)
was purchased from Merck and Company, Inc., Rahway, New Jersey.
Chemical analysis was performed by Hazleton Laboratories America,
Inc., Vienna Virginia. The experimentally determined melting point
was 115°C, while the literature value is 120°C (Windholtz, 1976).
The results of analysis via reaction with silver nitrate and titration
with thiocyanate also suggested a compound of extremely high purity.
Throughout this report the term iodoform is used to represent
this technical-grade material.
B. Dosage Preparation
Fresh solutions of iodoform in Duke's®corn oil (S. F. Sauer
.Company, Richmond, Virginia) were prepared weekly, sealed, and stored
in dark bottles at 1°C. These iodoform solutions were considered
generally stable for ten days under the indicated storage conditions.
The concentrations of iodoform in corn oil ranged from 1.8 to 9.0
percent for the rat bioassay and 0.6 to 1.0 percent for the mouse
bioassay.
C. Animals
Two animal species, rats and mice, were used in the carcinogen
icity bioassay. The Osborne-Mendel rat was selected on the basis
of a comparative study of the tumorigenic responsiveness to carbon

I
H-— C—I
I
FIGURE 1 CHEMICAL STRUCTURE OF IODOFORM

tetrachloride of five different strains of rats (Reuber and Glover,
1970). The B6C3F1 mouse was selected because it has been used by the
NCI for carcinogenesis bioassays and has proved satisfactory in this
capacity.
Rats and mice of both sexes were obtained through contracts of
the Division of Cancer Treatment, National Cancer Institute. The
Osborne-Mendel rats were procured from the Battelle Memorial Insti
tute, Columbus, Ohio, and the B6C3F1 mice were obtained from the
Charles River Breeding Laboratories, Inc., Wilmington, Massachusetts.
Upon receipt, animals were quarantined for at least 10 days, observed
for visible signs of disease or parasites, and assigned to the various
treated and control groups.
D. Animal Maintenance
All animals were housed by species in temperature- and humidity-
controlled rooms. The temperature range was 20° to 24°C and the
relative humidity was maintained between 45 and 55 percent. The
air conditioning system in the laboratory provided filtered air at a
rate of 12 to 15 complete changes of room air per hour. Fluorescent
lighting was provided on a 12-hour-daily cycle.
The rats were individually housed in suspended galvanized-steel
wire-mesh cages with perforated floors, while mice were housed in
groups of ten in solid-bottom, polypropylene cages equipped with non
woven filter tops. Sanitized cages with fresh bedding (Sanichips ,
Pinewood Sawdust Company, Moonachie, New Jersey) were provided once

each week for mice. Rats received sanitized cages with no bedding
with the same frequency. Food hoppers were changed and heat-
sterilized once a week for the first 10 weeks and once a month there
after. Fresh heat-sterilized glass water bottles and sipper tubes
(*F?) were provided three times a week. Food (Wayne Lab-Blox , Allied
Mills, Inc., Chicago, Illinois) and water were available ad libitum.
The iodoform-dosed and vehicle control rats were housed in the
same room as other rats intubated with 3-sulfolene (77-79-2) and
hexachloroethane (67-72-1). The untreated control rats were housed
with other rats intubated with 1,1,2-trichloroethane (79-00-5) and
tetrachloroethylene (127-18-4).
All mice utilized in the iodoform bioassay, including controls,
were housed with other mice intubated with allyl chloride (107-05-1);
1,1,2,2-tetrachloroethane (79-34-5); chloroform (67-66-3); chloropi
crin (76-06-2); carbon disulfide (75-15-0); dibromochloropropane
(96-12-8); 1,2-dibromoethane (106-93-4); 1,2-dichloroethane (107-06-2);
1,1-dichloroethane (75-34-3); trichloroethylene (79-01-6); 3-sulfolene
(77-79-2); methylchloroform (71-55-6); 1,1,2-trichloroethane (79-00-5);
tetrachloroethylene (127-18-4); hexachloroethane (67-72-1); trichloro
fluoromethane (75-69-4) and carbon tetrachloride (56-23-5).
E. Gastric Intubation
Intubation was performed for five consecutive days per week on
a mg/kg body weight basis utilizing the most recently observed group
* CAS registry numbers are given in parentheses.

mean body weight as a guide for determining the dose. Mean body
weights for each group were recorded at weekly intervals for the
first 10 weeks and at monthly intervals thereafter. All animals of
one sex within a treated group received the same dose. Animals were
gavaged with the test solution under a hood to minimize extraneous
exposure of other animals and laboratory personnel to the chemical.
F. Selection of Initial Dose Levels
In order to estimate the maximum tolerated dosage of iodoform for
administration to treated animals in the chronic studies, subchronic
toxicity tests were conducted with both rats and mice. Animals of
each species were distributed among six groups, each consisting of
five males and five females. Iodoform mixed with corn oil was intro
duced by gavage to five of the six rat groups at dosages of 56, 100,
178, 316 and 562 mg/kg/day and five of the six mouse groups at dosages
of 18, 32, 56, 100, and 178 mg/kg/day. The sixth group of each spe
cies served as a control group, receiving only the corn oil by gavage.
Intubation was performed 5 days per week for 6 weeks, followed by a
2—week observation period to detect any delayed toxicity.
A dosage inducing no mortality and resulting in a depression in
mean group body weight of approximately 20 percent was selected as
the initial high dose. When weight gain criteria were not applicable,
mortality data alone were utilized.
Deaths occurred in all groups of treated female rats and in all
male groups receiving 316 mg/kg/day or more. All the male and female

rats receiving dosages of 562 mg/kg/day died before the end of the
experiment. Mean body weight was depressed in male rats receiving
dosages of 316 mg/kg/day and in female rats receiving dosages of 56
mg/kg/day or higher. The initial high doses selected for the chronic
bioassay were 180 and 36 mg/kg/day for males and females, respec
tively.
All male mice receiving 56 mg/kg/day or less survived. One
of the five male mice receiving 100 mg/kg/day died and all the male
mice receiving 178 mg/kg/day died. All treated female mice survived,
except for four of the five female mice treated with 178 mg/kg/day.
The only significant mean body weight depression observed was in
female mice receiving 178 mg/kg/day. The initial high dose selected
for both male and female mice in the chronic bioassay was 56 mg/kg/
day.
G. Experimental Design
The experimental design parameters for the chronic study (spe
cies, sex, group size, dosages administered, duration of treated and
untreated observation periods, and the time-weighted average dosages)
are summarized in Tables 1 and 2.
All rats were approximately 7 weeks old when they were started
on test. Vehicle control and treated rats shared the same median
date of birth while untreated control rats were approximately 2 weeks
younger than the other groups and were started on test a correspond
ing 2 weeks after the other groups. Male rats initially received
8

TABLE 1
DESIGN SUMMARY FOR OSBORNE-MENDEL RATS IODOFORM GAVAGE EXPERIMENT
INITIAL OBSERVATION PERIOD TIME-WEIGHTED GROUP IODOFORM TREATED UNTREATED AVERAGE SIZE DOSAGE3 (WEEKS) (WEEKS) DOSAGEb
MALE
UNTREATED CONTROL 20 0 0 112 0
VEHICLE CONTROL 20 0 78 34 0
LOW DOSE 50 90 28 71 60 50 0 34
HIGH DOSE 50 180 28 142 120 50 0 34
FEMALE
UNTREATED CONTROL 20 0 0 112 0
VEHICLE CONTROL 20 0 78 34 0
LOW DOSE 50 18 18 27 30 60 0 34
HIGH DOSE 50 36 18 55 60 60 0 34
a Dosage, given in mg/kg body weight, was administered by gavage five consecutive days per week.
2 (dosage X weeks received) Ti me»— UPI crhf-pd flvf =>TflPP Hnfiflpfi = ; 2 : : : ,
2(weeks receiving chemical)

TABLE 2
DESIGN SUMMARY FOR B6C3F1 MICE IODOFORM GAVAGE EXPERIMENT
MALE
UNTREATED CONTROL
VEHICLE CONTROL
LOW DOSE
HIGH DOSE
FEMALE
UNTREATED CONTROL
VEHICLE CONTROL
LOW DOSE
HIGH DOSE
a Dosage, given in consecutive days
INITIAL OBSERVATION PERIOD TIME -WEIGHTED GROUP IODOFORM TREATED UNTREATED AVERAGE SIZE DOSAGE3 (WEEKS) (WEEKS) DOSAGEb
20 0 0 90 0
20 0 78 12 0
50 28 8 47 40 10 50 60 0 13
50 56 8 93 80 10 100 60 0 13
20 0 0 90 0
20 0 78 12 0
50 28 8 47 40 10 50 60 0 13
50 56 8 93 80 10 100 60 0 14
mg/kg body weight, was administered by gavage five per week.
, 2 (dosage X weeksB received) Ti TTIP— upi ohfprl a\rtarawp rmsfl&p = : :—: : .
10

iodoform dosages of 90 and 180 mg/kg/day. Throughout this report
those male rats initially receiving the former dosage are referred
to as the low dose group, while those initially receiving the latter
dosage are referred to as the high dose group. In week 29 the dos
ages were lowered to 60 and 120 mg/kg/day for low and high dose males,
respectively. The dosages were maintained at these levels for the
remainder of the period of compound administration. The doses ini
tially utilized for female rats were 18 and 36 mg/kg/day. Throughout
this report those female rats initially receiving the former dosage
are referred to as the low dose group while those initially receiving
the latter dosage are referred to as the high dose group. In week 19
the dosages were increased to 30 and 60 mg/kg/day for low and high
dose female rats, respectively. These dosages were maintained for
the remainder of the period of compound administration.
Mice were all approximately 5 weeks old when they were started
on test. The vehicle control and treated mice shared the same median
date of birth. The untreated control mice were approximately 4 weeks
younger than the other groups and were started on test a correspond
ing 4 weeks later. For the first 8 weeks of the experiment male and
female mice received dosages of 28 and 56 mg/kg/day. Throughout this
report those mice initially receiving the former dosage are referred
to as the low dose groups, while those initially receiving the latter
dosage are referred to as the high dose groups. In week 9 dosages
were raised to 40 and 80 mg/kg/day for low and high dose mice,
11

respectively. In week 19 the dosages were again raised, to 50 and
100 mg/kg/day for low and high dose mice, respectively. These dosages
remained unchanged for both male and female mice for the remainder of
the period of compound administration.
H. Clinical and Histopathologic Examinations
Animals were weighed immediately prior to initiation of the
experiment. Body weights, food consumption, and data concerning
appearance, behavior, signs of toxic effects, and incidence, size,
and location of tissue masses were recorded at weekly intervals for
the first 10 weeks and at monthly intervals thereafter. From the
first day, all animals were inspected daily for mortality. The
presence of tissue masses was determined by observation and palpation
of each animal.
A necropsy was performed on each animal regardless of whether it
died, was killed when moribund, or was sacrificed at the end of the
bioassay. The animals were euthanized by exsanguination under sodium
pentobarbital anesthesia, and were immediately necropsied. The histo
pathologic examination consisted of gross and microscopic examination
of major tissues, organs, and gross lesions taken from sacrificed
animals and, whenever possible, from animals found dead.
Tissues were preserved in 10 percent buffered formalin, embedded
in paraffin, sectioned, and stained with hematoxylin and eosin prior
to microscopic examination. An occasional section was subjected to
special staining techniques for more definitive diagnosis.
12

Slides were prepared from the following tissues: skin, lungs,
bronchi, trachea, bone marrow, spleen, lymph nodes, thymus, heart,
salivary gland, liver, gallbladder (mice), pancreas, esophagus,
stomach, small intestine, large intestine, kidney, urinary bladder,
pituitary, adrenal, thyroid, parathyroid, mammary gland, testis,
prostate, and brain.
A few tissues were not examined for some animals, particularly
for those that died early. Also, some animals were missing, canni
balized, or judged to be in such an advanced state of autolysis as to
preclude histopathologic interpretation. Thus, the number of animals
for which particular organs, tissues, or lesions were examined micro
scopically varies and does not necessarily represent the number of
animals that were placed on experiment in each group.
I. Data Recording and Statistical Analyses
Pertinent data on this experiment have been recorded in an auto
matic data processing system, the Carcinogenesis Bioassay Data System
(Linhart et al., 1974). The data elements include descriptive infor
mation on the chemicals, animals, experimental design, clinical obser
vations, survival, body weight, and individual pathologic results,
as recommended by the International Union Against Cancer (Berenblum,
1969). Data tables were generated for verification of data transcrip
tion and for statistical review.
These data were analyzed using the statistical techniques de
scribed in this section. Those analyses of the experimental results
13

that bear on the possibility of carcinogenicity are discussed in the
statistical narrative sections.
Probabilities of survival were estimated by the product-limit
procedure of Kaplan and Meier (1958) and are presented in this report
in the form of graphs. Animals were statistically censored as of the
time that they died of other than natural causes or were found to be
missing; animals dying from natural causes were not statistically
censored. Statistical analyses for a possible dose-related effect
on survival used the method of Cox (1972) when testing two groups for
equality and used Tarone's (1975) extensions of Cox's methods when
testing a dose-related trend. One-tailed P-values have been reported
for all tests except the departure from linearity test, which is only
reported when its two-tailed P-value is less than 0.05.
The incidence of neoplastic or nonneoplastic lesions has been
given as the ratio of the number of animals bearing such lesions at a
specific anatomic site (numerator) to the number of animals in which
that site was examined (denominator). In most instances, the denomi
nators included only those animals for which that site was examined
histologically. However, when macroscopic examination was required
to detect lesions prior to histologic sampling (e.g., skin or mammary
tumors), or when lesions could have appeared at multiple sites (e.g.,
lymphomas), the denominators consist of the numbers of animals necrop
sied.
14

The purpose of the statistical analyses of tumor incidence is to
determine whether animals receiving the test chemical developed a sig
nificantly higher proportion of tumors than did the control animals.
As a part of these analyses, the one-tailed Fisher exact test (Cox,
1970, pp. 48-52) was used to compare the tumor incidence of a control
group to that of a group of treated animals at each dose level. When
results for a number of treated groups, k, are compared simultaneously
with those for a control group, a correction to ensure an overall
significance level of 0.05 may be made. The Bonferroni inequality
(Miller, 1966, pp. 6-10) requires that the P-value for any comparison
be less than or equal to 0.05/k. In cases where this correction was
used, it is discussed in the narrative section. It is not, however,
presented in the tables, where the Fisher exact P-values are shown.
The Cochran-Armitage test for linear trend in proportions, with
continuity correction (Armitage, 1971, pp. 362-365), was also used
when appropriate. Under the assumption of a linear trend, this test
determined if the slope of the dose-response curve is different from
zero at the one-tailed 0.05 level of significance. Unless otherwise
noted, the direction of the significant trend was a positive dose re
lationship. This method also provides a two-tailed test of departure
from linear trend.
A time-adjusted analysis was applied when numerous early deaths
resulted from causes that were not associated with the formation of
tumors. In this analysis, deaths that occurred before the first
15

tumor was observed were excluded by basing the statistical tests on
animals that survived at least 52 weeks, unless a tumor was found at
the anatomic site of interest before week 52. When such an early
tumor was found, comparisons were based exclusively on animals that
survived at least as long as the animal in which the first tumor was
found. Once this reduced set of data was obtained, the standard
procedures for analyses of the incidence of tumors (Fisher exact
tests, Cochran-Armitage tests, etc.) were followed.
When appropriate, life-table methods were used to analyze the
incidence of tumors. Curves of the proportions surviving without an
observed tumor were computed as in Saffiotti et al. (1972). The week
during which animals died naturally or were sacrificed was entered as
the time point of tumor observation. Cox's methods of comparing
these curves were used for two groups; Tarone's extension to testing
for linear trend was used for three groups. The statistical tests
for the incidence of tumors which used life-table methods were one-
tailed and, unless otherwise noted, in the direction of a positive
dose relationship. Significant departures from linearity (P < 0.05,
two-tailed test) were also noted.
The approximate 95 percent confidence interval for the relative
risk of each dosed group compared to its control was calculated from
the exact interval on the odds ratio (Gart, 1971). The relative risk
is defined as p /p where p is the true binomial probability of the t c t
incidence of a specific type of tumor in a treated group of animals
16

and p is the true probability of the spontaneous incidence of the
same type of tumor in a control group. The hypothesis of equality
between the true proportion of a specific tumor in a treated group
and the proportion in a control group corresponds to a relative risk
of unity. Values in excess of unity represent the condition of a
larger proportion in the treated group than in the control.
The lower and upper limits of the confidence interval of the
relative risk have been included in the tables of statistical analy
ses. The interpretation of the limits is that in approximately 95
percent of a large number of identical experiments, the true ratio
of the risk in a treated group of animals to that in a control group
would be within the interval calculated from the experiment. When
the lower limit of the confidence interval is greater than one, it
can be inferred that a statistically significant result (a P < 0.025
one-tailed test when the control incidence is not zero, P < 0.050
when the control incidence is zero) has occurred. When the lower
limit is less than unity but the upper limit is greater than unity,
the lower limit indicates the absence of a significant result while
the upper limit indicates that there is a theoretical possibility
of the induction of tumors by the test chemical which could not be
detected under the conditions of this test.
17

III. CHRONIC TESTING RESULTS: RATS
A. Body Weights and Clinical Observations
No mean body weight depression was evident during this bioassay
for female rats, but a slight compound-related mean body weight
depression was observed among male rats during the dosing period
(Figure 2). Fluctuations in the growth curve may be due to mortal
ity; as the size of the group diminishes, the mean body weight may be
subject to wide variations.
During the first 18 weeks of the study the appearance and be
havior of the treated rats were generally comparable with those of
the untreated controls. From week 20 to the end of the first year,
a hunched appearance was observed with greater frequency in the high
dose males and females than in the low dose and control groups, but
was noted at a comparable rate in all groups during the remainder of
the study.
Respiratory signs, involving labored respiration, wheezing, and/
or nasal discharge, were observed at a low incidence in all groups
during the first year, increasing as the animals aged; by week 110
most of the surviving rats exhibited respiratory symptoms. Clinical
signs associated with aging were noted at a comparable frequency in
treated and control rats during the last 10 months of the study.
These signs included sores on the body or extremities, alopecia,
rough fur, abdominal urine stains, squinted or reddened eyes, swollen
areas of the body, tissue masses, and palpable nodules. Isolated
18

ME
AN
BO
DY
WE
IGH
T (
GR
AM
S)
ME
AN
BO
DY
WE
IGH
T (G
RA
MS
)
1
O
O1
C3
O
O
c
m
>
f
m
>
3
m
•O
CO
C/
3 m
m
^1
CO
I
O

observations in one to three rats included tremors, transient saliva
tion, incoordination, ataxia, red vaginal discharge, abnormal gait,
and head tilt.
B. Survival
The estimated probabilities of survival for male and female rats
in the control and iodoform-dosed groups are shown in Figure 3. For
male rats the Tarone test indicated a significant (P < 0.001) positive
association between increased dosage and mortality. For female rats
no statistically significant association between dose and mortality
was observed.
The survival of the dosed males was low, with 50 percent (25/50)
of the high dose male rats dead by week 46 and 52 percent (26/50) of
the low dose male rats dead by week 76. For each of the control
groups, however, 50 percent (10/20) of the rats survived on test at
least 100 weeks.
There were adequate numbers of females at risk from late-
developing tumors as 54 percent (27/50) of the high dose, 38 percent
(19/50) of the low dose, 80 percent (16/20) of the vehicle control
and 60 percent (12/20) of the untreated control females survived on
test until the end of the study.
C. Pathology
Histopathologic findings on neoplasms in rats are tabulated in
Appendix A (Tables Al and A2); findings on nonneoplastic lesions are
tabulated in Appendix C (Tables Cl and C2).
20

PR
OB
AB
ILIT
Y O
F S
UR
VIV
AL
PR
OB
AB
ILIT
Y O
F S
UR
VIV
AL
C 3
0
O
0
0
CD
to
-^
Oi
bo
i D
0—
[ 1
1 1
1 1
1 ,
1 1
i i
~
1 i
_i
1 '
CT1
1
5 m
i
0
§
I
H
Xf
IS
31
«F
W
O
fn
K
C
n u
°
m
>
fW
01
H
1•
«i
DO
s
m
§ S
Hi
^f
CO
H
g 5 1
•
>
° §
5 *"™
T 3
1 "
o
r
o •
: o
If!
_1
J
>
, .
ۥ
•
•3)
= ! &
-P
^
•
•o
eo
5O
rn
4'
:
rvj
= O
f a
—
—
O Q
H
o
§2 i
O "
m
f"AJnJ
ii
S
»•
J^
v
o
o
CO
Z
J
03
C
o
—
O
X
•*r ^
"n
" r
CO
i-i
1
/
K"
S
r
J
f—
_2
i I
i™^
SJ
i i
i i
i i
i i
o
C 3
O
O
O
o
-»
C 3
ro
!t̂
c>
bo
o

Follicular-cell tumors of the thyroid gland occurred in treated
rats and pooled vehicle controls of both sexes but not in matched
vehicle controls. Each of the other types of tumors observed in this
bioassay has been encountered previously as a naturally occurring
lesion in the aged Osborne-Mendel rat.
Inflammatory, degenerative, and proliferative lesions as seen
in the control and chemically treated rats were similar in number and
kind to those lesions occurring spontaneously in untreated aged rats.
This histopathologic examination did not provide evidence that
iodoform was carcinogenic to Osborne-Mendel rats under the conditions
of this experiment.
D. Statistical Analyses of Results
The results of the statistical analyses of tumor incidence in
rats are summarized in Tables 3 and 4. For males (Table 3) because
of the high early mortality in the high dose group the statistical
analyses were based either on rats which survived at least 52 weeks
or, in the case of the combined incidence of follicular-cell carci
nomas or follicular-cell adenomas of the thyroid, on rats which
survived at least 50 weeks (the time at which the first tumor of
interest was detected). For females (Table 4) the standard analyses
were performed. The analysis is included for every type of malignant
tumor in either sex where at least two such tumors were observed in
at least one of the control or iodoform-dosed groups and where such
tumors were observed in at least 5 percent of the group.
22

TABLE 3
ANALYSES OF THE INCIDENCE OF PRIMARY TUMORS AT SPECIFIC SITES IN MALE RATS TREATED WITH IODOFORM
eWHICH SURVIVED AT LEAST 52 WEEKS3»
POOLED MATCHED VEHICLE VEHICLE
TOPOGRAPHY: MORPHOLOGY CONTROL CONTROL
Pituitary: Chromophobe Adenoma 6/36(0.17) 4/18(0.22)
P Values0 N.S. N.S.
Relative Risk (Pooled Vehicle Control) Lower Limit Upper Limit
___ Relative Risk (Matched Vehicle Control)
Lower Limit Upper Limit
Weeks to First Observed Tumor 105 Ill
Thyroid: Follicular-Cell Carcinoma 1/34(0.03) 0/16(0.00)
P Values0 N.S. N.S.
Relative Risk (Pooled Vehicle Control) Lower Limit Upper Limit
Relative Risk (Matched Vehicle Control) Lower Limit Upper Limit
Weeks to First Observed Tumor Ill
LOW DOSE
7/36(0.19)
N.S.
1.167 0.363 3.697
0.875 0.258 3.560
72
6/35(0.17)
N.S.
5.829 0.722
245.698
Infinite 0.735
Infinite
74
HIGH DOSE
4/20(0.20)
N.S.
1.200 0.276 4.348
0.900 0.198 4.141
95
3/17(0.18)
N.S.
6.000 0.520
293.063
Infinite 0.604
Infinite
112

___
___
___
___
___
TABLE
TOPOGRAPHY: MORPHOLOGY
Thyroid: Follicular-Cell Adenoma or Follicular-Cell Carcinoma** »e
P Values0
Relative Risk (Pooled Vehicle Control)d
Lower Limit Upper Limit
Relative Risk (Matched Vehicle Control)d
Lower Limit Upper Limit
Weeks to First Observed Tumor
Thyroid: Cr-Cell Adenoma or C-Cell Carcinoma
P Values0
Relative Risk (Pooled Vehicle Control) Lower Limit Upper Limit
Relative Risk (Matched Vehicle Control) Lower Limit Upper Limit
Weeks to First Observed Tumor
3 (CONTINUED)
POOLED VEHICLE CONTROL
2/34(0.06)
N.S.
Ill
1/34(0.03)
N.S. __H
Ill
MATCHED VEHICLE CONTROL
0/16(0.00)
N.S.
1/16(0.06)
N.S.
«.__
Ill
LOW DOSE
8/35(0.23)
P = 0.046* P = 0.037**
3.886 0.851 35.305
Infinite 1.112
Infinite
74
3/35(0.09)
N.S.
2.914 0.235
140.599
1.371 0.117 66.206
111
HIGH DOSE
4/18(0.22)
N.S.
3.778 0.595 37.389
Infinite 0.882
Infinite
3/20(0.15)
N.S.
5.100 0.520
293.063
2.400 0.259
137.988
50
112

TABLE 3 (CONCLUDED)
created groups received time-weighted average doses of 71 or 142 mg/kg by gavage.
Number of tumor-bearing animals/number of animals examined at site (proportion). GThe probability level for the Cochran-Armitage test is given beneath the incidence of tumors in the corresponding control group when P - 0.05; otherwise, not significant (N.S.) is indicated. The probability level for the Fisher exact test for the comparison of a treated group with the pooled vehicle control group (*) or the matched vehicle control group (**) is given beneath the incidence of tumors in that treated group when P - 0.05; otherwise, not significant (N.S.) is indicated. For both Cochran-Armitage and Fisher exact tests a negative designation (N) indicates a lower incidence in the treated group(s) than in the control group.
The 95% confidence interval on the relative risk of the treated group to the control group. p
For sites where the first tumor of interest was observed earlier than 52 weeks, the analyses were based upon all animals that survived until or past the date that the first tumor was observed.

TABLE 4
ANALYSES OF THE INCIDENCE OF PRIMARY TUMORS AT SPECIFIC SITES IN FEMALE RATS TREATED WITH IODOFORM£
POOLED MATCHED VEHICLE , VEHICLE LOW
TOPOGRAPHY: MORPHOLOGY CONTROL CONTROL DOSE
Pituitary: Chromophobe Adenoma 12/40(0.30) 5/20(0.25) 8/45(0.18)
P Values0 N.S. N.S. N.S.
Relative Risk (Pooled Vehicle Control) —_ 0.593 Lower Limit 0.236 Upper Limit 1.411
Relative Risk (Matched Vehicle Control) 0.711 Lower Limit 0.243 Upper Limit 2.485
ON
Weeks to First Observed Tumor 89 112 62
Thyroid: Follicular-Cell Carcinoma 1/40(0.02) 0/20(0.00) 4/40(0.10)
P Values0 N.S. N.S. N.S.
Relative Risk (Pooled Vehicle Control) 4.000 Lower Limit 0.420 Upper Limit 191.652
Relative Risk (Matched Vehicle Control) Infinite Lower Limit 0.483 Upper Limit Infinite
Weeks to First Observed Tumor Ill 91
HIGH DOSE
9/47(0.19)
N.S.
0.638 0.267 1.478
0.766 0.273 2.618
104
2/42(0.05)
N.S.
1.905 0.103
109.644
Infinite 0.146
Infinite
104

___
_ __
_ __
_ _ _
___
___
TABLE 4 (CONTINUED)
TOPOGRAPHY: MORPHOLOGY
Mammary Gland: Adenocarcinoma NOS
P Values0
Relative Risk (Pooled Vehicle Control) Lower Limit Upper Limit
Relative Risk (Matched Vehicle Control)d
Lower Limit Upper Limit
N> --J Weeks to First Observed Tumor
Mammary Gland: Fibroadenoma
P Values0
Relative Rick (Pooled Vehicle Control) Lower Limit Upper Limit
Relative Riak (Matched Vehicle Control)d
Lower Limit Upper Limit
Weeks to First Observed Tumor
POOLED VEHICLE CONTROL
1/40(0.02)
N.S.
112
10/40(0.25)
N.S.
106
MATCHED VEHICLE CONTROL
1/20(0.05)
N.S.
112
4/20(0.20)
N.S.
112
LOW DOSE
6/50(0.12)
N.S.
4.800 0.620
215.902
2.400 0.325
108.021
32
10/50(0.20)
N.S.
0.800 0.334 1.934
1.000 0.339 3.991
73
HIGH DOSE
4/50(0.08)
N.S.
3.200 0.335
154.289
1.600 0.175 77.169
76
8/50(0.16)
N.S.
0.640 0.244 1.63.4
0.800 0.250 3.327
75

___
00
TABLE 4 (CONCLUDED)
POOLED MATCHED VEHICLE VEHICLE LOW HIGH
TOPOGRAPHY: MORPHOLOGY CONTROL CONTROL DOSE DOSE
Uterus: Endometrlal Stromal Polyp 2/39(0.05) 1/19(0.05), 2/47(0.04) 3/48(0.06)
P Values0 N.S. N.S. N.S. N.S.
Relative Risk (Pooled Vehicle Control)d 0.830 1.219 Lower Limit 0.063 0.147 Upper Limit 11.016 14.035
Relative Risk (Matched Vehicle Control) _-._ 0.809 1.187 Lower Limit 0.046 0.105 Upper Limit 46.702 61,031
Weeks to First Observed Tumor Ill 112 112 112
Treated groups received time-weighted average doses of 27 or 55 mg/kg by gavage.
Number of tumor-bearing animals/number of animals examined at site (proportion).
The probability level for the Cochran-Armitage test is given beneath the incidence of tumors in the corresponding control group when P < 0.05; otherwise, not significant (N.S.) is indicated. The probability level for the Fisher exact test for the comparison of a treated group with the pooled vehicle control group (*) or the matched vehicle control group (**) is given beneath the incidence of tumors in that treated group when P < 0.05; otherwise, not significant (N.S.) is indicated. For both Cochran-Armitage and Fisher exact tests a negative designation (N) indicates a lower incidence in the treated group(s) than in the control group.
The 95% confidence interval on the relative risk of the treated group to the control group.

Two types of control groups were used for statistical analyses:
the vehicle control group (designated in this section as the "matched"
vehicle control group) and a pooled vehicle control group, combining
the vehicle controls from the studies of iodoform and hexachloro
ethane. The pooled control rats were of the same strain, were housed
in the same room, were started on test within 2 weeks of each other
and tested concurrently for more than one year, received the same
vehicle, and were diagnosed by the same pathologists.
Thyroid tumors were found in both male and female rats. For
males for the combined incidence of follicular-cell carcinomas or
follicular-cel1 adenomas of the thyroid, the Fisher exact test com
parisons of low dose to both the pooled and the matched control had
marginal test results which were not significant under the Bonferroni
criterion. In historical control data collected by this laboratory
for the NCI Carcinogenesis Testing Program, 11/200 (6 percent) of the
male vehicle control Osborne-Mendel rats had one of these tumors—
compared to the 8/35 (23 percent) and 4/18 (22 percent) observed in
the low dose and high dose groups, respectively.
No statistical test for any site in either males or females was
significant under the Bonferroni criterion. Thus, there was no con
vincing statistical evidence of the carcinogenicity of iodoform in
rats.
To provide additional insight into the possible carcinogenicity
of this compound, 95 percent confidence intervals on the relative
risk have been estimated and entered in the tables based upon the
29

observed tumor incidence rates. In all of the intervals shown in
Tables 3 and 4, the value one is included; this indicates the absence
of statistically significant results. It should also be noted that
all of the confidence intervals have an upper limit greater than one,
indicating the theoretical possibility of tumor induction in rats by
iodoform that could not be established under the conditions of this
test.
30

IV. CHRONIC TESTING RESULTS: MICE
A. Body Weights and Clinical Observations
Distinct patterns of compound-related mean body weight depression
were not apparent during this bioassay (Figure 4).
Throughout the study, there was no evidence of compound effect
with regard to physical appearance and behavior among the iodoform
treated mice. Clinical signs often observed in group-housed labora
tory mice were noted at comparable rates in control and treated mice,
with the incidences increasing gradually in all groups as the study
approached termination. These common signs included sores and/or
desquamation on parts of the body, alopecia, stains on the fur,
external genital irritation, bloating, palpable nodules, and tissue
masses.
B. Survival
The estimated probabilities of survival for male and female mice
in the control and iodoform-dosed groups are shown in Figure 5. For
both male and female mice no statistically significant positive asso
ciation between dosage and mortality was observed.
There were adequate numbers of male mice at risk from late-
developing tumors as 60 percent (30/50) of the high dose, 68 percent
(34/50) of the low dose, and 60 percent (12/20) of the vehicle con-
control mice lived on test until the end of the study. Survival
among the untreated control mice was unexpectedly low, as only 10
percent (2/20) lived on test until the end of the study.
31

50- -50
40- -40
IX
<53oi-
-30
(D
> 20D O UNTREATED CONTROL
-20
m
VEHICLE CONTROL
10 — LOW DOSE -10
HIGH DOSE
MALE MICE ] I ' 1 ' I
15 30 45 60 75 90 105 120
TIME ON TEST (WEEKS)
50- -50
40 — — 40
w
< cc ii 30 — -30
>20H -20
o CD UNTREATED CONTROL
< Ol VEHICLE CONTROL
10 — -10 LOW DOSE
HIGH DOSE FEMALE MICE
15 30 45 60 75 90 105 120
TIME ON TEST (WEEKS)
FIGURE 4 GROWTH CURVES FOR IODOFORM CHRONIC STUDY MICE
32

r
- 1
PR
OB
AB
ILIT
Y O
F S
UR
VIV
AL
PR
OB
AB
ILIT
Y O
F S
UR
VIV
AL
o
o
P
o
o
b
ro
-^
CT
) bo
D
o
—l
1 l
1 1
1 l
1 i
'| i
t
01 ~
~ !
! C
J X
r-
<
C
c—
O
m
Z
30
I
S
-
B
o
o
°
m
o 8
S
> I
g-
s
m
8 5
1 5
o
1
o
^ o
1o
3J
5
O
^
1°
5
I I O
o m
8 -
o—
01
-
fO
Tj
;o
=! £
^ ^1
m
Tci
2
jO
en
H
i p
m
1 y% 8
-j H
5
1 T
m
"̂
i
«m
1 ;
A
C/J
i,;
O
*j _
1 IT
"
O
Ii
,i
30
en
r U^
J O
-n
m
>̂
m̂
g
Q
m
o
i |
l |
1 |
1 |
l |
o
b
o
o
p
o
.-*
io
^
"GJ
oo
o

There were adequate numbers of female mice at risk from late-
developing tumors as 86 percent (43/50) of the high dose, 86 percent
(43/50) of the low dose, and 90 percent (18/20) of the vehicle con
trol mice lived on test until the end of the study. Fifty-five per
cent (11/20) of the untreated controls survived on test until the
study was terminated, despite the death of seven animals in weeks 64
and 65. Six of these mice had congestion of the lungs; the other was
autolyzed.
C. Pathology
Histopathologic findings on neoplasms in mice are tabulated in
Appendix B (Tables Bl and B2); findings on nonneoplastic lesions are
tabulated in Appendix D (Tables Dl and D2).
The incidence of malignant lymphoma, a neoplasm occurring com
monly in the B6C3F1 mouse, were increased in high dose male mice
(i.e, 2/19 [11 percent] controls, 3/50 [6 percent] low dose, and
10/50 [20 percent] high dose). A large variety of other neoplasms
were found in various organs of mice in both the control and treated
groups; however, they were of the usual number and type observed in
hybrid mice of this age and strain.
The inflammatory, degenerative, and proliferative lesions were
of the usual type observed in mice of this age and strain and were
essentially comparable in incidence in the control and treated
groups, except for an increase in amyloidosis of the liver, spleen,
kidney, and adrenal gland in untreated control males.
34

This histopathologic examination did not provide convincing evi
dence for the carcinogenicity of iodoform in B6C3F1 mice, although
exposure to the compound may have been associated with an increased
incidence of malignant lymphoma in high dose males.
D. Statistical Analyses of Results
The results of the statistical analyses of tumor incidence in
mice are summarized in Tables 5 and 6. The analysis for every type
of tumor that was observed in more than 5 percent of any of the
iodoform-dosed groups of either sex is included.
Two types of control groups were used for statistical analyses:
the vehicle control group (designated in this section as the "matched"
vehicle control group) and a pooled vehicle control group, combining
the vehicle controls from the studies of iodoform and 1,1,2-trichloro
ethane. The pooled control mice were of the same strain, were given
the same vehicle, were housed in the same room, were started on test
in the same month and tested concurrently for at least one year, and
were diagnosed by the same pathologists.
No statistical tests from any site in male or female mice
showed a positive association between administration and tumor inci
dence. Based upon these results there was no statistical evidence
of the carcarcinogenicity of iodoform in mice.
To provide additional insight into the possible carcinogenicity
of this compound, 95 percent confidence intervals on the relative
risk have been estimated and entered in the tables based upon the
35

_ __
_ __
___
___
___
TABLE 5
ANALYSES OF THE INCIDENCE OF PRIMARY TUMORS AT SPECIFIC SITES IN MALE MICE TREATED WITH IODOFORMS
POOLED MATCHED VEHICLE VEHICLE LOW
TOPOGRAPHY -.MORPHOLOGY CONTROL CONTROL DOSE
Lung: Alveolar /Bronchlolar Carcinoma 0/39(0.00) 0/19(0.00) 3/50(0.06)
P Values0 N.S. N.S. N.S.
Relative Risk (Pooled Vehicle Control) Infinite Lower Limit 0.472 Upper Limit Infinite
u> Relative Risk (Matched Vehicle Control) Infinite Lower Limit 0.238 Upper Limit Infinite
Weeks to First Observed Tumor 90
Lung: Alveolar/Bronchiolar Adenoma or Alveolar /Bronchiolar Carcinoma^ . 1/39(0.03) 1/19(0.05) 4/50(0.08)
P Values0 N.S. N.S. N.S.
Relative Risk (Pooled Vehicle Control) 3.120 Lower Limit 0.327 Upper Limit 150.411
Relative Risk (Matched Vehicle Control) _— 1.520 Lower Limit 0.167 Upper Limit 73.309
90 Weeks to First Observed Tumor 90 90
HIGH DOSE
1/49(0.02)
N.S.
Infinite 0.043
Infinite
Infinite 0.021
Infinite
91
4/49(0.08)
N.S.
3.184 0.333
153.393
1.551 0.171 74.767
91

___
___
_ __
___
TABLE
TOPOGRAPHY: MORPHOLOGY
Hematopoietic: Malignant Lymphoma
P Values0
Relative Risk (Pooled Vehicle Control) Lower Limit Upper Limit
Relative Risk (Matched Vehicle Control) Lower Limit Upper Limit
Weeks to First Observed Tumor
Liver: Hepatocellular Carcinoma
P Values0
Relative Risk (Pooled Vehicle Control) Lower Limit Upper Limit
Relative Risk (Matched Vehicle Control) Lower Limit Upper Limit
Weeks to First Observed Tumor
5 (CONTINUED)
POOLED VEHICLE CONTROL
4/39(0.10)
P = 0.009
—_
66
5/39(0.13)
N.S.
88
MATCHED VEHICLE CONTROL
2/19(0.11)
N.S.
74
3/19(0.16)
N.S.
88
LOW DOSE
3/50(0.06)
N.S.
0.585 0.091 3.266
0.570 0.073 6.511
70
5/49(0.10)
N.S.
0.796 0.198 3.228
0.646 0.144 3.881
90
HIGH DOSE
10/50(0.20)
N.S.
1.950 0.616 7.953
1.900 0.468 16.901
40
7/50(0.14)
N.S.
1.092 0.325 4.061
0.887 0.234 4.945
91

TABLE 5 (CONCLUDED)
rt
Treated groups received time-weighted average doses of 47 or 93 mg/kg by gavage.
Number of tumor-bearing animals/number of animals examined at site (proportion). Q
The probability level for the Cochran-Armitage test is given beneath the incidence of tumors in the corresponding control group when P< 0.05; otherwise, not significant (N.S.) is indicated. The probability level for the Fisher exact test for the comparison of a treated group with the pooled vehicle control group (*) or the matched vehicle control group (**) is given beneath the incidence of tumors in that treated group when P< 0.05; otherwise, not significant (N.S.) is indicated. For both Cochran-Armitage and Fisher exact tests a negative designation (N) indicates a lower incidence in the treated group(s) than in the control group.
The 95% confidence interval on the relative risk of the treated group to the control group.
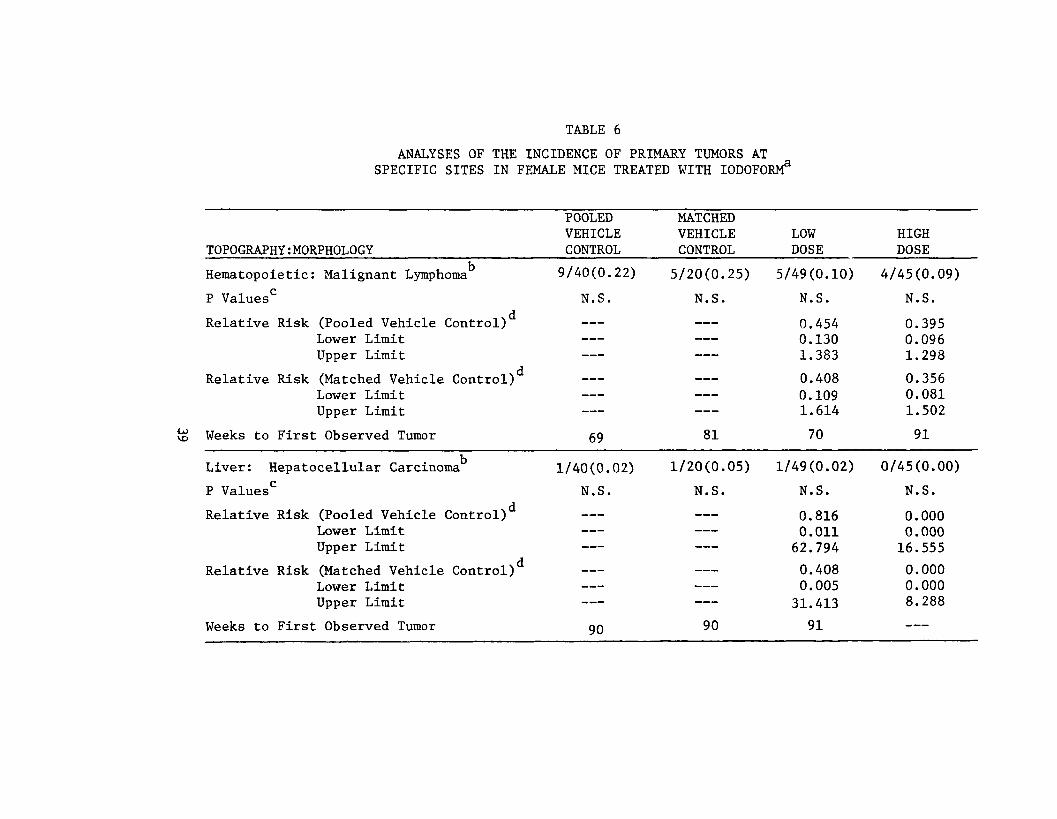
TABLE 6
ANALYSES OF THE INCIDENCE OF PRIMARY TUMORS AT SPECIFIC SITES IN FEMALE MICE TREATED WITH IODOFORM3
POOLED MATCHED VEHICLE VEHICLE LOW
TOPOGRAPHY: MORPHOLOGY CONTROL CONTROL DOSE
Hematopoietic: Malignant Lymphoma 9/40(0.22) 5/20(0.25) 5/49(0.10)
P Values0 N.S. N.S. N.S.
Relative Risk (Pooled Vehicle Control) 0.454 Lower Limit 0.130 Upper Limit 1.383
Relative Risk (Matched Vehicle Control) 0.408 Lower Limit 0.109 Upper Limit 1.614
VO Weeks to First Observed Tumor 81 70 69
Liver: Hepatocellular Carcinoma 1/40(0.02) 1/20(0.05) 1/49(0.02)
P Values0 N.S. N.S. N.S.
Relative Risk (Pooled Vehicle Control)d 0.816 Lower Limit 0.011 Upper Limit 62.794
Relative Risk (Matched Vehicle Control) 0.408 Lower Limit 0.005 Upper Limit 31.413
Weeks to First Observed Tumor 90 91 90
HIGH DOSE
4/45(0.09)
N.S.
0.395 0.096 1.298
0.356 0.081 1.502
0/45(0.00)
N.S.
0.000 0.000 16.555
0.000 0.000 8.288
91

TABLE 6 (CONCLUDED)
A Treated groups received time-weighted average doses of 47 or 93 mg/kg by gavage.
Number of tumor-bearing animals/number of animals examined at site (proportion). ft
The probability level for the Cochran-Armitage test is g'iven beneath the incidence of tumors in the corresponding control group when P< 0.05; otherwise, not significant (N.S.) is indicated. The probability level for the Fisher exact test for the comparison of a treated group with the pooled vehicle control group (*) or the matched vehicle control group (**) is given beneath the incidence of tumors in that treated group when P< 0.05; otherwise, not significant (N.S.) is indicated. For both Cochran-Armitage and Fisher exact tests a negative designation (N) indicates a lower incidence in the treated group(s) than in the control group.
The 95% confidence interval on the relative risk of the treated group to the control group.

observed tumor incidence rates. In all of the intervals shown in
Tables 5 and 6, the value one is included; this indicates the absence
of statistically significant results. It should also be noted that
all of the confidence intervals have an upper limit greater than one,
indicating the theoretical possibility of tumor induction in mice by
iodoform that could not be established under the conditions of this
test.
41

V. DISCUSSION
There was a significant positive association between the dosage
of iodoform administered and mortality in male rats; this was not
the case for female rats or mice of either sex. Adequate numbers of
animals in all groups survived sufficiently long to be at risk from
late-developing tumors.
The possibility that female rats and mice of both sexes did not
receive dosages of iodoform approximating the maximum tolerated dos
ages must be considered, as intubation with the compound had no sig
nificant effect upon the mean body weights for these treated animals
when compared to their respective controls.
Of the neoplasms of histopathologic interest observed in treated
animals (i.e., follicular-cell thyroid tumors in rats and malignant
lymphomas in high dose male mice), neither showed a significant posi
tive association between administration of the compound and tumor inci
dence and neither of these neoplasms was unusua'l in these species.
Because of poor survival in male rats, however, the possibility that
compound administration resulted in thyroid tumors cannot be excluded.
No neoplasms occurred in statistically significant increased
incidences when treated rats and mice were compared to their respec
tive controls.
Under the conditions of this bioassay, no convincing evidence
was provided for the carcinogenicity of iodoform in Osborne-Mendel
rats or in B6C3F1 mice.
42

VI. BIBLIOGRAPHY
Armitage, P., Statistical Methods in Medical Research, Chapter 14. J. Wiley & Sons, New York, 1971.
Berenblum, I., editor, Carcinogenicity Testing. International Union Against Cancer, Technical Report Series, Vol. 2. International Union Against Cancer, Geneva, 1969.
Chemical Abstracts Service, The Chemical Abstracts Service (CAS) Ninth Collective Index, Volumes 76-85, 1972-1976. American Chemical Society, Washington, B.C., 1977.
Cox, D.R., Analysis of Binary Data, Chapters 4 and 5. Methuen and Co., Ltd., London, 1970.
Cox, D.R., "Regression Models and Life-Tables." Journal of the Royal Statistical Society, Series "B" 34:187-220, 1972.
Druckrey, H., H. Kruse, R. Preussmann, S. Ivankovic, and C. Landschutz, "Cancerogene alkylierende Substanzen. III. Alkyl-halogenide, -sulfate, -sulfonate und ringgespannte Heterocyclen." Z. Krebsforsch 74:241-270, 1970.
Eschenbrenner, A.B., "Induction of Hepatomas in Mice by Repeated Administration of Chloroform, With Observations on Sex Differences." Journal of the National Cancer Institute 5:251:255, 1945.
Gart, J.J., "The Comparison of Proportions: A Review of Significance Tests, Confidence Limits, and Adjustments for Stratification." International Statistical Institute Review 39:148-169, 1971.
Goodman, L.S., and A. Gilman, The Pharmacological Basis of Therapeutics , 4th edition. The MacMillan Company, New York, 1970.
Gosselin, R.E., H.C. Hodge, R.P. Smith, and M.N. Gleason, Clinical Toxicology of Commercial Products, 4th edition. The Williams and Wilkins Company, Baltimore, Maryland, 1976.
Irish, D.D., "Aliphatic Saturated Hydrocarbons." Industrial Hygiene and Toxicology, 2nd revised edition. F.A. Patty, editor. Interscience, New York, 1967.
Kaplan, E.L., and P. Meier, "Nonparametrie Estimation from Incomplete Observations." Journal of the American Statistical Association 53:457-481, 1958.
43

Linhart, M.S., J.A. Cooper, R.L. Martin, N.P. Page, and J.A. Peters, "Carcinogenesis Bioassay Data System." Computers and Biomedical Research 7:230-248, 1974.
Miller, R.G., Simultaneous Statistical Inference. McGraw-Hill Book Co., New York, 1966.
Preussmann, R., "Direct Alkylating Agents as Carcinogens." Food and Cosmetics Toxicology 6:576-577, 1968.
Reuber, M.D., and E.L. Glover, "Cirrhosis and Carcinoma of the Liver in Male Rats Given Subcutaneous Carbon Tetrachloride." Journal of the National Cancer Institute 44:419-423, 1970.
Rudali, G., "A Propos de 1'Activite oncogene de quelques hydrocarbures halogenes utilises en therapeutique." UICC Monograph Series 7: 138-143, 1967 (French). ~
Saffiotti, U., R. Montesano, A.R. Sellakumar, F. Cefis, and D.G. Kaufman, "Respiratory Tract Carcinogenesis in Hamsters Induced by Different Numbers of Administration of Benzo (a) Pyrene and Ferric Oxide." Cancer Research 32:1073-1079, 1972.
Sax, N.I., "General Chemicals." Dangerous Properties of Industrial Materials. N.I. Sax, editor. Van Nostrand Reinhold Company, New York, 1975.
Stanford Research Institute, 1976 Directory of Chemical Producers. Menlo Park, California, 1976.
Tarone, R.E., "Tests for Trend in Life-Table Analysis." Biometrika 62_:679-682, 1975.
U.S. Department of Health, Education, and Welfare, Registry of Toxic Effects of Chemical Substances, 1976. HEW Publication No. (NIOSH)76-191, Washington, D.C., 1976.
Windholz, M., editor, The Merck Index: An Encyclopedia of Chemicals and Drugs, Ninth edition. Merck and Co., Rahway, New Jersey, 1976.
44

APPENDIX A
SUMMARY OF THE INCIDENCE OF NEOPLASMS IN RATS TREATED WITH IODOFORM


TABLE A1 SUMMARY OF THE INCIDENCE OF NEOPLASMS IN MALE RATS TREATED WITH IODOFORM
CONTROL (ONTR)01-141(1
CONTROL (VEH) 01-111M
1011 DOSE 01-112W
HIGH DOSE 01-113M
ASIRA1S INITIALLY IN STUDY 20ANIMALS NECRCPSIFD 20ANIMALS EXAMINED HISTOFATHOLOGICALLY ** 20
20 20 20
50 1*9 49
50 50 50
INTEGUMENTARY SYSTEM
*SUBCUT TISSUEFIBROMAFIEROSARCOBAHEMANGIOMANEUROFIBROSA8CORANEOROFIBROSAHCOMA, METASTATIC
(20) 1 (5X)
(20)
1 (5X)
1 (5X) 1 (5%)
(1(9) 1 (2%)
1 (2X)
(50)
RESPIBATORY SYSTEM
ILUNGALVEOLAR/BEONCHIOLAR ADENOMANEUROFIBEOSARCOMA, METASTATIC
(20) (19)
1 (5%)
(49) 1 (2X)
(50)
HEBATOPOIETIC SYSTEM
•MULTIPLE ORGANSMALIG.LYMPHOMA, HISTIOCYTIC TYPE
(20) (20) 1 (5X)
(«9) 1 (2X)
(50)
»SPLEENHEMANGIOSAfiCOMAHALIG.LYBPHOMA, HISTIOCYTIC TYPF
(19) 2 (11X)
(19) (47) (50) 1 (2X) 1 <2X)
iLYKPH NODENEURCFIBBOSARCOMA. METASTATIC
(19) (17) 1 (6JS)
(41) (37)
CIRCULATORY SYSTEM
NCNE
D I G E S T I V E S Y S T E M
I S A L I V A R Y G L A N DN E y E g F I B B O S A R C O M A i _ M S T A S T A T I C
(14) (16) i_J
(31) (13)
* N U M B E R O F A N I M A L S HITH TISSUE E X A M I N E D* N U M B E R OF A N I M A L S NECFOPSIED **EXCLUDES PARTIALLY AUTOLY2ED ANIMALS
M I C R O S C O P I C A L L Y
A-3

TABLE A1 (CONTINUED)
CONTROL (ONTR)01-141(1
COHTROL (VEH) 01-111B
LOB DOSE 01-112H
HIGH DOSE 01-113H
URINARY SYSTEM
IKICNEY KIXED TUMOR, MALIGNANT
(19)1 (5X) (20) (49) (50)
ENDOCBINI SYSTEM
tPITUITARY CKROKOEHOBE ADENOMA CHROMOPHOBE CARCINOMA
tADRENAL PKEOCHROMOCYTOMA
ITHYROIC FOLLICULAR-CELL ADENOMA FGLLICULAR-CELL CARCINOMA C-CELL ADENOMA C-CELL CARCINOMA NEUBOFIBBOSARCOfIA, METASTATIC
tPANCHEATIC ISLETS ISLET-CELL ADENOMA
(19)3 (16X)1 (5X)
(19)
(19)
1 (5X)
(19)2 (11X)
(19) 4 (21S)
(19)1 (5X)
(17)
1 (6X)
1 (6X)
(19) 1 (5X)
(43) 7 (16*)
(48)
(43) 2 (5X) 6 (14X) 1 (2X) 2 (5X)
(48)
(33) 4 (12X)
(19)
(37) 1 (3X) 3 (8X) 3 (8%)
(45)
REPRODUCTIVE SYSTEM
*BABMARY GLAND ADENCCARCINOMA, NOS FIB8CADENOMA
(20)
1 (5X)
(20)1 (5X) (49)
1 (2X> (50)
NEBVOOS SYSTEM
tERAIN CHROMOPHOBE CARCINOMA, METASTATI
(19)1 (5X) (20) (48) (50)
SPECIAL SENSE ORGANS
NCNE
MDSCULOSKELETAL SYSTEM
I NUC.BES OF ANIMALS 8ITH TISSUE EXAMINED* NUKBER OF ANIMALS NECROPSIED
MICROSCOPICALLY
A-4

TABLE A1 (CONCLUDED)
CONTROL (UNTR)01-141M
CONTROL(VEH) 01-111M
LOW DOSE 01-112(1
HIGH DOSE 01-113R
BODY CAVITIES
NONE
ALI OTHER SYSTEMS
*BULTIPLE ORGANSFIBROUS HISTIOCYTOMA, MALIGNANT
(20) (20) 1 (5*)
(19) (50) 1(2%)
ANIflAL DISECSITICN SUMMARY
ANIHALS INITIALLY IN STUDYNATURAL DEATHS!HORIBUND SACRIFICESCHEDULEi: SACRIFICE ACCIDENTALLY KILLED TERMINAL SACRIFICEANIflAL KISSING
i INCLUDES AUTCLYZED ANIMALS
20 11*
1
5
20 11
9
50 36
11
50 U2
8
TUMOR SUBBARI
TOTAL ANIMALS KITH PRIMARY TUMORS* 9 7 17 TOTAL PRIMARY TUMORS 12 12 23
TOTAL ANIMALS KITH BENIGN TUMORS 6 4 11 TOTAL BESIGN TDBORS 7 7 13
TOTAL ANIMALS KITH MALIGNANT TUMORS 5 U 10 TOTAL MALIGNANT TUMORS 5 5 10
TOTAL ANIMALS »ITH SECONDARY TUMORS! 1 1 TOTAL SECONDARY TUHORS 1 5
TOTAL ANIMALS KITH TUMOBS UNCERTAINBENIGN OR MALIGNANT
TOTAL UNCERTAIN TUBORS
TOTAL ANIMALS WITH TUMORS UNCERTAINFEIBARY OR METASTATIC
TOTAL UNCERTAIN TUMORS
* PRIBARY TUMORS: ALL TUMORS EXCEPT SECONDARY TUMORS * SECONDARY TUMORS: METASTATIC TUMORS OR TUBORS INVASIVE INTO AN ADJACENT ORGAN
10 1U
A-5

TABLE A2 SUMMARY OF THE INCIDENCE OF NEOPLASMS IN FEMALE RATS TREATED WITH 1ODOFORM
CONTROL(UNTR)01-1U1F
ANIBAIS INITIALLY IN STUDY 20ANIMALS NECECPSIED 20ANIM A L S EXAMINED HISTOPATHOLOGICALLY** 20
CONTROL(VEH) 01-111F
20 20 20
LOU DOSE 01-114F
50 50 50
HIGH DOSE 01-115F
50 50 50
INTEGUMENTARY SYSTEM
*SUBCUT TISSUEFIERCSARCOMA
(20) 1 (5X)
(20) (50) (50)
RESPIRATORY SYSTEM
•TRACHEAFGLLICULAE-CELL CARCINOMA, METAS
ttLUNGADENCCARC1NOMA, NOS, METASTATICHEB1NGIOSA6COMA. METASTATIC
(20)
(20)
(20)
(20)
(50) 1 (2X)
(50)
(19)
(50) 1 (2%) 1 (2X)
HEhATOEOIETIC SYSTEM
• SPLEENHEMANGIOSARCOMA
(20) (20) (U9) 1 (2X)
(50) 2 (IK)
CIRCULATORY SYSTEM
NCNE
DIGESTIVE SYSTEM
• LIVERNEOPLASTIC NODULEHEEATOCELLOLAR CARCINOMAHEKANGIOSARCOBA
(20) 1 (5X)
(20) 1 (5X)
1 (5S)
(U9)
1 (2X)
(49)
URINA R Y SYSTEM
# K I E N E Y (20) (20) ____ MI X E E _ T U B O S X _ M A L I G N A N T _______________________________ I_
t N U M B E R O F A N I M A L S W I T H T I S S U E E X A M I N E D M I C R O S C O P I C A L L Y * N U M B E R OF A N I M A L S NECROPSIED **EXCLUDtS PARTIALLY AU10LYZED ANIMALS
(19) (50)
A-6

TABLE A2 (CONTINUED)
CONTROL (UNTB) CONTROL (VEH) LOU DOSE HIGH DOSE 01-141F 01-111F 01-114F 01-1 15F
HABAETOMA + 1 (5%)
ENCCCRINE SYSTEM
*PITOITARY CHROMOPHOBE ADENOMA
(20) 8 (40%)
(20)5 (25%) (45)
8 (18%) (47) 9 (19%)
I ADRENAL PHEOCHROMOCY10MA HEMANGIOSARCOMA. METASTATIC
(20) (20) (49) (50) 1 1
(2%) (2%)
ITHYROID FOLIICULAH-CELL CARCINOMA C-CELL ADENOMA C-CELL CARCINOMA
(19)
2 (11%)
(20)
11 (5%) (5%)
(40) 4 (10%)
1 (3%)
(42) 2 (5%)
tPANCREATIC ISLETS ISLET-CELL ADENOMA
(20) 1 (5%)
(20) (47) 2 (4%)
(50)
REPRODUCTIVE SYSIEH
*MAMMARY GLAND (20) (20) (50) (50) ADENCCARCINOMA, DOS 1 (5*) 6 (12%) 4 (8%) FIBBOADENOMA 3 (15%) 4 (20%) 10 (20%) 8 (16%)
*CLITORAL GLAND (20) (20) (50) (50) ADENCCARCINOMA, NOS 1 (2%)
tOTERUS (20) (19) (47) (48) ADENOCARCINOMA, NOS 1 (5%) INDOBETRIAL STROMAL POLYP 1 (5%) 1 (5%) 2 (4%) 3 (6%)
tCEFVIX UTERI (20) (19) (47) (48) SCUAMOUS CELL CARCINOMA 1 (2%)
IOVARJ (20) (19) (47) (50) GRANULCSA-CELL TUMOR 1 (2%)
NEBVCUS SYSTEM
NONE
S P E C I A L S E N S E O R G A N S
* N U M B E R O F A N I M A L S KITH T I S S U E E X A M I N E D MICROSCOPICALLY * l i U M B E R O F A N I M A L S N E C R O P S I E D + THIS IS CONSIDERED TO BE A BENIGN FORM OF THE MALIGNANT MIXED TUMOR OF THE KIDNEY AND CONSISTS OF PROLIFERATIVE
LIPOCYTES, TUBULAR STRUCTURES, FIBROBLASTS, AND VASCULAR SPACES IN VARYING PROPORTIONS.
A-7

TABLE A2 (CONTINUED)
CONTROL(nNTR) COBTROL(VEH) LOU DOSE HIGH DOSE 0 1 - 1 I M F 0 1 - 1 1 1 F 0 1 - 1 1 U F 0 1 - 1 1 5 F
MUSCULOSKELETAL SYSTEM
NCNE
BODY CAVITIES
NONE
ALL CTHER SYSTEMS
•MULTIPLE ORGANS (20) (20) (50) (50) FIBROUS HISTIOCYTOMA, MALIGNANT 1(21)
ANIKA1 DISEOSIIICN SUMMARY
ANIMALS INITIALLY IN STUDY 20 20 50 50 NA1UEAL EFATHS 8 I* 30 23 MORIBUND SACRIFICE 1 SCHEDULED SACRIFICE ACCIDENTALLY KILLED TERMINAL SACRIFICE 12 16 19 27 ASIMAL MISSING
# NUHBEB OF ANIMALS KITH TISSUE EXAMINED MICROSCOPICALLY * NUMBER OF ANIMALS NECROPSIED
A-8

TABLE A2 (CONCLUDED)
CONTROL (ONTR) CONTROL (VEH) LOW DOSE HIGH DOSE 01-141F 01-111F 01-114F 01-115F
TUtOR SUMMARY
TOTAL ANIMALS KITH PRIMARY TUMORS* 13 10 27 23 TOTAL PRIMARY TUMORS 18 17 37 31
TOTAL ANIMALS WITH BENIGN TOMORS 13 9 20 18 TOTAL BENIGN TUMORS 16 11 22 21
TOTAL ANIMALS KITH MALIGNANT TUMOBS 12 9 TOTAL MALIGNANT TDMOBS 1* 10
TOTAL ANIMALS WITH SECONDARY TUMORS* 1 TOTAL SECONDARY TUMORS 1
TOTAL ANIMALS WITH TUMORS UNCERTAINBENIGN OR MALIGNANT 1 1 1
TOTAL UNCERTAIN TUMORS 1 1 1
TOTAL ANIMALS WITH TUMORS UNCERTAINPEIMAEY OR METASTATIC
TOTAL UNCERTAIN TUMORS
PRIMARY TUMORS: ALL TUMORS EXCEPT SECONDARY TUMORS SECONDARY TUMOES: METASTATIC TUMORS OR TUHORS INVASIVE INTO AN ADJACENT ORGAN
A-9


APPENDIX B
SUMMARY OF THE INCIDENCE OF NEOPLASMS IN MICE TREATED WITH IODOFORM


TABLE Bl SUMMARY OF THE INCIDENCE OF NEOPLASMS IN MALE MICE TREATED WITH IODOFORM
CONTROL (ONTR) CONTROL (VEH) LOR DOSE HIGH DOSE 02-M121 02-M111 02-B112 02-H113
ANIMALS INITIALLY IN STUDY 20 20 50 50 ANIMALS KISSING 1 ANIMALS NECRCPSIED 15 19 50 50 ANIMALS EXAMINED HISTOPATHOLOGICALLY ** 15 19 49 50
INTEGUMENTARY SYSTEM
*SKIN (15) (19) (50) (50) SQUAKOUS CELL CARCINOMA 1 (2)1)
RESPIRATORY SYSTEM
»LUNG (15) (19) (50) («9) SQUAKOUS CELL CARCINOMA, METASTA 1 (2*) ALVECLAR/BRONCHIOLAR ADENOMA 1 (7X) 1 (5X) 1 (2*) 3 <6X) ALVECLAR/BBONCHIOLA8 CARCINOMA 3 (6%) 1 <2X)
HEMATOEOIETIC SYSTEM
*MULTIPLE ORGANS (15) (19) (50) (50) MALIG.LYMPHOMA, LYHPHOCYTIC TYPE 1 <5X> 1 (2%) 6 (12X) MALIG.LYrPHOMA, HISTIOCYTIC TYPE 2 (»X) 2 (HX)
ISFLEEN (15) (19) (50) (50) MALIGNANT LYMPHOMA. SOS 1 (7X) MALIG.LYMPHOMA, HISTIOCYTIC TYPE 1 (7X)
ILYMEH NODE (15) (19) (18) (K5) MALIG.LYMPHOMA, HISTIOCYTIC TYPE 1 (7X)
tCERVICAL LYtiEH NODE (15) (19) (18) (15) SQUAMOUS CELL CARCINOMA, METASTA 1 (2X) MAIIG. LYMPHOMA, HISTIOCYTIC TYPE 1 (2X)
*MESENTERIC L. NODE (15) (19) (48) (H5) MALIG.LYMPHOMA, HISTIOCYTIC TYPE 1 (5*) 1 (2%)
•LIVER (15) (19) (19) (50) LYMPHOMA METASTATIC 1 (7X)
CIRCULATORY SYSTEM
NONE
I N U M B E R O F A N I M A L S H I T H T I S S U E E X A M I N E D MICROSCOPICALLY » N U M B E R O F A N I M A L S N E C F O P S I E D **EXCLUDES PARTIALLY AUTOLYZED ANIMALS
B-3

TABLE Bl (CONTINUED)
CONTROL (ONTR) 02-M121
CONTROL(VFH) 02-M111
LOU DOSE 02-H112
HIGH DOSE 02-H113
DIGESTIVE SYSTEM
•SALIVARY GLAND SQUAMOUS CELL CARCINOMA, METASTA
ttlVEfi HEPATOCELLULAR CARCINOMH HEHAKGIOMA HEHANGIOSARCOMA
*STOBACHCARCINOMA,NOSSQOAHOUS CELL CARCINOMA
(15)
(15)
(15)
(18)
(19) 3 (16*)
(19)
(18)
(49) 5 (10*)
(50)
(KO) 1 (3%)
(50) 7 (1UX) 1 (2X> 1 (2%)
(19) 1 (2«) 1 (2X)
URINABY SYSTEM
NONE
ENDOCRINE SYSTEH
tlHYROIDFOLLICULAR-CEL1 ADENOMA
(15) (17) (41) 1 (2X)
(38)
REPRODUCTIVE SYSTEM
NONE
NERVOUS SYSTEM
HONE
SPECIAL SENSE ORGANS
*EYE/LACRIMAL GLANDADENOMA, NOS
(15) (19) (50) 1 (21)
(50) 1(2%)
MDSCBLOSKELETAL SYSTEM
NCNE
BODY CAVITIES
BONE
* KUMBER OF ANIMALS WITH TISSUE EXAMINED MICROSCOPICALLY * NUMBER OE ANIMALS NECROPSIED
B-4

TABLE Bl (CONCLUDED)
CONTROL (UNTH) CONTROL (VEH) LOU DOSE HIGH DOSE 02-M121 02-M111 02-B112 02-H113
ALL CTHER SYSTEMS
NCNE
ANIMAt DISPOSITION SUMMARY
ANIMALS INITIALLY IN STUDY 20 20 50 50 NATURAL DEATHS 17 8 15 15 MORIBUND SACRIFICE 1 I) SCHEDULED SACRIFICE ACCIDENTALLY KILLED 1 TERMINAL SACRIFICE 2 12 31 30 ANIMAL MISSING 1
9 INCLUDES AUTCLYZED AKIMALS
TUHOR SUMMARY
TOTAL ANIMALS KITH PEIMARY TUMORS* 2 5 11 23 TOTAL PRIMARY TUMORS 4 6 1I» 27
TOTAL ANIMALS WITH BENIGN TUMORS 1 1 3 5 TOTAL BENIGN TUMORS 1 1 3 5
TOTAL ANIMALS KITH MALIGNANT TUMORS 2 1 1 1 20 TOTAI MALIGNANT TUMOHS 3 5 1 1 22
TOTAL ANIKALS »ITH SECONDARY TUMORS* 1 TOTAL SECONDARY TUMORS 1
TOTAL ANIKALS KITH TUKORS UNCERTAINBENIGN OR MALIGNANT
TOTAL UNCERTAIN TUMORS
TOTAL ANIMALS KITH TUMORS UNCERTAIN-E flMARY OR METASTATIC
TOTAL UNCERTAIN TUMORS
* PRIMARY TUMORS: ALL TUMORS EXCEPT SECONDARY TUMORS * SECONDARY TUMORS: METASTATIC TUMORS OR TUMORS INVASIVE INTO AN ADJACENT ORGAN
B-5

TABLE B2 SUMMARY OF THE INCIDENCE OF NEOPLASMS IN FEMALE MICE TREATED WITH IODOFORM
CONTROL (UNTR) CONTROL (VEH) LOW DOSE HIGH DOSE 02-F121 02-F111 02-F114 02-F115
ANIMALS INITIALLY IN STUDY 20 20 50 50 ANIMALS HISSING 2 ANIMALS SECROPSIED 18 20 49 45 ANIMALS EXAMINED HISTOPATHOLOGICALLY ** 18 20 49 45
INTEGUMENTARY SYSTEM
*SKIN (18) (20) (49) (45) SQUAMOUS CELL CARCINOMA 1 (2X)
BESPIBATORY SYSTEM
tlUNG (18) (20) (49) (45) ALVEOLAH/BBONCHIOLAR ADENOMA 1 (5*) 1 (2X)
HEMATOEOIETIC SYSTEM
*NERVE TRACT (18) (20) (49) C*5) MALIG.LYMPHOMA, LYMPHOCYTIC TYPE 1 (5X)
IERAIN (16) (20) (49) (45) MALIGNANT LYfiPHOMA, NOS 1 (6X)
*HULTIPLE ORGANS (18) (20) (49) (<*5) MALIG.LYMPHOMA, LYMPHOCYTIC TYPE 3 (6X) 2 (4X) MALIG.LYMPHOMA, HISTIOCYTIC TYPE 1 <5X) 2 (IX)
ISPLEEN (18) (20) (49) (45) MALIGNANT LYMPHOMA, NOS 1 <6X) LYMPHOMA METASTATIC 1 (6X) MALIG.LYMPHOMA. HISTIOCYTIC TYPE 3 (15X)
ILYMPH NODE (18) (20) (47) («5) FIBROUS HISTIOCYTOMA, MALIGNANT 1 <2X) MALIGNANT LYMPHOMA. SOS 2 (11X)
•MESENTERIC L. NODE (18) (20) (47) (45) MALIG.LYMPHOMA. HISTIOCYTIC TYPE 1 <5X)
*LIVER (18) (20) (U9) (<*5)
I N U M B E R OF A N I M A L S K I T H T I S S U E E X A M I N E D MICROSCOPICALLY * K U M B E R O F A N I M A L S NECROPSIED **EXCLUDES PARTIALLY AUTOLYZED ANIMALS
B-6

TABLE B2 (CONTINUED)
MALIG.LYMPHOMA, HISTIOCYTIC TYPE
tPANCREASLYMPHOBA METASTATIC
*SMALL INTESTINEMALIG.LYMPHOBA, HISTIOCYTIC TYPE
IKIDNEYLYMPHOMA METASTATICBALIG.LYBPHOBA, LYBPHOCYTIC TYPE
IOVARY LYMPHOMA METASTATIC
t A D R E N A LMALIG.LYMPHOMA, LYMPHOCYTIC TYPE
CONTROL (UNTR) 02-F121
(18) 1 (6X)
(18)
(18) 2 (11J6)
(18) 2 (11X)
(18)
CONTROL (VEH) 02-F111
1 (5%)
(20)
(20)
(20)
(20)
(20) 1 (5X)
LOB DOSE 02-F11I*
(U9)
(U9) 1 (2%)
(49)
<2X)
(49)
(49)
HIGH DOSE 02-F115
(U5)
(44)
(45)
CIECULATCBY SYSTEM
NONE
DIGESTIVE SYSTEM
*LIVEFHEPATOCELLULAR CARCINOMAENDOMETBIAL STROMAL SARCOMA, METHEMANGIOBAHEBANGIOSARCOBA
(18) (20) 1 (5X)
.
(49) 1 (2X)
1 (2X) 1 (2X) 1 (2X)
(45)
URINARY SYSTEM
iKIDNEYINDOMETRIAL STROMAL SARCOMA, MET
(18) (20) (49) 1 (2X)
(45)
ENDOCRINE SYSTEM
IPITDITARY (16) (19)CHROMOPHOBE ADENOMA
tADRENAL (18) (20)CORTICAL_ADENOMA J_ifiXJ
* NUMBER OF ANIMALS KITH TISSUE EXAMINED MICROSCOPICALLY * SOMBER OF ANIMALS NECROPSIED
(39) 1 (3X)
(49)
(43)
(45)
B-7

TABLE B2 (CONTINUED)
CONTROL ( U N T R ) C O N T R O L ( V E H ) LOU DOSE H I G H DOSE 02-F121 02-F111 02-F114 02-F115
R E P R O D U C T I V E S Y S T E M
* M A M f l A R Y G L A N D (18) (20) (1*9) (K5) A D E N O C A R C I N O M A , N O S 1 (2%) 1 (2X)
I U T E R D S (18) (20) LEIOflYCSARCOBA 1 (2X) E N D O P I E T R I A L S T R O M A L P O L Y P 1 (2X> E N B O M E T 8 I A L S T B O M A L S A R C O M A 1 (2X)
tCVARY (18) (20) (49) (41) CYSTADENCMA, NOS 1 (2X)
NERVOUS SYSTEM
"CRANIAL NERVE (18) (20) (U9) (H5) NEURCFIBROSARCOHA 1 (2X)
SPECIAL SENSE ORGANS
NCNE
HUSCULOSKELETAL SYSTEM
NCNE
BODY CAVITIES
NCNE
ALL CTHEE SYSTEMS
NCNE
* N U B B E R OF A N I M A L S KITH TISSUE T X A M I N E D MICROSCOPICALLY * K D M B F R O F A N I M A L S N E C R O P S I E D
B Op

TABLE B2 (CONCLUDED)
CONTROL (DHTR) CONTROL ( V E H ) LOH DOSE HIGH DOSE 02-F121 02-F111 02-F11U 02-F115
ANIf.AL DISFCSITICN SUMMARY
ANIMALS INITIAILY IN STUDY 20 20 50 50 NATURAL DEATHS MORIBUND SACRIFICE SCHEDULED SACRIFICE ACCIDENTALLY KILLED TERMINAL SACRIFICE 11 18 U3 U3 ANIMAL MISSING 2
a INCLUDES AUTOLYZED ANIMALS
TUBCR S U M M A R Y
TOTAL ANIMALS WITH PRIMARY TUMOilS* It 7 14 5 TCTA1 PRIMARY TUMORS 5 10 18 5
TOTAL ANIMALS WITH BENIGN TUMO6S 1 1 5 TOTAL BENIGN TUMORS 1 1 5
TOTAL ANIMALS WITH MALIGNANT TUMORS 3 6 10 5 TOTAL HALISNANT TUHOHS 1 9 13 5
TOTAL ANIMALS WITH SECONDARY TUMOHS* 3 1 TOTAL SECONDARY TUMORS 7 2
TOTAL ANIMALS WITH TUMORS UNCERTAINBENIGN OR MALIGNANT
TOTAL UNCERTAIN TUflOHS
TOTAL ANIMALS WITH TUMORS UNCERTAINERIHARY OB MITASTATIC
TOTAL UNCEHTAIN TUMORS
* PRIMARY TUBORS: ALL TDMORS EXCEPT SECONDARY TUMORS * SECONDARY TUMORS: MFTASTATIC TUMORS OR TUMORS INVASIVE INTO AN ADJACENT ORGAN
B-9


APPENDIX C
SUMMARY OF THE INCIDENCE OF NONNEOPLASTIC LESIONS IN RATS TREATED WITH IODOFORM


TABLE Cl SUMMARY OF THE INCIDENCE OF NONNEOPLASTIC LESIONS IN MALE RATS TREATED WITH IODOFORM
C O N T E O L ( U N T R ) CONTROL (VEH) LOS DOSE HIGH DOSE 01-111M 01-111M 01-112M 01-113M
ANIMALS INITIALLY 111 STUDY 20 20 50 50 ANIMALS NECECPSIED 20 20 19 50 ANIMALS EXAMINED HISTOPATHOLOGICALLY ** 20 20 19 50
INTEGUMENTABY SYSTEM
*SKIN (20) (20) (1*9) (50) EPIDERMAL INCLUSION CYST 1 (5X) INFLAMMATION, HOS 1 (5X)
*SOBCUT TISSUE (20) (20) (49) (50) EPIDERMAL INCLUSION CYST 1 (5X) THROMBUS, ORGANIZED 1 (2X) ABSCESS, NOS 2 (IX)
RESPIRATORY SYSTEM
ILUNG (20) (19) (19) (50) PNEUMONIA, CHRONIC MURINE 16 (BOX) 11 (58X) 30 (61X) 32 CALCIUM DEPOSIT 1 (2X)
HBHATOPOIETIC SYSTEM
ISPLEEN (19) (19) (17) (50) HEMATOPOIESIS 1 (5X) 1 (5%)
CIRCULATORY SYSTEM
tBEART (20) (19) (19) (50) CALCIUM DEPOSIT 2 (10X) 1 (S%) 1 (2*)
tMYOCARDIUK (20) (19) (19) (50) FIBROSIS 1 (5X) 2 (11X) 1 (8X) 1 (2X) DEGENEEATION, NOS 2 ( 1 1 % ) 5 (10*) 1 (2*)
tENDOCAFDIUM (20) (19) (19) (50)
* N U M B E R O F A N I M A L S K I T H TISSUE E X A M I N E D M I C R O S C O P I C A L L Y * N D M B E R OF A N I M A L S N E C R O P S I E D **EXCLUDES PARTIALLY AU10LYZED ANIMALS
C-3

TABLECl (CONTINUED)
CONTROL (UNTB) 01-111H
CONTROL (VEH) 01-1111!
LOH DOSE 01-112W
HIGH DOSE 01-113B
*AORTA MEDIAL CALCIFICATION
(20) 3 (15*)
(20) 4 (20*)
(K9) 9 (18X)
(50) 2 (IX)
*CORONARY ARTERY MEDIAL CALCIFICATION
(20) 2 (10X)
<20) 2 (10*)
(U9) (50)
*MESENTERIC ARTERY MEDIAL CALCIFICATION
(20) 1 (5%)
(20) 2 (10*)
(K9) 3 (6X)
(50) 2 (IX)
DIGESTIVE SYSTEM
ILIVEB THBOKBUS, ORGANIZED INFLAMMATION, DOS PELIOSIS HEPATIS METAKORPHOSIS FATTY
*BILE DUCT HYPEEPLASIA, NOS
*f ANCREAS PEBIARTERITIS
•ESOPHAGUS EUFTURE INFLAMMATION, NOS
(20)
1
1
(20)
(19)
(19)
(5X)
(5X)
(20)
1 (5%) 2 (10*)
(20) 1 (5«)
(19)
(20)
(«9) 1 (2X)
2 (IX)
(149) 3 (6X)
(tB) 2 (tX)
(19)
(50)
1 (2X) 2 («X)
(50)
(15)
(50) 2 (IX) 2 (IX)
•STOMACH INFLAMMATION, FOCAL CALCIUM DEPOSIT
(20)
3 (15X)
(20) 1 (5%) 3 (15X)
(K9)
5 (10X)
(50)
1 (2X)
URINARY SYSTEM
IKIDNEY PYELONEPHRITIS. NOS INFLAMMATION, CHRONIC CALCIUM DEPOSIT
tURINARY BLADDER INFLAMMATION, NOS
(19) 2
131
(19) 1
(11X) (68%) (5X)
(5X)
(20) 1 (5*)
11 (55X)
(18)
(19)
23 (17X) 5 (10X)
(18) 1 (2X)
(50)
8 (16%) 2 (IX)
(37)
ENDOCRINE SYSTEM
•ADRENAL CYSTX NOS_ .
(19) (19) ._ _1 -1551
# NUMBER OF ANIMALS KITH TISSUE EXAMINED MICROSCOPICALLY * KUBBER OF ANIMALS NECROPSIED
_ . (18)
-
(19)
— .
C-4

TABLE Cl (CONTINUED)
CONTROL (UNTB) 01-141H
CONTROL (VEH) 01-111M
THROMBUS, ORGANIZED
IADRENAL COHTEX DEGENERATION, NOS
(19) (19) 1 (5%)
tADRENAL MEDULLA CYST, NOS
(19) (19) 1 (5X)
ITHYROID FOLLICULAR CYST, NOS HYPERPLASIA, FOLLICULAR-CELL
(19) 1 (5%)
(17)
•PARATHYROID HYPEBPLAEIA, NOS
(19) 1 (5%)
(10) 3 (30%)
REPRODUCTIVE SYSTEM
tFBOSTATE (19) (19) INFLAMMATION, NOS 2 (11%) 2 (11%)
tlESTIS (19) (19) CALCIUM DEPOSIT CALCIFICATION, NOS ATROPHY, NOS 8 (12%) K (21%)
*EPIDIDY«IS (20) <20) EPIDERMAL INCLUSION CYST NECROSIS, FAT 2 (10%)
NEBVCUS SYSTEM
NONE
SPECIAL SENSE ORGANS
*EYE/COeNEA (20) (20) INFLAMMATION, NOS
H O S C U L C S K E L E T A L S Y S T E M
* S K E L E T A L M U S C L E (20) (20)
* NUMBER OF ANIMALS KITH TISSUE EXAMINED MICROSCOPICALLY * NUMBER OF ANIMALS NECROPSIED
C-5
10H DOSE 01-112M
1 (2%)
(18) 2 (<tX)
(«8)
(«3) 4 (9%) 1 (2%)
(U1) 4 (10%)
(39) 3 (8X)
(18) U (8%) 1 (2%)
11 (23%)
(H9) 1 (2%) » (8%)
(U9) 1 (2%)
HIGH DOSE 01-1138
(19) 1 (2%)
(119)
(37) 1 (3%)
(23) 1 (1%)
(25)
(50) 1 (2%)
6 (12%)
(50)
(50)
(50)

TABLECl (CONCLUDED)
CONTROL(UNTR) CONTROL (YEH) LOi DOSE HIGH DOSE 01-1U1M 01-111M 01-112H 01-113H
BODY CAVITIES
*PEBICARDIUM (20) (20) (U9) (50) INFLABBATION, NOS 2 (10*) 1 (2X)
»BESENTERY (20) (20) (U9) (50) PEKIARTEEITIS 2 (10X) 1 (2K)
ALL OTHEF SYSTEHS
HCNE
SPECIAL MORPHOLOGY SUMMARY
NO LESION REPORTED 1 7 10 AUTOLYSIS/NO NECROPSY 1
* NUBEER OF ANIMALS BI1H TISSUE EXAMINED MICROSCOPICALLY * NUMBER OF ANIMALS NECROPSIED
C-6

TABLE C2 SUMMARY OF THE INCIDENCE OF NONNEOPLASTIC LESIONS IN FEMALE RATS TREATED WITH IODOFORM
CONTROL (ONTR) 01-141F
CONTROL (VEH)01-111F
LOW DOSE 01-111F
HIGH DOSE 01-115F
ANIMALS INITIALLY IK STUDY 20 ANIMALS NECBCPSIED 20 ANIMALS EXAMINED HISTOPATHOLOGICALLY** 20
202020
50 50 50
50 50 50
INTEGUMENTARY SYSTEM
»SKININFLAMMATION, NOSHYPERKERATOSIS
(20) 1 (5*)
(20) (50)1 <2X) 1 <2X)
(50)
*SUBCDT TISSUEABSCESS, NOS NECROSIS, FAT
(20) (20) (50)2 (4X) (50)
1 (2%)
HESPIRATORY SYSTEM
tLUNGINEUHONIA, CHRONIC MURINE (20)
19 (95X) (20)18 (90*)
(50) 37 (lt%)
(50) 37 (71*)
HEMATCEOIETIC SYSTEM
tSPLEENLEDKOCYTCSIS, NOS HEMATOPOIESIS
(20)
3 (15X)
(20) (49) (50) 1 (2%) 3 (6%)
tCERVICAL LYMPH NODEINFLAMMATION, NOS
(20) <18) (UK)1 (2X) («U)
1 (2%)
tTHYMUSCYST, NOS INFLAMMATION, NOS
(16) (13) (3«)2 (6%) 1 (3X)
(26)
CIECULA1CRY SYSTEM
*MYOCABDIDMINFLAMMATION, NOS
(20) (20) (50)3 (6X) (U9)
• ENDOCARDIUMjJXEIREliSIA,. JJO.S
(20) 1 i5Sl
(20) (50) (U9)
* N U M B E R O F A N I M A L S BITH T I S S U E E X A M I N E D« N U M B E R O F A N I M A L S N E C R O P S I E D "EXCLUDES PARTIALLY AUTOLYZED ANIMALS
M I C R O S C O P I C A L L Y
C-7

TABLE C2 (CONTINUED)
CONTROL (DNTR) 01-141F
CONTROL (VEH) 01-111P
LOB DOSE 01-114F
HIGH DOSE 01-115F
*AORTA MEDIAL CALCIFICATION
(20) 1 (5*)
(20) (50) (50)
DIGESTIVE SYSTEM
•SALIVARY GLAND CYST, NOS
(16) (17) 1 (6X)
(27) (34)
•LIVER INFLAMMATION, NOS PELICSIS HEPATIS METAMORPHOSIS FATTY
(20) 1
2
(5X)
(10X)
(20)
1 (551)
(49) 1
4
(2X)
(8X)
(49)
1 (2X)
tLIVEfi/EERIEORTAL METAMORPHOSIS FATTY
(20) (20) (49) 1 (2X)
(49)
*BILE DUCT HYPERPLASIA, NOS
(20) 2 (10X)
(20) 1 (5*)
(50) (50) 1 (2X)
*ESOPHAGUS INFLAMMATION, NOS
(20) (20) (50) 3 (6X)
(45)
*STCMACH ULCER, FOCAL
(20) 3 (15X)
(20) (48) 2 <4X)
(50)
*COLON NEMATODIASIS
(20) (18) (34) (33) 1 (3X)
URINARY SYSTEM
IKIDNEY HYDEONEPHEOSIS PYELONEPHEITIS, NOS INFLAMMATION, CHRONIC CALCIUM DEPOSIT
(20)
6 (30*) 1 (5X)
(20)
1 (5X) 1 <5X) 1 <5X)
(49)
10 4
(20X) (8X)
(50) 1
5
(2X)
(10X)
#URI N A R Y BLADDER INFLAMMATION, NOS
(20) (20) (40) (41) 1 (2X)
ENtCCHINE SYSTEM
tADRENAL CALCIUM DEPOSIT
(20) 1 X5&1.
(20) (49) (50)
t N U M B E R* N U M B E R
O F O F
A N I M A L S A N I M A L S
K I T H T I S S U E E X A M I N E D N E C R O P S I E D
MICROSCOPICALLY

TABLE C2 (CONTINUED)
.. _ CONTROL (UNTR) 01-141F
CONTROL (VEH) 01-111F
ANGIECTASIS 2 (10X)
•ADRENAL CORTEX DEGENERATION, NOS ANGIECTASIS
(20)
5 (25X)
(20) 31 (15X) (5X)
tlHYROID FOLLICULAR CYST. NOS HYPEEPLASIA, C-CELL HYPERPLASIA. FOLLICULAR-CELL
(19) 2 (11X)
(20) 2 (1051)
IPARATHYROIC HYPESPLASIA, NOS
(20) (13)
REPRODUCTIVE SYSTEB
*HAMBARY GLAND (20) (20) NECROSIS, FAT 1 (5X)
*VAGINA (20) (20) INFLAMMATION, NOS 1 (5%) E01YP, INFLAMMATORY 1 (5X)
IBTERliS (20) (19) HYEBOMETBA INFLAMMATION, NOS PYOMZTRA
IUTERUS/ENDOMET8IOM (20) (19) INFLAMMATION, NOS 2 (10X) HYPEFPLASIA, CYSTIC
ICVARY/OVIDUCT (20) (19) INFLAMMATION, NOS
IOVARY (20) (19) CYST, NOS 1 (5X) 1 (5*)
NERVOUS SYSTEM
»BRAIN/«ENINGES (20) (20) INFLAMMATION, NOS
SPECIAL SENSE ORGANS
*EYE (20) (20) §YjiicHiAt EOSTERIOR
• NUMBER OF ANIMALS KITH TISSUE EXAMINED MICROSCOPICALLY * NUMBER OF ANIMALS SECROPSIED
C-9
LOU DOSE 01-114F
(49) 1 <2X) 3 (6X)
(«0) 2 (5X)
(50) 1 (2X)
(50)
(50)
(«7) 2 {<•*) 1 (2X)
(47)
1 (2X)
(it 7)
(17) 2 (tX)
(50) 1 (2X)
(50)
HIGH DOSE 01-115F
1 12%)
(50) 6 (12X) 1 <2X)
(12) 2 (5X) 1 (2X) 1 (2X)
(33)
(50)
(50)
(18) 1 <2X) 1 (2X) 1 (2X)
(US)
1 (2X)
(48) 1 (2X)
(50) 1 (2X)
(50)
(50) 1 J2SI _

TABLE C2 (CONCLUDED)
CONTROL(UNTR) CONTROL(VEH) LOW DOSE HIGH DOSE 01-141F 01-111F 01-11UF 01-115F
HUSCULOSKELETAL SYSTEM
NONE
BODY CAVITIES
*EERICAPDIUM (20) (20) (50) (50) INFLAMMATION, NOS 2 (10X) 1 (8%) 1 (2X)
ALL CTHEB SYSTEMS
NONE
SPECIAL MORPHOLOGY SUMMARY
BO LESION REPORTED 3 5
t NUfEER OF ANIMALS HITH TISSUE FXAMINFD MICROSCOPICALLY * NUMBER OF ANIMALS NECROPSIED
c-io

APPENDIX D
SUMMARY OF THE INCIDENCE OF NQNNEOPLASTIC LESIONS IN MICE TREATED WITH IODOFORM


TABLED! SUMMARY OF THE INCIDENCE OF NONNEOPLASTIC LESIONS IN MALE MICE TREATED WITH IODOFORM
CONTHOL(UNTR) CONTROL (VEH)02-M121 02-M111
LOU DOSE 02-B112
HIGH 02-M
DOSE 113
ANIMALS INITIALLY IN STUDY ANIMALS MISSING ANIMALS NECROPSIED ANIMALS EXAMINED HISTOPATHOLOGICALLY**
201
1515
20
19 19
50
50 «9
50
50 50
INTEGUMENTARY SYSTEM
*SKIN (15) (19) (50) (50) INFLAMMATION, CHRONIC 1 (2%) ABSCISS, CHRONIC 1 (7%)
*SUBCUT TISSUE (15) (19) (50) (50) EDEMA, NOS 1 (7%)ABSCESS, NOS 1 <5X) GRANULOMA, NOS 1 (2%)
RESPIRATORY SYSTEM
tTFACHEA (15) (19) (UU) (UO) INFLAMMATION, NOS 1 (3%)
• LUNG (15) (19) (50) (U9) CONGESTION, NOS 9 (60%) 2 (U%) INFLAMMATION, NOS 1 (7X) PNEUMONIA, CHRONIC SURINE 2 (11%) 13 (26%) 12 (2U%)
HEBATOPOIETIC SYSTEM
*EONE MARROS (15) (19) (U8) («8) NECROSIS, NOS 1 (2%) HYPEEPLASIA, HEMATOPOIETIC 1 (7%)
tSPIEEN (15) (19) (50) (50) AMYLOIDOSIS 7 (U7%) 2 (11%) 9 (18%) 5 (10%) HYPERPLAEIA, LYMPHOID 1 (7%) 1 (2%)
((LYMPH NODE (15) (19) (18) (45) CONGESTION, NOS 2 (13%) i*S£i!2!P_DEPI.E.TIO.J! 1 QJJ
* N U M B E R OF A N I M A L S W I T H TISSUE E X A M I N E D MICROSCOPICALLT * N U M B E R OF A N I H A L S NECROPSIED **EXCLUDES PARTIALLY AUTOLYZED ANIMALS
D-3

TABLE Dl (CONTINUED)
CONTROL (DNIR) CONTROL (VEH)02-M121 02-M111
HYEEEPLASIA, LYMEHOID 1 <7X)
ICERVICAL LYMPH NODE (15) (19) CYST, NOS ANGIECTASIS 1 (5%)
•SUPERIOR DEEP CERVIC (15) (19) ANGIECTASIS 1 (5X)
tERCNCHIAL LYMPH NODE (15) (19) ABSCESS, NOS
tMESENTFRIC L. NODE (15) (19) CONGESTION, NOS HYPEEPLASIA, LYMPHOID
CIBCULATOEY SYSTEM
tHEART (15) (19) MINEFALIZAIION
*AORTA (15) (19) INFLAMMATION, ACUTE 1 (7X)
DIGESTIVE SYSTEM
tSALIVARY GLAND (15) (18) CYST, NOS
*IIVER (15) (19) INFABCT, NOS AMYLCIDCSIS 7 (47X) 2 (11*) ANGIECTASIS 1 <7X)
*LIVER/CENTRILOBULAR (15) (19) NECROSIS, NOS NECROSIS, FOCAL
IFANCEEAS (15) (19) AKYLOIDOSIS
((ESOPHAGUS (15) (19) RUPTURE INFLAMMATION^ SUPPUKATIVF
* NUMBER OF ANIMALS WITH TISSUE EXAMINED MICROSCOPICALLY * NUMBER OF ANIMALS NF.CROPSIED
D-4
LOB DOSE 02-H112
1 <2X)
(48) 1 <2X)
(48)
(48)
(48) 1 (2X)
(50) 3 (6X)
(50)
(48)
(49) 1 (2X) 6 (12X)
(49)
1 (2X)
(50) 6 (12X)
(50) _
HIGH DOSE 02-H113
(45)
(45)
(45) 1 <2X)
(45)
2 (4X)
(50)
(50)
(40) 1 <3X)
(50) 1 (2X) 2 (4X)
(50) 1 (2X)
(49)
(48) 1 (2X)
. l_12il

TABLE Dl (CONTINUED)
CONTROL (UNTB)02-B121
CONTROL (VEH) 02-M111
LOW DOSE 02-H112
HIGH DOSE 02-M113
tSTCMACH HYPEFKERATOSIS
tLARGE INTESTINE NEMATODIASIS
*COLON NEMATODIASIS
(15)
(15)
(15)
(19)
(19)
(19) 3 (16%)
(50)
(48) 2 («%)
(48)
(19) 1 (2%)
(47)
(47)
OBINABY SYSTEH
IKIDNEY MINERALIZATION HYERONEPHBOSIS LTMPHOCYTIC INFILTRATE PYELONEPHRITIS SUPPUBATIVE INFLAHBATION. ACUTE SUPPURATIVE INFLAMMATION, CHRONIC FIBBOSIS, DIFFUSE AHYLOIDOSIS CALCIFICATION, FOCAL
IKIDNEY/TUBULE CYTOPLASHIC VACDOLIZATION
•URINARY BLADDER INFLAMMATION, NOS HYPEFPLASIA. EPITHELIAL
(15)
2 (13X)
2 (13%) t (27X)2 (13%) 3 (20%)
(15)2 (13%)
(15)
(19)
1 (5*)
1 (5%)
(19)
(19) 1 (5*)
(50) 1 (2%)
2 (1%)
9 (18%)
(50)
(50)
(50)
6 (12%)
1 (2%)
(50)
(49)
3 (6%)
EHEOCHINE SYSTEM
* ADRENAL AMYLOIDOSIS
•THYROID HYPERPLASIA, FOLLICULAR-CELL
(15)3
(15)
(20%) (19)
(17)
(50)
(41) 2 (5%)
(50) 2 <<•%)
(38)
REPRODUCTIVE SYSTEH
tPROSTATE INFLAMMATION, ACUTE SfiAl!ULQMA1._SPEJIIATIC
(15)1 (7%) (18) (50) (50)
_l_i2SI_-
* NUMBER OF ANIMALS KITH TISSUE EXAMINED MICROSCOPICALLY » NUMBER OF ANIMALS NECROPSIED
D-5

TABLE DI (CONTINUED)
CONTROL (UNTR) CONTROL (VEH) 02-M121 02-M111
tTESTIS (15) (18) ATBOFHY, NOS
*EPIDIDYMIS (15) (19) GRANDLCMA, SPERMATIC 1 (5%) NECBCSIS, FAT
NEEVOUS SYSTEM
tERAIN/KENINGES (15) (19) INFLAMMATION, NOS INFLAMMATION, ACUTF 1 (71)
tERAIN/FPENCYHA (15) (19) INFLAMMATION, NOS
*EfiAIK (15) (19) COMPKESSION
SPECIAL SENSE ORGANS
*EYE (15) (19) INFLAMMATICS, CHRONIC
*EYE/CORNEA (15) (19) INFLAMMATION. NOS
MUSCULOSKEIETAL SYSTEM
NCNE
BODY CAVITIES
*ELEURA (15) (19) INFLAMMATION, SUPPUEATIVE
ALL CTHEB SYSTEMS
—NONE
* NUMBER OF ANIMALS WITH TISSUE EXAMINED MICROSCOPICALLY * NUMBER OF ANIMALS NECROPSIED
D-6
LOU DOSE 02-H112
(09) 1 (2X)
(50)
2 (HX)
(50)
(50)
(50)
(50)
(50)
(50)
HIGH DOSE 02-H113
(50)
(50)
(148) 1 (2X)
(U8) 1 (2X)
(US) 1 (2X)
(50) 1 (2X)
(50) 1 (2%)
(50) 1 (2X)

TABLE DI (CONCLUDED)
CONTROL(UNTR) CONTROL(VEH) LOW DOSE HIGH DOSE 02-M121 02-M111 02-M112 02-M113
SPECIAL MORPHOLOGY SUMMARY
NO LESION REPORTED 1 8 12 13 ANIMAL HISSING/NO NECROPSY 1 AUTO/NECROPSY/NO HISTO 1 AUTOLYSIS/NO NECBOPSY 4 1
* KUMEER OF ANIMALS KITH TISSUE EXAMINED MICROSCOPICALLY * NUMBER OF ANIMALS NECROPSIED
D-7

TABLE D2 SUMMARY OF THE INCIDENCE OF NONNEOPLASTIC LESIONS IN FEMALE MICE TREATED WITH IODOFORM
c:ONTROI(UNTR) CONTROL (VEH) LOW DOSE HIGH DOSE 02-F121 02-F111 02-F114 02-F115
A8IKALS INITIALLY IN STUDY 20 20 50 50 ANIMALS KISSING 2 ANIMALS NECBCPSIED 18 20 49 45 ANIMALS EXAMINED HISTOFATHOLOGICALLY** 18 20 49 145
INTEGUMENTARY SYSTEM
*SKIN (18) (20) (49) (45) ACANTHOSIS 8 (44X)
RESPIBATORY SYSTEM
ITRACHEA (18) (20) (47) (44) INFLAMMATION, NOS 1 (2X) 1 (2X)
tLBNG (18) (20) (49) (45) CONGESTION, NOS 9 (5C%) EDEMA, NOS 1 (6X) HEMORRHAGE 1 (2X) 3 (7X) INFLAMMATION, NOS 4 (22X) PNEUMONIA, CHRONIC MURINE 1 (6X) 2 (10X) 5 (10X) 4 (9X)
HEMATOPOIEIIC SYSTEM
tEONE MARROH (18) (20) (49) (45) HEHORHHAGE 1 (6X) HYPEPPLASIA, HEMATOPOIETIC 2 (11X)
ISPLEFN (18) (20) (49) (45) INFLAMMATION, ACUTE 1 (6X) AMYLOIDOSIS 1 (2X) HYPERPLASIA, RETICULUB CELL 1 <2X) HYPERPLASIA, LYKPHOID 5 (28X) 1 (2X) 2 (4%)
tLYMFH NODE (18) (20) (47) (45) INFLAMMATION, CHRONIC 1 (6%) HYPEFPLASIA, LYMPHOID 2 (11X)
tCERVICAL LYMPH NODE (18) (20) (47) (45) INFLAMMATION^ NOS - , . _ . . . _ , . , _ _ . , , _ 1 ,J2X) ,
t N U M B E R O F A N I M A L S W I T H TISSUE E X A M I N E D MICROSCOPICALLY * N U M B E R O F A N I M A L S N E C R O P S I E D **EXCLUDES PARTIALLY AUTOLYZED ANIMALS
D-8

HYPEFPLASIA, LYHFHOID
IMESENTEHIC L. NODE INFLAMMATION. NOS AHGIECTASIS HYPERPLASIA, LYMPHOID
CIRCULATORY SYSTEM
tHEAET PEEIABTEBITIS
DIGESTIVE SYSTEM
ILIVEE THBOHBUS, ORGANIZED LYBPHOCYTIC INFILTRATE INFLAMMATION, ACUTE/CHRONIC NECROSIS, NOS INFABCT, NOS HYPFRPLA2IA, FOCAL
tLIVEB/CENTBILOBULAB NECROSIS, NOS
•PANCREAS CYSTIC DUCTS ATROPHY, NOS
•PANCREATIC DUCT EILATATICN, NOS
•PANCREATIC ACINUS ATFOFHY, NOS
*STOMACH INFLAMMATION, FOCAL ULCEB, ACUTE
•SMALL INTESTINE HYPEBPLASIA, LYMPHOID
ICOLON NEMATODIASIS
# NUMBER OF ANIMALS KITH TISSUE* NUMBER OF ANIMALS NECROPSIED
TABLE D2 (CONTINUED)
CONTROL (DNTR) CONTROL (VEH) 02-F121 02-F111
(18) (20)
(18) (20)
(18) (20)
2 (11X) 1 (6%)
(18) (20)
(18) 120)
(18) (20) 1 (5X)
(18) (20)
(18) (20)
1 (6%)
(18) (20) 1 (6X)
(18) (20) 3 J15J1
EXAMINED MICROSCOPICALLY
D-9
LOB DOSE 02-F11U
2 («%)
(47) 2 (IX)
2 (KX)
(19)
(19)
1 (2X) 1 (2X)
(19) 1 (2*)
(1*9) 6 (12*) 1 (2X)
(19)
(19) 1 (2X)
(19)
(19)
(18)
HIGH DOSE 02-F115
(15)
1 (2X) 2 (IX)
(15) 1 <2X)
(15) 1 (2X)
2 (IX)
(15)
(15) 2 (IX)
(15)
(15)
(15)1 <2X)
(15)
(13)

TABLE D2 (CONTINUED)
CONTROL (UNTR) 02-F121
CONTROL (VEH) 02-F111
LOU DOSE02-F114
HIGH DOSE 02-F115
URINARY SYSTEM
IKIENEY HYCRCNEPHROSIS CYST, NOS PYELONEPHRITIS, NOS LYflPHOCYTIC INFILTRATE INFLAMMATION, CHRONIC ATROPHY, NOS
(18) 1 (6X)
4 (22X) 1 (6X)
(20)
1 (5X)
1 (5X)
(49)
1 (2X)
(45)
1 (2X>
tUPINARY BLADDER LYMPHOCYIIC INFILTRATE
(18) 1 (6X)
(19) (48) (44)
ENDOCRINE SYSTEM
IADRENAI CORTEX DEGENERATION, NOS HYPEtPLASIA, NOS
(18)
1 (6X)
(20) (49) (45) 1 (2X)
RF.PECDUCTIVE SYSTEM
* M A M M A R Y GLAND GALACTOCELE
(18) (20) (49)1 (2X) (45)
•UTERUS HYDROMETRA INFLAMMATION, NOS PYOMETFA INFLAMMATION, ACUTEANGIECTASIS
SUPPURATIVE
(18)
1 (6X)
(20) 2 (10X) 2 (10X)
(48)2 <4X)
1 <2X)
(44) 1 (2X)
1 (2X)
IUTERUS/ENDCMETRIDM HYPEEiPLASIA, CYSTIC
(18) 15 (83X)
(20) 9 (1*5X)
(48)39 (81X) (44)
41 (93X)
JtOVAHY CYST, NOS FOLLICULAR CYST, NOS ABSCESS, NOS ATROPHY, NOS
(18) 2 (11X) 1 <6X)
2 (11X)
(20) 2 (10X)
(49)4 (8X)1 (2X)
(44) 7 (16X) 6 (14X) 1 (2X)
8EEVCUS SYSTEM
tERAIN MALACJA _ _
(16) (20) (49) (45) J (2%)
# NUMBER OF ANIHALS HITH TISSUE EXAMINED MICROSCOPICALLY * NUNEFR OF ANIMALS NECROPSIED
D-IO

TABLE D2 (CONCLUDED)
CONTROL (UNTB) CONTROL (VEH) LOU DOSE HIGH DOSE 02-F121 02-F111 02-F11U 02-F115
SPECIAL SENSE ORGANS
*EYE (18) (20) (49) (45) PHTHISIS SULEI 1 (2X)
HUSCULOSKELEIAL SYSTEM
NCNE
BOCY CAVITIES
*PEEITCNEUK (18) (20) (49) (45) I N F L A M M A T I O N , NOS 1 (2*)
ALL C1HEB SYSTEMS
*BULTIPIE ORGANS (18) (20) (49) (45) AMYLOIDOSIS 1 (2*)
SPECIAI hOKFHOLOGY S U M M A R Y
NO LESION EEFORTED 2 1 2 ANIMAL MISSING/NC NECROPSY 2 AUTOLYSIS/NC NECECPSY 2 1 3
f NUBEIR OF ANIMALS UI7H TISSUE EXAMINED MICROSCOPICALLY » NUMBER OF ANIKALS NECROPSIED
D-l


Review of the Bioassay of lodoform* for Carcinogenicity by the Data Evaluation/Risk Assessment Subgroup of the
Clearinghouse on Environmental Carcinogens
April 26, 1978
The Clearinghouse on Environmental Carcinogens was established in May, 1976, in compliance with DHEW Committee Regulations and the Provisions of the Federal Advisory Committee Act. The purpose of the Clearinghouse is to advise the Director of the National Cancer Institute (NCI) on its bioassay program to identify and to evaluate chemical carcinogens in the environment to which humans may be exposed. The members of the Clearinghouse have been drawn from academia, industry, organized labor, public interest groups, State health officials, and quasi-public health and research organizations. Members have been selected on the basis of their experience in carcinogenesis or related fields and, collectively, provide expertise in chemistry, biochemistry, biostatistics, toxicology, pathology, and epidemiology. Representatives of various Governmental agencies participate as ad hoc members. The Data Evaluation/ Risk Assessment Subgroup of the Clearinghouse is charged with the responsibility of providing a peer review of reports prepared on NCI-sponsored bioassays of chemicals studied for carcinogenicity. It is in this context that the below critique is given on the bioassay of lodoform for carcinogenicity.
The primary reviewer said that the study did not provide evidence that lodoform was carcinogenic in rats or mice, under the conditions of test. After a brief description of the experimental design, Me commented that the subchronic study was deficient in that it provided little help in establishing chronic dose levels. He noted the numerous dose changes which occurred during the chronic phase and the fact that a maximum tolerated dose may not have been achieved. The only statistically significant neoplasm observed was a follicular-cell tumor of the thyroid in low dose male rats.
The secondary reviewer opined that the dose levels administered were sufficiently high, based on an inspection of survival curves. He concurred with the conclusion in the report that lodoform was not carcinogenic under the conditions of test.


It was moved that the report on the bioassay of lodoform be accepted as written. The motion was seconded and approved unanimously.
Members present were:
Michael Shimkin (Acting Chairman), University of California at San Diego
Joseph Highland, Environmental Defense Fund George Roush, Jr., Monsanto Company Louise Strong, University of Texas Health Sciences Center John Weisburger, American Health Foundation
Subsequent to this review, changes may have been made in the bioassay report either as a result of the review or other reasons. Thus, certain comments and criticisms reflected in the review may no longer be appropriate.
•ft U. S . G O V E R N M E N T P R I N T I N G O F F I C E : 1 9 7 8 - 2 6 0 - 8 9 9 / 3 1 6 3


DHEW Publication No. (NIH1 78-1365