Embed Size (px)
Citation preview

1979
National Cancer Institute
CARCINOGENESIS Technical Report Series NO. 155
BIOASSAY OF
2, 4, 6-TRICHLOROPHENOL
FOR POSSIBLE CARCINOGENICITY
CAS No. 88-06-2
NCI-CG-TR-155
U.S. DEPARTMENT OF HEALTH, EDUCATION, AND WELFARE Public Health Service National Institutes of Health


BIOASSAY OF
2,4,6-TRICHLOROPHENOL
FOR POSSIBLE CARCINOGENICITY
Carcinogenesis Testing Program Division of Cancer Cause and Prevention
National Cancer Institute National Institutes of Health Bethesda, Maryland 20014
U. S. DEPARTMENT OF HEALTH, EDUCATION, AND WELFARE Public Health Service
National Institutes of Health
DHEW Publications No. (NIH) 79-1711

11

BIOASSAY OF 2,4,6-TRICHLOROPHENOL
FOR POSSIBLE CARCINOGENICITY
Carcinogenesis Testing Program Division of Cancer Cause and Prevention
National Cancer Institute National Institutes of Health
FOREWORD; This report presents the results of the bioassay of 2,4,6-trichloropheno1 conducted for the Carcinogenesis Testing Program, Division of Cancer Cause and Prevention, National Cancer Institute (NCI), National Institutes of Health, Bethesda, Maryland. This is one of a series of experiments designed to determine whether selected chemicals have the capacity to produce cancer in animals. A negative result, in which the test animals do not have a greater incidence of cancer than control animals, does not necessarily mean that the test chemical is not a carcinogen, inasmuch as the experiments are conducted under a limited set of circumstances. A positive result demonstrates that the test chemical is carcinogenic for animals under the conditions of the tests and indicates that exposure to the chemical is a potential risk to man. The actual determination of the risk to man from chemicals that are carcinogenic in animals requires a wider analysis.
CONTRIBUTORS; This bioassay of 2,4,6-trLchloropheno1 was conducted by the NCI Frederick Cancer Research Center (FCRC) (1), Frederick, Maryland, operated for NCI (2) by Litton Bionetics, Inc.
The manager of the bioassay at FCRC was Dr. B. Ulland, the toxicologist was Dr. E. Gordon, and Drs. R. Cardy and D. Creasia compiled the data. Ms. S. Toms was responsible for management of data, Mr. D. Cameron for management of histopathology, Mr. L. Callahan for management of the computer branch, and Mr. R. Cypher for management of the facilities. Mr. A. Butler performed the computer services. Necropsies were performed by Drs. B. Ulland, R. Schueler, R. Ball, and R. Cardy. The lesions of the rats and mice were reviewed by Drs. J. L. Stookey and J. M. Ward (2), and the diagnoses included in this report represent their interpretations.
ill

Animal pathology tables and survival tables were compiled at EG&G Mason Research Institute (3). Statistical analyses were performed by Dr. J. R. Joiner (4), and Ms. P. L. Yong <"4), using methods selected for the bioassay program by Dr. J. J. Gart (5). The chemicals used in this bioassay were analyzed at FCRC Cancer Research Center by Dr. W. Zielinsky. The chemical analyses and narrative were reviewed and approved by Dr. Lijinsky O).
This report was prepared at Tracer Jitco (5) under the direction of NCI. Those responsible for the report at Tracor Jitco were Dr. C. R. Angel, Acting Director of the Bioassay Program; Dr. S. S. Olin, Deputy Director for Science; Dr. J. F. Robens, toxicologist; Dr. R. L. Schueler, pathologist; Dr. G. L. Miller, Ms. L. A. Owen, Ms. M. S. King, and Mr. W. D. Reichardt, bioscience writers; and Dr. E. W. Gunberg, technical editor, assisted by Ms. Y. E. Presley.
The following scientists at NCI were responsible for evaluating the bioassay experiment, interpreting the results, and reporting the findings: Dr. Kenneth C. Chu, Dr. Cipriano Cueto, Jr., Dr. J. Fielding Douglas, Dr. Richard A. Griesemer, Dr. Thomas E. Hamm, Dr. William V. Hartwell, Dr. Morton H. Levitt, Dr. Harry A. Milman, Dr. Thomas W. Orme, Dr. A. R. Patel, Dr. Sherman F. Stinson, Dr. Jerrold M. Ward, and Dr. Carrie E. Whitmire.
(1) Frederick Cancer Research Center, P.O. Box B, Frederick, Maryland.
(2) Carcinogenesis Testing Program, Division of Cancer Cause and Prevention, National Cancer Institute, National Institutes of Health, Bethesda, Maryland.
(3) EG&G Mason Research Institute, 1530 East Jefferson Street, Rockville, Maryland.
(4) Tracor Jitco, Inc., 1776 East Jefferson Street, Rockville, Maryland.
(5) Mathematical Statistics and Applied Mathematics Section, Biometry Branch, Field Studies and Statistics, Division of Cancer Cause and Prevention, National Cancer Institute, National Institutes of Health, Bethesda, Maryland.
iv

SUMMARY
A bioassay of 2,4,6-trichlorophenol for possible carcinogenicity was conducted by administering the test chemical in feed to F344 rats and B6C3F1 mice.
Groups of 50 rats of each sex were administered 2,4,6-trichlorophenol at one of two doses, either 5,000 or 10,000 ppm, for 106 or 107 weeks. Matched controls consisted of 20 untreated rats of each sex. All surviving rats were killed at the end of administration of the test chemical.
Groups of 50 male mice were administered 2,4,6-trichlorophenol at one of two doses, either 5,000 or 10,000 ppm for 105 weeks. Groups of 50 female mice were administered the test chemical at one of two doses, initially either 10,000 or 20,000 ppm, for 38 weeks. Because of excessively lowered body weights in the dosed groups of the females, the doses for the females were then reduced to 2,500 and 5,000 ppm, respectively, and administration at the lowered doses was continued for 67 weeks. The time-weighted average doses for the female mice were either 5,214 or 10,428 ppm. Matched controls consisted of 20 untreated mice of each sex. All surviving mice were killed at the end of administration of the test chemical.
Mean body weights of dosed rats and mice of each sex were lower than those of corresponding controls and were dose related throughout the bioassay. Survivals to the end of the experiment were 68% or greater in all groups of rats and 80% or greater in all groups of mice.
In the male rats, lymphomas or leukemias occurred at incidences that were dose related (P = 0.006) and in direct comparisons were significantly higher in the low-dose (P = 0.019) and high-dose (P = 0.004) groups than in the corresponding control group (controls 4/20, low-dose 25/50, high-dose 29/50). Leukocytosis and monocytosis of the peripheral blood and hyperplasia of the bone marrow also occurred in some dosed male rats not having lymphoma or leukemia.
In the female rats, monocytic leukemia did not occur at incidences that were significant. However, as in the male rats, leukocytosis and monocytosis of the peripheral blood and

hyperplasia of the bone marrow occurred in the dosed female rats but not in the controls (blood leukocytosis and monocytosis: controls 0/20, low-dose 6/50, high-dose 3/50; bone marrow hyperplasia: controls 0/20, low-dose 16/50, high-dose 2/50).
In both the male and female mice, hepatocellular carcinomas or adenomas occurred at incidences that were dose related (P less than 0.001), and in direct comparisons were significantly higher in the low- and high-dose male groups and the high-dose female group (P less than or equal to 0.001) than in the corresponding control groups (males: controls 4/20, low-dose 32/49, high-dose 39/47; females: controls 1/20, low-dose 12/50, high-dose 24/48).
It is concluded that under the conditions of this bioassay, 2,4,6trichlorophenol was carcinogenic in male F344 rats, inducing lymphomas or leukemias. The test chemical was also carcinogenic in both sexes of B6C3F1 mice, inducing hepatocellular carcinomas or adenomas.
vi

TABLE OF CONTENTS
I. Introduction 1
II. Materials and Methods 3
A. Chemical 3 B. Dietary Preparation 3 C. Animals 4 D. Animal Maintenance 5 E. Subchronic Studies 7 F. Chronic Studies 10 G. Clinical and Pathologic Examinations 10 H. Data Recording and Statistical Analyses 14
III. Results - Rats 21
A. Body Weights and Clinical Signs (Rats) 21 B. Survival (Rats) 21 C. Pathology (Rats) 24 D. Statistical Analyses of Results (Rats) 26
IV. Results - Mice 29
A. Body Weights and Clinical Signs (Mice) 29 B. Survival (Mice) 29 C. Pathology (Mice) 32 D. Statistical Analyses of Results (Mice) 34
V. Discussion 37
VI. Bibliography 39
APPENDIXES
Appendix A Summary of the Incidence of Neoplasms in Rats Administered 2,4,6-Trichlorophenol in the Diet 41
Table Al Summary of the Incidence of Neoplasms in Male Rats Administered 2,4,6-Trichlorophenol in the Diet 43
vii

Table A2 Summary of the Incidence of Neoplasms in Female Rats Administered 2,4,6-Trichlorophenol in the Diet 48
Appendix B Summary of the Incidence of Neoplasms in Mice Administered 2,4,6-Trichlorophenol in the Diet 53
Table Bl Summary of the Incidence of Neoplasms in Male Mice Administered 2,4,6-Trichlorophenol in the Diet 55
Table B2 Summary of the Incidence of Neoplasms in Female Mice Administered 2,4,6-Trichlorophenol in the Diet 59
Appendix C Summary of the Incidence of Nonneoplastic Lesions in Rats Administered 2,4,6-Trichlorophenol in the Diet 63
Table Cl Summary of the Incidence of Nonneoplastic Lesions in Male Rats Administered 2,4,6-Trichlorophenol in the Diet 65
Table C2 Summary of the Incidence of Nonneoplastic Lesions in Female Rats Administered 2,4,6-Trichlorophenol in the Diet 72
Appendix D Summary of the Incidence of Nonneoplastic Lesions in Mice Administered 2,4,6-Trichlorophenol in the Diet 79
Table Dl Summary of the Incidence of Nonneoplastic Lesions in Male Mice Administered 2,4,6-Trichlorophenol in the Diet 81
Table D2 Summary of the Incidence of Nonneoplastic Lesions in Female Mice Administered 2,4,6-Trichlorophenol in the Diet 86
Appendix E Analyses of the Incidence of Primary Tumors in Rats Administered 2,4,6-Trichlorophenol in the Diet 91
Table El Analyses of the Incidence of Primaryin Male Rats Administered 2,4,6-Trichlorophenol in the Diet
Tumors
93
viii

Table E2 Analyses of the Incidence of Primary Tumors in Female Rats Administered 2,4,6-Trichlorophenol in the Diet 100
Appendix F Analyses of the Incidence of Primary Tumors in Mice Administered 2,4,6-Trichlorophenol in the Diet 105
Table Fl Analyses of the Incidence of Primary Tumors in Male Mice Administered 2,4,6-Trichlorophenol in the Diet 107
Table F2 Analyses of the Incidence of Primary Tumors in Female Mice Administered 2,4,6-Trichlorophenol in the Diet Ill
TABLES
Table 1 2,4,6-Trichlorophenol Subchronic Feeding Studies in Rats and Mice 8
Table 2 2,4,6-TrichlorophenolStudies in Rats
Chronic Feeding 11
Table 3 2,4,6-Trichlorophenol Chronic Feeding Studies in Mice 12
FIGURES
Figure 1 Growth Curves for Rats Administered 2,4,6-Trichlorophenol in the Diet 22
Figure 2 Survival Curves for Rats Administered 2,4,6-Trichlorophenol in the Diet 23
Figure 3 Growth Curves for Mice Administered 2,4,6-Trichlorophenol in the Diet 30
Figure 4 Survival Curves for Mice Administered 2,4,6-Trichlorophenol in the Diet 31
ix

X

I. INTRODUCTION
2,4,6-Trichloropheno1 (CAS 88-06-2;
NCI 002904) is a germicidal agent
that has been used to preserve wood
and glue as well as to protect
textiles against mildew (Stanford
Research Institute, 1976). Produc-Cl
tion of this chemical (for sale as 2, 4, 6-Trichlorophenol
an end product) was discontinued in
1975 by Dow Chemical Company (1978),
the only manufacturer of 2,4,6-trichlorophenol in the United
States, because of the high cost of removing toxic dioxin
impurities. However, a small quantity (2,204 pounds) was
imported for domestic use in 1976 (United States International
Trade Commission, 1977).
The chemical has been reported to be produced when water
containing phenol (Eisenhauer, 1964; Smith et al., 1975) or
certain aromatic acids (Larson and Rockwell, 1977) is treated
with hypochlorite, suggesting the possibility of human exposure
to 2,4,6-trichlorophenol in treated industrial waste water. The

chemical is also an end product of lindane metabolism in mammals
(Tanaka et al., 1977).
The oral LD of 2,4,6-trichlorophenol has been reported as 820
mg/kg body weight in rats of unspecified strain (NIOSH, 1976).
2,4,6-Trichlorophenol was tested by Innes et al. (1969) in a
large-scale screen of industrial compounds for carcinogenic
activity. The results of this preliminary bioassay in mice
suggested a possible association of the incidence of tumors with
administration of the test chemical; therefore, 2,4,6-trichloro
phenol was selected for further testing in the Carcinogenesis
Testing Program.

II. MATERIALS AND METHODS
A. Chemical
2,4,6-Trichlorophenol (Omal , Dowicide 2S) was obtained from
the Dow Chemical Company as a light, pinkish-orange solid. Its
melting point was 65 and its boiling point was 251 to 252 C;
corresponding values given in the literature (Windholz, 1976)
were 69 and 246 C, respectively. Elemental analysis showed
average values of 36.2% carbon and 1.5% hydrogen (theoretical:
36.5% C and 1.5% H). Its infrared spectrum was consistent with
the chemical structure, and identical to that of a standard.
Mass spectral analysis showed a molecular ion as the base peak at
m/e 197. Its purity was determined by gas-liquid chromatography
to be 96 to 97%, with up to 17 minor contaminants. The chlorin
ated dibenzo-p-dioxin content of the 2,4,6-trichlorophenol was
not determined.
B. Dietary Preparation
Test diets containing 2,4,6-trichlorophenol were prepared by
mixing the appropriate amount of the chemical with autoclaved

Wayne® Sterilizable Lab Meal containing 4% fat (Allied Mills,
Inc., Chicago, 111). The weighed chemical was first mixed with
an equal amount of the lab meal using a mortar and pestle. The
mixing was continued with second and third additions of feed, and
final mixing was performed with the remaining quantity of feed
for a minimum of 15 minutes in a Patterson-Kelly twin-shell
blender with an intensifier bar. The material was then stored in
sealed 3-kg plastic bags at 7 C until used.
C. Animals
Male and female F344 (Fischer) rats and B6C3F1 mice were obtained
as 4-week-old weanlings, all within 3 days of the same age, from
the NCI Frederick Cancer Research Center (Frederick, Md.). The
animals were housed within the test facility for 2 weeks and then
were assigned four rats of the same sex to a cage and five mice
of the same sex to a cage. For use in the chronic study, the
male rats weighed 90 to 105 g, averaging at least 100 g; for
female rats, 80 to 95 g, averaging at least 90 g; for male mice,
18 to 22 g, averaging at least 19.5 g; and for female mice, 17 to
21 g, averaging at least 18.5 g. Individual animals were
identified by ear punch.

D. Animal Maintenance
The animals were housed in polycarbonate cages (Lab Products
Inc., Garfield, N.J.), 19 x 10-1/2 x 8 inches for the rats and
11-1/2 x 7-1/2 x 5 inches for the mice. The cages were
suspended from aluminum racks (Scientific Cages, Inc., Bryan,
Tex.) and were covered by nonwoven polyester-fiber 12-mil-thick
filter paper (Hoeltge, Inc., Cincinnati, Ohio). The bedding used
® was hardwood chips (Absorb-dri , Northeastern Products, Inc.,
Warrenburg, N.Y.). The feed was presterilized Wayne
Sterilizable Lab Meal containing 4% fat, provided ad_ libitum in
suspended stainless steel hoppers and replenished as required, at
least three times per week. Water, acidified to pH 2.5, was
supplied ad libitum from glass bottles with sipper tubes
suspended through the tops of the cages.
The contaminated bedding was disposed of through an enclosed
vacuum line that led to a holding tank from which the bedding was
fed periodically into an incinerator. The cages were sanitized
twice per week and the feed hoppers twice per month at 82 to
88 C in a tunnel-type cagewasher (Industrial Washing Machine
Corp., Mataway, N. J.) using the detergents, Clout (Pharmacal
Research Laboratories, Greenwich, Conn.) or Oxford D'Chlor
(Oxford Chemicals, Atlanta, Ga.). The bottles were sanitized at

82 to 88 C in a tunnel-type bottle washer (Consolidated
Equipment Supply Co., Mercersburg, Pa.) three times per week,
using a Calgen Commercial Division detergent (St. Louis, Mo.).
The racks for the cages were sanitized at or above 82 C in a
rack washer (Consolidated Equipment Supply Co.) once per month,
using the Calgen Commercial Division detergent, and the filter
paper was changed at the same time.
The animal rooms were maintained at 22 to 24 C and 45 to 55%
relative humidity. Incoming air was passed through a filter of
65% efficiency and a bag filter of 95% efficiency at the intake
and expelled without recirculation through a "Z"-type roughing
filter of 30% efficiency and a bag system of 90 to 95% efficiency
at the exhaust (American Air Filters, Louisville, Ky.; Mine
Safety Appliances, Pittsburgh, Pa.). Room air was changed 15
times per hour. The air pressure was maintained negative to a
clean hallway and positive to a return hallway. Fluorescent
lighting was provided on a 12-hour-per-day automatic cycle.
Rats administered 2,4,6-trichlorophenol and their corresponding
controls were housed in the same room as rats on feeding studies
of the following chemicals:
(CAS 999-81-5) (2-chloroethyl)trimethylammonium chloride (CCC) (CAS 51-03-6) piperonyl butoxide
Mice administered 2,4,6-trichlorophenol and their corresponding
controls were housed in the same room as mice on feeding studies
of the following chemicals:
(CAS 103-33-3) azobenzene (CAS 128-66-5) C.I. vat yellow 4 (CAS 20941-65-5) ethyl tellurac (CAS 298-00-0) methyl parathion (CAS 72-56-0) p,p'-ethyl-DDD (CAS 85-44-9) phthalic anhydride (CAS 51-03-6) piperonyl butoxide
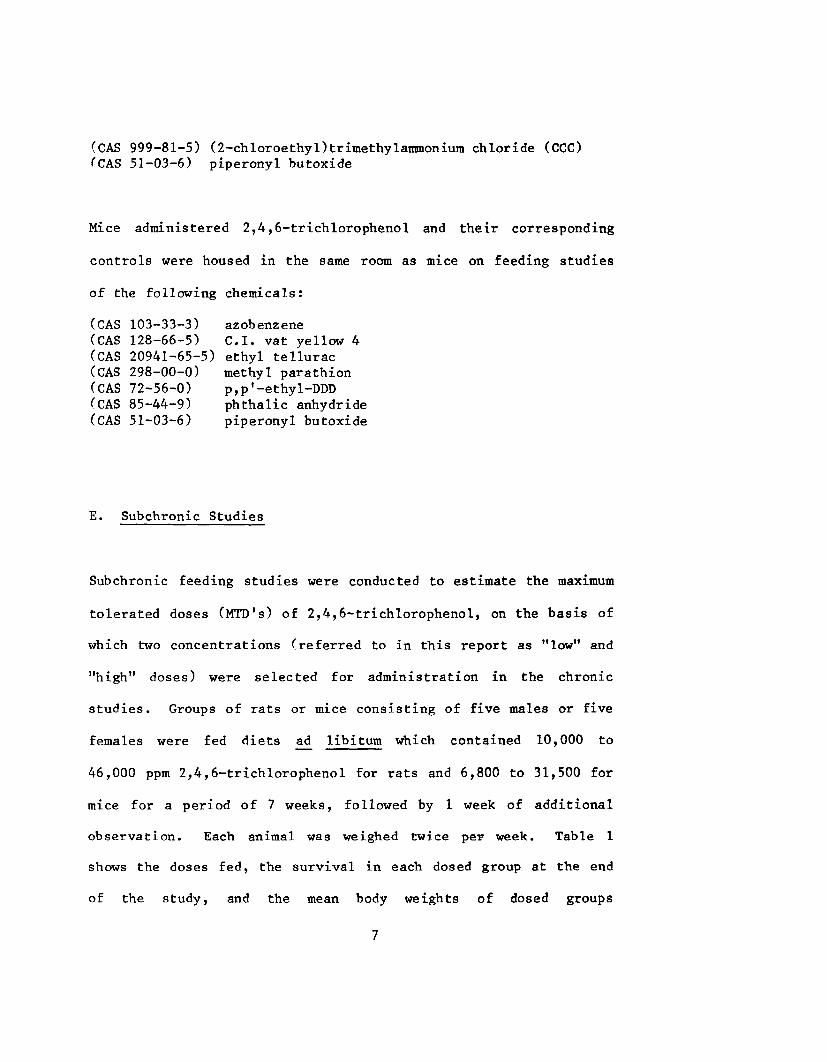
E. Subchronic Studies
Subchronic feeding studies were conducted to estimate the maximum
tolerated doses (MTD's) of 2,4,6-trichlorophenol, on the basis of
which two concentrations (referred to in this report as "low" and
"high" doses) were selected for administration in the chronic
studies. Groups of rats or mice consisting of five males or five
females were fed diets ad libitum which contained 10,000 to
46,000 ppm 2,4,6-trichlorophenol for rats and 6,800 to 31,500 for
mice for a period of 7 weeks, followed by 1 week of additional
observation. Each animal was weighed twice per week. Table 1
shows the doses fed, the survival in each dosed group at the end
of the study, and the mean body weights of dosed groups

Table 1. 2,4,6-Trichlorophenol Subchronic Feeding Studies in Rats and Mice
Dose (ppm)
RATS
0
10,000
14,700
21,500
31,500
46,000
MICE
0
6,800
10,000
14,700
21,500
31,500
Male
Survival (a)
5/5
5/5
5/5
4/5
4/5
3/5
5/5
5/5
5/5
5/5
5/5
3/5
Female Mean Weight at Week 7 as % of Control
100
96
89
73
47
39
100
99
99
83
79
57
Survival (a)
5/5
5/5
5/5
5/5
4/5
2/5
4/5
5/5
5/5
5/5
5/5
3/5
Mean Weight at Week 7 as % of Control
100
92
84
73
67
42
100
110
110
101
93
68
(a) Number surviving/number in group.

of animals at week 7, expressed as percentages of mean body
weights of corresponding control groups.
At the end of the subchronic studies, all animals were killed
using CO- and necropsied. The lowest dose at which histo
pathologic findings were observed in the rats was 46,000 ppm; at
this dose moderate to marked increase in splenic hematopoiesis
was seen in male and female rats and midzonal vacuolation of
hepatocytes was seen in two males. In male and female mice dosed
at 21,500 ppm, all tissues were essentially normal.
Ten percent depression in body weight was a major criterion for
the estimation of MTD's. The doses that were required to produce
this response were determined by the following procedure: first,
least squares regressions of mean body weights versus days on
study were used to estimate mean body weights of each of the
dosed groups at day 49. Next, probits of the percent weights of
each of the dosed groups at day 49 relative to weights of
corresponding control groups were plotted against logarithms of
the doses, and least squares regressions fitted to the data were
used to estimate the doses required to induce 10% depression in
weight. No histopathologic lesions were observed at the doses
selected.

The low and high doses for chronic studies were set at 5,000 and
10,000 ppm for male and female rats; 5,000 and 10,000 ppm for
male mice; and 10,000 and 20,000 ppm for female mice.
F. Chronic Studies
The test groups, doses administered, and durations of the chronic
feeding studies are shown in tables 2 and 3. Because of
excessive depression in body weight gain in the dosed groups of
female mice, doses administered to the females were reduced after
week 38 as indicated.
G. Clinical and Pathologic Examinations
All animals were checked twice daily. Observations for sick,
tumor-bearing, and moribund animals were recorded daily.
Clinical examination and palpation for masses were performed each
month, and the animals were weighed at least once per month.
Moribund animals and animals that survived to the termination of
the bioassay were killed using CO. and necropsied.
The pathologic evaluation consisted of gross and microscopic
10

Table 2. 2,4,6-Trichloropheno1 Chronic Feeding Studies in Rats
2,4,6-Tri-Sex and Initial chlorophenol Time on Test No. of in Diet (b) Study Group Animals (a) (ppm) (weeks)
Male
Matched-Control 20 0 107
Low-Dose 50 5,000 106
High -Dose 50 10,000 106
Female
Matched -Control 20 0 107
Low-Dose 50 5,000 106-107
High -Dose 50 10,000 106
(a) All animals were 6 weeks of age when placed on study.
(b) Test and control diets were provided ad libitum 7 days per week.
11

Table 3. 2,4,6-Trichlorophenol Chronic Feeding Studies in Mice
2, 4, 6-Tri-Sex and Initial chlorophenol Time on Time-Weighted Test No. of in Diet (b) Study Average Dose (c) Group Animals (a) (ppm) (weeks) (ppm)
Male
Matched-Control 20 0 105
Low-Dose 50 5,000 105
High -Dose 50 10,000 105
Female
Matched-Control 20 0 105
Low-Dose 50 10,000 38 2,500 67 5,214
High -Dose 50 20,000 38 5,000 67 10,428
(a) All animals were 6 weeks of age when placed on study.
(b) Test and control diets were provided ad 1ibiturn 7 days per week.
(c) Time-weighted average dose = Z(dose in ppm x no. of weeks at that dose) Z(no. of weeks receiving each dose)
12

examination of major tissues, major organs, and all gross
lesions. The tissues were preserved in neutral buffered 10%
formalin, embedded in paraffin, sectioned, and stained with
hematoxylin and eosin. The following tissues were examined
microscopically: skin, lungs and bronchi, trachea, bone marrow
(femur), spleen, lymph nodes (mesenteric and submandibular),
thymus, heart, salivary glands (parotid, sublingual, and
submaxillary), liver, pancreas, esophagus, stomach (glandular and
nonglandular), small and large intestines, kidney, urinary
bladder, pituitary, adrenal, thyroid, parathyroid, testis,
prostate, mammary gland, uterus, ovary, brain (cerebrum and
cerebellum), and all tissue masses. Peripheral blood smears also
were made for all animals, whenever possible.
Necropsies were performed on all animals found dead unless
precluded in whole or in part by autolysis or cannibalization.
Thus, the number of animals from which particular organs or
tissues were examined microscopically varies and does not
necessarily represent the number of animals that were placed on
study in each group.
13

H. Data Recording and Statistical Analyses
Pertinent data on this experiment have been recorded in an
automatic data processing system, the Carcinogenesis Bioassay
Data System (Linhart et al., 1974). The data elements include
descriptive information on the chemicals, animals, experimental
design, clinical observations, survival, body weight, and
individual pathologic results, as recommended by the
International Union Against Cancer (Berenblum, 1969). Data
tables were generated for verification of data transcription and
for statistical review.
These data were analyzed using the appropriate statistical
techniques described in this section. Those analyses of the
experimental results that bear on the possibility of
carcinogenicity are discussed in the statistical narrative
sections.
Probabilities of survival were estimated by the product-limit
procedure of Kaplan and Meier (1958) and are presented in this
report in the form of graphs. Animals were statistically
censored as of the time that they died of other than natural
causes or were found to be missing; animals dying from natural
causes were not statistically censored. Statistical analyses for
14

a possible dose-related effect on survival used the method of Cox
(1972) for testing two groups for equality and Tarone's (1975)
extensions of Cox methods for testing for a dose-related trend.
One-tailed P values have been reported for all tests except the
departure from linearity test, which is only reported when its
two-tailed P value is less than 0.05.
The incidence of neoplastic or nonneoplastic lesions has been
given as the ratio of the number of animals bearing such lesions
at a specific anatomic site (numerator) to the number of animals
in which that site is examined (denominator). In most instances,
the denominators included only those animals for which that site
was examined histologically. However, when macroscopic
examination was required to detect lesions prior to histologic
sampling (e.g., skin or mammary tumors), or when lesions could
have appeared at multiple sites (e.g., lymphomas), the
denominators consist of the numbers of animals necropsied.
The purpose of the statistical analyses of tumor incidence is to
determine whether animals receiving the test chemical developed a
significantly higher proportion of tumors than did the control
animals. As a part of these analyses, the one-tailed Fisher
exact test (Cox, 1970) was used to compare the tumor incidence of
a control group with that of a group of dosed animals at each
15

dose level. When results for a number of dosed groups (k) are
compared simultaneously with those for a control group, a
correction to ensure an overall significance level of 0.05 may be
made. The Bonferroni inequality (Miller, 1966) requires that the
P value for any comparison be less than or equal to 0.05/k. In
cases where this correction was used, it is discussed in the
narrative section. It is not, however, presented in the tables,
where the Fisher exact P values are shown.
The Cochran-Armitage test for linear trend in proportions, with
continuity correction (Armitage, 1971), was also used. Under the
assumption of a linear trend, this test determines if the slope
of the dose-response curve is different from zero at the
one-tailed 0.05 level of significance. Unless otherwise noted,
the direction of the significant trend is a positive dose
relationship. This method also provides a two-tailed test of
departure from linear trend.
A time-adjusted analysis was applied when numerous early deaths
resulted from causes that were not associated with the formation
of tumors. In this analysis, deaths that occurred before the
first tumor was observed were excluded by basing the statistical
tests on animals that survived at least 52 weeks, unless a tumor
was found at the anatomic site of interest before week 52. When
16

such an early tumor was found, comparisons were based exclusively
on animals that survived at least as long as the animal in which
the first tumor was found. Once this reduced set of data was
obtained, the standard procedures for analyses of the incidence
of tumors (Fisher exact tests, Cochran-Armitage tests, etc.) were
followed.
When appropriate, life-table methods were used to analyze the
incidence of tumors. Curves of the proportions surviving without
an observed tumor were computed as in Saffiotti et al. (1972).
The week during which an animal died naturally or was sacrificed
was entered as the time point of tumor observation. Cox's
methods of comparing these curves were used for two groups;
Tarone's extension to testing for linear trend was used for three
groups. The statistical tests for the incidence of tumors which
used life-table methods were one-tailed and, unless otherwise
noted, in the direction of a positive dose relationship.
Significant departures from linearity (P less than 0.05,
two-ta'iled test) were also noted.
The approximate 95 percent confidence interval for the relative
risk of each dosed group compared with its control was calculated
from the exact interval on the odds ratio (Gart, 1971). The
relative risk is defined as p /p where p is the true
17

binomial probability of the incidence of a specific type of tumor
in a dosed group of animals and p is the true probability of
the spontaneous incidence of the same type of tumor in a control
group. The hypothesis of equality between the true proportion of
a specific tumor in a dosed group and the proportion in a control
group corresponds to a relative risk of unity. Values in excess
of unity represent the condition of a larger proportion in the
dosed group than in the control.
The lower and upper limits of the confidence interval of the
relative risk have been included in the tables of statistical
analyses. The interpretation of the limits is that in
approximately 95% of a large number of identical experiments, the
true ratio of the risk in a dosed group of animals to that in a
control group would be within the interval calculated from the
experiment. When the lower limit of the confidence interval is
greater than one, it can be inferred that a statistically
significant result (P less than 0.025 one-tailed test when the
control incidence is not zero, P less than 0.050 when the control
incidence is zero) has occurred. When the lower limit is less
than unity, but the upper limit is a greater than unity, the
lower limit indicates the absence of a significant result while
the upper limit indicates that there is a theoretical possibility
18

of the induction of tumors by the test chemical, which could not
be detected under the conditions of this test.
19

20

III. RESULTS - RATS
A. Body Weights and Clinical Signs (Rats)
Mean body weights of both dosed male and dosed female rats were
lower than those of corresponding controls and were dose related
throughout the bioassay (figure 1). Other clinical signs were
common to both the dosed and the control groups. Fluctuation in
the growth curves may be due to mortality; as the size of a group
diminishes, the mean body weights may be subject to variation.
B. Survival (Rats)
Estimates of the probabilities of survival for male and female
rats administered 2,4,6-trichlorophenol in the diet at the doses
of this bioassay, together with those for the matched controls,
are shown by Kaplan and Meier curves in figure 2. The result of
the Tarone test indicates no statistically significant
dose-related trend in mortality in either sex.
In male rats, 34/50 (68%) of the high-dose group, 35/50 (70%) of
21

0 ° 0 O o o g o o o
A A A A
0 ° A A A
a a D
a a
0 0
D
0 D
O
Io UJ
300
P o
Do° A
jgAA*
o o m
8
100)1
D
O
A
MALE RATS
MATCHED CONTROL
LOW DOSE
HIGH DOSE
40 50 60 70
TIME ON STUDY (WEEKS)
100 110
C3 UJ
g O O m
DD D
D D
D D D
O O
t
O
FEMALE RATS
D
O
A
MATCHED CONTROL
LOW DOSE
HIGH DOSE
20 30 40 50 60 70 80 90 100
TIME ON STUDY (WEEKS)
Figure 1. Growth Curves for Rats Administered 2,4,6-Trichlorophenol in the Diet
110
22

PR
OB
AB
ILIT
Y
OF
SU
RV
IVA
L P
RO
BA
BIL
ITY
OF
SU
RV
IVA
L
(5
ro f I
CJ o
30
to
U>
S. 5
3.
n
O
3
I"
e
CD
O
S

the low-dose group, and 18/20 (90%) of the control group lived to
the end of the bioassay. In females, 39/50 (78%) of the
high-dose group, 39/50 (78%) of the low-dose group, and 14/20
(70%) of the control group lived to the end of the bioassay.
Sufficient numbers of rats of each sex were at risk for the
development of late-appearing tumors.
C. Pathology (Rats)
Histopathologic findings on neoplasms in rats are summarized in
Appendix A, tables Al and A2; findings on nonneoplastic lesions
are summarized in Appendix C, tables Cl and C2.
Three types of neoplasms occurred in appreciable numbers in the
dosed rats, and only one of these, neoplasms of the hematopoietic
system, appears to be compound related. The other two neoplasms
which occurred at a high incidence were interstitial-cell tumors
of the testes in male rats and pituitary chromophobe adenomas in
both sexes of rats. Both of the latter neoplasms occurred with
equal frequency in dosed and control groups of animals, and the
type, distribution, and incidence of these neoplasms is similar
to that found in aged F344 rats.
24

Leukemias and hematopoietic disorders have been reported in the
F344 strain of rats (Davey and Moloney, 1970); however, their
incidence in the dosed groups, the occurrence of hyperplasia in
the bone marrow and leukocytosis in blood smears of both males
and females, together with the virtual absence of any of these
lesions in control males or females, indicates that the effects
were compound related. The incidences of these neoplasms are
summarized as follows:
MALES FEMALES Low High Low High
Control Dose Dose Control Dose Dose
Number of Animals Necropsied 20 50 50 20 50 50
Ma lignant Lymphoma 1(5%) 2(4%) 0(0%) 0(0%) 0(0%) 2(4%)
Leukemia 3(15%) 23(46%) 29(58%) 3(15%) 11(22%) 11(22%)
Bone Marrow Hyperplasia 0(0%) 26(52%) 15(30%) 0(0%) 16(32%) 2(4%)
Leukocytosis 0(0%) 13(26%) 11(22%) 0(0%) 6(12%) 3(6%)
The leukemias were characterized by the presence of large numbers
of circulating monocytes in the blood. The cell types varied
from mature, well-differentiated monocytes to a variety of
immature developing and blast forms. In addition to their
presence in circulating blood, similar monocytic cells were
usually observed in the liver, spleen, lymph tissues, and bone
25

marrow and occasionally in lung, adrenals, and other organs. An
aleukemic form was also observed where neoplastic cells were not
found in circulating blood but were seen in the spleen and liver
and occasionally in bone marrow and other organs. In addition to
those rats diagnosed as having monocytic leukemia, a large number
of additional dosed rats manifested hyperplastic bone marrows
and/or a leukocytosis, seen on peripheral blood smears.
A variety of nonneoplastic lesions and disorders were encountered
with regularity in both control and dosed animals. Such lesions
were considered to be common in aged F344 rats, and the
incidences of these lesions were considered to be within normal
limits for this age and strain of rat.
Based on the histopathologic examination, 2,4,6-trichlorophenol
was carcinogenic for male F344 rats, inducing tumors of the
hematopoietic system under the conditions of this bioassay.
D. Statistical Analyses of Results (Rats)
Tables El and E2 in Appendix E contain the statistical analyses
of the incidences of those primary tumors that occurred in at
26

least two animals of one group and at an incidence of at least 5%
in one or more than one group.
In male rats, the result of the Cochran-Armitage test for
positive dose-related trend is significant (P = 0.003) in the
incidence of monocytic leukemia. The results of the Fisher exact
test comparing the incidence of the tumors in each dosed group
with that in the control group are significant (P = 0.013 in the
low-dose group and P = 0.002 in the high-dose group). The
statistical conclusion is that the incidence of this tumor in
male rats is associated with the administration of 2,4,6-tri
chlorophenol. When the incidence of either lymphoma or leukemia
in male rats is analyzed, the results of the statistical tests
are significant, and the main contributor to this significance is
the incidence of monocytic leukemia. The historical incidence to
date of monocytic leukemia in male control rats at this
laboratory is 11/255 (4%) , compared with the following incidences
in this study: controls 3/20 (15%); low-dose group, 23/50 (46%);
and high-dose group, 28/50 (56%).
The results of the statistical tests on the incidence of
hematopoietic tumors in female rats are not significant. The
current historical records at this laboratory show that the
incidence of some form of lymphoma or leukemia in female control
27

rats is 42/420 (10%), compared with the following incidences in
this study: controls 3/20 (15%); low-dose group 11/50 (22%);
high-dose group 13/50 (26%).
Significant results in the negative direction are observed in the
incidences of pituitary and mammary tumors in male and female
rats and of tumors of the integumentary system and the thyroid in
female rats.
28

IV. RESULTS - MICE
A. Body Weights and Clinical Signs (Mice)
Mean body weights of dosed mice of each sex were lower than those
of corresponding controls and were dose related throughout the
bioassay (figure 3). Fluctation in the growth curves may be due
to mortality; as the size of a group diminishes, the mean body
weight may be subject to variation. Other clinical signs were
common to both the dosed and control groups.
B. Survival (Mice)
Estimates of the probabilities of survival for male and female
mice administered 2,4,6-trichlorophenol in the diet at the doses
of this bioassay, together with those for the matched controls,
are shown by Kaplan and Meier curves in figure 4. The result of
the Tarone test indicates no statistically significant
dose-related trend in mortality in either sex.
In male mice, 45/50 (90%) of the high-dose group, 44/50 (88%) of
the low-dose group, and 16/20 (80%) of the control group lived to
29

D 0 ^DD nD0 00 U
DDDD D O O0Q0
° O 00
a
Du o
0o O0
A 8. .0 BA AAA
, A AA AA AAA
AA O A
. A A
A A o A
MALE MICE
D MATCHED CONTROL
O LOW DOSE
A HIGH DOSE
40 50 60 70 100 110
TIME ON STUDY (WEEKS)
D ° D a DD
DQDD Doses lowered for
n
D DD 0« - o o -
DDDD O OO A X 0 A A . AA2 A A A UJ
AAAa n o a o m ° °D o ° ̂
D DQO O° ° A A
dftfi0 A A A A
FEMALE MICE r D MATCHED CONTROL
O LOW DOSE
A HIGH DOSE
TIME ON STUDY (WEEKS)
Figure 3. Growth Curves for Mice Administered 2,4,6-Trichlorophenol in the Diet
30

PR
OB
AB
ILIT
Y O
F S
UR
VIV
AL
PR
OB
AB
ILIT
Y O
F S
UR
VIV
AL
->
O
D
.
MA
tj,
m OO
3.
z cS3
' Zw
o
2
D
=.
-c
0J
:?J
CD e_ 5* if o CD
"

the end of the study. In females, 40/50 (80%) of the high-dose
group, 44/50 (88%) of the low-dose group, and 17/20 (85%) of the
control group lived to the end of the study.
Sufficient numbers of mice of each sex were at risk for the
development of late-appearing tumors.
C. Pathology (Mice)
Histopathologic findings on neoplasms in mice are summarized in
Appendix B, tables Bl and B2; findings on nonneoplastic lesions
are summarized in Appendix D, tables Dl and D2.
Several types of neoplasms occurred frequently in dosed mice;
these included hepatocellular and pulmonary neoplasms,
hemangiosarcomas of various organs, and malignant lymphomas.
With the exception of the hepatocellular neoplasms, however, most
neoplasms occurred in equal numbers in control and dosed mice,
and the type, distribution, and incidence of these neoplasms is
similar to that found in aged B6C3F1 mice.
The incidence of hepatocellular neoplasms and hyperplasias was
high in all dosed groups of mice, but it was especially high in
32

the two dosed groups of male mice, where most of the livers were
affected. The incidences of these lesions are summarized in the
following table:
MALES FEMALES Low High Low High
Control Dose Dose Control Dose Dose
Number of Animals with Tissues Examined Microscopically 20 49 47 20 50 48
Hepatocellular Adenoma 3(0%) 22(45%) 32(68%) 1(5%) 12(24%) 17(35%)
Hepatocellular Carcinoma 1(5%) 10(20%) 7(15%) 0(0%) 0(0%) 7(14%)
Hyperplasia 2(10%) 12(24%) 6(13%) 1(5%) 1(2%) 6(13%)
In addition to these neoplasms, hepatocellular damage, ranging
from individual liver cell abnormalities, through focal areas of
cellular alteration, to focal and nodular areas of hyperplasia
was commonly present in the livers of dosed mice.
A variety of nonneoplastic lesions were encountered with regular
ity in both control and dosed animals. Such lesions are commonly
seen in aged B6C3F1 mice, and occurred with no appreciable
differences in frequency between control and dosed mice.
Based on the histopathologic examination, 2,4,6-trichlorophenol
33

was carcinogenic for B6C3F1 mice, inducing hepatocellular
carcinomas and adenomas in both males and females.
D. Statistical Analyses of Results (Mice)
Tables Fl and F2 in Appendix F contain the statistical analyses
of the incidences of those primary tumors that occurred in at
least two animals of one group and at an incidence of at least 5%
in one or more than one group.
The result of the Cochran-Armitage test for positive dose-related
trend in the incidence of male mice with hepatocellular
carcinomas or adenomas is significant (P less than 0.001). The
results of the Fisher exact test comparing the incidence of the
tumors in the control group with that for each dosed group are
significant (P less than or equal to 0.001). The
historical-control male B6C3F1 mice of this laboratory have an
incidence of liver tumors of 99/323 (30%), compared with 32/49
(65%) in the low-dose group and 39/47 (83%) in the high-dose
group of this study. In females, the result of the Cochran-
Armitage test on the incidence of hepatocellular carcinoma is
significant (P = 0.005), but the results of the Fisher exact test
are not significant. When the incidence of female mice with
34

hepatocellular carcinoma or adenoma is analyzed, the results of
the Cochran-Armitage test and that of the Fisher exact test
comparing the incidence in the high-dose group with that in the
control group are significant (P less than 0.001). The
historical-control female mice of this laboratory have an
incidence of liver tumors of 14/324 (4.3%), compared with 12/50
(24%) in the low-dose group and 24/48 (50%) in the high-dose
group of this study. The statistical conclusion is that the
occurrence of liver tumors in male and female mice is associated
with the administration of 2,4,6-trichlorophenol.
35

36

V. DISCUSSION
Mean body weights of the dosed rats and mice of each sex were
lower than those of corresponding controls and were dose related
throughout the bioassay. No other clinical signs could be
related to administration of the test chemical. Survival of the
dosed rats and mice was 68% or greater in all groups of rats and
80% or greater in all groups of mice.
In the male rats, lymphomas or leukemias occurred at incidences
that were dose related (P = 0.006), and in direct comparisons
were significantly higher in the low-dose (P = 0.019) and
high-dose (P = 0.004) groups than in the corresponding control
group (controls 4/20, low-dose 25/50, high-dose 29/50).
Leukocytosis and monocytosis of the peripheral blood and
hyperplasia of the bone marrow also occurred in some dosed male
rats not having lymphoma or leukemia.
In the female rats, monocytic leukemia did not occur at
incidences that were significant. Leukocytosis and monocytosis
of the peripheral blood and hyperplasia of the bone marrow
occurred in the dosed female rats, but not in the controls (blood
leukocytosis and monocytosis: controls 0/20, low-dose 6/50,
37

high-dose 3/50; bone marrow hyperplasia: controls 0/20, low-dose
16/50, high-dose 2/50).
In both the male and female mice, hepatocellular carcinomas or
adenomas occurred at incidences that were dose related (P less
than 0.001), and in direct comparisons were significantly higher
in the low- and high-dose male groups and the high-dose female
groups (P less than or equal to 0.001) than in the corresponding
control groups (males: controls 4/20, low-dose 32/49, high-dose
39/47; females: controls 1/20, low-dose 12/50, high-dose 24/48).
In previous tests for tumorigenicity (National Technical
Information Service, 1968; Innes et al. , 1969), it was reported
that when 2,4,6-trichlorophenol was administered at 100 mg/kg
body weight by stomach tube for 3 weeks, then in the diet at 260
ppm for 18 months, to hybrid mice (C57BL/6 x C3H/Anf and C57BL/6
x AKR), elevated incidences of reticulum-cell sarcoma (P = 0.05)
and of hepatoma (P = 0.05) were observed.
It is concluded that under the conditions of this bioassay,
2,4,6-trichlorophenol was carcinogenic in male F344 rats,
inducing lymphomas or leukemias. The test chemical was also
carcinogenic in both sexes of B6C3F1 mice, inducing hepato
cellular carcinomas or adenomas.
38

VI. BIBLIOGRAPHY
Armitage, P., Statistical Methods in Medical Research, John Wiley & Sons, Inc., New York, 1971, pp. 362-365.
Berenblum, I., ed., Carcinogenicity Testing; A Report o_f the Panel on Carcinogenicity of the Cancer Research Commission of the UICC, Vol. 2._ International Union Against Cancer, Geneva, 1969.
Cox, D. R., Regression models and life tables. J. R. Statist. Soc. B 34;187-220, 1972.
Cox, D. R., Analysis of Binary Data, Methuen & Co., Ltd., London, 1970, pp. 48-52.
Dow Chemicals, Personal Communication. 26 May 1978.
Gart, J. J., The comparison of proportions: a review of significance tests, confidence limits and adjustments for stratification. Rev. Int. Stat. Inst. 39:148-169, 1971.
Eisenhauer, H. R., Oxidation of phenolic water. 3_. WPCF 36(9):1116-1128, 1964.
Innes, J. R. M., Ulland, B. M., Valeric, M. G., Petrucelli, L., Fishbein, L., Hart, E. R., Pallotta, A. J., Bates, R. R., Falk, H. L., Gart, J. J., Klein, M., Mitchell, I. and Peters, J., Bioassay of pesticides and industrial chemicals for tumorigenicity in mice: a preliminary note. J._ Nat. Cancer Inst. 42:1101-1114, 1969.
Kaplan, E. L., and Meier, P., Nonparametric estimation from incomplete observations. J_̂ Am. Statist. Assoc. 53:457-481, 1958.
Larson, R. A. and Rockwell, A. L., Gas chromatographic identification of some chlorinated aromatic acids, chlorophenols, and their aromatic acid precursors. J. Chromatogr. 139_(1): 186-190, 1977.
Linhart, M. S., Cooper, J. A., Martin, R.L., Page, N. P., and Peters, J. A., Carcinogenesis bioassay data system. Comp. and Biomed. Res. 7:230-248, 1974.
Miller, R. G., Jr., Simultaneous Statistical Inference, McGraw-Hill Book Co., New York, 1966, pp. 6-10.
39

National Institute for Occupational Safety and Health, Suspected Carcinogens, 2nd edition, Christensen, H.E., ed., National Institute for Occupational Safety and Health, Cincinnati, Ohio, 1976, p. 176.
National Technical Information Service, Evaluation of Carcinogenic, Teratogenic, and Mutagenic Activities o_f_ Selected Pesticide and Industrial Chemicals, Vol. I., Carcinogenic Study, U. S. Department of Commerce, Springfield, Va., 1968, p. 64.
Saffiotti, U., Monesano, R., Sellakumar, R. A., Cefis, F., and Kaufman, D. G., Respiratory tract carcinogenesis in hamsters induced by different numbers of administrations of benzo (a) pyrene and ferric oxide. Cancer Res. 32;1073-1081, 1972.
Smith, J. G., Lee, S. F., and Netzer, A., Chlorination in dilute aqueous systems; 2,4,6-trichlorophenol. Environ. Letters 10(l):47-52, 1975.
Stanford Research Institute, Stage 1̂ Chemical Dossier, Stanford Research Institute, Menlo Park, April 1976.
Tanaka, K., Kurihara, N., and Nakajima, M., Pathway of chlorophenol formation in oxidative biodegradation of BHC. Agric. Biol. Chem. 41(4) -.723-725, 1977.
Tarone, R. E., Tests for trend in life table analysis. Biometrika 62(3) ;679-682, 1975.
United States International Trade Commission, Imports of Benzenoid Chemicals and Products - 1976, USITC Publication 828, United States International Trade Commission, Washington, D.C., 1977, p. 103.
Windholz, M., ed., Merck Index, Merck & Co., Inc., Rahway, N.J., 1976.
40

APPENDIX A
SUMMARY OF THE INCIDENCE OF NEOPLASMS IN RATS ADMINISTERED 2,4,6-TRICHLOROPHENOL IN THE DIET
41

42

TABLE A1.
SUMMARY OF THE INCIDENCE OF NEOPLASMS IN MALE RATS ADMINISTERED 2,4,6-TRICHLOROPHENOL IN THE DIET
ANIMALS INITIALLY IN STUDY ANIMALS NECROPSIED ANIMALS EXAMINED HISTOPATHOLOGICALLY
INTEGUMENTARY SYSTEM
XSKIN SQUAMOUS CELL CARCINOMA TRICHOEPITHELIOMA
XSUBCUT TISSUE SQUAMOUS CELL CARCINOMA, INVASIV TRICHOEPITHELIOMA FIBROMA FIBROSARCOMA RHABDOMYOSARCOMA FIBROADENOMA
RESPIRATORY SYSTEM
ttLUNG ALVEOLAR/BRONCHIOLAR ADENOMA ALVEOLAR/BRONCHIOLAR CARCINOMA
HEMATOPOIETIC SYSTEM
^MULTIPLE ORGANS MALIGNANT LYMPHOMA, NOS LEUKEMIA, NOS MONOCYTIC LEUKEMIA
XHEMATOPOIETIC SYSTEM MALIGNANT LYMPHOMA, NOS MONOCYTIC LEUKEMIA
*RENAL LYMPH NODE SARCOMA, NOS
MATCHED CONTROL
20 20 20
(20) 1 (5%) 2 (10%)
(20) 1 (5%)
1 <5X)
(18)
2 (1U)
(20) 1 (5%)
3 (15X)
(20)
(20)
LOW DOSE
50 50 50
(50) 1 (2%) 1 (2%)
(50)
3 (6X) 1 (2%) 1 (2%) 1 (2%)
(50)
1 (2%)
(50)1 (2%)
23 (46%)
(50)1 (2X)
(50)1 (2%)
HIGH DOSE
50 50 50
(50) 1 (2%) 2 (4%)
(50)
1 (2%)
(50) 1 (2%) 1 (2%)
(50)
1 (2X) 26 (52%)
(50)
2 (450
(50)
* NUMBER OF ANIMALS WITH TISSUE EXAMINED MICROSCOPICALLY X NUMBER OF ANIMALS NECROPSIED
43

TABLE A1. MALE RATS: NEOPLASMS (CONTINUED)
MATCHED CONTROL LOW DOSE
SJEJUNUM (20) (49) MALIG.LYMPHOMA, HISTIOCYTIC TYPE
CIRCULATORY SYSTEM
NONE
DIGESTIVE SYSTEM
XUPPER LIP (20) (50) SQUAMOUS CELL PAPILLOMA 1 (25O
8SALIVARY GLAND (20) (50) ADENOMA, NOS 1 (5X) FIBROADENOCARCINOMA 1 (5%)
SLIVER (20) (49) HEPATOCELLULAR ADENOMA 1 (53O NEOPLASTIC NODULE 1 (2X)
#STOMACH (20) (50) SQUAMOUS CELL PAPILLOMA
ftJEJUNUM (20) (49) MUCINOUS ADENOCARCINOMA 1 (5%)
fCOLONIC SUBMUCOSA (20) (50)LIPOMA 1 (2%)
URINARY SYSTEM
ttURINARY BLADDER (20) (46) PAPILLOMA, NOS TRANSITIONAL-CELL PAPILLOMA 1 (2X)
ENDOCRINE SYSTEM
^PITUITARY (20) (49)ADENOMA, NOS 1 (2%) CHROMOPHOBE ADENOMA 10 (50%) 7 (14%)
# NUMBER OF ANIMALS WITH TISSUE EXAMINED MICROSCOPICALLY * NUMBER OF ANIMALS NECROPSIED
HIGH DOSE
(49)1 (2%)
(50)
(50)
(50)
(49)2 (4%)
(49)
(48)
(49)1 (2X)
(50)1 (2JO 4 (85O
44

ACIDOPHIL CARCINOMA
ftADRENAL CORTICAL ADENOMA PHEOCHROMOCYTOMA PHEOCHROMOCYTOMA, MALIGNANT
•THYROID ADENOMA, NOS ADENOCARCINOMA, NOS C-CELL ADENOMA C-CELL CARCINOMA
*PARATHYROID ADENOMA, NOS ADENOCARCINOMA, NOS
8PANCREATIC ISLETS ISLET-CELL ADENOMA
REPRODUCTIVE SYSTEM
KMAMMARY GLAND ADENOMA, NOS FIBROMA LIPOMA
#TESTIS INTERSTITIAL-CELL TUMOR INTERSTITIAL-CELL TUMOR, MALIGNA
NERVOUS SYSTEM
ftBRAIN ASTROCYTOMA
SPECIAL SENSE ORGANS
*ZYMBAL'S GLAND CARCINOMA, NOS
MUSCULOSKELETAL SYSTEM
NONE
TABLE A1. MALE RATS: NEOPLASMS (CONTINUED)
MATCHED CONTROL
(20)
3 (15%)
(20)
1 (5%) 2 (10%)
(17)
(20)
(20) 2 (10%)
(20) 18 (90%)
(20)
(20) 1 (5%)
LOW DOSE
(50)
1 (2%) 1 (2%)
(49)
1 (2%) 1 (2%)
(39) 1 (3%) 1 (3%)
(50)
(50)
1 (2%) 1 (2%)
(50) 40 (80%)
(50) 1 (2%)
(50)
HIGH DOSE
1
(49)142
(49) 1241
(43)
(50) 1
(50)
(50)37
1
(50)
(50)
(2%)
(2%) (8%) (4%)
(2%) (4%) (8%) (2%)
(2%)
(74%) (2%)
# NUMBER OF ANIMALS WITH TISSUE EXAMINED MICROSCOPICALLY * NUMBER OF ANIMALS NECROPSIED
45

TABLE A1. MALE RATS: NEOPLASMS (CONTINUED)
MATCHED CONTROL LOW DOSE HIGH DOSE
BODY CAVITIES
*PLEURA (20) (50) (50) ALVEOLAR/BRONCHIOLAR CA, METASTA 1 (2%)
XTUNICA VAGINALIS (20) (50) (50) MESOTHELIOMA, NOS 1 (5%) 2 (4X) 1 (2%)
ALL OTHER SYSTEMS
^MULTIPLE ORGANS (20) (50) (50) MUCINOUS ADENOCARCINOMA, METASTA 1 (55O MESOTHELIOMA, NOS 1 (55O 1 (25O
ANIMAL DISPOSITION SUMMARY
ANIMALS INITIALLY IN STUDY 20 50 50 NATURAL DEATHS 2 9 H MORIBUND SACRIFICE 6 2 SCHEDULED SACRIFICE ACCIDENTALLY KILLED TERMINAL SACRIFICE 18 35 ANIMAL MISSING
a INCLUDES AUTOLYZED ANIMALS
* NUMBER OF ANIMALS WITH TISSUE EXAMINED MICROSCOPICALLY * NUMBER OF ANIMALS NECROPSIED
46

TABLE A1. MALE RATS: NEOPLASMS (CONTINUED)
MATCHED CONTROL LOW DOSE HIGH DOSE
TUMOR SUMMARY
TOTAL ANIMALS WITH PRIMARY TUMORS* 20 49 49 TOTAL PRIMARY TUMORS 53 99 100
TOTAL ANIMALS WITH BENIGN TUMORS 19 43 43 TOTAL BENIGN TUMORS 40 61 60
TOTAL ANIMALS WITH MALIGNANT TUMORS 9 29 33 TOTAL MALIGNANT TUMORS 1 1 34 39
TOTAL ANIMALS WITH SECONDARY TUMORS* 2 1 TOTAL SECONDARY TUMORS 2 1
TOTAL ANIMALS WITH TUMORS UNCERTAINBENIGN OR MALIGNANT 2 4 1
TOTAL UNCERTAIN TUMORS 2 4 1
TOTAL ANIMALS WITH TUMORS UNCERTAINPRIMARY OR METASTATIC
TOTAL UNCERTAIN TUMORS
* PRIMARY TUMORS: ALL TUMORS EXCEPT SECONDARY TUMORS # SECONDARY TUMORS: METASTATIC TUMORS OR TUMORS INVASIVE INTO AN ADJACENT ORGAN
47

TABLE A2.
SUMMARY OF THE INCIDENCE OF NEOPLASMS IN FEMALE RATS ADMINISTERED 2,4,6-TRICHLOROPHENOL IN THE DIET
MATCHED CONTROL LOW DOSE HIGH DOSE
ANIMALS INITIALLY IN STUDY 20 50 50 ANIMALS NECROPSIED 20 50 50 ANIMALS EXAMINED HISTOPATHOLOGICALLY 20 50 50
INTEGUMENTARY SYSTEM
XSKIN (20) (50) (50) SQUAMOUS CELL PAPILLOMA 1 (2X) TRICHOEPITHELIOMA 1 (5X)
*SUBCUT TISSUE (20) (50) (50) FIBROSARCOMA 1 (55O 1 (25O LIPOMA 1 (2X) FIBROADENOMA 2 (105O 1 (25O
RESPIRATORY SYSTEM
*NASAL MUCOSA (20) (50) (50) ADENOCARCINOMA, NOS 1 (2%) 1 (25{)
SLUNG (18) (50) (50) ALVEOLAR/BRONCHIOLAR ADENOMA 1 (25O ALVEOLAR/BRONCHIOLAR CARCINOMA 1 (2X)
HEMATOPOIETIC SYSTEM
8CEREBRUM (20) (50) (49) MALIGNANT RETICULOSIS 1 (2X)
^MULTIPLE ORGANS (20) (50) (50)LEUKEMIA,NOS 1 (2X) MONOCYTIC LEUKEMIA 3 (15*) 11 (22X) 10 (20%)
*HEMATOPOIETIC SYSTEM (20) (50) (50) MALIGNANT LYMPHOMA, NOS 2
CIRCULATORY SYSTEM
NONE
* NUMBER OF ANIMALS WITH TISSUE EXAMINED MICROSCOPICALLY * NUMBER OF ANIMALS NECROPSIED
48

TABLE A2. FEMALE RATS: NEOPLASMS (CONTINUED)
MATCHED CONTROL LOW DOSE HIGH DOSE
DIGESTIVE SYSTEM
SSMALL INTESTINE (20) (4S) (48) CYSTADENOCARCINOMA, NOS 1 (2%) MUCINOUS ADENOCARCINOMA 1 (2%)
*RECTUM (20) (50) (50) ADENOCA IN ADENOMATOUS POLYP 1 (5%)
URINARY SYSTEM
NONE
ENDOCRINE SYSTEM
#PITUITARY (20) (49) (49) CARCINOMA, NOS 1 (2%) ADENOMA, NOS 3 (15%) 3 (6%) CHROMOPHOBE ADENOMA 4 (20%) 10 (20%) 8 (16%) CHROMOPHOBE CARCINOMA 1 (2%)
SADRENAL (20) (50) (49) CORTICAL ADENOMA 1 (5%) PHEOCHROMOCYTOMA 1 (5%)
ttTHYROID (20) (49) (50) ADENOCARCINOMA, NOS 1 (2%) 1 (2%) FOLLICULAR-CELL ADENOMA 1 (2%) FOLLICULAR-CELL CARCINOMA 1 (2%) C-CELL ADENOMA 3 (15%) 1 (2%) 1 (2%)
REPRODUCTIVE SYSTEM
XMAMMARY GLAND (20) (50) (50) ADENOCARCINOMA, NOS 1 (5%) PAPILLARY CYSTADENOMA, NOS 1 (2%) FIBROADENOMA 2 (10%)
XVAGINA (20) (50) (50) SQUAMOUS CELL CARCINOMA 1 (5%)
ttUTERUS (20) (50) (49) ENDOMETRIAL STROMAL POLYP 1 (5%) 3 (6%) 2 (4%)
* NUMBER OF ANIMALS WITH TISSUE EXAMINED MICROSCOPICALLY * NUMBER OF ANIMALS NECROPSIED
49

TABLE A2. FEMALE RATS: NEOPLASMS (CONTINUED)
MATCHED CONTROL LOW DOSE HIGH DOSE
SOVARY (20) (50) (49) LIPOMA 1 (25O
NERVOUS SYSTEM
SBRAIN (20) (50) (49) CARCINOMA, NOS, METASTATIC 1 (2%) ASTROCYTOMA 2 (4X)
SPECIAL SENSE ORGANS
NONE
MUSCULOSKELETAL SYSTEM
*RIB (20) (50) (50) OSTEOSARCOMA 1 (2X)
BODY CAVITIES
NONE
ALL OTHER SYSTEMS
NONE
ANIMAL DISPOSITION SUMMARY
ANIMALS INITIALLY IN STUDY 20 50 50 NATURAL DEATHS 2 10 6 MORIBUND SACRIFICE 4 1 5 SCHEDULED SACRIFICE ACCIDENTALLY KILLED TERMINAL SACRIFICE 14 39 39 ANIMAL MISSING
3 INCLUDES AUTOLYZED ANIMALS
# NUMBER OF ANIMALS WITH TISSUE EXAMINED MICROSCOPICALLY * NUMBER OF ANIMALS NECROPSIED
50

TABLE A2. FEMALE RATS: NEOPLASMS (CONTINUED)
MATCHED CONTROL LOW DOSE HIGH DOSE
TUMOR SUMMARY
TOTAL ANIMALS WITH PRIMARY TUMORS* 16 32 27 TOTAL PRIMARY TUMORS 25 40 34
TOTAL ANIMALS WITH BENIGN TUMORS 13 18 13 TOTAL BENIGN TUMORS 18 22 13
TOTAL ANIMALS WITH MALIGNANT TUMORS 6 17 20 TOTAL MALIGNANT TUMORS 7 18 21
TOTAL ANIMALS WITH SECONDARY TUMORS* 1 TOTAL SECONDARY TUMORS 1
TOTAL ANIMALS WITH TUMORS UNCERTAINBENIGN OR MALIGNANT
TOTAL UNCERTAIN TUMORS
TOTAL ANIMALS WITH TUMORS UNCERTAINPRIMARY OR METASTATIC
TOTAL UNCERTAIN TUMORS
H PRIMARY TUMORS: ALL TUMORS EXCEPT SECONDARY TUMORS S SECONDARY TUMORS: METASTATIC TUMORS OR TUMORS INVASIVE INTO AN ADJACENT ORGAN
51

52

APPENDIX B
SUMMARY OF THE INCIDENCE OF NEOPLASMS IN MICE ADMINISTERED 2,4,6-TRICHLOROPHENOL IN THE DIET
53

54

TABLE B1.
SUMMARY OF THE INCIDENCE OF NEOPLASMS IN MALE MICE ADMINISTERED 2,4,6 TRICHLOROPHENOL IN THE DIET
ANIMALS INITIALLY IN STUDY ANIMALS MISSING ANIMALS NECROPSIED ANIMALS EXAMINED HISTOPATHOLOGICALLY
INTEGUMENTARY SYSTEM
*SUBCUT TISSUE FIBROSARCOMA
RESPIRATORY SYSTEM
SLUNG BILE DUCT CARCINOMA, METASTATIC HEPATOCELLULAR CARCINOMA, METAST ALVEOLAR/BRONCHIOLAR ADENOMA ALVEOLAR/BRONCHIOLAR CARCINOMA
HEMATOPOIETIC SYSTEM
^MULTIPLE ORGANS MALIGNANT LYMPHOMA, NOS MALIG.LYMPHOMA, HISTIOCYTIC TYPE
*SUBCUT TISSUE MAST-CELL TUMOR
8LYMPH NODE MALIG.LYMPHOMA, LYMPHOCYTIC TYPE
#LIVER KUPFFER-CELL SARCOMA
CIRCULATORY SYSTEM
^MULTIPLE ORGANS HEMANGIOMA
MATCHED CONTROL
20
20 20
(20)1 (5X)
(20)
1 (5X) 2 (10%)
(20)2 (102)
(20)
(19)
(20)
(20)1 (55O
LOW DOSE
50 1
49 49
(49) 1 (2X)
(48)
1 (2%) 7 (15X) 6 (13X)
(49) 1 (25i) 1 (2X)
(49) 1 (25O
(46) 1 (2X)
(49)
(49)
HIGH
50
49 49
(49)
(47)1 1 6 1
(49)
1
(49)
(47)
(47)1
(49)
DOSE
(2%) (2%) (13X) (2%)
(2%)
(2X)
* NUMBER OF ANIMALS WITH TISSUE EXAMINED MICROSCOPICALLY x NUMBER OF ANIMALS NECROPSIED
55

TABLE B1. MALE MICE: NEOPLASMS (CONTINUED)
MATCHED CONTROL LOW DOSE HIGH DOSE
HEMANGIOSARCOMA 1 (250
8SPLEEN (20) (49) (47) HEMANGIOSARCOMA 3 (650 4 (9%)
SHEART ( 2 0 ) (49) (47) HEMANGIOMA 1 (2%)
•SALIVARY GLAND ( 2 0 ) (48) (47) HEMANGIOSARCOMA 1 (25O
f tLIVER (20) (49) (47) HEMANGIOSARCOMA 1 (5>O 1 (25O 2 (4%)
DIGESTIVE SYSTEM
SLIVER (20) (49) (47) BILE DUCT CARCINOMA 1 (25O HEPATOCELLULAR ADENOMA 3 (155O 22 (455O 32 (685O HEPATOCELLULAR CARCINOMA 1 (55O 10 (205O 7 (15%) SARCOMA, NOS 1 (25O
URINARY SYSTEM
NONE
ENDOCRINE SYSTEM
8THYROID (20) (47) (46) ADENOCARCINOMA, NOS 1 (2%)
REPRODUCTIVE SYSTEM
NONE
NERVOUS SYSTEM
NONE
SPECIAL SENSE ORGANS
*EYE/LACRIMAl GLAND (20 ) (49) (49) ADENOCARCINOMA. NOS 1 (25Q
tt NUMBER OF ANIMALS WITH TISSUE EXAMINED MICROSCOPICALLY * NUMBER OF ANIMALS NECROPSIED
56

TABLE B1. MALE MICE: NEOPLASMS (CONTINUED)
MATCHED CONTROL LOW DOSE HIGH DOSE
MUSCULOSKELETAL SYSTEM XVERTEBRAL COLUMN
OSTEOSARCOMA (20)
1 (55O (49) (49)
BODY CAVITIES
*MESENTERY LIPOMA
(20) 1 (5%)
(49) (49)
ALL OTHER SYSTEMS
NONE
ANIMAL DISPOSITION SUMMARY
ANIMALS INITIALLY IN STUDYNATURAL DEATHSMORIBUND SACRIFICE SCHEDULED SACRIFICE ACCIDENTALLY KILLED TERMINAL SACRIFICEANIMAL MISSING
20 4
16
50 4 1
44 1
50 5
45
a INCLUDES AUTOLYZED ANIMALS * NUMBER OF ANIMALS WITH TISSUE EXAMINED MICROSCOPICALLY X NUMBER OF ANIMALS NECROPSIED
57

TABLE B1. MALE MICE: NEOPLASMS (CONTINUED)
MATCHED CONTROL LOW DOSE HIGH DOSE
TUMOR SUMMARY
TOTAL ANIMALS WITH PRIMARY TUMORS* 14 42 42 TOTAL PRIMARY TUMORS 14 59 56
TOTAL ANIMALS WITH BENIGN TUMORS 6 26 34 TOTAL BENIGN TUMORS 6 29 39
TOTAL ANIMALS WITH MALIGNANT TUMORS 8 26 13 TOTAL MALIGNANT TUMORS 8 29 17
TOTAL ANIMALS WITH SECONDARY TUMORS* 1 2 TOTAL SECONDARY TUMORS 1 2
TOTAL ANIMALS WITH TUMORS UNCERTAINBENIGN OR MALIGNANT 1
TOTAL UNCERTAIN TUMORS 1
TOTAL ANIMALS WITH TUMORS UNCERTAINPRIMARY OR METASTATIC
TOTAL UNCERTAIN TUMORS
* PRIMARY TUMORS: ALL TUMORS EXCEPT SECONDARY TUMORS * SECONDARY TUMORS: METASTATIC TUMORS OR TUMORS INVASIVE INTO AN ADJACENT ORGAN
58

TABLE B2.
SUMMARY OF THE INCIDENCE OF NEOPLASMS IN FEMALE MICE ADMINISTERED 2,4,6-TRICHLOROPHENOL IN THE DIET
MATCHED CONTROL LOW DOSE
ANIMALS INITIALLY IN STUDY ANIMALS MISSING ANIMALS NECROPSIED ANIMALS EXAMINED HISTOPATHOLOGICALLY
20
20 20
50
50 50
INTEGUMENTARY SYSTEM
XSUBCUT TISSUE (20) (50) FIBROSARCOMA 1 (5X)
RESPIRATORY SYSTEM
8LUNG (20) (50)ALVEOLAR/BRONCHIOLAR ADENOMA 1 (550 4 (85O ALVEOLAR/BRONCHIOLAR CARCINOMA SARCOMA, NOS, METASTATIC
HEMATOPOIETIC SYSTEM
^MULTIPLE ORGANS (20) (50) MALIGNANT LYMPHOMA, NOS 5 (10X) MALIG.LYMPHOMA, UNDIFFER-TYPE 1 (25O MALIG.LYMPHOMA, HISTIOCYTIC TYPE 4 (8X) GRANULOCYTIC SARCOMA 1 (2X)
XABDOMINAL CAVITY (20) (50)MALIGNANT LYMPHOMA, NOS 1 (2X)
XHEMATOPOIETIC SYSTEM (20) (50) MALIGNANT LYMPHOMA, NOS 1 (5X)
tSPLEEN (20) (50) MALIGNANT LYMPHOMA, NOS 1 (2X)
ftMANDIBULAR L. NODE (20) (47) MALIGNANT LYMPHOMA, NOS 1 (55i)
(JKIDNEY (20) (50) MALIGNANT LYMPHOMA, NOS
* NUMBER OF ANIMALS WITH TISSUE EXAMINED MICROSCOPICALLY x NUMBER OF ANIMALS NECROPSIED
HIGH DOSE
50 2 48 48
(48)
(48) 1 (2X) 2 (4X) 1 (2%)
(48) 4 (8X)
(48)
(48)2 (4X)
(48)
(48)
(48)1 (25O
59

TABLE B2. FEMALE MICE: NEOPLASMS (CONTINUED)
MATCHED CONTROL LOW DOSE
CIRCULATORY SYSTEM
XSUBCUT TISSUE (20) (50)HEMANGIOMA 1 (2%) HEMANGIOSARCOMA
SBONE MARROW (20) (50) HEMANGIOSARCOMA
*SPLEEN (20) (50)HEMANGIOMA 1 (2%) HEMANGIOSARCOMA 2 (4%)
#HEART (20) (48) HEMANGIOSARCOMA
«LIVER (20) (50) HEMANGIOSARCOMA 1 (5%)
#OVARY (20) (50) HEMANGIOSARCOMA
DIGESTIVE SYSTEM
SLIVER HEPATOCELLULAR ADENOMA HEPATOCELLULAR CARCINOMA
(20) 1 (5%)
(50)12 (24%)
SARCOMA, NOS SARCOMA, NOS, UNC PRIM OR META
URINARY SYSTEM
NONE
ENDOCRINE SYSTEM
^PITUITARY (20) (49) ADENOMA, NOS CHROMOPHOBE ADENOMA 1 (2%)
ttADRENAL (20) (48)CORTICAL ADENOMA 1 (5%) 1 (2%)
* NUMBER OF ANIMALS WITH TISSUE EXAMINED MICROSCOPICALLY * NUMBER OF ANIMALS NECROPSIED
HIGH DOSE
(48)
1 (2%)
(48) 1 (2%)
(48)
1 (2%)
(48)1 (2%)
(48)
(48)1 (2%)
(48)17 (35%) 7 (15%) 1 (2%) 1 (2%)
(46) 1 (2%)
(46)
60

TABLE B2. FEMALE MICE: NEOPLASMS (CONTINUED)
MATCHED CONTROL LOW DOSE HIGH DOSE
PHEOCHROMOCYTOMA 1 (2X)
REPRODUCTIVE SYSTEM
#OVARY (20) C50) (48) ADENOCARCINOMA, NOS 1 (2%) GRANULOSA-CELL TUMOR 1 (2X) T U B U L A R ADENOMA 1 (25{)
N E R V O U S SYSTEM
NONE
SPECIAL SENSE ORGANS *EYE/LACRIMAL GLAND (20) (50) (48)
CARCINOMA,NOS 1 (2%) ADENOMA, NOS 1 (55O ADENOCARCINOMA, NOS 1 (2X)
MUSCULOSKELETAL SYSTEM XVERTEBRAL COLUMN (20) (50) (48)
RHABDOMYOSARCOMA, INVASIVE 1 (55O KRIB (20) (50) (48)
RHABDOMYOSARCOMA 1 (5%)
BODY CAVITIES
NONE
ALL OTHER SYSTEMS
NONE
# NUMBER OF ANIMALS WITH TISSUE EXAMINED MICROSCOPICALLY * NUMBER OF ANIMALS NECROPSIED
61

TABLE B2. FEMALE MICE: NEOPLASMS (CONTINUED)
ANIMAL DISPOSITION SUMMARY
ANIMALS INITIALLY IN STUDYNATURAL DEATH3MORIBUND SACRIFICE SCHEDULED SACRIFICE ACCIDENTALLY KILLED TERMINAL SACRIFICEANIMAL MISSING
3 INCLUDES AUTOLYZED ANIMALS
TUMOR SUMMARY
TOTAL ANIMALS WITH PRIMARY TUMORS*TOTAL PRIMARY TUMORS
TOTAL ANIMALS WITH BENIGN TUMORSTOTAL BENIGN TUMORS
TOTAL ANIMALS WITH MALIGNANT TUMORSTOTAL MALIGNANT TUMORS
TOTAL ANIMALS WITH SECONDARY TUMORS*TOTAL SECONDARY TUMORS
TOTAL ANIMALS WITH TUMORS UNCERTAINBENIGN OR MALIGNANT
TOTAL UNCERTAIN TUMORS
TOTAL ANIMALS WITH TUMORS UNCERTAINPRIMARY OR METASTATIC
TOTAL UNCERTAIN TUMORS
MATCHED CONTROL LOW DOSE
20 50 3 6
17 44
6 30 9 39
3 19 4 22
4 15 5 17
1 1
HIGH DOSE
50 8
40 2
33 44
19 19
19 23
1 1
1 1
1 1
* PRIMARY TUMORS: ALL TUMORS EXCEPT SECONDARY TUMORS # SECONDARY TUMORS: METASTATIC TUMORS OR TUMORS INVASIVE INTO AN ADJACENT ORGAN
62

APPENDIX C
SUMMARY OF THE INCIDENCE OF NONNEOPLASTIC LESIONS IN RATS ADMINISTERED 2,4,6-TRICHLOROPHENOL IN THE DIET
63

64

TABLE C1.
SUMMARY OF THE INCIDENCE OF NONNEOPLASTIC LESIONS IN MALE RATS ADMINISTERED 2,4,6-TRiCHLOROPHENOL IN THE DIET
ANIMALS INITIALLY IN STUDY ANIMALS NECROPSIED ANIMALS EXAMINED HISTOPATHOLOGICALLY
INTEGUMENTARY SYSTEM
XSUBCUT TISSUE ABSCESS, NOS
RESPIRATORY SYSTEM
ftLUNG EDEMA, NOS BRONCHOPNEUMONIA SUPPURATIVE GRANULOMA, NOS
HEMATOPOIETIC SYSTEM
KBLOOD LEUKOCYTOSIS, NOS LEUKOCYTOSIS, NEUTROPHILIC MONOCYTOSIS ANEMIA, NOS
XHEMATOPOIETIC SYSTEM HYPERPLASIA, LYMPHOID
ttBONE MARROW HYPERPLASIA, DIFFUSE HYPERPLASIA, HEMATOPOIETIC
ftSPLEEN CONGESTION, NOS INFARCT, NOS INFARCT, FOCAL HEMOSIDEROSIS
#SINUSOID OF LYMPH NO CONGESTION, NOS
MATCHED CONTROL
20 20 20
(20)
(18)
1 (6%)
(20)
(20)
(20)
(20)
2 (105O
(20)
LOW DOSE
50 50 50
(50) 1 (250
(50)1 (25O
(50) 6 (125O 7 (145O 4 (85O 1 (25O
(50)
(49)26 (535O
(49)
(50)
HIGH DOSE
50 50 50
(50)
(50)
1 (2X)
(50) 2 (4X) 9 (1850
2 (4X)
(50)1 (25O
(50)14 (28%) 1 (250
(50)1 (2%) 1 (25O 1 (25O
(50)1 (25O
# NUMBER OF ANIMALS WITH TISSUE EXAMINED MICROSCOPICALLY X NUMBER OF ANIMALS NECROPSIED
65

TABLE C1. MALE RATS: NONNEOPLASTIC LESIONS (CONTINUED)
HIGH DOSE
1 (25O
(50)
(50)
(50)
(50) 2 (45O
(36)
(50) 1 (25O
(50)
(50)
37 (745O 2 (45O
1 (2%)
(50)1 CZ5O
(50)
(50)1 (25O
HEMOSIDEROSIS
#MANDIBULAR L. NODE HYPERPLASIA, RETICULUM CELL
#CERVICAL LYMPH NODE STEATITIS HYPERPLASIA, LYMPHOID
ftRENAL LYMPH NODE EDEMA, NOS HEMORRHAGE HEMOSIDEROSIS
8HEPATIC SINUSOID LEUKOCYTOSIS, NOS
STHYMUS ATROPHY, NOS
CIRCULATORY SYSTEM
SHEART FIBROSIS, DIFFUSE
SHEART/ATRIUM THROMBOSIS, NOS
ttMYOCARDIUM INFLAMMATION, FOCAL INFLAMMATION, CHRONIC INFLAMMATION, CHRONIC FOCAL FIBROSIS FIBROSIS, DIFFUSE DEGENERATION, NOS NECROSIS, FOCAL
8ENDOCARDIUM THROMBOSIS, NOS
XARTERY THROMBOSIS, NOS INFLAMMATION, NOS
XMESENTERIC ARTERY MINERALIZATION
S NUMBER OF ANIMALS WITH TISSUEx NUMBER OF ANIMALS NECROPSIED
MATCHED CONTROL
(20)
(20)1 (5X) 1 (55O
(20)1 (55O 1 (55O 1 (55O
(20)
(15)
(20)
(20)
(20) 1 (550
14 (7050 2 (10%)
13 (6550
(20)
(20)1 (550 1 (55O
(20)
LOW DOSE
(50)1 (2X)
(50)
(50)
(49)2 (4%)
(38) 1 (3%)
(50)
(50)1 (2%)
(50)
33 (6650
2 (4%) 1 (2%) 1 (25O
(50)
(50)
(50)
EXAMINED MICROSCOPICALLY
66

TABLE C1. MALE RATS: NONNEOPLASTIC LESIONS (CONTINUED)
MATCHED CONTROL LOW DOSE
SLIVER (20) (49) THROMBOSIS, NOS PERIARTERITIS 1 (5X)
SPANCREAS (20) (50)PERIARTERITIS 1 (2X)
XMESENTERY (20) (50) PERIARTERITIS
SPROSTATE (17) (48)PERIARTERITIS 1 (2%)
DIGESTIVE SYSTEM
iSALIVARY GLAND (20) (50)INFLAMMATION, CHRONIC 1 (25O INFLAMMATION, CHRONIC FOCAL 1 (2%) ATROPHY, NOS 1 (5%)
SLIVER (20) (49) CYST, NOS INFLAMMATION, SUPPURATIVE INFLAMMATION, CHRONIC DIFFUSE 1 (2%) NECROSIS, NOS 1 (5%) 1 (2X) NECROSIS, FOCAL 1 (25O METAMORPHOSIS FATTY 3 (65O LIPOIDOSIS 1 (5X) 4 (82) BASOPHILIC CYTO CHANGE HYPERPLASIA, NODULAR 1 (2X) ANGIECTASIS
#LIVER/CENTRILOBULAR (20) (49) DEGENERATION, NOS NECROSIS, NOS METAMORPHOSIS FATTY 1 (25O HYPERTROPHY, NOS
(JLIVER/HEPATOCYTES (20) (49) NECROSIS, NOS 1 (5X)
SBILE DUCT (20) (49)HYPERPLASIA, NOS 5 (25%) 8 (16X)
* NUMBER OF ANIMALS WITH TISSUE EXAMINED MICROSCOPICALLY x NUMBER OF ANIMALS NECROPSIED
HIGH DOSE
(50)2 (4X)
(50)3 (6X)
(50)1 (25O
(47)
(50)
(50)1 (25O 1 (2X)
2 (43O 4 (8X) 4 (8X) 1 (25O 1 (2X) 1 (25O
(50) 1 (2X) 1 (2%) 3 (650 1 (25O
(50)
(50)7 (145£)
67

TABLE C1. MALE RATS: NONNEOPLASTIC LESIONS (CONTINUED)
*PANCREAS INFLAMMATION, CHRONIC INFLAMMATION, CHRONIC FOCAL
#PANCREATIC DUCT HYPERPLASIA, FOCAL
8PANCREATIC ACINUS ATROPHY, NOS ATROPHY, FOCAL
tSTOMACH ULCER, NOS INFLAMMATION, CHRONIC FOCAL
ttGASTRIC MUCOSA ULCER, NOS
#GASTRIC SUBMUCOSA INFLAMMATION, GRANULOMATOUS
8DUODENUM INFLAMMATION, CHRONIC INFLAMMATION, CHRONIC DIFFUSE
ttCOLON PARASITISM
URINARY SYSTEM
*KIDNEY CAST, NOS INFLAMMATION, INTERSTITIAL INFLAMMATION, CHRONIC INFLAMMATION, CHRONIC FOCAL SCLEROSIS NEPHROPATHY
#KIDNEY/GLOMERULUS DEGENERATION, NOS
ttKIDNEY/TUBULECAST, NOS
MATCHED CONTROL
(20) 1 (5X) 1 (55O
(20)
(20)
3 (155O
(20)
1 (5%)
(20)
(20)
(20)
(20)
(20)
17 (85X) 1 (5X)
10 (5050 4 (20%)
(20) 1 (5X)
(20) 2 (105J)
LOW DOSE
(50)
(50)
(50)
3 (65O
(50)1 (2X)
(50)
(50)1 (2X)
(49)
(50)1 (25{)
(50)
36 (72X)
40 (80X)
(50)
(50)
HIGH DOSE
(50)1 (2X) 1 (25O
(50) 1 (2X)
(50) 1 (2X) 9 (18X)
(49)1 (2X) 1 (2%)
(49) 1 (2*)
(49)
(49) 1 (25O 1 (2%)
(48)
(50) 2 (4SO 16 (32%) 22 (445O 1 (2%) 4 (85O
41 (82>{)
(50)
(50)
# NUMBER OF ANIMALS WITH TISSUE EXAMINED MICROSCOPICALLY * NUMBER OF ANIMALS NECROPSIED
68

TABLE C1. MALE RATS: NONNEOPLASTIC LESIONS (CONTINUED)
DEGENERATION, NOS PIGMENTATION, NOS
ftURINARY BLADDER CALCULUS, NOS
ENDOCRINE SYSTEM
*PITUITARY CYST, NOS HYPERPLASIA, FOCAL ANGIECTASIS
1ADRENAL NECROSIS, NOS
SADRENAL CORTEX HEMORRHAGE HYPERPLASIA, FOCAL
#ADRENAL MEDULLA HYPERPLASIA, NOS
#THYROID COLLOID CYST
^PARATHYROID HYPERPLASIA, NOS HYPERPLASIA, DIFFUSE
REPRODUCTIVE SYSTEM
XMAMMARY GLAND GALACTOCELE HYPERPLASIA, DIFFUSE LACTATION
#PROSTATE INFLAMMATION, INTERSTITIAL INFLAMMATION, SUPPURATIVE INFLAMMATION, CHRONIC INFLAMMATION, CHRONIC SUPPURATIV HYPERPLASIA, EPITHELIAL
MATCHED CONTROL LOW DOSE
(20) (46)1 (25O
(20) (49)1 (25O 1 (25O
(20) (50)1 (25O
(20) (50) 1 (550
1 (2%)
(20) (50) 1 (5%)
(20) (49)1 (25O
(17) (39)
(20) (50)
2 (10%) 1 (550
(17) (48)1 (2*) 1 (25O
1 (65O 2 (4%) 1 (25O
2 (12%)
HIGH DOSE
1 (25O 1 (2X)
(49)
(50)1 (2JO
1 (25O
(49)
(49)
(49)
(49)1 (25O
(43) 1 (25O 1 (25O
(50)1 (25O 1 (25O
(47)
1 (250 1 (2X)
1 (25O
# NUMBER OF ANIMALS WITH TISSUE EXAMINED MICROSCOPICALLY x NUMBER OF ANIMALS NECROPSIED
69

TABLE C1. MALE RATS: NONNEOPLASTIC LESIONS (CONTINUED)
MATCHED CONTROL LOW DOSE HIGH DOSE
#PROSTATIC GLAND (17) (48) (47) INFLAMMATION, SUPPURATIVE 1 (2%) INFLAMMATION, ACUTE FOCAL 1 (2%) INFLAMMATION, ACUTE/CHRONIC 1 (2%)
8TESTIS (20) (50) (50) INFARCT, NOS 1 (2%) HYPERPLASIA, INTERSTITIAL CELL 2 (4?O
KEPIDIDYMIS (20) (50) (50) GRANULOMA, SPERMATIC 2 (45O 1 (2%)
^SPERMATIC CORD (20) (50) (50) ABSCESS, NOS 1 (5%) GRANULOMA, NOS 1 (5%)
NERVOUS SYSTEM
NONE
SPECIAL SENSE ORGANS
*EYE (20) (50) (50) CATARACT 16 (80X)' 21 (42'/.) 15 (30X)
XEYE/CORNEA (20) (50) (50) INFLAMMATION, SUPPURATIVE 1 (5%)
XEYE/RETINA (20) (50) (50) DEGENERATION, NOS 16 (80%) 17 (34?O 12 (24X)
MUSCULOSKELETAL SYSTEM
*BONE (20) (50) (50) FIBROUS OSTEODYSTROPHY 1 (2*)
*MUSCLE HIP/THIGH (20) (50) (50) INFLAMMATION, CHRONIC FOCAL 1 (2X) 1
BODY CAVITIES
^PERITONEUM (20) (50) (50) INFLAMMATION, CHRONIC 1 (2X)
# NUMBER OF ANIMALS WITH TISSUE EXAMINED MICROSCOPICALLY * NUMBER OF ANIMALS NECROPSIED
70

TABLE C1. MALE RATS: NONNEOPLASTIC LESIONS (CONTINUED)
MATCHED CONTROL LOW DOSE HIGH DOSE
INFLAMMATION, CHRONIC FOCAL 1 (2X)
ALL OTHER SYSTEMS
NONE
SPECIAL MORPHOLOGY SUMMARY
NO LESION REPORTED 1
# NUMBER OF ANIMALS WITH TISSUE EXAMINED MICROSCOPICALLY * NUMBER OF ANIMALS NECROPSIED
71

TABLE C2.
SUMMARY OF THE INCIDENCE OF NONNEOPLASTIC LESIONS IN FEMALE RATS ADMINSTERED 2,4,6-TRICHLOROPHENOL IN THE DIET
ANIMALS INITIALLY IN STUDYANIMALS NECROPSIEDANIMALS EXAMINED HISTOPATHOLOGICALLY
INTEGUMENTARY SYSTEM
XSUBCUT TISSUEABSCESS, NOS
RESPIRATORY SYSTEM
tfLUNG/BRONCHIOLELYMPHOCYTIC INFLAMMATORY INFILTR
SLUNGCONGESTION, NOS HEMORRHAGE INFLAMMATION, ACUTE SUPPURATIVEGRANULOMA, NOS INFLAMMATION, FOCAL GRANULOMATOU HYPERPLASIA, ADENOMATOUS
HEMATOPOIETIC SYSTEM
*BLOODLEUKOCYTOSIS, NOS LEUKOCYTOSIS, NEUTROPHILIC MONOCYTOSIS
«BONE MARROWHYPERPLASIA, DIFFUSE
KSPLEENINFARCT HEMORRHAGICHEMOSIDEROSISHEMATOPOIESIS GRANULOPOIESIS
MATCHED CONTROL
20 20
20
(20)
(18)
(18)
1 (6%)
1 (6%)
(20)
(20)
(20) 1 (5%)
12 (60%)
LOW DOSE
50 50 50
(50)
(50)
(50)
1 (2%)
(50) 3 (6%) 2 (4%) 2 (4%)
(50) 16 (32%)
(50)
14 (28%) 1 C25O 1 (2%)
HIGH DOSE
50 50 50
(50)1 (2%)
(50) 1 (2%)
(50) 1 (2%) 1 (25£)
1 (2X)
(50) 3 (6%)
(50) 2 (4X)
(50)
13 (26%) 1 (2%)
* NUMBER OF ANIMALS WITH TISSUE EXAMINED MICROSCOPICALLY x NUMBER OF ANIMALS NECROPSIED
72

TABLE C2. FEMALE RATS: NONNEOPLASTIC LESIONS (CONTINUED)
ttSPLENIC FOLLICLES ATROPHY, NOS
«SPLEHIC RED PULP HYPERPLA5IA, NOS
#LYMPH NODE HEMOSIDEROSIS HYPERPLASIA, DIFFUSE
ttMEDIASTINAL L.NODE EDEMA, NOS HEMORRHAGE HEMOSIDEROSIS
SMESENTERIC L. NODE HISTIOCYTOSIS LYMPHOCYTOSIS
SHEPATIC SINUSOID LEUKOCYTOSIS, NOS
CIRCULATORY SYSTEM
#MANDIBULAR L. NODE LYMPHANGIECTASIS
8HEART PERIARTERITIS
#HEART/ATRIUM THROMBOSIS, NOS
#MYOCARDIUM INFLAMMATION, CHRONIC FIBROSIS DEGENERATION, NOS
8CARDIAC VALVE INFLAMMATION, CHRONIC FOCAL
SPANCREAS PERIARTERITIS
MATCHED CONTROL
(20)
(20)
(20) 8 (40X)
(20)
(20)
(20)
(20)
(20)
(20)
(20)H (70X)
(20)
(20)
LOW DOSE
(50)
(50)
(50)
(50)
(50)1 C2X) 1 (2X)
(50) 1 (2X)
(50)
(50)
(50) 1 (2%)
(50)34 (68*)
2 (4X)
(50)
(50)1 (2%)
HIGH DOSE
(50)1 (2X)
(50)1 (2X)
(50)1 (2X) 1 (25O
(50)1 (23O 1 (2X) 1 (2X)
(50)
(50)
(50) 1 (2*)
(50)1 (2%)
(50)
(50)40 (80X) 1 (2X) 2 (4X)
(50)1 (2X)
(44)1 (255)
# NUMBER OF ANIMALS WITH TISSUE EXAMINED MICROSCOPICALLY * NUMBER OF ANIMALS NECROPSIED
73

TABLE C2. FEMALE RATS: NONNEOPLASTIC LESIONS (CONTINUED)
MATCHED CONTROL LOW DOSE
KMESENTERY PERIARTERITIS
(20) (50)1 (2%)
DIGESTIVE SYSTEM
USALIVARY GLAND INFLAMMATION, CHRONIC INFLAMMATION, CHRONIC FOCAL ATROPHY, NOS
(19) (50) 11 (2%) (2%)
#LIVER INFLAMMATION, FOCAL INFLAMMATION, CHRONIC GRANULOMA, NOS
(20) (50)14 (2%) (8%)
NECROSIS, NOS METAMORPHOSIS FATTY LIPOIDOSIS
1 15%-) 32 (6%) (4%)
BASOPHILIC CYTO CHANGE FOCAL CELLULAR CHANGE HYPERPLASIA, NODULAR HYPERPLASIA, FOCAL
2 (10%) 1 (5%) 1
31
(250 (6%) (2%)
SLIVER/CENTRILOBULAR INFLAMMATION, NECROTIZING LIPOIDOSIS
(20) (50)1 (25O 1 (2%)
ttLIVER/PERIPORTALINFLAMMATION, CHRONIC FOCAL
(20) (50)
#LIVER/HEPATOCYTES METAMORPHOSIS FATTY
(20) 1 (5X)
(50)
8BILE DUCT INFLAMMATION, CHRONIC
(20) (50)
HYPERPLASIA, NOS 1 (5%)
«PANCREAS INFLAMMATION, CHRONIC
(20) (50)
INFLAMMATION, CHRONIC FOCAL
SPANCREATIC ACINUS FIBROSIS, FOCAL
(20) (50)
ATROPHY, FOCAL 2 (10%) 6 (125O
* NUMBER OF ANIMALS WITH TISSUE EXAMINED MICROSCOPICALLY * NUMBER OF ANIMALS NECROPSIED
HIGH DOSE
(50)
(48) 3 (6X)
1 (2X)
(50)
1 (2X) 1 (2%)
13 (26%) 3 (6%)
1 (2%)
(50)
(50) 1 (2%)
(50)
(50) 1 (2%) 3 (6%)
(44)1 (2%) 2 (5%)
(44)1 (2%) 7 (16%)
74

TABLE C2. FEMALE RATS: NONNEOPLASTIC LESIONS (CONTINUED)
MATCHED CONTROL LOW DOSE
8ESOPHAGUS INFLAMMATION, NECROTIZING
(20) (50) 1 (2%)
USTOMACH ULCER, NOS INFLAMMATION, NECROTIZING
(20) (50)
1 (2%)
#SMALL INTESTINE ULCER, PERFORATED ADHESION, NOS
(20) (48)2 (4%) 1 (2%)
8DUODENAL SEROSA INFLAMMATION, CHRONIC
(20) (48)
SCOLON PARASITISM
(20) (49) 2 (4%)
URINARY SYSTEM
#KIDNEY HYDRONEPHROSIS
(20) (50)
INFLAMMATION, INTERSTITIAL INFLAMMATION, CHRONIC INFLAMMATION, CHRONIC FOCAL SCLEROSIS NEPHROPATHY GLOMERULOSCLEROSIS, NOS
8 (40%) 1 (5%)
1 (5%) 8 (40%)
272
17
(54%) (4%)
(34%)
#KIDNEY/GLOMERULUS NEPHROPATHY
(20) 1 (5%)
(50)
SURINARY BLADDER INFLAMMATION, CHRONIC FOCAL
(19) (48) 1 (2%)
ENDOCRINE SYSTEM
^PITUITARY CYST, NOS MULTIPLE CYSTS
(20)2 (10%)
(49)3 (6%)
HADRENAL LYMPHOCYTIC INFLAMMATORY INFILTR
(20) 1 (5%)
(50)
*.NUMBER OF ANIMALS WITH TISSUE EXAMINED MICROSCOPICALLY * NUMBER OF ANIMALS NECROPSIED
HIGH DOSE
(48)
(49) 1 (2%)
(48)
(48)2 (4%)
(47)
(50) 1 (2%)
13 (26%) 26 (52%)
21 (42%) 1 (2X)
(50)
(48)
(49) 1 (2%) 2 (4%)
(49)
75

TABLE C2. FEMALE RATS: NONNEOPLASTIC LESIONS (CONTINUED)
MATCHED CONTROL LOW DOSE HIGH DOSE
ftADRENAL CORTEX (20) (50) (49)METAMORPHOSIS FATTY 1 (2%) 1 (25O HYPERPLASIA, NODULAR 1 (2?O HYPERPLASIA, FOCAL 1 (2%)
STHYROID (20) (49) (50) COLLOID CYST 1 (2X) INFLAMMATION, CHRONIC FOCAL 1 (2X)
REPRODUCTIVE SYSTEM
XMAMMARY GLAND (20) (50) (50) DILATATION, NOS 1 (2%) DILATATION/DUCTS 1 (5%) 2 (45O 1 (2X) GALACTOCELE 1 (2>O 1 (2%) CYST, NOS 1 (25O HEMATOMA, NOS 1 (25O FIBROSIS 1 (2%) HYPERPLASIA, EPITHELIAL 2 C10X) HYPERPLASIA, FOCAL 1 (2%)
XMAMMARY DUCT (20) (50) (50) HYPERPLASIA, FOCAL 1 (2X)
XVAGINA (20) (50) (50) PROLAPSE 1 (2X) EPIDERMAL INCLUSION CYST 1 (5X)
SUTERUS (20) (50) (49) GRANULATION, TISSUE 1 (2X) HEMOSIDEROSIS 1 (250
ftCERVIX UTERI (20) (50) (49) PROLAPSE 1 (2%)
#UTERUS/ENDOMETRIUM (20) (50) (49) NECROSIS, FOCAL 1 (2%) INFARCT, NOS 1 (2%)
ftOVARY (20) (50) (49) FOLLICULAR CYST, NOS 1 (2X)
NERVOUS SYSTEM
ftCEREBRAL VENTRICLE (20) (50) (49) DILATATION, NOS 1 (5X)
ft NUMBER OF ANIMALS WITH TISSUE EXAMINED MICROSCOPICALLY x NUMBER OF ANIMALS NECROPSIED
76

TABLE C2. FEMALE RATS: NONNEOPLASTIC LESIONS (CONTINUED)
MATCHED CONTROL LOW DOSE HIGH DOSE
SPECIAL SENSE ORGANS
*EYE (20) C50) (50) CATARACT 4 (20X) 8 (165O 3 (6%)
*EYE/CORNEA (20) (50) (50) INFLAMMATION, NOS 1 (5X)
*EYE/RETINA (20) (50) (50) DEGENERATION, NOS 4 (20X) 7 (1<m 3 (6X)
MUSCULOSKELETAL SYSTEM
NONE
BODY CAVITIES
^PERITONEUM (20) (50) (50) INFLAMMATION, FOCAL 1 (25O INFLAMMATION, CHRONIC 1 (2%)
^MESENTERY (20) (50) (50) STEATITIS 2 (4X) NECROSIS, FOCAL 1 (2X)
ALL OTHER SYSTEMS
NONE
SPECIAL MORPHOLOGY SUMMARY
NONE
« NUMBER OF ANIMALS WITH TISSUE EXAMINED MICROSCOPICALLY « NUMBER OF ANIMALS NECROPSIED
77

78

APPENDIX D
SUMMARY OF THE INCIDENCE OF NONNEOPLASTIC LESIONS IN MICE ADMINISTERED 2,4,6-TRICHLOROPHENOL IN THE DIET
79

oo o

TABLE D1.
SUMMARY OF THE INCIDENCE OF NONNEOPLASTIC LESIONS IN MALE MICE ADMINISTERED 2,4,6-TRICHLOROPHENOL IN THE DIET
MATCHED CONTROL LOW DOSE HIGH DOSE
ANIMALS INITIALLY IN STUDY 20 50 50 ANIMALS MISSING 1 ANIMALS NECROPSIED 20 49 49 ANIMALS EXAMINED HISTOPATHOLOGICALLY 20 49 49
INTEGUMENTARY SYSTEM
XSKIN (20) (49) (49) CYST, NOS 1 (5X)
XSUBCUT TISSUE (20) (49) (49) INFLAMMATION, NOS 1 (23O
RESPIRATORY SYSTEM
SLUNG (20) (48) (47) INFLAMMATION, CHRONIC FOCAL 1 (5X) GRANULOMA, NOS 1 (2X)
HEMATOPOIETIC SYSTEM
XBLOOD (20) (49) (49) LEUKOCYTOSIS, NEUTROPHILIC
ffBONE MARROW HYPOPLASIA, NOS HYPERPLASIA, NOS HYPERPLASIA, HEMATOPOIETIC
(20)
1 (55O
(47)1
1
(2X)
(2%)
(47)
«SPLEEN HYPERPLASIA,HEMATOPOIESIS
LYMPHOID (20) 3 1 (15%)(5X.)
(49) 2 (45O 1 (2%)
(47) 2 (4JO
SLYMPH NODE CONGESTION, NOS HEMOSIDEROSIS HYPERPLASIA, NOS PLASMACYTOSIS
(19)
1 1 (5%)(5%)
(46) (47)1 (25O 3 (6X)
* NUMBER OF ANIMALS WITH TISSUE EXAMINED MICROSCOPICALLY x NUMBER OF ANIMALS NECROPSIED
81

TABLE D1. MALE MICE: NONNEOPLASTIC LESIONS (CONTINUED)
HYPERPLASIA, LYMPHOID
ttMESENTERIC L. NODE CONGESTION, N05 HEMORRHAGE HYPERPLASIA, LYMPHOID
SLUNG/ALVEOLI HISTIOCYTOSIS
KLIVER HEMATOPOIESIS
ftPEYERS PATCH HYPERPLASIA, LYMPHOID
CIRCULATORY SYSTEM
SHEART PERIVASCULITIS
ftHEART/ATRIUM THROMBOSIS, NOS
MYOCARDIUM INFLAMMATION, CHRONIC FOCAL INFLAMMATION, PYOGRANULOMATOUS
XCORONARY ARTERY INFLAMMATION, CHRONIC INFLAMMATION, CHRONIC FOCAL
XMESENTERIC ARTERY INFLAMMATION, CHRONIC
XRENAL ARTERY INFLAMMATION, CHRONIC
XEPIDIDYMIS PERIARTERITIS
#THYROID PERIARTERITIS PERIVASCULITIS
MATCHED CONTROL
( 19) 3 (16%)
(20)
(20) 1 (55O
(20)
(20)
(20)
(20)
(20)
(20)
(20)
(20)
(20)
LOW DOSE
(46) 1 (2%)
4 (9%)
(48)1 (25O
(49) 1 (250
(46)1 (2%)
(49)1 (250
(49)1 (2%)
(49)1 (2%)
(49) 1 (2%) 1 (25O
(49)
(49)1 (25O
(49)
(47)
1 (25O
HIGH DOSE
1 (25O
(47) 4 (950 1 (25£) 3 (65C)
(47)
(47)
(43) 1 (25O
(47)
(47)
(47)1 (25O 1 (25O
(49)1 (2%)
(49)1 (2%)
(49)1 (2%)
(49)1 (2%)
(46) 1 (254)
* NUMBER OF ANIMALS WITH TISSUE EXAMINED MICROSCOPICALLY x NUMBER OF ANIMALS NECROPSIED
82

TABLE 01. MALE MICE: NONNEOPLASTIC LESIONS (CONTINUED)
MATCHED CONTROL LOW DOSE HIGH DOSE
DIGESTIVE SYSTEM
•SALIVARY GLAND (20) (48) (47)INFLAMMATION, CHRONIC 7 (35X) 10 (21JO 14 (30X) INFLAMMATION, CHRONIC FOCAL 2 (45O
•LIVER (20) (49) (47) INFLAMMATION, NECROTIZING 2 (4%) INFLAMMATION, CHRONIC 1 (55O INFLAMMATION, CHRONIC FOCAL 1 (5X) NECROSIS, NOS 2 (10X) 1 (25O INFARCT, NOS 1 (5%) INFARCT, FOCAL 1 (5X) 1 (2X) LIPOIDOSIS 1 (55O 1 (2X) HYPERPLASIA, NODULAR 1 (550 3 (65O HYPERPLASIA, FOCAL 1 (53O ANGIECTASIS
•LIVER/CENTRILOBULAR (20) (49) (47) NECROSIS, NOS 1 (550
•LIVER/HEPATOCYTES (20) (49) (47) DEGENERATION, NOS 1 (255) HYPERTROPHY, FOCAL 1 (2X) HYPERPLASIA, NODULAR 1 (25O 1 HYPERPLASIA, NOS 10 (20K) 2 (4X) HYPERPLASIA, FOCAL 1 (22)
*BILE DUCT (20) (49) (47) INFLAMMATION, NOS 1 (2%) INFLAMMATION, CHRONIC 3 (6%) INFLAMMATION, CHRONIC FOCAL 2 (4%) INFLAMMATION CHRONIC CYSTIC 1 (2%) NECROSIS, NOS 1 (2%) HYPERPLASIA, NOS 1 (2%)
((PANCREAS (20) (48) (47) HEMORRHAGE 1 (55O STEATITIS 1 (55O
•STOMACH (20) (47) (46) INFLAMMATION, SUPPURATIVE 1 (2X)
•SMALL INTESTINE (20) (46) (43)DIVERTICULUM 1 (2X)
» NUMBER OF ANIMALS WITH TISSUE EXAMINED MICROSCOPICALLY X NUMBER OF ANIMALS NECROPSIED
83

TABLE 01. MALE MICE: NONNEOPLASTIC LESIONS (CONTINUED)
MATCHED CONTROL LOW DOSE
((COLON (19) (47) PARASITISM 1 (5%)
URINARY SYSTEM
SKIDNEY (20) (49) INFLAMMATION, INTERSTITIAL 1 (2X) INFLAMMATION, CHRONIC 9 (45X) 4 (8X) PYELONEPHRITIS, CHRONIC HYPERPLASIA, TUBULAR CELL 1 (55O
#KIDNEY/PELVIS (20) (49.' INFLAMMATION, CHRONIC FOCAL
ffURINARY BLADDER (18) (48)CALCULUS, NOS 1 (25O INFLAMMATION, CHRONIC FOCAL
ENDOCRINE SYSTEM
*ADRENAL CORTEX (20) (49) HYPERPLASIA, NODULAR 1 (55O
«THYROID (20) (47) ULTIMOBRANCHIAL CYST INFLAMMATION, FOCAL GRANULOMATOU
REPRODUCTIVE SYSTEM
*PREPUTIAL GLAND (20) (49) ABSCESS, CHRONIC 1 (2%)
SPROSTATE (20) (48) INFLAMMATION, CHRONIC FOCAL 1 (2X)
*TESTIS (19) (49)INFLAMMATION, FOCAL GRANULOMATOU 1 (2%)
XEPIDIDYMIS (20) (49) DILATATION, NOS 1 (5%) STEATITIS 1 (5X)
8 NUMBER OF ANIMALS WITH TISSUE EXAMINED MICROSCOPICALLY x NUMBER OF ANIMALS NECROPSIED
HIGH DOSE
(46)
(47)
10 (2U) 2 (450
(47)1 (23O
(45)
1 (25O
(45)
(46) 1 (2X) 1 (25S)
(49)
(42)
(46)
(49)
84

TABLE 01. MALE MICE: NONNEOPLASTIC
INFLAMMATION, CHRONIC FOCALGRANULOMA, SPERMATICNECROSIS, FAT
NERVOUS SYSTEM
NONE
SPECIAL SENSE ORGANS
NONE
MUSCULOSKELETAL SYSTEM *ISCHIOCAVERNOSUS MUS
PARASITISM
BODY CAVITIES XMESENTERY
GRANULATION, TISSUE
ALL OTHER SYSTEMS HEAD
HEMATOMA, ORGANIZED
SPECIAL MORPHOLOGY SUMMARY
NO LESION REPORTEDANIMAL MISSING/NO NECROPSYAUTOLYSIS/NO NECROPSY
LESIONS (CONTINUED)
MATCHED CONTROL LOW DOSE HIGH DOSE
1 (2SO 1 (2%)
1 (55O
(20) (49) (49) 1 (55O
(20) (49) (49) 1 (2%)
1
2 2 1
1
» NUMBER OF ANIMALS WITH TISSUE EXAMINED MICROSCOPICALLY * NUMBER OF ANIMALS NECROPSIED
85

TABLE 02.
SUMMARY OF THE INCIDENCE OF NONNEOPLASTIC LESIONS IN FEMALE MICE ADMINISTERED 2,4,6-TRICHLOROPHENOL IN THE DIET
MATCHED CONTROL LOW DOSE
ANIMALS INITIALLY IN STUDY 20 50 ANIMALS MISSING ANIMALS NECROPSIED 20 50 ANIMALS EXAMINED HISTOPATHOLOGICALLY 20 50
INTEGUMENTARY SYSTEM
NONE
RESPIRATORY SYSTEM
*LUNG/BRONCHIOLE (20) (50) LYMPHOCYTIC INFLAMMATORY INFILTR
ttLUNG (20) (50) LYMPHOCYTIC INFLAMMATORY INFILTR 1 (2%) HYPERPLASIA, ALVEOLAR EPITHELIUM 1 (250
HEMATOPOIETIC SYSTEM
ttBONE MARROW (20) (50) HYPERPLASIA, HEMATOPOIETIC
#SPLEEN (20) (50) INFLAMMATION, GRANULOMATOUS HEMOSIDEROSIS 3 (155O 2 (4%) HYPERPLASIA, RETICULUM CELL HYPERPLASIA, LYMPHOID 1 (2X) HEMATOPOIESIS 1 (2X)
KSPLENIC FOLLICLES (20) (50) NECROSIS, NOS 1 (2X)
ttLYMPH NODE (20) (47) HYPERPLASIA, RETICULUM CELL 1 (5X) HYPERPLASIA, LYMPHOID 1 (23O
ftMANDIBULAR L. NODE (20) (47) HYPERPLASIA, LYMPHOID 1 (25O
* NUMBER OF ANIMALS WITH TISSUE EXAMINED MICROSCOPICALLY x NUMBER OF ANIMALS NECROPSIED
HIGH DOSE
50 2 48 48
(48) 1 (2X)
(48)
(48)
(48)
4 (8X) 1 (2X)
(48)
(48)
(48) 1 (25O
86

TABLE 02. FEMALE MICE: NONNEOPLASTIC
ttABDOMINAL LYMPH NODE INFLAMMATION, GRANULOMATOUS
ttMESENTERIC L. NODE CONGESTION, NOS EOSINOPHILIC INFILTRATE HYPERPLASIA, RETICULUM CELL HYPERPLASIA, LYMPHOID
SLIVER HEMATOPOIESIS
#PEYERS PATCH HYPERPLASIA, RETICULUM CELL HYPERPLASIA, LYMPHOID
CIRCULATORY SYSTEM
^MULTIPLE ORGANS PERIARTERITIS
KLUNG PERIVASCULITIS
KMYOCARDIUM INFLAMMATION, CHRONIC FOCAL
SOVARY THROMBOSIS, NOS
DIGESTIVE SYSTEM
SSALIVARY GLAND INFLAMMATION, NOS INFLAMMATION, CHRONIC INFLAMMATION, CHRONIC FOCAL
ttLIVER INFLAMMATION, NECROTIZING INFLAMMATION, ACUTE/CHRONIC INFLAMMATION, CHRONIC INFLAMMATION, CHRONIC NECROTIZIN
LESIONS (CONTINUED)
MATCHED CONTROL
(20)
(20)
(20) 1 (5%)
(19)
(20)
(20)
(20)
(20)
(20) 1 (5%)
10 (SOX) 2 (10%)
(20)
6 (30%)
LOW DOSE
(47)
(47) 1 (2%)
2 (4%)
(50)
(50)
2 (4%)
(50) 1 (2%)
(50)
(48) 1 (2%)
(50)
(46)
15 (33%)
(50)
1 (2%) 6 (12%)
HIGH DOSE
(48)1
(48)2121
(48)
(48)21
(48)
(48)1
(48)
(48)1
(47)
18
(48)1
161
(2%)
(4%) (2%) (4%) (2%)
(4%) (2%)
(2%)
(2%)
(38%)
(2%)
(33%) (2%)
ft NUMBER OF ANIMALS WITH TISSUE EXAMINED MICROSCOPICALLY * NUMBER OF ANIMALS NECROPSIED
87

TABLE 02. FEMALE MICE: NONNEOPLASTIC LESIONS (CONTINUED)
NECROSIS, NOS NECROSIS, FOCAL INFARCT, FOCAL LIPOIDOSIS HYPERTROPHY, NOS HYPERPLASIA, NODULAR HYPERPLASIA, FOCAL
HIVER/HEPATOCYTES HYPERPLASIA, NOS HYPERPLASIA, FOCAL
#BILE DUCT DILATATION, NOS INFLAMMATION, CHRONIC HYPERPLASIA, FOCAL
ttPANCREAS CYSTIC DUCTS INFLAMMATION, CHRONIC INFLAMMATION, CHRONIC FOCAL
UPANCREATIC DUCT DILATATION, NOS CYST, NOS
SSTOMACH INFLAMMATION, SUPPURATIVE
ttCOLON PARASITISM
URINARY SYSTEM
#KIDNEY INFLAMMATION, CHRONIC PYELONEPHRITIS, CHRONIC INFARCT, NOS
#KIDNEY/ CORTEX INFARCT, FOCAL
*KIDNEY/PELVIS INFLAMMATION, FOCAL
MATCHED CONTROL
1 (5%)
(20)
(30)
(19)
(19)1 (55O
(20)
(20)
(20)6 (30%) 4 (2050
(20)
(20)1 (55O
LOW DOSE
1 (25O 1 (2*)
(50)
1 (2%)
(50)
(48)
1 (250 1 (25O
(48)
1 (25O
(50)1 (25O
(48)3 (6%)
(50)4 (8%) 5 (10X)
(50)1 (25O
(50)
HIGH DOSE
1 (25O
1 (2%) 2 (4%) 1 (25O
1 (2%)
(48)3 (6%) 2 (4%)
(48)1 (2X) 2 (450 1 (250
(48) 1 (250
(48)
(47)
(47)
(48)6 (1350 3 (65O 1 (25O
(48)
(48)
# NUMBER OF ANIMALS WITH TISSUE EXAMINED MICROSCOPICALLY x NUMBER OF ANIMALS NECROPSIED
88

TABLE 02. FEMALE MICE: NONNEOPLASTIC LESIONS (CONTINUED)
INFLAMMATION, CHRONIC INFLAMMATION, CHRONIC FOCAL
8URINARY BLADDER INFLAMMATION, CHRONIC INFLAMMATION, CHRONIC FOCAL INFLAMMATION, CHRONIC DIFFUSE
ENDOCRINE SYSTEM
#ADRENAL CORTEX HYPERPLASIA, NODULAR
STHYROID HYPERPLASIA, FOLLICULAR-CELL
REPRODUCTIVE SYSTEM
ttUTERUS HYDROMETRA
SUTERUS/ENDOMETRIUMCYST, NOS MULTIPLE CYSTS HYPERPLASIA, DIFFUSE HYPERPLASIA, PAPILLARY HYPERPLASIA, CYSTIC
#UTERUS/MYOMETRIUM INFLAMMATION, CHRONIC FOCAL
SOVARY FOLLICULAR CYST, NOS
NERVOUS SYSTEM
ttBRAIN/MENINGES INFLAMMATION, CHRONIC
SPECIAL SENSE ORGANS
NONE
MATCHED CONTROL
1 (5%)
(20) 1 (5%) 2 (10%)
(20) 1 (5%)
(20)
(20)
(20) 1 (5%) 2 (10%)
1 (5%)
(20)
(20)
(20)1 (5%)
LOW DOSE
1 (2%)
(47)9 (19%) 1 (2%)
(48)
(48)1 (2%)
(50)1 (2%)
(50)1 (2%) 1 (2%) 3 (6%) 1 (2%) 5 (10%)
(50) 1 (2%)
(50)1 (2%)
(50)
HIGH DOSE
2 (4%) 2 (4%)
(46)6 (13%)
1 (2%)
(46)
(45)
(48)
(48)
1 (2%)
(48)
(48) 1 (2%)
(48)
# NUMBER OF ANIMALS WITH TISSUE EXAMINED MICROSCOPICALLY x NUMBER OF ANIMALS NECROPSIED
89

TABLE D2. FEMALE MICE: NONNEOPLASTIC LESIONS (CONTINUED)
MATCHED CONTROL LOW DOSE HIGH DOSE
MUSCULOSKELETAL SYSTEM
^SKELETAL MUSCLE (20) (50) (48) PARASITISM 1 (2K)
BODY CAVITIES
^PERITONEUM (20) (50) (48) INFLAMMATION, GRANULOMATOUS 1 (2X)
*PLEURA (20) (50) (48) INFLAMMATION, CHRONIC 1 (2X)
XMESENTERY (20) (50) (48) CYST, NOS 1 (5X)
ALL OTHER SYSTEMS
NONE
SPECIAL MORPHOLOGY SUMMARY
NO LESION REPORTED 2 ANIMAL MISSING/NO NECROPSY 2 AUTO/NECROPSY/HISTO PERF 1
* NUMBER OF ANIMALS WITH TISSUE EXAMINED MICROSCOPICALLY * NUMBER OF ANIMALS NECROPSIED
90

APPENDIX E
ANALYSES OF THE INCIDENCE OF PRIMARY TUMORS IN RATS ADMINISTERED 2,4,6-TRICHLOROPHENOL IN THE DIET
91

92

Table El. Analyses of the Incidence of Primary Tumors in Male Rats Administered 2,4,6-Trichlorophenol in the Diet (a)
Topography: Morphology
Integumentary System: Trichoepithelioma (b)
P Values (c,d)
Relative Risk (f) Lower Limit Upper Limit
Weeks to First Observed Tumor
U)
Lung: Alveolar/Bronchiolar Carcinoma (b)
P Values (c,d)
Relative Risk (f) Lower Limit Upper Limit
Weeks to First Observed Tumor
Matched Control
2/20 (10)
N.S.
107
2/18 (11)
N.S.
107
Low Dose
4/50 (8)
N.S.
0.800 0.128 8.436
106
1/50 (2)
N.S.
0.180 0.003 3.307
86
High Dose
2/50 (4)
N.S.
0.400 0.032 5.277
106
1/50 (2)
N.S.
0.180 0.003 3.307
106

Table El. Analyses of the Incidence of Primary Tumors in Male Rats Administered 2,4,6-Trichlorophenol in the Diet (a)
(continued)
Topography: Morphology
Lung: Alveolar /Bronchiolar Carcinoma or Adenoma (b)
P Values (c,d)
Relative Risk (f) Lower Limit Upper Limit
Weeks to First Observed Tumor
Hematopoietic System: Monocytic Leukemia (b)
P Values (c,d)
Relative Risk (f) Lower Limit Upper Limit
Weeks to First Observed Tumor
Matched Low High Control Dose Dose
2/18 (11) 1/50 (2) 2/50 (4)
N.S. N.S. N.S.
0.180 0.360 0.003 0.029 3.307 4.740
107 86 106
3/20 (15) 23/50 (46) 28/50 (56)
P = 0.003 P = 0.013 P = 0.002
3.067 3.733 1.095 1.373 14.502 17.192
107 64 69

Table El. Analyses of the Incidence of Primary Tumors in Male Rats Administered 2,4,6-Trichlorophenol in the Diet (a)
(continued)
Topography: Morphology
Hematopoietic System: Lymphoma or Leukemia (b)
P Values (c,d)
Relative Risk (f) Lower Limit Upper Limit
Weeks to First Observed TumorVO Ln
Pituitary: Chromophobe Adenoma (b)
P Values (c,d)
Departure from Linear Trend (e)
Relative Risk (f) Lower Limit Upper Limit
Matched Control
4/20 (20)
P = 0.006
107
10/20 (50)
P less than 0.001 (N)
P = 0.044
Low Dose
25/50 (50)
P = 0.019
2.500 1.036 8.761
64
7/49 (14)
P = 0.003 (N)
0.286 0.117 0.718
High Dose
29/50 (58)
P = 0.004
2.900 1.230 9.922
69
4/50 (8)
P less than 0.001 (N)
0.160 0.045 0.486
Weeks to First Observed Tumor 107 106 106

Table El. Analyses of the Incidence of Primary Tumors in Male Rats Administered 2,4,6-Trichlorophenol in the Diet (a)
(continued) Matched Low High
Topography: Morphology Control Dose Dose
Adrenal: Pheochromocytoma (b) 3/20 (15) 2/50 (4) 6/49 (12)
P Values (c,d) N.S. N.S. N.S.
Relative Risk (f) 0.267 0.816 Lower Limit 0.024 0.199 Upper Limit 2.190 4.706
Weeks to First Observed Tumor 107 84 79
Thyroid: C-cell Carcinoma or Adenoma (b) 2/20 (10) 2/49 (4) 5/49 (10)
P Values (c,d) N.S. N.S. N.S.
Relative Risk (f) 0.408 1.020 Lower Limit 0.032 0.188 Upper Limit 5.381 10.204
Weeks to First Observed Tumor 107 96 98
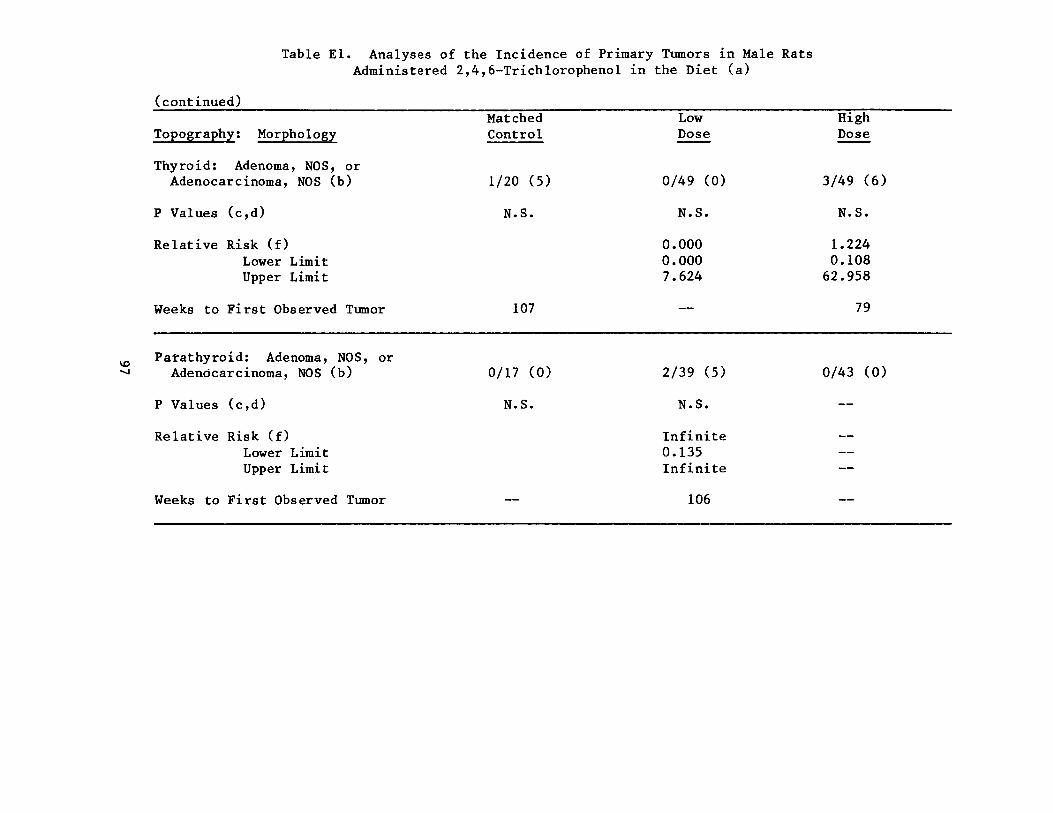
Table El. Analyses of the Incidence of Primary Tumors in Male Rats Administered 2,4,6-Trichlorophenol in the Diet (a)
(continued) Matched Low
Topography: Morphology Control Dose
Thyroid: Adenoma, NOS, or Adenocarcinoma, NOS (b) 1/20 (5) 0/49 (0)
P Values (c,d) N.S. N.S.
Relative Risk (f) 0.000 Lower Limit 0.000 Upper Limit 7.624
Weeks to First Observed Tumor 107 —
Parathyroid: Adenoma, NOS, or VO
Adenocarcinoma, NOS (b) 0/17 (0) 2/39 (5)
P Values (c,d) N.S. N.S.
Relative Risk (f) Infinite Lower Limit 0.135 Upper Limit Infinite
Weeks to First Observed Tumor 106
High Dose
3/49 (6)
N.S.
1.224 0.108 62.958
0/43 (0)
—
— — —
79

00
Table El. Analyses of the Incidence of Primary Tumors in Male Rats Administered 2,4,6-Trichlorophenol in the Diet (a)
(continued) Matched Low
Topography: Morphology Control Dose
Mammary Gland: Adenoma, NOS (b) 2/20 (10) 0/50 (0)
P Values (c,d) P = 0.024 (N) N.S.
Departure from Linear Trend (e) P = 0.042
Relative Risk (f) 0.000 Lower Limit 0.000 Upper Limit 1.345
Weeks to First Observed Tumor 107 —
Testis: Interstitial-cell Tumor (b) 18/20 (90) 40/50 (80)
P Values (c,d) N.S. N.S.
Relative Risk (f) 0.889 Lower Limit 0.775 Upper Limit 1.190
Weeks to First Observed Tumor 103 84
High Dose
0/50 (0)
N.S.
0.000 0.000 1.345
—
38/50 (76)
N.S.
0.844 0.735 1.147
98

Table El. Analyses of the Incidence of Primary Tumors in Male Rats Administered 2,4,6-Trichlorophenol in the Diet (a)
(continued)
(a) Dosed groups received 5,000 or 10,000 ppm.
(b) Number of tumor-bearing animals/number of animals examined at site (percent).
(c) Beneath the incidence of tumors in the control group is the probability level for the Cochran-Armitage test when P is less than 0.05; otherwise, not significant (N.S.) is indicated. Beneath the incidence of tumors in a dosed group is the probability level for the Fisher exact test for the comparison of that dosed group with the matched-control group when P is less than 0.05; otherwise, not significant (N.S.) is indicated.
(d) A negative trend (N) indicates a lower incidence in a dosed group than in a control group.
(e) The probability level for departure from linear trend is given when P is less than 0.05 for any comparison.
VD
(f) The 95% confidence interval of the relative risk between each dosed group and the control group.

Table E2. Analyses of the Incidence of Primary Tumors in Female Rats Administered 2,4,6-Trichorophenol in the Diet (a)
Matched Low Topography: Morphology Control Dose
Integumentary System: Fibroadenoma of the Subcutaneous Tissue (b) 2/20 (10) 1/50 (2)
P Values (c,d) P = 0.035 (N) N.S.
Relative Risk ( f) 0.200 Lower Limit 0.004 Upper Limit 3.681
Weeks to First Observed Tumor 92 92
o o
Hematopoietic System: Monocytic Leukemia (b) 3/20 (15) 11/50 (22)
P Values (c,d) N.S. N.S.
Relative Risk (f) 1.467 Lower Limit 0.450 Upper Limit 7.595
Weeks to First Observed Tumor 103 69
High Dose
0/50 (0)
N.S.
0.000 0.000 1.345
—
10/50 (20)
N.S.
1.333 0.398 7.002
104

Table E2. Analyses of the Incidence of Primary Tumors in Female Rats Administered 2,4,6-Trichorophenol in the Diet (a)
(continued)
Topography: Morphology
Hematopoietic System: Lymphoma or Leukemia (b)
P Values (c,d)
Relative Risk (f) Lower Limit Upper Limit
Weeks to First Observed Tumor
Pituitary: Carcinoma, NOS, or Adenoma, NOS (b)
P Values (c,d)
Relative Risk (f) Lower Limit Upper Limit
Weeks to First Observed Tumor
Matched Control
3/20 (15)
N.S.
103
3/20 (15)
P = 0.042 (N)
92
Low Dose
11/50 (22)
N.S.
1.467 0.450 7.594
69
3/49 (6)
N.S.
0.408 0.061 2.857
92
High Dose
13/50 (26)
N.S.
1.733 0.556 8.773
1/49 (2)
N.S.
0.136 0.003 1.599
106
55

Table E2. Analyses of the Incidence of Primary Tumors in Female Rats Administered 2,4,6-Trichorophenol in the Diet (a)
(continued) Matched Low
Topography: Morphology Control Dose
Pituitary: Chromophobe Carcinoma or Adenoma (b) 4/20 (20) 11/49 (22)
P Values (c,d) N.S. N.S.
Relative Risk (f) 1.122 Lower Limit 0.392 Upper Limit 4.404
Weeks to First Observed Tumor 107 107
o N3
Thyroid: C-cell Adenoma (b) 3/20 (15) 1/49 (2)
P Values (c,d) P = 0.041 (N) N.S.
Relative Risk (f) 0.136 Lower Limit 0.003 Upper Limit 1.599
Weeks to First Observed Tumor 107 106
High Dose
8/49 (16)
N.S.
0.816 0.255 3.392
106
1/50 (2)
N.S.
0.133 0.003 1.568
106

Table E2. Analyses ofAdministered
the Incidence of Primary Tumors in Female 2,4,6-Trichorophenol in the Diet (a)
Rats
(continued)
Topography: Morphology MatchedControl
Low Dose
High Dose
Mammary Gland: Fibroadenoma (b) 2/20 (10) 0/50 (0) 0/50 (0)
P Values (c,d) P = 0.024 (N) N.S. N.S.
Departure from Linear Trend (e) P = 0.042
Relative Risk (f) Lower Limit Upper Limit
0.000 0.000 1.345
0.000 0.000 1.345
o to
Weeks to First Observed Tumor 92 —
Uterus: Endometrial Stromal Polyp (b) 1/20 (5) 3/50 (6) 2/49 (4)
P Values (c,d) N.S. N.S. N.S.
Relative Risk (f) Lower Limit Upper Limit
1.200 0.106 61. 724
0.816 0.046 47.195
Weeks to First Observed Tumor 100 106 87

Table E2. Analyses of the Incidence of Primary Tumors in Female Rats Administered 2,4,6-Trichorophenol in the Diet (a)
(continued)
(a) Dosed groups received 5,000 or 10,000 ppm.
(b) Number of tumor-bearing animals/number of animals examined at site (percent).
(c) Beneath the incidence of tumors in the control group is the probability level for the Cochran-Armitage test when P is less than 0.05; otherwise, not significant (N.S.) is indicated. Beneath the incidence of tumors in a dosed group is the probability level for the Fisher exact test for the comparison of that dosed group with the matched-control group when P is less than 0.05; otherwise, not significant (N.S.) is indicated.
(d) A negative trend (N) indicates a lower incidence in a dosed group than in a control group.
(e) The probability level for departure from linear trend is given when P is less than 0.05 for any comparison.
(f) The 95% confidence interval of the relative risk between each dosed group and the control group.

APPENDIX F
ANALYSES OF THE INCIDENCE OF PRIMARY TUMORS IN MICE ADMINISTERED 2,4,6-TRICHLOROPHENOL IN THE DIET
105

106

Table Fl. Analyses of the Incidence of Primary Tumors in Male Mice Administered 2,4,6-Trichlorophenol in the Diet (a)
Topography: Morphology
Lung: Alveolar /Bronchiolar Carcinoma (b)
P Values (c,d)
Relative Risk (f) Lower Limit Upper Limit
Weeks to First Observed Tumor
Lung: Alveolar/Bronchiolar Carcinoma or Adenoma (b)
P Values (c,d)
Relative Risk (f) Lower Limit Upper Limit
Weeks to First Observed Tumor
Matched Control
2/20 (10)
N.S.
105
3/20 (15)
N.S.
105
Low Dose
6/48 (13)
N.S.
1.250 0.253 12.039
93
13/48 (27)
N.S.
1.806 0.579 9.115
93
High Dose
1/47 (2)
N.S.
0.213 0.004 3.909
105
7/47 (15)
N.S.
0.993 0.261 5.532
95

Table Fl. Analyses ofAdministered
(continued)
Topography: Morphology
Hematopoietic System: Malignant Lymphoma (b)
P Values (c,d)
Relative Risk ( f) Lower Limit Upper Limit
Weeks to First Observed Tumor
o 00 All Sites: Hemangios arcoma (b)
P Values (c,d)
Relative Risk (f) Lower Limit Upper Limit
Weeks to First Observed Tumor
the Incidence of Primary Tumors in Male 2,4,6-Trichlorophenol in the Diet (a)
Mice
Matched Control
Low Dose
High Dose
2/20 (10) 3/49 (6) 1/49 (2)
N.S. N.S. N.S.
0.612 0.078 6.996
0.204 0.004 3.754
105 105 105
1/20 (5) 5/49 (10) 4/49 (8)
N.S. N.S. N.S.
2.041 0.254 94.440
1.633 0.179 78.704
105 102 91

Table Fl. Analyses of the Incidence of Primary Tumors in Male Mice Administered 2,4,6-Trichloropheno1 in the Diet (a)
(continued)
Topography: Morphology
All Sites: Hemangiosarcoma or Hemangioma (b)
P Values (c,d)
Relative Risk (f) Lower Limit Upper Limit
Weeks to First Observed Tumor
Liver: Hepatocellular Carcinoma (b)
P Values (c,d)
Relative Risk (f) Lower Limit Upper Limit
Weeks to First Observed Tumor
Matched Control
2/20 (10)
N.S.
105
1/20 (5)
N.S.
97
Low Dose
5/49 (10)
N.S.
1.020 0.188 10.204
102
10/49 (20)
N.S.
4.082 0.655
172.772
102
High Dose
5/49 (10)
N.S.
1.020 0.188 10.204
91
7/47 (15)
N.S.
2.979 0.429
131.059
105

Table Fl. Analyses of the Incidence of Primary Tumors in Male Mice Administered 2,4,6-Trichlorophenol in the Diet (a)
(continued) Matched Low High
Topography; Morphology Control Dose Dose
Liver: Hepatocellular Carcinoma or Adenoma (b) 4/20 (20) 32/49 (65) 39/47
P Values (c,d) P less than 0.001 P = 0.001 P less
Relative Risk (f) 3.265 4.149 Lower Limit 1.408 1.878 Upper Limit 10.877 12.093
Weeks to First Observed Tumor 97 102 95
(a) Dosed groups received 5,000 or 10,000 ppm.
(b) Number of tumor-bearing animals/number of animals examined at site (percent).
(c) Beneath the incidence of tumors in the control group is the probability level for the Cochran-Armitage test when P is less than 0.05; otherwise, not significant (N.S.) is indicated. Beneath the incidence of tumors in a dosed group is the probability level for the Fisher exact test for the comparison of that dosed group with the matched-control group when P is less than 0.05; otherwise, not significant (N.S.) is indicated.
(d) A negative trend (N) indicates a lower incidence in a dosed group than in a control group.
(e) The probability level for departure from linear trend is given when P is less than 0.05 for any comparison.
(f) The 95% confidence interval of the relative risk between each dosed group and the control group.

Table F2. Analyses of the Incidence of Primary Tumors in Female Mice Administered 2,4,6-Trichlorophenol in the Diet (a)
Topography: MorphologyMatched
Control Low Dose
High Dose
Lung: Alveolar /Bronchiolar Carcinoma or Adenoma (b) 1/20 (5) 4/50 (8) 3/48 (6)
P Values (c,d) N.S. N.S. N.S.
Relative Risk (f) Lower Limit Upper Limit
1.600 0.175 77.169
1.250 0.110 64.251
Weeks to First Observed Tumor 105 105 105
Hematopoietic System:Lymphoma (b)
Malignant 2/20 (10) 12/50 (24) 7/48 (15)
P Values (c,d) N.S. N.S. N.S.
Relative Risk (f) Lower Limit Upper Limit
2.400 0.614 20.902
1.458 0.316 13.664
Weeks to First Observed Tumor 91 82 35

Table F2. Analyses of the Incidence of Primary Tumors in Female Mice Administered 2,4,6-Trichlorophenol in the Diet (a)
(continued)
Matched Low High Topography: Morphology Control Dose Dose
All Sites: Hemangios arcoma or Hemangioma (b) 1/20 (5) 4/50 (8) 5/50 (10)
P Values (c,d) N.S. N.S. N.S.
Relative Risk (f) 1.600 2.000 Lower Limit 0.175 0.249 Upper Limit 77.169 92.596
Weeks to First Observed Tumor 105 86 105
Liver: Hepatocellular Carcinoma or Adenoma (b) 1/20 (5) 12/50 (24) 24/48 (50)
P Values (c,d) P less than 0.001 N.S. P less than 0.001
Relative Risk (f) 4.800 10.000 Lower Limit 0.803 1.872 Upper Liit 200.025 394.581
Weeks to First Observed Tumor 105 105 105

Table F2. Analyses of the Incidence of Primary Tumors in Female Mice Administered 2,4,6-Trichlorophenol in the Diet (a)
(continued)
Topography: Morphology Matched Control
Low Dose
High Dose
Liver: Hepatocellular Carcinoma or Adenoma (b) 1/20 (5) 12/50 (24) 24/48 (50)
P Values (c,d) P less than 0.001 N.S. P less than 0.001
Relative Risk (f) Lower Limit Upper Li it
4.800 0.803
200.025
10.000 1.872
394.581
Weeks to First Observed Tumor 105 105 105
(a) Dosed groups received time-weighted average doses of 5,214 or 10,428 ppm.
(b) Number of tumor-bearing animals/number of animals examined at site (percent).
(c) Beneath the incidence of tumors in the control group is the probability level for the Cochran-Armitage test when P is less than 0.05; otherwise, not significant (N.S.) is indicated. Beneath the incidence of tumors in a dosed group is the probability level for the Fisher exact test for the comparison of that dosed group with the matched-control group when P is less than 0.05; otherwise, not significant (N.S.) is indicated.
(d) A negative trend (N) indicates a lower incidence in a dosed group than in a control group.
(e) The probability level for departure from linear trend is given when P is less than 0.05 for any comparison.
(f) The 95% confidence interval of the relative risk between each dosed group and the control group.

114

Review of the Bioassay of 2,4,6-Trichlorophenol* for Carcinogenicity by the Data Evaluation/Risk Assessment Subgroup
of the Clearinghouse on Environmental Carcinogens
December 13, 1978
The Clearinghouse on Environmental Carcinogens was established in May, 1976, in compliance with DHEW Committee Regulations and the Provisions of the Federal Advisory Committee Act. The purpose of the Clearinghouse is to advise the Director of the National Cancer Institute on the Institute's bioassay program to identify and evaluate chemical carcinogens in the environment to which humans may be exposed. The members of the Clearinghouse have been drawn from academia, industry, organized labor, public interest groups, and State health officials. Members have been selected on the basis of their experience in carcinogenesis or related fields and, collectively, provide expertise in chemistry, biochemistry, biostatistics, toxicology, pathology, and epidemiology. Representatives of various Governmental agencies participate as ad hoc members. The Data Evaluation/Risk Assessment Subgroup of the Clearinghouse is charged with the responsibility of providing a peer review of reports prepared on NCI-sponsored bioassays of chemicals studied for carcinogenicity. It is in this context that the below critique is given on the bioassay of 2,4,6-Trichlorophenol.
The reviewer for the report on the bioassay of 2,4,6-Trichlorophenol agreed with the conclusion that the compound was carcinogenic in both rats and mice. After a brief description of the experimental design, he said that animal survival was adequate. He moved that the report on the bioassay of 2,4,6-Trichlorophenol be accepted as written. The motion was seconded and approved without objection.
Clearinghouse Members Present;
Arnold L. Brown (Chairman), University of Wisconsin Medical School Joseph Highland, Environmental Defense Fund William Lijinsky, Frederick Cancer Research Center Henry Pitot, University of Wisconsin Medical Center Verne A. Ray, Pfizer Medical Research Laboratory Verald K. Rowe, Dow Chemical USA Michael Shimkin, University of California at San Diego Louise Strong, University of Texas Health Sciences Center Kenneth Wilcox, Michigan State Health Department
Subsequent to this review, changes may have been made in the bioassay report either as a result of the review or other reasons. Thus, certain comments and criticisms reflected in the review may no longer be appropriate.
115
< T U . S . G O V E R N M E N T P R I N T I N G O F F I C E : 1 9 7 9 - 2 8 1 - 2 1 7 / 3 0 1 6

DHEW Publication No. (NIH) 79-1711