Embed Size (px)
Citation preview

Group 01, Section 073, Bio 122 1
Bio 122 Lab; Section 073; Group 01:
Dawn McDougall
Krupa Patel
Ria Raju*
Bill Tashjian
The Effects of Malonate Inhibiting Succinate Dehydrogenase (SDH) Activity in the Krebs
Cycle

Group 01, Section 073, Bio 122 2
Introduction
The aim of this project was to measure enzyme activity by analyzing succinate
dehydrogenase (SDH) reactions in the experiment. Through cell fractionation, the
mitochondrion from a bovine liver sample was isolated to produce a more detailed analysis
(Bradford, 249). Succinate dehydrogenase (SDH) is an enzyme found within the inner
mitochondrial membrane that, in a normal reaction during the Krebs cycle, oxidizes to fumerate.
This reaction releases an electron, which is deposited into the electron transport chain (ETC) via
FADH2 reduction (Mason et. al., 132).
Methodology was based on the Bradford and SDH assays. The Bradford assay was
implemented to measure protein concentration as well as to create a standard curve. The curve
represented the relationship between Bovine Serum Albumin (BSA) concentration and light
absorbance. Establishing a standard for enzyme activity allowed comparison of enzyme
reactions and observation of inhibitory enzyme reactions while calculating for protein
concentration (Bradford, 248; Thorn, 540). In addition to succinate, reagents were added to the
solutions to maintain integrity of the data and isolate activity for accurate interpretation
(Bradford, 248). Dichlorophenolindophenol (DCPIP) acted as an artificial electron acceptor in
the solutions. DCPIP also colored the solution blue indicating oxidation and a lack of color
when the solution is reduced (Bradford 249). Several samples with reagents and varying
dilutions were measured to distinguish the relationship.
Similar to the Bradford assay, the SDH assay uses a combination of reagents and controls
to illustrate enzyme activity (Thorn, 541). In the SDH Assay the assigned reagent, Malonate,
was included in the experiment. Succinate was added to the solutions to act as the substrate for
SDH and/or malonate to measure the competitive nature of the inhibitor enzyme (Thorn, 541).
The SDH assay demonstrated the correlation between light absorbance with respect to time for
eight samples used with varying dilutions and the assigned reagent. The light absorbency
represented SDH oxidation. As SDH was reduced to FADH2, electrons were accepted by DCPIP
making the solution colorless, and thus the light absorbency decreased (Bradford, 251-252).
Succinate dehydrogenase is a flavoprotein including the prosthetic group FAD. It is the
reductant, combining with succinate (the electron receptor) (Dervartanian and Veeger, 233) to
reduce FADH2. In the cell, SDH activity occurs as part of the Krebs Cycle. Organisms can
generate ATP through cellular respiration. The most basic breakdown is glycolysis which
ultimately generates pyruvate. The Krebs cycle is a series of nine reactions in which an acetyl
group from pyruvate is oxidized (Mason et. al., 129-132). Within the third segment of the
Kreb’s cycle, reaction 7 states succinate is oxidized to fumerate by an enzyme located in the
inner mitochondrial membrane (Mason et. al., 132). In this process, the free energy change is
not great enough to reduce NAD+. Also, in this case, FAD is the electron acceptor and is not
free to diffuse within the mitochondrian. FAD is tightly crossed with the enzyme once again in
the mitochondrian membrane. FAD’s reduced form FADH2 can only lend electrons to the
electron transport chain within the membrane. For FAD to convert to FADH2, oxidation must
occur between the enzyme and the reactant (Mason et. al., 132).
The focus of this experiment was the effect of malonate on the succinate dehydrogenase
complex. The reagent malonate is a competitive inhibitor enzyme that competes directly with

Group 01, Section 073, Bio 122 3
succinate dehydrogenase in the Krebs cycle. Inhibitor enzymes have similarly designed
structures to compete with the original enzyme by combining with the desired substrate (Krantz,
1327). This competitive inhibitor is one that is reversible depending on its mode of action.
Reversible inhibitors are those that can be removed from an enzyme thus allowing the enzyme to
regain its activity. The inhibitor, in this case malonate, only attempts to copy one substrate—
whereas irreversible inhibitors cannot be removed from the enzyme to restore activity. When
these inhibitors tightly bind to the substrate, activity is not restored between the enzyme and the
solution when separated (Krantz, 1327). Malonate fits in with the reversible inhibitors that are
called transition state analogs. These inhibitors are structurally similar to the transition state to
their enzyme catalyzed reactions. These inhibitors are potent with values of the inhibitor
association constants several orders of magnitude higher than the enzyme-substrate association
constant (Krantz, 1327- 1329).
Malonate is characterized by an activated methylene group making it an electron donor.
Therefore, the enzyme malonate would affect light absorbency in the experiment; comparatively
malonate is not as competitive as other enzyme inhibitors (Dervartanian and Veeger, 238-239).
When an enzyme is categorized as a competitive enzyme, the degree to which the inhibitor is
effective must be quantified to determine potency (Thorn, 540). Malonate, like succinate
dehydrogenase is also a dicarboxylate that binds to cationic amino acid residues in the active site
of the succinate dehydrogenase complex (Hajjawi, 135-137). Malonate will not oxidize because
it lacks the CH2 – CH2 group necessary for dehydration. The missing group is necessary for
enzyme activity to take place within this reaction because this is postulated as the state of highest
energy activated complex through which reactants (substrates) must pass on their way to
becoming products (Hajjawi, 137). Malonate inhibits fumerate production within the Krebs
cycle when the enzyme outcompetes SDH.
Thus, we hypothesize that the reagent malonate will act successfully as a competitive
enzyme inhibitor, decreasing succinate dehydrogenase (SDH) activity by not allowing the
reaction of converting FAD to FADH2,within the Krebs cycle, to occur.

Group 01, Section 073, Bio 122 4
Results
Bradford Assay:
Concentration(mg/mL) Absorbance(Au) @ 595 nm
0 0
0.050 0.056
0.100 0.124
0.200 0.152
0.400 0.558
1 1.158
Dilution Factor Sample Absorbance(Au) Sample Concetration
(mg/mL)
20 Mitochondria 0.217 3.433
50 Crude 0.304 11.964
Week 3 SDH Assay:
y = 1.2863x - 0.0038 R² = 0.9585
-0.5
0
0.5
1
1.5
0 0.2 0.4 0.6 0.8 1 1.2
Ab
sorb
ance
(A
U)
@ 5
95
nm
Concentration (mg/mL)
Bradford Assay to determine Protein Concentration of Various Cellular Fractions
Isolated from Bovine Liver
Table 1.Light wave absorbance by cellular fractions isolated from the bovine liver at specific
concentrations.
Figure 1.BSA standard curve of protein concentration in various cellular fractions isolated
from bovine liver in the Bradford assay.
Table 1.Calculated protein concentration of crude and mitochondrial
fractions taken from the bovine liver.

Group 01, Section 073, Bio 122 5
0 3 6 9 12 15 18 21
Blank 0 -0.100 -0.002 -0.002 -0.002 -0.003 -0.004 -0.006
Succinate
Control
0.752 0.751 0.738 0.732 0.728 0.724 0.721 0.720
Enzyme
Control
0.600 0.481 0.409 0.352 0.315 0.288 0.273 0.261
mito
extract(1)
0.581 0.478 0.400 0.352 0.321 0.291 0.277 0.269
mito
extract (2)
0.772 0.628 0.534 0.467 0.414 0.377 0.350 0.338
crude
extract(1)
0.570 0.447 0.364 0.301 0.251 0.217 0.187 0.172
crude
extract(2)
0.765 0.593 0.480 0.394 0.327 0.217 0.243 0.222
crude
extract(3)
0.539 0.413 0.331 0.273 0.227 0.199 0.176 0.164
-0.2
0
0.2
0.4
0.6
0.8
1
0 3 6 9 12 15 18 21
Ab
s a
t 6
00
nM
(AU
)
Time (min)
Absorbance of mitochondrial and crude fractions from bovine liver
blank
no Succinate
no enzyme
mitochondrial fraction (avg)
crude extract (avg)
Table 3.Protein absorbance readings over a 21 minute span.
Figure 2.Absorbencies of the mitochondrial and crude fractions over 21 minutes. The
absorbance change is a reflection of the reduction of DCPIP.
Table 2.Average mitochondrial fractionation compared to average crude fractionation.

Group 01, Section 073, Bio 122 6
Time (mins) 0 3 6 9 12 15 18 21
Average
mitochondrial
0.675 0.553 0.467 0.409 0.367 0.334 0.313 0.303
sd
mitochondrial
0.136 0.106 0.095 0.081 0.065 0.060 0.051 0.048
Average
crude
0.625 0.484 0.391 0.322 0.268 0.211 0.202 0.186
sd crude 0.122 0.095 0.078 0.063 0.052 0.010 0.035 0.031
SDH Assay
(mito.)
Assay Trial
(crude)
Dividing Au (at 3
minutes) by Au(at 15
minutes)
1.54941 2.29541
Taking the natural log
of the quotient
0.43787 0.83091
Dividing the natural log
of the quotient by the
time span
0.03648 min-1
0.06924 min-1
Dividing the above
quotient by 1 unit of
enzyme activity
.36 Units .69 Units
Dividing Units by total
amount of fraction
added to reaction
3.6 Units/ml 6.9 Units/ml
Dividing the Unit/ml by
the Protein
concentration(mg/ml)
1.0486 Units/mg 0.57674 Units/mg
Specific Activity of mitochondrial fractions were greater than the Specific Activity of the
crude fractions.
Week 4 Assay 1:
0 3 6 9 12 15 18 21
Blank 0 -0.001 0 0.001 0.004 0.003 0.001 0.001
Table 5.Specific Activity of first SDH assay of crude and
mitochondrial fractions taken from bovine liver.
Table 6.Absorbencies of SDH assay including reagent malonate within a 21-minute span.

Group 01, Section 073, Bio 122 7
No
Succinate
0.933 0.904 0.884 0.871 0.861 0.851 0.845 0.837
No
Enzyme
Control
0.795 0.708 0.679 0.661 0.631 0.612 0.601 0.581
mito
extract(1)
1.183 1.008 0.862 0.743 0.645 0.563 0.493 0.440
mito
extract (2)
1.148 0.982 0.840 0.722 0.626 0.541 0.473 0.419
mito
extract
with
reagent(1)
1.080 1.029 0.988 0.954 0.924 0.892 0.862 0.835
mito
extract
with
reagent(2)
1.085 1.037 0.997 0.964 0.935 0.904 0.875 0.849
mito
extract
with
reagent(3)
1.017 0.969 0.928 0.895 0.862 0.831 0.800 0.775
Time
(mins)
0 3 6 9 12 15 18 21
mito
extract
(Average)
1.165 0.995 0.851 0.732 0.635 0.552 0.483 0.429
mito
extract
(SD)
0.024 0.018 0.015 0.014 0.013 0.015 0.014 0.014
-0.2
0
0.2
0.4
0.6
0.8
1
1.2
1.4
0 3 6 9 12 15 18 21
Ab
s 6
00
nM
(A
U)
Time (min)
SDH Assay Data blank
no Succinate
No Enzyme Control
mitochondria (avg)
mitochondria+assigned reagent(avg)
Figure 3.The average mitochondrial absorbencies on SDH Assay with malonate reagent.
Table 7.Average mitochondrial fractionation with and without reagent.

Group 01, Section 073, Bio 122 8
mito
extract
with
reagent
(Average)
1.060 1.011 0.971 0.937 0.907 0.875 0.845 0.819
mito
extract
with
reagent
0.037 0.037 0.037 0.037 0.039 0.039 0.040 0.039
Week 4 Assay 2:
0 3 6 9 12 15 18 21
Blank 0 0.003 0 0.001 0 0 0.001 0
No
Succinate
1.073 1.059 1.048 1.039 1.032 1.024 1.019 1.014
No
Enzyme
Control
1.133 0.925 0.851 0.806 0.785 0.755 0.719 0.702
mito
extract(1)
1.438 1.179 1.047 0.893 0.775 0.756 0.646 0.619
mito
extract(2)
1.353 1.104 0.978 0.830 0.721 0.650 0.606 0.581
mito
extract
with
reagent(1)
1.360 1.290 1.256 1.205 1.160 1.121 1.084 1.049
mito
extract
with
reagent(2)
1.291 1.226 1.192 1.146 1.105 1.068 1.031 0.997
mito
extract
with
reagent(3)
1.256 1.183 1.143 1.094 1.050 1 0.968 0.933
Table 8.Second SDH Assay data with assigned reagent (malonate).

Group 01, Section 073, Bio 122 9
Time
(mins)
0 3 6 9 12 15 18 21
mito
extract
(Average)
1.395 1.141 1.012 0.861 0.748 0.703 0.626 0.600
mito
extract
(SD)
0.060 0.053 0.048 0.044 0.038 0.074 0.028 0.026
mito
extract
with
reagent
(Average)
1.302 1.233 1.197 1.148 1.105 1.063 1.02 0.993
mito
extract
with
reagent
0.052 0.053 0.056 0.055 0.055 0.060 0.058 0.058
0
0.2
0.4
0.6
0.8
1
1.2
1.4
1.6
0 3 6 9 12 15 18 21
Ab
s 6
00
nM
(A
U)
Time (min)
Sdh Assay Data
blank
no Succinate
No Enzyme Control
mitochondria (avg)
mitochondria+assigned reagent(avg)
Figure 4.Average mitochondrial absorbance from second SDH Assay with assigned reagent
(malonate).
Table 9.Average mitochondrial fractionation with and without reagent.

Group 01, Section 073, Bio 122 10
Table 3.Comparison between SDH Assays with and without reagent malonate.
SDH Assay 1
(without reagent)
SDH Assay 1
(with reagent)
SDH Assay 2
(without reagent)
SDH Assay 2
(with reagent)
Dividing Au (at 3
minutes) by Au(at 15
minutes)
1.80253 1.15520 1.62376 1.15992
Taking the natural log
of the quotient
0.58919 0.14433 0.48474 .14836
Dividing the natural log
of the quotient by the
time span
0.04909 min-1
0.01203 min-1
.04039 min-1
0.01236 min-1
Dividing the above
quotient by 1 unit of
enzyme activity
.49 Units .12 Units .403 Units 0.12 Units
Dividing Units by total
amount of fraction
added to reaction
4.9 Units/ml 1.2 Units/ml 4.03 Units/ml 1.2 Units/ml
Dividing the Unit/ml by
the Protein
concentration(mg/ml)
1.43 Units/mg 0.34957 Units/mg 1.17673 Units/mg 0.36013 Unit/mg
The reagent slowed down the enzymatic activity of the SDH.
Group 01, Section 073, Bio 122 11
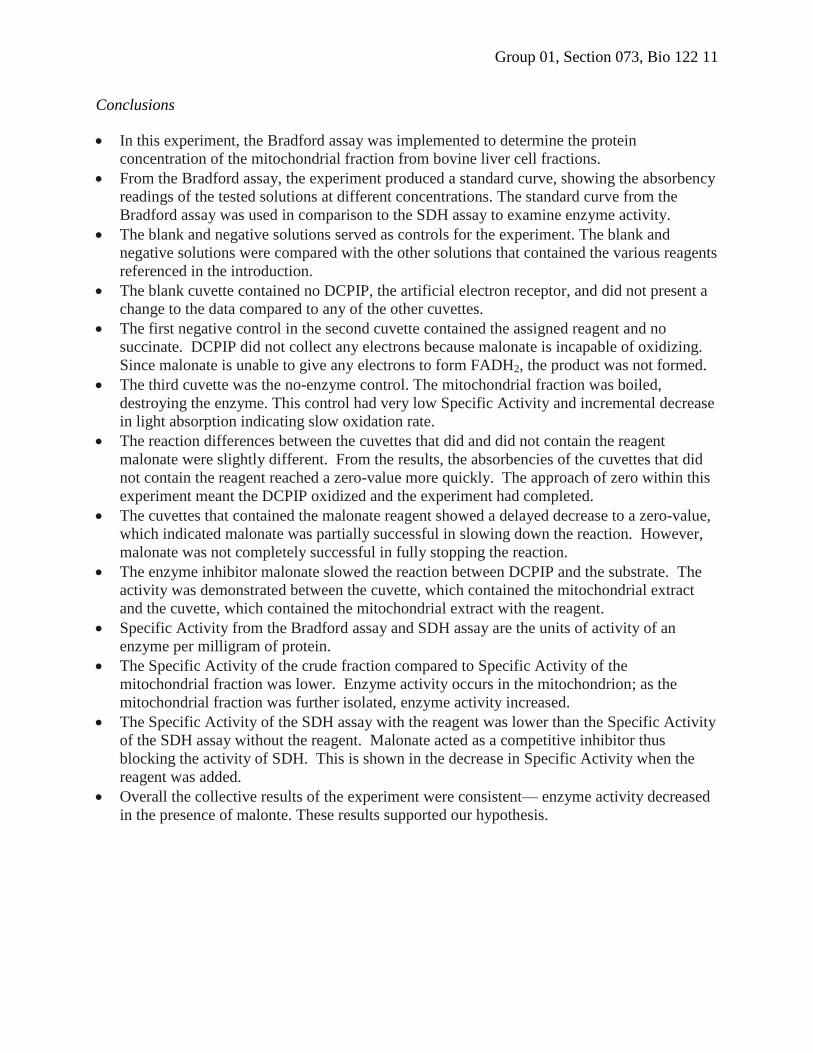
Conclusions
In this experiment, the Bradford assay was implemented to determine the protein
concentration of the mitochondrial fraction from bovine liver cell fractions.
From the Bradford assay, the experiment produced a standard curve, showing the absorbency
readings of the tested solutions at different concentrations. The standard curve from the
Bradford assay was used in comparison to the SDH assay to examine enzyme activity.
The blank and negative solutions served as controls for the experiment. The blank and
negative solutions were compared with the other solutions that contained the various reagents
referenced in the introduction.
The blank cuvette contained no DCPIP, the artificial electron receptor, and did not present a
change to the data compared to any of the other cuvettes.
The first negative control in the second cuvette contained the assigned reagent and no
succinate. DCPIP did not collect any electrons because malonate is incapable of oxidizing.
Since malonate is unable to give any electrons to form FADH2, the product was not formed.
The third cuvette was the no-enzyme control. The mitochondrial fraction was boiled,
destroying the enzyme. This control had very low Specific Activity and incremental decrease
in light absorption indicating slow oxidation rate.
The reaction differences between the cuvettes that did and did not contain the reagent
malonate were slightly different. From the results, the absorbencies of the cuvettes that did
not contain the reagent reached a zero-value more quickly. The approach of zero within this
experiment meant the DCPIP oxidized and the experiment had completed.
The cuvettes that contained the malonate reagent showed a delayed decrease to a zero-value,
which indicated malonate was partially successful in slowing down the reaction. However,
malonate was not completely successful in fully stopping the reaction.
The enzyme inhibitor malonate slowed the reaction between DCPIP and the substrate. The
activity was demonstrated between the cuvette, which contained the mitochondrial extract
and the cuvette, which contained the mitochondrial extract with the reagent.
Specific Activity from the Bradford assay and SDH assay are the units of activity of an
enzyme per milligram of protein.
The Specific Activity of the crude fraction compared to Specific Activity of the
mitochondrial fraction was lower. Enzyme activity occurs in the mitochondrion; as the
mitochondrial fraction was further isolated, enzyme activity increased.
The Specific Activity of the SDH assay with the reagent was lower than the Specific Activity
of the SDH assay without the reagent. Malonate acted as a competitive inhibitor thus
blocking the activity of SDH. This is shown in the decrease in Specific Activity when the
reagent was added.
Overall the collective results of the experiment were consistent— enzyme activity decreased
in the presence of malonte. These results supported our hypothesis.

Group 01, Section 073, Bio 122 12
References
Bradford, Marion M., A Rapid and Sensitive Method for the Quantitation of Microgram
Quantities of Protein Utilizing the Principles of Protein-Dye Binding, Analytical Biochemistry,
Issue 72, 1976 January: 248-254.
Dervartanian, D.V. , Veeger, C., Studies on Succinate Dehydrogenase: I. Spectral Properties of
the Purified Enzyme and Formation of Enzyme-Competitive Inhibitor Complexes, Biochimica et
Biophysica Acta (BBA) - Specialized Section on Enzymological Subjects, Volume 92, Issue 2,
22 November 1964, Pages 233-247.
(http://www.sciencedirect.com/science/article/pii/0926656964901828)
Hajjawi, Omar S., Succinate Dehydrogenase: Assembly, Regulation, and Role in Human
Disease, European Journal of Scientific Research, Vol. 51, No. 1, 2011, Pages 133-142.
(http://www.eurojournals.com/EJSR_51_1_15.pdf)
Krantz, Allen, A Classification of Enzyme Inhibitors, Bioorganic and Medicinal Chemistry
Letters, Volume 2, Issue 11, November 1992, Pages 1327-1334.
(http://www.sciencedirect.com/science/article/pii/S0960894X00805077)
Mason, Kenneth A., Losos, Jonathan B., Singer, Susan R., Raven, Peter H., Johnson, George B,
(2011) Biology. New York: McGraw-Hill.
Thorn, M.B., Inhibition by Malonate of Succinic Dehydrogenase in Heart-Muscle Preparations,
Biochem J. 1953 July; 54(4): 540–547.
(http://www.ncbi.nlm.nih.gov/pmc/articles/pmc1269092/)


![Bio stress [Skrivebeskyttet] - Arbejdsmiljørådgivernebamr.dk/media/1388/122-bio-stress.pdf · 2016. 11. 17. · Title: Microsoft PowerPoint - Bio stress [Skrivebeskyttet] Author:](https://img.dokumen.tips/doc/110x75/60f6b6322cbf0d5ccb525683/bio-stress-skrivebeskyttet-arbejdsmiljr-2016-11-17-title-microsoft.jpg)