Embed Size (px)
Citation preview

Bimonthly Meeting on March 13, 2009
Amarjeet Bhullar
MRS on Exam 5181

NLB_24Feb_2009, Exam 5181, S40.5
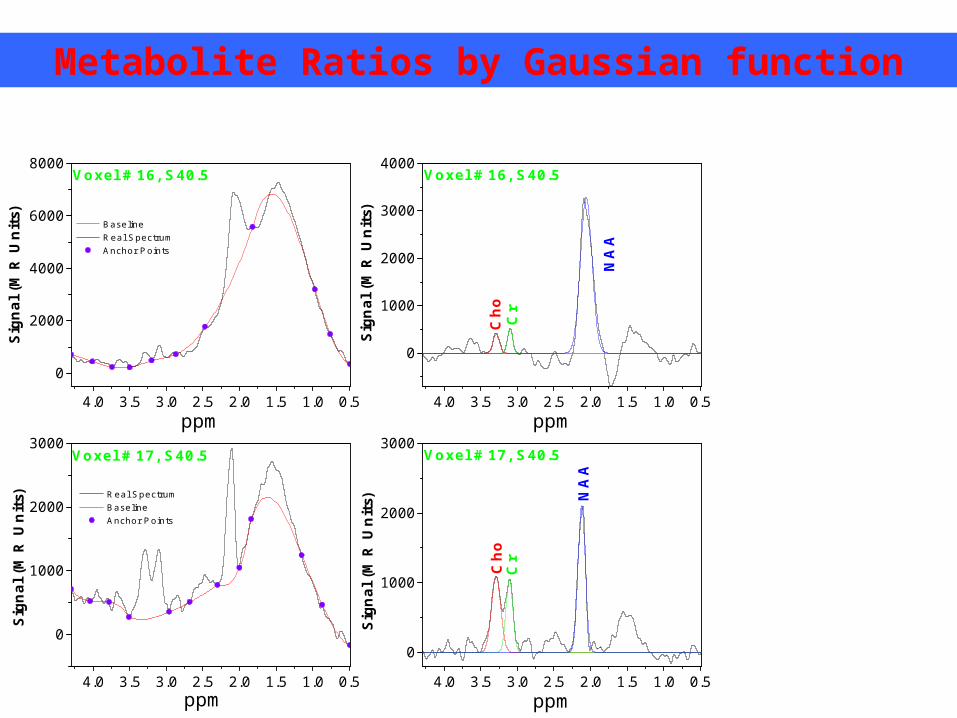
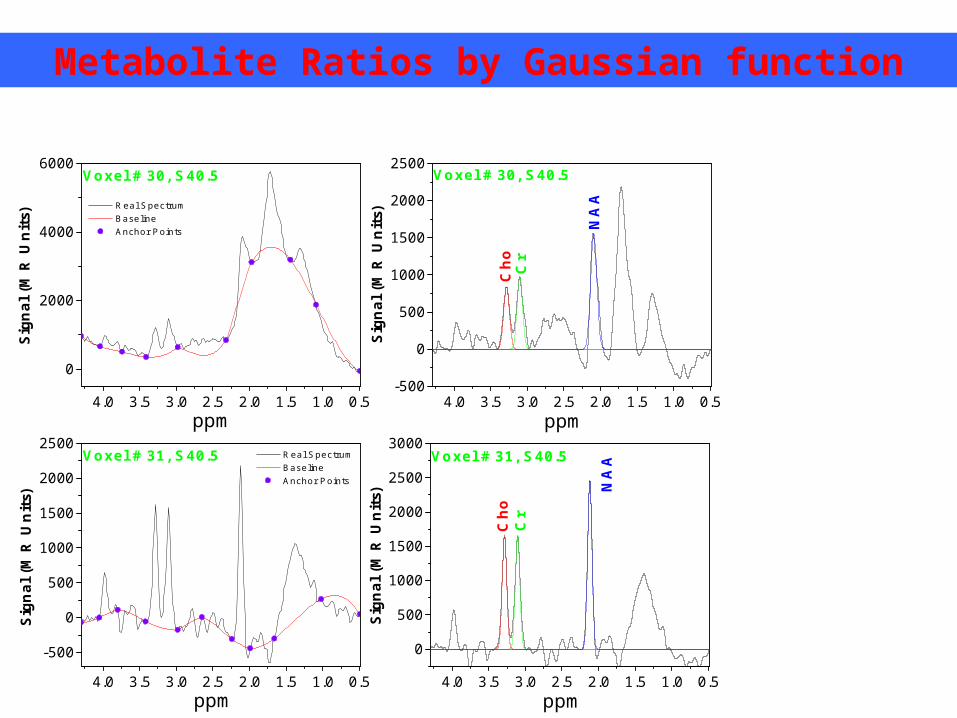
Metabolite Ratios by Gaussian function
4.0 3.5 3.0 2.5 2.0 1.5 1.0 0.5
0
2000
4000
6000
8000
Baseline Real Spectrum Anchor Points
Sig
nal
(M
R U
nit
s)
ppm
Voxel # 16, S40.5
4.0 3.5 3.0 2.5 2.0 1.5 1.0 0.5
0
1000
2000
3000
Real Spectrum Baseline Anchor Points
ppm
Sig
nal
(M
R U
nit
s)
Voxel # 17, S40.5
4.0 3.5 3.0 2.5 2.0 1.5 1.0 0.5
0
1000
2000
3000
Sig
nal
(M
R U
nit
s)
Voxel # 17, S40.5
Cr
Cho
NA
A
ppm
4.0 3.5 3.0 2.5 2.0 1.5 1.0 0.5
0
1000
2000
3000
4000
ppm
Sig
nal
(M
R U
nit
s)
Cho Cr
NA
A
Voxel # 16, S40.5

Metabolite Ratios by Gaussian function
4.0 3.5 3.0 2.5 2.0 1.5 1.0 0.5
-1500
-1000
-500
0
500
1000
ppm
Sig
nal
(M
R U
nit
s)
Cho
Cr
NA
A
Voxel # 18, S40.5
4.0 3.5 3.0 2.5 2.0 1.5 1.0 0.5
-1000
0
1000
2000
Baseline Real Spectrum Anchor Points
Voxel # 18, S40.5
Sig
nal
(M
R U
nit
s)
ppm
4.0 3.5 3.0 2.5 2.0 1.5 1.0 0.5-400
0
400
800
1200
1600
Sig
nal
(M
R U
nit
s)
Voxel # 19, S40.5
Cho
Cr
NA
A
ppm4.0 3.5 3.0 2.5 2.0 1.5 1.0 0.5
-1000
-500
0
500
1000
1500
Real Spectrum Baseline Anchor Points
Sig
nal
(M
R U
nit
s)
Voxel # 19, S40.5
ppm

Metabolite Ratios by Gaussian function
4.0 3.5 3.0 2.5 2.0 1.5 1.0 0.5
0
500
1000
1500
2000
ppm
Sig
nal
(M
R U
nit
s) Real Spectrum Baseline Anchor Points
Voxel # 20, S40.5
4.0 3.5 3.0 2.5 2.0 1.5 1.0 0.5-200
0
200
400
600
800
1000
Sig
nal
(M
R U
nit
s)
Voxel # 20, S40.5
Cho C
r
NA
A
ppm
4.0 3.5 3.0 2.5 2.0 1.5 1.0 0.5
0
1000
2000
3000
4000
5000
Sig
nal
(M
R U
nit
s)
ppm
Real Spectrum Baseline Anchor Points
Voxel # 23, S40.5
4.0 3.5 3.0 2.5 2.0 1.5 1.0 0.5
0
1000
2000
3000
4000
Sig
nal
(M
R U
nit
s)
Voxel # 23, S40.5
Cho
Cr
NA
A
ppm

Metabolite Ratios by Gaussian function
4.0 3.5 3.0 2.5 2.0 1.5 1.0 0.5
-1000
0
1000
2000
ppm
Sig
nal
(M
R U
nit
s)
Real Spectrum Baseline Anchor Points
Voxel # 24, S40.5
4.0 3.5 3.0 2.5 2.0 1.5 1.0 0.5
0
1000
2000
3000
Sig
nal
(M
R U
nit
s)
Voxel # 24, S40.5
NA
A
ppm
Cho
Cr
4.0 3.5 3.0 2.5 2.0 1.5 1.0 0.5-1000
-500
0
500
1000
1500
2000
Sig
nal
(M
R U
nit
s)
Real Spectrum Baseline Anchor Points
Voxel # 25, S40.5
ppm4.0 3.5 3.0 2.5 2.0 1.5 1.0 0.5
0
1000
2000
3000
Sig
nal
(M
R U
nit
s)
Voxel # 25, S40.5
Cho
Cr
NA
A
ppm

Metabolite Ratios by Gaussian function
4.0 3.5 3.0 2.5 2.0 1.5 1.0 0.5
0
1000
2000
3000
Sig
nal
(M
R U
nit
s)
ppm
Real Spectrum Baseline Anchor Points
Voxel # 26, S40.5
4.0 3.5 3.0 2.5 2.0 1.5 1.0 0.5
0
1000
2000
3000
Sig
nal
(M
R U
nit
s)
Voxel # 26, S40.5
Cho
Cr
NA
A
ppm
4.0 3.5 3.0 2.5 2.0 1.5 1.0 0.5-500
0
500
1000
1500
2000
Sig
nal
(M
R U
nit
s) Real Spectrum Baseline Anchor Points
Voxel # 27, S40.5
ppm4.0 3.5 3.0 2.5 2.0 1.5 1.0 0.5
-500
0
500
1000
1500
2000
Sig
nal
(M
R U
nit
s)
Voxel # 27, S40.5
Cho Cr
NA
A
ppm
Metabolite Ratios by Gaussian function
4.0 3.5 3.0 2.5 2.0 1.5 1.0 0.5
0
2000
4000
6000
ppm
Sig
nal
(M
R U
nit
s)
Real Spectrum Baseline Anchor Points
Voxel # 30, S40.5
4.0 3.5 3.0 2.5 2.0 1.5 1.0 0.5-500
0
500
1000
1500
2000
2500
Sig
nal
(M
R U
nit
s)
Voxel # 30, S40.5
Cho Cr
NA
A
ppm
4.0 3.5 3.0 2.5 2.0 1.5 1.0 0.5
-500
0
500
1000
1500
2000
2500
Sig
nal
(M
R U
nit
s)
Real Spectrum Baseline Anchor Points
Voxel # 31, S40.5
ppm4.0 3.5 3.0 2.5 2.0 1.5 1.0 0.5
0
500
1000
1500
2000
2500
3000
Sig
nal
(M
R U
nit
s)
Voxel # 31, S40.5
ppm
Cho
Cr
NA
A

Metabolite Ratios by Gaussian function
4.0 3.5 3.0 2.5 2.0 1.5 1.0 0.5
0
1000
2000
3000
Sig
nal
(M
R U
nit
s)
Real Spectrum Baseline Anchor Points
Voxel # 32, S40.5
ppm4.0 3.5 3.0 2.5 2.0 1.5 1.0 0.5
0
1000
2000
3000
4000
Sig
nal
(M
R U
nit
s)
Voxel # 32, S40.5
ppm
Cho
Cr
NA
A
4.0 3.5 3.0 2.5 2.0 1.5 1.0 0.5
0
1000
2000
3000
4000
Sig
nal
(M
R U
nit
s)
Voxel # 33, S40.5 Real Spectrum Baseline Anchor Points
ppm4.0 3.5 3.0 2.5 2.0 1.5 1.0 0.5
0
1000
2000
3000
4000
Sig
nal
(M
R U
nit
s)
Voxel # 33, S40.5
Cho
Cr
NA
A
ppm

Metabolite Ratios by Gaussian function
4.0 3.5 3.0 2.5 2.0 1.5 1.0 0.5
0
500
1000
1500
2000
Sig
nal
(M
R U
nit
s)
Voxel # 34, S40.5 Real Spectrum Baseline Anchor Points
ppm4.0 3.5 3.0 2.5 2.0 1.5 1.0 0.5
0
500
1000
1500
2000
Sig
nal
(M
R U
nit
s)
Voxel # 34, S40.5
Cho
Cr
NA
A
ppm
4.0 3.5 3.0 2.5 2.0 1.5 1.0 0.5
0
4000
8000
12000
Sig
nal
(M
R U
nit
s)
Voxel # 37, S40.5
Real Spectrum Baseline Anchor Points
ppm4.0 3.5 3.0 2.5 2.0 1.5 1.0 0.5
0
2000
4000
6000
8000
Sig
nal
(M
R U
nit
s)
Voxel # 37, S40.5
Cho
Cr N
AA
ppm

Metabolite Ratios by Gaussian function
4.0 3.5 3.0 2.5 2.0 1.5 1.0 0.5
0
1000
2000
3000
Sig
nal
(M
R U
nit
s)
Voxel # 38, S40.5
Real Spectrum Baseline Anchor Points
ppm4.0 3.5 3.0 2.5 2.0 1.5 1.0 0.5
-500
0
500
1000
1500
2000
2500
ppm
Sig
nal
(M
R U
nit
s)
Voxel # 38, S40.5
Cho Cr
NA
A
4.0 3.5 3.0 2.5 2.0 1.5 1.0 0.5-2000
-1000
0
1000
2000
3000
Sig
nal
(M
R U
nit
s)
Voxel # 39, S40.5
Real Spectrum Baseline Anchor Points
ppm4.0 3.5 3.0 2.5 2.0 1.5 1.0 0.5
-1000
0
1000
2000
3000
Sig
nal
(M
R U
nit
s)
Voxel # 39, S40.5
Cho
Cr
NA
A
ppm

Metabolite Ratios by Gaussian function
4.0 3.5 3.0 2.5 2.0 1.5 1.0 0.5
0
1000
2000
3000
Sig
nal
(M
R U
nit
s)
Voxel # 40, S40.5
ppm
Real Spectrum Baseline Anchor Points
4.0 3.5 3.0 2.5 2.0 1.5 1.0 0.5
0
500
1000
1500
2000
2500
Sig
nal
(M
R U
nit
s)
Voxel # 40, S40.5
Cho Cr
NA
A
ppm
4.0 3.5 3.0 2.5 2.0 1.5 1.0 0.5
0
1000
2000
3000
4000
Sig
nal
(M
R U
nit
s)
Voxel # 41, S40.5
Real Spectrum Baseline Anchor Points
ppm4.0 3.5 3.0 2.5 2.0 1.5 1.0 0.5
0
500
1000
1500
2000
Sig
nal
(M
R U
nit
s)
Voxel # 41, S40.5
Cho C
r
NA
A
ppm

Conclusion
15 20 25 30 35 40 450
100
200
300
400
500 Cho Cr NAA
Met
abol
ite
Con
.
Voxel Index10 20 30 400
5
10
Met
abol
ite
Rat
ios NAA/Cr
Cho/NAA Cho/Cr
Voxel Index
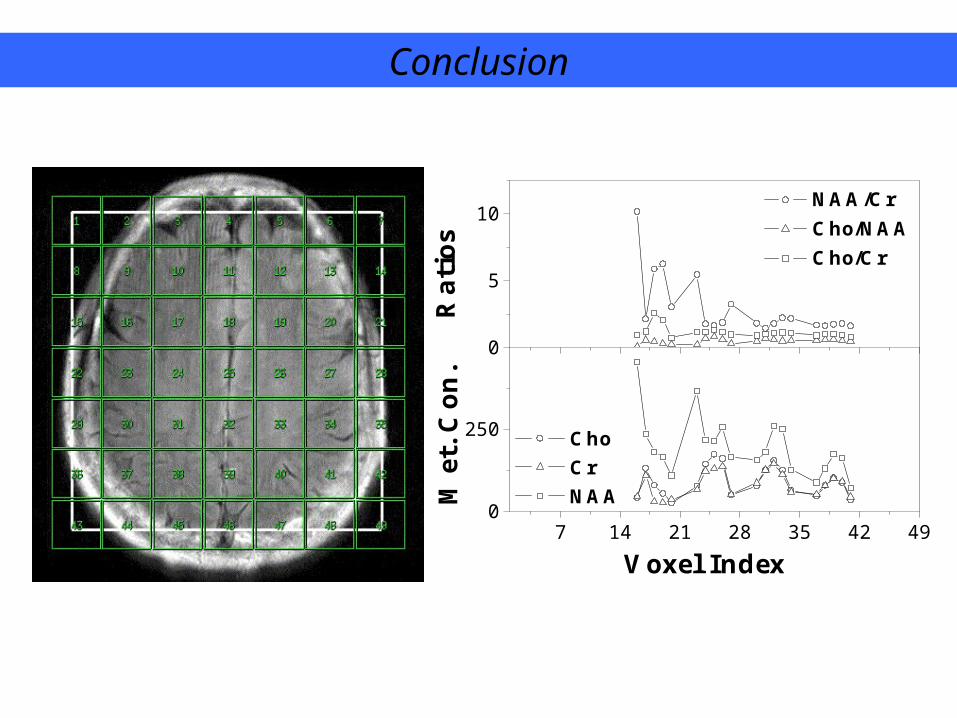
Conclusion
7 14 21 28 35 42 490
250M
et. C
on.
Rat
ios
NAA/Cr Cho/NAA Cho/Cr
Cho Cr NAA
Voxel Index
0
5
10

Descriptive Statistics on Exam 5181
Exam5181 N total Mean Standard Deviation Sum Minimum Median Maximum
Cho 20 92.19968 45.06231 1843.994 26.3443 79.92885 173.846
Cr 20 82.67384 38.67509 1653.477 26.6278 83.4441 144.951
NAA 20 198.7451 91.28516 3974.902 71.7208 177.362 455.092
NAA/Cr 20 2.97148 2.2592 59.42959 1.43855 1.84054 10.17202
Cho/NAA 20 0.49232 0.17744 9.84641 0.09125 0.52672 0.80998
Cho/Cr 20 1.16189 0.43303 23.23784 0.73672 1.04297 2.59402

# on Exam 5181
Cho Cr NAA NAA/Cr Cho/NAA Cho/Cr
16 41.5259 44.7396 455.092 10.17202 0.091247 0.928169
17 131.125 109.804 235.514 2.144858 0.556761 1.194173
18 80.1995 30.9171 181.974 5.885869 0.44072 2.594018
19 55.2244 26.6278 166.746 6.262102 0.331189 2.073938
20 26.3443 35.7591 109.101 3.051 0.241467 0.736716
23 77.6021 67.0489 366.051 5.459463 0.211998 1.157396
24 143.823 122.52 217.628 1.776265 0.660866 1.173874
25 173.846 130.519 214.63 1.644435 0.80998 1.331959
26 161.217 137.851 258.233 1.873276 0.624308 1.169502
27 50.1289 51.1685 166.198 3.248053 0.301622 0.979683
30 78.0842 86.7197 156.773 1.807813 0.498072 0.900421
31 125.804 125.804 180.975 1.438547 0.695146 1
32 154.535 144.951 260.726 1.798718 0.59271 1.066119
33 125.872 112.627 250.988 2.228489 0.501506 1.117601
34 64.806 58.4722 126.897 2.170211 0.510698 1.108322
37 47.9615 52.2592 87.939 1.682747 0.545395 0.917762
38 79.6582 80.1685 130.947 1.633397 0.608324 0.993635
39 102.485 100.493 173.749 1.728966 0.589845 1.019822
40 88.4783 91.1669 163.02 1.788149 0.542745 0.970509
41 35.2733 43.8603 71.7208 1.63521 0.491814 0.804219


![5|lT4 › consumer › lokdarbar2016 › 2016_SYL_SNR_SNR.pdf73568/03764/5 2015 5181 2015 2015 5181 39248.58 એ\.પj.ચૌિ ી ના]Z ઈિને^ ૯૯૨૫૨૧૩૯](https://img.dokumen.tips/doc/110x75/60d791d319e2287e5817295b/5lt4-a-consumer-a-lokdarbar2016-a-2016sylsnrsnrpdf-73568037645-2015.jpg)