Embed Size (px)
Citation preview

RRRRRRRREEEEEEEEPPPPPPPPUUUUUUUUBBBBBBBBLLLLLLLLIIIIIIIICCCCCCCC OOOOOOOOFFFFFFFF MMMMMMMMAAAAAAAACCCCCCCCEEEEEEEEDDDDDDDDOOOOOOOONNNNNNNNIIIIIIIIAAAAAAAA
MMMMMMMMIIIIIIIINNNNNNNNIIIIIIIISSSSSSSSTTTTTTTTRRRRRRRRYYYYYYYY OOOOOOOOFFFFFFFF FFFFFFFFIIIIIIIINNNNNNNNAAAAAAAANNNNNNNNCCCCCCCCEEEEEEEE MMMMMMMMaaaaaaaaccccccccrrrrrrrrooooooooeeeeeeeeccccccccoooooooonnnnnnnnoooooooommmmmmmmiiiiiiiicccccccc PPPPPPPPoooooooolllllllliiiiiiiiccccccccyyyyyyyy DDDDDDDDeeeeeeeeppppppppaaaaaaaarrrrrrrrttttttttmmmmmmmmeeeeeeeennnnnnnntttttttt
____________________________________________
____________________________________________________________________
____________________________________________________________________________________________
____________________________________________________________________________________________________________________
____________________________________________________________________________________________________________________________________________
BBBBBBBB UUUUUUUU LLLLLLLL LLLLLLLL EEEEEEEE TTTTTTTT IIIIIIII NNNNNNNN SSSSSSSSeeeeeeeepppppppptttttttteeeeeeeemmmmmmmmbbbbbbbbeeeeeeeerrrrrrrr 22222222000000001111111144444444
____________________________________________________________________________________________________________________________________________________
____________________________________________________________________________________________________________________________________
________________________________________________________________________________________________________________
____________________________________________________________________________________________
________________________________________________________________________
Skopje, Skopje, Skopje, Skopje, NovembNovembNovembNovemberererer 2014201420142014

Bulletin-Ministry of Finance of the Republic of Macedonia
2
SUMMARYSUMMARYSUMMARYSUMMARY
OF THE MOST IMPORTANT SHORT-TERM ECONOMIC
TRENDS
September 2014
� Industrial production grew by 9.1% in September 2014
compared to September 2013;
� Inflation amounted to – 0.7% on annual basis, while it
remained unchanged on monthly basis, hence, average
inflation rate in the period January – September 2014
amounted to – 0.2%;
� Export in the period January - September 2014 surged by
16.2%, while import increased by 10.0%, resulting in narrowing
of trade deficit by 1.3% compared to the same period in 2013;
� In the period January - September 2014, both total budget
revenues and total budget expenditures increased by 1.5% and
by 2.7% respectively; state budget deficit amounted to Denar
17,454 million (3.3% of GDP), while central budget deficit
amounted to Denar 15,214 million (2.9% of GDP);
� Increase of both total credits to private sector by 9.4% and
total deposit potential of banks by 8.7% on annual basis.

Bulletin-Ministry of Finance of the Republic of Macedonia
3
Total 9.1 9.8 4.8
Ore and stone extraction 7.7 6.5 -1.7
Processing industry 12.9 7.2 10.7
Electricity, gas and water supply -15.9 49.3 -21.9
Industrial production (%) - September 2014
m/m-12I-IX 2014
I-IX 2013
Source: SSO
m/m-1
-30-25-20-15-10-505
10152025
IX 2013
X XI XII I II III IV V VI VII VIII IX 2014
Industrial production indices; Source: SSO
м/м-12 м/м-1
%%
1. Real 1. Real 1. Real 1. Real SectorSectorSectorSector
Industrial ProductionIndustrial ProductionIndustrial ProductionIndustrial Production
Industrial production experienced high growth of 9.1% in September 2014
compared to September 2013. Analyzed by sectors, production in the
manufacturing industry grew
by 12.9%, while production in
the mining and quarrying
sector surged by 7.7%.
Production in the electricity,
gas, steam and air-
conditioning supply sector
dropped by 15.9%.
As for the manufacturing industry, annual positive growth was registered at 16
out of 23 branches, comprising 63% of the industrial production. As regards the
branches with two-digit share in the structure of industrial production, an
increase was registered at production of clothing by 5% and production of food
products by 4.2% . High growth was generated at the following branches:
production of motor vehicles, trailers and semi-trailers – 1.286%, production of
electrical equipment – 31%, production of rubber products and plastic mass
products – 25.3%, processing of wood, cork and wood products – 25.2%, production
of machines and devices – 23.5%, production of chemicals and chemical products –
19%, production of other transportation equipment – 15.5% and production of
textile – 11.7%.
Production of motor vehicles, trailers and semi-trailers (4.2 p.p.) contributed the
most to the annual change of
industrial production in
September 2014, while
production of other non-metal
mineral products had the
highest negative contribution
(-0.4 p.p.).
Industrial production surged
by 9.8% in September 2014
compared to August 2014.
Sector analysis points out that
increase was seen in all sectors, as follows: electricity, gas, steam and air-
conditioning supply by 49.3%, manufacturing industry by 7.2% and mining and
quarrying by 6.5%.
On cumulative basis, in the period January-September 2014, industrial production
grew by 4.8%, compared to the same period in 2013. Growth was also registered in
the manufacturing industry sector – 10.7%, while electricity, gas, steam and air-
conditioning supply sector and mining and quarrying sector experienced a decline
of 21.9% and 1.7% respectively.

Bulletin-Ministry of Finance of the Republic of Macedonia
4
40
45
50
55
60
65
70
75
I 2011
IV VII X I 2012
IV VII X I 2013
IV VII X I 2014
IV VII
Average utilization of the capacities of business entities (in %); Source: SSO
Data on industrial production by target groups in September 2014, compared to
September 2013, show that there was increase in the production at the following
groups: capital goods – 64.5%, consumer non-durables – 8.3% and intermediary
goods, except energy – 6.9%, while decline was observed at the following groups:
energy – 11.1% and consumer durables – 8%.
On monthly basis, data on the industrial production by target groups in
September 2014 showed an increase at the following groups: energy – 37.9%,
consumer durables – 33.4%, consumer non-durables – 10.0%, capital goods – 6.5%
and intermediary goods, except energy – 1.9%.
On cumulative basis, in the period January–September 2014, compared to the
same period in 2013, growth was registered at the following groups: capital goods
– 45.4%, intermediary goods, except energy – 7.5% and consumer non-durables –
4.7%. Decline was observed at the following groups: energy – 17.5% and consumer
durables – 1.9%.
Business Tendencies in the ManufacturinBusiness Tendencies in the ManufacturinBusiness Tendencies in the ManufacturinBusiness Tendencies in the Manufacturing Industryg Industryg Industryg Industry
According to the assessments, current economic trends of business entities in
September 2014 were less favourable compared to both the previous month and
September 2013.
Assessment of delivery-to-
production was more
favourable compared to both
the previous month and
September 2013. Assessment
of the production volume in
the past three months was
more favourable compared to
August 2014, while it was less
favourable compared to
September 2013. In September 2014, expectations for the production volume in the
next three months were less favourable compared to the previous month, while
compared to September 2013, they were more favourable.
As regards the number of employees, expectations in September 2014 for the next
three months were less favourable compared to both the previous month and
September 2013.
Average utilization of the capacities in September 2014 accounted for 61.3%, being
a decrease compared to the previous month, when it accounted for 61.8%.
Compared to September 2013, utilization of the capacities was lower by 0.4 p.p..
In September 2014, stocks of raw materials and intermediate goods, as well as on-
going procurement of raw materials and intermediate goods, were below and
around the average. Assessment of the current stocks of ready-made products was
less favourable compared to both the previous month and September 2013. In the
next 3-month period, according to the assessment of managers, average purchase

Bulletin-Ministry of Finance of the Republic of Macedonia
5
500000
5500000
10500000
15500000
20500000
100
120
140
160
180
200
220
240
260
280
300
IX 2013
X XI XII I II III IV V VI VII VIII IX 2014
Number of issued building permits and expected value of work;Source: SSO
Number of issued building permits (LHS)
Expected value of works (RHS)
prices of inputs and selling prices of ready-made products are expected to
decrease.
According to the assessment, following factors limited the most the production
volume in September 2014: insufficient foreign demand – 22.7%, insufficient
domestic demand – 18.0%, shortage of skilled labour – 15,9%, uncertainty of the
economic environment – 10.6% and financial problems – 8.9%.
Less business entities indicated the following as a limiting factor in September
2014, compared to August 2014: insufficient foreign demand, competitive import,
unclear economic laws and lack of equipment, while more of the business entities
indicated the following: insufficient domestic demand, shortage of skilled labour,
uncertainty of the economic environment, financial problems, shortage of raw
materials and shortage of energy. As regards other factors, there were no
significant changes.
Number of Industrial WorkersNumber of Industrial WorkersNumber of Industrial WorkersNumber of Industrial Workers
Number of workers in the industry in September 2014, compared to September
2013, grew by 10.4%. Sector analysis points out to an increase in the number of
workers in the manufacturing industry sector by 12.5%, while the number of
workers in the mining and quarrying sector, as well as the electricity, gas, steam
and air-conditioning supply sector, decreased by 2.8% and 1.3% respectively.
Data on the number of workers in the industry by target groups in September
2014, compared to September 2013, showed an increase in the number of workers
at the following groups: capital goods – 111%, intermediary goods, except energy –
8.2%, consumer durables – 7.3% and consumer non-durables – 4.1%, while number of
workers in the energy group dropped by 4.6%.
Index on the number of workers in the industry in the period January – September
2014, compared to the period January - September 2013, accounted for 7.7%.
Number of Issued Building Permits and Envisaged Value oNumber of Issued Building Permits and Envisaged Value oNumber of Issued Building Permits and Envisaged Value oNumber of Issued Building Permits and Envisaged Value of Facilitiesf Facilitiesf Facilitiesf Facilities
In September 2014, 264 building permits were issued, being a two-fold increase
compared to the same month
last year. Total number of
issued building permits,
compared to August 2014,
when 155 permits were issued,
increased by 70.3%.
Envisaged value of the
facilities, according to the
issued building permits in
September, amounted to
Denar 3,939,191 million, being
by 22% less compared to September 2013. In relation to August 2014, value of the
facilities grew by 4.4 times.

Bulletin-Ministry of Finance of the Republic of Macedonia
6
Vardar
4%
East
11%
South - West
8%
South - East
7%
Pelagonija
8%
Polog
17%
North - East
7%
Skopje
39%
Number of building permits issued by regions, September 2014; Source: SSO
Analyzed by types of facilities, out of the total number of issued building permits,
176 (or 66.7%) were intended for buildings, 29 (or 11%) for civil engineering
structures and 59 (or 22.3%) for
reconstruction facilities.
Analyzed by types of
investors, out of total 264
issued building permits,
natural persons were
investors in 198 facilities (or
75%), while business entities
were investors in 66 facilities
(or 25%).
In September 2014,
construction of 448 flats was envisaged, with total usable area of 38,500 m2.
Number of envisaged flats for construction dropped by 10.8% compared to the
same month in 2013, increasing by 171.5% compared to August 2014.
Analyzed by regions, in September 2014, most permits were issued in the Skopje
region, 102 in total, 74 permits out of which were issued to natural persons as
investors, while 28 permits were issued to business entities as investors. Vardar
region had least issued permits, 10 permits in total, 7 permits out of which were
issued to natural persons as investors, while 3 permits were issued to business
entities as investors.
Analyzed on cumulative basis, in the period January - September 2014, most
building permits were issued in the Skopje region, 619 in total, 361 permits out of
which were issued to natural persons as investors, while 258 permits were issued
to business entities as investors. Least building permits were issued in the
Northeastern region, 103 permits in total, 68 permits out of which were issued to
natural persons as investors, while 35 permits were issued to business entities as
investors.
InflationInflationInflationInflation
Annual inflation rate in September 2014, measured according to the CPI index,
amounted to -0.7%. Average inflation rate in the period January - September 2014
amounted to -0.2%, as opposed to 3.3% rate registered in the same period last year.
On annual basis, food and non-alcoholic beverages category, accounting for the
most in the CPI index, experienced 1.1% decline, mostly as a result of the 11.9% drop
of prices in the sub-category oils and fats. Price reduction was registered at the
following categories: recreation and culture by 5.7%, transportation by 2.7%,
communications by 2.4%, furniture, household furnishings and maintenance of
household furnishings by 1.9% and restaurants and hotels by 1,6%. The highest
annual increase of prices in September was seen at the alcoholic beverages and
tobacco category by 3.6%. Monthly increase of prices was also registered at the
following categories: health by 2.5%, other goods and services by 1.4%, housing,

Bulletin-Ministry of Finance of the Republic of Macedonia
7
-2
-1
0
1
2
3
IX
2013
X XI XII I II III IV V VI VII VIII IX
2014
%
Consumer prices; Source: SSO
м/м-12 м/м-1
1700
1800
1900
2000
2100
2200
2300
2400
12000
13000
14000
15000
16000
17000
18000
19000
20000
IX 2013
X XI XII I II III IV V VI VII VIII IX 2014
Metal Stock Prices ($); Source: World Bank
Nickel (lhs) Lead Zinc
water, electricity, gas and other fuels by 0.5%, clothing and footwear by 0.4% and
education by 0.2%.
On monthly basis, inflation in
September 2014 remained
unchanged. Prices in the food
and non-alcoholic beverages
category decreased by 0.3% as
a result of the increase of food
prices by the same percentage.
Monthly price increase was
also observed at the following
categories: furniture,
household furnishings and maintenance of household furnishings and
communications by 0.5% each, other goods and services by 0.4%, housing, water,
electricity, gas and other fuels by 0.2% and clothing and footwear by 0.1%. Monthly
price decline was also recorded at the transportation and health categories by 1.5%
and 0.6% respectively. Prices remained the same at the following categories:
alcoholic beverages and tobacco, recreation and culture, education and
restaurants and hotels.
Retail prices in September 2014 were lower by 1.8% compared to September 2013.
Compared to the previous month, retail prices were lower by 0.5%. Average
increase of retail prices in the first nine months of 2014 accounted for -0.6%.
Stock Market PricesStock Market PricesStock Market PricesStock Market Prices
In September 2014, crude oil price (Brent) on the global stock markets declined by
4.5%, compared to the previous month, reaching the price of US$ 97.3 per barrel.
Compared to September 2013, oil price was lower by 12.8%. Price of natural gas in
September surged by 1.9% compared to the previous month.
As regards metal products, nickel, as product with high share in the Macedonian
export, was traded at an average price of US$ 18,035 for a metric ton ($/mt) in
September 2014, being a
monthly price decrease by
3.0%. Compared to September
2013, nickel price surged by
30.7%. As for basic metals, in
September, there was
monthly reduction of price of
lead by 5.3%, tin by 5.1%,
aluminium by 2%, copper by
1.9% and zinc by 1.4%. Price of
iron ore in September
experienced monthly decline
of 11.1%. Price of precious metals in September dropped on monthly basis. Hence,
price of silver dropped by 6.9%, price of platinum and gold declined by 6.0% and 4.5%
respectively.

Bulletin-Ministry of Finance of the Republic of Macedonia
8
-400
-200
0
200
400
600
800
1000
IX 2013
X XI XII I II III IV V VI VII VIII IX 2014
Foreign trade of the Republic of Macedonia (in million EUR); Source: SSO
Export Import
Deficit Total
Iron and steel15.2%
Clothing 14.1%
Chemical materials and
products17.2%
Beverages and tobacco
4.6%
Oil and oil products
1.5%
Metal ore and metal scrap
4.2%
Other 43.2%
Structure of export according to SITC,I-IX 2014 (share in %); Source: SSO
In September 2014, compared to August 2014, price of maize and wheat on global
stock markets dropped by 7.6% and 7.5% respectively. Price of lamb’s meat
registered monthly decline of 2.3% in September.
2. Foreign Trade2. Foreign Trade2. Foreign Trade2. Foreign Trade
Total foreign trade in the first nine months in 2014 amounted to EUR 6,731.0
million, increasing by 12.4%
compared to the same period
in 2013.
Export Export Export Export
In the period January -
September 2014, physical
output of export increased by
3.5% compared to the same
period in 2013, while value of
exported goods amounted to
EUR 2,731.6 million, being an
increase of 16.2% (EUR 381.1 million) in relation to the period January - September
2013.
In September 2014, value of exported goods amounted to EUR 353.7 million,
surging by 31.3% (EUR 84.3 million) compared to September last year. Analyzed on
monthly basis, in September 2014, export increased by 16.6% (EUR 50.3 million)
compared to the previous month.
Seasonally adjusted trend of export in September 2014 increased by 3.3% on
monthly basis, pointing out to positive effects of the seasonal factor (13.3 p.p.) on
the export in September.
Main groups of goods (according to SITC) being most exported in the period
January - September 2014
were the following: chemical
materials and products –
17.2%, iron and steel – 15.2%,
clothing – 14.1%, beverages and
tobacco – 4.6%, metal ore and
metal scrap – 4.2% and oil and
oil products – 1.5%. These six
groups of products comprised
56.8% of the total export of the
country.
In the first nine months of 2014, observed by economic purpose, following
products were most exported: goods for industrial procurement (49.0%), followed
by consumer goods (20.5%), products for investments without transport equipment
(12.4%), food and beverages (9.5%), transport equipment (7.2%) and fuels and
lubricants (1.4%).

Bulletin-Ministry of Finance of the Republic of Macedonia
9
I - IX - 2013 I - IX - 2014 Balance % rate I - IX - 2013 I - IX - 2014 Balance % rate
000 Т 433.3 447.3 14.0 3.2 .000 Т 425.7 401.0 -24.8 -5.8
EUR mil. 434.4 414.2 -20.2 -4.6 EUR mil. 210.5 197.2 -13.3 -6.3
$ mil. 571.3 559.8 -11.4 -2.0 $ mil. 277.2 266.5 -10.8 -3.9
*)Previous data *)Previous data
Export of iron and steel*) Import of iron and steel*)
Analyzed by tariffs, following products were the most exported: catalysts with
precious metals or precious metal compounds as active substance; filtering or
purifying machinery and apparatus for other gases by a catalytic process;
ferronickel; ignition wiring sets and other wiring sets of a kind used in vehicles,
aircraft or ships; tobacco; reaction initiators, reaction accelerators and catalytic
preparations; ferosilicium; boards, plates, stands, tables, cabinets and others;
motor vehicles for transport of ten or more persons, including the driver; men's
shirts of cotton; lead ore and concentrates; etc.
269
393
354
473
0
100
200
300
400
500
600
in m
illio
n E
UR
Foreign trade, September 2013 and 2014; Source: SSO
2012 20122013 2013Export import
2350
3636
2732
3999
0
500
1000
1500
2000
2500
3000
3500
4000
4500
Foreign trade, January - September 2013 and 2014; Source: SSO
2012 20122013 2013Export Import
Import Import Import Import
Imported quantities of goods in the period January - September 2014 increased by
5.1%, compared to the same period in the previous year, while their value
amounted to EUR 3,999.4 million, increasing by 10.0% (EUR 363.8 million)
compared to the period January - September 2013.
Imported goods in September 2014 amounted to EUR 473.1 million, increasing by
20.3% (EUR 79.7 million) compared to September last year. Analyzed on monthly
basis, in September 2014, import grew by 13.3% (EUR 55.4 million), compared to the
previous month.
Seasonally adjusted trend of import in September 2014 surged by 9.2% on monthly
basis, pointing out to positive effects of the seasonal factor (4.0 p.p.) on the import
in September.
I - IX - 2013 I - IX - 2014 Balance % rate I - IX - 2013 I - IX - 2014 Balance % rate
000 Т 112.4 95.5 -16.9 -15.1 .000 Т 685.8 712.5 26.7 3.9
EUR mil. 57.5 41.2 -16.3 -28.4 EUR mil. 416.2 412.9 -3.3 -0.8
$ mil. 75.7 55.7 -20.0 -26.4 $ mil. 547.5 559.1 11.6 2.1
*)Previous data *)Previous data
Export of oil and oil products*) Import of oil and oil products*)
In addition to non-ferrous metals, following goods were the most imported
(according to SITC) in the period January – September 2014: oil; yarn, fabrics and

Bulletin-Ministry of Finance of the Republic of Macedonia
10
0
10
20
30
40
50
60
Food and beverages Industrial supplies Fuel and lubricants -
energy
Investments except
transport
equipment
Transport
equipment
Consumption goods
Participation of goods by economic purpose in total exports and imports of the Republic of Macedonia, I-IX 2014 (in %); Source: SSO and MoF calculations
export import
textile products; electrical machines, devices and spare parts; iron and steel; road
vehicles, etc.
In the period January – September 2014, observed by economic purpose, following
products were the most
imported: goods for industrial
procurement (47.4%), followed
by fuels and lubricants (14.8%),
products for investments
without transport equipment
(12.4%), consumer goods (10.1%),
food and beverages (10.0%) and
transport equipment (5.2%).
Most imported products by
tariffs were the following:
platinum, unwrought or in powder form; gas oils for other purpose with a sulphur
content up to 0.001% by weight; electricity; palladium: unwrought or in powder
form; ceramic products for laboratory, chemical or other technical use; motor
petrol with an octane number (RON) of 95 or more, but less than 98; nickel ore and
concentrates; pharmaceuticals put up in measured doses; heating oils with a
sulphur content by weight bigger than 0.1%, but not bigger than 1% by weight; hot
rolled products with thickness less than 3 mm; oil gas and other gaseous
hydrocarbons; etc.
I - IX - 2013 I - IX - 2014 Balance % rate I - IX - 2013 I - IX - 2014 Balance % rate
000 Т 5.3 9.3 4.0 75.0 .000 Т 23.4 24.2 0.8 3.2
EUR mil. 346.6 470.2 123.6 35.7 EUR mil. 56.9 65.3 8.5 14.9
$ mil. 456.4 635.8 179.4 39.3 $ mil. 74.7 88.6 13.9 18.6
*)Previous data *)Previous data
Export of chemical products*) Import of chemical products*)
Trade BalanceTrade BalanceTrade BalanceTrade Balance
In the first nine months in 2014, trade deficit narrowed by EUR 17.3 million or 1.3%
compared to the same period last year.
If we analyze the balance of export and import of goods by economic purpose,
deficit narrowing was a result of combined effect from: narrowed negative balance
in the trade of transport equipment, investment goods without transport
equipment and food and beverages, while the widened negative balance in the
trade of goods for industrial procurement, fuels and lubricants and consumer
goods acted in opposite direction.
Analyzed according to economic groups of countries, in the period January -
September 2014, compared to the same period in 2013, export surged at the
following groups: EU 28, EFTA, Organization of Petroleum Exporting Counties,
North American Free Trade Zone, while drop was recorded at the following
groups: Western Balkan Countries, Asia-Pacific Economic Cooperation
Organization and Commonwealth of Independent States. Export to the EU surged
by 26.6% on annual basis, while as for Western Balkan countries, it declined by
8.6%.

Bulletin-Ministry of Finance of the Republic of Macedonia
11
In the first nine months of 2014, foreign trade of the Republic of Macedonia with
the European Union (EU 28), in relation to the same period in the previous year,
increased by 21.1%, whereby share of trade with the EU in the total foreign trade
increased by 3.1 p.p., accounting for 69.4%. Export of goods to the European Union
(EU 28) accounted for 77.2% in the total export of the Republic of Macedonia, while
import of goods participated with 64.1%.
In the period January - September 2014, 86.6% of the trade deficit of the country
was realized in the trade with Great Britain, Greece, Serbia and China, followed by:
Turkey, Romania, Italy, the USA, Slovenia, Russia, Austria, and others. Surplus
was realized in the trade with Germany, Kosovo, Belgium and Bosnia and
Herzegovina.
Currency StructureCurrency StructureCurrency StructureCurrency Structure
Observed by currency structure, 79.3% of the trade in the period January -
September 2014 was realized in euros and, compared to the period January -
September 2013, it surged by 5.8 percentage points. On export and import side,
euro accounted for 87.3% and 73.8%, respectively, whereby share of euro in the
export was higher by 4.2 p.p., while share of euro in the import increased by 6.6 p.p.
compared to the period January – September 2013.
import
currency .000 Timport in
currency
average Denar
exch. Rate in
relation to
currencies
import in Denarstructure in
%.000 T
import in
currency
average
Denar exch.
Rate in
relation to
currencies
import in Denar structure in %
EUR 2,250.5 2,444,275,319 61.5009 150,325,188,987 67.1 2,371.4 2,949,430,704 61.5246 181,462,406,654 73.8 505,155,385 20.7
USD 1,853.5 1,036,206,400 46.1178 47,787,573,314 21.3 1,939.7 1,079,850,404 47.6534 51,458,536,058 20.9 43,644,005 4.2
GBP 2.3 315,531,373 72.9867 23,029,606,306 10.3 3.6 175,423,233 77.7789 13,644,233,102 5.5 -140,108,140 -44.4
EUR+USD+
GBP4,106.3 221,142,368,608 88.5 4,314.8 246,565,175,814 100.2
tot. import 4,113.9 223,963,309,126 100.0 4,322.5 246,021,996,121 100.0 9.8
Source: SSO and NBRM
Foreign trade of the Republic of Macedonia (by currency ); calculations: MoF
I - IX - 2013 I - IX - 2014
absolute
change in
currency
value
relative
change in
currency
value (in %)
3. Fiscal Sector3. Fiscal Sector3. Fiscal Sector3. Fiscal Sector
Budget RevenuesBudget RevenuesBudget RevenuesBudget Revenues
In the period January - September 2014, total budget revenues reached the amount
of Denar 104,564 million, i.e. 19.9% of GDP, being higher by 1.5% in relation to the
same period in 2013.
Tax revenues in the first nine months were realized in the amount of Denar 59,848
million, i.e. 11.4% of GDP, being higher by 5.5% in relation to the same period in
2013.
Revenues on the basis of value added tax were realized in the amount of Denar
31,422 million, whereby share of VAT in total tax revenues in this period was
dominant, accounting for 52.5%. Revenues on the basis of excises were realized in
the amount of Denar 12,385 million (participating with 20.7% in the tax revenues).
Hence, revenues realized on the basis of these two indirect taxes amounted to
Denar 43,807 million, i.e. 73.2% of total tax revenues (8.4% of GDP). Thereby, VAT

Bulletin-Ministry of Finance of the Republic of Macedonia
12
PIT
Profit tax
VAT
Excises
Custom duties
Wages
Goods and services
Transfers
Interest
Capital
expenditures
-80000-76000-72000-68000-64000-60000-56000-52000-48000-44000-40000-36000-32000-28000-24000-20000-16000-12000
-8000-4000
040008000
120001600020000240002800032000
Separate categories of revenues and expendituresSource : MoF
IX 2013
IX 2014
collection amounted to Denar 43,538 million on gross basis, Denar 12,116 million
out of which was refunded to taxpayers.
As for VAT structure, VAT
share was the biggest when
importing, increasing by 1.4%,
while VAT on the basis of sales
in the country registered
slight decline of 0.6%. Share of
VAT grants was insignificant,
accounting for 0.5%, whereby
tax on donations experienced
higher performance by 87.5%.
Observed by certain categories
of taxes, revenues on the basis
of personal income tax were realized in the amount of Denar 8,603 million,
increasing by 17.3% on annual basis, whereby revenues on the basis of tax on
salaries and other personal earnings accounted for around 3/4, i.e. 71.9% of the
personal income tax, revenues on the basis of contractual agreement accounted
for 7.6%, capital revenues accounted for 6.0% and revenues on the basis of property
and property rights accounted for 3.5%. Profit tax revenues in the first nine
months of 2014 amounted to Denar 3,590 million, increasing by 0.5% compared to
the same period in the previous year, being mainly a result of the paid dividend
and other profit distribution, withheld tax on paid revenues to foreign legal
entities, tax collected on the basis of monthly advance payments and tax balances.
VAT revenues experienced growth of 9.8%, while excises experienced higher
performance by 6.4%. Revenues on the basis of customs duties were realized in the
amount of Denar 3,102 million, experiencing almost identical performance, i.e.
dropping by 1.2%. Revenues on the basis of other taxes in the amount of Denar 746
million declined by more than 3 times compared to last year.
Non-tax revenues amounted to Denar 7,679 million and, in relation to the same
period in 2013, they were lower by 18.4% (these revenues are revenues on the basis
of profit realized by the public institutions, revenues collected on the basis of
administrative fees, fines, concessions, etc.).
Capital revenues realized on the basis of sale of construction land, flats and
dividends reached Denar 1,563 million (Denar 946 million out of the total revenues
on this basis accounted for the funds paid from AD Macedonian Telecom dividend
paid in April), decreasing by 48.9% compared to the same period in the previous
year.
Revenues collected on the basis of foreign donations from international and
bilateral cooperation amounted to Denar 1,912 million, being by 13.7% less
compared to the same period last year.
Social contributions were collected in the amount of Denar 32,154 million, being
higher by 4.3% compared to the same period in 2013, whereby collection of pension
insurance contributions increased by 4.2%, collection of health insurance

Bulletin-Ministry of Finance of the Republic of Macedonia
13
contribution grew by 4.6% and the one of employment contributions surged by
4.4%.
Budget ExpendituresBudget ExpendituresBudget ExpendituresBudget Expenditures
In the period January - September 2014, total budget expenditures amounted to
Denar 122,018 million, i.e. 23.2% of GDP, being higher by 2.7% compared to the same
period in 2013.
With respect to the structure of total realized expenditures, current expenditures
in the amount of Denar 110,424 million accounted for 90.5% (21.0% of GDP) and they
increased by 3.4% in relation to the same period in 2013.
Transfers amounting to Denar 78,682 million (15.0% of GDP) accounted for the
most in the current expenditure items, followed by expenditures related to wages
and salaries and allowances - Denar 17,194 million. With respect to total budget
expenditures, expenditures related to wages and salaries and allowances
accounted for 14.1% and, in relation to 2013, they increased by 1.8%.
Expenditures related to goods and services amounted to Denar 11,038 million,
increasing by 2.1% compared to the same period in 2013.
Transfers increased by 3.6% compared to the same period in 2013, participating
with 64.5% in the total expenditures. Social transfers amounted to Denar 57,789
million, increasing by 4.6% and participating with 47.4% in the total expenditures.
Transfers towards the Pension and Disability Insurance Fund accounted for the
most of the social transfers, amounting to Denar 36,030 million, increasing by
7.4%, compared to the same period in 2013 and accounting for 29.5% of the total
expenditures. Category other transfers, which includes transfers to local
government units, accounted for 16.6% in the total expenditures, i.e. they dropped
by 0.8% compared to the same period in 2013. Block grants to local government
units, amounting to Denar 10,354 million, grew by 0.3%, i.e. almost the same
amount compared to the same period in the previous year. Subsidies and transfers
were higher by 1.0%.
Interest-related expenditures amounted to Denar 3,510 million, being by 10.6%
more compared to the same period in 2013. Expenditures related to interest on the
basis of domestic borrowing increased by 35.0%, while the ones on the basis of
foreign borrowing dropped by 7.7%.
In the analyzed period, capital expenditures were realized in the amount of Denar
11,594 million, participating with 9.5% in the total expenditures (2.2% of GDP), i.e.
they slightly dropped by 3.2% compared to the same period last year.
Budget BalanceBudget BalanceBudget BalanceBudget Balance
In the period January - September 2014, the budget deficit of the Republic of
Macedonia reached the amount of Denar 17,454 million, being 3.3% of GDP, while
central budget deficit amounted to Denar 15,214 million, accounting for 2.9% of
GDP.

Bulletin-Ministry of Finance of the Republic of Macedonia
14
0
4000
8000
12000
16000
20000
0100020003000400050006000700080009000
10000
IX
2013
X XI XII I II III IV V VI VII VIII IX
2014
Summary of new employment; Source: ESAM
Newly employed from the registry
Total newly employed (RHS)
4. Social Sector4. Social Sector4. Social Sector4. Social Sector
Number of Newly Employed and Registered Unemployed Persons in Number of Newly Employed and Registered Unemployed Persons in Number of Newly Employed and Registered Unemployed Persons in Number of Newly Employed and Registered Unemployed Persons in
EARMEARMEARMEARM1111
In the first nine months in 2014, Employment Agency of the Republic of
Macedonia registered total of 131,516 new employments. 45.5% out of the total
number of newly employed was on the basis of full-time employment, while the
rest of the employed were on the basis of temporary employment and seasonal
workers. Compared to September 2013, number of newly employed persons was
higher by 7.2%.
During September, 18,327 new employments were registered, 19.5% out of which
were from the unemployed
records. Outflow of persons
from the Employment Agency
Registry of the Republic of
Macedonia amounted to 6,685,
persons in September, 52.1%
out of which were new
employments. In September
2014, 20,714 persons were
registered as inflow to the
Agency, 17.3% out of which
were persons whose
employment was terminated. Thus, in September 2014, 114,487 persons were
registered as unemployed, while number of other unemployed persons accounted
for 105,814.
Major percentage of the unemployed, i.e. 70.7%, came from urban areas (cities),
whereby 59.8% were men. Analyzed by education structure, major part, i.e. 52.3% of
unemployed persons, was without education, with primary education or
incomplete secondary education, 30.9% was with complete secondary education,
while 16.8% of the unemployed persons was with completed community college or
higher education level. Observed by age, majority of the unemployed persons or
53.0% fall in the category of 25-49 years of age. According to the time they waited
for a job, 34.4% of the unemployed persons wait for employment from 1 to 7 years,
while 16.7% wait for employment for 8 years and more.
SalariesSalariesSalariesSalaries
According to the data from the State Statistical Office, average monthly paid
gross salary per employee in August 2014 amounted to Denar 31,080, while
average monthly paid net salary amounted to Denar 21,217.
1Modifications and amendments to the Law on Employment and Unemployment Insurance (“Official Gazette of
the Republic of Macedonia”, no. 114/2012) also referred to changes as regards records on unemployed persons.
This Law sets the basis for establishing and keeping two records: records on unemployed persons and records on
other persons applying to the Employment Agency.

Bulletin-Ministry of Finance of the Republic of Macedonia
15
-3
-2
-2
-1
-1
0
1
1
2
2
3
VIII 2013
IX X XI XII I II III IV V VI VII VIII 2014
Average net wage (annual change %); Source: SSO
Nominal change Real change
On monthly basis, in August 2014, average gross salary decreased by 0.5% in
nominal terms, remaining unchanged in real terms, while average net salary
dropped by 0.6% in nominal terms, being lower by 0.1% in real terms.
In August 2014, compared to August 2013, average gross salary increased by 0.3%
in nominal terms, while it was
higher by 0.8% in real terms.
Average net salary was higher
by 0.5% in nominal terms,
increasing by 1.0% in real
terms.
On cumulative basis, in the
period January - August 2014,
average gross salary
increased by 0.3% in nominal
terms, while it was higher by
0.5% in real terms. Average net salary was higher by 0.5% in nominal terms,
increasing by 0.7% in real terms.
Increase of average monthly gross and net salary per employee in August 2014,
compared to August 2013, was recorded in the following sectors: expert, scientific
and technical activities (7.0% gross salary and 8.9% net salary), construction (4.6%
gross salary and 5.0% net salary) and art, entertainment and recreation (4.2% gross
salary and 4.8 net salary).
Reduction of average monthly gross and net salary per employee in August 2014,
compared to the previous month, was registered in the following sectors:
construction (3.5% gross salary and 3.9% net salary), mining and quarrying (2.5%
gross salary and 2.3% net salary) and manufacturing industry (2.2% gross salary
and 2.4% net salary).
Employees who did not receive salary in August 2014 accounted for 1.4%, being
lower by 0.1 p.p. compared to the same month in the previous year, while compared
to July 2014, percentage of employees who did not receive salary was higher by 0.2
p.p..
PensionsPensionsPensionsPensions
In September 2014, 294,744 pensioners were registered at the Pension and
Disability Insurance Fund, being an increase by 2.0% compared to the same month
in 2013. Number of pension beneficiaries increased by 1,502 persons in relation to
August 2014. 59.2% out of the total number of pensioners are beneficiaries of old-
age pension, 26.1% of survival pension and 14.8% of disability pension.

Bulletin-Ministry of Finance of the Republic of Macedonia
16
283000
285000
287000
289000
291000
293000
295000
297000
IX 2013
X XI XII I II III IV V VI VII VIII IX 2014
Total number of pensioners; Source: PDIF
57.6
77.6
42.4
22.4
0
20
40
60
80
100
Deposits Credits
%
Currency structure of deposits and credits in September 2014; Source: NBRM
Foreign currency Denar
In September 2014, Denar
3,551.02 million was spent for
payment of pensions,
accounting for 54.6% of the
total social transfers2.
Average pension in September
2014 amounted to Denar
12,439, increasing by 5.3% on
annual basis. Ratio between
the average pension and the
average paid salary in August
2014 (the most recent available data) was 58.6%.
5. Monetary Sector5. Monetary Sector5. Monetary Sector5. Monetary Sector
Primary MoneyPrimary MoneyPrimary MoneyPrimary Money
Primary money3 in September
2014 grew by 7.5% on annual
basis, as opposed to the 6.7%
increase in the previous
month. Such growth was due
to the increased ready money
in circulation by 9.6% and the
increase of total liquid assets
of banks by 5.7% on annual
basis.
On monthly basis, primary
money dropped by 1.5%, as a result of the decline of ready money in circulation by
2.5% compared to 0.8% increase in the previous month, as well as the decline of
total liquidity assets of the banks by 0.7%.
In September 2014, National Bank of the Republic of Macedonia, in conditions of
stable trends, decided to retain the interest rate on CB bills at 3.25%.
Deposit PotentialDeposit PotentialDeposit PotentialDeposit Potential
Total deposit potential of banks4 in September 2014 increased by 1% on monthly
basis, as opposed to the growth of 2.2% registered in the previous month. Analyzed
by sectors, deposits of private enterprises grew by 1.9%, while deposits of
households increased by 0.5% compared to the previous month. From currency
2Category social transfers include pensions, unemployment benefit, social assistance and expenditures for health
protection. 3 Primary money is calculated as a sum of ready money in circulation (including cash in hand), denar and foreign
currency reserve requirement and the surplus of liquid assets over the reserve requirement (in denars). 4 Starting January 2009, deposits include calculated interest.

Bulletin-Ministry of Finance of the Republic of Macedonia
17
0
2
4
6
8
10
I 2013 III V VII IX XI I 2014 III V VII IX
%
Growth rates of depostis and credits (m/m-12); Source: NBRM
Deposits Credits
0
1
2
3
4
5
6
7
8
9
I 2013 III V VII IX XI I 2014 III V VII IX
%
Interest rates; Source: NBRM
Denar credits Denar deposits
Foreign currency credits Foreign currency deposits
point of view, Denar deposits increased by 1.3%, while foreign currency deposits
increased by 0.5%.
Total deposit potential in
September 2014 increased by
8.7% on annual basis. From
currency point of view,
domestic currency deposits
increased by 11.6% in
September 2014, which were
the main drivers of growth of
total deposits on annual basis,
while foreign currency
deposits surged by 5.1%. From
sector point of view, deposits
of households increased by 8%, while deposits of enterprises surged by 14.3%.
According to maturity, long-term deposits grew by 19.1%, while short-term
deposits grew by 1.7%.
Bank CreditsBank CreditsBank CreditsBank Credits
In September 2014, total credits of banks to the private sector grew by 0.8% on
monthly basis (as opposed to 0.3% growth in August 2014), in conditions of growth
of credits to households by 1% and credits to enterprises by 0.7%. From currency
aspect, Denar credits surged by 1%, while foreign currency credits grew by 0.4%.
In September 2014, total credits grew by 9.4% on annual basis (compared to the
growth of 8.7% in August), in conditions of growth of credits to enterprises by 7.2%
and credits of households by 12.3%. Denar credits surged by 11.6%, while foreign
currency credits increased by 2.1%. As regards maturity, long-term credits
experienced annual growth of 9.3%, while short-term credits were higher by 7.4%.
Interest Rates of Deposit BanksInterest Rates of Deposit BanksInterest Rates of Deposit BanksInterest Rates of Deposit Banks
Total interest rate on credits was 7.1% in September 2014, remaining unchanged
compared to the previous
month. However, it was lower
by 0.5 p.p. compared to the
same month in 2013. Interest
rates on Denar and foreign
currency deposits remained
unchanged in relation to the
previous month, accounting
for 7.4% and 6.2% respectively.
Total interest rate on deposits
was 2.3%, being lower by 0.1
p.p. compared to last month, while compared to September last year, it was lower

Bulletin-Ministry of Finance of the Republic of Macedonia
18
by 0.5 p.p. Interest rate on Denar deposits remained at 3.6%, while interest rate on
foreign currency deposits were kept at 1.3%.
Foreign Currency ReservesForeign Currency ReservesForeign Currency ReservesForeign Currency Reserves Gross foreign currency reserves at the end of September 2014 amounted to EUR
2,435 million and, compared to the previous month, they were lower by EUR 14.1
million, while compared to September 2013, foreign currency reserves were higher
by EUR 370.2 million.

Bulletin-Ministry of Finance of the Republic of Macedonia
19
AAAAAAAATTTTTTTTTTTTTTTTAAAAAAAACCCCCCCCHHHHHHHHMMMMMMMMEEEEEEEENNNNNNNNTTTTTTTTSSSSSSSS

Bulletin-Ministry of Finance of the Republic of Macedonia
20
MMMMMMMMAAAAAAAACCCCCCCCRRRRRRRROOOOOOOOEEEEEEEECCCCCCCCOOOOOOOONNNNNNNNOOOOOOOOMMMMMMMMYYYYYYYY
Bulletin-Ministry of Finance of the Republic of Macedonia
21
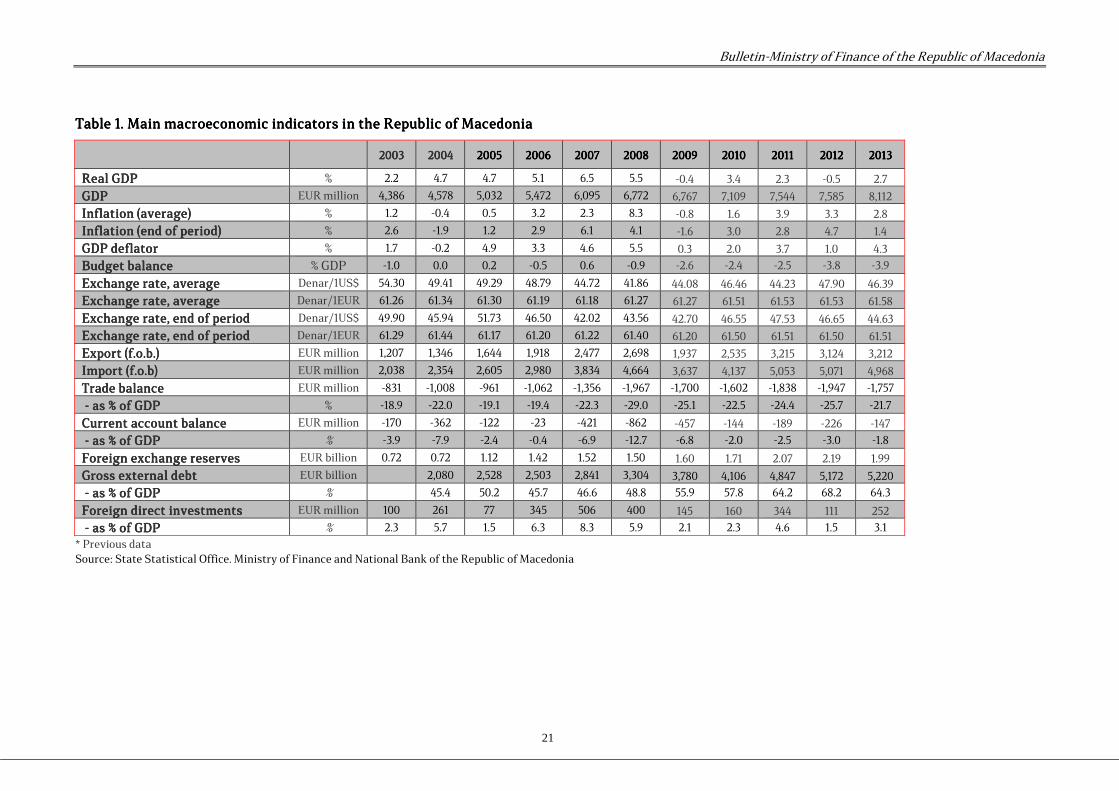
Table 1. Main macroeconomic indicators in the Republic of MacedoniaTable 1. Main macroeconomic indicators in the Republic of MacedoniaTable 1. Main macroeconomic indicators in the Republic of MacedoniaTable 1. Main macroeconomic indicators in the Republic of Macedonia
2003200320032003 2004200420042004 2005200520052005 2006200620062006 2007200720072007 2008200820082008 2009200920092009 2010201020102010 2011201120112011 2012201220122012 2013201320132013
Real GDPReal GDPReal GDPReal GDP % 2.2 4.7 4.7 5.1 6.5 5.5 -0.4 3.4 2.3 -0.5 2.7
GDPGDPGDPGDP EUR million 4,386 4,578 5,032 5,472 6,095 6,772 6,767 7,109 7,544 7,585 8,112
Inflation (average)Inflation (average)Inflation (average)Inflation (average) % 1.2 -0.4 0.5 3.2 2.3 8.3 -0.8 1.6 3.9 3.3 2.8
Inflation (end of period)Inflation (end of period)Inflation (end of period)Inflation (end of period) % 2.6 -1.9 1.2 2.9 6.1 4.1 -1.6 3.0 2.8 4.7 1.4
GDP deflatorGDP deflatorGDP deflatorGDP deflator % 1.7 -0.2 4.9 3.3 4.6 5.5 0.3 2.0 3.7 1.0 4.3
Budget balanceBudget balanceBudget balanceBudget balance % GDP -1.0 0.0 0.2 -0.5 0.6 -0.9 -2.6 -2.4 -2.5 -3.8 -3.9
Exchange rate, averageExchange rate, averageExchange rate, averageExchange rate, average Denar/1US$ 54.30 49.41 49.29 48.79 44.72 41.86 44.08 46.46 44.23 47.90 46.39
Exchange rate, averageExchange rate, averageExchange rate, averageExchange rate, average Denar/1EUR 61.26 61.34 61.30 61.19 61.18 61.27 61.27 61.51 61.53 61.53 61.58
Exchange rate, end of periodExchange rate, end of periodExchange rate, end of periodExchange rate, end of period Denar/1US$ 49.90 45.94 51.73 46.50 42.02 43.56 42.70 46.55 47.53 46.65 44.63
Exchange rate, end of periodExchange rate, end of periodExchange rate, end of periodExchange rate, end of period Denar/1EUR 61.29 61.44 61.17 61.20 61.22 61.40 61.20 61.50 61.51 61.50 61.51
Export (f.o.b.)Export (f.o.b.)Export (f.o.b.)Export (f.o.b.) EUR million 1,207 1,346 1,644 1,918 2,477 2,698 1,937 2,535 3,215 3,124 3,212
Import (f.o.b)Import (f.o.b)Import (f.o.b)Import (f.o.b) EUR million 2,038 2,354 2,605 2,980 3,834 4,664 3,637 4,137 5,053 5,071 4,968
Trade balanceTrade balanceTrade balanceTrade balance EUR million -831 -1,008 -961 -1,062 -1,356 -1,967 -1,700 -1,602 -1,838 -1,947 -1,757
---- as % of GDPas % of GDPas % of GDPas % of GDP % -18.9 -22.0 -19.1 -19.4 -22.3 -29.0 -25.1 -22.5 -24.4 -25.7 -21.7
Current account balanceCurrent account balanceCurrent account balanceCurrent account balance EUR million -170 -362 -122 -23 -421 -862 -457 -144 -189 -226 -147
---- as % of GDPas % of GDPas % of GDPas % of GDP % -3.9 -7.9 -2.4 -0.4 -6.9 -12.7 -6.8 -2.0 -2.5 -3.0 -1.8
Foreign exForeign exForeign exForeign exchange reserveschange reserveschange reserveschange reserves EUR billion 0.72 0.72 1.12 1.42 1.52 1.50 1.60 1.71 2.07 2.19 1.99
Gross external debtGross external debtGross external debtGross external debt EUR billion 2,080 2,528 2,503 2,841 3,304 3,780 4,106 4,847 5,172 5,220
---- as % of GDPas % of GDPas % of GDPas % of GDP % 45.4 50.2 45.7 46.6 48.8 55.9 57.8 64.2 68.2 64.3
ForeignForeignForeignForeign direct investmentsdirect investmentsdirect investmentsdirect investments EUR million 100 261 77 345 506 400 145 160 344 111 252
---- as % of GDPas % of GDPas % of GDPas % of GDP % 2.3 5.7 1.5 6.3 8.3 5.9 2.1 2.3 4.6 1.5 3.1
* Previous data Source: State Statistical Office. Ministry of Finance and National Bank of the Republic of Macedonia

Bulletin-Ministry of Finance of the Republic of Macedonia
22
TTTTable 2. Selected Macroeconomic indicators in certain economiesable 2. Selected Macroeconomic indicators in certain economiesable 2. Selected Macroeconomic indicators in certain economiesable 2. Selected Macroeconomic indicators in certain economies
Bu
lga
ria
Bu
lga
ria
Bu
lga
ria
Bu
lga
ria
Th
e C
zech
T
he
Cze
ch
Th
e C
zech
T
he
Cze
ch
Re
pu
bli
cR
ep
ub
lic
Re
pu
bli
cR
ep
ub
lic
Est
on
iaE
sto
nia
Est
on
iaE
sto
nia
Hu
ng
ary
Hu
ng
ary
Hu
ng
ary
Hu
ng
ary
La
tvia
La
tvia
La
tvia
La
tvia
Lit
hu
an
iaL
ith
ua
nia
Lit
hu
an
iaL
ith
ua
nia
Po
lan
dP
ola
nd
Po
lan
dP
ola
nd
Ro
ma
nia
Ro
ma
nia
Ro
ma
nia
Ro
ma
nia
Slo
va
kia
Slo
va
kia
Slo
va
kia
Slo
va
kia
Slo
ve
nia
Slo
ve
nia
Slo
ve
nia
Slo
ve
nia
Cro
ati
aC
roa
tia
Cro
ati
aC
roa
tia
Ma
lta
Ma
lta
Ma
lta
Ma
lta
Tu
rke
yT
urk
ey
Tu
rke
yT
urk
ey
GDP (annual real growth rate)GDP (annual real growth rate)GDP (annual real growth rate)GDP (annual real growth rate)
2006200620062006 6.5 7.0 10.2 3.9 11.0 7.8 6.2 7.9 8.3 5.8 4.9 2.6 6.9
2007200720072007 6.4 5.7 7.3 0.1 10.0 9.8 6.8 6.3 10.5 7.0 5.1 4.1 4.7
2008200820082008 6.2 3.1 -4.1 0.9 -2.8 2.9 5.1 7.3 5.8 3.4 2.1 3.9 0.7
2009200920092009 -5.5 -4.5 -14.1 -6.8 -17.7 -14.8 1.6 -6.6 -4.9 -7.9 -6.9 -2.8 -4.8
2010201020102010 0.4 2.5 3.3 1.1 -1.3 1.6 3.9 -1.1 4.4 1.3 -2.3 4.3 9.2
2011201120112011 1.8 1.8 8.7 1.6 5.3 6.0 4.5 2.3 3.0 0.7 -0.2 1.4 8.8
2012201220122012 0.6 -1.0 4.5 -1.7 5.2 3.7 2.0 0.6 1.8 -2.5 -2.2 1.1 2.1
2013201320132013 0.9 -0.9 2.2 1.1 4.1 3.3 1.6 3.5 0.9 -1.1 -0.9 2.9 4.0
2013 Q2013 Q2013 Q2013 Q----1111 0.9 -2.9 4.2 -0.9 3.8 3.6 0.4 2.1 0.5 -4.6 -1.5 2.0 3.1
QQQQ----2222 -0.1 -1.7 1.4 0.5 4.4 3.8 1.2 1.4 0.8 -1.4 -0.6 4.4 4.6
QQQQ----3333 1.1 -0.1 1.9 1.9 4.6 2.4 2.2 4.2 0.9 -0.5 -0.5 2.5 4.2
QQQQ----4444 1.6 0.8 1.6 2.7 3.6 3.6 2.3 5.4 1.5 2.1 -1.1 2.6 4.5
2014 Q2014 Q2014 Q2014 Q----1111 1.4 2.9 -0.1 3.7 2.8 3.2 3.8 3.9 2.4 1.9 -0.4 4.0 4.7
QQQQ----2222 2.1 2.7 2.6 3.9 2.5 3.3 3.3 1.2 2.5 2.9 -0.8 2.9 2.1
Inflation (CPI, annual percentage change)Inflation (CPI, annual percentage change)Inflation (CPI, annual percentage change)Inflation (CPI, annual percentage change)
2006200620062006 7.4 2.1 4.4 4.0 6.6 3.8 1.3 6.6 4.3 2.5 3.3 2.6 9.3
2007200720072007 7.6 3.0 6.7 7.9 10.1 5.8 2.6 4.9 1.9 3.8 2.7 0.7 8.8
2008200820082008 12.0 6.3 10.6 6.0 15.3 11.1 4.2 7.9 3.9 5.5 5.8 4.7 10.4
2009200920092009 2.5 0.6 0.2 4.0 3.3 4.2 4.0 5.6 0.9 0.9 2.2 1.8 6.3
2010201020102010 3.0 1.2 2.7 4.7 -1.2 1.2 2.7 6.1 0.7 2.1 1.1 2.0 8.6
2011201120112011 3.4 2.1 5.1 3.9 4.2 4.1 3.9 5.8 4.1 2.1 2.2 2.5 6.5
2012201220122012 2.4 3.5 4.2 5.7 2.3 3.2 3.7 3.4 3.7 2.8 3.4 3.2 9.0
2013201320132013 0.4 1.4 3.2 1.7 0.0 1.2 0.8 3.2 1.5 1.9 2.3 1.0 7.5
2013 Q2013 Q2013 Q2013 Q----1111 2.1 1.7 3.8 2.7 0.4 2.2 1.3 4.8 2.2 2.6 4.1 1.9 7.4
QQQQ----2222 1.0 1.5 3.7 1.9 -0.1 1.4 0.5 4.4 1.7 1.8 2.4 0.8 6.8
QQQQ----3333 -0.7 1.2 3.4 1.6 0.0 0.5 0.9 2.4 1.4 2.2 2.3 0.7 8.2
QQQQ----4444 -1.0 1.1 2.1 0.7 -0.2 0.5 0.6 1.3 0.5 1.1 0.7 0.6 7.5
2014 Q2014 Q2014 Q2014 Q----1111 -1.8 0.3 1.1 0.4 0.4 0.3 0.6 1.3 -0.1 0.6 0.0 1.3 8.1
QQQQ----2222 -1.6 0.2 0.6 -0.1 0.8 0.2 0.3 1.3 -0.1 0.8 0.3 0.5 9.3
Unemployment rate (ILO definition)Unemployment rate (ILO definition)Unemployment rate (ILO definition)Unemployment rate (ILO definition)
2006200620062006 9.0 7.1 5.9 7.5 7.0 5.8 13.9 7.2 13.5 6.0 11.6 6.8 9.0
2222007007007007 6.9 5.3 4.6 7.4 6.1 4.3 9.6 6.4 11.2 4.9 10.0 6.5 9.1
2008200820082008 5.6 4.4 5.5 7.8 7.7 5.8 7.1 5.6 9.6 4.4 8.9 6.0 10.0
2009200920092009 6.8 6.7 13.5 10.0 17.5 13.8 8.1 6.5 12.1 5.9 9.6 6.9 13.0
2010201020102010 10.3 7.3 16.7 11.2 19.5 17.8 9.7 7.0 14.5 7.3 12.3 6.9 11.1
2011201120112011 11.3 6.7 12.3 10.9 16.2 15.4 9.7 7.2 13.7 8.2 13.9 6.4 9.1
2012201220122012 12.3 7.0 10.0 10.9 15.0 13.4 10.1 6.8 14.0 8.9 16.1 6.3 8.4
2013201320132013 13.0 7.0 8.6 10.2 11.9 11.8 10.3 7.1 14.2 10.1 17.3 6.4 9.0
2013 Q2013 Q2013 Q2013 Q----1111 13.8 7.5 10.0 11.8 13.0 13.1 11.3 7.3 14.5 11.1 18.0 6.0 9.6
QQQQ----2222 13.0 6.8 8.0 10.3 11.4 11.7 10.5 7.3 14.0 10.4 16.8 6.6 8.4
QQQQ----3333 12.0 7.0 7.8 9.8 11.8 10.9 9.8 6.7 14.1 9.4 16.8 6.5 8.9
QQQQ----4444 13.1 6.7 8.7 9.1 11.3 11.4 9.8 7.1 14.3 9.7 17.7 6.4 9.3
2014 Q2014 Q2014 Q2014 Q----1111 13.0 6.8 8.5 8.3 11.9 12.4 10.6 7.2 14.1 10.8 18.9 6.0 10.0
QQQQ----2222 11.4 6.0 6.9 8.0 10.7 11.2 9.1 6.7 13.2 9.3 16.6 5.8 n.a.

Bulletin-Ministry of Finance of the Republic of Macedonia
23
-2
0
2
4
6
8
10
12
2000 2001 2002 2003 2004 2005 2006 2007 2008 2009 2010 2011 2012 2013
Chart Chart Chart Chart 1111. Inflation (average rate, in %). Inflation (average rate, in %). Inflation (average rate, in %). Inflation (average rate, in %)
CPI Retail prices
-4
-2
0
2
4
6
8
10
12
2000 2001 2002 2003 2004 2005 2006 2007 2008 2009 2010 2011 2012 2013
Chart Chart Chart Chart 2222. Inflation (end of period, in %). Inflation (end of period, in %). Inflation (end of period, in %). Inflation (end of period, in %)
CPI Retail prices

Bulletin-Ministry of Finance of the Republic of Macedonia
24
Table 3. Gross domestic product according to production approach (annual real growth rates %)Table 3. Gross domestic product according to production approach (annual real growth rates %)Table 3. Gross domestic product according to production approach (annual real growth rates %)Table 3. Gross domestic product according to production approach (annual real growth rates %)
Source: State Statistical Office
Note: Data is presented according to the European System of National and Regional Accounts (ESA) 2010
Table 4. Gross domestic product according to expenditure approach Table 4. Gross domestic product according to expenditure approach Table 4. Gross domestic product according to expenditure approach Table 4. Gross domestic product according to expenditure approach
(Annual real growth rates %) (Annual real growth rates %) (Annual real growth rates %) (Annual real growth rates %)
GDPGDPGDPGDP Final consumptionFinal consumptionFinal consumptionFinal consumption
Gross Gross Gross Gross
investmentinvestmentinvestmentinvestment
Export of Export of Export of Export of
goods and goods and goods and goods and
servicesservicesservicesservices
Import of Import of Import of Import of
goods and goods and goods and goods and
servicesservicesservicesservices TotalTotalTotalTotal PersonalPersonalPersonalPersonal PublicPublicPublicPublic
2013201320132013 2.2 1.8 3.2 -3.7 -8.9 3.8 -1.3
2013 Q2013 Q2013 Q2013 Q----1111 -0.5 4.1 5.7 -2.0 -34.0 -4.4 -5.3
QQQQ----2222 1.3 3.5 5.8 -6.1 -3.6 4.8 5.1
QQQQ----3333 2.9 -0.1 1.1 -5.0 -10.7 5.4 -4.9
QQQQ----4444 4.5 -0.2 0.2 -1.7 3.9 8.9 -0.2
2014 Q2014 Q2014 Q2014 Q----1111 3.5 1.7 1.5 2.4 13.9 14.3 10.5
QQQQ----2222 4.3 4.5 4.6 3.5 1.3 12.4 8.1
Source: State Statistical Office
Note: Data is presented according to the European System of National and Regional Accounts (ESA) 2010
Ag
ricu
ltu
reA
gri
cult
ure
Ag
ricu
ltu
reA
gri
cult
ure
Ind
ust
ryIn
du
stry
Ind
ust
ryIn
du
stry
Co
nst
ruct
ion
Co
nst
ruct
ion
Co
nst
ruct
ion
Co
nst
ruct
ion
Wh
ole
sale
an
d r
eta
il t
rad
Wh
ole
sale
an
d r
eta
il t
rad
Wh
ole
sale
an
d r
eta
il t
rad
Wh
ole
sale
an
d r
eta
il t
rad
e;
e;
e; e;
tra
nsp
ort
tra
nsp
ort
tra
nsp
ort
tra
nsp
ort
Info
rma
tio
n a
nd
In
form
ati
on
an
d
Info
rma
tio
n a
nd
In
form
ati
on
an
d
com
mu
nic
ati
on
com
mu
nic
ati
on
com
mu
nic
ati
on
com
mu
nic
ati
on
Fin
an
cia
l a
nd
in
sura
nce
F
ina
nci
al
an
d i
nsu
ran
ce
Fin
an
cia
l a
nd
in
sura
nce
F
ina
nci
al
an
d i
nsu
ran
ce
act
ivit
ies
act
ivit
ies
act
ivit
ies
act
ivit
ies
RR RRe
al
est
ate
act
ivit
ies
ea
l e
sta
te a
ctiv
itie
se
al
est
ate
act
ivit
ies
ea
l e
sta
te a
ctiv
itie
s
Pro
fess
ion
al,
sci
en
tifi
cP
rofe
ssio
na
l, s
cie
nti
fic
Pro
fess
ion
al,
sci
en
tifi
cP
rofe
ssio
na
l, s
cie
nti
fic
an
d t
ech
nic
al
act
ivit
ies;
an
d t
ech
nic
al
act
ivit
ies;
an
d t
ech
nic
al
act
ivit
ies;
an
d t
ech
nic
al
act
ivit
ies;
Ad
min
istr
ati
ve
an
d s
up
po
rtA
dm
inis
tra
tiv
e a
nd
su
pp
ort
Ad
min
istr
ati
ve
an
d s
up
po
rtA
dm
inis
tra
tiv
e a
nd
su
pp
ort
serv
ice
act
ivit
ies
serv
ice
act
ivit
ies
serv
ice
act
ivit
ies
serv
ice
act
ivit
ies
Pu
bli
c a
dm
inis
tra
tio
n a
nd
P
ub
lic
ad
min
istr
ati
on
an
d
Pu
bli
c a
dm
inis
tra
tio
n a
nd
P
ub
lic
ad
min
istr
ati
on
an
d
de
fen
sed
efe
nse
de
fen
sed
efe
nse
; co
mp
uls
ory
so
cia
l ; c
om
pu
lso
ry s
oci
al
; co
mp
uls
ory
so
cia
l ; c
om
pu
lso
ry s
oci
al
sec
sec
sec
sec u
rity
; Ed
uca
tio
n; H
um
an
u
rity
; Ed
uca
tio
n; H
um
an
u
rity
; Ed
uca
tio
n; H
um
an
u
rity
; Ed
uca
tio
n; H
um
an
he
alt
h a
nd
so
cia
l w
ork
h
ea
lth
an
d s
oci
al
wo
rk
he
alt
h a
nd
so
cia
l w
ork
h
ea
lth
an
d s
oci
al
wo
rk
act
ivit
ies
act
ivit
ies
act
ivit
ies
act
ivit
ies
Art
s, e
nte
rta
inm
en
t a
nd
A
rts,
en
tert
ain
me
nt
an
d
Art
s, e
nte
rta
inm
en
t a
nd
A
rts,
en
tert
ain
me
nt
an
d
recr
ea
tio
n; O
the
r se
rvic
e
recr
ea
tio
n; O
the
r se
rvic
e
recr
ea
tio
n; O
the
r se
rvic
e
recr
ea
tio
n; O
the
r se
rvic
e
act
ivit
ies;
act
ivit
ies;
act
ivit
ies;
act
ivit
ies;
Ne
tN
et
Ne
tN
et -- --
tax
es
on
pro
du
ctio
nta
xe
s o
n p
rod
uct
ion
tax
es
on
pro
du
ctio
nta
xe
s o
n p
rod
uct
ion
GR
OS
S D
OM
ES
TIC
PR
OD
UC
TG
RO
SS
DO
ME
ST
IC P
RO
DU
CT
GR
OS
S D
OM
ES
TIC
PR
OD
UC
TG
RO
SS
DO
ME
ST
IC P
RO
DU
CT
A A A A B, C, B, C, B, C, B, C,
D & ED & ED & ED & E FFFF
G, H G, H G, H G, H
& I& I& I& I JJJJ KKKK LLLL M & N M & N M & N M & N O, P & QO, P & QO, P & QO, P & Q R, S & TR, S & TR, S & TR, S & T
2013201320132013 -0.1 5.1 32.2 -1.6 4.3 1.1 0.4 3.3 0.5 -0.2 0.9 2.2
2013 Q2013 Q2013 Q2013 Q----1111 -4.1 9.8 32.0 -5.5 6.5 0.1 1.4 3.8 1.8 -9.2 1.0 -0.5
QQQQ----2222 -0.8 5.3 25.6 -4.2 3.6 0.9 4.6 -0.3 0.9 3.2 1.1 1.3
QQQQ----3333 1.1 2.7 33.8 3.9 2.7 0.3 0.0 4.5 0.1 3.0 0.2 2.9
QQQQ----4444 2.3 3.6 37.6 -1.3 4.7 3.3 -4.1 5.1 -0.4 2.9 1.3 4.5
2014 Q2014 Q2014 Q2014 Q----1111 0.4 2.8 10.4 3.1 4.4 4.3 2.3 4.4 0.2 4.0 9.4 3.5
QQQQ----2222 1.7 0.2 0.6 5.0 4.0 4.1 2.7 0.7 0.4 2.0 35.6 4.3

Bulletin-Ministry of Finance of the Republic of Macedonia
25
Table 5. Industry (productionTable 5. Industry (productionTable 5. Industry (productionTable 5. Industry (production,,,, employment and productivity) annual changes %employment and productivity) annual changes %employment and productivity) annual changes %employment and productivity) annual changes %
Industrial productionIndustrial productionIndustrial productionIndustrial production EmploymentEmploymentEmploymentEmployment ProducProducProducProductivitytivitytivitytivity
To
tal
To
tal
To
tal
To
tal
Ex
trac
tio
n o
f o
re a
nd
sto
ne
Pro
cess
ing
ind
ust
ry
Ele
ctri
city
. ga
s a
nd
wa
ter
To
tal
To
tal
To
tal
To
tal
Ex
trac
tio
n o
f o
re a
nd
sto
ne
Pro
cess
ing
ind
ust
ry
Ele
ctri
city
. ga
s a
nd
wa
ter
To
tal
To
tal
To
tal
To
tal
Ex
trac
tio
n o
f o
re a
nd
sto
ne
Pro
cess
ing
ind
ust
ry
Ele
ctri
city
. ga
s a
nd
wa
ter
2002002002006666 5.9 11.1 6.4 0.8 -0.3 -0.6 -3.6 -4.3 6.3 11.8 10.4 5.3
2007200720072007 3.9 10.0 5.5 -9.5 -1.0 -6.4 -0.3 -2.2 4.9 17.5 5.8 -7.5
2008200820082008 5.1 9.4 5.9 -3.1 -1.1 -8.3 -0.2 -1.9 6.3 19.3 6.1 -1.2
2009200920092009 -8.7 -12.4 -10.4 8.7 -6.6 -9.6 -6.8 -2.1 -2.2 -3.1 -3.9 11.0
2010201020102010 -4.3 -3.4 -6.9 14.3 -4.4 -2.8 -5.0 -0.9 0.1 -0.6 -2.0 15.3
2011201120112011 3.3 7.4 5.5 -11.1 1.5 2.6 1.1 3.0 1.8 4.7 4.4 -13.7
2012201220122012 -6.6 -4.4 -6.3 -9.6 -2.4 1.8 -3.2 1.3 -4.3 -6.1 -3.2 -10.8
2013201320132013 3.2 3.4 2.8 5.3 1.1 6.9 0.6 1.4 2.1 -3.3 2.2 3.8
2013 I2013 I2013 I2013 I -1.3 17.6 -4.5 -0.7 -0.2 8.7 -1.1 1.7 -1.1 8.2 -3.4 -2.4
IIIIIIII 4.5 17.7 4.4 -3.6 1.1 8.5 0.4 1.7 3.4 8.5 4.0 -5.2
IIIIIIIIIIII 4.2 8.2 0.9 20.6 1.7 7.7 1.1 1.6 2.5 0.5 -0.2 18.7
IVIVIVIV 4.0 1.9 3.4 9.5 0.2 8.5 -0.6 2.1 3.8 -6.1 4.0 7.2
VVVV -2.8 9.1 -9.3 34.3 0.3 8.8 -0.6 1.9 -3.1 0.3 -8.8 31.8
VIVIVIVI 1.9 6.7 1.9 -2.7 0.5 8.4 -0.3 2.1 1.4 -1.6 2.2 -4.7
VIIVIIVIIVII 3.9 3.3 7.3 -15.5 0.7 8.4 -0.1 3.1 3.2 -4.7 7.4 -18.0
VIIIVIIIVIIIVIII -1.2 4.8 -2.9 4 1.6 8.2 1.0 1.9 -2.8 -3.1 -3.9 2.1
IXIXIXIX 5.1 -8.9 4.2 32.6 1.3 8.7 0.7 0.9 3.8 -16.2 3.5 31.4
XXXX 6.9 9.7 7.4 -0.8 2.8 9.2 2.3 1.5 4.0 0.5 5.0 -2.3
XIXIXIXI 3.1 -15.8 7.1 -2.6 1.2 -0.6 1.6 -1.4 1.9 -15.3 5.4 -1.2
XIIXIIXIIXII 9.5 -4.2 13.1 1.9 2.5 -0.2 3 0 6.8 -4.0 9.8 1.9
2014 I2014 I2014 I2014 I 6.4 -1.1 12.1 -9.9 6.5 -0.7 7.8 -1.1 -0.1 -0.4 4.0 -8.9
IIIIIIII 4.1 3.5 10.0 -21.5 6.8 -0.8 8.1 -0.7 -2.5 4.3 1.8 -20.9
IIIIIIIIIIII 0.6 -3.2 4.9 -18.2 7.3 -1.3 8.7 -0.5 -6.2 -1.9 -3.5 -17.8
IVIVIVIV 2.2 0.4 6.5 -19.9 7.1 -1.9 8.5 -0.8 -4.6 2.3 -1.8 -19.3
VVVV 9.7 13.9 16.2 -26.1 6.7 0.7 7.8 -0.7 2.8 13.1 7.8 -25.6
VIVIVIVI 4.9 -9.9 12.8 -33.1 7.4 0.6 8.7 -0.8 -2.3 -10.4 3.8 -32.6
VIIVIIVIIVII 5.9 -12.0 10.4 -7.6 6.3 -3.0 7.8 -1.9 -0.4 -9.3 2.4 -5.8
VIIIVIIIVIIIVIII 1.3 -11.8 11.2 -46.6 9.1 -3.1 11.1 -1.3 -7.1 -9.0 0.1 -45.9
IXIXIXIX 9.1 7.7 12.9 -15.9 10.4 -2.8 12.5 -1.3 -1.2 10.8 0.4 -14.8
Source: State Statistical Office and own calculations

Bulletin-Ministry of Finance of the Republic of Macedonia
26
Table 6. Prices growth rates (%) Table 6. Prices growth rates (%) Table 6. Prices growth rates (%) Table 6. Prices growth rates (%)
Consumer Price IndexConsumer Price IndexConsumer Price IndexConsumer Price Index
Re
tail
Pri
ce I
nd
ex
Re
tail
Pri
ce I
nd
ex
Re
tail
Pri
ce I
nd
ex
Re
tail
Pri
ce I
nd
ex
In
de
x o
f p
rod
uce
r In
de
x o
f p
rod
uce
r In
de
x o
f p
rod
uce
r In
de
x o
f p
rod
uce
r
pri
ces
for
ind
ust
ria
l p
rice
s fo
r in
du
stri
al
pri
ces
for
ind
ust
ria
l p
rice
s fo
r in
du
stri
al
pro
du
cts
pro
du
cts
pro
du
cts
pro
du
cts
To
tal
Fo
od
an
d n
on
-
alco
ho
lic
bev
erag
es
Alc
oh
oli
c b
ever
ages
,
tob
acco
Clo
thin
g a
nd
foo
twea
r H
ou
sin
g, w
ater
,
elec
tric
ity
, gas
an
d
oth
er f
uel
s
ho
use
ho
ld e
qu
ipm
ent
and
ro
uti
ne
mai
nte
nan
ce o
f th
e
ho
use
Hea
lth
Tra
nsp
ort
Co
mm
un
icat
ion
Rec
reat
ion
an
d
cult
ure
Ed
uca
tio
n
Res
tau
ran
ts a
nd
ho
tels
Mis
cell
aneo
us
go
od
s
and
ser
vic
es
2005200520052005 0.5 -1.2 7.5 2.2 0.8 -3.0 -3.0 7.5 0.0 0.2 1.0 1.5 -0.5 2.1 3.2
2006200620062006 2.9 1.9 23.8 0.8 4.7 -0.8 2.8 1.0 -6.0 3.3 1.1 2.8 7.4 3.9 7.3
2007200720072007 6.1 12.3 3.1 5.6 5.0 1.5 -2.0 6.0 -13.8 -1.1 0.2 9.5 2.7 2.6 2.6
2008200820082008 4.1 6.2 4.7 -0.5 12.8 3.6 -2.6 -4.9 -2.2 -1.0 2.2 6.6 0.1 6.7 10.3
2009200920092009 -0.8 -1.4 3.3 -0.1 5.2 0.6 3.0 -10.0 -3.5 -4.2 1.5 2.2 -0.1 -1.4 -6.5
2010201020102010 1.6 0.3 0.6 0.8 7.0 0.3 0.9 6.8 -1.9 0.6 -3.0 -0.2 0.7 2.6 8.3
2011201120112011 3.9 6.2 1.0 1.4 5.0 0.9 3.8 5.3 -1.7 -0.9 -5.7 1.9 2.4 4.0 11.1
2012201220122012 3.3 2.3 0.2 5.4 9.2 0.6 3.0 6.3 -4.2 -1.4 3.6 3.1 3.4 3.3 4.6
2013201320132013 2.8 3.4 4.0 7.0 1.0 1.9 8.4 -0.7 -1.0 -2.1 6.6 4.1 2.7 1.3 0.4
2013 Q2013 Q2013 Q2013 Q----1111 3.5 3.4 0.6 10.5 5.0 2.2 6.5 1.1 -4.3 -2.6 10.2 4.4 4.2 1.7 2.9
QQQQ----2222 3.6 5.0 4.1 7.2 3.1 1.8 7.1 -1.6 -1.4 -2.9 10.2 4.2 2.6 1.4 0.9
QQQQ----3333 2.8 4.0 6.1 6.7 -2.0 2.1 8.1 0.0 1.0 -2.0 6.8 4.2 2.5 1.5 0.1
QQQQ----4444 1.3 1.2 6.0 3.9 -2.6 1.4 11.7 -1.3 0.8 -0.9 0.2 3.7 1.8 0.6 -2.2
2014 Q2014 Q2014 Q2014 Q----1111 0.6 0.6 5.4 0.4 -2.2 -0.4 12.1 -1.2 2.3 -0.8 0.2 -0.8 1.9 0.2 -2.2
QQQQ----2222 -0.9 -2.5 2.7 1.4 -1.6 -1.5 10.0 0.4 -1.1 -3.6 0.2 -1.7 1.8 -1.2 -0.9
QQQQ----3 3 3 3 -0.3 -0.8 1.5 0.6 1.4 -1.2 6.1 1.5 -1.3 -1.6 0.1 -0.3 0.5 -0.9 0.3
2013 I2013 I2013 I2013 I 3.8 3.6 0.8 11.1 5.3 1.9 5.8 1.8 -3.0 -2.1 10.1 5.3 4.7 2.4 4.8
IIIIIIII 3.5 3.3 0.6 10.7 5.6 2.7 5.8 1.8 -5.2 -2.6 10.2 3.8 4.1 1.8 2.9
IIIIIIIIIIII 3.1 3.3 0.4 9.7 4.3 2.0 8.0 -0.3 -4.9 -3.1 10.2 4.1 3.8 1.0 1.1
IVIVIVIV 3.3 4.8 3.0 7.2 3.9 1.7 7.7 -3.1 -3.1 -3.2 10.2 4.0 2.5 0.9 1.2
VVVV 3.4 4.9 3.4 7.4 3.8 1.7 6.8 -3.5 -2.1 -3.0 10.2 4.3 2.6 0.9 0.7
VIVIVIVI 4.0 5.3 5.8 6.9 1.5 1.9 6.7 1.9 1.1 -2.6 10.2 4.3 2.7 2.3 0.8
VIIVIIVIIVII 4.0 5.3 5.8 6.9 1.5 1.9 6.7 1.9 1.1 -2.6 10.2 4.3 2.7 2.5 2.9
VIIIVIIIVIIIVIII 2.8 4.9 6.0 6.8 -4.3 2.5 5.5 0.0 1.1 -2.2 10.2 4.2 2.6 1.3 -1.4
IXIXIXIX 1.6 1.8 6.4 6.2 -3.2 2.0 12.0 -1.8 0.8 -1.2 0.1 4.2 2.1 0.7 -1.3
XXXX 1.3 1.0 6.1 5.6 -2.6 1.2 12.1 -1.3 0.8 -0.7 0.1 4.3 1.7 0.7 -2.0
XIXIXIXI 1.1 0.9 6.2 3.5 -2.7 1.8 11.4 -1.5 0.9 -1.0 0.2 3.9 1.9 0.4 -2.6
XIIXIIXIIXII 1.3 1.7 5.8 2.6 -2.6 1.3 11.5 -1.0 0.9 -0.9 0.2 3.0 1.7 0.7 -2.1
2014 I2014 I2014 I2014 I1)1)1)1) 0.9 1.0 5.3 0.4 -2.3 0.6 13.0 0.1 0.8 -0.8 0.2 0.4 1.9 0.8 -2.3
IIIIIIII 0.6 0.7 5.5 0.2 -2.6 -0.8 13.1 -1.4 3.9 -1.0 0.2 -1.2 2.0 0.4 -2.6
IIIIIIIIIIII 0.2 0.1 5.5 0.5 -1.7 -1.1 10.2 -2.3 2.1 -0.5 0.2 -1.8 2.0 -0.7 -1.6
IVIVIVIV -1.1 -2.7 2.8 0.9 -1.8 -1.2 9.9 -1.7 0.2 -1.3 0.2 -1.7 2.0 -1.5 -1.8
VVVV -0.6 -2.0 2.5 1.7 -1.5 -1.6 9.3 1.6 0.0 -4.1 0.2 -2.3 1.4 -0.7 -0.2
VIVIVIVI -1.1 -3.0 2.7 1.5 -1.5 -1.7 10.9 1.2 -3.4 -5.4 0.2 -1.2 1.8 -1.4 -0.7
VIIVIIVIIVII 0.3 -1.5 4.1 1.4 3.1 -2.2 10.9 2.3 -3.4 -5.3 0.2 -1.1 1.6 0.0 -0.7
VIIIVIIIVIIIVIII -0.5 -2.1 4.0 0.8 1.5 -3.2 9.7 -0.3 -2.8 -5.2 0.2 -1.3 1.2 -0.8 0.4
IXIXIXIX -0.7 -1.1 3.6 0.4 0.5 -1.9 2.5 -2.7 -2.4 -5.7 0.2 -1.4 1.4 -1.8 1.3
Source: State Statistical Office.
1) As of January 2014 Consumer Price Index according to COICOP classification

Bulletin-Ministry of Finance of the Republic of Macedonia
27
Table 7. Stock exchange prices of main import and export products (US$/mt)Table 7. Stock exchange prices of main import and export products (US$/mt)Table 7. Stock exchange prices of main import and export products (US$/mt)Table 7. Stock exchange prices of main import and export products (US$/mt)
Brant Brant Brant Brant crude crude crude crude
oiloiloiloil
Lamb Lamb Lamb Lamb ($/kg)($/kg)($/kg)($/kg)
NickelNickelNickelNickel CopperCopperCopperCopper LeadLeadLeadLead ZincZincZincZinc
2002200220022002 25.0 3.3 1,559.5 452.7 6,771.8 778.8
2003200320032003 28.9 3.9 1,779.1 515.0 9,629.5 827.7
2004200420042004 38.3 4.6 2,865.9 886.5 13,823.2 1,047.8
2005200520052005 54.4 4.4 3,678.9 976.4 14,744.0 1,381.3
2006200620062006 65.4 4.0 6,722.1 1,289.7 24,254.4 3,275.3
2007200720072007 72.7 4.1 7,118.2 2,580.0 37,229.8 3,242.4
2008200820082008 97.6 4.6 6,955.9 2,090.7 21,110.6 1,874.7
2009200920092009 61.9 4.3 5,149.7 1,719.3 14,654.6 1,655.1
2010201020102010 79.6 5.3 7,534.8 2,148.4 21,808.9 2,160.7
2011201120112011 110.9 6.6 8,828.2 2,400.8 22,910.4 2,193.9
2012201220122012 112.0 6.1 7,962.3 2,064.6 17,547.5 1,950.4
2013201320132013 108.9 5.7 7,332.0 2,140.0 15,032.0 1,910.0
2013 I2013 I2013 I2013 I 113.0 5.8 8,047.4 2,333.7 17,472.5 2,032.2
IIIIIIII 116.5 5.5 8,060.9 2,365.8 17,690.1 2,128.7
IIIIIIIIIIII 109.2 5.4 7,645.6 2,169.4 16,724.9 1,926.1
IVIVIVIV 102.9 5.4 7,234.3 2,027.4 15,673.0 1,856.0
VVVV 103.0 5.4 7,249.4 2,033.0 14,948.0 1,831.6
VIVIVIVI 103.1 5.5 7,000.2 2,099.7 14,280.3 1,839.0
VIIVIIVIIVII 107.7 5.4 6,906.6 2,047.7 13,750.3 1,837.6
VIIIVIIIVIIIVIII 111.0 5.5 7,192.9 2,174.2 14,314.9 1,898.8
IXIXIXIX 111.6 5.8 7,159.3 2,084.9 13,801.4 1,846.9
XXXX 109.5 6.0 7,203.0 2,115.4 14,117.7 1,884.8
XIXIXIXI 108.1 6.0 7,070.7 2,089.6 13,684.0 1,866.4
XIIXIIXIIXII 110.7 6.1 7,214.9 2,136.7 13,924.6 1,975.0
2014 I2014 I2014 I2014 I 107.4 6.2 7,291.5 2,143.2 14,101.3 2,036.9
IIIIIIII 108.8 6.4 7,149.2 2,108.0 14,203.6 2,034.5
IIIIIIIIIIII 107.4 6.4 6,650.0 2,053.1 15,678.1 2,007.9
IVIVIVIV 107.8 6.5 6,674.0 2,087.0 17,374.0 2,027.0
VVVV 109.7 6.8 6,891.1 2,097.3 19,401.1 2,059.0
VIVIVIVI 111.9 6.9 6,821.1 2,106.9 18,628.8 2,128.1
VIIVIIVIIVII 107.0 6.7 7,113.4 2,193.2 19,117.7 2,310.6
VIIIVIIIVIIIVIII 101.9 6.4 7,001.8 2,236.8 18,600.2 2,327.0
IXIXIXIX 97.3 6.3 6.872,2 2,117.2 18,034.8 2,294.6
Source: World Development Prospects (Pink Sheets)

Bulletin-Ministry of Finance of the Republic of Macedonia
28
Table 8. Balance of Payments of the Republic of Macedonia (EUR million)Table 8. Balance of Payments of the Republic of Macedonia (EUR million)Table 8. Balance of Payments of the Republic of Macedonia (EUR million)Table 8. Balance of Payments of the Republic of Macedonia (EUR million)
2003200320032003 2004200420042004 2005200520052005 2006200620062006 2007200720072007 2008200820082008 2009200920092009 2010201020102010 2011201120112011 2012201220122012 2013201320132013 I 2014I 2014I 2014I 2014 II 2014II 2014II 2014II 2014 III 2014III 2014III 2014III 2014 IV 2014IV 2014IV 2014IV 2014 V 2014V 2014V 2014V 2014 VI 2014VI 2014VI 2014VI 2014 VII 2014VII 2014VII 2014VII 2014 VIII 2014VIII 2014VIII 2014VIII 2014
I. Current accountI. Current accountI. Current accountI. Current account -169.8-169.8-169.8-169.8 -361.8-361.8-361.8-361.8 -122.5-122.5-122.5-122.5 -23.4-23.4-23.4-23.4 -421.2-421.2-421.2-421.2 -862.2-862.2-862.2-862.2 -457.1-457.1-457.1-457.1 -144.0-144.0-144.0-144.0 -189.2-189.2-189.2-189.2 -225.7-225.7-225.7-225.7 -147.2-147.2-147.2-147.2 -23.7-23.7-23.7-23.7 -48.9-48.9-48.9-48.9 -45.5-45.5-45.5-45.5 -115.9-115.9-115.9-115.9 -6.6-6.6-6.6-6.6 20.320.320.320.3 15.215.215.215.2 55.155.155.155.1
Credit 1,880.41,880.41,880.41,880.4 2,075.52,075.52,075.52,075.5 2,655.52,655.52,655.52,655.5 3,146.13,146.13,146.13,146.1 3,869.73,869.73,869.73,869.7 4,098.74,098.74,098.74,098.7 3,459.63,459.63,459.63,459.6 4,294.64,294.64,294.64,294.6 5,152.95,152.95,152.95,152.9 5,225.55,225.55,225.55,225.5 5,298.35,298.35,298.35,298.3 385.7385.7385.7385.7 403.5403.5403.5403.5 427.4427.4427.4427.4 458.6458.6458.6458.6 496.3 473.7 544.1 508.7
Debit 2,050.22,050.22,050.22,050.2 2,437.32,437.32,437.32,437.3 2,778.02,778.02,778.02,778.0 3,169.43,169.43,169.43,169.4 4,290.84,290.84,290.84,290.8 4,960.94,960.94,960.94,960.9 3,916.73,916.73,916.73,916.7 4,438.64,438.64,438.64,438.6 5,342.15,342.15,342.15,342.1 5,451.25,451.25,451.25,451.2 5,445.55,445.55,445.55,445.5 409.5409.5409.5409.5 452.5452.5452.5452.5 473.0473.0473.0473.0 574.5574.5574.5574.5 502.8 453.4 528.9 453.5
Goods and servicesGoods and servicesGoods and servicesGoods and services -756.8-756.8-756.8-756.8 -954.9-954.9-954.9-954.9 -881.0-881.0-881.0-881.0 -974.9-974.9-974.9-974.9 -1,144.4-1,144.4-1,144.4-1,144.4 -1,745.6-1,745.6-1,745.6-1,745.6 -1,537.2-1,537.2-1,537.2-1,537.2 -1,400.1-1,400.1-1,400.1-1,400.1 -1,545.7-1,545.7-1,545.7-1,545.7 -1,700.2-1,700.2-1,700.2-1,700.2 -1,495.6-1,495.6-1,495.6-1,495.6 -111.4-111.4-111.4-111.4 -122.7-122.7-122.7-122.7 -131.2-131.2-131.2-131.2 -223.8-223.8-223.8-223.8 -138.9-138.9-138.9-138.9 -90.6-90.6-90.6-90.6 -134.4-134.4-134.4-134.4 -84.5-84.5-84.5-84.5
Credit 1,146.4 1,340.4 1,686.1 2,020.7 2,631.9 2,878.9 2,143.6 2,728.8 3,441.3 3,368.6 3,525.1 268.2 296.6 308.0 318.8 327.5 329.7 360.1 333.3
Debit 1,903.2 2,295.2 2,567.1 2,995.7 3,776.3 4,624.5 3,680.8 4,128.8 4,987.0 5,068.8 5,020.7 379.5 419.3 439.2 542.6 466.4 420.3 494.5 417.8
GoodsGoodsGoodsGoods -891.4 -1,052.8 -996.9 -1,127.6 -1,354.1 -1,933.6 -1,742.5 -1,532.0 -1,904.9 -2,008.1 -1,858.5 -147.5 -159.3 -164.7 -172.3 -159.6-159.6-159.6-159.6 -119.2-119.2-119.2-119.2 -180.3-180.3-180.3-180.3 -143.5-143.5-143.5-143.5
Credit 671.9 839.8 1,132.4 1,418.2 1,866.1 2,022.2 1,350.9 1,981.3 2,396.5 2,303.9 2,383.2 178.0 199.4 211.4 217.3 237.6 230.9 238.8 210.6
Debit /2 1,563.3 1,892.6 2,129.3 2,545.8 3,220.2 3,955.8 3,093.4 3,513.3 4,301.3 4,312.0 4,241.6 325.4 358.7 376.0 389.6 397.2 350.1 419.1 354.1
ServicesServicesServicesServices 134.5134.5134.5134.5 98.098.098.098.0 115.8115.8115.8115.8 152.7152.7152.7152.7 209.7209.7209.7209.7 188.0188.0188.0188.0 205.3205.3205.3205.3 132.0132.0132.0132.0 359.2359.2359.2359.2 307.8307.8307.8307.8 362.9362.9362.9362.9 36.136.136.136.1 36.636.636.636.6 33.533.533.533.5 -51.5-51.5-51.5-51.5 20.820.820.820.8 28.628.628.628.6 45.945.945.945.9 59.059.059.059.0
Credit 474.5 500.6 553.7 602.5 765.7 856.8 792.7 747.5 1,044.9 1,064.7 1,141.9 90.2 97.2 96.7 101.5 89.9 98.8 121.3 122.7
Debit 340.0 402.6 437.9 449.8 556.1 668.7 587.4 615.5 685.7 756.9 779.0 54.1 60.6 63.2 153.0 69.2 70.2 75.4 63.8
Primary incomePrimary incomePrimary incomePrimary income -53.5 -30.1 -88.1 -21.2 -280.8 -94.4 -47.3 -99.7 -131.0 -147.6 -182.4 -13.3 -17.6 -16.7 -14.2 -16.8-16.8-16.8-16.8 -16.9-16.9-16.9-16.9 -15.5-15.5-15.5-15.5 -18.8-18.8-18.8-18.8
Credit 52.5 67.2 78.0 105.5 152.4 181.3 128.9 146.7 161.4 162.9 151.1 11.4 10.2 10.6 11.2 10.2 10.4 12.6 9.7
Debit 106.0 97.3 166.1 126.6 433.2 275.7 176.1 246.4 292.5 310.5 333.5 24.7 27.8 27.3 25.4 27.0 27.3 28.1 28.5
Secondary incomeSecondary incomeSecondary incomeSecondary income 640.5640.5640.5640.5 623.2623.2623.2623.2 846.6846.6846.6846.6 972.7972.7972.7972.7 1,004.11,004.11,004.11,004.1 977.8977.8977.8977.8 1,127.41,127.41,127.41,127.4 1,355.81,355.81,355.81,355.8 1,487.51,487.51,487.51,487.5 1,622.11,622.11,622.11,622.1 1,530.71,530.71,530.71,530.7 100.9100.9100.9100.9 91.491.491.491.4 102.4102.4102.4102.4 122.1122.1122.1122.1 149.1149.1149.1149.1 127.9127.9127.9127.9 165.0165.0165.0165.0 158.4158.4158.4158.4
Credit 681.5 667.9 891.4 1,019.9 1,085.5 1,038.5 1,187.2 1,419.1 1,550.1 1,694.0 1,622.1 106.2 96.8 108.8 128.6 158.5 133.7 171.4 165.6
Debit 41.0 44.7 44.8 47.1 81.4 60.7 59.8 63.3 62.6 71.9 91.3 5.3 5.4 6.5 6.5 9.4 5.8 6.4 7.2
II. Capital accountII. Capital accountII. Capital accountII. Capital account -0.1-0.1-0.1-0.1 0.00.00.00.0 0.00.00.00.0 0.00.00.00.0 4.04.04.04.0 -10.6-10.6-10.6-10.6 10.910.910.910.9 3.33.33.33.3 -2.5-2.5-2.5-2.5 9.09.09.09.0 9.09.09.09.0 2.02.02.02.0 0.30.30.30.3 0.20.20.20.2 0.00.00.00.0 1.31.31.31.3 0.10.10.10.1 -0.6-0.6-0.6-0.6 0.00.00.00.0
Credit 0.0 0.0 0.0 0.0 0.0 0.0 3.2 2.8 -4.3 9.6 9.3 2.0 0.3 0.2 0.0 1.7 0.1 0.0 0.0
Debit 0.1 0.0 0.0 0.0 -4.0 10.6 -7.7 -0.5 -1.8 0.6 0.2 0.0 0.0 0.0 0.0 0.4 0.0 0.6 0.0
-169.9-169.9-169.9-169.9 -361.8 -122.4 -23.4 -417.1 -872.8 -446.2 -140.6 -191.7 -216.6 -138.2 -21.8 -48.6 -45.4 -115.9 -5.2-5.2-5.2-5.2 20.420.420.420.4 14.614.614.614.6 55.155.155.155.1
III. Financial accountIII. Financial accountIII. Financial accountIII. Financial account -194.0-194.0-194.0-194.0 -347.1-347.1-347.1-347.1 -127.7-127.7-127.7-127.7 -19.5-19.5-19.5-19.5 -457.0-457.0-457.0-457.0 -896.8-896.8-896.8-896.8 -419.1-419.1-419.1-419.1 -139.5-139.5-139.5-139.5 -179.4-179.4-179.4-179.4 -198.9-198.9-198.9-198.9 -112.1-112.1-112.1-112.1 -19.9-19.9-19.9-19.9 -44.6-44.6-44.6-44.6 -45.1-45.1-45.1-45.1 -112.3-112.3-112.3-112.3 0.60.60.60.6 19.619.619.619.6 14.514.514.514.5 56.156.156.156.1
Direct investmentDirect investmentDirect investmentDirect investment -100.1-100.1-100.1-100.1 -259.7-259.7-259.7-259.7 -74.9-74.9-74.9-74.9 -344.7-344.7-344.7-344.7 -506.9-506.9-506.9-506.9 -409.4-409.4-409.4-409.4 -136.9-136.9-136.9-136.9 -156.9-156.9-156.9-156.9 -344.6-344.6-344.6-344.6 -117.3-117.3-117.3-117.3 -280.9-280.9-280.9-280.9 -24.1-24.1-24.1-24.1 -38.2-38.2-38.2-38.2 -43.4-43.4-43.4-43.4 -9.2-9.2-9.2-9.2 -25.3-25.3-25.3-25.3 -1.1-1.1-1.1-1.1 -20.3-20.3-20.3-20.3 -26.3-26.3-26.3-26.3
Net acquisition of financial assets 1.4 -10.2 41.2 2.8 24.9 7.9 54.5 72.0 25.7 143.7 29.5 3.1 4.2 2.1 23.0 -36.1 -17.3 -27.1 -13.8
Net incurrence of liabilities 101.5 249.5 116.1 347.4 531.7 417.3 191.4 228.9 370.3 261.0 310.4 27.2 42.3 45.5 32.2 -10.9 -16.2 -6.8 12.5
Portfolio investmentPortfolio investmentPortfolio investmentPortfolio investment -5.1 -8.6 -200.8 -72.7 -114.1 50.6 -104.0 57.9 76.4 -77.3 159.3 -7.0 1.1 6.0 0.8 1.91.91.91.9 5.25.25.25.2 -491.8-491.8-491.8-491.8 -1.7-1.7-1.7-1.7
Net acquisition of financial assets -0.3 0.8 -0.7 0.4 2.0 0.5 37.6 21.9 23.9 7.3 33.0 0.7 1.6 6.7 1.2 2.1 1.6 3.3 2.7
Net incurrence of liabilities 4.8 9.3 200.1 73.1 116.1 -50.1 141.7 -35.9 -52.5 84.6 -126.3 7.7 0.5 0.7 0.5 0.3 -3.6 495.1 4.4
0.00.00.00.0 0.00.00.00.0 0.00.00.00.0 0.00.00.00.0 0.00.00.00.0 0.00.00.00.0 0.00.00.00.0 0.00.00.00.0 0.00.00.00.0 0.00.00.00.0 0.00.00.00.0 0.00.00.00.0 0.00.00.00.0 0.00.00.00.0 0.00.00.00.0 0.00.00.00.0 0.00.00.00.0 0.00.00.00.0 0.00.00.00.0
Other investmentOther investmentOther investmentOther investment -127.4-127.4-127.4-127.4 -94.7-94.7-94.7-94.7 -199.8-199.8-199.8-199.8 101.5101.5101.5101.5 69.369.369.369.3 -462.8-462.8-462.8-462.8 -255.1-255.1-255.1-255.1 -102.2-102.2-102.2-102.2 -242.6-242.6-242.6-242.6 -146.7-146.7-146.7-146.7 53.553.553.553.5 35.535.535.535.5 -7.5-7.5-7.5-7.5 26.726.726.726.7 -68.0-68.0-68.0-68.0 4.24.24.24.2 69.269.269.269.2 23.823.823.823.8 19.519.519.519.5
Net acquisition of financial assets -8.3 -3.5 41.5 118.5 61.8 -205.8 97.8 151.7 390.9 93.7 67.6 307.7 12.1 18.9 62.7 -124.2 128.5 -83.5 73.9
Net incurrence of liabilities 119.1 91.2 241.4 17.0 -7.5 256.9 352.8 253.9 633.4 240.4 14.1 272.1 19.5 -7.7 130.7 -128.4 59.3 -107.3 54.4
Other equityOther equityOther equityOther equity 0.00.00.00.0 0.00.00.00.0 0.00.00.00.0 0.00.00.00.0 0.00.00.00.0 0.00.00.00.0 0.00.00.00.0 0.00.00.00.0 0.00.00.00.0 -0.2-0.2-0.2-0.2 0.00.00.00.0 0.00.00.00.0 0.00.00.00.0 0.00.00.00.0 0.00.00.00.0 0.00.00.00.0 0.00.00.00.0 0.00.00.00.0 0.00.00.00.0
Net acquisition of financial assets 0.0 0.0 0.0 0.0 0.0 0.0 0.0 0.0 0.0 -0.2 0.0 0.0 0.0 0.0 0.0 0.0 0.0 0.0 0.0
Net incurrence of liabilities 0.0 0.0 0.0 0.0 0.0 0.0 0.0 0.0 0.0 0.0 0.0 0.0 0.0 0.0 0.0 0.0 0.0 0.0 0.0
3.1.3. Валути и депозити 3.1.3. Валути и депозити 3.1.3. Валути и депозити 3.1.3. Валути и депозитиCurrency and depositsCurrency and depositsCurrency and depositsCurrency and deposits -16.9 -0.3 16.9 83.3 11.6 -221.7 52.8 160.8 220.2 103.5 245.0 17.7 12.4 13.7 60.7 -28.1-28.1-28.1-28.1 22.722.722.722.7 22.622.622.622.6 74.974.974.974.9
Net acquisition of financial assetsNet acquisition of financial assetsNet acquisition of financial assetsNet acquisition of financial assets -8.8 -2.4 37.1 123.6 62.2 -209.7 78.8 158.0 158.4 169.7 215.2 2.8 11.3 20.3 64.7 -22.7-22.7-22.7-22.7 23.623.623.623.6 16.016.016.016.0 74.774.774.774.7
Central bank -15.5 -23.2 0.0 5.7 0.2 -16.0 0.0 -0.6 -0.1 0.0 0.0 0.0 0.0 0.0 0.0 0.0 0.0 0.0 0.0
Deposit-taking corporations, except
central bank41.8 79.7 -5.7 50.9 -0.4 -236.8 76.8 69.5 25.0 -57.6 -2.0 -9.8 -7.0 -2.3 40.2 -47.6 -0.9 -5.3 61.5
General government 0.0 0.0 0.0 0.0 0.0 0.0 0.0 0.0 0.0 0.0 0.0 0.0 0.0 0.0 0.0 0.0 0.0 0.0 0.0
Other sectors -35.1 -58.9 42.7 67.0 62.3 43.2 2.0 89.1 133.5 227.3 217.2 12.6 18.3 22.6 24.5 24.8 24.5 21.3 13.2
Net incurrence of liabilitiesNet incurrence of liabilitiesNet incurrence of liabilitiesNet incurrence of liabilities 8.1 -2.1 20.1 40.3 50.6 12.1 26.0 -2.8 -61.9 66.2 -29.8 -14.9 -1.0 6.6 4.0 5.3 0.9 -6.5-6.5-6.5-6.5 -0.2-0.2-0.2-0.2
Central bank 0.0 0.0 0.0 0.0 0.0 0.0 0.0 0.0 0.0 0.0 0.0 0.0 0.0 0.0 0.0 0.00.00.00.0 0.00.00.00.0 0.0 0.0
Deposit-taking corporations, except
central bank 8.1 -2.1 20.1 40.3 50.6 12.1 26.0 -2.8 -61.9 66.2 -29.8 -14.9 -1.0 6.6 4.0 5.3 0.9 -6.5 -0.2
General government 0.0 0.0 0.0 0.0 0.0 0.0 0.0 0.0 0.0 0.0 0.0 0.0 0.0 0.0 0.0 0.0 0.0 0.0 0.0
Останати сектори 0.0 0.0 0.0 0.0 0.0 0.0 0.0 0.0 0.0 0.0 0.0 0.0 0.0 0.0 0.0 0.0 0.0 0.0 0.0
LoansLoansLoansLoans -49.8 -12.1 -98.0 5.7 93.9 -237.2 -50.8 -197.2 -503.1 -90.9 -320.1 17.0 -21.8 -8.6 -114.6 21.7 35.0 12.612.612.612.6 -53.2-53.2-53.2-53.2
Net acquisition of financial assets -1.3 -1.5 7.0 -6.0 0.0 4.7 19.1 -5.5 232.5 -75.6 -147.4 304.8 0.8 -1.4 -2.0 -101.5-101.5-101.5-101.5 104.9104.9104.9104.9 -99.5 -0.8
Net incurrence of liabilities 48.5 10.5 105.0 -11.7 -93.8 241.9 69.9 191.7 735.6 15.4 172.7 287.8 22.6 7.2 112.6 -123.2 69.8 -112.1 52.4
0.0 0.0 0.0 0.0 0.0 0.0 0.0 0.0 0.0 0.0 0.0 0.0 0.0 0.0 0.0 0.0 0.0 0.00.00.00.0 0.00.00.00.0
Trade credit and advancesTrade credit and advancesTrade credit and advancesTrade credit and advances -67.4 -71.0 -105.9 17.4 22.7 4.4 -169.1 -65.6 40.3 -158.9 128.8 0.8 2.0 21.5 -14.0 10.610.610.610.6 11.411.411.411.4 -11.4-11.4-11.4-11.4 -2.2-2.2-2.2-2.2
Net acquisition of financial assets 0.0 0.0 0.0 0.0 0.0 0.0 0.0 -0.7 0.0 0.0 0.0 0.0 0.0 0.0 0.0 0.00.00.00.0 0.00.00.00.0 0.0 0.0
Net incurrence of liabilities 67.4 71.0 105.9 -17.4 -22.7 -4.4 169.1 64.9 -40.3 158.9 -128.8 -0.8 -2.0 -21.5 14.0 -10.6 -11.4 11.4 2.2
Other accounts receivable/payableOther accounts receivable/payableOther accounts receivable/payableOther accounts receivable/payable 6.7 -11.3 -12.9 -4.9 -58.8 -8.2 -25.2 -0.2 0.1 -0.1 -0.2 0.1 0.0 0.0 0.0 0.0 0.0 0.00.00.00.0 0.00.00.00.0
Net acquisition of financial assets 1.8 0.5 -2.6 0.8 -0.3 -0.8 -0.1 -0.2 0.1 -0.1 -0.2 0.1 0.0 0.0 0.0 0.00.00.00.0 0.00.00.00.0 0.0 0.0
Net incurrence of liabilities -4.9 11.7 10.3 5.8 58.5 7.4 25.1 0.0 0.0 0.0 0.0 0.0 0.0 0.0 0.0 0.0 0.0 0.0 0.0
Special drawing rights (Net Special drawing rights (Net Special drawing rights (Net Special drawing rights (Net
incurrence of liabilities)incurrence of liabilities)incurrence of liabilities)incurrence of liabilities)0.0 0.0 0.0 0.0 0.0 0.0 62.8 0.0 0.0 0.0 0.0 0.0 0.0 0.0 0.0 0.0 0.0
0.00.00.00.0 0.00.00.00.0
Reserve assets /3Reserve assets /3Reserve assets /3Reserve assets /3 38.638.638.638.6 15.915.915.915.9 347.9347.9347.9347.9 296.4296.4296.4296.4 94.794.794.794.7 -75.3-75.3-75.3-75.3 76.976.976.976.9 61.761.761.761.7 331.3331.3331.3331.3 142.3142.3142.3142.3 -44.0-44.0-44.0-44.0 -24.3-24.3-24.3-24.3 -0.1-0.1-0.1-0.1 -34.4-34.4-34.4-34.4 -35.9-35.9-35.9-35.9 19.819.819.819.8 -53.6-53.6-53.6-53.6 502.8502.8502.8502.8 64.664.664.664.6
IV. Net errors and omissionsIV. Net errors and omissionsIV. Net errors and omissionsIV. Net errors and omissions -24.1-24.1-24.1-24.1 14.714.714.714.7 -5.3-5.3-5.3-5.3 3.83.83.83.8 -39.9-39.9-39.9-39.9 -24.0-24.0-24.0-24.0 27.127.127.127.1 1.11.11.11.1 12.312.312.312.3 17.717.717.717.7 26.126.126.126.1 1.81.81.81.8 4.04.04.04.0 0.30.30.30.3 3.63.63.63.6 5.85.85.85.8 -0.8-0.8-0.8-0.8 -0.1-0.1-0.1-0.1 0.90.90.90.9
Net-lending (+) / net-borrowing (-) (balance Net-lending (+) / net-borrowing (-) (balance Net-lending (+) / net-borrowing (-) (balance Net-lending (+) / net-borrowing (-) (balance
from current and capital account)from current and capital account)from current and capital account)from current and capital account)
Financial derivatives (other than reserves) Financial derivatives (other than reserves) Financial derivatives (other than reserves) Financial derivatives (other than reserves)
and employee stock optionsand employee stock optionsand employee stock optionsand employee stock options
guarantee schemes (F60)guarantee schemes (F60)guarantee schemes (F60)guarantee schemes (F60)
Source: National Bank of the Republic of Macedonia

Bulletin-Ministry of Finance of the Republic of Macedonia
29
Table 9.1. EXPORT Table 9.1. EXPORT Table 9.1. EXPORT Table 9.1. EXPORT ---- selected products acselected products acselected products acselected products according to SITC (EUR million)cording to SITC (EUR million)cording to SITC (EUR million)cording to SITC (EUR million)
Iro
n a
nd
ste
el
Iro
n a
nd
ste
el
Iro
n a
nd
ste
el
Iro
n a
nd
ste
el
Clo
thin
gC
loth
ing
Clo
thin
gC
loth
ing
Oil
an
d o
il
Oil
an
d o
il
Oil
an
d o
il
Oil
an
d o
il
pro
du
cts
pro
du
cts
pro
du
cts
pro
du
cts
To
ba
cco
an
d
To
ba
cco
an
d
To
ba
cco
an
d
To
ba
cco
an
d
tob
acc
o
tob
acc
o
tob
acc
o
tob
acc
o
pro
cess
ed
go
od
sp
roce
sse
d g
oo
ds
pro
cess
ed
go
od
sp
roce
sse
d g
oo
ds
Fru
it a
nd
F
ruit
an
d
Fru
it a
nd
F
ruit
an
d
ve
ge
tab
les
ve
ge
tab
les
ve
ge
tab
les
ve
ge
tab
les
Be
ve
rag
es
Be
ve
rag
es
Be
ve
rag
es
Be
ve
rag
es
No
nN
on
No
nN
on
-- -- me
tal
me
tal
me
tal
me
tal
min
era
l m
ine
ral
min
era
l m
ine
ral
pro
du
cts
pro
du
cts
pro
du
cts
pro
du
cts
Ele
ctri
cal
Ele
ctri
cal
Ele
ctri
cal
Ele
ctri
cal
ma
chin
es
an
d
ma
chin
es
an
d
ma
chin
es
an
d
ma
chin
es
an
d
spa
re p
art
ssp
are
pa
rts
spa
re p
art
ssp
are
pa
rts
Fo
otw
ea
rF
oo
twe
ar
Fo
otw
ea
rF
oo
twe
ar
Me
tal
pro
du
cts
Me
tal
pro
du
cts
Me
tal
pro
du
cts
Me
tal
pro
du
cts
Te
xti
le y
arn
sT
ex
tile
ya
rns
Te
xti
le y
arn
sT
ex
tile
ya
rns
Me
dic
al
an
dM
ed
ica
l a
nd
Me
dic
al
an
dM
ed
ica
l a
nd
ph
arm
ace
uti
cal
ph
arm
ace
uti
cal
ph
arm
ace
uti
cal
ph
arm
ace
uti
cal
pro
du
cts
pro
du
cts
pro
du
cts
pro
du
cts
Ro
ad
ve
hic
les
Ro
ad
ve
hic
les
Ro
ad
ve
hic
les
Ro
ad
ve
hic
les
Me
tal
ore
s a
nd
M
eta
l o
res
an
d
Me
tal
ore
s a
nd
M
eta
l o
res
an
d
me
tal
scru
bs
me
tal
scru
bs
me
tal
scru
bs
me
tal
scru
bs
2007200720072007 921.2 462.8 114.9 77 103 74 49.4 60.9 36.2 40.2 24.2 44.6 69.9 92.4
2008200820082008 870.6 485.5 204.8 83.8 112.8 65.0 78.4 61.1 62.0 70.6 38.2 51.6 23.9 151.4
2009200920092009 365.3 339.8 124.1 79.1 92.5 51.3 58.2 40.6 45.3 42.0 26.3 41.2 15.5 91.2
2010201020102010 589.2 424.4 164.9 93.5 137.3 60.0 54.8 36.4 56.7 42.4 42.6 57.8 22.4 153.5
2011201120112011 725.5 472.8 229.4 111.2 141.0 58.5 48.8 113.7 58.7 46.0 43.0 59.8 22.8 157.9
2012201220122012 649.0 465.1 160.5 114.5 136.5 70.8 42.9 103.8 52.1 46.0 46.6 65.0 28.6 163.7
2013201320132013 592.9 469.1 71.3 137.3 145.2 66.0 37.3 149.5 52.9 43.8 58.4 59.7 35.3 164.1
2013 Q2013 Q2013 Q2013 Q----1111 133.9 126.3 19.5 23.2 18.5 17.3 5.3 25.0 10.5 8.3 13.6 13.1 7.0 44.8
QQQQ----2222 157.0 101.1 17.5 40.2 42.2 14.2 9.6 32.8 13.5 8.4 14.5 17.3 7.7 42.2
QQQQ----3333 143.1 121.6 20.3 39.3 46.9 12.4 11.8 42.1 18.6 13.9 15.1 13.1 6.8 39.1
QQQQ----4444 158.8 120.1 13.9 34.7 37.6 22.1 10.6 49.6 10.4 13.3 15.2 16.4 13.9 38.0
2014 Q2014 Q2014 Q2014 Q----1111 131.7 132.7 9.6 14.0 23.6 15.5 7.5 65.5 9.7 8.8 14.2 13.4 19.8 37.3
QQQQ----2222 124.4 120.0 13.8 39.9 40.7 10.3 8.9 70.1 13.1 10.1 15.6 16.1 24.9 37.3
QQQQ----3333 139.3 128.4 17.5 34.5 51.7 12.6 10.6 93.4 18.9 18.4 13.0 14.3 19.6 38.5
2013 I2013 I2013 I2013 I 42.2 36.9 9.0 10.7 5.7 9.9 1.2 6.9 3.8 3.5 4.1 2.9 2.4 16.1
IIIIIIII 51.0 43.2 4.5 4.6 5.5 3.8 1.7 8.5 3.7 2.5 4.2 5.0 2.3 14.0
IIIIIIIIIIII 40.7 46.3 6.0 7.9 7.2 3.7 2.4 9.6 3.0 2.3 5.3 5.2 2.2 14.6
IVIVIVIV 62.1 33.3 6.6 9.2 12.9 4.6 3.4 11.8 3.6 3.1 5.5 6.4 2.2 14.9
VVVV 52.9 29.3 5.7 7.9 13.8 5.2 3.3 10.1 3.5 2.5 4.5 5.4 2.5 15.5
VIVIVIVI 42.1 38.6 5.2 23.1 15.6 4.3 3.0 10.9 6.4 2.7 4.5 5.4 3.0 11.8
VIIVIIVIIVII 59.2 52.0 8.1 26.1 14.6 3.9 4.7 16.0 5.2 4.2 6.2 5.0 2.3 14.2
VIIIVIIIVIIIVIII 36.1 33.3 7.2 3.0 14.4 4.7 3.5 10.2 8.1 3.8 3.9 4.0 2.5 12.3
IXIXIXIX 47.9 36.4 5.0 10.2 18.0 3.8 3.6 15.9 5.3 5.8 5.0 4.1 1.9 12.7
XXXX 54.3 35.5 5.1 9.6 17.3 5.9 4.4 16.7 3.4 5.2 4.7 5.1 3.0 13.7
XIXIXIXI 53.9 43.3 3.8 5.0 11.4 6.2 3.8 13.8 4.3 5.1 5.4 5.1 5.8 12.6
XIIXIIXIIXII 50.7 41.3 5.0 20.1 8.9 10.0 2.4 19.1 2.7 3.0 5.2 6.1 5.1 11.8
2014 I2014 I2014 I2014 I 29.8 40.6 3.4 3.5 6.4 9.6 2.0 16.8 3.0 2.5 4.4 3.6 6.5 12.6
IIIIIIII 55.6 41.6 2.8 3.1 8.3 2.8 3.0 23.2 3.0 3.0 4.6 4.5 5.8 11.3
IIIIIIIIIIII 46.2 50.4 3.5 7.4 8.9 3.1 2.5 25.5 3.6 3.4 5.3 5.3 7.5 13.3
IVIVIVIV 48.2 40.4 4.3 6.6 14.5 3.4 2.8 24.9 4.0 3.0 5.0 5.2 6.6 11.9
VVVV 48.5 39.1 4.4 10.5 12.6 3.5 3.1 23.3 5.0 3.6 5.9 4.9 10.0 12.7
VIVIVIVI 46.6 43.4 5.4 22.8 14.3 3.7 3.7 21.9 6.0 3.6 5.2 6.0 8.3 13.3
VIIVIIVIIVII 48.1 46.2 6.4 19.0 12.8 4.2 3.7 27.7 7.2 6.0 4.7 5.2 6.8 12.2
VIIIVIIIVIIIVIII 31.0 35.0 6.4 4.9 15.3 4.5 2.6 33.9 4.5 5.3 3.8 4.6 5.3 11.8
IXIXIXIX 44.3 44.3 4.5 10.6 23.5 3.8 3.6 31.8 5.3 7.1 4.5 4.4 7.5 14.5
Source: State Statistical Office

Bulletin-Ministry of Finance of the Republic of Macedonia
30
Table 9.2. IMPORT Table 9.2. IMPORT Table 9.2. IMPORT Table 9.2. IMPORT ---- selected products according to SITC (EUR million)selected products according to SITC (EUR million)selected products according to SITC (EUR million)selected products according to SITC (EUR million)
Oil
an
d o
il p
rod
uct
sO
il a
nd
oil
pro
du
cts
Oil
an
d o
il p
rod
uct
sO
il a
nd
oil
pro
du
cts
Iro
n a
nd
ste
elIr
on
an
d s
teel
Iro
n a
nd
ste
elIr
on
an
d s
teel
Tex
tile
ya
rns
Tex
tile
ya
rns
Tex
tile
ya
rns
Tex
tile
ya
rns
Ro
ad
veh
icle
sR
oa
d v
ehic
les
Ro
ad
veh
icle
sR
oa
d v
ehic
les
Ele
ctri
cal
mac
hin
es
Ele
ctri
cal
mac
hin
es
Ele
ctri
cal
mac
hin
es
Ele
ctri
cal
mac
hin
es
and
sp
are
pa
rts
and
sp
are
pa
rts
and
sp
are
pa
rts
and
sp
are
pa
rts
Ind
ust
rial
mac
hin
es
Ind
ust
rial
mac
hin
es
Ind
ust
rial
mac
hin
es
Ind
ust
rial
mac
hin
es
and
sp
are
pa
rts
and
sp
are
pa
rts
and
sp
are
pa
rts
and
sp
are
pa
rts
Mea
t an
d m
eat
Mea
t an
d m
eat
Mea
t an
d m
eat
Mea
t an
d m
eat
pr
pr
prpr o
cess
ed p
rod
uct
so
cess
ed p
rod
uct
so
cess
ed p
rod
uct
so
cess
ed p
rod
uct
s
Sp
ecia
l in
du
stry
S
pec
ial
ind
ust
ry
Sp
ecia
l in
du
stry
S
pec
ial
ind
ust
ry
mac
hin
esm
ach
ines
mac
hin
esm
ach
ines
Pap
er a
nd
pa
per
P
aper
an
d p
ap
er
Pap
er a
nd
pa
per
P
aper
an
d p
ap
er
pro
du
cts
pro
du
cts
pro
du
cts
pro
du
cts
Pre
par
atio
n o
f n
on
Pre
par
atio
n o
f n
on
Pre
par
atio
n o
f n
on
Pre
par
atio
n o
f n
on
-- --
met
al m
iner
als
met
al m
iner
als
met
al m
iner
als
met
al m
iner
als
Clo
thin
gC
loth
ing
Clo
thin
gC
loth
ing
Fru
it a
nd
veg
etab
les
Fru
it a
nd
veg
etab
les
Fru
it a
nd
veg
etab
les
Fru
it a
nd
veg
etab
les
Wh
eat
and
wh
eat
Wh
eat
and
wh
eat
Wh
eat
and
wh
eat
Wh
eat
and
wh
eat
pro
du
cts
pro
du
cts
pro
du
cts
pro
du
cts
Dai
ry p
rod
uct
s an
d
Dai
ry p
rod
uct
s an
d
Dai
ry p
rod
uct
s an
d
Dai
ry p
rod
uct
s an
d
egg
seg
gs
egg
seg
gs
2007200720072007 459.0 396.4 309.3 232.1 113.2 99.7 86.9 100.8 76.0 67.7 55.8 45.9 69.2 26.4
2008200820082008 626.9 505.2 316.2 302.2 131.6 139.7 94.9 105.9 89.2 82.1 60.2 52.6 79.7 29.1
2009200920092009 444.1 215.4 277.3 212.5 130.2 123.2 101.0 87.5 81.6 80.7 53.4 50.3 58.7 29.9
2010201020102010 563.5 267.2 305.1 280.3 141.7 97.4 94.8 82.4 85.4 96.3 48.8 50.7 59.7 33.2
2222011011011011 758.1 313.9 341.3 250.5 181.5 137.5 111.2 77.2 95.2 118.6 47.8 56.9 75.1 40.4
2012201220122012 746.4 288.1 341.6 211.9 158.7 130.5 124.6 84.0 94.1 127.2 55.7 60.3 90.5 43.7
2013201320132013 560.3 274.5 361.6 190.7 197.2 149.8 127.6 89.2 96.4 142.1 54.6 63.1 73.4 44.3
2012 2012 2012 2012 QQQQ----1111 198.7 54.9 68.5 56.5 30.8 26.7 25.2 17.9 21.2 23.2 10.0 16.8 23.2 8.6
QQQQ----2222 148.4 84.7 93.0 50.4 38.8 35.9 31.7 24.1 25.6 37.1 11.4 12.9 26.4 12.8
QQQQ----3333 179.9 75.5 72.8 44.6 43.6 31.2 35.1 22.8 22.8 34.5 12.4 11.7 17.5 12.3
QQQQ----4444 219.4 73.1 107.3 60.4 45.4 36.7 32.6 19.2 24.5 32.4 21.9 18.8 23.4 10.0
2013 Q2013 Q2013 Q2013 Q----1111 115.9 75.9 73.5 44.4 41.3 33.5 26.9 17.9 21.6 26.0 12.3 17.0 17.4 8.2
QQQQ----2222 139.5 73.4 96.0 49.0 48.1 45.7 31.7 28.2 24.7 39.7 13.2 16.0 21.6 13.0
QQQQ----3333 159.8 61.2 81.9 48.9 51.0 35.2 36.1 22.6 24.5 39.4 13.4 11.3 14.4 12.3
QQQQ----4444 145.0 64.1 110.3 48.4 56.8 35.4 33.0 20.5 25.7 37.0 15.7 18.8 20.0 10.8
2014 Q2014 Q2014 Q2014 Q----1111 122.1 61.9 84.9 48.3 58.2 32.8 26.7 18.4 21.2 37.3 13.4 19.8 19.7 10.1
QQQQ----2222 134.8 56.1 110.9 54.8 73.1 44.6 28.1 25.9 26.7 50.8 14.0 16.7 17.9 11.3
QQQQ----3333 152.7 78.3 87.0 60.5 77.2 37.3 31.3 26.9 24.3 47.6 16.6 12.8 18.2 11.8
2013 I2013 I2013 I2013 I 53.6 26.4 25.2 12.9 12.0 8.6 10.5 3.4 6.5 7.3 2.8 6.0 5.1 2.7
IIIIIIII 23.6 29.9 24.0 16.7 12.0 13.3 7.6 6.0 6.8 8.2 4.3 5.0 5.8 2.4
IIIIIIIIIIII 38.8 19.6 24.3 14.8 17.3 11.5 8.8 8.5 8.3 10.4 5.2 6.1 6.5 3.1
IVIVIVIV 46.5 25.9 29.3 17.7 19.3 17.8 12.0 10.0 8.1 13.3 5.2 6.8 7.6 4.7
VVVV 46.3 27.7 34.2 15.4 13.8 15.0 10.1 11.7 8.4 12.9 4.5 4.9 6.6 4.7
VIVIVIVI 46.8 19.8 32.5 15.9 15.0 12.9 9.6 6.5 8.2 13.5 3.5 4.2 7.4 3.6
VIIVIIVIIVII 63.4 22.7 32.9 17.4 21.2 15.0 14.1 9.5 8.6 14.2 3.6 4.5 4.7 4.7
VIIIVIIIVIIIVIII 52.6 18.2 19.9 14.1 12.8 10.8 11.6 5.3 7.5 13.3 4.1 3.2 4.2 4.1
IXIXIXIX 43.8 20.3 29.1 17.4 17.0 9.3 10.3 7.7 8.4 11.9 5.7 3.6 5.5 3.5
XXXX 53.0 23.1 35.6 15.3 18.8 10.8 11.9 7.6 8.2 13.6 6.2 5.1 6.4 3.8
XIXIXIXI 43.4 22.3 39.3 14.6 18.8 11.9 9.6 5.6 8.7 11.8 5.0 6.3 6.8 3.3
XIIXIIXIIXII 48.7 18.7 35.4 18.5 19.2 12.8 11.5 7.3 8.8 11.6 4.4 7.4 6.8 3.7
2014 I2014 I2014 I2014 I 38.1 15.5 25.0 13.6 16.6 8.4 9.0 4.6 5.6 9.9 3.3 6.7 5.0 3.5
IIIIIIII 38.0 20.7 28.3 17.3 20.6 11.7 7.8 5.2 7.1 12.1 4.0 6.8 6.4 2.7
IIIIIIIIIIII 45.9 25.7 31.5 17.4 21.1 12.7 9.9 8.6 8.5 15.3 6.1 6.4 8.4 3.9
IVIVIVIV 45.9 22.9 33.3 18.4 23.8 14.3 10.0 8.6 8.3 15.4 5.0 6.8 6.8 3.7
VVVV 46.2 19.0 39.8 18.8 27.0 17.2 8.8 9.2 9.4 18.0 4.7 5.6 6.0 3.7
VIVIVIVI 45.9 15.1 38.2 17.7 22.4 13.2 9.6 8.1 9.2 17.4 4.3 4.3 5.1 3.9
VIIVIIVIIVII 54.5 24.9 32.9 22.7 28.0 14.4 11.1 11.6 8.4 15.3 3.9 4.7 7.5 4.6
VIIIVIIIVIIIVIII 50.4 23.5 22.8 14.6 20.7 11.8 10.7 7.3 7.1 16.2 4.8 3.4 5.1 3.7
IXIXIXIX 47.3 28.6 31.3 23.1 28.4 11.1 9.4 8.0 8.7 16.1 7.9 4.7 5.5 3.5
Source: State Statistical Office

Bulletin-Ministry of Finance of the Republic of Macedonia
31
Table 10. Foreign Direct Investments in the Republic of Macedonia by selected countries (EUR million)Table 10. Foreign Direct Investments in the Republic of Macedonia by selected countries (EUR million)Table 10. Foreign Direct Investments in the Republic of Macedonia by selected countries (EUR million)Table 10. Foreign Direct Investments in the Republic of Macedonia by selected countries (EUR million)
CountriesCountriesCountriesCountries Total Total Total Total AustriaAustriaAustriaAustria FranceFranceFranceFrance GermanyGermanyGermanyGermany GreeceGreeceGreeceGreece HungaryHungaryHungaryHungary ItalyItalyItalyItaly The The The The
NetherlandsNetherlandsNetherlandsNetherlands SloveniaSloveniaSloveniaSlovenia SwitzerlandSwitzerlandSwitzerlandSwitzerland TurkeyTurkeyTurkeyTurkey
Great Great Great Great
BritainBritainBritainBritain SerbiaSerbiaSerbiaSerbia
2003200320032003 100.4 7.5 4.6 5.2 8.8 3.8 0.4 8.6 5.9 18.7 10.0 1.5 7.1
2004200420042004 260.7 16.7 4.5 8.0 40.3 4.5 13.3 34.7 0.4 5.9 27.4 4.0 5.4
2005200520052005 77.2 -6.7 -3.2 -0.4 17.6 -3.8 10.6 12.2 5.2 8.8 17.4 0.3 0.1
2006200620062006 344.8 130.9 0.0 0.6 40.7 0.8 4.9 14.7 15.2 10.5 21.3 3.9 12.1
2007200720072007 506.0 10.8 28.5 9.3 44.6 73.0 6.8 26.5 54.1 60.0 30.9 2.0 40.5
2008200820082008 399.9 95.7 -2.0 4.0 6.7 -8.7 4.8 2.3 3.4 79.2 24.8 -1.5 38.0
2009200920092009 145.0 30.1 -1.4 2.9 -57.2 -23.6 3.0 65.1 -1.3 134.1 4.6 4.4 -45.8
2010201020102010 160.5 -10.6 84.5 11.9 15.2 -39.0 1.6 0.5 1.3 19.7 -41.2 15.5 31.6
2011201120112011 344.4 48.1 2.6 10.7 14.8 -0.3 9.6 136.6 -5.1 19.1 -5.8 77.1 -59.3
2012201220122012 111.2 47.7 0.9 12.1 2.1 -0.1 2.1 8.1 -0.6 8.8 -15.0 23.5 0.5
2013201320132013 252.2 56.3 2.5 32.0 -1.1 -22.0 5.7 37.1 -0.4 38.0 -8.5 22.8 45.1
2011 Q2011 Q2011 Q2011 Q----1111 197.9 9.5 1.5 6.0 4.7 0.4 2.3 93.4 -1.3 5.4 -1.4 15.6 28.1
QQQQ----2222 -6.4 -4.4 -0.9 1.5 3.4 -1.5 1.8 15.3 -1.6 2.0 -0.9 6.2 -56.9
QQQQ----3333 43.9 -6.0 1.9 1.9 3.2 0.5 2.7 14.1 -1.6 -0.6 -0.5 31.0 -14.2
QQQQ----4444 108.9 49.0 0.1 1.4 3.5 0.3 2.8 13.8 -0.6 12.2 -3.0 24.3 -16.3
2012 Q2012 Q2012 Q2012 Q----1111 82.4 24.0 1.1 1.7 3.2 12.6 0.3 15.4 0.0 1.2 4.3 3.4 -14.1
QQQQ----2222 -1.7 -13.4 -3.6 1.4 -10.0 -37.5 0.1 12.0 0.4 -6.3 2.1 13.1 20.2
QQQQ----3333 -21.6 29.7 -0.8 7.2 -11.9 12.3 -0.1 -33.6 1.4 -2.3 -21.3 5.6 -18.4
QQQQ----4444 52.1 7.4 4.3 1.7 20.8 12.5 1.8 14.2 -2.4 16.2 -0.2 1.4 12.7
2013 2013 2013 2013 QQQQ----1111 83.3 8.6 -1.1 4.5 2.0 5.8 0.5 18.6 -0.3 7.5 10.3 2.7 4.9
QQQQ----2222 32.9 22.6 0.1 4.9 -4.1 -38.7 2.3 15.5 -0.8 3.4 -12.6 8.2 32.4
QQQQ----3333 78.0 13.7 2.9 11.7 -2.1 5.3 1.7 -1.3 2.5 10.4 5.0 6.9 5.8
QQQQ----4444 58.1 11.4 0.7 10.8 3.1 5.5 1.3 4.3 -1.9 16.7 -11.1 5.0 2.1
2014 Q2014 Q2014 Q2014 Q----1111 101.7 2.3 -106.1 7.4 1.2 -0.4 1.7 1.2 -0.9 -1.6 115.0 1.6 5.2
QQQQ----2222 30.8 -6.9 0.3 6.7 0.6 10.2 4.3 5.5 -0.5 9.3 3.4 22.6 6.7
Source: National Bank of the Republic of Macedonia

Bulletin-Ministry of Finance of the Republic of Macedonia
32
Table 11. Gross external debtTable 11. Gross external debtTable 11. Gross external debtTable 11. Gross external debt----stock stock stock stock (In millions(In millions(In millions(In millions EUR) EUR) EUR) EUR) PrPrPrPreliminary dataeliminary dataeliminary dataeliminary data
QQQQ----1 20121 20121 20121 2012 QQQQ----2 20122 20122 20122 2012 QQQQ----3 20123 20123 20123 2012 QQQQ----4 20124 20124 20124 2012 QQQQ----1 20131 20131 20131 2013 QQQQ----2 20132 20132 20132 2013 QQQQ----3 20133 20133 20133 2013 QQQQ----4 20134 20134 20134 2013 QQQQ----1 20141 20141 20141 2014 QQQQ----2 20142 20142 20142 2014
General GovernmentGeneral GovernmentGeneral GovernmentGeneral Government 1,452.62 1,486.25 1,600.32 1,589.81 1,692.42 1,683.28 1,631.13 1,608.89 1,625.89 1,607.61
ShortShortShortShort----termtermtermterm 0.00 0.00 0.00 0.00 0.00 0.00 0.00 0.00 9.89 6.97
LongLongLongLong----termtermtermterm 1,452.62 1,486.25 1,600.32 1,589.81 1,692.42 1,683.28 1,631.13 1,608.89 1,616.00 1,600.64
Central BankCentral BankCentral BankCentral Bank 372.37 319.64 344.57 234.24 380.63 427.03 357.71 73.20 378.01 378.61
ShortShortShortShort----termtermtermterm 296.28 240.41 266.40 157.57 303.72 351.66 283.34 0.00 304.28 304.12
LongLongLongLong----termtermtermterm 76.10 79.23 78.17 76.67 76.91 75.37 74.37 73.20 73.73 74.49
DepositDepositDepositDeposit----Taking Corporations, except Taking Corporations, except Taking Corporations, except Taking Corporations, except
the Central Bankthe Central Bankthe Central Bankthe Central Bank 568.82 573.66 565.29 618.82 626.23 666.15 635.59 609.34 606.05 607.86
ShortShortShortShort----termtermtermterm 108.06 132.62 132.62 176.91 173.57 198.90 136.43 119.03 106.15 136.17
LongLongLongLong----termtermtermterm 460.76 441.04 432.67 441.91 452.66 467.25 499.15 490.31 499.91 471.69
Other SectorsOther SectorsOther SectorsOther Sectors 1,699.00 1,685.87 1,652.12 1,730.87 1,733.31 1,752.42 1,767.59 1,758.92 1,785.85 1,894.81
ShortShortShortShort----termtermtermterm 839.00 830.69 819.83 864.15 840.11 878.35 819.85 797.17 808.38 818.27
LongLongLongLong----termtermtermterm 859.99 855.17 832.29 866.71 893.20 874.08 947.74 961.75 977.48 1,076.54
Direct investment: Intercompany Direct investment: Intercompany Direct investment: Intercompany Direct investment: Intercompany
lendinglendinglendinglending 852.86 876.13 918.29 997.94 1,061.29 1,076.45 1,124.77 1,169.39 1,232.91 1,252.76
Gross External Debt Gross External Debt Gross External Debt Gross External Debt 4,945.67 4,941.55 5,080.60 5,171.67 5,493.89 5,605.33 5,516.79 5,219.75 5,628.71 5,741.65
Source: National Bank of the Republic of Macedonia
Note: In June, 2014 revision was done in accordance with the Balance of Payments and International Investment Position Manual (BPM6), IMF, 2009 and the External Debt Statistics: Guide for
Compilers and Users, IMF, 2013.

Bulletin-Ministry of Finance of the Republic of Macedonia
33
Table 12.1. Monetary trends, denar million Table 12.1. Monetary trends, denar million Table 12.1. Monetary trends, denar million Table 12.1. Monetary trends, denar million
TotalTotalTotalTotal DenarsDenarsDenarsDenarsForeign Foreign Foreign Foreign
currenciescurrenciescurrenciescurrenciesTotalTotalTotalTotal DenarsDenarsDenarsDenars
Foreign Foreign Foreign Foreign
currenciescurrenciescurrenciescurrencies
Primary Primary Primary Primary
moneymoneymoneymoneyМ1М1М1М1 М2М2М2М2 М4М4М4М4
2007200720072007 128,071 97,352 30,719 155,869 87,613 68,256 37,860 47,256 166,953 175,783
2008200820082008 172,150 133,679 38,471 175,130 91,298 83,832 40,890 54,119 178,885 195,525
2009 2)2009 2)2009 2)2009 2) 178,196 139,197 38,998 187,587 87,073 100,513 45,952 52,223 185,984 207,262
2010 2)2010 2)2010 2)2010 2) 190,816 142,457 48,359 213,202 104,409 108,793 49,003 57,362 201,579 232,569
2011 2)2011 2)2011 2)2011 2) 207,102 149,789 57,312 232,836 119,357 113,479 53,644 61,301 216,700 255,038
2012 2)2012 2)2012 2)2012 2) 218,362 163,995 54,366 244,250 133,135 111,115 55,936 65,940 217,709 266,284
2013 1)2013 1)2013 1)2013 1) 232,420 178,159 54,261 259,101 147,364 111,738 53,478 70,005 218,066 280,363
2013 Q-12013 Q-12013 Q-12013 Q-1 219,952 164,972 54,980 247,633 135,225 112,408 55,277 66,214 218,225 270,466
Q-2Q-2Q-2Q-2 224,152 168,408 55,745 245,542 137,749 107,793 53,417 65,306 210,647 266,292
Q-3Q-3Q-3Q-3 225,573 171,536 54,036 253,277 142,236 111,040 52,279 66,470 214,219 273,757
Q-4 1)Q-4 1)Q-4 1)Q-4 1) 232,420 178,159 54,261 259,101 147,364 111,738 53,478 70,005 218,066 280,363
2014 Q-12014 Q-12014 Q-12014 Q-1 236,525 181,879 54,645 264,770 151,501 113,268 53,272 71,900 220,424 286,238
Q-2Q-2Q-2Q-2 243,267 188,320 54,947 265,841 152,507 113,334 54,602 72,914 219,507 287,703
Q-3Q-3Q-3Q-3 246,664 191,519 55,145 275,393 158,730 116,664 56,198 76,718 226,707 298,210
2013 I2013 I2013 I2013 I 218,406 164,331 54,075 244,142 132,691 111,451 53,503 62,561 214,795 265,043
IIIIIIII 218,520 164,379 54,141 247,948 134,985 112,963 53,005 64,081 217,616 268,711
IIIIIIIIIIII 219,952 164,972 54,980 247,633 135,225 112,408 55,277 66,214 218,225 270,466
IVIVIVIV 220,536 165,776 54,760 241,217 133,718 107,499 54,267 63,869 208,900 262,379
VVVV 223,072 168,116 54,956 243,264 135,474 107,790 53,272 64,381 209,451 263,806
VIVIVIVI 224,152 168,408 55,745 245,542 137,749 107,793 53,417 65,306 210,647 266,292
VIIVIIVIIVII 224,897 169,712 55,186 246,963 137,946 109,017 54,709 65,920 211,211 268,478
VIIIVIIIVIIIVIII 224,942 170,447 54,494 252,317 140,448 111,869 53,491 67,350 215,106 273,553
IXIXIXIX 225,573 171,536 54,036 253,277 142,236 111,040 52,279 66,470 214,219 273,757
XXXX 226,305 173,108 53,196 254,359 142,874 111,485 53,099 66,431 214,167 274,630
XIXIXIXI 228,575 175,238 53,336 256,150 143,549 112,601 50,738 65,440 214,660 276,124
XII 1)XII 1)XII 1)XII 1) 232,420 178,159 54,261 259,101 147,364 111,738 53,478 70,005 218,066 280,363
2014 I2014 I2014 I2014 I 233,023 178,957 54,065 259,614 146,848 112,765 54,049 67,824 216,184 280,036
IIIIIIII 233,914 179,644 54,270 263,185 150,244 112,942 54,873 71,000 219,715 284,751
IIIIIIIIIIII 236,525 181,879 54,645 264,770 151,501 113,268 53,272 71,900 220,424 286,238
IVIVIVIV 236,230 182,543 53,687 263,919 150,418 113,501 53,527 71,991 219,231 286,023
VVVV 240,097 185,816 54,281 264,037 151,359 112,678 54,336 72,368 218,076 285,846
VIVIVIVI 243,267 188,320 54,947 265,841 152,507 113,334 54,602 72,914 219,507 287,703
VIIVIIVIIVII 243,879 188,858 55,020 266,888 153,448 113,440 57,557 74,147 220,774 290,144
VIIIVIIIVIIIVIII 244,587 189,685 54,903 272,694 156,623 116,071 57,076 75,858 225,212 295,743
IXIXIXIX 246,664 191,519 55,145 275,393 158,730 116,664 56,198 76,718 226,707 298,210
Denar Denar Denar Denar
millionmillionmillionmillion
Credits Credits Credits Credits DepositsDepositsDepositsDeposits Monetary aggregatesMonetary aggregatesMonetary aggregatesMonetary aggregates
Source: NBRM 1) Preliminary data 2) Data in accordance with the final balance sheets submission 3) Starting from January 2009 the data are compiled based on the New Banks' Chart of accounts

Bulletin-Ministry of Finance of the Republic of Macedonia
34
Table 12.2. Monetary trends, growth rates % Table 12.2. Monetary trends, growth rates % Table 12.2. Monetary trends, growth rates % Table 12.2. Monetary trends, growth rates %
TotalTotalTotalTotal DenarsDenarsDenarsDenarsForeign Foreign Foreign Foreign
currenciescurrenciescurrenciescurrenciesTotalTotalTotalTotal DenarsDenarsDenarsDenars
Foreign Foreign Foreign Foreign
currenciescurrenciescurrenciescurrencies
Primary Primary Primary Primary
moneymoneymoneymoneyМ1М1М1М1 М2М2М2М2 М4М4М4М4
2007200720072007 39.2 42.2 30.3 32.3 52.7 12.9 20.2 30.7 28.1 29.3
2008200820082008 34.4 37.3 25.2 12.4 4.2 22.8 8.0 14.5 7.1 11.2
2009 2) 2009 2) 2009 2) 2009 2) 3.5 4.1 1.4 7.1 -4.6 19.9 12.4 -3.5 4.0 6.0
2010 2)2010 2)2010 2)2010 2) 7.1 2.3 24.0 13.7 19.9 8.2 6.6 9.8 8.4 12.2
2011 2)2011 2)2011 2)2011 2) 8.5 5.1 18.5 9.2 14.3 4.3 9.5 6.9 7.5 9.7
2012 2)2012 2)2012 2)2012 2) 5.4 9.5 -5.1 4.9 11.5 -2.1 4.3 7.6 0.5 4.4
2013 1)2013 1)2013 1)2013 1) 6.4 8.6 -0.2 6.1 10.7 0.6 -4.4 6.2 0.2 5.3
2013 Q-12013 Q-12013 Q-12013 Q-1 4.3 7.8 -5.0 4.6 8.2 0.6 13.3 11.6 0.5 5.0
Q-2Q-2Q-2Q-2 3.7 5.8 -2.4 3.9 9.6 -2.6 2.3 6.7 -2.3 3.0
Q-3Q-3Q-3Q-3 3.7 5.6 -2.0 6.4 10.6 1.5 -1.2 5.2 -0.3 5.1
Q-4 1)Q-4 1)Q-4 1)Q-4 1) 6.4 8.6 -0.2 6.1 10.7 0.6 -4.4 6.2 0.2 5.3
2014 Q-12014 Q-12014 Q-12014 Q-1 7.5 10.2 -0.6 6.9 12.0 0.8 -3.6 8.6 1.0 5.8
Q-2Q-2Q-2Q-2 8.5 11.8 -1.4 8.3 10.7 5.1 2.2 11.6 4.2 8.0
Q-3Q-3Q-3Q-3 9.4 11.6 2.1 8.7 11.6 5.1 7.5 15.4 5.8 8.9
2013 I2013 I2013 I2013 I 5.0 9.1 -5.7 4.3 9.0 -0.9 4.6 4.0 -1.1 3.8
IIIIIIII 4.8 8.7 -5.7 5.6 9.4 1.4 4.8 7.2 0.3 4.9
IIIIIIIIIIII 4.3 7.8 -5.0 4.6 8.2 0.6 13.3 11.6 0.5 5.0
IVIVIVIV 3.3 6.7 -5.9 2.6 8.1 -3.5 2.5 4.9 -2.9 2.4
VVVV 3.7 6.7 -4.4 3.3 9.3 -3.4 3.5 7.7 -2.6 2.6
VIVIVIVI 3.7 5.8 -2.4 3.9 9.6 -2.6 2.3 6.7 -2.3 3.0
VIIVIIVIIVII 3.5 5.2 -1.5 3.1 8.3 -2.9 2.1 4.1 -3.8 2.0
VIIIVIIIVIIIVIII 3.6 5.9 -3.1 5.7 9.7 1.0 0.6 7.9 -0.9 4.5
IXIXIXIX 3.7 5.6 -2.0 6.4 10.6 1.5 -1.2 5.2 -0.3 5.1
XXXX 4.2 6.1 -1.6 5.9 9.8 1.3 2.4 4.2 -0.8 4.7
XIXIXIXI 4.9 6.6 -0.3 6.2 10.4 1.3 -1.2 5.2 -0.4 5.0
XII 1)XII 1)XII 1)XII 1) 9.3 0.2 6.1 11.3 0.0 3.5 10.8 1.0 6.0 5.3
2014 I2014 I2014 I2014 I 10.2 -0.6 6.9 12.0 0.8 -3.6 8.6 1.0 5.8 5.7
IIIIIIII 10.1 -2.0 9.4 12.5 5.6 -1.4 12.7 4.9 9.0 6.0
IIIIIIIIIIII 10.5 -1.2 8.5 11.7 4.5 2.0 12.4 4.1 8.4 5.8
IVIVIVIV 7.1 10.1 -2.0 9.4 12.5 5.6 -1.4 12.7 4.9 9.0
VVVV 7.6 10.5 -1.2 8.5 11.7 4.5 2.0 12.4 4.1 8.4
VIVIVIVI 8.5 11.8 -1.4 8.3 10.7 5.1 2.2 11.6 4.2 8.0
VIIVIIVIIVII 8.4 11.3 -0.3 8.1 11.2 4.1 5.2 12.5 4.5 8.1
VIIIVIIIVIIIVIII 8.7 11.3 0.7 8.1 11.5 3.8 6.7 12.6 4.7 8.1
XIXIXIXI 9.4 11.6 2.1 8.7 11.6 5.1 7.5 15.4 5.8 8.9
Credits Credits Credits Credits DepositsDepositsDepositsDeposits Monetary aggregatesMonetary aggregatesMonetary aggregatesMonetary aggregates
Source: NBRM 1) Preliminary data 2) Data in accordance with the final balance sheets submission 3) Starting from January 2009 the data are compiled based on the New Banks' Chart of accounts

Bulletin-Ministry of Finance of the Republic of Macedonia
35
Table 13. Wages (amount and annual growth rates)Table 13. Wages (amount and annual growth rates)Table 13. Wages (amount and annual growth rates)Table 13. Wages (amount and annual growth rates)
Gross wageGross wageGross wageGross wage Net wageNet wageNet wageNet wage
Average Average Average Average
(Denar)(Denar)(Denar)(Denar)
Nominal Nominal Nominal Nominal
changechangechangechange
Real Real Real Real
changechangechangechange
Average Average Average Average
(Denar)(Denar)(Denar)(Denar)
Nominal Nominal Nominal Nominal
chachachachangengengenge
Real Real Real Real
changechangechangechange
2003200320032003 19,957 4.9 3.7 11,828 4.8 3.6
2004200420042004 20,779 4.1 4.5 12,298 4.0 4.4
2005200520052005 21,335 2.7 2.2 12,600 2.5 2.0
2006200620062006 23,037 8.0 4.8 13,518 7.3 4.1
2007200720072007 24,139 4.8 2.5 14,586 7.9 5.6
2008200820082008 26,228 8.7 0.4 16,095 10.4 1.9
2009200920092009 29,923 14.1 15.0 19,958 24.0 25.0
2010201020102010 30,225 1.0 -0.6 20,553 3.0 1.4
2011201120112011 30,603 1.3 -2.5 20,765 1.4 -2.4
2012201220122012 30,670 0.2 -3.0 20,906 0.3 -2.9
2013201320132013 31,026 1.2 -1.6 21,146 1.2 -1.6
2013 Q2013 Q2013 Q2013 Q----1111 30,973 1.1 -2.3 21,130 1.1 -2.2
QQQQ----2222 31,001 1.8 -1.8 21,126 1.8 -1.8
QQQQ----3333 30,919 1.1 -1.7 21,060 1.0 -1.7
QQQQ----4444 31,209 0.7 -0.5 21,267 0.7 -0.6
2014 Q2014 Q2014 Q2014 Q----1111 30,885 0.3 -0.1 21,092 -0.2 -0.7
QQQQ----2222 31,172 0.5 1.5 21,297 0.8 1.7
2013 I2013 I2013 I2013 I 31,090 1.0 -2.7 21,185 1.0 -2.7
IIIIIIII 30,644 1.3 -2.1 20,910 1.4 -2.0
IIIIIIIIIIII 31,185 1.0 -2.0 21,294 1.0 -2.0
IVIVIVIV 30,799 1.2 -2.1 20,983 1.2 -2.1
VVVV 31,247 2.0 -1.4 21,288 2.0 -1.3
VIVIVIVI 30,957 2.1 -2.0 21,108 2.2 -1.9
VIIVIIVIIVII 30,851 1.3 -2.6 21,013 1.1 -2.8
VIIIVIIIVIIIVIII 30,990 0.7 -2.0 21,108 0.7 -2.1
IXIXIXIX 30,915 1.2 -0.4 21,060 1.3 -0.2
XXXX 31,228 1.1 -0.2 21,247 1.0 -0.3
XIXIXIXI 30,902 1.0 -0.1 21,054 0.9 -0.2
XIIXIIXIIXII 31,498 0.1 -1.3 21,500 0.1 -1.2
2014 I2014 I2014 I2014 I 31,236 0.5 -0.4 21,327 0.7 -0.2
IIIIIIII 30,662 0.1 -0.5 20,941 0.1 -0.4
IIIIIIIIIIII 30,756 0.3 0.6 21,007 -1.3 -1.5
IVIVIVIV 31,027 0.7 1.9 21,175 0.9 2.0
VVVV 31,429 0.6 1.2 21,483 0.9 1.5
VIVIVIVI 31,061 0.3 1.5 21,233 0.6 1.7
VIIVIIVIIVII 31,245 1.3 1.0 21,350 1.6 1.3
VIIIVIIIVIIIVIII 31,080 0,3 0,8 21,217 0,5 1,0
Source: State Statistical Office and own estimation
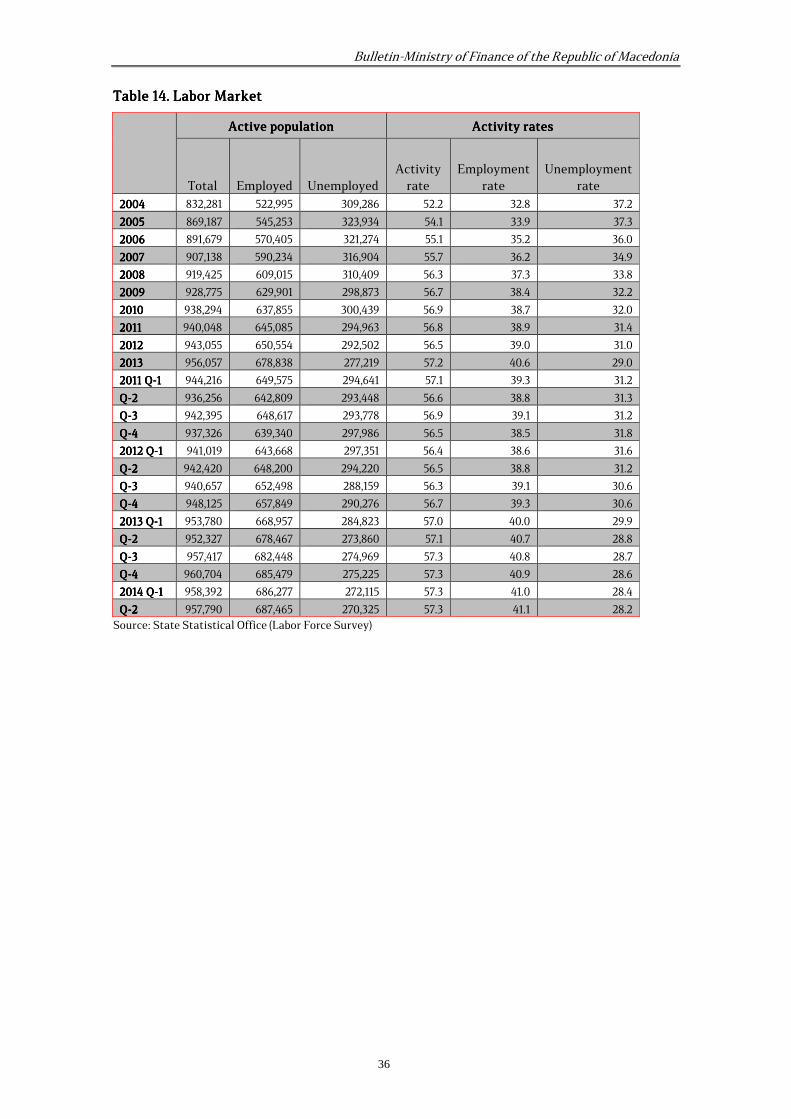
Bulletin-Ministry of Finance of the Republic of Macedonia
36
Table 14. Labor MarketTable 14. Labor MarketTable 14. Labor MarketTable 14. Labor Market
Active populationActive populationActive populationActive population Activity ratesActivity ratesActivity ratesActivity rates
Total Employed Unemployed
Activity
rate
Employment
rate
Unemployment
rate
2004200420042004 832,281 522,995 309,286 52.2 32.8 37.2
2005200520052005 869,187 545,253 323,934 54.1 33.9 37.3
2006200620062006 891,679 570,405 321,274 55.1 35.2 36.0
2007200720072007 907,138 590,234 316,904 55.7 36.2 34.9
2008200820082008 919,425 609,015 310,409 56.3 37.3 33.8
2009200920092009 928,775 629,901 298,873 56.7 38.4 32.2
2010201020102010 938,294 637,855 300,439 56.9 38.7 32.0
2011201120112011 940,048 645,085 294,963 56.8 38.9 31.4
2012201220122012 943,055 650,554 292,502 56.5 39.0 31.0
2013201320132013 956,057 678,838 277,219 57.2 40.6 29.0
2011 Q2011 Q2011 Q2011 Q----1111 944,216 649,575 294,641 57.1 39.3 31.2
QQQQ----2222 936,256 642,809 293,448 56.6 38.8 31.3
QQQQ----3333 942,395 648,617 293,778 56.9 39.1 31.2
QQQQ----4444 937,326 639,340 297,986 56.5 38.5 31.8
2012 Q2012 Q2012 Q2012 Q----1111 941,019 643,668 297,351 56.4 38.6 31.6
QQQQ----2222 942,420 648,200 294,220 56.5 38.8 31.2
QQQQ----3333 940,657 652,498 288,159 56.3 39.1 30.6
QQQQ----4444 948,125 657,849 290,276 56.7 39.3 30.6
2013 Q2013 Q2013 Q2013 Q----1111 953,780 668,957 284,823 57.0 40.0 29.9
QQQQ----2222 952,327 678,467 273,860 57.1 40.7 28.8
QQQQ----3333 957,417 682,448 274,969 57.3 40.8 28.7
QQQQ----4444 960,704 685,479 275,225 57.3 40.9 28.6
2014 Q2014 Q2014 Q2014 Q----1111 958,392 686,277 272,115 57.3 41.0 28.4
QQQQ----2222 957,790 687,465 270,325 57.3 41.1 28.2
Source: State Statistical Office (Labor Force Survey)

Bulletin-Ministry of Finance of the Republic of Macedonia
37
BBBBBBBBUUUUUUUUDDDDDDDDGGGGGGGGEEEEEEEETTTTTTTT AAAAAAAANNNNNNNNDDDDDDDD FFFFFFFFUUUUUUUUNNNNNNNNDDDDDDDDSSSSSSSS

Bulletin-Ministry of Finance of the Republic of Macedonia
38
surplus/deficit
expenditures
revenues-20.000
0
20.000
40.000
60.000
80.000
100.000
120.000
140.000
160.000
2009 20102011
20122013
-10,895 -10,543-11,483
-17,767-19,250
139,
393
142,
692
148,
649
155,
840
159,
517
128,498 132,150 137,166 138,073 140,267
Chart Chart Chart Chart 1111. Total expenditures, total revenues and . Total expenditures, total revenues and . Total expenditures, total revenues and . Total expenditures, total revenues and
surplus/deficit of the Budget of the Republic of Macedonasurplus/deficit of the Budget of the Republic of Macedonasurplus/deficit of the Budget of the Republic of Macedonasurplus/deficit of the Budget of the Republic of Macedona
Source: MoF
surplus/deficit
expenditures
revenues
-5
0
5
10
15
20
25
30
35
20092010
20112012
2013
-2.7-2.4
-2.5
-3.9-3.9
33.932.9
32.334.0 32.3
31.3 30.4
29.8 30.128.4
Chart Chart Chart Chart 2222. Total expenditures, total revenues and surplus/deficit of the . Total expenditures, total revenues and surplus/deficit of the . Total expenditures, total revenues and surplus/deficit of the . Total expenditures, total revenues and surplus/deficit of the
Budget of the Republic of Macedonia as % og GDPBudget of the Republic of Macedonia as % og GDPBudget of the Republic of Macedonia as % og GDPBudget of the Republic of Macedonia as % og GDP
Source: MoF

Bulletin-Ministry of Finance of the Republic of Macedonia
39
0%
5%
10%
15%
20%
25%
30%
35%
2009 2010 2011 2012 2013
17.23% 16.80% 17.01% 16.49% 15.68%
9.46% 8.91% 8.65% 8.89% 8.59%
3.99%3.24% 2.84% 2.74%
2.40%
0.28% 0.84% 0.77% 0.97%0.68%
0.20%0.34% 0.24% 0.66%
0.70%
0.06%0.12% 0.17% 0.14%
0.11%
Collected revenues extended to domestic entities Donations from abroad
Capital revenues Non-tax revenues
Contributions Taxes
Chart Chart Chart Chart 3333. Budget Revenues as % of GDP. Budget Revenues as % of GDP. Budget Revenues as % of GDP. Budget Revenues as % of GDP
Source: MoF
0%
5%
10%
15%
20%
25%
30%
35%
2009 2010 2011 2012 2013
5,53% 5.21% 5.03% 4.95% 4.57%
3.81% 3.34% 3.01% 3.17% 2.99%
0.14% 0.04% 0.02%0.02% 0.02%
20.60%20.01% 19.66%
20.83%20.41%
0.60%0.73% 0.75% 0.92%
0.93%
3.27% 3.53% 3.85% 4.09%3.36%
Capital expenditures Interest
Transfer Reserves
Goods and services Salaries, salary supplements and allowances
Chart Chart Chart Chart 4444. Budget Expenditures as % of GDP. Budget Expenditures as % of GDP. Budget Expenditures as % of GDP. Budget Expenditures as % of GDP
Source: MoF

Bulletin-Ministry of Finance of the Republic of Macedonia
40
Table 1. Budget of the RepublicTable 1. Budget of the RepublicTable 1. Budget of the RepublicTable 1. Budget of the Republic of Macedonia (Central Budget and Funds Budgets)of Macedonia (Central Budget and Funds Budgets)of Macedonia (Central Budget and Funds Budgets)of Macedonia (Central Budget and Funds Budgets) DenarDenarDenarDenar
millionmillionmillionmillion RevenuesRevenuesRevenuesRevenues ExpendituresExpendituresExpendituresExpenditures Surplus/DeficitSurplus/DeficitSurplus/DeficitSurplus/Deficit
1 2 3=1-2
2006200620062006 104,044 105,744 -1,700
2007200720072007 119,608 117,455 2,153
2008200820082008 136,411 140,222 -3,811
2009200920092009 128,498 139,393 -10,895
2010201020102010 132,150 142,692 -10,543
2011201120112011 137,166 148,649 -11,483
2012201220122012 138,073 155,840 -17,767
2013201320132013 140,267 159,520 -19,253
2013 2013 2013 2013 QQQQ----1111 29,931 41,348 -11,417
QQQQ----2222 36,121 38,513 -2,392
QQQQ----3333 36,983 38,944 -1,961
QQQQ----4444 37,232 40,.715 -3,483
2012012012014 4 4 4 QQQQ----1111 32,291 43,428 -11,137
QQQQ----2222 36,257 39,878 -3,621 QQQQ----3333 36,016 38,712 -2,696
2013 I2013 I2013 I2013 I 10,651 13,522 -2,871
IIIIIIII 8,278 11,997 -3,719
IIIIIIIIIIII 11,002 15,829 -4,827
IVIVIVIV 14,627 14,486 141
VVVV 10,555 11,710 -1,155
VIVIVIVI 10,939 12,317 -1,378
VIIVIIVIIVII 14,708 15,218 -510
VIIIVIIIVIIIVIII 11,143 11,572 -429
IXIXIXIX 11,132 12,154 -1,022
XXXX 11,837 13,186 -1,349
XIXIXIXI 11,466 12,248 -782
XIIXIIXIIXII 13,929 15,281 -1,352
2014 I2014 I2014 I2014 I 10,086 11,975 -1,889
IIIIIIII 10,979 16,648 -5,669
IIIIIIIIIIII 11,226 14,805 -3,579
IVIVIVIV 13,210 14,377 -1,167
VVVV 12,140 13,176 -1,036
VIVIVIVI 10,907 12,325 -1,418
VIIVIIVIIVII 12,877 13,558 -681
VIIVIIVIIVIIIIII 10,397 11,936 -1,539
IXIXIXIX 12,742 13,218 -476
Source: MoF

Bulletin-Ministry of Finance of the Republic of Macedonia
41
Table 2. Budget Revenues (Central Budget and Funds Budgets)Table 2. Budget Revenues (Central Budget and Funds Budgets)Table 2. Budget Revenues (Central Budget and Funds Budgets)Table 2. Budget Revenues (Central Budget and Funds Budgets)
Denar Denar Denar Denar millionmillionmillionmillion
Total revenusTotal revenusTotal revenusTotal revenus TaxesTaxesTaxesTaxes ContributionsContributionsContributionsContributions NonNonNonNon----tax tax tax tax
revenuesrevenuesrevenuesrevenues Capital Capital Capital Capital
revenuesrevenuesrevenuesrevenues Donations Donations Donations Donations
from abroadfrom abroadfrom abroadfrom abroad
Collected Collected Collected Collected loans loans loans loans
extendeextendeextendeextended to d to d to d to domestic domestic domestic domestic entitiesentitiesentitiesentities
1=(2+3+4+5+6+7) 2 3 4 5 6 7
2006200620062006 104,044 59,774 30,766 10,706 948 1,423 427
2007200720072007 119,608 69,761 33,457 13,901 1,397 906 186
2008200820082008 136,411 76,854 38,249 18,400 1,390 1,327 191
2009200920092009 128,498 71,023 38,837 16,402 1,167 833 237
2012012012010000 132,149 73,753 38,687 16,569 1,157 1,458 524
2011201120112011 137,166 78,910 39,759 13,077 3,554 1,087 779
2012201220122012 138,073 76,617 40,765 12,584 4,433 3,045 629
2013201320132013 140,267 140,886 42,458 11,867 3,382 3,451 556
2013 2013 2013 2013 QQQQ----1111 29,901 16,756 9,720 2,600 299 456 100
QQQQ----2222 36,121 20,229 10,436 2,135 2,461 752 108
QQQQ----3333 36,983 20,404 10,671 4,479 293 1,008 128
QQQQ----4444 37,232 21,164 11,631 2,653 329 1,235 220
2014 2014 2014 2014 QQQQ----1111 32,291 18,493 10,211 2,591 181 612 203
QQQQ----2222 36,257 21,190 10,891 2,436 1,041 534 165 QQQQ----3333 36,016 21,094 11,052 2,645 348 766 111
2013 I2013 I2013 I2013 I 10,651 6,435 2,811 918 172 278 37
IIIIIIII 8,278 3,708 3,445 951 65 89 20
IIIIIIIIIIII 11,002 6,613 3,464 731 62 89 43
IVIVIVIV 14,627 7,169 3,913 746 2,325 456 18
VVVV 10,555 6,479 3,205 705 55 55 56
VIVIVIVI 10,939 6,581 3,318 684 81 241 34
VIIVIIVIIVII 14,708 7,745 3,777 2,610 177 353 46
VIIIVIIIVIIIVIII 11,143 6,592 3,428 769 58 283 13
IXIXIXIX 11,132 6,067 3,466 1,100 58 372 69
XXXX 11,837 6,721 3,587 1,041 139 328 21
XIXIXIXI 11,466 6,333 3,791 731 58 490 63
XIIXIIXIIXII 13,929 8,110 4,253 881 132 417 136
2012012012014444 IIII 10,086 6,042 3,014 748 83 139 60
IIIIIIII 10,979 6,155 3,578 1,030 59 98 59
IIIIIIIIIIII 11,226 6,296 3,619 813 39 375 84
IVIVIVIV 13,210 7,466 3,748 906 972 70 48
VVVV 12,140 7,371 3,546 748 30 375 70
VIVIVIVI 10,907 6,353 3,597 782 39 89 47
VIIVIIVIIVII 12,877 7,959 3,818 813 140 119 28
VIIIVIIIVIIIVIII 10,397 5,926 3,532 707 67 149 16
IXIXIXIX 12,742 7,209 3,702 1,125 141 498 67
Source: MoF

Bulletin-Ministry of Finance of the Republic of Macedonia
42
Table 3. Tax revenues of the Budget of the Republic of MacedoniaTable 3. Tax revenues of the Budget of the Republic of MacedoniaTable 3. Tax revenues of the Budget of the Republic of MacedoniaTable 3. Tax revenues of the Budget of the Republic of Macedonia
Denar Denar Denar Denar millionmillionmillionmillion
Tax revenuesTax revenuesTax revenuesTax revenues Personal Personal Personal Personal
income taxincome taxincome taxincome tax Profit taxProfit taxProfit taxProfit tax VATVATVATVAT ExcisesExcisesExcisesExcises
Import Import Import Import dutiesdutiesdutiesduties
Other tax Other tax Other tax Other tax revenuesrevenuesrevenuesrevenues
Tax Tax Tax Tax rerererevenues venues venues venues
(Own (Own (Own (Own accounts)accounts)accounts)accounts)
1=(2+3+4+5+6+7+8) 2 3 4 5 6 7 8
2006200620062006 59,774 8,414 4,708 27,239 12,174 5,420 1,620 199
2007200720072007 69,761 8,892 5,898 32,962 13,265 6,199 2,298 247
2008200820082008 76,854 8,696 8,579 36,173 14,276 6,275 2,560 295
2009200920092009 71,023 8,710 4,434 35,173 14,533 5,229 2,675 269
2010201020102010 73,754 8,872 3,690 37,694 14,926 4,712 3,045 815
2011201120112011 78,910 9,513 3,888 42,224 15,513 3,779 3,289 704
2012201220122012 76,617 9,553 3,652 38,469 16,596 4,067 3,282 998
2013201320132013 78,553 10,254 4,421 39,835 15,990 4,255 2,723 1,075
2013 2013 2013 2013 QQQQ----1111 16,756 2,436 1,617 7,441 3,168 1,015 830 249
QQQQ----2222 20,229 2,475 1,247 10,520 3,807 1,085 881 214
QQQQ----3333 20,404 2,425 708 10,669 4,669 1,041 682 210
QQQQ----4444 21,164 2,918 849 11,205 4,346 1,114 330 402
2014 Q2014 Q2014 Q2014 Q----1111 18,493 2,786 1,039 9,971 3,095 1,042 283 277
QQQQ----2222 21,190 2,872 1,648 10,675 4,370 1,092 230 303 QQQQ----3333 21,094 2,945 903 10,776 4,920 968 233 349
2013 I2013 I2013 I2013 I 6,435 702 213 3,546 1,168 360 357 89
IIIIIIII 3,708 831 925 382 971 297 211 91
IIIIIIIIIIII 6,613 903 479 3,513 1,029 358 262 69
IVIVIVIV 7,169 959 755 3,419 1,195 424 340 77
VVVV 6,479 763 240 3,626 1,222 342 216 70
VIVIVIVI 6,581 753 252 3,475 1,390 319 325 67
VIIVIIVIIVII 7,745 860 286 4,291 1,510 353 366 79
VIIIVIIIVIIIVIII 6,592 760 163 3,513 1,585 336 169 66
IXIXIXIX 6,067 805 259 2,865 1,574 352 147 65
XXXX 6,721 828 181 3,459 1,675 383 119 76
XIXIXIXI 6,333 866 188 3,430 1,334 344 100 71
XIIXIIXIIXII 8,110 1,224 480 4,316 1,337 387 111 255
2012012012014444 IIII 6,042 833 179 3,760 765 318 118 69
IIIIIIII 6,155 948 463 3,065 1,114 336 88 141
IIIIIIIIIIII 6,296 1,005 397 3,146 1,216 388 77 67
IVIVIVIV 7,466 1,008 856 3,703 1,362 384 80 73
VVVV 7,371 938 492 3,940 1,436 364 86 115
VIVIVIVI 6,353 926 300 3,032 1,572 344 64 115
VIIVIIVIIVII 7,959 1,004 423 4,535 1,503 313 69 112
VIIIVIIIVIIIVIII 5,926 885 240 2,612 1,685 316 90 98
IXIXIXIX 7,209 1,056 240 3,629 1,732 339 74 139
Source: MoF

Bulletin-Ministry of Finance of the Republic of Macedonia
43
Table 4. Budget ExpenditureTable 4. Budget ExpenditureTable 4. Budget ExpenditureTable 4. Budget Expendituressss
Denar Denar Denar Denar millionmillionmillionmillion
TOTAL TOTAL TOTAL TOTAL EXPENDITURESEXPENDITURESEXPENDITURESEXPENDITURES
Salaries, Salaries, Salaries, Salaries, salary salary salary salary
supplements supplements supplements supplements and and and and
allowancesallowancesallowancesallowances
Goods Goods Goods Goods and and and and
servicesservicesservicesservices ReservesReservesReservesReserves TransfersTransfersTransfersTransfers InterestInterestInterestInterest
Capital Capital Capital Capital expendituresexpendituresexpendituresexpenditures
1=(2+3+4+5+6+7) 2 3 4 5 6 7
2006200620062006 105,744 23,421 12,609 318 56,607 3,137 9,266
2007200720072007 117,455 23,607 14,440 366 62,386 2,915 13,741
2008200820082008 140,222 20,827 18,146 599 77,942 2,646 20,062
2009200920092009 139,393 22,699 15,656 564 84,601 2,445 13,428
2010201020102010 142,691 22,638 14,506 175 86,864 3,174 15,334
2011201120112011 148,649 23,147 13,853 105 90,363 3,471 17,710
2012201220122012 155,840 22,714 14,548 104 95,501 4,216 18,757
2013201320132013 159,520 22,588 14,785 94 100,836 4,606 16,611
2013 2013 2013 2013 QQQQ----1111 41,348 5,618 4,094 15 26,413 1,163 4,045
QQQQ----2222 38,513 5,646 3,685 0 24,304 898 3,980
QQQQ----3333 38,944 5,637 3,002 12 25,226 1,113 3,954
QQQQ----4444 40,715 5,687 4,004 67 24,893 1,432 4,632
2014 Q2014 Q2014 Q2014 Q----1111 43,428 5,702 4,102 57 28,219 1,040 4,308
QQQQ----2222 39,878 5,773 3,604 18 25,094 1,250 4,139 QQQQ----3333 38,712 5,719 3,257 0 25,369 1,220 3,147
2013 I2013 I2013 I2013 I 13,522 1,860 1,463 0 7,598 850 1,751
IIIIIIII 11,997 1,873 1,340 1 7,773 206 804
IIIIIIIIIIII 15,829 1,885 1,291 14 11,042 107 1,490
IVIVIVIV 14,486 1,863 1,704 0 8,869 221 1,829
VVVV 11,710 1,911 931 0 7,748 232 888
VIVIVIVI 12,317 1,872 1,050 0 7,687 445 1,263
VIIVIIVIIVII 15,218 1,911 1,293 8 9,696 664 1,646
VIIIVIIIVIIIVIII 11,572 1,869 787 0 7,747 239 930
IXIXIXIX 12,154 1,857 922 4 7,783 210 1,378
XXXX 13,186 1,881 1,341 2 8,454 296 1,212
XIXIXIXI 12,248 1,897 870 4 8,146 331 1,000
XIIXIIXIIXII 15,281 1,909 1,793 61 8,293 805 2,420
2012012012014444 IIII 11,975 1,877 805 57 7,930 693 613
IIIIIIII 16,648 1,906 1,501 0 11,181 186 1,874
IIIIIIIIIIII 14,805 1,919 1,796 0 9,108 161 1,821
IVIVIVIV 14,377 1,894 1,805 0 8,568 419 1,691
VVVV 13,176 1,907 990 12 8,394 316 1,557
VIVIVIVI 12,325 1,972 809 6 8,132 515 891
VIIVIIVIIVII 13,558 1,907 1,179 0 8,599 681 1,192
VIIIVIIIVIIIVIII 11,936 1,881 790 0 8,241 243 781
IXIXIXIX 13,218 1,931 1,288 0 8,529 296 1,174
Source: MoF

Bulletin-Ministry of Finance of the Republic of Macedonia
44
CORE BUDGETCORE BUDGETCORE BUDGETCORE BUDGET
surplus/deficit
expenditures
revenues-20.000
0
20.000
40.000
60.000
80.000
100.000
120.000
20092010
20112012
2013
-9,587 -8,161-9542
-15,831-18,131
88,0
71
89,9
83
95,7
41
99,2
36
104,
102
78,484 81,82286,199 83,403 85,971
Chart Chart Chart Chart 5555. Total revenues, total expenditures and surplus/deficit of the . Total revenues, total expenditures and surplus/deficit of the . Total revenues, total expenditures and surplus/deficit of the . Total revenues, total expenditures and surplus/deficit of the
Core Budget of the Republic of Macedonia (Denar million)Core Budget of the Republic of Macedonia (Denar million)Core Budget of the Republic of Macedonia (Denar million)Core Budget of the Republic of Macedonia (Denar million)
Source: MoF
0
10.000
20.000
30.000
40.000
50.000
60.000
70.000
80.000
90.000
2009 2010 2011 2012 2013
70,0
09
72,1
50
74,7
67
74,7
67
76,6
10
7,075 8,016 3,872 3,8727,6251.163
1,131 4,137
4,137
1,180237
524 779 629 556
Collected loans extended to domestic entities
Capital revenues
Non-tax revenues
Taxes
Chart Chart Chart Chart 6666. Core Budget Revenues. Core Budget Revenues. Core Budget Revenues. Core Budget Revenues
Source: MoF
0
20.000
40.000
60.000
80.000
100.000
120.000
2009 2010 2011 2012 2013
21,024 21,201 21,498 21,067 21,035
9,736 9,058 9,112 8,993 9,795
564 175 105 104 94
44,048 45,348 48,762 52,94457,195
2,101 2.9113,219
3,9794,599
10,598 11,29013,045
12,14911,384
Capital expenditures Interest Transfers Reserves Goods and services Salaries, salary supplements and allowances
Chart Chart Chart Chart 7777. Core Budget Expenditures. Core Budget Expenditures. Core Budget Expenditures. Core Budget Expenditures
Source: MoF

Bulletin-Ministry of Finance of the Republic of Macedonia
45
Table 5. Total revenues, total expenditures and Surplus/Deficit of Core BudgetTable 5. Total revenues, total expenditures and Surplus/Deficit of Core BudgetTable 5. Total revenues, total expenditures and Surplus/Deficit of Core BudgetTable 5. Total revenues, total expenditures and Surplus/Deficit of Core Budget
Denar Denar Denar Denar millionmillionmillionmillion
RevenuesRevenuesRevenuesRevenues ExpendituresExpendituresExpendituresExpenditures Surplus/DeficitSurplus/DeficitSurplus/DeficitSurplus/Deficit
1 2 3=1-2
2006200620062006 62,964 63,555 -591
2007200720072007 76,157 75,455 702
2008200820082008 85,894 88,710 -2,816
2009200920092009 78,484 88,071 -9,587
2010201020102010 81,822 89,983 -8,161
2011201120112011 86,199 95,741 -9,542
2012201220122012 83,405 99,236 -15,831
2013201320132013 85,971 104,102 -18,131
2013 2013 2013 2013 QQQQ----1111 17,692 28,438 -10,746
QQQQ----2222 23,144 24,889 -1,775
QQQQ----3333 23,159 24,135 -976
QQQQ----4444 22,006 26,640 -4,634
2014 Q2014 Q2014 Q2014 Q----1111 19,352 29,343 -9,991
QQQQ----2222 22,860 25,493 -2,633 QQQQ----3333 21,841 24,431 -2,590
2013 I2013 I2013 I2013 I 6,932 9,268 -2,336
IIIIIIII 3,893 7,821 -3,928
IIIIIIIIIIII 6,867 11,349 -4,482
IVIVIVIV 9,613 9,669 -56
VVVV 6,706 7,465 -759
VIVIVIVI 6,795 7,755 -960
VIIVIIVIIVII 9,972 9,968 4
VIIIVIIIVIIIVIII 6,795 7,033 -238
IIIIXXXX 6,392 7,134 -742
XXXX 7,032 8,259 -1,227
XIXIXIXI 6,567 7,918 -1,351
XIIXIIXIIXII 8,407 10,463 -2,056
2012012012014444 IIII 6,390 7,804 -1,414
IIIIIIII 6,359 12,237 -5,878
IIIIIIIIIIII 6,603 9,302 -2,699
IVIVIVIV 8,778 9,672 -894
VVVV 7,543 8,171 -628
VIVIVIVI 6,539 7,650 -1,111
VIIVIIVIIVII 8,240 8,991 -751
VIIIVIIIVIIIVIII 6,065 7,361 -1,296
IXIXIXIX 7,536 8,079 -543
Source: MoF

Bulletin-Ministry of Finance of the Republic of Macedonia
46
Table 6. Core Budget RevenuesTable 6. Core Budget RevenuesTable 6. Core Budget RevenuesTable 6. Core Budget Revenues
Denar Denar Denar Denar millionmillionmillionmillion
Total revenuesTotal revenuesTotal revenuesTotal revenues TaxesTaxesTaxesTaxes NonNonNonNon----tax tax tax tax revenuesrevenuesrevenuesrevenues
Capital Capital Capital Capital revenuesrevenuesrevenuesrevenues
Collected loans Collected loans Collected loans Collected loans extended to extended to extended to extended to
domestic entitiesdomestic entitiesdomestic entitiesdomestic entities
1=(2+3+4+5) 2 3 4 5
2006200620062006 58,915 8,414 4,710 27,240 11,511
2007200720072007 68,828 8,891 5,896 32,962 12,584
2008200820082008 75,840 8,696 8,579 36,173 13,557
2009200920092009 70,009 8,710 4,434 35,173 13,788
2010201020102010 81,822 72,150 8,016 1,131 524
2011201120112011 86,199 77,392 4,256 3,772 779
2012201220122012 83,405 74,767 3,872 4,137 629
2013201320132013 85,971 76,610 7,625 1,180 556
2013 2013 2013 2013 QQQQ----1111 17,692 16,328 977 287 100
QQQQ----2222 23,144 19,797 2,932 277 108
QQQQ----3333 23,159 19,936 2,807 288 128
QQQQ----4444 22,006 20,549 909 328 220
2014 Q2014 Q2014 Q2014 Q----1111 19,352 18,029 940 180 203
QQQQ----2222 22,860 20,673 1,927 95 165
QQQQ----3333 21,841 20,476 919 335 111
2013 I2013 I2013 I2013 I 6,932 6,283 440 172 37
IIIIIIII 3,893 3,562 247 64 20
IIIIIIIIIIII 6,867 6,483 290 51 43
IVIVIVIV 9,613 7,021 2,433 141 18
VVVV 6,706 6,336 259 55 56
VIVIVIVI 6,795 6,440 240 81 34
VIIVIIVIIVII 9,972 7,590 2,163 173 46
VIIIVIIIVIIIVIII 6,795 6,433 291 58 13
IXIXIXIX 6,392 5,913 353 57 69
XXXX 7,032 6,569 304 138 21
XIXIXIXI 6,567 6,191 255 58 63
XIIXIIXIIXII 8,407 7,789 350 132 136
2012012012014444 IIII 6,390 5,906 342 82 60
IIIIIIII 6,359 5,955 286 59 59
IIIIIIIIIIII 6,603 6,168 312 39 84
IVIVIVIV 8,778 7,325 1,379 26 48
VVVV 7,543 7,184 259 30 70
VIVIVIVI 6,539 6,164 289 39 47
VIIVIIVIIVII 8,240 7,767 318 127 28
VIIIVIIIVIIIVIII 6,065 5,733 249 67 16
IXIXIXIX 7,536 6,976 352 141 67
Source: MoF

Bulletin-Ministry of Finance of the Republic of Macedonia
47
Table 7. Core Budget Tax RevenuesTable 7. Core Budget Tax RevenuesTable 7. Core Budget Tax RevenuesTable 7. Core Budget Tax Revenues
Denar Denar Denar Denar millionmillionmillionmillion
Tax revenuesTax revenuesTax revenuesTax revenues Personal Personal Personal Personal
income taxincome taxincome taxincome tax Profit taxProfit taxProfit taxProfit tax VATVATVATVAT ExcisesExcisesExcisesExcises
Import Import Import Import dutiesdutiesdutiesduties
Other tax Other tax Other tax Other tax revenuesrevenuesrevenuesrevenues
1=(2+3+4+5) 2 3 4 5 6 7
2006200620062006 58,915 8,414 4,710 27,240 11,511 5,421 1,619
2007200720072007 68,828 8,891 5,896 32,962 12,584 6,198 2,297
2008200820082008 75,840 8,696 8,579 36,173 13,557 6,275 2,560
2009200920092009 70,009 8,710 4,434 35,173 13,788 5,229 2,675
2010201020102010 72,150 8,872 3,690 37,694 14,137 4,712 3,045
2011201120112011 77,392 9,513 3,888 42,224 14,699 3,779 3,289
2012201220122012 74,767 9,553 3,652 38,469 15,744 4,067 3,282
2013201320132013 76,610 10,254 4,421 39,835 15,122 4,255 2,723
2013 2013 2013 2013 QQQQ----1111 16,328 2,436 1,617 7,441 2,989 1,015 830
QQQQ----2222 19,797 2,475 1,247 10,520 3,589 1,085 881
QQQQ----3333 19,936 2,425 708 10,669 4,411 1,041 682
QQQQ----4444 20,549 2,918 849 11,205 4,133 1,114 330
2014 Q2014 Q2014 Q2014 Q----1111 18,029 2,786 1,039 9,971 2,908 1,042 283
QQQQ----2222 20,673 2,872 1,648 10,675 4,156 1,092 230
QQQQ----3333 20,476 2,945 903 10,776 4,651 968 233
2013 I2013 I2013 I2013 I 6,283 702 213 3,546 1,105 360 357
IIIIIIII 3,562 831 925 382 916 297 211
IIIIIIIIIIII 6,483 903 479 3,513 968 358 262
IVIVIVIV 7,021 959 755 3,419 1,124 424 340
VVVV 6,336 763 240 3,626 1,149 342 216
VIVIVIVI 6,440 753 252 3,475 1,316 319 325
VIIVIIVIIVII 7,590 860 286 4,291 1,434 353 366
VIIIVIIIVIIIVIII 6,433 760 163 3,513 1,492 336 169
IXIXIXIX 5,913 805 259 2,865 1,485 352 147
XXXX 6,569 828 181 3,459 1,599 383 119
XIXIXIXI 6,191 866 188 3,430 1,263 344 100
XIIXIIXIIXII 7,789 1,224 480 4,316 1,271 387 111
2012012012014444 IIII 5,906 833 179 3,760 698 318 118
IIIIIIII 5,955 948 463 3,065 1,055 336 88
IIIIIIIIIIII 6,168 1,005 397 3,146 1,155 388 77
IVIVIVIV 7,325 1,008 856 3,703 1,294 384 80
VVVV 7,184 938 492 3,940 1,364 364 86
VIVIVIVI 6,164 926 300 3,032 1,498 344 64
VIIVIIVIIVII 7,767 1,004 423 4,535 1,423 313 69
VIIIVIIIVIIIVIII 5,733 885 240 2,612 1,590 316 90
IXIXIXIX 6,976 1,056 240 3,629 1,638 339 74
Source: MoF

Bulletin-Ministry of Finance of the Republic of Macedonia
48
Table 8. Core Budget ExpendituresTable 8. Core Budget ExpendituresTable 8. Core Budget ExpendituresTable 8. Core Budget Expenditures
Denar Denar Denar Denar millionmillionmillionmillion
TOTAL TOTAL TOTAL TOTAL EXPENDITURESEXPENDITURESEXPENDITURESEXPENDITURES
Salaries, Salaries, Salaries, Salaries, salary salary salary salary
supplements supplements supplements supplements and and and and
allowancesallowancesallowancesallowances
Goods Goods Goods Goods and and and and
servicesservicesservicesservices ReservesReservesReservesReserves TransfersTransfersTransfersTransfers InterestInterestInterestInterest
Capital Capital Capital Capital ExpendituresExpendituresExpendituresExpenditures
1=(2+3+4+5+6+7) 2 3 4 5 6 7
2006200620062006 63,555 22,223 7,604 318 24,491 2,811 6,108
2007200720072007 75,455 22,300 9,153 366 30,241 2,574 10,821
2008200820082008 88,710 19,293 12,486 599 37,133 2,488 16,711
2009200920092009 88,071 21,024 9,736 564 44,048 2,101 10,598
2010201020102010 89,983 21,201 9,058 175 45,348 2,911 11,290
2011201120112011 95,741 21,498 9,112 105 48,762 3,219 13,045
2012201220122012 99,236 21,067 8,993 104 52,944 3,979 12,149
2013201320132013 104,102 21,035 9,795 94 57,195 4,599 11,384
2013 2013 2013 2013 QQQQ----1111 28,438 5,221 2,904 15 15,624 1,162 3,512
QQQQ----2222 24,889 5,249 2,495 0 13,403 897 2,845
QQQQ----3333 24,135 5,248 1,869 12 13,701 1,111 2,194
QQQQ----4444 26,640 5,317 2,527 67 14,467 1,429 2,833
2014 Q2014 Q2014 Q2014 Q----1111 29,343 5,328 2,764 57 16,956 1,040 3,198
QQQQ----2222 25,493 5,399 2,444 18 13,833 1,249 2,550
QQQQ----3333 24,431 5,328 2,764 57 16,956 1,040 3,198
2013 I2013 I2013 I2013 I 9,268 1,731 1,185 3,935 850 1,567
IIIIIIII 7,821 1,742 909 1 4,309 206 654
IIIIIIIIIIII 11,349 1,748 810 14 7,380 106 1,291
IVIVIVIV 9,669 1,730 1,179 5,129 221 1,410
VVVV 7,465 1,779 624 4,211 231 620
VIVIVIVI 7,755 1,740 692 4,063 445 815
VIIVIIVIIVII 9,968 1,779 880 8 5,741 664 896
VIIIVIIIVIIIVIII 7,033 1,740 512 4,018 238 525
IXIXIXIX 7,134 1,729 477 4 3,942 209 773
XXXX 8,259 1,763 816 2 4,560 296 822
XIXIXIXI 7,918 1,768 458 4 4,859 329 500
XIIXIIXIIXII 10,463 1,786 1,253 61 5,048 804 1,511
2012012012014444 IIII 7,804 1,752 460 57 4,328 693 514
IIIIIIII 12,237 1,780 1,071 7,745 186 1,455
IIIIIIIIIIII 9,302 1,796 1,233 4,883 161 1,229
IVIVIVIV 9,672 1,769 1,349 4,975 419 1,160
VVVV 8,171 1,782 616 12 4,435 315 1,011
VIVIVIVI 7,650 1,848 479 6 4,423 515 379
VIIVIIVIIVII 8,991 1,783 844 4,848 680 836
VIIIVIIIVIIIVIII 7,361 1,764 568 4,341 243 445
IXIXIXIX 8,079 1,796 615 4,721 296 651
Source: MoF

Bulletin-Ministry of Finance of the Republic of Macedonia
49
FUNDSFUNDSFUNDSFUNDS
0
5.000
10.000
15.000
20.000
25.000
30.000
20092010
20112012
2013
1.848
1.651 1.6991.746
1.802
10.7
08
10.8
99
11.17
0
11.4
95
12.0
06
26.2
81
2613
7
26.8
90
27.5
24
28.6
50
EA HIF PDIF
Chart Chart Chart Chart 8888. Social contributions (PDIF, HIF and Employment Agency). Social contributions (PDIF, HIF and Employment Agency). Social contributions (PDIF, HIF and Employment Agency). Social contributions (PDIF, HIF and Employment Agency)
Source: MoF
33,532 34,44335,751
37,293
40,807
1,7342,194
2,2692,239 1,935
16,435 16,655 17,661 18,408 18,606
0
5.000
10.000
15.000
20.000
25.000
30.000
35.000
40.000
45.000
2009 2010 2011 2012 2013
Pensions (PDIF) Pecuniarary allowance (EA) Health Protection (HIF)
Chart Chart Chart Chart 9999. Expenditures related to pensions, health protection and pecuniary . Expenditures related to pensions, health protection and pecuniary . Expenditures related to pensions, health protection and pecuniary . Expenditures related to pensions, health protection and pecuniary
allowancesallowancesallowancesallowances
De
nar
mill
ion

Bulletin-Ministry of Finance of the Republic of Macedonia
50
Table 9. Social Contributions (PDIF, HIF and Employment Agency)Table 9. Social Contributions (PDIF, HIF and Employment Agency)Table 9. Social Contributions (PDIF, HIF and Employment Agency)Table 9. Social Contributions (PDIF, HIF and Employment Agency)
Denar Denar Denar Denar millionmillionmillionmillion
PDIFPDIFPDIFPDIF HIFHIFHIFHIF EAEAEAEA TOTAL TOTAL TOTAL TOTAL
CONTRIBUTIONSCONTRIBUTIONSCONTRIBUTIONSCONTRIBUTIONS
2005200520052005 18,300 8,982 1,313 28,595
2006200620062006 19,948 9,447 1,371 30,766
2007200720072007 21,936 9,998 1,523 33,457
2008200820082008 25,586 10,873 1,790 38,249
2009200920092009 26,281 10,708 1,848 38,837
2010201020102010 26,137 10,899 1,651 38,687
2011201120112011 26,890 11,170 1,699 39,759
2012201220122012 27,524 11,495 1,746 40,765
2013201320132013 28,650 12,006 1,802 42,458
2013 2013 2013 2013 QQQQ----1111 6,537 2,770 413 9,720
QQQQ----2222 7,017 2,973 446 10,436
QQQQ----3333 7,194 3,022 455 10,671
QQQQ----4444 7,902 3,241 488 11,631
2014 Q2014 Q2014 Q2014 Q----1111 6,874 2,904 433 10,211
QQQQ----2222 7,327 3,098 466 10,891
QQQQ----3333 7,415 3,164 473 11,052
2013 I2013 I2013 I2013 I 1,898 794 119 2,811
IIIIIIII 2,322 976 147 3,445
IIIIIIIIIIII 2,317 1,000 147 3,464
IVIVIVIV 2,625 1,120 168 3,913
VVVV 2,162 907 136 3,205
VIVIVIVI 2,230 946 142 3,318
VIIVIIVIIVII 2,553 1,064 160 3,777
VIIIVIIIVIIIVIII 2,307 974 147 3,428
IXIXIXIX 2,334 984 148 3,466
XXXX 2,422 1,012 153 3,587
XIXIXIXI 2,614 1,023 154 3,791
XIIXIIXIIXII 2,866 1,206 181 4,253
2012012012014444 IIII 2,033 853 128 3,014
IIIIIIII 2,409 1,016 153 3,578
IIIIIIIIIIII 2,432 1,035 152 3,619
IVIVIVIV 2,520 1,068 160 3,748
VVVV 2,386 1,008 152 3,546
VIVIVIVI 2,421 1,022 154 3,597
VIIVIIVIIVII 2,568 1,086 164 3,818
VIIIVIIIVIIIVIII 2,363 1,018 151 3,532
IXIXIXIX 2,484 1,060 158 3,702
Source: MoF

Bulletin-Ministry of Finance of the Republic of Macedonia
51
Table 10. Expenditures related to pensions, health protection and pecuniary Table 10. Expenditures related to pensions, health protection and pecuniary Table 10. Expenditures related to pensions, health protection and pecuniary Table 10. Expenditures related to pensions, health protection and pecuniary
allowancesallowancesallowancesallowances
Denar Denar Denar Denar millionmillionmillionmillion
Pensions (PDIF)Pensions (PDIF)Pensions (PDIF)Pensions (PDIF) Health Protection Health Protection Health Protection Health Protection
(HIF)(HIF)(HIF)(HIF) Pecuniary allowance Pecuniary allowance Pecuniary allowance Pecuniary allowance
(EA)(EA)(EA)(EA)
2005200520052005 24,969 13,440 2,425
2006200620062006 25,410 14,282 1,992
2007200720072007 26,308 14,681 1,607
2008200820082008 30,875 17,291 1,521
2009200920092009 33,532 16,435 1,734
2010201020102010 34,443 16,655 2,194
2011201120112011 35,751 17,661 2,269
2012201220122012 37,293 18,408 2,239
2013201320132013 40,807 18,606 1,935
2013 2013 2013 2013 QQQQ----1111 9,775 4,482 479
QQQQ----2222 10,319 4,569 429
QQQQ----3333 10,255 4,711 518
QQQQ----4444 10,458 4,844 509
2014 Q2014 Q2014 Q2014 Q----1111 10,654 4,698 365
QQQQ----2222 11,064 4,803 404
QQQQ----3333 11,063 4,263 443
2013 I2013 I2013 I2013 I 3,225 1,319 172
IIIIIIII 3,191 1,585 144
IIIIIIIIIIII 3,359 1,578 163
IVIVIVIV 3,505 1,570 139
VVVV 3,408 1,481 147
VIVIVIVI 3,406 1,518 143
VIIVIIVIIVII 3,432 1,597 207
VIIIVIIIVIIIVIII 3,414 1,492 168
IXIXIXIX 3,409 1,622 143
XXXX 3,521 1,611 135
XIXIXIXI 3,468 1,567 222
XIIXIIXIIXII 3,469 1,666 152
2012012012014444 IIII 3,505 1,327 121
IIIIIIII 3,477 1,650 122
IIIIIIIIIIII 3,672 1,721 122
IVIVIVIV 3,703 1,586 126
VVVV 3,668 1,670 153
VIVIVIVI 3,693 1,547 125
VIIVIIVIIVII 3,685 1,412 128
VIIIVIIIVIIIVIII 3,687 1,371 124
IXIXIXIX 3,691 1,480 191
Source: MoF

Bulletin-Ministry of Finance of the Republic of Macedonia
52
AAAAAAAATTTTTTTTTTTTTTTTAAAAAAAACCCCCCCCHHHHHHHHMMMMMMMMEEEEEEEENNNNNNNNTTTTTTTT
METHODOLOGY OF FISCAL TABLE OF THE BUDGET OF THE REPUBLIC OF METHODOLOGY OF FISCAL TABLE OF THE BUDGET OF THE REPUBLIC OF METHODOLOGY OF FISCAL TABLE OF THE BUDGET OF THE REPUBLIC OF METHODOLOGY OF FISCAL TABLE OF THE BUDGET OF THE REPUBLIC OF
MACEDONIAMACEDONIAMACEDONIAMACEDONIA
Methodology used when preparing the fiscal tables (showing the projected. i.e. realized
deficit or surplus) i.e. showing revenues and expenditures above the lineabove the lineabove the lineabove the line and inflows
(borrowing. privatisation and concession proceeds) and outflows (repayment of debt
principal) below the line (below the line (below the line (below the line (whereby “line” means line showing deficit/surplus) is according
to the IMF Government Finance Statistics Manual (GFS Manual 1986). However, when
preparing the balance sheets of the Budget of the Republic of Macedonia. Inflows are also
shown as revenues, i.e. outflows as expenditures. Principle of balancing, i.e. equalizing
revenue (including inflows) and expenditure side (including outflows) is applied on the
balance sheets during the budget planning process. When shown in the fiscal tables
revenues and expenditures are above the line while inflows and outflows below the line.
Difference between revenues and expenditures is equal to surplus or deficit. Surplus, i.e.
deficit should be equal to the financing below the line but with opposite sign. Thus, if there
is a deficit (negative sign) there should be financing (positive sign). Financing is obtained
as difference between inflows and outflows and net changes in deposits (being actually
residual of the three previously mentioned categories: inflows. outflows and
deficit/surplus).
As for fiscal tables, net changes in deposits are shown below the line under inflows (shown
with “-“ if there is increase in deposits. or with “+” if there is drawing down of deposits
1. Basic scheme of fisca1. Basic scheme of fisca1. Basic scheme of fisca1. Basic scheme of fiscal table according to GFS Methodologyl table according to GFS Methodologyl table according to GFS Methodologyl table according to GFS Methodology
REVENUESREVENUESREVENUESREVENUES
EXPENDITURESEXPENDITURESEXPENDITURESEXPENDITURES
SURPLUS/DEFICITSURPLUS/DEFICITSURPLUS/DEFICITSURPLUS/DEFICIT = REVENUES = REVENUES = REVENUES = REVENUES –––– EXPENDITURES EXPENDITURES EXPENDITURES EXPENDITURES line
FINANCINGFINANCINGFINANCINGFINANCING = surplus/ deficit with opposite sign. i.e. inflows-outflows
INFLOWSINFLOWSINFLOWSINFLOWS
DEPOSITSDEPOSITSDEPOSITSDEPOSITS +/-
OUTFLOWSOUTFLOWSOUTFLOWSOUTFLOWS
Funds’ BudgetsFunds’ BudgetsFunds’ BudgetsFunds’ Budgets
Core
Budget
Donations Donations Donations Donations
BudgetBudgetBudgetBudget Loans Loans Loans Loans
BudgetBudgetBudgetBudget Budget of Budget of Budget of Budget of
selfselfselfself----
financing financing financing financing
activitiesactivitiesactivitiesactivities
Central BudgetCentral BudgetCentral BudgetCentral Budget
Budget of RMBudget of RMBudget of RMBudget of RM

Bulletin-Ministry of Finance of the Republic of Macedonia
53
PPPPPPPPUUUUUUUUBBBBBBBBLLLLLLLLIIIIIIIICCCCCCCC DDDDDDDDEEEEEEEEBBBBBBBBTTTTTTTT

Bulletin-Ministry of Finance of the Republic of Macedonia
54
Table 1. Table 1. Table 1. Table 1. PublicPublicPublicPublic DebDebDebDebtttt
2007200720072007 2008200820082008 2009200920092009 2010201020102010 2011201120112011 2012201220122012 2013201320132013 Q1Q1Q1Q1----2014201420142014 Q2Q2Q2Q2----2014201420142014 31.07.201431.07.201431.07.201431.07.2014 31.08.201431.08.201431.08.201431.08.2014 30.09.201430.09.201430.09.201430.09.2014
GENERAL GOVERNMENT DEBTGENERAL GOVERNMENT DEBTGENERAL GOVERNMENT DEBTGENERAL GOVERNMENT DEBT (Central (Central (Central (Central
GovernmentGovernmentGovernmentGovernment, , , , Public Funds and MunicipalitiesPublic Funds and MunicipalitiesPublic Funds and MunicipalitiesPublic Funds and Municipalities)))) 1111,,,,430430430430....0000 1111,,,,387387387387....1111 1111,,,,597597597597....2222 1111,,,,710710710710....8888 2222,,,,092092092092....9999 2222,,,,554554554554....5555 2222,,,,771771771771....6666 2222,,,,865865865865....1111 2222,,,,810810810810....2222 3333,,,,321321321321....1111 3333,,,,379379379379....7777 3,355.83,355.83,355.83,355.8
External general government debtExternal general government debtExternal general government debtExternal general government debt**** 877877877877....2222 921921921921....2222 1111,,,,105105105105....3333 1111,,,,173173173173....8888 1111,,,,582582582582....1111 1111,,,,615615615615....9999 1111,,,,597597597597....5555 1111,,,,602602602602....8888 1111,,,,581581581581....0000 2222,,,,086086086086....1111 2222,,,,129129129129....1111 2,108.22,108.22,108.22,108.2
Central Government 841.8 886.7 1,074.4 1,146.5 1,558.4 1,592.5 1,591.9 1,597.2 1,575.4 2,080.5 2,123.5 2,102.6
Public Funds 35.4 34.6 30.9 27.3 23.6 20.0 0.0 0.0 0.0 0.0 0.0 0.0
Municipalities 0.0 0.0 0.0 0.0 0.0 3.4 5.6 5.6 5.6 5.6 5.6 5.6
Domestic general government debtDomestic general government debtDomestic general government debtDomestic general government debt 552552552552....8888 465465465465....9999 492492492492....0000 537537537537....0000 510510510510....8888 938938938938....6666 1111,,,,174174174174....1111 1111,,,,262262262262....3333 1111,,,,229229229229....2222 1111,,,,235235235235....1111 1111,,,,250250250250....6666 1,247.61,247.61,247.61,247.6
Central Government 552.8 465.5 491.7 536.8 506.7 932.0 1,165.1 1,252.7 1,217.6 1,223.4 1,238.9 1,236.2
Structural bonds 396.3 343.5 282.5 226.1 152.1 126.8 103.2 100.8 79.3 77.1 85.8 86.0
Stopanska banka rehabilitation bond 0.0 0.0 0.0 0.0 0.0 0.0 0.0 0.0 0.0 0.0 0.0 0.0
Bond for selective credits 17.0 16.9 16.9 16.9 16.9 16.9 16.9 16.8 16.8 16.8 16.8 16.8
Stopanska banka privatization bond 60.1 51.5 42.9 34.3 27.9 19.3 10.7 8.6 6.4 4.3 4.3 4.3
Bond for old foreign exchange savings 203.9 152.9 101.9 51.0 0.0 0.0 0.0 0.0 0.0 0.0 0.0 0.0
Denationalization bond (I-XIII issue) 115.4 122.2 120.7 124.0 107.3 90.6 75.6 75.4 56.1 56.0 64.7 64.9
Continuous Government Securities 156.5 122.0 209.2 310.6 354.6 805.2 1,061.9 1,152.0 1,138.3 1,146.3 1,153.2 1,150.2
o.w. Treasury bills for monetary purposes 75.5 0.0 0.0 0.0 0.0 0.0 0.0 0.0 0.0 0.0 0.0 0.0
Municipalities** 0.0 0.4 0.3 0.2 4.1 6.6 9.0 9.6 11.7 11.7 11.7 11.4
General government debt as % of gross – domestic
product*** 23.5 20.5 23.6 24.1 27.7 33.7 34.2 33.5 32.9 38.9 39.6 39.3
Guaranteed debt of public enterprises and state Guaranteed debt of public enterprises and state Guaranteed debt of public enterprises and state Guaranteed debt of public enterprises and state
owned joint stock companiesowned joint stock companiesowned joint stock companiesowned joint stock companies 139139139139....8888 171171171171....2222 175175175175....0000 225225225225....5555 322322322322....0000 354354354354....3333 509509509509....8888 522522522522....0000 615615615615....7777 612612612612....8888 617617617617....6666 628.2628.2628.2628.2
PUBPUBPUBPUBLIC DEBTLIC DEBTLIC DEBTLIC DEBT 1111,,,,569569569569....8888 1111,,,,558558558558....3333 1111,,,,772772772772....2222 1111,,,,936936936936....3333 2222,,,,414414414414....9999 2222,,,,908908908908....8888 3333,,,,281281281281....4444 3333,,,,387387387387....1111 3333,,,,425425425425....9999 3333,,,,934934934934....0000 3333,,,,997997997997....3333 3,984.03,984.03,984.03,984.0
External public debt* 1,017.0 1,092.4 1,280.3 1,388.2 1,881.9 1,941.2 2,078.7 2,096.8 2,169.4 2,671.6 2,719.4 2,709.8
Domestic public debt 552.8 465.9 492.0 548.0 532.9 967.6 1,202.7 1,290.3 1,256.5 1,262.3 1,277.9 1,274.2
Public debt as % of gross – domestic product*** 25.8 23.0 26.2 27.2 32.0 38.3 40.5 39.7 40.1 46.1 46.8 46.6
* Source: NBRM, ** Monthly data on municipal debt are preliminary, and it will be updated quarterly.
*** Data for gross-domestic product up to 2013 are official data from the State Statistical Office (published on 30.09.2014). Data for 2014 is projection of the Ministry of finance with real growth
of 3.5% and GDP deflator of 1.6%.

Bulletin-Ministry of Finance of the Republic of Macedonia
55
1262.3 1229.2 1250.6 1247.61602.8 1581.0
2129.1 2108.2
33.5% 32.9%
39.6% 39.3%
0%
5%
10%
15%
20%
25%
30%
35%
40%
45%
0
500
1000
1500
2000
2500
Q1-2014 Q2-2014 aug-14 sep-14
Chart 1. Trends in domestic and external general government debtChart 1. Trends in domestic and external general government debtChart 1. Trends in domestic and external general government debtChart 1. Trends in domestic and external general government debt
Domestic general government debt External general governmentdebt Total central government debt as % of GDP
52.8% 52.7% 55.0% 54.4% 53.5% 54.5% 61.6%
47.2% 47.3% 45.0% 45.6% 46.5% 45.5% 38.4%
0%
20%
40%
60%
80%
100%
Q1-2013 Q2-2013 Q3-2013 Q4-2013 Q1-2014 Q2-2014 Q3-2014
Fixed interest rate Variable interest rate
CharCharCharChart t t t 2222. Interest rate structure of total public debt. Interest rate structure of total public debt. Interest rate structure of total public debt. Interest rate structure of total public debt
55.6%59.8% 60.2%
58.2%56.3%
53.8%
62.1%
1.0% 0.9% 0.9% 0.8% 0.8% 0.8% 0.7%
18.6% 18.0% 17.9% 17.1% 16.6% 16.0%12.8%
22.2%19.0% 18.8%
21.9%24.4%
27.5%
22.8%
2.6% 2.3% 2.2% 2.0% 1.9% 2.0% 1.6%0%
10%
20%
30%
40%
50%
60%
70%
Q1-2013 Q2-2013 Q3-2013 Q4-2013 Q1-2014 Q2-2014 Q3-2014
EUR US$ SDR Denar Other
Chart Chart Chart Chart 3333. Currency structure of total public debt. Currency structure of total public debt. Currency structure of total public debt. Currency structure of total public debt

Bulletin-Ministry of Finance of the Republic of Macedonia
56
Aug.2013 Sep.2013 Oct.2013 Nov.2013 Dec.2013 Jan.2014 Feb.2014 Mar.2014 Apr.2014May
2014Jun.2014 Jul.2014 Aug.2014 Sep.2014
Principal repayment on the basis of domestic public debt 0.0 0.0 2.1 0.0 0.0 2.1 0.0 0.0 2.1 0.0 19.3 2.1 0.0 0.0
Interest repayment on the basis of domestic public debt 2.7 0.3 3.6 4.0 2.8 2.5 1.6 2.3 5.2 3.8 4.9 2.4 2.5 4.5
Principal repaymen on the basis of external public debt 3.2 1.9 5.5 7.3 2.64 9.2 3.2 5.1 6.6 7.67 32.1 3.7 4.8 30.5
Interest repayment on the basis of external public debt 1.1 0.3 0.9 2.2 10.3 8.0 1.4 0.3 1.15 2.12 3.5 7.9 1.4 0.3
0.0
10.0
20.0
30.0
40.0
50.0
60.0
inm
ilio
ns
eu
ros
ChartChartChartChart 4444. Repayments on the basis of the public debt. Repayments on the basis of the public debt. Repayments on the basis of the public debt. Repayments on the basis of the public debt
493.9 500.9 490.8 501.3 509.8 508.8 512.5 522.0613.3 618.0 615.7 612.8 617.6 628.2
6.1% 6.2% 6.1% 6.2% 6.3%6.0% 6.0% 6.1%
7.2% 7.2% 7.2% 7.2% 7.2% 7.4%
0%
1%
2%
3%
4%
5%
6%
7%
8%
0
100
200
300
400
500
600
700
Aug.2013 Sep.2013 Oct. 2013 Nov.2013 Dec.2013 Jan.2014 Feb.2014 Mar.2014 Apr.2014 May.2014 Jun.2014 Jul.2014 Aug.2014 Sep.2014
Chart Chart Chart Chart 5555. Guaranteed public debt. Guaranteed public debt. Guaranteed public debt. Guaranteed public debt
Stock of guaranteed public debt Guaranteed public debt as % of GDP (RHS)
3.00%
3.50%
4.00%
4.50%
5.00%
5.50%
6.00%
Jan.2013
Feb.2013
Mar.2013
Apr.2013
May20.13
Jun
.2013
Jul.2013
Au
g.2013
Sep.2013
Oct.2013
Nov.2013
Dec.2013
Jan.2014
Feb.2014
Mar.2014
Apr.2014
May20.14
Jun
.2014
Jul.2014
Avg
.2014
Sep.2014
Chart Chart Chart Chart 6666. Interest rate of GS without a currency clause. Interest rate of GS without a currency clause. Interest rate of GS without a currency clause. Interest rate of GS without a currency clause
3m 6m 12m 2y 3y 5y 10y

Bulletin-Ministry of Finance of the Republic of Macedonia
57
3.00%
3.50%
4.00%
4.50%
5.00%
5.50%
6.00%
Jan
.20
12
Fe
b.2
012
Ma
r.2
012
Ap
r.2
012
Ma
y.2
012
Jun
.20
12
Jul.2
012
Au
g.2
012
Se
p.2
012
Oc
t.2
012
No
e.2
012
De
c.2
012
Jan
.20
13
Fe
b.2
013
Ma
r.2
013
Ap
r.2
013
Ma
y.2
013
Jun
.20
13
Jul.2
013
Au
g.2
013
Se
p.2
013
Oc
t.2
013
No
e.2
013
De
c.2
013
Jan
.20
14
Fe
b.2
014
Ma
r.2
014
Ap
r.2
014
Ma
y.2
014
Jun
.20
14
Jul.2
014
Au
g.2
014
Se
p.2
014
Chart Chart Chart Chart 7777. Interest rate of GS with a currency clause. Interest rate of GS with a currency clause. Interest rate of GS with a currency clause. Interest rate of GS with a currency clause
3m 6m 12m 2y 3y 5y 10y
0
2,000
4,000
6,000
8,000
10,000
12,000
14,000
16,000
18,000
Jan.2013
Feb.2013
Mar.2013
Apr.2013
May.2013
Jun.2013
Jul.2013
Aug.2013
Sep.2013
Oct.2013
Noe.2013
Dec.2013
Jan.2014
Feb.2014
Mar.2014
Apr.2014
May.2014
Jun.2014
Jul.2014
Aug.2014
Sep.2014
Chart Chart Chart Chart 8888. Realized GS by month. Realized GS by month. Realized GS by month. Realized GS by month
3m TB 6m TB 12m TB 2y GB 3y GB 5y GB 10y GB
0.00
10,000.00
20,000.00
30,000.00
40,000.00
50,000.00
60,000.00
70,000.00
80,000.00
Jan.
2013
Feb.
2013
Mar.
2013
Apr.
2013
May.
2013
Jun.
2013
Jul.
2013
Aug.
2013
Sep.
2013
Oct.
2013
Noe.
2013
Dec.
2013
Jan.
2014
Feb.
2013
Mar.
2014
Apr.
2014
May.
2014
Jun.
2014
Jul.
2014
Aug.
2014
Sep.
2014
Chart Chart Chart Chart 9999. Stock of Undue GS. Stock of Undue GS. Stock of Undue GS. Stock of Undue GS
3m TB 6m TB 12m TB 2y GB 3y GB 5y GB 10y GB

Bulletin-Ministry of Finance of the Republic of Macedonia
58
Table 2. Results of Auctions of GSTable 2. Results of Auctions of GSTable 2. Results of Auctions of GSTable 2. Results of Auctions of GS
Denotement DZ2014/15-364 DО2014/20-1017 DО2014/21-1017dk DО2014/22-1019 DО2014/19-0924dk DО2014/23-1024
ISIN code MKMINFDYE159 MKMINF20GA22 MKMINF20GA30 MKMINF20GA48 MKMINF20GA14 MKMINF20GA55
Type of tender Tender with amount Tender with amount Tender with amount Tender with amount Tender with amount Tender with amount
Date/year of maturity 364 3 years 3 years 5 years 10 years 10 years
Auction date 02.09.2014 30.09.2014 30.09.2014 30.09.2014 02.09.2014 30.09.2014
Date of maturity 02.09.2015 02.10.2017 02.10.2017 02.10.2019 04.09.2024 02.10.2024
Exchange rate Den/EUR / / 61.6534 / 61.4878 /
Interest rate 3.20% / / / / /
Coupon interest rate / 3.65% 3.40% 3.90% 5.00% 4.80%
Price 96.8659 100.000 100.000 100.000 100.000 100.000
Offer 330,000,000 400,000,000 391,500,000 260,000,000 63,000,000 641,550,000
Demand 649,510,000 400,000,000 391,500,000 260,000,000 63,000,000 641,550,000
Realization 330,000,000 400,000,000 391,500,000 260,000,000 63,000,000 641,550,000
Results of Auctions of GSResults of Auctions of GSResults of Auctions of GSResults of Auctions of GS
September 2014 September 2014 September 2014 September 2014
Interest rate of GS without a currency clauseInterest rate of GS without a currency clauseInterest rate of GS without a currency clauseInterest rate of GS without a currency clause Interest rate of GS with a currency clauseInterest rate of GS with a currency clauseInterest rate of GS with a currency clauseInterest rate of GS with a currency clause
6 months 12 months 2 years 3 years 5 years 10 years 6 months 12 months 2 years 3 years 5 years 10 years
sep. 2013 3,60% sep. 2013 3,10% 3,80%
oct. 2013 3,15% 3,60% oct. 2013 3,10% 3,40% 3,80% 4,60%
noe.2013 3,15% 3,60% noe.2013 3,10% 3,40% 4,60%
dec.2013 3,15% 3,60% 4,00% dec.2013 3,10% 3,40% 4,60%
jan.2014 3,15% 5,30% jan.2014 3,10% 4,60% 5,00%
feb. 2014 3,60% 4,00% 4,80% feb. 2014 4,60%
mar. 2014 3,60% 4,00% mar. 2014 4,60%
apr. 2014 3,15% 3,60% apr. 2014 3,10% 4,60% 5,00%
may. 2014 3,15% 3,60% 4,80% may. 2014 3,10% 4,60%
june 2014 3,15% 3,60% 4,00% 5,30% june 2014 3,10% 4,60% 5,00%
july 2014 3,20% july 2014 3,00% 5,00%
aug. 2014 3,20% aug. 2014 5,00%
sep. 2014 3,20% 3,65% 3,90% 4,80% sep. 2014 3,40% 5,00%

Bulletin-Ministry of Finance of the Republic of Macedonia
59
Ministry of Finance Ministry of Finance Ministry of Finance Ministry of Finance
Macroeconomic Policy DepartMacroeconomic Policy DepartMacroeconomic Policy DepartMacroeconomic Policy Departmentmentmentment
www.finance.gov.mk
Report was prepared by:Report was prepared by:Report was prepared by:Report was prepared by:
Ana Nikolova
Angela Vasovska
Aneta Dudeska
Bojana Ilievska
Goko Gorgeski
Koprinka Sapunova
Negati Kurtisi
Controlled by: Controlled by: Controlled by: Controlled by: Sanja Kikovska-Georgievska, Ph.D.
Approved by: Approved by: Approved by: Approved by: Jordan Trajkovski
November 2014, Skopje