Embed Size (px)
Citation preview

LOGO
National Centre for Agricultural Economics and
Policy Research (NCAP)
Bilateral Agricultural Trade between India and Pakistan:
Trend, Compositions and Future Directions
Prof Ramesh Chand
Director
and
Dr. Raka Saxena
Senior Scientist

Na
tio
na
l C
en
tre
fo
r A
gri
cu
ltu
ral E
co
no
mic
s a
nd
Po
lic
y R
es
ea
rch
N
ati
on
al C
en
tre
fo
r A
gri
cu
ltu
ral E
co
no
mic
s a
nd
Po
lic
y R
es
ea
rch
Introduction
Agricultural trade constitutes the major chunk of trade between India and
Pakistan
In 1996, India accorded Most Favored Nation(MFN) to Pakistan; Pakistan not
yet given the MFN status to India
There have been disruption in normal trade:
India stopped trade via air and land routes between 2001 and 2004
The cross border trade was stopped in 2013.
Both countries part of South Asian Free Trade Agreement (SAFTA) which came
into effect on 1.1.2006; the trade governed under the SAFTA agreement

Na
tio
na
l C
en
tre
fo
r A
gri
cu
ltu
ral E
co
no
mic
s a
nd
Po
lic
y R
es
ea
rch
N
ati
on
al C
en
tre
fo
r A
gri
cu
ltu
ral E
co
no
mic
s a
nd
Po
lic
y R
es
ea
rch
Trade policy of India and Pakistan
Contents
Trend and composition of
bilateral agricultural trade
Emerging and loosing commodities
Regional orientation
Trade intensity and complementarity
indices
Way forward
Na
tio
na
l C
en
tre
fo
r A
gri
cu
ltu
ral E
co
no
mic
s a
nd
Po
lic
y R
es
ea
rch
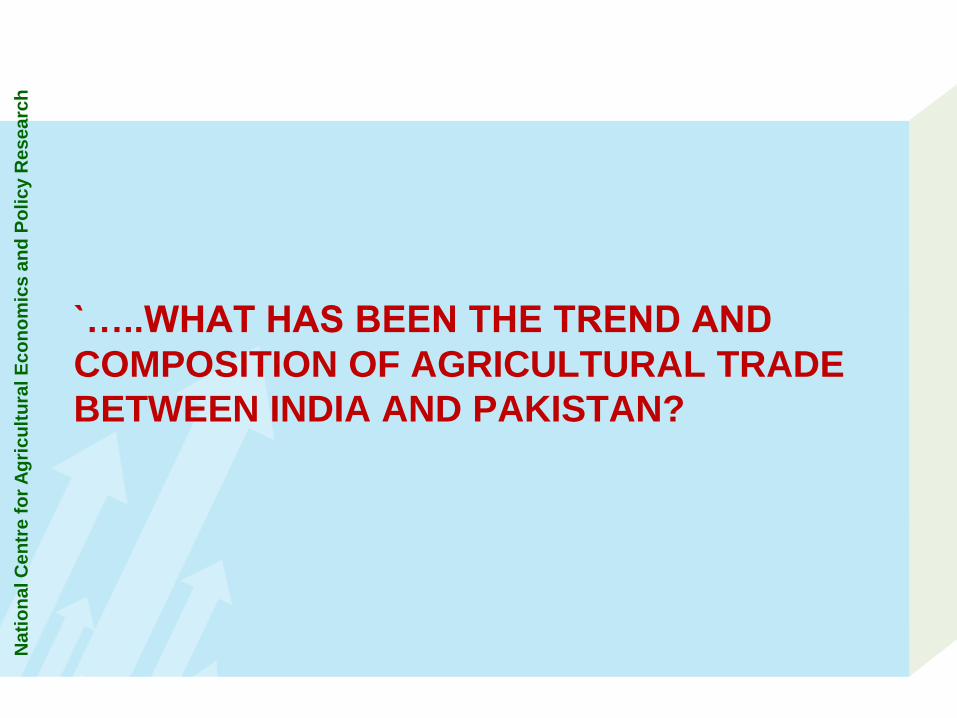
`…..WHAT HAS BEEN THE TREND AND
COMPOSITION OF AGRICULTURAL TRADE
BETWEEN INDIA AND PAKISTAN?
Na
tio
na
l C
en
tre
fo
r A
gri
cu
ltu
ral E
co
no
mic
s a
nd
Po
lic
y R
es
ea
rch
N
ati
on
al C
en
tre
fo
r A
gri
cu
ltu
ral E
co
no
mic
s a
nd
Po
lic
y R
es
ea
rch
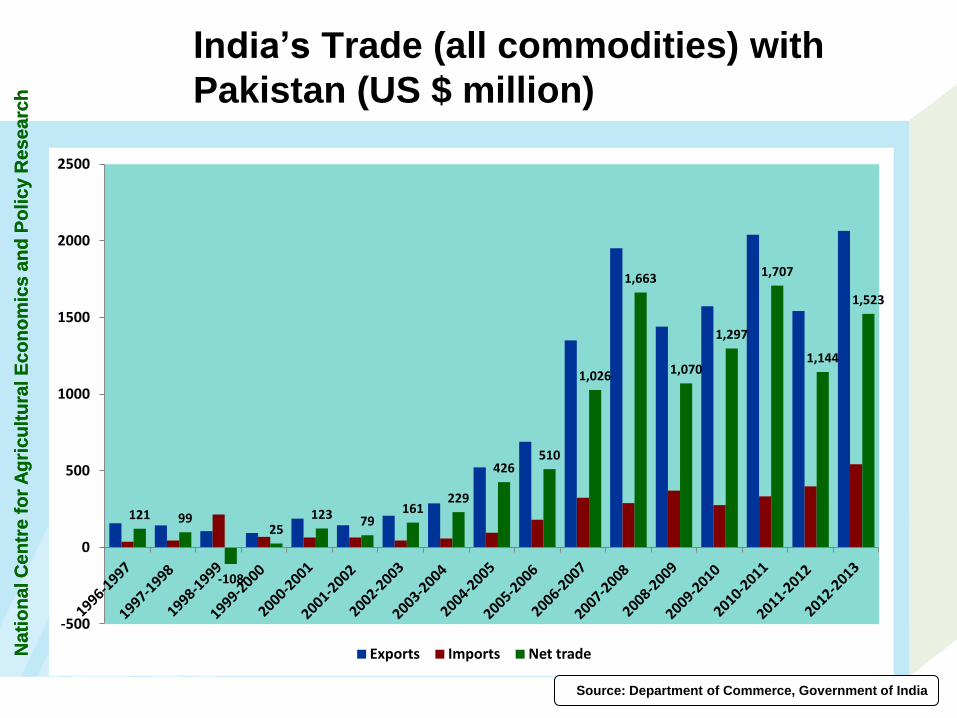
India’s Trade (all commodities) with
Pakistan (US $ million)
121 99
-108
25 123 79
161 229
426 510
1,026
1,663
1,070
1,297
1,707
1,144
1,523
-500
0
500
1000
1500
2000
2500
Exports Imports Net trade
Source: Department of Commerce, Government of India
Na
tio
na
l C
en
tre
fo
r A
gri
cu
ltu
ral E
co
no
mic
s a
nd
Po
lic
y R
es
ea
rch
N
ati
on
al C
en
tre
fo
r A
gri
cu
ltu
ral E
co
no
mic
s a
nd
Po
lic
y R
es
ea
rch
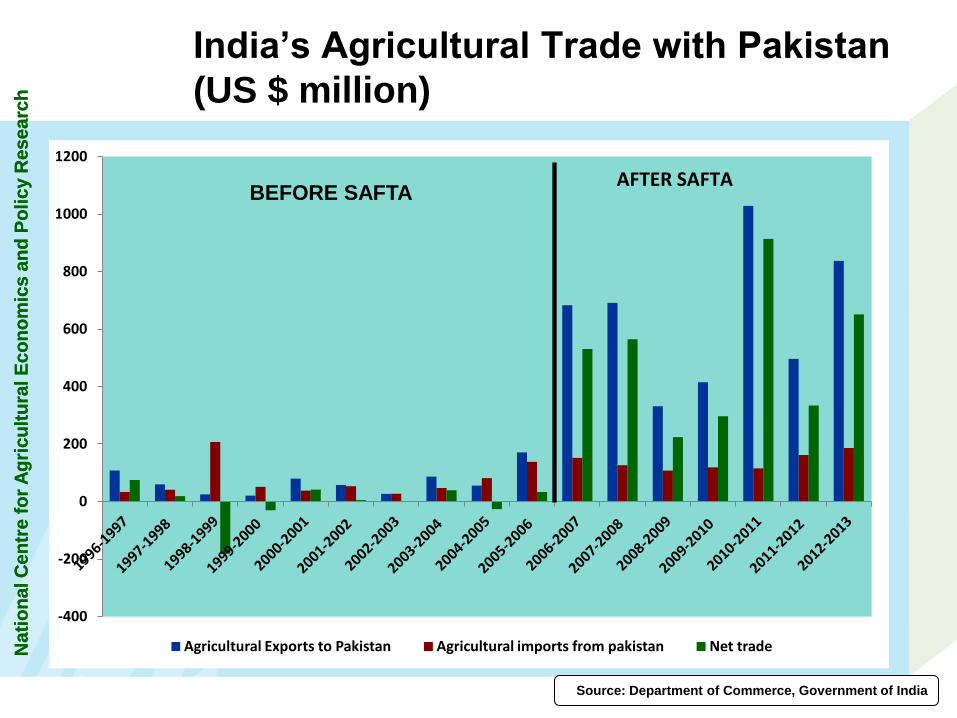
-400
-200
0
200
400
600
800
1000
1200
Agricultural Exports to Pakistan Agricultural imports from pakistan Net trade
AFTER SAFTA
Source: Department of Commerce, Government of India
India’s Agricultural Trade with Pakistan
(US $ million)
BEFORE SAFTA

Na
tio
na
l C
en
tre
fo
r A
gri
cu
ltu
ral E
co
no
mic
s a
nd
Po
lic
y R
es
ea
rch
N
ati
on
al C
en
tre
fo
r A
gri
cu
ltu
ral E
co
no
mic
s a
nd
Po
lic
y R
es
ea
rch
Broad Composition of India’s exports to
Pakistan - agricultural and non-agricultural
(US $ million)
0
500
1000
1500
2000
2500
Agricultural Exports to Pakistan Non Agri exports to Pakistan
Source: Department of Commerce, Government of India
Agri share high, rising

Na
tio
na
l C
en
tre
fo
r A
gri
cu
ltu
ral E
co
no
mic
s a
nd
Po
lic
y R
es
ea
rch
N
ati
on
al C
en
tre
fo
r A
gri
cu
ltu
ral E
co
no
mic
s a
nd
Po
lic
y R
es
ea
rch
Share of agriculture in Pakistan
Imports from India %
0.00
10.00
20.00
30.00
40.00
50.00
60.00
70.00
80.00
Na
tio
na
l C
en
tre
fo
r A
gri
cu
ltu
ral E
co
no
mic
s a
nd
Po
lic
y R
es
ea
rch
N
ati
on
al C
en
tre
fo
r A
gri
cu
ltu
ral E
co
no
mic
s a
nd
Po
lic
y R
es
ea
rch
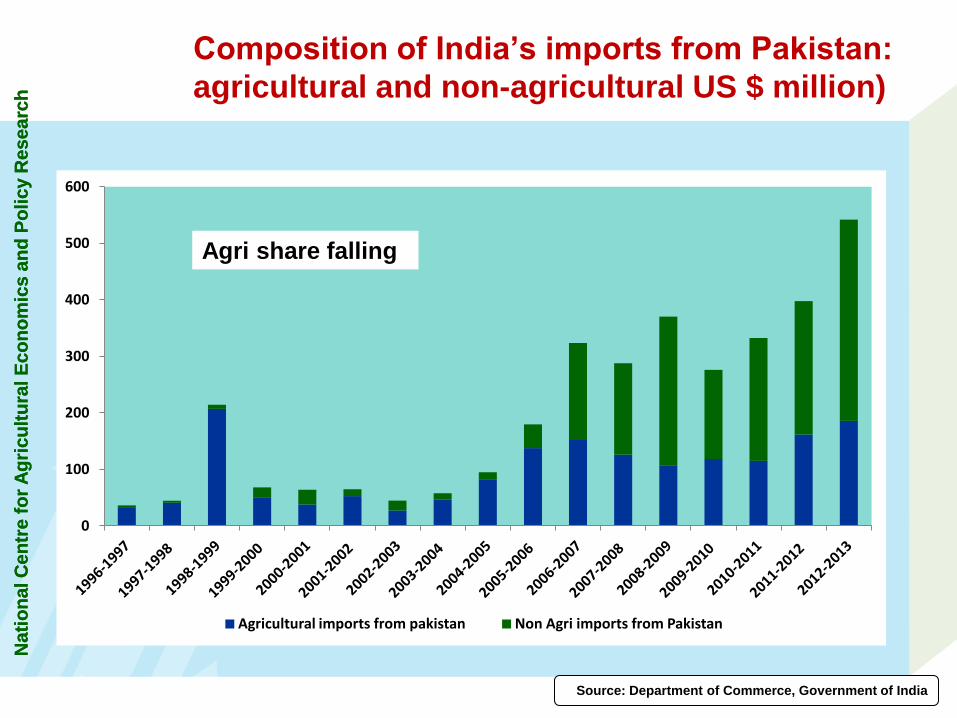
0
100
200
300
400
500
600
Agricultural imports from pakistan Non Agri imports from Pakistan
Source: Department of Commerce, Government of India
Composition of India’s imports from Pakistan:
agricultural and non-agricultural US $ million)
Agri share falling

Na
tio
na
l C
en
tre
fo
r A
gri
cu
ltu
ral E
co
no
mic
s a
nd
Po
lic
y R
es
ea
rch
N
ati
on
al C
en
tre
fo
r A
gri
cu
ltu
ral E
co
no
mic
s a
nd
Po
lic
y R
es
ea
rch
Share of Agri in India’s Import
from Pakistan
91.76 92.19 96.54
74.12
59.41
81.44
60.49
81.32 85.62
76.70
46.99 43.80
28.99
42.88
34.57
40.65
34.33
0.00
10.00
20.00
30.00
40.00
50.00
60.00
70.00
80.00
90.00
100.00

Na
tio
na
l C
en
tre
fo
r A
gri
cu
ltu
ral E
co
no
mic
s a
nd
Po
lic
y R
es
ea
rch
N
ati
on
al C
en
tre
fo
r A
gri
cu
ltu
ral E
co
no
mic
s a
nd
Po
lic
y R
es
ea
rch
Major agro commodities exported to
Pakistan (US ’000 $)
0
100000
200000
300000
400000
500000
600000
700000
TE 1998/99 TE 2001/02 TE 2004/05 TE 2007/08 TE 2010/11 TE 2012/13
Edible Vegetables Coffee Tea Cotton Sugar Cereals oilseeds fruits Meat
Source: Department of Commerce, Government of India
Raw cotton and vegetables
emerged and dominates

Na
tio
na
l C
en
tre
fo
r A
gri
cu
ltu
ral E
co
no
mic
s a
nd
Po
lic
y R
es
ea
rch
N
ati
on
al C
en
tre
fo
r A
gri
cu
ltu
ral E
co
no
mic
s a
nd
Po
lic
y R
es
ea
rch
Share of major commodities in
agricultural exports to Pakistan (%)
Commodity/
commodity groups 1996-1997 2000-2001 2004-2005 2009-2010 2012-2013
Dairy Products 0.00 0.00 2.13 0.64 1.71
Vegetables 0.27 1.28 11.73 14.41 17.27
Coffee, Tea etc 10.56 18.36 26.99 8.89 10.00
Fruits 0.63 0.31 0.18 0.45 2.99
Cereals 0.04 0.53 7.81 2.63 1.73
Oilseeds 2.25 3.33 8.36 8.55 6.26
Sugar 80.60 71.20 1.00 0.26 0.06
Cotton 0.12 0.09 30.40 58.46 56.38
Others 5.54 4.90 11.40 5.71 3.61
Source: Department of Commerce, Government of India

Na
tio
na
l C
en
tre
fo
r A
gri
cu
ltu
ral E
co
no
mic
s a
nd
Po
lic
y R
es
ea
rch
N
ati
on
al C
en
tre
fo
r A
gri
cu
ltu
ral E
co
no
mic
s a
nd
Po
lic
y R
es
ea
rch
Trends in exports of major commodities
(US ’000 $)
0
10000
20000
30000
40000
50000
60000
70000
80000
TE 1998/99
TE 2001/02
TE 2004/05
TE 2007/08
TE 2010/11
TE 2012/13
Edible Vegetables
Pulses Tomatoes Onion Other Fresh Vegetables
0
10000
20000
30000
40000
50000
TE 1998/99 TE 2001/02 TE 2004/05 TE 2007/08 TE 2010/11 TE 2012/13
Beverage and Spices
Tea PEPPER SEEDS OF CORIANDER CARDAMOMS GINGER
0
50000
100000
150000
200000
250000
300000
TE 1998/99 TE 2001/02 TE 2004/05 TE 2007/08 TE 2010/11 TE 2012/13
Cotton
COTTON, NOT CARDED OR COMBED COTN YRN WOVN FBRCS
0
2000
4000
6000
8000
10000
12000
TE 1998/99
TE 2001/02
TE 2004/05
TE 2007/08
TE 2010/11
TE 2012/13
Cereals
RICE GRAIN SORGHUM BUCKWHEAT MAIZE (CORN)
Source: Department of Commerce, Government of India

Na
tio
na
l C
en
tre
fo
r A
gri
cu
ltu
ral E
co
no
mic
s a
nd
Po
lic
y R
es
ea
rch
N
ati
on
al C
en
tre
fo
r A
gri
cu
ltu
ral E
co
no
mic
s a
nd
Po
lic
y R
es
ea
rch
0
5000
10000
15000
20000
TE 1998/99 TE 2001/02 TE 2004/05 TE 2007/08 TE 2010/11 TE 2012/13
Oilseeds
PLNTS AND PRTS OF PLNTS SEEDS FOR SOWING
GROUND-NUTS SUNFLOWER
0
20000
40000
60000
80000
100000
120000
140000
160000
TE 1998/99
TE 2001/02
TE 2004/05
TE 2007/08
TE 2010/11
TE 2012/13
Sugar
0
2000
4000
6000
8000
10000
12000
14000
16000
TE 1998/99 TE 2001/02 TE 2004/05 TE 2007/08 TE 2010/11 TE 2012/13
MEAT OF BOVINE ANIMALS
Source: Department of Commerce, Government of India
Trends in exports of major commodities
(US ’000 $)
Na
tio
na
l C
en
tre
fo
r A
gri
cu
ltu
ral E
co
no
mic
s a
nd
Po
lic
y R
es
ea
rch
N
ati
on
al C
en
tre
fo
r A
gri
cu
ltu
ral E
co
no
mic
s a
nd
Po
lic
y R
es
ea
rch
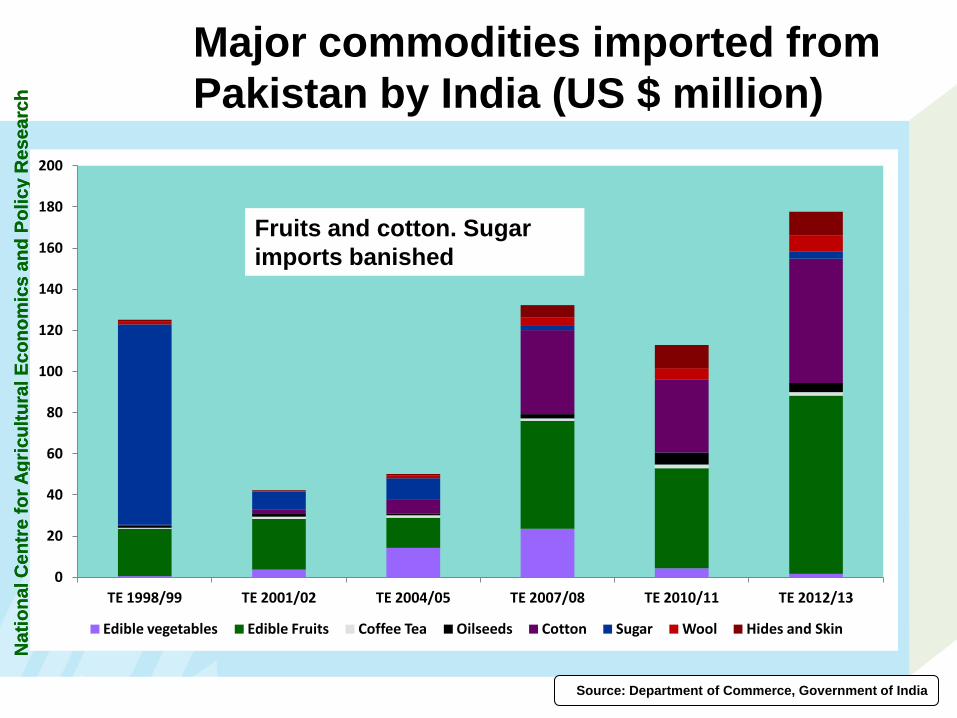
Major commodities imported from
Pakistan by India (US $ million)
Source: Department of Commerce, Government of India
0
20
40
60
80
100
120
140
160
180
200
TE 1998/99 TE 2001/02 TE 2004/05 TE 2007/08 TE 2010/11 TE 2012/13
Edible vegetables Edible Fruits Coffee Tea Oilseeds Cotton Sugar Wool Hides and Skin
Fruits and cotton. Sugar
imports banished

Na
tio
na
l C
en
tre
fo
r A
gri
cu
ltu
ral E
co
no
mic
s a
nd
Po
lic
y R
es
ea
rch
`…..HOW DIVERSIFIED ARE THE INDIAN
EXPORTS IN TERMS OF COVERAGE OF
COMMODITIES AND FOREIGN MARKETS?

Na
tio
na
l C
en
tre
fo
r A
gri
cu
ltu
ral E
co
no
mic
s a
nd
Po
lic
y R
es
ea
rch
N
ati
on
al C
en
tre
fo
r A
gri
cu
ltu
ral E
co
no
mic
s a
nd
Po
lic
y R
es
ea
rch
Diversification Index
(Gini-Hirschman Coefficient)
Commodity and Geographical concentration indices were
calculated by Gini-Hirschman Coefficient
Gxt = 100 - 100 (Xit/Xt)2
Commodity
Concentration/
diversification
Geographical
Concentration/
diversification
Xit is the value of exports of
the export destination i in the
year t. Xt is the total
agricultural exports in the year
t. Gxt is the diversification
coefficient
Formula Explanation
Cxt = 100 - 100 (Xit/Xt)2
Xit is the value of exports of
the commodity i in the year t.
Xt is the total agricultural
exports in the year t. Cxt is
the diversification coefficient

Na
tio
na
l C
en
tre
fo
r A
gri
cu
ltu
ral E
co
no
mic
s a
nd
Po
lic
y R
es
ea
rch
N
ati
on
al C
en
tre
fo
r A
gri
cu
ltu
ral E
co
no
mic
s a
nd
Po
lic
y R
es
ea
rch
Commodity diversification of India’s
Agri Exports to World
67.64
66.89
68.36
68.38
69.79
69.45
68.41
69.51
70.15
67.57
69.55
67.51
65.00
66.00
67.00
68.00
69.00
70.00
71.00
2001 2002 2003 2004 2005 2006 2007 2008 2009 2010 2011 2012

Na
tio
na
l C
en
tre
fo
r A
gri
cu
ltu
ral E
co
no
mic
s a
nd
Po
lic
y R
es
ea
rch
`HOW MUCH IS INTENSITY OF INDO – PAK
AGRICULTURAL EXPORTS W. R. TO TOTAL
AGRICULTURAL EXPORT FROM INDIA?

Na
tio
na
l C
en
tre
fo
r A
gri
cu
ltu
ral E
co
no
mic
s a
nd
Po
lic
y R
es
ea
rch
N
ati
on
al C
en
tre
fo
r A
gri
cu
ltu
ral E
co
no
mic
s a
nd
Po
lic
y R
es
ea
rch
Trade Intensity Index
TII =
sd Xsd / sw Xsw
wd Xwd / wy Xwy
X is the exports
w is the world
s is the Source
d is the destination
The numerator is the export share of the source region to the
destination, the denominator is the export share of the world to the destination.
Trade Intensity
The statistic tells us whether or not a region exports more (as a percentage) to a given destination than the world does on average to that
destination
Na
tio
na
l C
en
tre
fo
r A
gri
cu
ltu
ral E
co
no
mic
s a
nd
Po
lic
y R
es
ea
rch
N
ati
on
al C
en
tre
fo
r A
gri
cu
ltu
ral E
co
no
mic
s a
nd
Po
lic
y R
es
ea
rch
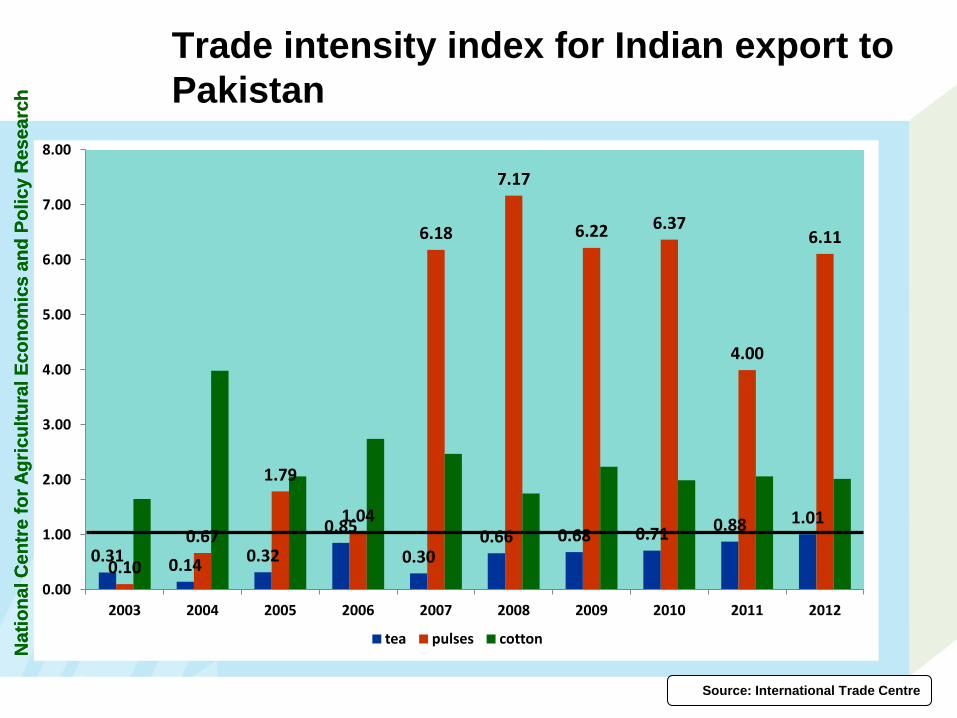
Trade intensity index for Indian export to
Pakistan
0.31 0.14
0.32
0.85
0.30 0.66 0.68 0.71 0.88 1.01
0.10
0.67
1.79
1.04
6.18
7.17
6.22 6.37
4.00
6.11
0.00
1.00
2.00
3.00
4.00
5.00
6.00
7.00
8.00
2003 2004 2005 2006 2007 2008 2009 2010 2011 2012
tea pulses cotton
Source: International Trade Centre

Na
tio
na
l C
en
tre
fo
r A
gri
cu
ltu
ral E
co
no
mic
s a
nd
Po
lic
y R
es
ea
rch
`…..WHAT HAS BEEN THE GROWTH IN
BILATERAL AGRICULTURAL TRADE AND
WHICH COMMODITIES ARE GAINING
MOMEMTUM?
Na
tio
na
l C
en
tre
fo
r A
gri
cu
ltu
ral E
co
no
mic
s a
nd
Po
lic
y R
es
ea
rch
N
ati
on
al C
en
tre
fo
r A
gri
cu
ltu
ral E
co
no
mic
s a
nd
Po
lic
y R
es
ea
rch
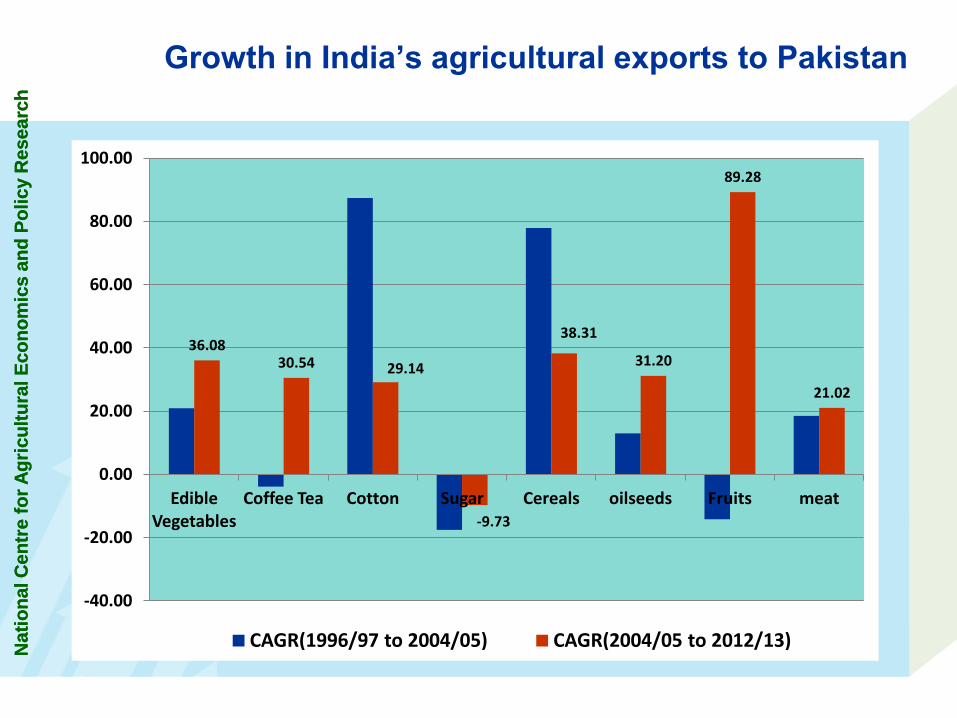
Growth in India’s agricultural exports to Pakistan
36.08 30.54 29.14
-9.73
38.31
31.20
89.28
21.02
-40.00
-20.00
0.00
20.00
40.00
60.00
80.00
100.00
Edible Vegetables
Coffee Tea Cotton Sugar Cereals oilseeds Fruits meat
CAGR(1996/97 to 2004/05) CAGR(2004/05 to 2012/13)
Na
tio
na
l C
en
tre
fo
r A
gri
cu
ltu
ral E
co
no
mic
s a
nd
Po
lic
y R
es
ea
rch
N
ati
on
al C
en
tre
fo
r A
gri
cu
ltu
ral E
co
no
mic
s a
nd
Po
lic
y R
es
ea
rch
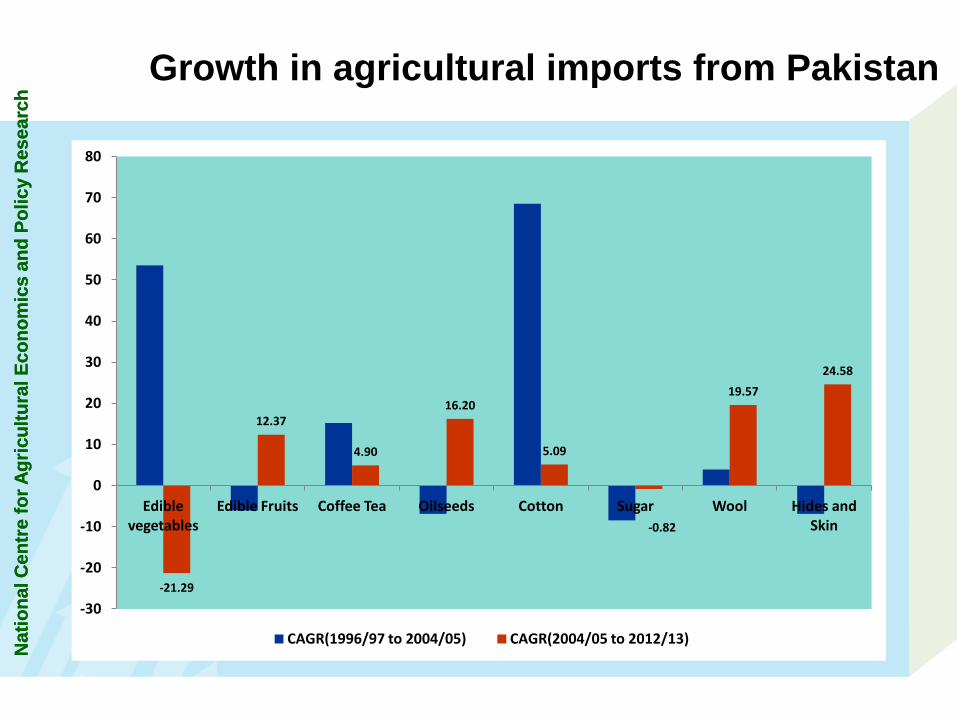
Growth in agricultural imports from Pakistan
-21.29
12.37
4.90
16.20
5.09
-0.82
19.57
24.58
-30
-20
-10
0
10
20
30
40
50
60
70
80
Edible vegetables
Edible Fruits Coffee Tea Oilseeds Cotton Sugar Wool Hides and Skin
CAGR(1996/97 to 2004/05) CAGR(2004/05 to 2012/13)

Na
tio
na
l C
en
tre
fo
r A
gri
cu
ltu
ral E
co
no
mic
s a
nd
Po
lic
y R
es
ea
rch
N
ati
on
al C
en
tre
fo
r A
gri
cu
ltu
ral E
co
no
mic
s a
nd
Po
lic
y R
es
ea
rch
Emerging and losing commodities in
agricultural exports to Pakistan
Sugar
Fruits
Cereals Oilseeds
Tea and
spices Losing
Commodities Emerging
Commodities
Vegetables
Cotton

Na
tio
na
l C
en
tre
fo
r A
gri
cu
ltu
ral E
co
no
mic
s a
nd
Po
lic
y R
es
ea
rch
N
ati
on
al C
en
tre
fo
r A
gri
cu
ltu
ral E
co
no
mic
s a
nd
Po
lic
y R
es
ea
rch
Vegetables Fruits
Cotton
Hides
and
Skins
Oilseeds
Emerging and losing commodities in
agricultural imports from Pakistan
Losing Commodities
Emerging Commodities

Na
tio
na
l C
en
tre
fo
r A
gri
cu
ltu
ral E
co
no
mic
s a
nd
Po
lic
y R
es
ea
rch
N
ati
on
al C
en
tre
fo
r A
gri
cu
ltu
ral E
co
no
mic
s a
nd
Po
lic
y R
es
ea
rch
Share of Indo Pak Agri Trade in
Total Agri Trade of Pakistan %
1.12
1.60 1.74
2.98
3.72
2.36
3.10 3.27
2.27
3.11
0.00
0.50
1.00
1.50
2.00
2.50
3.00
3.50
4.00
2003 2004 2005 2006 2007 2008 2009 2010 2011 2012

Na
tio
na
l C
en
tre
fo
r A
gri
cu
ltu
ral E
co
no
mic
s a
nd
Po
lic
y R
es
ea
rch
N
ati
on
al C
en
tre
fo
r A
gri
cu
ltu
ral E
co
no
mic
s a
nd
Po
lic
y R
es
ea
rch
Share of Indo-Pak Agri Trade in
India’s total Agri Trade %
0.24
0.32 0.34
0.52 0.57
0.34 0.39 0.39
0.24
0.31
0.00
0.10
0.20
0.30
0.40
0.50
0.60
0.70
2003 2004 2005 2006 2007 2008 2009 2010 2011 2012
Na
tio
na
l C
en
tre
fo
r A
gri
cu
ltu
ral E
co
no
mic
s a
nd
Po
lic
y R
es
ea
rch
`…..WHAT HAS BEEN THE TRADE
COMPLEMENTARITY IN BILATERAL TRADE
BETWEEN INDIA AND PAKISTAN?

Na
tio
na
l C
en
tre
fo
r A
gri
cu
ltu
ral E
co
no
mic
s a
nd
Po
lic
y R
es
ea
rch
Trade Complementarity Index
(TCI)
Mathematical Definition
d is the importing country of interest, s is the exporting country of interest, w is the world, x is the commodity export flow, X is the total export flow, m the commodity
import flow, and M the total import flow.
Explanation Definition
the sum of the absolute value of the difference between the sectoral import shares of one country
and the sectoral export shares of the other. Dividing by 2 coverts this to a number between 0 and 1, with zero indicating all shares matched and 1 indicating
none did.
It measures the degree to which the export pattern of one country
matches the import pattern of another.
W miwd w xisw
1- i 2 * 100 w Mwd wXsw
TCI =

Na
tio
na
l C
en
tre
fo
r A
gri
cu
ltu
ral E
co
no
mic
s a
nd
Po
lic
y R
es
ea
rch
N
ati
on
al C
en
tre
fo
r A
gri
cu
ltu
ral E
co
no
mic
s a
nd
Po
lic
y R
es
ea
rch
Trade complementarity Index
45.68
59.12
52.94 52.48
57.03 60.31
53.83 50.74
49.91
44.16
19.22 18.51 19.37 22.13
30.30
20.71
17.49 16.05 16.64 19.23
0.00
10.00
20.00
30.00
40.00
50.00
60.00
70.00
2003 2004 2005 2006 2007 2008 2009 2010 2011 2012
For Indian ag exports to Pakistan For Indian ag imports from Pakistan
Na
tio
na
l C
en
tre
fo
r A
gri
cu
ltu
ral E
co
no
mic
s a
nd
Po
lic
y R
es
ea
rch
`…..WHO ARE INDIA’S COMPETITORS IN
PAKISTANI MARKET?

Na
tio
na
l C
en
tre
fo
r A
gri
cu
ltu
ral E
co
no
mic
s a
nd
Po
lic
y R
es
ea
rch
N
ati
on
al C
en
tre
fo
r A
gri
cu
ltu
ral E
co
no
mic
s a
nd
Po
lic
y R
es
ea
rch
Major Suppliers in Pakistani Markets
for the commodities exported by India
Kenya
India
China
Rwanda
Vietnam
49.5%
13.1 %
7.8%
4.8%
4.5%
Coffee Tea
India
Australia
Myanmar
Ethiopia
China
33.9%
21.2%
7.6%
6%
5.9%
Edible Vegetables
China
India
UAE
US
Jordan
16.4%
73.9%
5.1%
2.4%
0.7%
Meat
US
China
Thailand
India
Brazil
36.2%
32%
10.4%
6.2%
3.4%
Cereals
US
India
Brazil
China
Afghanistan
15.8%
27.9%
17.4%
11.1%
10%
Cotton
US
New Zealand
France
Germany
Lithuania
30.5%
15.1%
11.9%
10.8%
8.6%
Dairy Products
India 2.8%
Source: International Trade Centre

Na
tio
na
l C
en
tre
fo
r A
gri
cu
ltu
ral E
co
no
mic
s a
nd
Po
lic
y R
es
ea
rch
`…..HOW FAVOURABLE IS THE TRADE
POLICY ENVIRONMENT IN TWO
COUNTRIES?

Na
tio
na
l C
en
tre
fo
r A
gri
cu
ltu
ral E
co
no
mic
s a
nd
Po
lic
y R
es
ea
rch
India’s Import Duty Structure
Item Description Basic Customs duty (%)
(As on 01.09.2012) Bound Duty (%)
( As on 01.09.2012) Cereals and Pulses
Pulses other than peas (pisum sativum) Free 100 Maize (Corn) seed 50 70
Buck wheat and canary seed Free 100
Other cereals (rye, barley etc.) Free 100
Dairy Products
Fresh milk and cream 30 100
Butter and melted butter (ghee) 30 40
Cheese 30 40 Milk powder 60 60 Yoghurt 30 150
Plantation Crops
Tea 100 150 Coffee 100 100 Other Spices 30/70 150/100
Meat & Poultry
Meat of poultry, not cut in pieces, fresh or chilled
30 100
Raw harms, pig fat; meat of bovine animals 30 100
other meat and offal 30 100
Processed hams 30 55 Fish 30 unbound
Na
tio
na
l C
en
tre
fo
r A
gri
cu
ltu
ral E
co
no
mic
s a
nd
Po
lic
y R
es
ea
rch
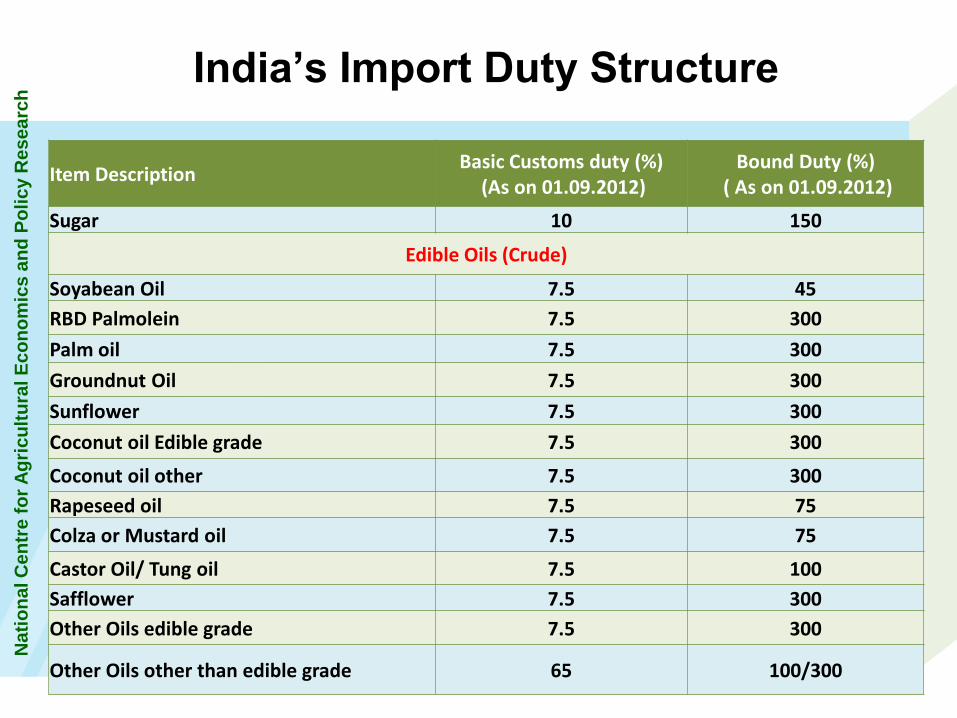
India’s Import Duty Structure
Item Description Basic Customs duty (%)
(As on 01.09.2012) Bound Duty (%)
( As on 01.09.2012)
Sugar 10 150
Edible Oils (Crude)
Soyabean Oil 7.5 45
RBD Palmolein 7.5 300
Palm oil 7.5 300
Groundnut Oil 7.5 300
Sunflower 7.5 300
Coconut oil Edible grade 7.5 300
Coconut oil other 7.5 300
Rapeseed oil 7.5 75
Colza or Mustard oil 7.5 75
Castor Oil/ Tung oil 7.5 100
Safflower 7.5 300
Other Oils edible grade 7.5 300
Other Oils other than edible grade 65 100/300
Na
tio
na
l C
en
tre
fo
r A
gri
cu
ltu
ral E
co
no
mic
s a
nd
Po
lic
y R
es
ea
rch
N
ati
on
al C
en
tre
fo
r A
gri
cu
ltu
ral E
co
no
mic
s a
nd
Po
lic
y R
es
ea
rch
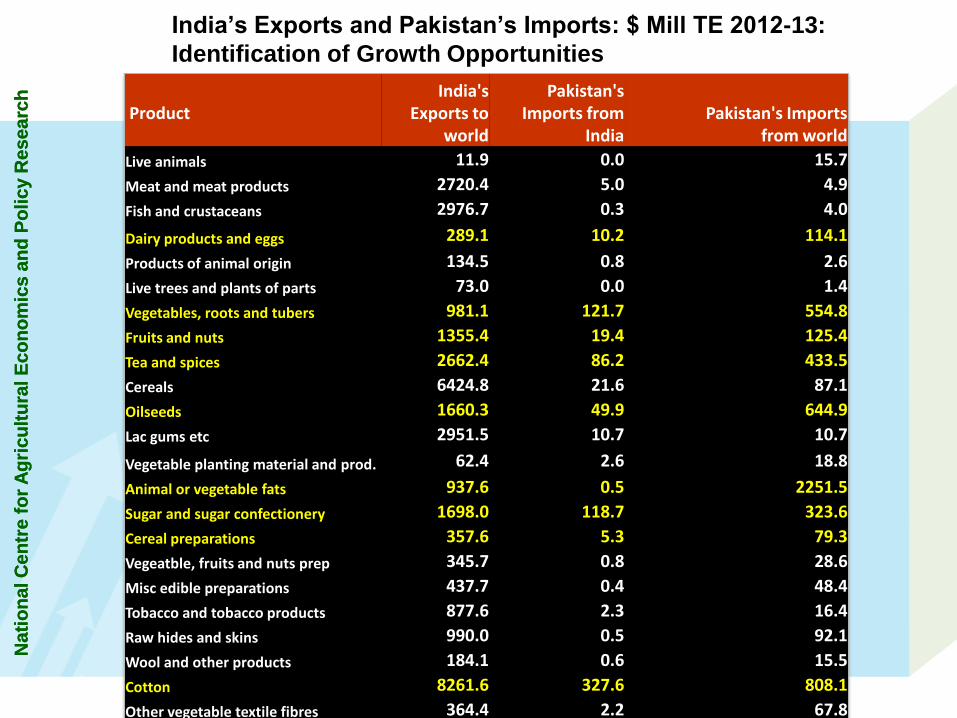
India’s Exports and Pakistan’s Imports: $ Mill TE 2012-13:
Identification of Growth Opportunities
Product
India's Exports to
world
Pakistan's Imports from
India Pakistan's Imports
from world
Live animals 11.9 0.0 15.7
Meat and meat products 2720.4 5.0 4.9
Fish and crustaceans 2976.7 0.3 4.0
Dairy products and eggs 289.1 10.2 114.1
Products of animal origin 134.5 0.8 2.6
Live trees and plants of parts 73.0 0.0 1.4
Vegetables, roots and tubers 981.1 121.7 554.8
Fruits and nuts 1355.4 19.4 125.4
Tea and spices 2662.4 86.2 433.5
Cereals 6424.8 21.6 87.1
Oilseeds 1660.3 49.9 644.9
Lac gums etc 2951.5 10.7 10.7
Vegetable planting material and prod. 62.4 2.6 18.8
Animal or vegetable fats 937.6 0.5 2251.5
Sugar and sugar confectionery 1698.0 118.7 323.6
Cereal preparations 357.6 5.3 79.3
Vegeatble, fruits and nuts prep 345.7 0.8 28.6
Misc edible preparations 437.7 0.4 48.4
Tobacco and tobacco products 877.6 2.3 16.4
Raw hides and skins 990.0 0.5 92.1
Wool and other products 184.1 0.6 15.5
Cotton 8261.6 327.6 808.1
Other vegetable textile fibres 364.4 2.2 67.8

Na
tio
na
l C
en
tre
fo
r A
gri
cu
ltu
ral E
co
no
mic
s a
nd
Po
lic
y R
es
ea
rch
N
ati
on
al C
en
tre
fo
r A
gri
cu
ltu
ral E
co
no
mic
s a
nd
Po
lic
y R
es
ea
rch
Pakistan's Exports
to world India's Imports from
Pakistan India's Imports from
world
Live animals 23.0 0.0 10.0
Meat and meat products 166.7 0.0 1.6
Fish and crustaceans 261.4 1.1 83.1
Dairy products and eggs 71.4 0.0 157.0
Products of animal origin 48.0 0.1 39.7
Live trees and plants of parts 1.1 0.0 19.9
Vegetables, roots and tubers 189.0 3.5 2030.7
Fruits and nuts 304.3 78.7 1882.4
Tea and spices 57.8 1.7 432.8
Cereals 2382.6 0.0 32.8
Oilseeds 57.7 4.2 202.3
Lac gums etc 97.8 1.4 135.5
Vegetable planting material and products 6.4 0.0 10.1
Animal or vegetable fats 166.4 0.6 9219.4
Sugar and sugar confectionery 136.0 2.3 486.5
Cereal preparations 40.6 0.0 40.7
Vegeatble, fruits and nuts preparations 0.0 0.6 72.4
Misc edible preparations 0.0 0.1 36.5
Tobacco and tobacco products 25.2 0.0 36.8
Raw hides and skins 447.0 12.1 515.8
Wool and other products 11.7 8.5 399.1
Cotton 4778.7 47.8 572.0
Other vegetable textile fibres 4.8 0.2 251.9
Indian Imports and Pakistani Exports $Million TE 2012-13:
Identification of Growth Opportunities
Na
tio
na
l C
en
tre
fo
r A
gri
cu
ltu
ral E
co
no
mic
s a
nd
Po
lic
y R
es
ea
rch
N
ati
on
al C
en
tre
fo
r A
gri
cu
ltu
ral E
co
no
mic
s a
nd
Po
lic
y R
es
ea
rch
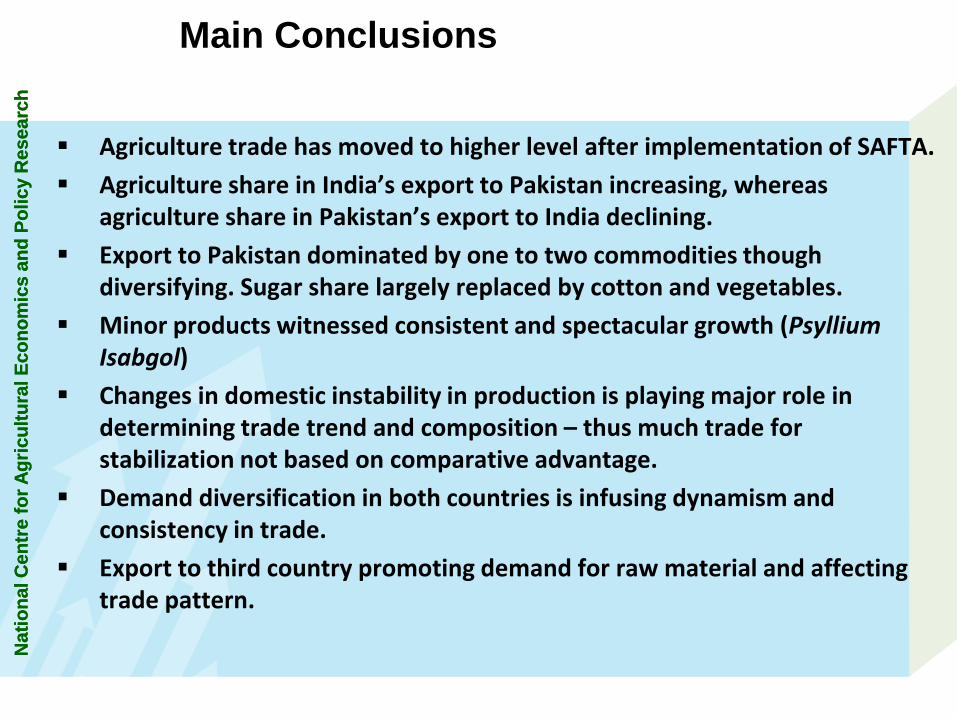
Main Conclusions
Agriculture trade has moved to higher level after implementation of SAFTA.
Agriculture share in India’s export to Pakistan increasing, whereas agriculture share in Pakistan’s export to India declining.
Export to Pakistan dominated by one to two commodities though diversifying. Sugar share largely replaced by cotton and vegetables.
Minor products witnessed consistent and spectacular growth (Psyllium Isabgol)
Changes in domestic instability in production is playing major role in determining trade trend and composition – thus much trade for stabilization not based on comparative advantage.
Demand diversification in both countries is infusing dynamism and consistency in trade.
Export to third country promoting demand for raw material and affecting trade pattern.

Na
tio
na
l C
en
tre
fo
r A
gri
cu
ltu
ral E
co
no
mic
s a
nd
Po
lic
y R
es
ea
rch
N
ati
on
al C
en
tre
fo
r A
gri
cu
ltu
ral E
co
no
mic
s a
nd
Po
lic
y R
es
ea
rch
…………………..
There is high complementarity between Pakistan’s imports and India’s export of agricultural products, however, there is low complementarity between India’s imports and Pakistan’s exports.
There are opportunities for Pakistan to push export of fruits and nuts, raw hides & skins and cotton textiles.
Major import of India are also the imports of Pakistan
Large opportunity for India to export dairy products, vegetables, tea & spices, oilseeds and raw cotton.
Acceleration of agricultural growth in India post 2005-6 has thrown many surprises.
Proximity and regional trade

Na
tio
na
l C
en
tre
fo
r A
gri
cu
ltu
ral E
co
no
mic
s a
nd
Po
lic
y R
es
ea
rch
N
ati
on
al C
en
tre
fo
r A
gri
cu
ltu
ral E
co
no
mic
s a
nd
Po
lic
y R
es
ea
rch
Growth Trajectory of Agriculture GDP at
2004-5 Prices, 1971-80 to 2001-12
1.00
1.50
2.00
2.50
3.00
3.50
4.00
Gro
wth
rat
e p
erc
en
t p
er
ann
um
Decade ending with

Na
tio
na
l C
en
tre
fo
r A
gri
cu
ltu
ral E
co
no
mic
s a
nd
Po
lic
y R
es
ea
rch
N
ati
on
al C
en
tre
fo
r A
gri
cu
ltu
ral E
co
no
mic
s a
nd
Po
lic
y R
es
ea
rch
• Growth deceleration to growth acceleration
– DE 1996-97 to DE 2004-05: 3.5% to 2.0%
– DE 2004-05 to DE 2012-13: 2.0% to 3.7%
• Technology fatigue (by end of 10th Plan) to technology resurgence-resilience of the system
– TFP growth rate up from 0.5% to 2.0%
• Net foreign exchange earnings 10 fold rise in 11 years
– 2001-02: $ 2.5 billion.
– 2012-13: > $ 25 billion.
Recent Achievements Indian Agri

Na
tio
na
l C
en
tre
fo
r A
gri
cu
ltu
ral E
co
no
mic
s a
nd
Po
lic
y R
es
ea
rch
N
ati
on
al C
en
tre
fo
r A
gri
cu
ltu
ral E
co
no
mic
s a
nd
Po
lic
y R
es
ea
rch
Policy Suggestions
Agriculture trade need to be classified in 3 categories
Trade based on comparative advantage -focus on demand diversification in two countries. Minor products and unique products.
Trade to address price and market volatility.
Trade in technology and knowledge products
Policy and strategy – facilitating mechanisms
Agriculture innovation led integration
Neglect of agri R&D in South Asia
Technology spillovers, but serves some purpose
Partner in technology generation:
– Nature of modern research – regional research alliance
Sharing of knowledge capital
Best practices, innovation
Trade in seed and planting material including animal

LOGO