Embed Size (px)
Citation preview
%KXWDQ�7RXULVP�0RQLWRU��������$QQXDO�5HSRUW�����
�����
BHUTAN TOURISM MONITORAnnual Report
2013Kingdom of Bhutan
A Publication of the Tourism Council of Bhutan, 2014

%KXWDQ�7RXULVP�0RQLWRU��������$QQXDO�5HSRUW�����
�����

�����
%KXWDQ�7RXULVP�0RQLWRU��������$QQXDO�5HSRUW�����
�����
)RUHZRUG
I am happy to present ‘The Bhutan Tourism Monitor – 2013’ an annual publication of the Tourism Council of Bhutan. This important report brings to the fore the performance of the tourism industry in the year 2013,
market trends over the years, and various other analysis on the key aspects that provide significant market intelligence and insights about the industry.
Bhutan’s tourism industry continued to grow in 2013 with a +10.25% increase over the previous year contributing significantly to GDP receipts, hard currency reserves, and employment generation in the country. The Royal Government of Bhutan continues to accord high priority to the industry as a major engine of economic growth in the 11th FYP Period. The stable performance of the industry in the last 5 years indicate that tourism is poised to grow in the expected trajectory to meet the aspired targets by the end of 2018.
Findings this year also remind us that tourism is vulnerable to external conditions. The volatile economic conditions in Europe have affected arrivals from major EU markets in 2013 while arrivals from the Japanese market has fallen back to its normal trajectory of growth after the boom in 2012. However, the emerging Asian markets and the regional arrivals from India recorded significant increases, therefore offsetting any major impact on arrival trends.
Endowed with the allure of a rich living culture and pristine natural environment, Bhutan continues to gain momentum as an emerging high-end destination in South-Asia. The concerted effort of the government and the tourism stakeholders together continue to attract increasing visitors to Bhutan. However, we also need to be highly conscious of the challenges confronting the tourism sector. We must continue to diversify experiences, encourage visitation to less-visited Dzongkhags and during the summer and winter months. With increasing number of visitors, there is a need now to work on an integrated approach to sustainable tourism development and destination management at the Dzongkhag level. Monitoring by all stakeholders has to be strengthened.
This year’s report also presents a detailed analysis on the out-of-pocket spending patterns of both international and regional visitors that contribute significantly to higher tourism receipts. It also presents a detailed study on the satisfaction levels of visitors on various aspects of their holiday in Bhutan to determine the Tourist Satisfaction Index.
This report is a testament to the commitment, hard work, enthusiasm, and the co-operative spirit of everyone involved in the tourism industry. I would like to thank all stakeholders for your continued contribution to the tourism industry.
Tashi Delek.
Chhimmy PemDirector

%KXWDQ�7RXULVP�0RQLWRU��������$QQXDO�5HSRUW�����
�����

�����
%KXWDQ�7RXULVP�0RQLWRU��������$QQXDO�5HSRUW�����
�����

%KXWDQ�7RXULVP�0RQLWRU��������$QQXDO�5HSRUW�����
�����
Introduction ..........................................................................................................................................................................11
Methodology ........................................................................................................................................................................11
Executive Summary .............................................................................................................................................................11
Global Tourism in 2011 (source: UNWTO) ......................................................................................................................... 13
Inbound visitor arrivals to Bhutan in 2013 ....................................................................................................................... 14
6HFWLRQ���²�$QQXDO�7RXULVP�6WDWLVWLFV�RI�,QWHUQDWLRQDO�9LVLWRUV���������������������������������������������
Major International Source Markets ................................................................................................................................ 17
Global Segmentation of Major International Source Markets ........................................................................................ 18
Road and Air Accessibility ............................................................................................................................................... 23
Major International Source Markets by Bed Nights ...................................................................................................... 24
Visitors by Activity ............................................................................................................................................................. 25
Tourists by Popular Festivals ............................................................................................................................................ 27
Trekkers by Route .............................................................................................................................................................. 28
Average Length of Stay .................................................................................................................................................... 29
Seasonality of Visitation (Based on Bed Nights) ............................................................................................................ 30
Major Source Markets by Season of Visitation .............................................................................................................. 31
Tour Group Size ................................................................................................................................................................. 32
Spread of Tourism Impact ................................................................................................................................................ 33
Accommodation Providers by Bed Nights ..................................................................................................................... 34
Categories of Accommodation Providers ...................................................................................................................... 35
Occupancy Rate Comparison by Accommodation Categories .................................................................................. 36
Distribution of bed nights by Star Categories of Accommodation Providers............................................................... 37
Accommodation Analysis and Occupancy Rate by Dzongkhag ................................................................................. 38
Tour Operator Share of International Market ................................................................................................................. 39
Tourism Earnings from International Arrivals (in $US Million) ....................................................................................... 40
6HFWLRQ���²�([LW�6XUYH\V�IRU�,QWHUQDWLRQDO�9LVLWRUV������������������������������������������������������������������ ��
Age of Visitors .....................................................................................................................................................................41
Level of Visitor Education................................................................................................................................................... 42
Composition of Visitors Travel Party. ................................................................................................................................ 43
Repeat Visitation Pattern of Visitors ................................................................................................................................. 45
Intention to Return to Bhutan ............................................................................................................................................ 46
Bhutan and Circuit Tourism............................................................................................................................................... 48
Bhutan – Major Draw Cards ............................................................................................................................................ 50
Keywords to Describe Bhutan ...........................................................................................................................................51
Attractions Visited/Activities Undertaken ........................................................................................................................ 52
&RQWHQWV

�����
%KXWDQ�7RXULVP�0RQLWRU��������$QQXDO�5HSRUW�����
�����
Visitors’ Time of Visit .......................................................................................................................................................... 53
Holiday Time in Source Markets....................................................................................................................................... 54
Individual Average Spending on a Bhutan Holiday.............................................................. ......................................... 56
Out of Pocket Spending........................................................... .......................................................................................... 57
Awareness on the Breakdown of Package Price.............................................. ............................................................. 59
Prior Information on Hotels ............................................................................................................................................... 60
Visitors Satisfaction Levels..................................................................................................................................................61
Additional Facilities and Improvements.............................. ............................................................................................ 64
6HFWLRQ���²�([LW�6XUYH\V�IRU�5HJLRQDO�9LVLWRUV�������������������������������������������������������������������������� ��
General Profile of Regional Visitors.................................................................................................................................. 67
Purpose of Visit...................................................................... ............................................................................................ 68
Type of Travel ...................................................................................................................................................................... 69
Travel Party Composition......................................................................................... ......................................................... 70
Length of Stay......................................................... ............................................................................................................. 71
Repeat Visitation Patterns.......................................................................................................................... ....................... 72
Visitation by Dzongkhags........................................................................................................................ ......................... 73
Major Draw Cards to Bhutan (Image of Bhutan Prior to Visit)....................................................................................... 74
Types of Activities Undertaken in Bhutan ....................................................................................................................... 75
Keywords to Describe Bhutan .......................................................................................................................................... 76
Entry and Exit Sectors .........................................................................................................................................................77
Transportation .................................................................................................................................................................... 78
Accommodation in Bhutan ............................................................................................................................................... 79
Factors Determining Visitors’ Time of Visit ...................................................................................................................... 80
Visitors Satisfaction Levels..................................................................................................................................................81
Satisfaction Levels on Hotels’ Quality Vs. Value for Money ........................................................................................... 83
Satisfaction Levels on Restaurants’ Quality Vs. Value for Money .................................................................................. 84
Satisfaction Levels on Transportation ............................................................................................................................... 85
Satisfaction Levels with Customer Service ....................................................................................................................... 86
Diversity of Attractions ....................................................................................................................................................... 86
Pricing of Goods and Souvenirs ....................................................................................................................................... 86
Easy of Organising Trips to Bhutan .................................................................................................................................. 86
Spending Patterns of Regional Visitors............................................................................................................................ 88
Suggestion for Improvement ............................................................................................................................................ 90

%KXWDQ�7RXULVP�0RQLWRU��������$QQXDO�5HSRUW�����
�����
6HFWLRQ���²�6RXUFH�0DUNHWV�6XPPDU\����������������������������������������������������������������������������������������� ��
United States of America ................................................................................................................................................. 93
China ................................................................................................................................................................................. 94
Japan ................................................................................................................................................................................. 95
Thailand .............................................................................................................................................................................. 96
Germany ........................................................................................................................................................................... 97
United Kingdom ................................................................................................................................................................ 98
Australia ............................................................................................................................................................................ 99
Singapore ......................................................................................................................................................................... 100
Malaysia ............................................................................................................................................................................ 101
France ............................................................................................................................................................................... 102
/LVW�RI�*UDSKV
Annual Tourism Statistics
Graph 1.1 - Major Source Markets for International Arrivals ......................................................................................... 17
Graph 1.2 - Global Segmentation of Source Markets .................................................................................................... 19
Graph 1.3 - Entry and Exit by Mode of Transport ........................................................................................................... 24
Graph 1.4 - Visitors by Main Motivation to Visit Bhutan ................................................................................................ 26
Graph 1.5 - Visitors by Activities ...................................................................................................................................... 26
Graph 1.6 - Tourist by Popular Festivals .......................................................................................................................... 27
Graph 1.7 - Visitation by Month ....................................................................................................................................... 30
Graph 1.8 - Bed Nights by Dzongkhags ........................................................................................................................ 33
Graph 1.9 - Distribution of Bed Nights by Star Rating of Accommodation Providers .................................................. 37
Graph 1.10 - Tourism Earnings from International Visitors in USD Million (2008 - 2013) ............................................. 40
Exit Surveys for International Visitors
Graph 2.1 - Age of Visitors ................................................................................................................................................ 41
Graph 2.2 - Visitors’ Level of Education .......................................................................................................................... 42
Graph 2.3 - Composition of Visitors Travel Party ........................................................................................................... 43
Graph 2.4 - Patterns of Repeat Visitation ....................................................................................................................... 45
Graph 2.5 - Intention to Return to Bhutan ...................................................................................................................... 47
Graph 2.6 - Bhutan and Circuit Tourism ......................................................................................................................... 48
Graph 2.7 - Major Attraction to Bhutan ........................................................................................................................... 50
Graph 2.8 - Keywords describing Bhutan ...................................................................................................................... 51
Graph 2.9 - Attractions Visited/Activities Undertaken .................................................................................................. 52
Graph 2.10 - Visitors Time of Visitation ........................................................................................................................... 53
Graph 2.11 - Holiday Time in Source Markets ................................................................................................................ 54
Graph 2.12 - Entire Spending (Including Out-of-pocket Spending, excluding airfare) ............................................... 56

�����
%KXWDQ�7RXULVP�0RQLWRU��������$QQXDO�5HSRUW�����
�����
Graph 2.13 - Out of Pocket Spending in USD ................................................................................................................. 58
Graph 2.14 - Awareness on the Breakdown of Package Prices .................................................................................. 59
Graph 2.15 - Prior Information on Hotel Standards ...................................................................................................... 60
Graph 2.16 - Tourist Satisfaction Index .............................................................................................................................61
Graph 2.17 - Satisfaction Levels with Accommodation Service ..................................................................................... 62
Graph 2.18 - Satisfaction Levels with the F&B Sector ..................................................................................................... 62
Graph 2.19 - Satisfaction Levels with Transportation Sector .......................................................................................... 63
Graph 2.20 - Satisfaction Levels with Customer Services .............................................................................................. 63
Graph 2.21 - Satisfaction Levels with Diversity of Attraction .......................................................................................... 63
Graph 2.22 - Satisfaction Levels with Pricing Souvenirs ................................................................................................ 63
Graph 2.23 - Satisfaction Levels with Quality of Tour Guide .......................................................................................... 63
Graph 2.24 - Satisfaction Levels with Ease of Organising Trip ...................................................................................... 63
Graph 2.25 - Value for Money Perception ...................................................................................................................... 64
Graph 2.26 - Suggestions for Improvement ................................................................................................................... 65
Exit Surveys for Regional Visitors
Graph 3. 1 – Country of Respondents .............................................................................................................................. 67
Graph 3. 2 - Age of Respondents .................................................................................................................................... 67
Graph 3. 3 - Gender of Respondents .............................................................................................................................. 67
Graph 3. 4 - Respondents’ Level of Education ................................................................................................................ 67
Graph 3.5 - Purpose of Visit ............................................................................................................................................. 68
Graph 3. 6 - Type of Travel ................................................................................................................................................ 69
Graph 3. 7 - Travel Party Composition ............................................................................................................................. 70
Graph 3. 8 - Length of Stay ................................................................................................................................................ 71
Graph 3. 9 - Patterns of Repeat Visitation ....................................................................................................................... 72
Graph 3. 10 - Arrivals by Dzongkhags ............................................................................................................................ 73
Graph 3. 11 - Major Draw Cards for Bhutan ................................................................................................................... 74
Graph 3. 12 - Activities Undertaken during the Trip ........................................................................................................ 75
Graph 3. 13 - Keywords describing Bhutan .................................................................................................................... 76
Graph 3. 14 - Entry and Exit Sectors ..................................................................................................................................77
Graph 3. 15 - Type of Transportation ................................................................................................................................ 78
Graph 3. 16 - Factors Determining Choice of Hotels ...................................................................................................... 79
Graph 3. 17 - Factors Determining Time of Visitation ..................................................................................................... 80
Graph 3. 18 – Tourist Satisfaction Index ............................................................................................................................81
Graph 3. 19 - Value for Money Perceptions .................................................................................................................... 82
Graph 3. 20 - Satisfaction Levels with Hotels (quality vs. value) .................................................................................... 83
Graph 3. 21 - Satisfaction Levels with Restaurants and Food (Quality vs. Value)......................................................... 84
Graph 3. 22 - Satisfaction Levels with Transportation (Quality Vs. Value) .................................................................... 85
Graph 3. 23 - Satisfaction Levels with Quality of Customer Services ............................................................................ 87
Graph 3. 24 - Satisfaction Levels with Variety of Things to Do and See ....................................................................... 87

%KXWDQ�7RXULVP�0RQLWRU��������$QQXDO�5HSRUW�����
������
Graph 3. 25 - Satisfaction Levels with Price of Souvenirs and other Shopping Goods ............................................... 87
Graph 3. 26 - Satisfaction Levels with Ease of Organising Trip to Bhutan .................................................................... 87
Graph 3. 27 - Total Spending of Regional Visitors .......................................................................................................... 89
/LVW�RI�7DEOHV
Table 1.1 - Major Source Markets by Growth Rates ........................................................................................................ 18
Table 1.2 - Country-wise Breakdown of International Source Markets ........................................................................ 19
Table 1.3 - Road and Air Accessibility ............................................................................................................................. 23
Table 1.4 - Major Source Markets by Bed Nights ........................................................................................................... 25
Table 1.5 - Trekkers by Route ............................................................................................................................................ 28
Table 1.6 - Average Length of Stay by Major Markets ................................................................................................... 29
Table 1.7 - Bed Nights by Month ...................................................................................................................................... 30
Table 1.8 - Source Markets by Season of Visitation ........................................................................................................ 31
Table 1.9 - Tour group Size ............................................................................................................................................... 32
Table 1.10 - Dzongkhag Arrivals and Bed Nights .......................................................................................................... 34
Table 1.11 - Accommodation Providers by Bed Nights .................................................................................................. 34
Table 1.12 - Categories of Accommodation Providers .................................................................................................. 35
Table 1.13 - Occupancy Rates by Type of Accommodation (October and Annual) ..................................................... 36
Table 1.14 - Accommodation Analysis and Occupancy Rate by Dzongkhags ........................................................... 38
Table 1.15 - Tour Operator Share of Market (based on Bed Nights) ............................................................................ 39
Table 1.16 - Tourism Earnings Breakdown (USD) ............................................................................................................ 40
Table 2.1 - Travel Party Composition by Major Markets ................................................................................................ 44
Table 2.2 - Repeat Visitors by Major Markets ................................................................................................................ 46
Table 2.3 - Intention to Return to Bhutan by Nationality ................................................................................................ 47
Table 2.4 - Cross-tabulation of Circuit Tourism by Nationality ...................................................................................... 49
Table 2.4 - Holiday Time by Major Source Markets ....................................................................................................... 55
Table 2.6 - Out-of-pocket Spending Categories in USD ................................................................................................ 58

������
%KXWDQ�7RXULVP�0RQLWRU��������$QQXDO�5HSRUW�����
������
INTRODUCTION
One of the main responsibilities of the Tourism Council of Bhutan Secretariat as the apex tourism regulatory body in the country is to ensure that the industry grows in a sustainable manner. This vision is realized through the implementation of national tourism policies and various regulations that uphold this vision. Policy decisions have to be based on research and factual findings as opposed to relying solely on anecdotal evidences that may not give the full picture. Therefore, the annual tourism report – The Bhutan Tourism Monitor - a publication of the Tourism Council of Bhutan seeks to provide quality information, factual findings and forecasts to meet the needs of a wide range of tourism sector users. It ensures the tourism industry has the information it needs to support policy, marketing and commercial decisions relating to the sector. It not only presents overall tourism performance of a particular year, but also an in-depth study on visitors’ first-hand feedback to understand visitor preferences and motivations, and a detailed market research and analysis.
METHODOLOGY
This report – The Bhutan Tourism Monitor 2013 - is presented in four sections. The first section presents the actual statistical data of international tourist arrivals, their profile, preferences and activities and the trends in the last few years. It is based on data produced by the Tashel-Online System database used for visa processing and costing. The Tashel-Online system of the Tourism Council of Bhutan only captures data on international visitors and therefore do not have in-depth data on regional, official and business visitors. Information that is generated from this system pertains to the data that the Tour Operators’ provide while applying for tourist visas online. Section 1 contains information on international visitors, which pertains to the entire calendar year of 2013.
Sections 2 and 3 present results of exit surveys carried out for international visitors and regional visitors respectively. The data was collected using administered interviewer-conducted surveys over a collection period of six months at Paro airport and the road entry points points of Phuentsholing, Gelephu and Samdrup Jongkhar. The collection periods were spread over the year to collect feedback pertaining to
that particular time of visitation. Findings of the exit surveys provide a more in-depth ‘snapshot’ of the visitors’ travel behaviours, motivations, patterns and preferences.
The fourth section presents an in-depth analysis of the top 10 international markets of 2013 independently. It presents a summary of the overall characteristics and the performance trends of a particular source market mainly aimed for country-specific marketing for tour operators.
EXECUTIVE SUMMARY
The tourism industry continued to grow at a steady rate with 2013 recording the highest number of inbound visitor arrivals in the country. There were 116, 209 tourist arrivals in 2013, marking a growth rate of +10.25% over the previous year. The international to regional visitor ratio was at 45:55, with growth rates more significant for the regional segment. Out of the total, a little in excess of three quarters (75.68%) were those who visited Bhutan for leisure and holidaying purpose.
Of the total international arrivals, a clear majority of 83.84% were ‘Tourist’ arrivals that visited the country solely for the purpose of holidaying and leisure. Some 10.67% were ‘Official’ visitors. Total regional arrivals were dominated by 68.89% of leisure visitors followed by a significant 13.34% who came to Bhutan to visit friends and family (VFR) members, and another 11.26% visiting for ‘Business’ purposes.
Gross earnings from international leisure arrivals alone reached USD 63.49 million. Spending patterns of the regional visitors suggest that tourism receipts from the regional segment may have contributed around USD 28 million in tourism receipts in the year 2013, even without including receipts from airfares.
India continues to be the biggest source market for Bhutan. For the international segment, USA surpassed arrivals from Japan to restore its dominance as the biggest source market, with an increase of +15.32% over the previous year. This was due to a substantial slump in Japanese arrivals plummeting by -42.37% in 2013, thereby allowing China to become the second-biggest market, which recorded a +26.50% increase

%KXWDQ�7RXULVP�0RQLWRU��������$QQXDO�5HSRUW�����
������
in 2013. All the top European markets recorded decrease in arrivals such as Germany (-4.41%), UK (-7.10%) and France (-15.48%), indicating volatile economic conditions in these countries and as a result affecting visitors’ travel patterns. European market’s decline was however offset by healthy growth rates amongst Asian markets notably Singapore, Malaysia, Taiwan, South Korea and Indonesia.
Arrivals from Saint Kitts and Nevis, Surinam, Guyana, Mauritania, Madagascar and Mozambique were recorded for the first time, therefore suggesting a growing interest for Bhutan in the global community.
Paro (33.70%) and Thimphu (24.31%) Dzongkhags recorded maximum bed nights by Dzongkhag. Maximum visitations were in the months of October, April, March, November, and September, accounting for 65.44% of all international arrivals.
Bhutan is mainly seen as a cultural destination. Segregating visitor profile by main motivation and draw card shows that a majority of 72.0% were cultural visitors mainly visiting Bhutan for a cultural sightseeing tour. Some 13.0% mainly visited Bhutan specifically to witness at least a festival and 8.0% were those who visited Bhutan mainly to experience trekking and multiday hiking. Paro Tsechu and Thimphu Tsechu dominated festival arrivals and Drukpath Trek and Jomolhari treks continue to be the most frequented trek routes.
Bed nights share by category of accommodation providers show that ‘3-Star’ category received the highest share of bed nights with 43%, followed by 34% staying in 2-Star properties. A significant 20% stayed in 4-Star and 5-Star luxury properties, therefore contributing significant yield through out-of-pocket spending. Meri Phuensum Resort in Punakha recorded the highest number of bed nights by accommodation providers.
The average length of stay of international visitors was 6.85 days in 2013. The shorter duration is due to the increase in top Asian markets that normally visit for shorter durations. Switzerland, France, Germany and Australia continue to have longer average stays between 9 – 11 days. Top 10 tour
operators accounted for 30.61% of total international arrivals.
More than 60% of the international visitors to Bhutan were found in the ‘45+ age’ and were well educated, with most holding university qualifications. Some 87.56% mainly were first-time visitors and approximately 35.20% of all international visitors came to Bhutan as a single holiday destination. Those who had combined their holiday with other countries mostly visited Nepal (29.10%), India (23.90%), and Thailand (20.0%). Travel party composition was varied and slightly skewed towards those who joined an organised tour group (30.89%) organised mainly by offshore travel agencies. Many also travelled as ‘Group of Friends’ (28.0%) and another quarter of them were travelling as couples. A clear majority of 80.35% of visitors expressed their interest to visit Bhutan again, indicating high satisfaction levels.
An analysis on visitor perceptions before coming to Bhutan shows that visitors were mainly motivated to experience the ‘Unique culture’, ‘Pristine Nature’, ‘Gross National Happiness’ and the ‘Undiscovered spectre’. ‘Favourable weather conditions’, ‘holiday timing’, and ‘Advice of Agents’ are the main factors determining visitation time.
An international visitor spent an average of USD 3917.32 (including the package price and out-of-pocket spending, and excluding airfare), for their Bhutan trip. The average out-of-pocket spending was recorded at USD 1080.75.
Tourist Satisfaction Index amongst international visitors in 2013 was at 74.23%.
For the regional market, India dominated the number of arrivals with 85.27%, followed by Bangladesh with 14.02%. Maldives only comprised of 0.71% of the total regional arrivals. Visitors were predominantly male (60.13%) and were much younger than the international visitors with majority of them between ‘26 – 55 years’ bracket. Like the international visitors, regional visitors are also highly educated with 88.78% of them having at least a Bachelor’s Degree.
Regional visitors came to Bhutan mainly for the purpose of ‘Holiday’ with 65.80% indicating leisure and holiday as the

������
%KXWDQ�7RXULVP�0RQLWRU��������$QQXDO�5HSRUW�����
������
main reason for their visit to Bhutan. This was followed by the 8.89% who indicated that they were on a ‘Private Business Trip’ and another 8.67% were of the ‘Meetings, Incentives, Conferences and Exhibitions (MICE) category. Contrary to earlier findings, in 2013 there was a significant increase in visitors constituting 58.76% who were travelling as part of a packaged tour organised by a travel operator. The remaining 41.24% were Free Independent Travellers (FITs) travelling on their own. They mainly travelled as a ‘Family Group’ with 30.11%, followed closely by 24.68% travelling as a ‘Group of Friends’. A significant 18.01% were travelling alone and a cross-tabulation confirms that solo travellers were mainly visiting for business purposes. Majority (77.09%) preferred to stay not more than 6 days.
On an average, a regional visitor spends around INR 27,157.27 (not including airfare) for a trip to Bhutan. This finding suggests that the regional visitors should have contributed in excess of INR 1722 million (circa USD 28 million) in tourism receipts in the year 2013, even without including receipts from airfares.
Tourism Satisfaction Index amongst regional visitors was 73.85% in 2013.
While international visitors suggested improvements in ‘roads’, ‘ ‘restroom facilities’, ‘garbage management’, better hotels’, etc. the regional segment’s main concern was with ‘online booking facilities’ for hotels and Drukair airline, lack of adequate information on hotels, difficulty to get hotels during peak period etc.
GLOBAL TOURISM IN 2013 (SOURCE: UNWTO)
International tourist arrivals grew by 5% in 2013, reaching a record 1,087 million arrivals, according to the latest UNWTO World Tourism Barometer. Despite global economic challenges, international tourism results were well above expectations, with an additional 52 million international tourists travelling the world in 2013.
Demand for international tourism was strongest for destinations in Asia and the Pacific (+6%), Africa (+6%) and Europe (+5%). The leading sub-regions were South-East
Asia (+10%), Central and Eastern Europe (+7%), Southern and Mediterranean Europe (+6%) and North Africa (+6%).
Europe led growth in absolute terms, welcoming an additional 29 million international tourist arrivals in 2013, raising the total to 563 million. Growth (+5%) exceeded the forecast for 2013 and is double the region’s average for the period 2005-2012 (+2.5% a year). By sub-region, Central and Eastern Europe (+7%) and Southern Mediterranean Europe (+6%) experienced the best results.
In relative terms, growth was strongest in Asia and the Pacific (+6%), where the number of international tourists grew by 14 million to reach 248 million. South-East Asia (+10%) was the best performing sub-region, while growth in South Asian region, was at a moderate 5%. Oceania and North-East Asia recorded +4% growth rates each.
The Americas (+4%) saw an increase of six million arrivals, reaching a total of 169 million. Leading growth were destinations in North and Central America (+4% each), while South America (+2%) and the Caribbean (+1%) showed some slowdown as compared to 2012.
Africa (+6%) attracted three million additional arrivals, reaching a new record of 56 million, reflecting the on-going rebound in North Africa (+6%) and the sustained growth of Sub-Saharan destinations (+5%). Results in the Middle East (+0% at 52 million) were rather mixed and volatile.
Among the ten most important source markets in the world, Russia and China clearly stand out. China, which became the largest outbound market in 2012 with an expenditure of US$ 102 billion, saw an increase in expenditure of 28% in the first three quarters of 2013. The Russian Federation, the 5th largest outbound market, reported 26% growth through September.
The performance of key advanced economy source markets was comparatively more modest. France (+6%) recovered from a weak 2012 and the United States, the United Kingdom, Canada and Australia all grew at 3%. In contrast, Germany, Japan and Italy reported declines in outbound expenditure.Other emerging markets with substantial growth in

%KXWDQ�7RXULVP�0RQLWRU��������$QQXDO�5HSRUW�����
������
outbound expenditure were Turkey (+24%), Qatar (+18%), Philippines (+18%), Kuwait (+15%), Indonesia (+15%), Ukraine (+15%) and Brazil (+14%).
*OREDO�,QWHUQDWLRQDO�$UULYDOV�E\�6XE�UHJLRQ��VRXUFH��81:72�
6XE�5HJLRQ �����*URZWK(XURSH ���&HQWUDO�DQG�(DVWHUQ�(XURSH ���6RXWKHUQ�0HGLWHUUDQHDQ�(XURSH ���$VLD ���6RXWK�(DVW�$VLD ����6RXWK�$VLD ���2FHDQLD�DQG�1RUWK�(DVW�$VLD ����HDFK$PHULFDV ���1RUWK�DQG�&HQWUDO�$PHULFD ����HDFK6RXWK�$PHULFD ���&DULEEHDQ ���$IULFD ���1RUWK�$IULFD ���6XE�6DKDUDQ�GHVWLQDWLRQV ���
INBOUND VISITOR ARRIVALS TO BHUTAN IN 2013
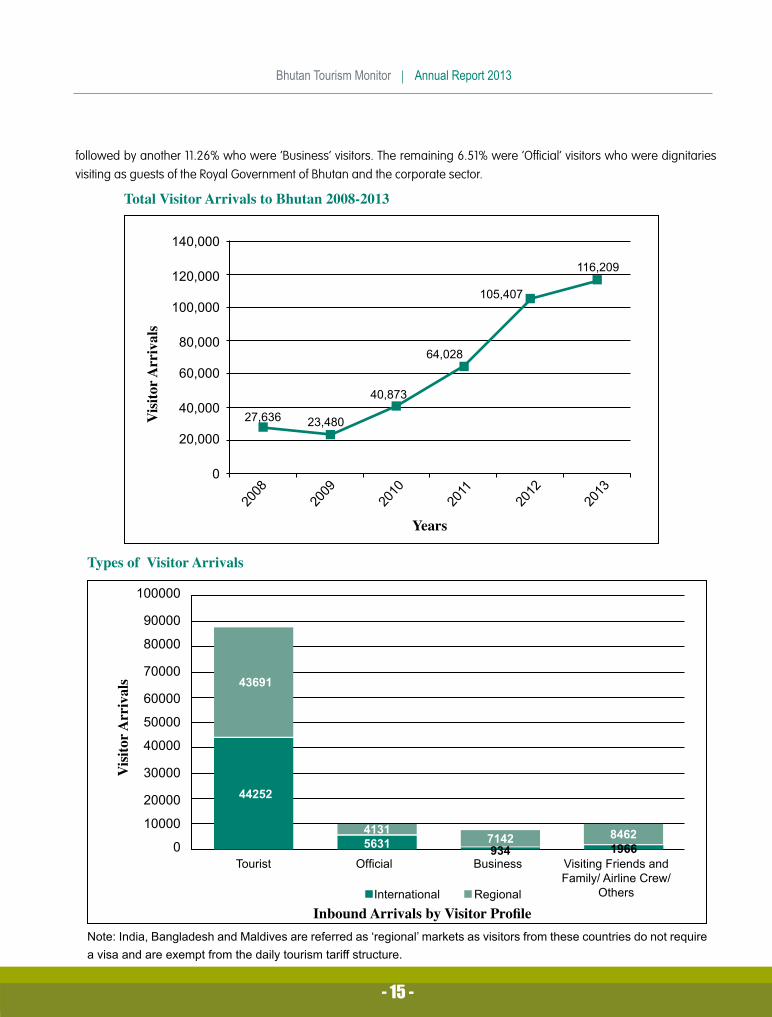
The tourism industry continued to grow at a steady rate in 2013 with record high inbound arrivals peaking at 116,209 visitors. The figure represents a growth of +10.25% over the previous year. There were 52,783 international arrivals and remaining 63,426 were regional arrivals. Regional arrivals are those originating from India, Bangladesh and Maldives. Out of the total, a little in excess of three quarters (75.68%) were those who visited Bhutan for leisure and holidaying purpose.
Of the total international arrivals, a clear majority of 83.84% were ‘Tourist’ arrivals that visited the country solely for the purpose of holidaying. Some 10.67% were ‘Official’ visitors. Only 1.77% of the total international arrivals were ‘Business Visitors’.
Total regional arrivals were dominated by 68.89% of leisure visitors coming to Bhutan solely for the purpose of having a holiday. This was followed by a significant 13.34% who came to Bhutan to visit friends and family (VFR) members,
*OREDO�,QWHUQDWLRQDO�$UULYDOV��VRXUFH��81:72�
����
����
���
���
���
���
������ ����� ����� ����� ����� ����� ����� ����� ����� ����
��� ������
��� ��� ������ ���
��������
*OREDO�,QWHUQDWLRQDO�7RXULVP�E\�<HDU
7RXULVW�DUULYDOV��P
LOOLRQV�
������
%KXWDQ�7RXULVP�0RQLWRU��������$QQXDO�5HSRUW�����
������
followed by another 11.26% who were ‘Business’ visitors. The remaining 6.51% were ‘Official’ visitors who were dignitaries visiting as guests of the Royal Government of Bhutan and the corporate sector.
1RWH��,QGLD��%DQJODGHVK�DQG�0DOGLYHV�DUH�UHIHUUHG�DV�µUHJLRQDO¶�PDUNHWV�DV�YLVLWRUV�IURP�WKHVH�FRXQWULHV�GR�QRW�UHTXLUH�D�YLVD�DQG�DUH�H[HPSW�IURP�WKH�GDLO\�WRXULVP�WDULII�VWUXFWXUH�
7RWDO�9LVLWRU�$UULYDOV�WR�%KXWDQ����������
�������
�������
�������
������
������
������
������
�
����
����
����
����
����
����
������ ������
������
������
�������
�������
<HDUV
9LVLWRU�$
UULYDOV
7\SHV�RI��9LVLWRU�$UULYDOV
������
�����
�����
�����
�����
�����
�����
�����
�����
�����
�7RXULVW� 2I¿FLDO� %XVLQHVV� 9LVLWLQJ�)ULHQGV�DQG�� �� � � )DPLO\��$LUOLQH�&UHZ�
� � � 2WKHUV,QWHUQDWLRQDO 5HJLRQDO
�����
��������
���� ����
�����
��� ����
9LVLWRU�$
UULYDOV
,QERXQG�$UULYDOV�E\�9LVLWRU�3URÀOH

%KXWDQ�7RXULVP�0RQLWRU��������$QQXDO�5HSRUW�����
������

������
%KXWDQ�7RXULVP�0RQLWRU��������$QQXDO�5HSRUW�����
������
���������������������������������������������
3HUFHQWDJH
0DMRU�6RXUFH�0DUNHWV
�����
����� ��������
���� �������� ���� ���� ����
&KLQD86
$-DSDQ
7KDLODQG
*HUPDQ\ 8.
$XVWUDOLD
6LQJDSRUH
0DOD\VLD
)UDQFH
6HFWLRQ� �� ²� $QQXDO� 7RXULVP� 6WDWLVWLFV� RI�,QWHUQDWLRQDO�9LVLWRUVThe first section of the report pertains to the international
‘Dollar-paying’ tourist segment that visited Bhutan for a holiday. Data input for this section is a compendium of the annual tourism statistics generated from the Tashel-Online system used by the Tourism Council of Bhutan (TCB) to endorse tourist visa applications. The system only collects information on international tourist figures given that visas for this segment have to be routed through TCB. Data on other type of visas for regional, official and business visitors are collected by the Department of Immigration as it issues visas directly.
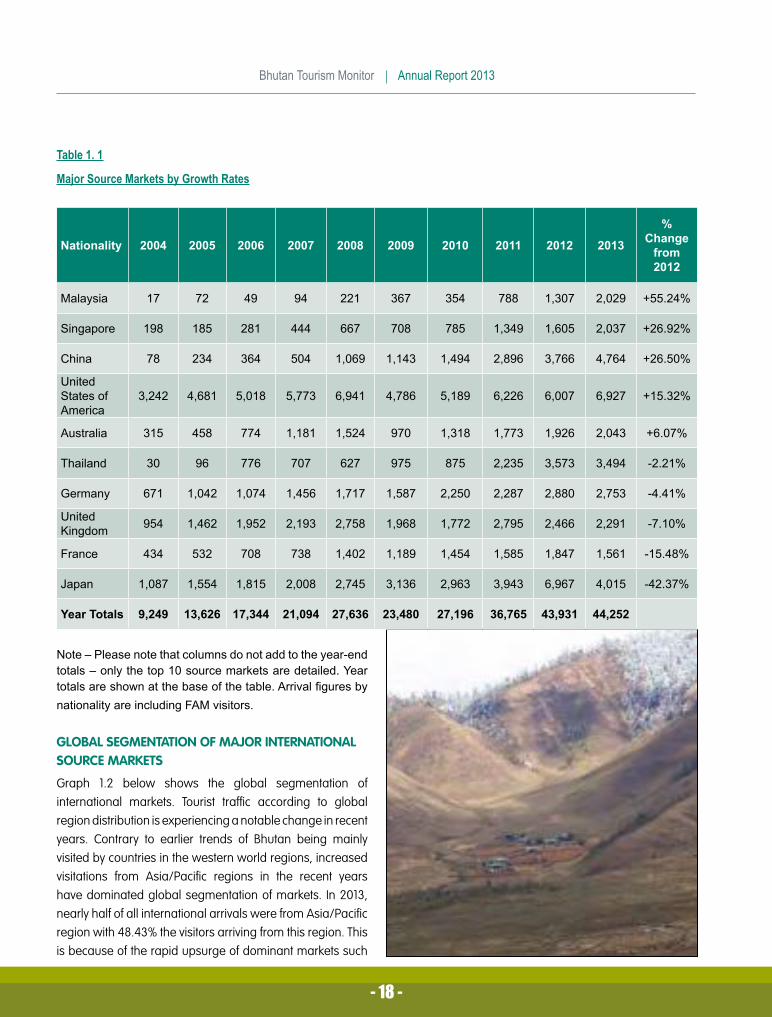
MAJOR INTERNATIONAL SOURCE MARKETS
Graph 1.2 and Table 1.1 illustrate the trends in the major source markets. Albeit the top 10 markets continue to remain the same, notable changes were recorded in the performance trends amongst these major markets. USA rebounded well in 2013 with an increase of +15.32% after a slight dip in 2012. This restores USA’s dominance as the biggest source market for Bhutan again, and constituted 15.65% of international arrivals. Japan, which surpassed US arrivals in 2012 with a +76.69% growth, recorded a drastic drop plummeting by -42.37% in 2013. The slump in
Japanese arrivals, and a +26.50% in Chinese arrivals have resulted in China becoming the second biggest international source market for the first time. China and Japan constituted 10.77% and 9.07% of the total visitor arrivals respectively.
Albeit a slight dip of -2.21%, Thailand has remained as the fourth biggest source market for Bhutan constituting 7.90% of total international arrivals. All the top European markets recorded decrease in arrivals such as Germany (-4.41%), UK (-7.10%) and France (-15.48%), indicating volatile economic conditions in these countries and as a result have affected visitors’ travel patterns, although many experts believe that the recession in Europe is over.
Other top Asian markets performed significantly well in 2013. Singapore recorded a +26.92% growth and the highest growth amongst the top 10 markets was recorded for Malaysia with a +55.24% increase over 2012.
Arrivals from Saint Kitts and Nevis, Surinam, Guyana, Mauritania, Madagascar, and Mozambique were recorded for the first time, therefore suggesting a growing interest for Bhutan in the global community.
*UDSK������0DMRU�6RXUFH�0DUNHWV�IRU�,QWHUQDWLRQDO�$UULYDOV
%KXWDQ�7RXULVP�0RQLWRU��������$QQXDO�5HSRUW�����
������
7DEOH�����
0DMRU�6RXUFH�0DUNHWV�E\�*URZWK�5DWHV
1DWLRQDOLW\ ���� ���� ���� ���� ���� ���� ���� ���� ���� ����
��&KDQJH�IURP�����
0DOD\VLD �� �� �� �� ��� ��� ��� ��� ����� ����� �������
6LQJDSRUH ��� ��� ��� ��� ��� ��� ��� ����� ����� ����� �������
&KLQD �� ��� ��� ��� ����� ����� ����� ����� ����� ����� �������
8QLWHG�6WDWHV�RI�$PHULFD
����� ����� ����� ����� ����� ����� ����� ����� ����� ����� �������
$XVWUDOLD ��� ��� ��� ����� ����� ��� ����� ����� ����� ����� ������
7KDLODQG �� �� ��� ��� ��� ��� ��� ����� ����� ����� ������
*HUPDQ\ ��� ����� ����� ����� ����� ����� ����� ����� ����� ����� ������
8QLWHG�.LQJGRP ��� ����� ����� ����� ����� ����� ����� ����� ����� ����� ������
)UDQFH ��� ��� ��� ��� ����� ����� ����� ����� ����� ����� �������
-DSDQ ����� ����� ����� ����� ����� ����� ����� ����� ����� ����� �������
<HDU�7RWDOV ����� ������ ������ ������ ������ ������ ������ ������ ������ ������
1RWH�±�3OHDVH�QRWH�WKDW�FROXPQV�GR�QRW�DGG�WR�WKH�\HDU�HQG�WRWDOV�±�RQO\�WKH�WRS����VRXUFH�PDUNHWV�DUH�GHWDLOHG��<HDU�WRWDOV�DUH�VKRZQ�DW�WKH�EDVH�RI�WKH�WDEOH��$UULYDO�¿JXUHV�E\�QDWLRQDOLW\�DUH�LQFOXGLQJ�)$0�YLVLWRUV�
GLOBAL SEGMENTATION OF MAJOR INTERNATIONAL SOURCE MARKETS
Graph 1.2 below shows the global segmentation of international markets. Tourist traffic according to global region distribution is experiencing a notable change in recent years. Contrary to earlier trends of Bhutan being mainly visited by countries in the western world regions, increased visitations from Asia/Pacific regions in the recent years have dominated global segmentation of markets. In 2013, nearly half of all international arrivals were from Asia/Pacific region with 48.43% the visitors arriving from this region. This is because of the rapid upsurge of dominant markets such

������
%KXWDQ�7RXULVP�0RQLWRU��������$QQXDO�5HSRUW�����
������
�����
�����
�����
�����
�����
�����
�
3HUFHQWDJH
*OREDO�6HJPHQWDWLRQ�RI�0DUNHWV
�����
�����
�����
�������� ����
$VLD�3DFL¿F (XURSH 1RUWK$PHULFD
6RXWK$PHULFD
0LGGOH�(DVW $IULFD
as China, Japan, Thailand, Australia, Singapore, Malaysia, Taiwan, South Korea, and Indonesia amongst others. The European region contributed 30.39% of the international arrivals, followed by the North American region with 18.57%.
South American region also increased in 2013 constituting 1.95% of total international arrivals.
Table 1.2 shows the country-wise breakdown of international source markets.
*UDSK������*OREDO�6HJPHQWDWLRQ�RI�6RXUFH�0DUNHWV

%KXWDQ�7RXULVP�0RQLWRU��������$QQXDO�5HSRUW�����
������
7DEOH������
&RXQWU\�ZLVH�%UHDNGRZQ�RI�,QWHUQDWLRQDO�6RXUFH�0DUNHWV�
6RXUFH�0DUNHWV $UULYDOV3URSRUWLRQ�RI�7RWDO�$UULYDOV
%HG�1LJKWV
3URSRUWLRQ�RI�7RWDO�
%HG�1LJKWV
$YHUDJH�/HQJWK�RI�6WD\��'D\V�
$��1RUWK�$PHULFDQ�5HJLRQ8QLWHG�6WDWHV�RI�$PHULFD ����� ������ ������ ������ ����&DQDGD ����� ����� ����� ����� ����0H[LFR ��� ����� ����� ����� ����%��(XURSHDQ�5HJLRQ*HUPDQ\ ����� ����� ������ ����� ����8QLWHG�.LQJGRP ����� ����� ������ ����� ����)UDQFH ����� ����� ������ ����� ����6ZLW]HUODQG ����� ����� ������ ����� �����1HWKHUODQGV ��� ����� ����� ����� ����,WDO\ ��� ����� ����� ����� ����$XVWULD ��� ����� ����� ����� ����%HOJLXP ��� ����� ����� ����� ����6SDLQ ��� ����� ����� ����� ����5XVVLD ��� ����� ����� ����� ����3RODQG ��� ����� ����� ����� ����6ZHGHQ ��� ����� ����� ����� ����3RUWXJDO ��� ����� ����� ����� ����1RUZD\ ��� ����� ����� ����� ����'HQPDUN ��� ����� ����� ����� ����7XUNH\ ��� ����� ��� ����� ����&]HFK�5HSXEOLF ��� ����� ����� ����� ����)LQODQG ��� ����� ����� ����� ����+XQJDU\ ��� ����� ��� ����� ����,UHODQG �� ����� ��� ����� ����/X[HPERXUJ �� ����� ��� ����� ����*UHHFH �� ����� ��� ����� ����6ORYDNLD �� ����� ��� ����� ����5RPDQLD �� ����� ��� ����� ����8NUDLQH �� ����� ��� ����� ����6ORYHQLD �� ����� ��� ����� ����%XOJDULD �� ����� �� ����� ����/LWKXDQLD �� ����� ��� ����� ����/DWYLD �� ����� ��� ����� ����(VWRQLD �� ����� �� ����� ����&URDWLD �� ����� �� ����� ����%HODUXV �� ����� �� ����� ����
������
%KXWDQ�7RXULVP�0RQLWRU��������$QQXDO�5HSRUW�����
������
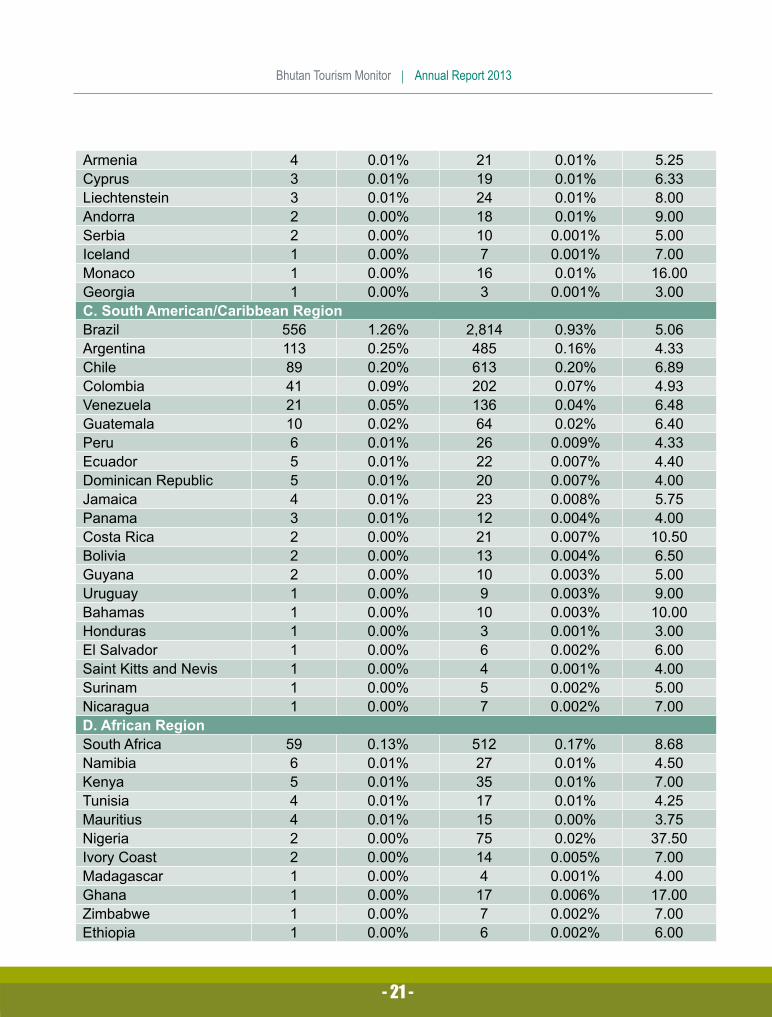
$UPHQLD � ����� �� ����� ����&\SUXV � ����� �� ����� ����/LHFKWHQVWHLQ � ����� �� ����� ����$QGRUUD � ����� �� ����� ����6HUELD � ����� �� ������ ����,FHODQG � ����� � ������ ����0RQDFR � ����� �� ����� �����*HRUJLD � ����� � ������ ����&��6RXWK�$PHULFDQ�&DULEEHDQ�5HJLRQ%UD]LO ��� ����� ����� ����� ����$UJHQWLQD ��� ����� ��� ����� ����&KLOH �� ����� ��� ����� ����&RORPELD �� ����� ��� ����� ����9HQH]XHOD �� ����� ��� ����� ����*XDWHPDOD �� ����� �� ����� ����3HUX � ����� �� ������ ����(FXDGRU � ����� �� ������ ����'RPLQLFDQ�5HSXEOLF � ����� �� ������ ����-DPDLFD � ����� �� ������ ����3DQDPD � ����� �� ������ ����&RVWD�5LFD � ����� �� ������ �����%ROLYLD � ����� �� ������ ����*X\DQD � ����� �� ������ ����8UXJXD\ � ����� � ������ ����%DKDPDV � ����� �� ������ �����+RQGXUDV � ����� � ������ ����(O�6DOYDGRU � ����� � ������ ����6DLQW�.LWWV�DQG�1HYLV � ����� � ������ ����6XULQDP � ����� � ������ ����1LFDUDJXD � ����� � ������ ����'��$IULFDQ�5HJLRQ6RXWK�$IULFD �� ����� ��� ����� ����1DPLELD � ����� �� ����� ����.HQ\D � ����� �� ����� ����7XQLVLD � ����� �� ����� ����0DXULWLXV� � ����� �� ����� ����1LJHULD � ����� �� ����� �����,YRU\�&RDVW � ����� �� ������ ����0DGDJDVFDU � ����� � ������ ����*KDQD � ����� �� ������ �����=LPEDEZH � ����� � ������ ����(WKLRSLD � ����� � ������ ����

%KXWDQ�7RXULVP�0RQLWRU��������$QQXDO�5HSRUW�����
������
0RURFFR � ����� � ������ ����0R]DPELTXH � ����� �� ������ �����6H\FKHOOHV � ����� �� ������ �����8JDQGD � ����� � ������ ����$OJHULD � ����� � ������ ����0DXULWDQLD � ����� � ������ ����(��0LGGOH�(DVWHUQ�5HJLRQ,VUDHO ��� ����� ����� ����� ����6DXGL�$UDELD � ����� �� ����� ����/HEDQRQ � ����� �� ����� ����-RUGDQ � ����� �� ������ ����,UDQ � ����� �� ������ ����%DKUDLQ � ����� �� ������ ����4DWDU � ����� � ������ ����2PDQ � ����� � ������ ����8QLWHG�$UDE�(PLUDWHV � ����� � ������ ����)��$VLD�3DFL¿F�5HJLRQ&KLQD ����� ������ ������ ����� ����-DSDQ ����� ����� ������ ����� ����7KDLODQG ����� ����� ������ ����� ����$XVWUDOLD ����� ����� ������ ����� ����6LQJDSRUH ����� ����� ������ ����� ����0DOD\VLD ����� ����� ������ ����� ����7DLZDQ ����� ����� ����� ����� ����6RXWK�.RUHD ��� ����� ����� ����� ����,QGRQHVLD ��� ����� ����� ����� ����3KLOLSSLQHV ��� ����� ����� ����� ����1HZ�=HDODQG ��� ����� ����� ����� ����1HSDO ��� ����� ��� ����� ����9LHW�1DP �� ����� ��� ����� ����6UL�/DQND �� ����� �� ����� ����/DRV �� ����� �� ����� ����%UXQHL�'DUXVVDODP � ����� �� ����� ����3DNLVWDQL � ����� �� ����� ����)LML � ����� �� ����� ����0\DQPDU � ����� �� ����� ����.D]DNKVWDQ � ����� �� ����� ����&DPERGLD � ����� �� ����� �����1RUWK�.RUHD � ����� � ������ ����.\UJ\]VWDQ � ����� � ������ ����

������
%KXWDQ�7RXULVP�0RQLWRU��������$QQXDO�5HSRUW�����
������
ROAD AND AIR ACCESSIBILITY
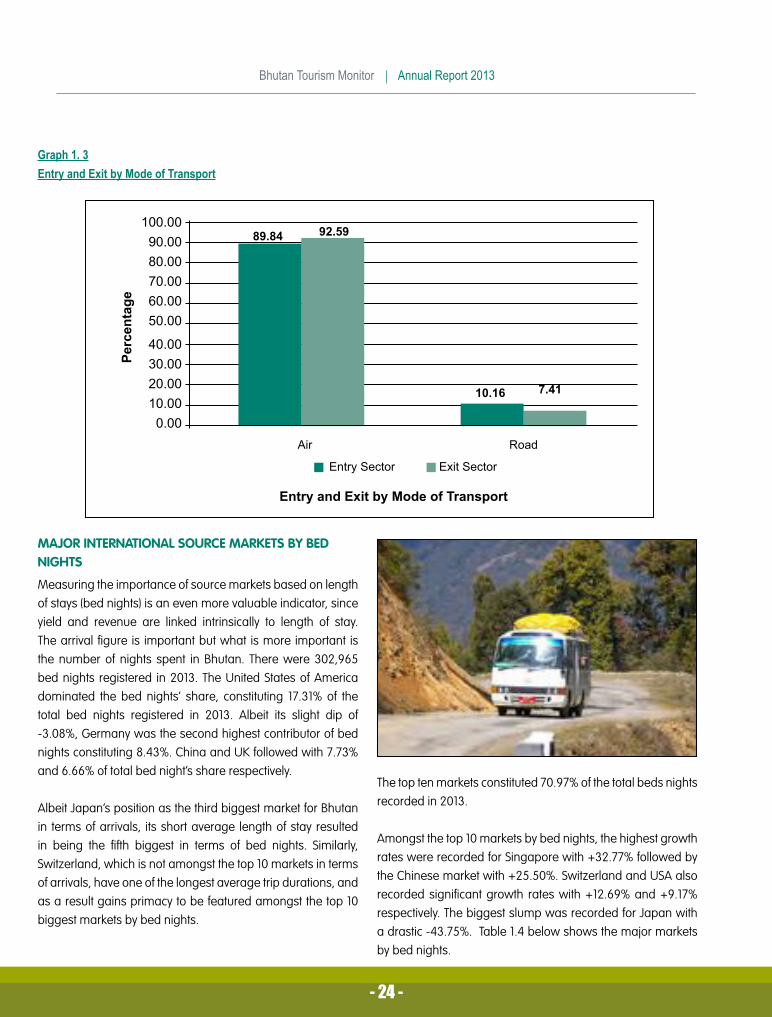
The port of entry and exit is an important trend as it provides insights to visitors’ preference to combine their holidays with other destinations in the region. Majority entered Bhutan using the air mode of travel with 89.84% entering Bhutan through the embarkation ports of the airlines. Whilst Drukair is still the dominant airline, the new entrant – Bhutan Airlines – greatly contributed to the air traffic after it commenced operations in October. The remaining 10.16% entered overland by road. Similarly, majority also use the air mode to exit Bhutan.
The major entry and exit ports are Bangkok and Kathmandu with 37.44% and 29.79% entering through it respectively. Another 38.84% and 27.84% used Bangkok and Kathmandu ports to exit from it. This was followed by the Delhi sector with 11.06% and 14.36% entering and exiting through this port. The new sector Singapore is increasingly used as port of entry
by source markets in South-East Asia and the Pacific region, popular mainly with markets such as Singapore and Australia. International visitors seldom use the Indian ports of Guwahati, Bodh Gaya and Bagdogra and Dhaka in Bangladesh to enter Bhutan. Records show that a chartered plane from Mandalay and Beijing also landed in Bhutan directly.
Phuentsholing is the most used port for entry over land with 7.74% of the total arrivals entering this border town. Some 4.73% also used to exit through it. Samdrup Jongkhar port also saw an increase in arrivals with 2.34% and 2.57% entering and exiting from it respectively. Only 39 visitors entered Bhutan from Gelephu in Sarpang Dzongkhag.
Graph 1.3 illustrates that the air exit continues to be the most preferred choice for tourists. In 2013, some 92.59% boarded the plane to exit Bhutan.
7DEOH������
5RDG�DQG�$LU�$FFHVVLELOLW\
$FFHVV�3RLQWV (QWU\�6HFWRU 3URSRUWLRQ�RI�(QWU\�6HFWRU ([LW�6HFWRU 3URSRUWLRQ�RI�([LW�
6HFWRU
%DQJNRN ������ ������ ������ ������
.DWKPDQGX ������ ������ ������ ������
'HOKL ����� ������ ����� ������
3KXHQWVKROLQJ ����� ����� ����� �����
.RONDWD ����� ����� ����� �����
6LQJDSRUH ����� ����� ����� �����
6DPGUXS�-RQJNKDU ����� ����� ����� �����
%DJGRJUD ��� ����� ��� �����
'KDND ��� ����� ��� �����
*XZDKDWL �� ����� �� �����
%RGK�*D\D ��� ����� �� �����
*HOHSKX �� ����� �� �����
0DQGDOD\ �� ����� �� �����
%HLMLQJ � ����� � �����
%KXWDQ�7RXULVP�0RQLWRU��������$QQXDO�5HSRUW�����
������
*UDSK������(QWU\�DQG�([LW�E\�0RGH�RI�7UDQVSRUW
�������������������������������
������������������������
3HUFHQWDJH
(QWU\�DQG�([LW�E\�0RGH�RI�7UDQVSRUW
����� �����
����� ����
$LU
(QWU\�6HFWRU ([LW�6HFWRU
5RDG
MAJOR INTERNATIONAL SOURCE MARKETS BY BED NIGHTS
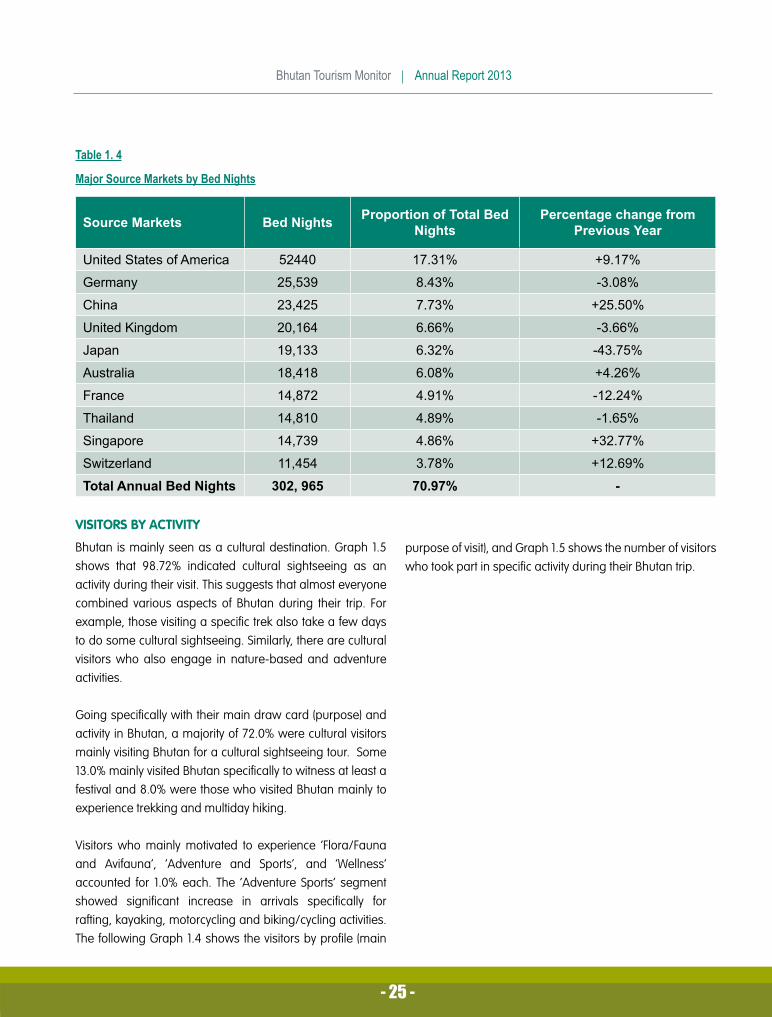
Measuring the importance of source markets based on length of stays (bed nights) is an even more valuable indicator, since yield and revenue are linked intrinsically to length of stay. The arrival figure is important but what is more important is the number of nights spent in Bhutan. There were 302,965 bed nights registered in 2013. The United States of America dominated the bed nights’ share, constituting 17.31% of the total bed nights registered in 2013. Albeit its slight dip of -3.08%, Germany was the second highest contributor of bed nights constituting 8.43%. China and UK followed with 7.73% and 6.66% of total bed night’s share respectively.
Albeit Japan’s position as the third biggest market for Bhutan in terms of arrivals, its short average length of stay resulted in being the fifth biggest in terms of bed nights. Similarly, Switzerland, which is not amongst the top 10 markets in terms of arrivals, have one of the longest average trip durations, and as a result gains primacy to be featured amongst the top 10 biggest markets by bed nights.
The top ten markets constituted 70.97% of the total beds nights recorded in 2013.
Amongst the top 10 markets by bed nights, the highest growth rates were recorded for Singapore with +32.77% followed by the Chinese market with +25.50%. Switzerland and USA also recorded significant growth rates with +12.69% and +9.17% respectively. The biggest slump was recorded for Japan with a drastic -43.75%. Table 1.4 below shows the major markets by bed nights.
������
%KXWDQ�7RXULVP�0RQLWRU��������$QQXDO�5HSRUW�����
������
7DEOH������
0DMRU�6RXUFH�0DUNHWV�E\�%HG�1LJKWV
6RXUFH�0DUNHWV %HG�1LJKWV 3URSRUWLRQ�RI�7RWDO�%HG�1LJKWV
3HUFHQWDJH�FKDQJH�IURP�3UHYLRXV�<HDU
8QLWHG�6WDWHV�RI�$PHULFD ����� ������ ������
*HUPDQ\ ������ ����� ������
&KLQD ������ ����� �������
8QLWHG�.LQJGRP ������ ����� ������
-DSDQ ������ ����� �������
$XVWUDOLD ������ ����� ������
)UDQFH ������ ����� �������
7KDLODQG ������ ����� ������
6LQJDSRUH ������ ����� �������
6ZLW]HUODQG ������ ����� �������
7RWDO�$QQXDO�%HG�1LJKWV �������� ������ �
VISITORS BY ACTIVITY
Bhutan is mainly seen as a cultural destination. Graph 1.5 shows that 98.72% indicated cultural sightseeing as an activity during their visit. This suggests that almost everyone combined various aspects of Bhutan during their trip. For example, those visiting a specific trek also take a few days to do some cultural sightseeing. Similarly, there are cultural visitors who also engage in nature-based and adventure activities.
Going specifically with their main draw card (purpose) and activity in Bhutan, a majority of 72.0% were cultural visitors mainly visiting Bhutan for a cultural sightseeing tour. Some 13.0% mainly visited Bhutan specifically to witness at least a festival and 8.0% were those who visited Bhutan mainly to experience trekking and multiday hiking.
Visitors who mainly motivated to experience ‘Flora/Fauna and Avifauna’, ‘Adventure and Sports’, and ‘Wellness’ accounted for 1.0% each. The ‘Adventure Sports’ segment showed significant increase in arrivals specifically for rafting, kayaking, motorcycling and biking/cycling activities. The following Graph 1.4 shows the visitors by profile (main
purpose of visit), and Graph 1.5 shows the number of visitors who took part in specific activity during their Bhutan trip.

%KXWDQ�7RXULVP�0RQLWRU��������$QQXDO�5HSRUW�����
������
*UDSK������9LVLWRUV�E\�0DLQ�0RWLYDWLRQ�WR�YLVLW�%KXWDQ
*UDSK������
9LVLWRUV�E\�$FWLYLW\
2WKHUV
7UDGLWLRQDO�0HGLFLQH
)O\�)LVKLQJ
5DIWLQJ�.D\DNLQJ
5HWUHDW�DQ�0HGLWDWLRQ
6SD�DQG�:HOOQHVV
0RXQWDLQ�%LNLQJ�0RWRUF\FOLQJ
)ORUD��)DXQD�DQG�$YL�)DXQD
7H[WLOHV
'D\�+LNHV
7UHNNLQJ
)HVWLYDOV
&XOWXUDO�6LJKWVHHLQJ
����� ������ ������ ������ ������ ������ ������ ������ ������ �����
������
�����
�����
�����
�����
���
���
���
���
���
�
�
����
7\SH�RI�$FWLYLWLHV�XQGHUWDNHQ�LQ�%KXWDQ

������
%KXWDQ�7RXULVP�0RQLWRU��������$QQXDO�5HSRUW�����
������
TOURISTS BY POPULAR FESTIVALS
Ever since Bhutan was opened for tourism, festivals remained one of the most visited attractions in the country. Festivals chiefly comprise of Tsechus – religious festivals – that are performed both by monks and laymen annually in Dzongs and temples. Paro Tsechu and Thimphu Tsechu continue to receive maximum visitations with record arrivals of 3,471 and 3,187 visitors respectively in 2013. Jambay Lhakhang Drub received 2,536 visitors, followed by Punakha Tsechu, Ura Yakchoe and Wangdue Tsechu. Amongst other events, the Rhododendron Festival organised in Lamperi Botanical Gardens, was the most popular event attracting approximately 600 international and local visitors.
*UDSK������
7RXULVWV�E\�3RSXODU�)HVWLYDOV
����������
����������
����������
���������
7RXULVW�$
UULYDOV
3DUR7VKHFKX
7KLPSKX7VKHFKX
-DPED\/KDNKDQJ7VKHFKX
3XQDNKD'UXEFKHQ
DQG�7VKHFKX
7RXULVW�$UULYDOV�E\�3RSXODU�)HVWLYDOV
:DQJGXH7VKHFKX
8UD<DNFKRH
7DP]KLQJ3KDOD
&KRHWSD
.XUMH\7VKHFKX
����������
�����
�����
����� ��� ��� ���

%KXWDQ�7RXULVP�0RQLWRU��������$QQXDO�5HSRUW�����
������
TREKKERS BY ROUTE
Visitors who visited Bhutan with the sole intention to experience trekking constituted 6.65% of the total international visitors in 2013. This figure represents a decline of -7.01% compared to the previous year. The Drukpath Trek remains to be the most popular trek accounting for 29.86% of all trekkers, followed closely by the Jomolhari Trek with 28.83%. The Laya Gasa Trek saw 6.43% of all trekkers, but this figure represents a decrease of -31.02% compared to the previous year. While most other treks saw dissipating numbers in 2013, the Bumthang Owl Trek, Nabji-Korphu trek, and the Snowman trek recorded significant increase in arrivals. The Merak Sakteng Community-based Trek received 113 visitors in 2013. The newly opened Royal Manas Community-based Trek received 2 visitors.
7DEOH������7UHNNHUV�E\�5RXWH
1DPH�RI�WKH�7UHN
1R��RI�7UHNNHUV
3HUFHQWDJH�7RWDO
3HUFHQWDJH�&KDQJH�IURP�3UHYLRXV�<HDU
'UXNSDWK�7UHN ��� ������ ������-RPROKDUL�7UHN ��� ������ ������/D\D�*DVD�7UHN ��� ����� �������
%XPWKDQJ�&XOWXUDO�WUHN ��� ����� �������
6DJDOD�7UHN ��� ����� ������6QRZPDQ�7UHN ��� ����� �������
0HUDN�6DNWHQJ�7UHN ��� ����� ������
'DJDOD�7KRXVDQG�/DNHV�7UHN
�� ����� ������
*DQJWH\�7UHN �� ����� �������
6DPWHQJDQJ�:LQWHU�7UHN �� ����� �������
%XPWKDQJ�2ZO�7UHN �� ����� �������
&KHOHOD�7UHN �� ����� �������
1XE�7VKRQD�3DWD�7UHN �� ����� ������
6LQFKXOD�7UHN �� ����� �������
1DEML�.RUSKX�7UHN �� ����� �������
'RQJOD�7UHN �� ����� �������3XQDNKD�:LQWHU�7UHN �� ����� �������
'XU�+RW�6SULQJ�7UHN � ����� �������
*DQJMXOD�7UHN � ����� �
*DQJNKDU�3KXHQVXP�7UHN � ����� �������
0DVDJDQJ�7UHN � ����� �������
5R\DO�0DQDV�7UHN � ����� ��������
:LOG�(DVW�5RGXQJOD�7UHN � ����� �������
7RWDO� �����

������
%KXWDQ�7RXULVP�0RQLWRU��������$QQXDO�5HSRUW�����
������
AVERAGE LENGTH OF STAY
The average length of stay in 2013 remained the same as that of the previous year at 6.85 days. This however does not mean that the trip duration of visitors is reducing, but is mainly attributed to the significant growth rates in Asian markets whose lengths of stays are shorter. Trends for source markets and their average length of stay remain almost the same over the years. The source market with highest average length of stay was Switzerland spending around 10.75 days in Bhutan, closely followed by France (9.53 days), Germany (9.28 days) and Australia (9.02 days).
Average Length of Stay of visitors from USA and UK also virtually remained the same with 7.57 days and 8.80 days respectively. Asian tourists staying for shorter duration is a stable trend and does not seem to change with the years. Malaysian visitors stayed for an average 5.18 days, Chinese visitors stayed for 4.92 days, Japanese for 4.77 days and Thai for 4.24 days on average.
Amongst other important markets, Netherlands, Denmark and Czech Republic had longer stays at an average of 9.5 days.
7DEOH������
$YHUDJH�/HQJWK�RI�6WD\�E\�0DMRU�0DUNHWV
6RXUFH�0DUNHWV %HG�1LJKWV 3URSRUWLRQ�RI�7RWDO�%HG�1LJKWV $YHUDJH�/HQJWK�RI�6WD\
6ZLW]HUODQG ������ ����� ������'D\V
)UDQFH ������ ����� �����'D\V
*HUPDQ\ ������ ����� �����'D\V
$XVWUDOLD ������ ����� �����'D\V
8QLWHG�.LQJGRP ������ ����� �����'D\V
8QLWHG�6WDWHV�RI�$PHULFD ������ ������ �����'D\V
6LQJDSRUH ������ ����� �����'D\V
0DOD\VLD ������ ����� �����'D\V
&KLQD ������ ����� �����'D\V
-DSDQ ������ ����� �����'D\V
7KDLODQG ������ ����� �����'D\V
7RWDO ������� ������ �����'D\V

%KXWDQ�7RXULVP�0RQLWRU��������$QQXDO�5HSRUW�����
������
SEASONALITY OF VISITATION (BASED ON BED NIGHTS)
As opposed to in 2012 where notable increase in arrivals was recorded during the lean season, findings in 2013 indicate that Bhutan is still viewed as a seasonal destination by travellers around the world. This suggests that Bhutan’s tourism industry is impacted with high incidence of seasonality as the busy months of March and October continue receive maximum arrivals. February recorded a growth rate of +54.84%, followed by +27.32% for March. June recorded a slight increase of +4.42%, followed by October +3.68%. Least visited months of January and July recorded significant drop in arrivals to exacerbate the seasonality of international visitation.
Graph 1.6 shows that March, April, September, October, and November are the months that most tourists visited Bhutan, accounting for 65.44% of all international arrivals. This is, to a large extend, attributed to the festival seasons and favourable weather conditions that coincide with the above months.
7DEOH������
%HG�1LJKWV�E\�0RQWK�
0RQWK%HG�
1LJKWV�LQ�����
3URSRUWLRQ�RI�%HG�1LJKWV
3HUFHQWDJH�&KDQJH�IURP�����
-DQXDU\ ����� ����� �������
)HEUXDU\ ������ ����� �������
0DUFK ������ ������ �������
$SULO ������ ������ �������
0D\ ������ ����� ������
-XQH� ������ ����� ������
-XO\ ����� ����� �������
$XJXVW ������ ����� ������
6HSWHPEHU ������ ����� ������
2FWREHU ������ ������ ������
1RYHPEHU ������ ������ ������
'HFHPEHU ������ ����� ������*UDSK������
9LVLWDWLRQ�E\�0RQWK
������������������������������������
�
7RXULVW�$
UULYDOV
,QWHUQDWLRQDO�7RXULVW�$UULYDOV�E\�0RQWK
-DQXDU\
)HEUXDU\
0DUFK $SULO
0D\
-XQH -XO\
$XJXVW
6HSWHPEHU
2FWREHU
1RYHPEHU
'HFHPEHU
����
����
���� ����
�������� ����
����
����
����
����
����

������
%KXWDQ�7RXULVP�0RQLWRU��������$QQXDO�5HSRUW�����
������
MAJOR SOURCE MARKETS BY SEASON OF VISITATION
Travel patterns pertaining to preferred holiday times for various nationalities is crucial for country-wise marketing purposes. More than half of the total arrivals from the top source markets – USA, UK, Germany, France, Switzerland, Canada etc. – chose to visit Bhutan during autumn (September – November), followed by roughly in excess of a quarter of them visiting during spring (March - May) months. Visitations from important Asian markets such as Japan, China, Thailand, Singapore and Malaysia and are distributed throughout all seasons.
Besides these top Asian markets, a significant number of Americans (7.88%) and Australians (8.52%) also visited during the lean summer monsoon season. Similarly Americans and Australians also travelled during the lean winter season with 12.73% and 8.91% respectively.
This finding shows that factors such as festival dates, favourable weather conditions, tour operator’s advice are more important than visitors’ holiday timing because findings show that most Americans and Europeans travel during the summer between June-August, which in Bhutan are lean months with lower arrivals.
The research shows that there is a huge majority of travellers, who associate Bhutan as too cold to travel in winter. Bhutan has a huge potential for winter tourism especially in the southern Dzongkhags and this should be promoted well through innovative packages to alleviate visitation during the winter lean months.Findings indicate that seasonality is entrenched in the marketing messages of the country and targeted campaigns could help increase visitations during the lean period.
7DEOH������6RXUFH�0DUNHWV�E\�6HDVRQ�RI�9LVLWDWLRQ�
0DMRU� 6RXUFH�0DUNHWV
1XPEHU�RI�7RXULVWV�DQG���RI�$QQXDO�7RWDO
0DUFK�±�0D\ -XQH���$XJXVW 6HSWHPEHU�±�1RYHPEHU 'HFHPEHU�-DQXDU\
8QLWHG�6WDWHV�RI�$PHULFD ����� ������ ��� ����� ����� ������ ��� ������
-DSDQ ����� ������ ����� ������ ����� ������ ��� ������
&KLQD ����� ������ ��� ������ ����� ������ ��� ������
8QLWHG�.LQJGRP ��� ������ ��� ����� ����� ������ ��� ������
*HUPDQ\ ��� ������ ��� ����� ����� ������ ��� ������
7KDLODQG ����� ������ ��� ������ ��� ������ ��� ������
$XVWUDOLD ��� ������ ��� ����� ��� ������ ��� �����
)UDQFH ��� ������ ��� ����� ��� ������ �� �����
6LQJDSRUH ��� ������ ��� ������ ��� ������ ��� ������
7DLZDQ ��� ������ ��� ������ ��� ������ ��� ������
0DOD\VLD ��� ������ ��� ������ ��� ������ ��� ������

%KXWDQ�7RXULVP�0RQLWRU��������$QQXDO�5HSRUW�����
������
TOUR GROUP SIZE
There were 11,602 tour groups that visited Bhutan in 2013. The group size varied with some groups as big as 84 people in a group. The maximum number of groups travelled as couples (2-member group) followed by a small group of 4 persons. There were a significant number of solo travellers as well. The average group size was 3.81 (4 persons). This average group size can be an important factor especially for
the Government and private tourism enterpreneurs to look at when deciding on issuing tax incentive for the purchase of vehicle (carrying capacity) to carry tourists and while devising small group surcharges. This tells us that most visitors prefer to travel in small groups ranging from 1 to 4 members. This was also the trend in the previous years.
7DEOH������7RXU�JURXS�6L]H
1XPEHU� RI� 3D[�LQ�*URXS
1XPEHU� RI�*URXSV
7RWDO�1XPEHU�RI�$UULYDOV
� ����� ������ ����� ������ ��� ������ ��� ������ ��� ������ ��� ������ ��� ������ ��� ������ ��� ������� ��� ������� ��� ������� ��� ������� �� ����� �� ����� �� ������� ��� ������� �� ������� �� ����� �� ����� �� ����� �� ����� �� ����� �� ����� �� ����� �� ����� � ����� � ���� � ����� � ���
�� � ����� � ����� �� ����� � ���� � ���� � ���� � ���� � ����� � ���� � ����� � ���� � ���� � ���� � ���� � ���� � ���� � ���� � ���� � ���� � ���� � ����� � ���� � ���� � ���� � ����� � ����� � ���� � ���� � ���� � ��
7RWDO� ������ ������

������
%KXWDQ�7RXULVP�0RQLWRU��������$QQXDO�5HSRUW�����
������������
SPREAD OF TOURISM IMPACT
In the Graph 1.8 the spread of tourism impact is graphically demonstrated by the geographical position of the Dzongkhags laterally across the country. It clearly illustrates that the geographical spread is very limited with high concentration of visitation mainly on the western part of the country namely Paro, Thimphu and Punakha, Wangdue and in the central Dzongkhag of Bumthang.
Paro (33.70%) hosted the maximum bed nights followed by Thimphu (24.31%), Punakha (14.04%) and Bumthang (9.70%) and Wangdue Phodrang (8.12%). Arrivals in the 6 eastern Dzongkhags saw slight increase in arrivals accounting for 3.76% of the total bed nights. Notwithstanding its huge potential for winter tourism, Samtse, Dagana, Tsirang, Sarpang and Zhemgang Dzongkhags continue to receive minimal visitors. The recently opened Royal Manas Trek is expected to improve geographical spread in the southern Dzongkhags and seasonality during winter lean months. Likewise, the newly opened Salt-route trek is an initiative of the Government to encourage more visitations in the eastern region.
Table 1.10 shows the number of tourist arrivals and bed nights by Dzongkhag.
�����
�����
�����
�����
�����
�����
����
��������
+DD
6DPWVH
3DUR
7KLPSKX
&KKXNKD
:DQJGXH�3KRGUDQJ
3XQDNKD*DVD
7VLUDQJ
']RQJNKDJ
3HUFHQWDJH
'DJDQD
6DUSDQJ
=KHPJDQJ
7URQJVD
%XPWKDQJ
0RQJJDU
/KXHQWVH
7UDVKL�<DQJWVH
7UDVKLJDQJ
3HPD�*DWVKHO
6DPGUXS�-RQJNKDU
����
�����
�����
����
����
�����
���� ���� ���� ��������� ����
����
��������
���� ���� ��������
*UDSK������%HG�1LJKWV�E\�']RQJNKDJV

%KXWDQ�7RXULVP�0RQLWRU��������$QQXDO�5HSRUW�����
������
7DEOH�������
']RQJNKDJ�$UULYDOV�DQG�%HG�1LJKWV
']RQJNKDJ 7RXULVW�$UULYDOV %HG�1LJKWV
3DUR ������ �������
7KLPSKX ������ ������
3XQDNKD ������ ������
%XPWKDQJ� ������ ������
:DQJGXH�3KRGUDQJ ������ ������
7URQJVD ����� �����
&KXNKD ����� �����
7UDVKLJDQJ ����� �����
+DD ����� �����
0RQJJDU ����� �����
*DVD ��� �����
6DPGUXS�-RQJNKDU ����� �����
7UDVKL�\DQJWVH ��� �����
=KHPJDQJ ��� ���
6DUSDQJ ��� ���
/KXHQWVH ��� ���
3HPD�*DWVKHO �� ���
7VLUDQJ �� ��
'DJDQD � ��
6DPWVH � �
ACCOMMODATION PROVIDERS BY BED NIGHTS
In terms of the bed nights by accommodation providers, hotel Meri Phuensum in Punakha recorded the highest number of bed nights constituting 3.90% of the total bed night share, followed by Olathang Hotel in Paro with 3.37%. Amongst the luxury 5-star properties, Uma Resort in Paro dominated the bed night’s share with 3.19%, followed by Hotel Zhiwaling (2.60%), and Hotel Taj Tashi in Thimphu (2.41%). The high occupancy for 5-star hotels indicate a substantial number of high-end travellers with significant Out-of-Pocket spending, contributing to higher yields. Amongst hotels in Thimphu, Hotel Phuntsho Pelri received the maximum bed nights contributing 2.85% of the total bed night’s share.
The top 13 accommodation providers accounted for a total of 34.75%, thereby indicating that the bed night’s share are getting increasingly distributed. This is because there has been an influx of new accommodation providers every year and as a result the hospitality sector is getting more competitive. Tashi Namgay Resort and Tenzinling Resort in Paro also recorded growth rates.
7DEOH������
$FFRPPRGDWLRQ�3URYLGHUV�E\�%HG�1LJKWV
$FFRPPRGDWLRQ�3URYLGHUV
%HG�1LJKWV
����3URSRUWLRQ�RI�$QQXDO�%HG�1LJKWV����
0HUL�3KHQVXP�5HVRUW�±�3XQDNKD ������ �����
2ODWKDQJ�+RWHO�±�3DUR ������ �����
8PD�5HVRUW�±�3DUR ����� �����
3KXHQWVKR�3HOUL�+RWHO�±�7KLPSKX ����� �����
7DVKL�1DPJD\�5HVRUW�±3DUR ����� �����
=KLZDOLQJ�+RWHO��3DUR ����� �����
7HQ]LQJOLQJ�5HVRUW��3DUR ����� �����
'DPFKHQ�5HVRUW ����� �����
7DM�7DVKL�±�7KLPSKX ����� �����
.LVD�+RWHO�±�7KLPSKX ����� �����
'HZDFKHQ�5HVRUW��:DQJGXH ����� �����
=DQJGRSHOUL�5HVRUW��3XQDNKD ����� �����
5LYHU�9LHZ�+RWHO�±�7KLPSKX ����� �����
&XPXODWLYH�7RWDO ������� ������

������
%KXWDQ�7RXULVP�0RQLWRU��������$QQXDO�5HSRUW�����
������
CATEGORIES OF ACCOMMODATION PROVIDERS
The Tourism Council of Bhutan continued assessment and accreditation of accommodation providers as per the ‘Star Classification’. Properties are classified according to the number of stars they merit based on a set of criteria that ensures and espouses the “high value, low impact” tourism policy. In 2013, there were 123 accredited properties that were divided into 9 ‘5-Star’ category, 8 ‘4-Star’ category, 45 ‘3-Star’ category, 42 ‘2-Star’ category and 19 ‘1-Star’ category properties.
The Tourism Council of Bhutan has set a minimum requirement of a ‘3-star’ property for tourism accommodation to encourage quality delivery to justify the tourism policy to promote high-end tourism.
Table 1.12 illustrates that only 11 Dzongkhags have accredited hotels in the country.
7DEOH�������&DWHJRULHV�RI�$FFRPPRGDWLRQ�3URYLGHUV
']RQJNKDJ��6WDU�
$FFRPPRGDWLRQ�3URYLGHUV
��6WDU�$FFRPPRGDWLRQ�
3URYLGHUV
��6WDU�$FFRPPRGDWLRQ�
3URYLGHUV
��6WDU$FFRPPRGDWLRQ�
3URYLGHUV
��6WDU�$FFRPPRGDWLRQ�
3URYLGHUV
3DUR � � �� �� �
7KLPSKX � � � �� �
%XPWKDQJ � � �� � �
3XQDNKD � � � � �
:DQJGXH�3KRGUDQJ � � � � �
7URQJVD � � � � �
&KKXNKD�3KXHQWVKROLQJ � � � � �
7UDVKLJDQJ � � � � �
0RQJJDU � � � � �
+DD � � � � �
6DPGUXS�-RQJNKDU � � � � �
7RWDO� � � �� �� ��
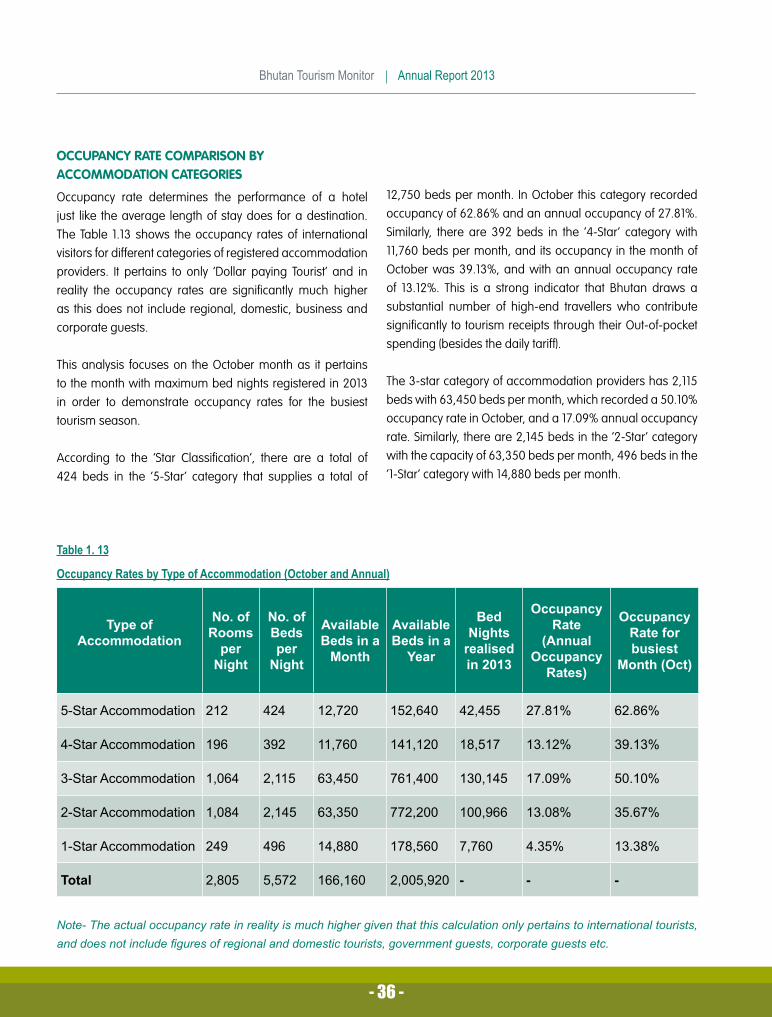
%KXWDQ�7RXULVP�0RQLWRU��������$QQXDO�5HSRUW�����
������
OCCUPANCY RATE COMPARISON BY ACCOMMODATION CATEGORIES
Occupancy rate determines the performance of a hotel just like the average length of stay does for a destination. The Table 1.13 shows the occupancy rates of international visitors for different categories of registered accommodation providers. It pertains to only ‘Dollar paying Tourist’ and in reality the occupancy rates are significantly much higher as this does not include regional, domestic, business and corporate guests.
This analysis focuses on the October month as it pertains to the month with maximum bed nights registered in 2013 in order to demonstrate occupancy rates for the busiest tourism season.
According to the ‘Star Classification’, there are a total of 424 beds in the ‘5-Star’ category that supplies a total of
12,750 beds per month. In October this category recorded occupancy of 62.86% and an annual occupancy of 27.81%. Similarly, there are 392 beds in the ‘4-Star’ category with 11,760 beds per month, and its occupancy in the month of October was 39.13%, and with an annual occupancy rate of 13.12%. This is a strong indicator that Bhutan draws a substantial number of high-end travellers who contribute significantly to tourism receipts through their Out-of-pocket spending (besides the daily tariff).
The 3-star category of accommodation providers has 2,115 beds with 63,450 beds per month, which recorded a 50.10% occupancy rate in October, and a 17.09% annual occupancy rate. Similarly, there are 2,145 beds in the ‘2-Star’ category with the capacity of 63,350 beds per month, 496 beds in the ‘1-Star’ category with 14,880 beds per month.
7DEOH������
2FFXSDQF\�5DWHV�E\�7\SH�RI�$FFRPPRGDWLRQ��2FWREHU�DQG�$QQXDO�
7\SH�RI�$FFRPPRGDWLRQ
1R��RI�5RRPV�SHU�1LJKW
1R��RI�%HGV�SHU�1LJKW
$YDLODEOH�%HGV�LQ�D�0RQWK
$YDLODEOH�%HGV�LQ�D�<HDU
%HG�1LJKWV�UHDOLVHG�LQ�����
2FFXSDQF\�5DWH
�$QQXDO�2FFXSDQF\�5DWHV�
2FFXSDQF\�5DWH�IRU�EXVLHVW�
0RQWK��2FW�
��6WDU�$FFRPPRGDWLRQ� ��� ��� ������ ������� ������ ������ ������
��6WDU�$FFRPPRGDWLRQ ��� ��� ������ ������� ������ ������ ������
��6WDU�$FFRPPRGDWLRQ ����� ����� ������ ������� ������� ������ ������
��6WDU�$FFRPPRGDWLRQ ����� ����� ������ ������� ������� ������ ������
��6WDU�$FFRPPRGDWLRQ ��� ��� ������ ������� ����� ����� ������
7RWDO ����� ����� ������� ��������� � � �
1RWH��7KH�DFWXDO�RFFXSDQF\�UDWH�LQ�UHDOLW\�LV�PXFK�KLJKHU�JLYHQ�WKDW�WKLV�FDOFXODWLRQ�RQO\�SHUWDLQV�WR�LQWHUQDWLRQDO�WRXULVWV��DQG�GRHV�QRW�LQFOXGH�¿JXUHV�RI�UHJLRQDO�DQG�GRPHVWLF�WRXULVWV��JRYHUQPHQW�JXHVWV��FRUSRUDWH�JXHVWV�HWF��
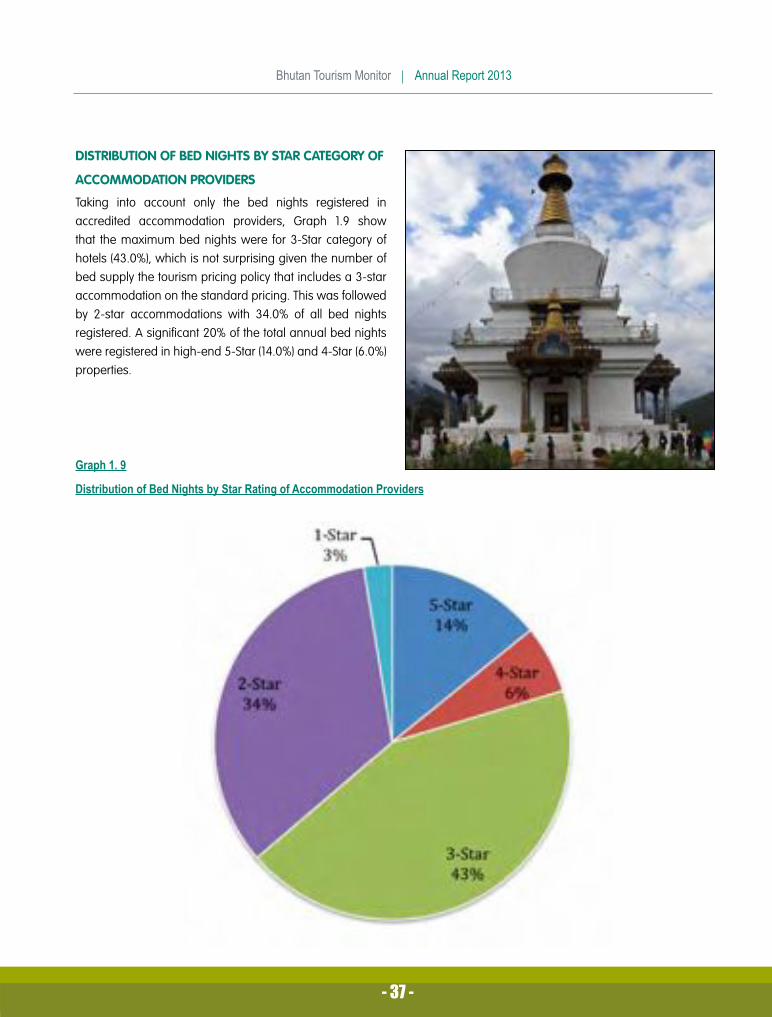
%KXWDQ�7RXULVP�0RQLWRU��������$QQXDO�5HSRUW�����
������
DISTRIBUTION OF BED NIGHTS BY STAR CATEGORY OF
ACCOMMODATION PROVIDERS
Taking into account only the bed nights registered in accredited accommodation providers, Graph 1.9 show that the maximum bed nights were for 3-Star category of hotels (43.0%), which is not surprising given the number of bed supply the tourism pricing policy that includes a 3-star accommodation on the standard pricing. This was followed by 2-star accommodations with 34.0% of all bed nights registered. A significant 20% of the total annual bed nights were registered in high-end 5-Star (14.0%) and 4-Star (6.0%) properties.
*UDSK�����
'LVWULEXWLRQ�RI�%HG�1LJKWV�E\�6WDU�5DWLQJ�RI�$FFRPPRGDWLRQ�3URYLGHUV

%KXWDQ�7RXULVP�0RQLWRU��������$QQXDO�5HSRUW�����
������
ACCOMMODATION ANALYSIS AND OCCUPANCY RATE BY DZONGKHAG
Tourism accommodation accredited by the Tourism Council of Bhutan have 123 properties that supplies 2,805 rooms with a capacity of 5,572 beds every night. A total of 166,160 beds are available in a month, which means that if all the beds were occupied in all the 123 registered accommodation providers every night, the current beds supply would be able to cater to more than in excess of 6.62 times than that of the overall annual occupancy of international visitors in 2013. This tells us that Bhutan has plenty of hotels, although they may not be equally distributed in all regions.
Table 1.14 show that although the main tourism destinations of Thimphu, Paro and Bumthang receive the maximum
visitors, they have registered lower occupancy rates due to an oversupply of beds compared to Punakha, Trashigang, Wangdue Phodrang, and Haa Dzongkhags. This suggests that investment in accommodation should be focused in Dzongkhags where there are less or no international standard hotels. Zhemgang, Gasa, Tsirang, Sarpang, Samtse, Lhuentse, Pema Gatshel, and Dagana Dzongkhags do not have registered hotels, and hence are affected by a lack of accommodation providers. The Tourism Council of Bhutan is encouraging and supporting local residents in these Dzongkhags to upgrade their homes as farmhouses to host visitors.
7DEOH�������
$FFRPPRGDWLRQ�$QDO\VLV�DQG�2FFXSDQF\�5DWH�E\�']RQJNKDJ
']RQJNKDJ 7RWDO�5RRPV
7RWDO�%HGV
$YDLODEOH�%HG�1LJKWV
SHU�0RQWK
$YDLODEOH�%HG�1LJKWV�LQ�D�<HDU
$QQXDO�%HG�1LJKWV�5HDOLVHG
$QQXDO�2FFXSDQF\�5DWH�
LQ�����
3DUR ��� ����� ������ ������� ������� ������
7KLPSKX ��� ����� ������ ������� ������ ������
%XPWKDQJ ��� ��� ������ ������� ������ ������
3XQDNKD ��� ��� ����� ������ ������ ������
:DQJGXH3KRGUDQJ ��� ��� ����� ������� ������ ������
7URQJVD �� ��� ����� ������ ����� ������
&KKXNKD�3�/LQJ ��� ��� ���� ����� ����� �����
7UDVKLJDQJ �� �� ����� ������ ����� ������
0RQJJDU �� ��� ����� ������ ����� �����
+DD �� �� ���� ����� ����� ������
6DPGUXS�-RQJNKDU �� ��� ����� ������ ����� �����
7UDVKL�<DQJWVH �� �� ��� ����� ����� ������
1RWH��7KH�DFWXDO�RFFXSDQF\�UDWH�LQ�UHDOLW\�LV�PXFK�KLJKHU�JLYHQ�WKDW�WKLV�FDOFXODWLRQ�RQO\�SHUWDLQV�WR�LQWHUQDWLRQDO�WRXULVWV��DQG�GRHV�QRW�LQFOXGH�¿JXUHV�RI�UHJLRQDO�DQG�GRPHVWLF�WRXULVWV��JRYHUQPHQW�JXHVWV��FRUSRUDWH�JXHVWV�HWF��

������
%KXWDQ�7RXULVP�0RQLWRU��������$QQXDO�5HSRUW�����
������
TOUR OPERATOR SHARE OF INTERNATIONAL MARKET
Norbu Bhutan Travel continued to dominate the market share followed by the Bhutan Tourism Corporation Limited’s Luxury Division. Himalayan Kingdom tours came third and also recorded the highest growth rate. Druk Asia Tours and Treks, and All Bhutan Connection continued to perform well in 2013, surpassing International Tours and Treks, Etho Metho Tours and Treks and Yangphel Adventure Travel. The table below shows the rankings of tour operators by gross tourism earnings.
7DEOH�������
7RXU�2SHUDWRU�6KDUH�RI�0DUNHW��EDVHG�RQ�%HG�1LJKWV��
7RXU�2SHUDWRU 7RWDO�,QWHUQDWLRQDO�$UULYDOV *URVV�(DUQLQJV�LQ�86'��PLOOLRQ�
1RUEX�%KXWDQ�7UDYHO�3ULYDWH�/LPLWHG ����� ����
%KXWDQ�7RXULVP�&RUSRUDWLRQ�/WG��LQFOXGLQJ�/X[XU\�'LYLVLRQ� ����� ����
+LPDOD\DQ�.LQJGRP�7RXUV ����� ����
'UXN�$VLD�7RXUV�DQG�7UHNV ����� ����
$OO�%KXWDQ�&RQQHFWLRQ ����� ����
,QWHUQDWLRQDO�7UHNV�DQG�7RXUV ��� ����
<DQJSKHO�$GYHQWXUH�7UDYHO ��� ����
(WKR�0HWKR�7RXUV��7UHNV�/WG� ��� ����
5DLQERZ�7RXUV��7UHNV ��� ����
*DQJUL�7RXUV��7UHNV ��� ����

%KXWDQ�7RXULVP�0RQLWRU��������$QQXDO�5HSRUW�����
������
TOURISM EARNINGS FROM INTERNATIONAL ARRIVALS (IN $US MILLION)
In 2013, the tourism receipts from international visitors (Dollar paying) alone generated USD 63.49 million as direct gross earnings, out of which USD 16.62 million was generated as direct revenue for the Government through the “Royalty” (35% tourism levy on daily tariff) only. Other earnings from international tourist arrivals through the aviation receipts, and taxes such as the Business Income Tax (BIT) and Sales Taxes paid by tourism service providers also translate into government revenue, therefore increasing the revenue generated by the international inbound segment. Table 1.16 shows the breakdown of tourism earnings from the international segment of visitors.
It is very difficult to measure the real benefit of tourism as it encompasses many services contributed by indirect tourism players in its supply chain. Many countries have tried to measure tourism industry’s benefit through Tourism Satellite Account (TSA), a methodology developed by the United Nation World Tourism Organization (UNWTO). However, TSA does not take into account the indirect tourism benefits. It is
believed that in most cases the indirect benefits is more than the double of the direct tourism benefit.
In reality, findings indicate that the overall tourism earnings is estimated to be approximately in excess of USD 220 million including receipts from Drukair, regional tourism, Out-of-pocket spending of visitors on shopping and other additional services and products etc.
*UDSK������
7RXULVP�(DUQLQJV�IURP�,QWHUQDWLRQDO�9LVLWRUV�LQ�86'�PLOOLRQV�������������
����� ����� ����� ����� ����� ����
*URVV�(DUQLQJV��IURP�7RXULVP�7DULII��IURP�,QWHUQDWLRQDO�9LVLWRUV
,Q�86'
��0LOOLRQ�
�����
�����
�����
�����
����������
�����
�����
�����
�����
�����
�����
����
�����
7DEOH������
7RXULVP�(DUQLQJV�%UHDNGRZQ��86'�
(DUQLQJV�%UHDNGRZQ (DUQLQJV86'��PLOOLRQ�
*URVV�(DUQLQJV �����5R\DOW\ �����9LVD�)HH�IURP�7RXULVWV ����9LVD�)HH�IURP�)$0�YLVLWRUV �����6PDOO�*URXS�6L]H�6XUFKDUJH �������7D[�'HGXFWHG�DW�6RXUFH �����7RXU�2SHUDWRU¶V�1HW �����

������
%KXWDQ�7RXULVP�0RQLWRU��������$QQXDO�5HSRUW�����
������
Findings in Section 2 are results from data collected using an administered (i.e. interviewer conducted) exit
survey methodology, in which international visitors were interviewed for their first-hand feedback while leaving Bhutan after their trip. The exit surveys were conducted using the on-site methodology by commissioning a team of experienced enumerators at the Paro International airport, and at land access points at Phuentsholing, Samdrup Jongkhar and Gelephu.
A total of 8,768 international visitors were interviewed in order to represent a robust sample-size so that the margin of error is minimal. A total of six collection periods spanning a month each were carried out over different parts of the year to capture data pertaining to specific visitation times.
This data provides additional information to the Tashel-Online system. It gives a more in-depth “snapshot” of
6HFWLRQ� �� ²� ([LW� 6XUYH\V� IRU� ,QWHUQDWLRQDO�9LVLWRUV
the visitors’ travel behaviours, motivations, patterns and preferences and a first-hand visitor feedback on their Bhutan experience. For additional market intelligence such information is important.
AGE OF VISITORS
International visitors to Bhutan are mostly 45+ years in age (63.35% of all respondents). Similar to earlier findings, the dominant age bracket was ‘Over 60’ years with 25.48%, followed by the ‘46 - 55’ years bracket with 23.58%. The ‘36 - 45’ years also rated significantly with 16.96%, followed closely by ‘56-60’ years age bracket with 14.29%. Only 5.70% were below 25 years of age, indicating that young travellers seldom choose Bhutan for a holiday. The constant trend suggests that Bhutan mainly attracts elderly travellers who are generally richer, well travelled, and willing to pay a premium to experience Bhutan.
3HUFHQW
��
��
��
�����
����
����������
�����
�����
�����
8QGHU��� ����� ����� ����� ����� ����� ���
$JH�RI�5HVSRQGHQW
*UDSK������$JH�RI�9LVLWRUV

%KXWDQ�7RXULVP�0RQLWRU��������$QQXDO�5HSRUW�����
������
LEVEL OF VISITOR EDUCATION
Visitors to Bhutan are well educated and the trend continues in 2013 with 85.84% of all respondents holding at least a Bachelor’s degree. Out of which, some 32.36% had a Master’s Degree and another 10.42% indicated to have Doctorate qualifications.
An increase in those attending school, which constituted 14.17% of the total respondents, indicates that a significant number of family groups with children, and young individuals still in school visited Bhutan in 2013.
*UDSK������
9LVLWRUV·�/HYHO�RI�(GXFDWLRQ
3HUFHQW
��
��
��
��
�6FKRRO %DFKHORUV�
'HJUHH0DVWHUV�'HJUHH
3KG 2WKHU
/HYHO�RI�(GXFDWLRQ
�����
�����
�����
�����
����
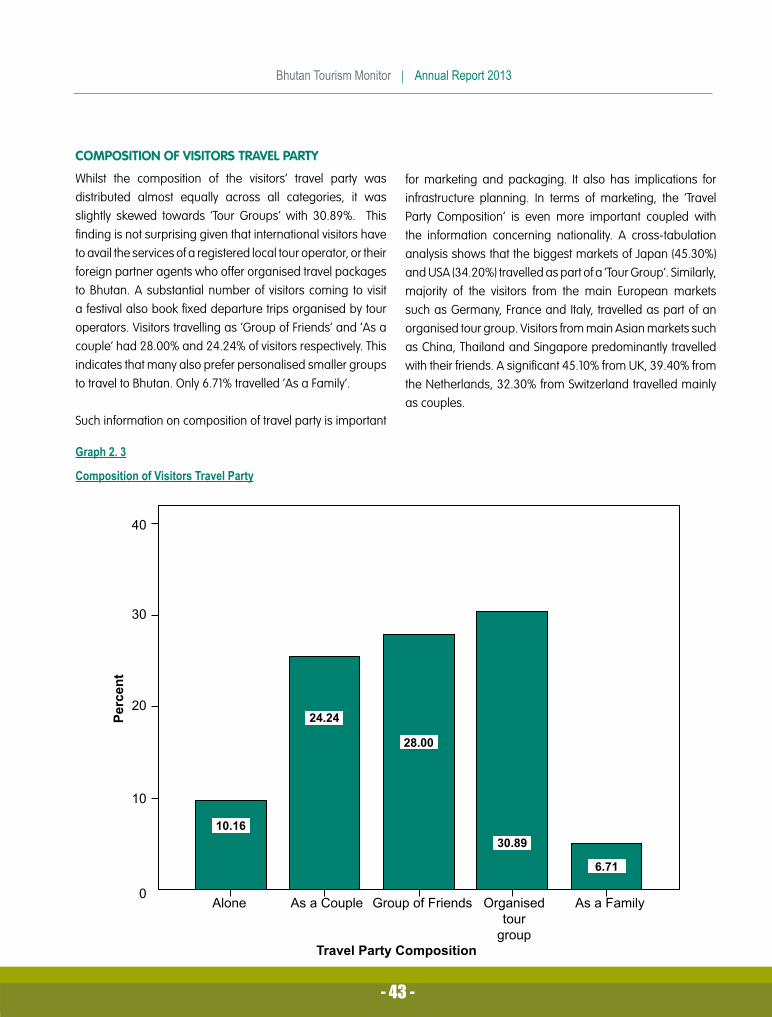
������
%KXWDQ�7RXULVP�0RQLWRU��������$QQXDO�5HSRUW�����
������
3HUFHQW
��
��
��
��
�$ORQH $V�D�&RXSOH *URXS�RI�)ULHQGV 2UJDQLVHG�
WRXUJURXS
$V�D�)DPLO\
7UDYHO�3DUW\�&RPSRVLWLRQ
�����
�����
�����
�����
����
COMPOSITION OF VISITORS TRAVEL PARTY
Whilst the composition of the visitors’ travel party was distributed almost equally across all categories, it was slightly skewed towards ‘Tour Groups’ with 30.89%. This finding is not surprising given that international visitors have to avail the services of a registered local tour operator, or their foreign partner agents who offer organised travel packages to Bhutan. A substantial number of visitors coming to visit a festival also book fixed departure trips organised by tour operators. Visitors travelling as ‘Group of Friends’ and ‘As a couple’ had 28.00% and 24.24% of visitors respectively. This indicates that many also prefer personalised smaller groups to travel to Bhutan. Only 6.71% travelled ‘As a Family’.
Such information on composition of travel party is important
for marketing and packaging. It also has implications for infrastructure planning. In terms of marketing, the ‘Travel Party Composition’ is even more important coupled with the information concerning nationality. A cross-tabulation analysis shows that the biggest markets of Japan (45.30%) and USA (34.20%) travelled as part of a ‘Tour Group’. Similarly, majority of the visitors from the main European markets such as Germany, France and Italy, travelled as part of an organised tour group. Visitors from main Asian markets such as China, Thailand and Singapore predominantly travelled with their friends. A significant 45.10% from UK, 39.40% from the Netherlands, 32.30% from Switzerland travelled mainly as couples.
*UDSK������
&RPSRVLWLRQ�RI�9LVLWRUV�7UDYHO�3DUW\

%KXWDQ�7RXULVP�0RQLWRU��������$QQXDO�5HSRUW�����
������
7DEOH������7UDYHO�3DUW\�&RPSRVLWLRQ�E\�0DMRU�0DUNHWV
0DMRU�6RXUFH�0DUNHWV $ORQH���� $V�D�&RXSOH����
*URXS�RI�)ULHQGV����
2UJDQLVHG�7RXUV����
$V�D�)DPLO\����
86$ ��� ���� ���� ���� ���-DSDQ ���� ���� ���� ���� ���*HUPDQ\ ��� ���� ���� ���� ���8. ��� ���� ���� ���� ���&KLQD ��� ���� ���� ���� ���)UDQFH ���� ���� ���� ���� ���$XVWUDOLD ���� ���� ���� ���� ���7KDLODQG ��� ���� ���� ���� ���,WDO\ ���� ���� ���� ���� ���1HWKHUODQGV ���� ���� ���� ���� ���6ZLW]HUODQG ���� ���� ���� ���� ���&DQDGD ��� ���� ���� ���� ���6LQJDSRUH ���� ���� ���� ���� ����2WKHU�(XURSH ��� ���� ���� ���� ���2WKHU�6RXWK�(DVW�$VLD ���� ���� ���� ���� ����6RXWK�$PHULFD ���� ���� ���� ���� ���$IULFD ��� ���� ���� ��� ���0LGGOH�HDVW ��� ��� ���� ���� ���2WKHU ��� ���� ���� ���� ���

������
%KXWDQ�7RXULVP�0RQLWRU��������$QQXDO�5HSRUW�����
������
REPEAT VISITATION PATTERN OF VISITORS
A significant majority of 87.56% of all international visitors were mostly first-timers to Bhutan. Of those who had visit before, some 7.80% indicated that they had visited Bhutan on one previous occasion, followed by 1.75% who visited twice before. There were also 2.88% of them who repeatedly visited Bhutan for a holiday with three or more previous visits. Bhutan is constantly focusing on product diversification and opening new destinations to encourage repeat visitations and diversify visitor profiles. This finding shows that for majority of the visitors, Bhutan remains a “Once in a lifetime destination”.
Amongst the top markets, repeat visitation was mainly from Thailand, Netherlands, Japan, Germany and France.
*UDSK������3DWWHUQV�RI�5HSHDW�9LVLWDWLRQ
1HYHU�9LVWHG%HIRUH
2QH�SUHYLRXVYLVLW
7ZR�SUHYLRXVYLVLW
7KUHH�SUHYLRXVYLVLW
1HYHU�YLVLWHGEHIRUH
)LYH�SUHYLRXVYLVLW
0RUH�WKDQ¿YH�SUHYLRXV
YLVLW
�����
�������� ���� ���� ���� ����
���
��
��
��
��
�
3HUFHQW
1XPEHU�RI�3UHYLRXV�9LVLWV

%KXWDQ�7RXULVP�0RQLWRU��������$QQXDO�5HSRUW�����
������
7DEOH�����5HSHDW�9LVLWRUV�E\�0DMRU�0DUNHWV
0DMRU�6RXUFH�0DUNHWV
1HYHU�9LVLWHG�
%HIRUH����
2QH�3UHYLRXV�9LVLW����
7ZR�3UHYLRXV�9LVLWV����
7KUHH�3UHYLRXV�9LVLWV����
)RXU�3UHYLRXV�9LVLWV����
)LYH�3UHYLRXV�9LVLWV����
0RUH�WKDQ�)LYH�9LVLWV����
86$ ���� ��� ��� ��� ��� ��� ���-DSDQ ���� ��� ��� ��� ��� ��� ���*HUPDQ\ ���� ��� ��� ��� ��� ��� ���8. ���� ��� ��� ��� ��� ��� ���&KLQD ���� ��� ��� ��� ��� ��� ���)UDQFH ���� ��� ��� ��� ��� ��� ���$XVWUDOLD ���� ��� ��� ��� ��� ��� ���7KDLODQG ���� ���� ��� ��� ��� ��� ���,WDO\ ���� ��� ��� ��� ��� ��� ���1HWKHUODQGV ���� ���� ��� ��� ��� ��� ���6ZLW]HUODQG ���� ��� ��� ��� ��� ��� ���&DQDGD ���� ��� ��� ��� ��� ��� ���6LQJDSRUH ���� ��� ��� ��� ��� ��� ���2WKHU�(XURSH ���� ��� ��� ��� ��� ��� ���2WKHU�6RXWK�(DVW�$VLD ���� ���� ��� ��� ��� ��� ���6RXWK�$PHULFD ���� ��� ��� ��� ��� ��� ���$IULFD ����� ��� ��� ��� ��� ��� ���0LGGOH�HDVW ���� ��� ��� ��� ��� ��� ���2WKHUV ���� ��� ��� ��� ��� ��� ���
INTENTION TO RETURN TO BHUTAN
Respondents clearly expressed their opinions about a possible return to Bhutan. An encouraging number of respondents (80.35%) indicated that they would like to visit Bhutan again in the near future - an indicator of high satisfaction levels. The remaining 19.65% believed that they had experienced what Bhutan has to offer and therefore would not consider visiting again.
Table 2.3 illustrates the cross-tabulation of major markets and intention to return to Bhutan. These figures are particularly important for tour operators for country-wise marketing purposes.

������
%KXWDQ�7RXULVP�0RQLWRU��������$QQXDO�5HSRUW�����
������
*UDSK������,QWHQWLRQ�WR�5HWXUQ�WR�%KXWDQ
7DEOH�����,QWHQWLRQ�WR�5HWXUQ�WR�%KXWDQ�E\�1DWLRQDOLW\
0DMRU�6RXUFH�0DUNHWV <HV���� 1R����86$ ���� ����-DSDQ ���� ����*HUPDQ\ ���� ����8. ���� ����&KLQD ���� ����)UDQFH ���� ����$XVWUDOLD ���� ����7KDLODQG ���� ����,WDO\ ���� ����1HWKHUODQGV ���� ����6ZLW]HUODQG ���� ����&DQDGD ���� ����6LQJDSRUH ���� ����2WKHU�(XURSH ���� ����2WKHU�6RXWK�(DVW�$VLD ���� ���6RXWK�$PHULFD ���� ����$IULFD ���� ����PLGGOH�HDVW ���� ����RWKHU ���� ����
���
��
��
��
��
�<HV
�����
�����
1R
3HUFHQW
3RVVLELOLW\�RI�D�5HWXUQ�7ULS

%KXWDQ�7RXULVP�0RQLWRU��������$QQXDO�5HSRUW�����
������������
BHUTAN AND CIRCUIT TOURISM
Sampled visitors were asked to indicate whether Bhutan was their sole and primary destination during the trip, or whether it was part of a circuit of destinations they combined with. This question is asked in order to understand valuable information regarding possible future marketing partnerships and networks. Almost one third (32.20%) of the total respondents indicated that Bhutan was their only destination during the trip. This implies that many are willing to spend a lot more money on long-haul international flights to solely experience Bhutan. Others indicated that they combined their Bhutan trip mainly other destinations in the region namely Nepal (29.1%), India (23.90%), and Thailand (20.0%).
To a lesser extent, the increase in arrivals through the Nepal sector also had implications on other circuit destinations such as Tibet, with 5.6% of visitors combining Bhutan with it. Visitors also combined their Bhutan trip with Cambodia (2.80%), Laos (2.50%) and Bangladesh (2.40%).
Table 2.4 illustrates the preferences of major markets with circuit tourism. Half of all arrivals from the biggest market Japan visited Bhutan as a sole destination during the trip. Similarly, other top Asian markets such as Thailand and Singapore with 79.70% and 75.60% respectively also solely visited Bhutan during the trip. This is mainly owing to the availability of direct flights from these two countries. Some 37.90% of visitors from China and 36.10% of visitors from Australia also solely visited Bhutan on this trip.
An even number of visitors from the USA combined their travel itineraries with Nepal (37.40%), Thailand (29.20%) and India (27.2%). European markets such as Germany, UK, and the Netherlands preferred to combine their Bhutan trip predominantly with India or Nepal, or both. A majority (63.0%) of visitors from Italy combined with India. Similarly, more than half of Canadian visitors combined their Bhutan holiday with Nepal.
*UDSK������%KXWDQ�DQG�&LUFXLW�7RXULVP

������
%KXWDQ�7RXULVP�0RQLWRU��������$QQXDO�5HSRUW�����
������
7DEOH����&URVV�WDEXODWLRQ�RI�&LUFXLW�7RXULVP�E\�1DWLRQDOLW\
0DMRU�6RXUFH�0DUNHWV %KXWDQ�2QO\����
:LWK�,QGLD����
:LWK�7KDLODQG����
:LWK�1HSDO����
:LWK�&KLQD��7LEHW�����
86$ ���� ���� ���� ���� ���
-DSDQ ���� ���� ���� ��� ���
*HUPDQ\ ���� ���� ���� ���� ���
8. ���� ���� ���� ���� ���
&KLQD ���� ��� ���� ���� ���
)UDQFH ���� ���� ���� ���� ���
$XVWUDOLD ���� ���� ���� ���� ���
7KDLODQG ���� ��� ��� ��� ���
,WDO\ ���� ���� ��� ���� ���
1HWKHUODQGV ���� ���� ���� ���� ���
6ZLW]HUODQG ���� ���� ���� ���� ���
&DQDGD ���� ���� ���� ���� ����
6LQJDSRUH ���� ��� ���� ��� ���
2WKHU�(XURSH ���� ���� ���� ���� ����
2WKHU�6RXWK�(DVW�$VLD ���� ���� ���� ���� ���
6RXWK�$PHULFD ��� ���� ���� ���� ����
$IULFD ���� ���� ���� ���� ���
0LGGOH�(DVW ���� ��� ��� ���� ���
2WKHUV ���� ���� ���� ���� ���
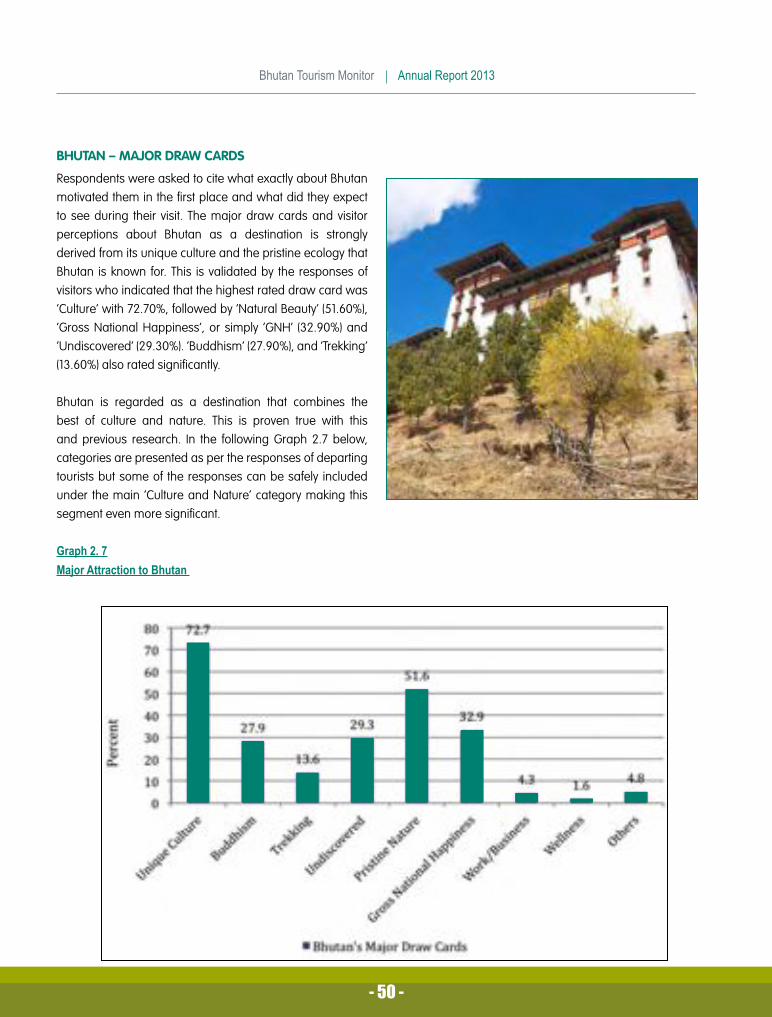
%KXWDQ�7RXULVP�0RQLWRU��������$QQXDO�5HSRUW�����
������
BHUTAN – MAJOR DRAW CARDS
Respondents were asked to cite what exactly about Bhutan motivated them in the first place and what did they expect to see during their visit. The major draw cards and visitor perceptions about Bhutan as a destination is strongly derived from its unique culture and the pristine ecology that Bhutan is known for. This is validated by the responses of visitors who indicated that the highest rated draw card was ‘Culture’ with 72.70%, followed by ‘Natural Beauty’ (51.60%), ‘Gross National Happiness’, or simply ‘GNH’ (32.90%) and ‘Undiscovered’ (29.30%). ‘Buddhism’ (27.90%), and ‘Trekking’ (13.60%) also rated significantly.
Bhutan is regarded as a destination that combines the best of culture and nature. This is proven true with this and previous research. In the following Graph 2.7 below, categories are presented as per the responses of departing tourists but some of the responses can be safely included under the main ‘Culture and Nature’ category making this segment even more significant.
*UDSK������0DMRU�$WWUDFWLRQ�WR�%KXWDQ�

������
%KXWDQ�7RXULVP�0RQLWRU��������$QQXDO�5HSRUW�����
������
KEYWORDS TO DESCRIBE BHUTAN
Respondents were asked to list two or three keywords to describe their Bhutan experience. From a wide range of responses, the most popular keywords were; ‘Friendly’ (70.20%), ‘Cultural’ (65.10%), ‘Pristine Nature’ (60.90%), ‘Beautiful’ (60.80%), ‘Religious/Spiritual’ (51.20%), and Happy (38.0%). Some other keywords used to describe Bhutan were “Unspoiled”; “Rapidly developing”; “Undiscovered”; “Road-less-travelled”; “Expensive” etc.
These impressions assist in determining some of the activities that the visitor really liked about his/her experience. Marketing and promotion campaigns could use such identifiers. For example, the highest rated keyword with respondents citing ‘Friendly’, supported by the keyword ‘Happy’ – illustrates the need to promote peoples interaction through farmhouse stays, village festivals, games etc. Similarly, people who indicated that Bhutan is abounded by ‘Pristine Nature’ indicate that many visitors are nature lovers and therefore would enjoy nature-based products. This is something to be capitalised upon in marketing activities and borne in mind when preparing itineraries and new products.
*UDSK������.H\ZRUGV�GHVFULELQJ�%KXWDQ

%KXWDQ�7RXULVP�0RQLWRU��������$QQXDO�5HSRUW�����
������
ATTRACTIONS VISITED/ACTIVITIES UNDERTAKEN
Respondents cited a diverse range of activities that they had undertaken during their trip, out of which the majority engaged in ‘general sightseeing’ activities and visiting ‘cultural heritages’ such as monasteries and Dzongs etc. Almost a quarter (23.20%) of the visitors witnessed at least a festival during their trip. The finding substantiates that Bhutan is mainly associated as a ‘Cultural’ destination.
Out of the total surveyed, some 35.30% took part in trekking or at least a minimum of a day’s hike during their trip. Nature-based activities such as ‘Flora/Fauna’ and ‘Bird Watching’ also rated significantly. An increase in Community-based tourism was noted in 2013 pertaining to the growing interest in Merak Sakteng trek, Nabji-Korphu trek and the recently opened Royal Manas trek, augmented by those who also stayed in farmhouses.
*UDSK������$WWUDFWLRQV�9LVLWHG�$FWLYLWLHV�8QGHUWDNHQ

������
%KXWDQ�7RXULVP�0RQLWRU��������$QQXDO�5HSRUW�����
������
VISITORS’ TIME OF VISIT
Visitors were asked to indicate how they chose the time of year to visit Bhutan. As proven by this finding and findings of earlier researches, Bhutan’s weather condition is a major factor, determining time of visit for 29.37% of the total respondents. The holiday timing of visitors in their country followed closely with 25.01% of the total respondents travelling during their holiday times. ‘Advice from Agents’ and ‘Timing of popular festivals’ (Tsechus) also determined the time of visit with 16.09% and 9.97% of the total respondents respectively. Some 8.47% indicated ‘Business/Work Schedule in Bhutan’, thereby suggesting a significant number of business and corporate travellers to Bhutan.
*UDSK�������9LVLWRUV�7LPH�RI�9LVLWDWLRQ

%KXWDQ�7RXULVP�0RQLWRU��������$QQXDO�5HSRUW�����
������
HOLIDAY TIME IN SOURCE MARKETS
Respondents were asked to indicate the holiday timing in their country. More than half of all arrivals sampled in 2013, cited the summer months of June, July and August as their holiday time and they would normally go for a vacation during these months. This is particularly interesting as Bhutan receives lesser visitation during these months mainly because of unfavourable weather conditions caused by the monsoon rains. Further research confirmed that families with children from the major markets of Europe and America, usually plan their holidays during school summer holidays. This finding suggests that if Bhutan adopts a policy to incentivise and promote family trips during summer, visitor arrivals during the summer months could be leveraged to a certain extent. Some 19.91% indicated that their holiday
times are between March-May, followed by 19.52% in September-November. For the remaining 9.38%, their holiday times are usually between December-February.
It is even more important to know the holiday time for the outbound major markets. Table 2.5 illustrates the prevailing trends in major source markets. Most of Bhutan’s major markets like Japan (59.60%), USA (59.30%), Germany (61.0%), UK (66.50%), France (62.60%), Italy (63.50%), Netherlands (69.50%), and Switzerland (75.80%) markets travel during summer. Thai holidaymakers mostly travel between March-May coinciding with the Songkran holiday week, whereas Australia’s holiday timing is from December-February as suggested by 38.90% of the respondents. China’s holiday timing is spread across the year.
*UDSK�������+ROLGD\�7LPH�LQ�6RXUFH�0DUNHWV
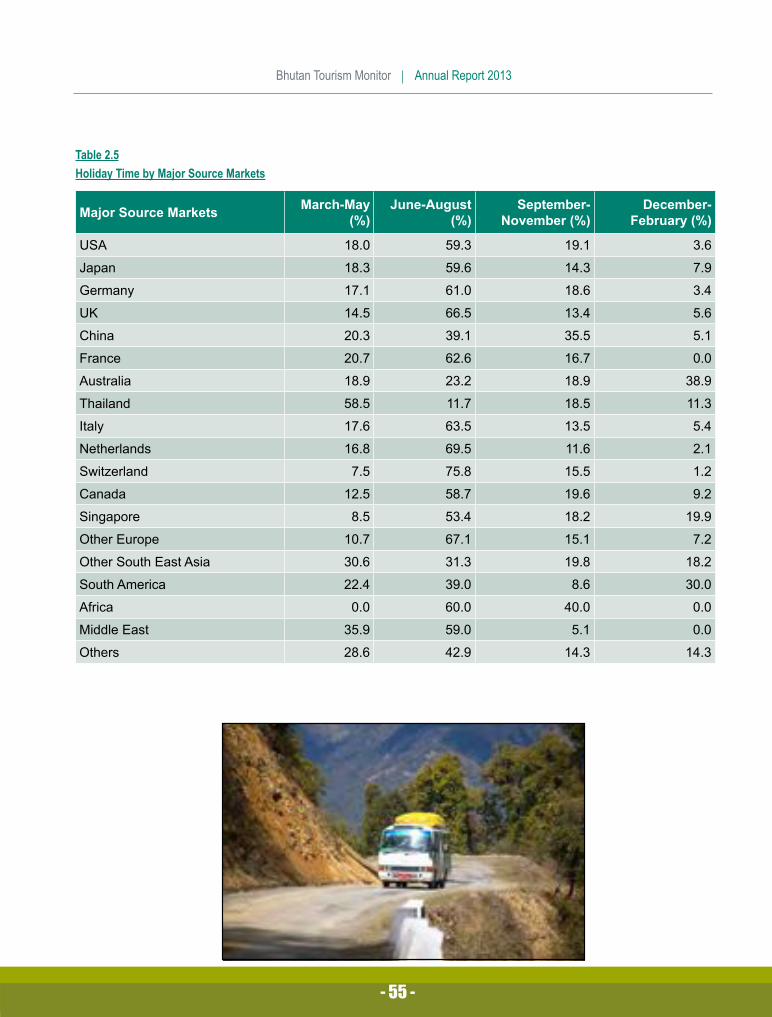
������
%KXWDQ�7RXULVP�0RQLWRU��������$QQXDO�5HSRUW�����
������
7DEOH����+ROLGD\�7LPH�E\�0DMRU�6RXUFH�0DUNHWV
0DMRU�6RXUFH�0DUNHWV 0DUFK�0D\����
-XQH�$XJXVW����
6HSWHPEHU�1RYHPEHU����
'HFHPEHU�)HEUXDU\����
86$ ���� ���� ���� ���
-DSDQ ���� ���� ���� ���
*HUPDQ\ ���� ���� ���� ���
8. ���� ���� ���� ���
&KLQD ���� ���� ���� ���
)UDQFH ���� ���� ���� ���
$XVWUDOLD ���� ���� ���� ����
7KDLODQG ���� ���� ���� ����
,WDO\ ���� ���� ���� ���
1HWKHUODQGV ���� ���� ���� ���
6ZLW]HUODQG ��� ���� ���� ���
&DQDGD ���� ���� ���� ���
6LQJDSRUH ��� ���� ���� ����
2WKHU�(XURSH ���� ���� ���� ���
2WKHU�6RXWK�(DVW�$VLD ���� ���� ���� ����
6RXWK�$PHULFD ���� ���� ��� ����
$IULFD ��� ���� ���� ���
0LGGOH�(DVW ���� ���� ��� ���
2WKHUV ���� ���� ���� ����

%KXWDQ�7RXULVP�0RQLWRU��������$QQXDO�5HSRUW�����
������
INDIVIDUAL AVERAGE SPENDING ON A BHUTAN HOLIDAY
Without including air travel and spending outside Bhutan, visitors were asked to indicate the approximate amount of money spent in Bhutan during the trip. Whilst the responses were highly varied depending on their preferences, a slight majority (25.77%) indicated that they spent between ‘USD 3,001 – 5,000’, closely followed by 23.84% who spent between ‘USD 5,001-10,000’. Another 18.48% and 17.37% spent between ‘USD 1,001-2,000’ and ‘USD 2,001 – 3,000’ respectively. Some 3.48% of the total respondents spent more than USD 10,000 per visitor during their trip to Bhutan.
The average spending per visitor that included the package price and out-of-pocket spending was USD 3917.32.
*UDSK�������(QWLUH�6SHQGLQJ��,QFOXGLQJ�2XW�RI�SRFNHW�VSHQGLQJ��H[FOXGLQJ�DLUIDUH�

������
%KXWDQ�7RXULVP�0RQLWRU��������$QQXDO�5HSRUW�����
������
OUT-OF-POCKET SPENDING
The daily tariff that visitors pay to come to Bhutan is an all-inclusive package rate that includes ‘Royalty’ – which goes as government revenue, full board, transport, guiding services etc. This however does not include airfare for flights in and out of Bhutan. Besides the airfare and the daily tariff (package price), respondents were asked if they had spent any extra money on any additional goods and services while they were in Bhutan.
Out of the total respondents, out-of-pocket spending was made by 58.60%, spent on various additional services that were not included in the package price. This means that the remaining 41.40% did not spend at all besides the daily tourism tariffs.
The average (Mean) out-of-pocket spending was recorded at USD 1080.75, Median was USD 335, and Mode was USD 200.
The total Out-of-pocket spending was further analysed by asking visitors to specify spending by categories of goods and services.
Out of the total, some 12.65% indicated that they spent extra money on accommodation by upgrading from a standard 3-Star to more luxurious 4 and 5 Star properties. Average out-of-pocket spending for this category amounted to USD 1060.66.
Out of the total respondents only 47.30% indicated that they spend extra money on shopping in Bhutan. A significant
number of visitors indicated that shopping for souvenirs and handcrafts goods was generally expensive in Bhutan. Average spending on shopping was recorded USD 773.76.
Tipping and offerings to temples etc. were made by 46.30% of the total respondents. Average out-of-pocket spending by visitors for rewarding their service providers with tips for guides, drivers, hotel personnel etc. amounted to USD 191.93.
The next category of out-of-pocket spending by visitors was ‘Food and Beverages’. Some 39.80% of the total respondents spend extra money on food and beverages amounting to an average of USD 162.70.
This was followed by 20.10% who spent extra cash on buying stamps, postcards and sometimes even shipping parcels (souvenirs, handicrafts, personal trekking gear etc.) using local postal services in Bhutan. Average spending for this category was USD 25.50.
Some 11.80% participated in wellness activities such as meditation, Yoga, retreats, spa and other wellbeing activities. This suggests that Bhutan is gradually improving in Wellness ratings as more visitors come to experience these activities. Average spending for Spa and Wellness activities was USD 81.0.
Average spending on entertainment activities was USD 79.60 and visitors spent an average of USD 10.70 on Internet and Telephone services.
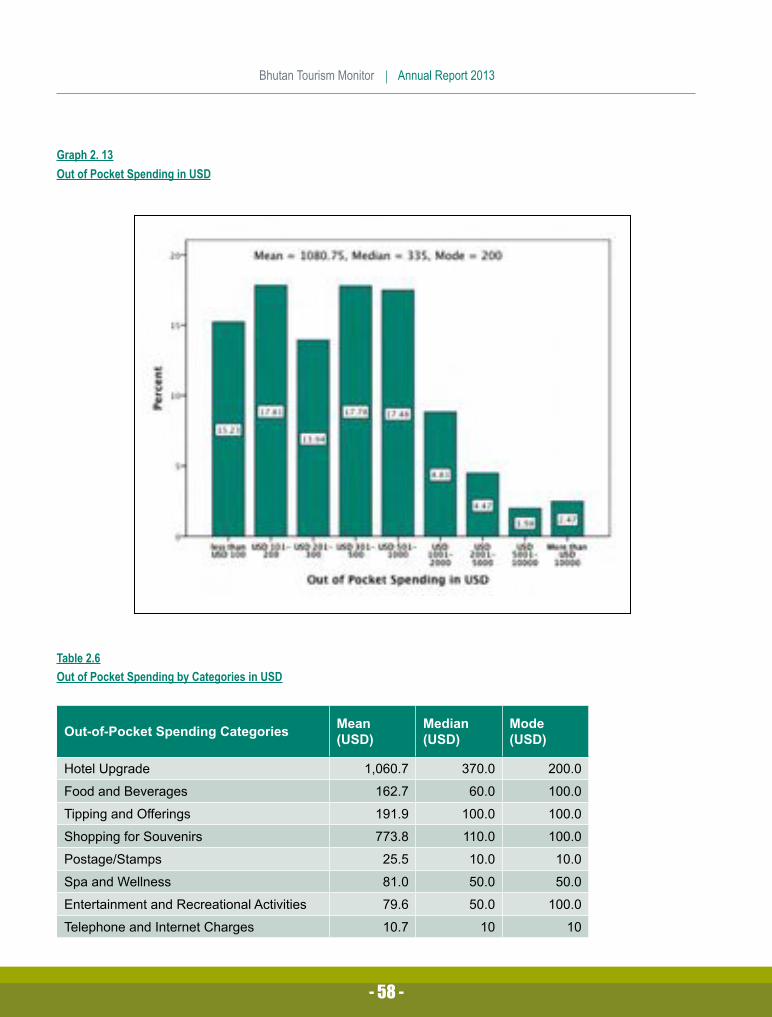
%KXWDQ�7RXULVP�0RQLWRU��������$QQXDO�5HSRUW�����
������
*UDSK�������2XW�RI�3RFNHW�6SHQGLQJ�LQ�86'
7DEOH����2XW�RI�3RFNHW�6SHQGLQJ�E\�&DWHJRULHV�LQ�86'
2XW�RI�3RFNHW�6SHQGLQJ�&DWHJRULHV 0HDQ��86'�
0HGLDQ��86'�
0RGH��86'�
+RWHO�8SJUDGH ������� ����� �����
)RRG�DQG�%HYHUDJHV ����� ���� �����
7LSSLQJ�DQG�2IIHULQJV ����� ����� �����
6KRSSLQJ�IRU�6RXYHQLUV ����� ����� �����
3RVWDJH�6WDPSV ���� ���� ����
6SD�DQG�:HOOQHVV ���� ���� ����
(QWHUWDLQPHQW�DQG�5HFUHDWLRQDO�$FWLYLWLHV ���� ���� �����
7HOHSKRQH�DQG�,QWHUQHW�&KDUJHV ���� �� ��
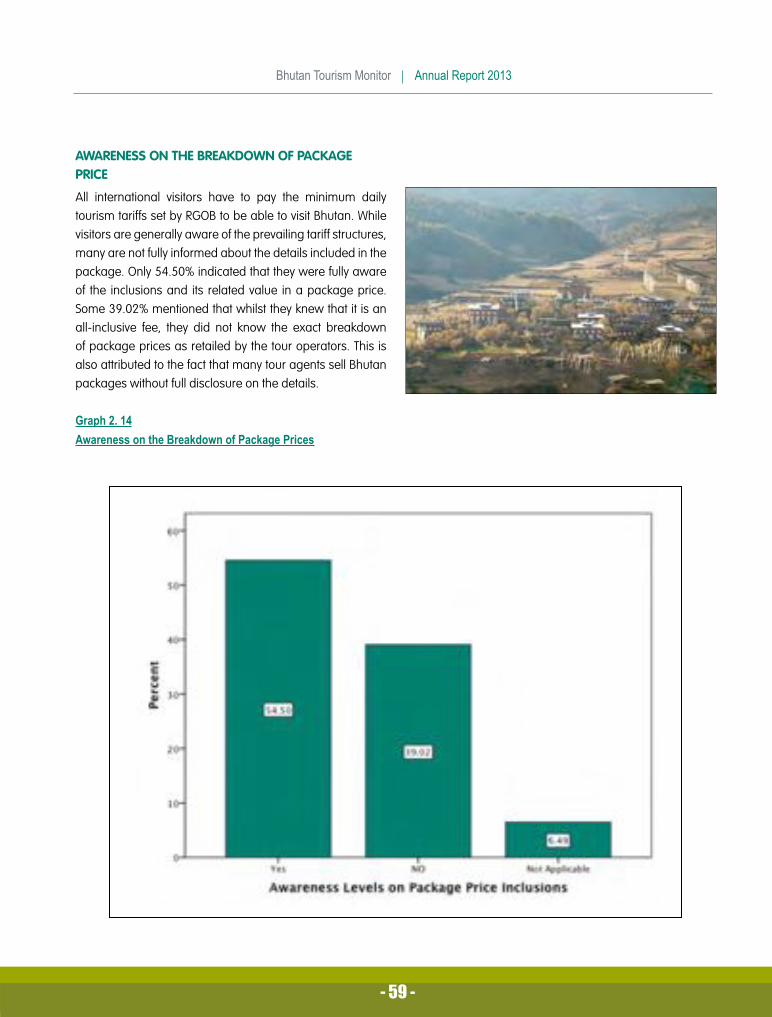
������
%KXWDQ�7RXULVP�0RQLWRU��������$QQXDO�5HSRUW�����
������
AWARENESS ON THE BREAKDOWN OF PACKAGE PRICE
All international visitors have to pay the minimum daily tourism tariffs set by RGOB to be able to visit Bhutan. While visitors are generally aware of the prevailing tariff structures, many are not fully informed about the details included in the package. Only 54.50% indicated that they were fully aware of the inclusions and its related value in a package price. Some 39.02% mentioned that whilst they knew that it is an all-inclusive fee, they did not know the exact breakdown of package prices as retailed by the tour operators. This is also attributed to the fact that many tour agents sell Bhutan packages without full disclosure on the details.
*UDSK�������$ZDUHQHVV�RQ�WKH�%UHDNGRZQ�RI�3DFNDJH�3ULFHV

%KXWDQ�7RXULVP�0RQLWRU��������$QQXDO�5HSRUW�����
������
PRIOR INFORMATION ON HOTELS
In keeping with the regulation that requires tour operators to host international visitors in a minimum of 3-Star hotel category as accredited by the Star Classification System, visitors were asked on the levels of awareness on the choice of hotels prior to their arrival in Bhutan.
Some 66.42% of the total visitors acknowledged their awareness on the minimum entitlement of a 3-Star category hotel included in the package price. Another 28.72% did not have any prior information on the standards of hotels they were booked in by their local tour operators.
*UDSK�������3ULRU�,QIRUPDWLRQ�RQ�+RWHO�6WDQGDUGV

������
%KXWDQ�7RXULVP�0RQLWRU��������$QQXDO�5HSRUW�����
������
VISITORS SATISFACTION LEVELS
Visitors were asked to rate their satisfaction levels with various aspects of their holiday in Bhutan. Taking into account only those who rated ‘Good’ and ‘Excellent’, the Tourist Satisfaction Index for 2013 was at 74.23%.
Accommodation plays an important role in enhancing visitor experiences while visiting a destination. This also includes the quality of services provided by the staff and facilities included in a hotel. The Tourism Council of Bhutan makes it mandatory for tour operators to keep their guests in accredited properties. Out of the total sampled in 2013, a majority of 73.13% (24.26% rated ‘Excellent’ and 48.87% rated ‘Good’) were satisfied with the quality and services of their accommodation. Some 21.62% said that the quality of hotels was ‘Average’ and some 4.46% indicated ‘Poor’.
In 2013, some 60.52% cited their satisfaction with the quality and diversity of food and restaurants in Bhutan. The remaining 39.48% stated it was either ‘average’ or ‘poor’ in quality and diversity. Some specifically mentioned the buffets in hotels and restaurants were repetitive and monotonous with limited choices on the menu. The finding illustrates the
*UDSK�������7RXULVW�6DWLVIDFWLRQ�,QGH[
need to improve quality of chefs and food businesses to respond to the standards preferred by international visitors.
Visitors were asked to review the quality of transport facilities, including the quality and comfort levels of the car and the conduct of the driver representing their local tour companies. A majority (76.02%) of the respondents indicated that the transportation facilities were highly satisfactory. The remaining indicated that improvements were necessary in the transport sector, especially pertaining to bad roads. A very few of them mentioned that tour operators had provided old uncomfortable cars for their trip.
When tourists are in Bhutan, local tour guides act as ambassadors of the country by showcasing Bhutan according to their competency levels. Overall satisfaction levels of visitors hugely depend on the personal character and conduct of the guides. Findings illustrate that visitors were generally pleased with the quality and the services of local tour guides with 89.47% indicating that the guides were highly professional and knowledgeable. Tour guides are constantly rated well and illustrates the high standards of service delivery and professionalism.
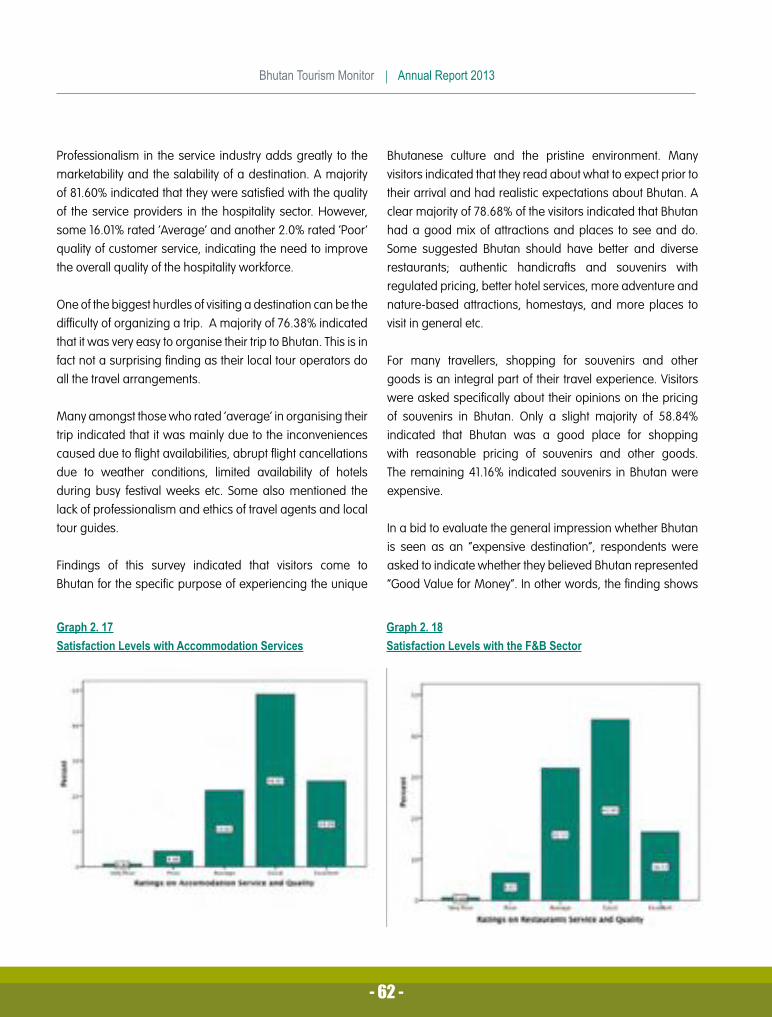
%KXWDQ�7RXULVP�0RQLWRU��������$QQXDO�5HSRUW�����
������
Professionalism in the service industry adds greatly to the marketability and the salability of a destination. A majority of 81.60% indicated that they were satisfied with the quality of the service providers in the hospitality sector. However, some 16.01% rated ‘Average’ and another 2.0% rated ‘Poor’ quality of customer service, indicating the need to improve the overall quality of the hospitality workforce.
One of the biggest hurdles of visiting a destination can be the difficulty of organizing a trip. A majority of 76.38% indicated that it was very easy to organise their trip to Bhutan. This is in fact not a surprising finding as their local tour operators do all the travel arrangements.
Many amongst those who rated ‘average’ in organising their trip indicated that it was mainly due to the inconveniences caused due to flight availabilities, abrupt flight cancellations due to weather conditions, limited availability of hotels during busy festival weeks etc. Some also mentioned the lack of professionalism and ethics of travel agents and local tour guides.
Findings of this survey indicated that visitors come to Bhutan for the specific purpose of experiencing the unique
Bhutanese culture and the pristine environment. Many visitors indicated that they read about what to expect prior to their arrival and had realistic expectations about Bhutan. A clear majority of 78.68% of the visitors indicated that Bhutan had a good mix of attractions and places to see and do. Some suggested Bhutan should have better and diverse restaurants; authentic handicrafts and souvenirs with regulated pricing, better hotel services, more adventure and nature-based attractions, homestays, and more places to visit in general etc.
For many travellers, shopping for souvenirs and other goods is an integral part of their travel experience. Visitors were asked specifically about their opinions on the pricing of souvenirs in Bhutan. Only a slight majority of 58.84% indicated that Bhutan was a good place for shopping with reasonable pricing of souvenirs and other goods. The remaining 41.16% indicated souvenirs in Bhutan were expensive.
In a bid to evaluate the general impression whether Bhutan is seen as an “expensive destination”, respondents were asked to indicate whether they believed Bhutan represented “Good Value for Money”. In other words, the finding shows
*UDSK�������6DWLVIDFWLRQ�/HYHOV�ZLWK�$FFRPPRGDWLRQ�6HUYLFHV
*UDSK�������6DWLVIDFWLRQ�/HYHOV�ZLWK�WKH�)%�6HFWRU

������
%KXWDQ�7RXULVP�0RQLWRU��������$QQXDO�5HSRUW�����
������
*UDSK�������6DWLVIDFWLRQ�/HYHOV�ZLWK�'LYHUVLW\�RI�$WWUDFWLRQV
*UDSK�������6DWLVIDFWLRQ�/HYHOV�ZLWK�3ULFLQJ�RI�6RXYHQLUV�
*UDSK�������6DWLVIDFWLRQ�/HYHOV�ZLWK�4XDOLW\�RI�7RXU�JXLGHV
*UDSK�������6DWLVIDFWLRQ�/HYHOV�ZLWK�(DVH�RI�2UJDQLVLQJ�7ULS
*UDSK�������6DWLVIDFWLRQ�/HYHOV�ZLWK�7UDQVSRUWDWLRQ�6HFWRU
*UDSK�������6DWLVIDFWLRQ�/HYHOV�ZLWK�&XVWRPHU�6HUYLFHV
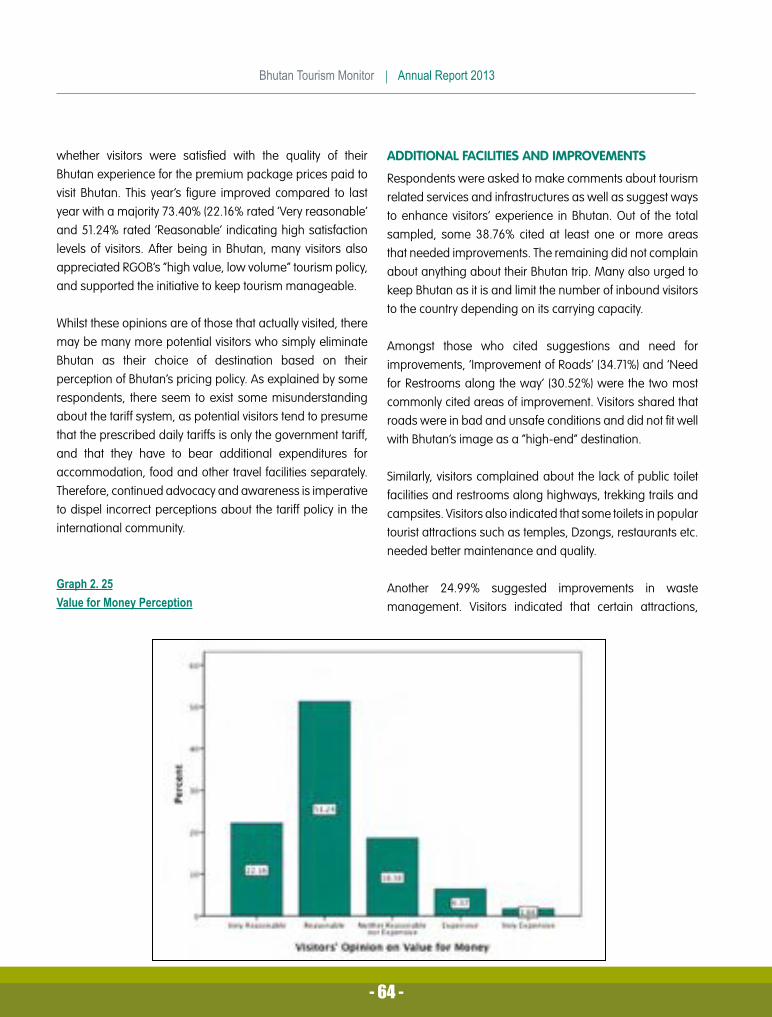
%KXWDQ�7RXULVP�0RQLWRU��������$QQXDO�5HSRUW�����
������
whether visitors were satisfied with the quality of their Bhutan experience for the premium package prices paid to visit Bhutan. This year’s figure improved compared to last year with a majority 73.40% (22.16% rated ‘Very reasonable’ and 51.24% rated ‘Reasonable’ indicating high satisfaction levels of visitors. After being in Bhutan, many visitors also appreciated RGOB’s “high value, low volume” tourism policy, and supported the initiative to keep tourism manageable.
Whilst these opinions are of those that actually visited, there may be many more potential visitors who simply eliminate Bhutan as their choice of destination based on their perception of Bhutan’s pricing policy. As explained by some respondents, there seem to exist some misunderstanding about the tariff system, as potential visitors tend to presume that the prescribed daily tariffs is only the government tariff, and that they have to bear additional expenditures for accommodation, food and other travel facilities separately. Therefore, continued advocacy and awareness is imperative to dispel incorrect perceptions about the tariff policy in the international community.
*UDSK�������9DOXH�IRU�0RQH\�3HUFHSWLRQ
ADDITIONAL FACILITIES AND IMPROVEMENTS
Respondents were asked to make comments about tourism related services and infrastructures as well as suggest ways to enhance visitors’ experience in Bhutan. Out of the total sampled, some 38.76% cited at least one or more areas that needed improvements. The remaining did not complain about anything about their Bhutan trip. Many also urged to keep Bhutan as it is and limit the number of inbound visitors to the country depending on its carrying capacity.
Amongst those who cited suggestions and need for improvements, ‘Improvement of Roads’ (34.71%) and ‘Need for Restrooms along the way’ (30.52%) were the two most commonly cited areas of improvement. Visitors shared that roads were in bad and unsafe conditions and did not fit well with Bhutan’s image as a “high-end” destination.
Similarly, visitors complained about the lack of public toilet facilities and restrooms along highways, trekking trails and campsites. Visitors also indicated that some toilets in popular tourist attractions such as temples, Dzongs, restaurants etc. needed better maintenance and quality.
Another 24.99% suggested improvements in waste management. Visitors indicated that certain attractions,

������
%KXWDQ�7RXULVP�0RQLWRU��������$QQXDO�5HSRUW�����
������
pedestrian walkways in major towns, rivers and trekking trails, were littered with trash and required proper waste management. Visitors were concerned that if left unattended, it could undermine Bhutan’s image as a “an environmental-friendly” destination. This finding infers a need for a better waste management system with regular clean-up campaigns and strict compliance to regulations.
Food related complaints rated highly this year with 19.32% expressing dissatisfaction with the quality and diversity of food. A significant number of visitors indicated that buffet servings in hotels and restaurants were repetitive and limited.
This was followed by hotel related complaints with 16.73% of the total respondents indicating one or more aspects of hotels required improvements.
Some 8.62% of those who made a suggestion indicated that more parts of Bhutan should be promoted for tourism, followed by 8.12% of those who indicated that the number of stray dogs in major towns were a nuisance at night and affected sleep quality.
*UDSK�������6XJJHVWLRQV�IRU�,PSURYHPHQW

%KXWDQ�7RXULVP�0RQLWRU��������$QQXDO�5HSRUW�����
������

������
%KXWDQ�7RXULVP�0RQLWRU��������$QQXDO�5HSRUW�����
������
6HFWLRQ���²�([LW�6XUYH\V�IRU�5HJLRQDO�9LVLWRUVVisitors from India, Bangladesh and Maldives have different visa requirements as opposed to the international segment. These three countries in the region share an open border policy with Bhutan and travellers are not required pay the minimum tourism tariff paid by international visitors. India is the biggest source market for Bhutan’s tourism industry and therefore a more detailed study was carried out for the regional market this year. All results in Section 3 are findings from data collected using an administered (i.e. interviewer conducted) exit survey methodology, in which a total of 2,704 regional tourists were interviewed for their first-hand feedback on their Bhutan experience.
GENERAL PROFILE OF REGIONAL VISITORS
India dominated the number of regional visitors to Bhutan with 85.27%, followed by Bangladesh with 14.02%. Maldives only comprised of 0.71% of the total regional arrivals. Visitors were predominantly male (60.13%). Ages of regional visitors were spread across all segments with majority of them between ‘26 – 55 years’. One third (33.30%) of the total arrivals were less than 35 years old, thereby indicating a significant number of younger travellers. Some 16.17% of the total sampled were more than 60 years. Like international visitors, regional visitors are also highly educated with 88.78% of them having at least a Bachelor’s Degree.
*UDSK������²�&RXQWU\�RI�5HVSRQGHQWV *UDSK��������$JH�RI�5HVSRQGHQWV
*UDSK��������*HQGHU�RI�5HVSRQGHQWV *UDSK��������5HVSRQGHQWV·�/HYHO�RI�(GXFDWLRQ

%KXWDQ�7RXULVP�0RQLWRU��������$QQXDO�5HSRUW�����
������
PURPOSE OF VISIT
Regional visitors came to Bhutan mainly for a vacation with 65.80% indicating leisure and holiday as the main reason for their visit to Bhutan. This was followed by the 8.89% who indicated that they were on a ‘Private Business Trip’ and another 8.67% were of the ‘Meetings, Incentives, Conferences and Exhibitions (MICE) category. Some 3.46% were visiting friends and relatives, closely followed by another 3.05% visiting Bhutan as a ‘Corporate guest’, on invitation by one of the corporate organisations. From the total sampled, 4.35% were expatriate workers from the region who were based in Bhutan.
*UDSK�������3XUSRVH�RI�9LVLW

������
%KXWDQ�7RXULVP�0RQLWRU��������$QQXDO�5HSRUW�����
������
TYPE OF TRAVEL
Unlike international visitors, regional visitors do not have to compulsorily take a packaged tour with a local tour operator. Contrary to earlier findings, in 2013 there was a significant increase in visitors constituting 58.76%, who were travelling as part of a packaged tour organised by a travel operator. The increase is attributed to the increasing number of notable tour operators in India who are marketing Bhutan to the high-end Indian holidaymakers. Tour operators in India mentioned that packaged tours are becoming more favourable as they partner with local hotels in Bhutan who offer good discounts during leaner months, and as a result translate into more sales. The remaining 41.24% were Free Independent Travellers (FITs) travelling on their own.
The findings illustrated that not all packaged tours are of the high-end type. Whilst there are a number of big travel agencies in India targeting the rich long-haul outbound Indians and Non-Residential Indians (NRI) to visit Bhutan, many small tour operators across the border in neighbouring states of India and Bangladesh sell reasonably cheap packages targeting also the budget-conscious segment.
*UDSK��������7\SH�RI�7UDYHO

%KXWDQ�7RXULVP�0RQLWRU��������$QQXDO�5HSRUW�����
������
TRAVEL PARTY COMPOSITION
Whilst the composition of the visitors’ travel party was distributed across all categories, the dominant segment remained to be those travelling as a ‘Family Group’ with 30.11%, followed closely by 24.68% travelling as a ‘Group of Friends’. These two segments indicate that regional visitors prefer small-personalised tours than a big organised tour group. A significant 18.01% were travelling alone and a cross-tabulation between ‘Travel Party Composition’ and “Purpose of Visit’ shows that majority of the solo travellers were on ‘Private Business Trips’. ‘Tour Groups’ accounted for 10.25% of the total visitors. Tour operators in India and Bangladesh also indicated that universities and colleges are showing increasing interest levels in organising student trips to Bhutan. Contrary to the international segment, the regional visitors travelled less as a ‘Couple’ with only 13.79% of the sampled.
*UDSK��������7UDYHO�3DUW\�&RPSRVLWLRQ
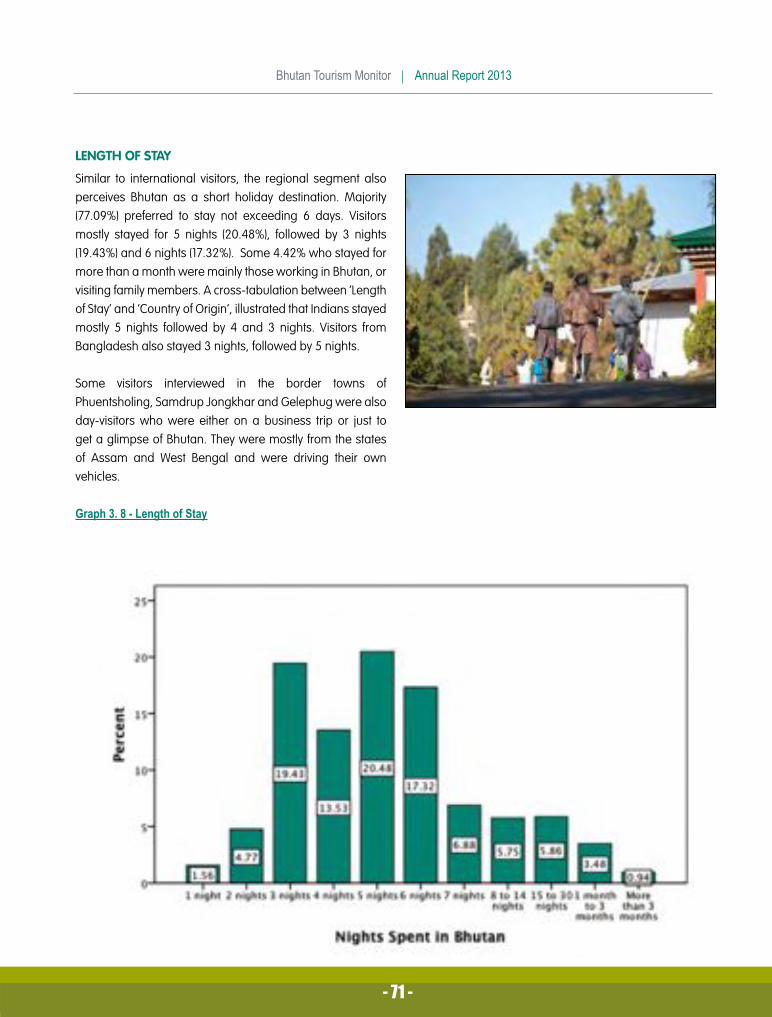
������
%KXWDQ�7RXULVP�0RQLWRU��������$QQXDO�5HSRUW�����
������
LENGTH OF STAY
Similar to international visitors, the regional segment also perceives Bhutan as a short holiday destination. Majority (77.09%) preferred to stay not exceeding 6 days. Visitors mostly stayed for 5 nights (20.48%), followed by 3 nights (19.43%) and 6 nights (17.32%). Some 4.42% who stayed for more than a month were mainly those working in Bhutan, or visiting family members. A cross-tabulation between ‘Length of Stay’ and ‘Country of Origin’, illustrated that Indians stayed mostly 5 nights followed by 4 and 3 nights. Visitors from Bangladesh also stayed 3 nights, followed by 5 nights.
Some visitors interviewed in the border towns of Phuentsholing, Samdrup Jongkhar and Gelephug were also day-visitors who were either on a business trip or just to get a glimpse of Bhutan. They were mostly from the states of Assam and West Bengal and were driving their own vehicles.
*UDSK��������/HQJWK�RI�6WD\
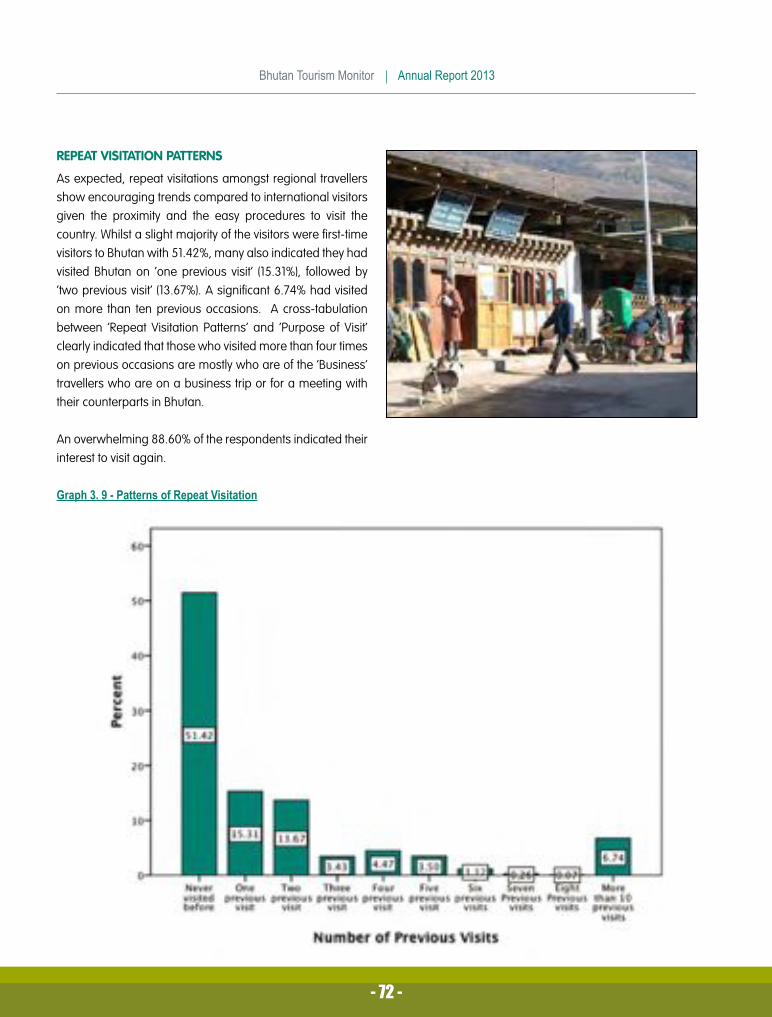
%KXWDQ�7RXULVP�0RQLWRU��������$QQXDO�5HSRUW�����
������
REPEAT VISITATION PATTERNS
As expected, repeat visitations amongst regional travellers show encouraging trends compared to international visitors given the proximity and the easy procedures to visit the country. Whilst a slight majority of the visitors were first-time visitors to Bhutan with 51.42%, many also indicated they had visited Bhutan on ‘one previous visit’ (15.31%), followed by ‘two previous visit’ (13.67%). A significant 6.74% had visited on more than ten previous occasions. A cross-tabulation between ‘Repeat Visitation Patterns’ and ‘Purpose of Visit’ clearly indicated that those who visited more than four times on previous occasions are mostly who are of the ‘Business’ travellers who are on a business trip or for a meeting with their counterparts in Bhutan.
An overwhelming 88.60% of the respondents indicated their interest to visit again.
*UDSK��������3DWWHUQV�RI�5HSHDW�9LVLWDWLRQ
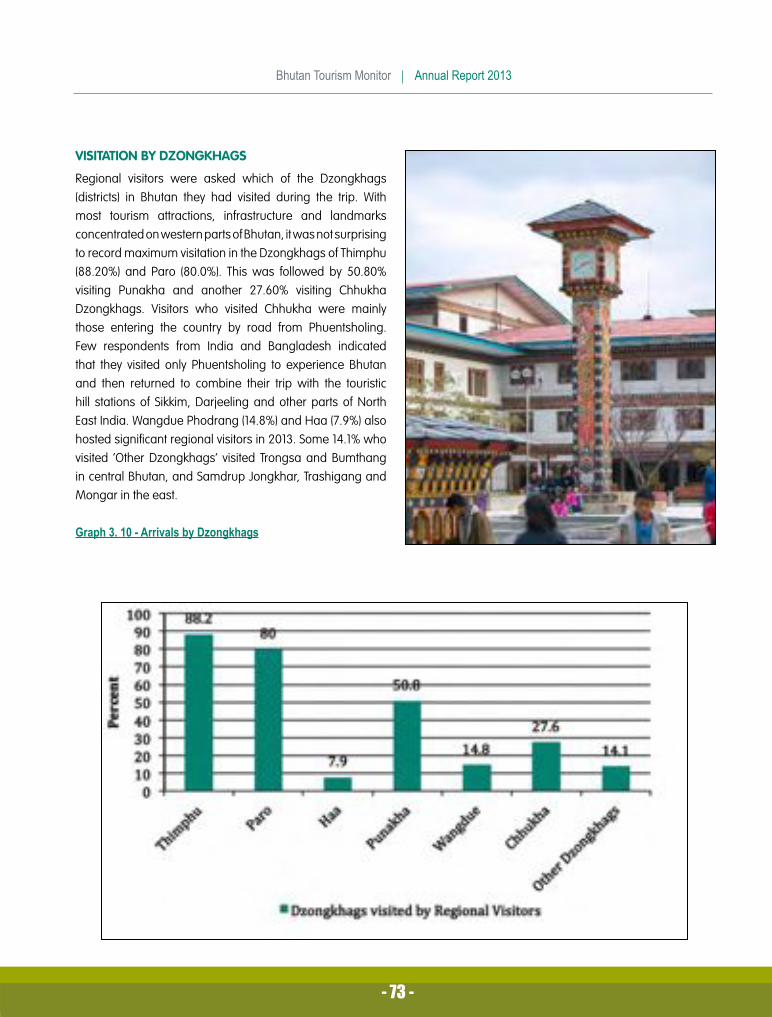
������
%KXWDQ�7RXULVP�0RQLWRU��������$QQXDO�5HSRUW�����
������
VISITATION BY DZONGKHAGS
Regional visitors were asked which of the Dzongkhags (districts) in Bhutan they had visited during the trip. With most tourism attractions, infrastructure and landmarks concentrated on western parts of Bhutan, it was not surprising to record maximum visitation in the Dzongkhags of Thimphu (88.20%) and Paro (80.0%). This was followed by 50.80% visiting Punakha and another 27.60% visiting Chhukha Dzongkhags. Visitors who visited Chhukha were mainly those entering the country by road from Phuentsholing. Few respondents from India and Bangladesh indicated that they visited only Phuentsholing to experience Bhutan and then returned to combine their trip with the touristic hill stations of Sikkim, Darjeeling and other parts of North East India. Wangdue Phodrang (14.8%) and Haa (7.9%) also hosted significant regional visitors in 2013. Some 14.1% who visited ‘Other Dzongkhags’ visited Trongsa and Bumthang in central Bhutan, and Samdrup Jongkhar, Trashigang and Mongar in the east.
*UDSK���������$UULYDOV�E\�']RQJNKDJV

%KXWDQ�7RXULVP�0RQLWRU��������$QQXDO�5HSRUW�����
������
MAJOR DRAW CARDS TO BHUTAN (IMAGE OF BHUTAN PRIOR TO VISIT)
Respondents were asked to cite what inspired them to visit Bhutan and what did they expect to see during their visit. Regional visitors associate Bhutan as a country with rich culture and nature, characterized by temperate weather and mountainous terrain. This is validated by the responses of visitors who indicated that their sole motivation was the ‘Pristine Nature’ with 68.30%, followed by ‘Unique Culture’ with 61.10%. Similarly, other draw cards cited were ‘Work/Business’ (31.30%), ‘Temples and Monasteries’ (31.20%), ‘Gross National Happiness’ (30.70%), ‘Buddhism’ (21.40%) etc. Contrary to international visitors, festivals were not a strong motivation for regional visitors to visit Bhutan. In the others’ category, many regional visitors also perceived Bhutan to have ‘favourable weather conditions’, making it ideal to escape the heat wave that hits the Indian sub-continent around May-June.
This finding substantiates that Bhutan is regarded as a destination that combines the best of culture and nature. In Graph 3.11, categories are presented as per the responses of departing tourists but many responses can be safely included under the main ‘Culture and Nature’ category making this segment even more significant.
*UDSK���������0DMRU�'UDZ�&DUGV�IRU�%KXWDQ

������
%KXWDQ�7RXULVP�0RQLWRU��������$QQXDO�5HSRUW�����
������
TYPE OF ACTIVITIES UNDERTAKEN IN BHUTAN
Some 72.90% of all respondents took part in general sightseeing, followed by 62.70% of all respondents visiting temples and monasteries. This further validates that the regional visitors perceive Bhutan as a ‘cultural’ destination. ‘Shopping’ was a major activity with 49.60%, and 29.50% of the sampled ‘visited museums’. ‘Trekking and Hiking’ rated highly and accounted for 25.2% of the total respondents undertaking at least a trek or a day’s hike while in Bhutan.
A significant 22.90% of the total respondents attended a business meeting, and another 4.20% participated in a MICE event, further justifying a high incidence of business travellers.
Unlike a high number of international visitors who visit Bhutan to attend a festival, regional visitors who attended a festival/Tsechu constituted only 7.0%.
*UDSK���������$FWLYLWLHV�8QGHUWDNHQ�GXULQJ�WKH�7ULS

%KXWDQ�7RXULVP�0RQLWRU��������$QQXDO�5HSRUW�����
������
KEYWORDS TO DESCRIBE BHUTAN
Respondents were asked to list two or three keywords to describe Bhutan and their impressions from the trip. From a wide range of responses, the most popular keywords were; “Beautiful” (73.20%), “Pristine Nature” (65.9%), “Friendly” (53.5%), “Cultural” (48.4%), “Happy” (40.40%) and “Spiritual” (39.3%). Some other keywords were “Mountainous Terrain”, “Relaxing”, “Good Weather”, “Unspoiled”, “Pure”, “Remote”, “Expensive”, “Peaceful” etc.
These keywords suggest that regional visitors appreciate the natural and the cultural aspects of Bhutan more than anything else.
*UDSK���������.H\ZRUGV�GHVFULELQJ�%KXWDQ

������
%KXWDQ�7RXULVP�0RQLWRU��������$QQXDO�5HSRUW�����
������
ENTRY AND EXIT SECTORS
Airlines in Bhutan fly to limited destinations in the region and therefore limit accessibility for many visitors who reside in other metropolitan cities of India. Whilst many Indian tourists from the neighbouring states of Assam, West Bengal and Bihar often use the southern gateway of Phuentsholing (6.10%), and to a certain extent Samdrup Jongkhar and Gelephug road entry points, many business and leisure visitors originating from India use the air mode to enter through main through Delhi (35.8%) and Kolkata (27.30%). Other entry ports such as Kathmandu (3.5%%), Bagdogra (2.70%), Mumbai (2.70%) and Guwahati (2.4%) have limited tourist traffic. Regional visitors seldom use the Bodh Gaya sector.
Even though Mumbai was not operational in 2013, tour operators in India had chartered a few flights from Mumbai to cater to high-end regional visitors originating from the Indian metropolitan.
Except for those visitors who had to combine their visit to
India, almost all visitors from Bangladesh entered and exited the country through Dhaka constituting 11.0% of the total regional visitors using this port. Traffic from Kolkata is expected to cater to an increasing number of visitors to Bhutan with the newly opened private airline - Bhutan Airlines.
*UDSK���������(QWU\�DQG�([LW�6HFWRUV
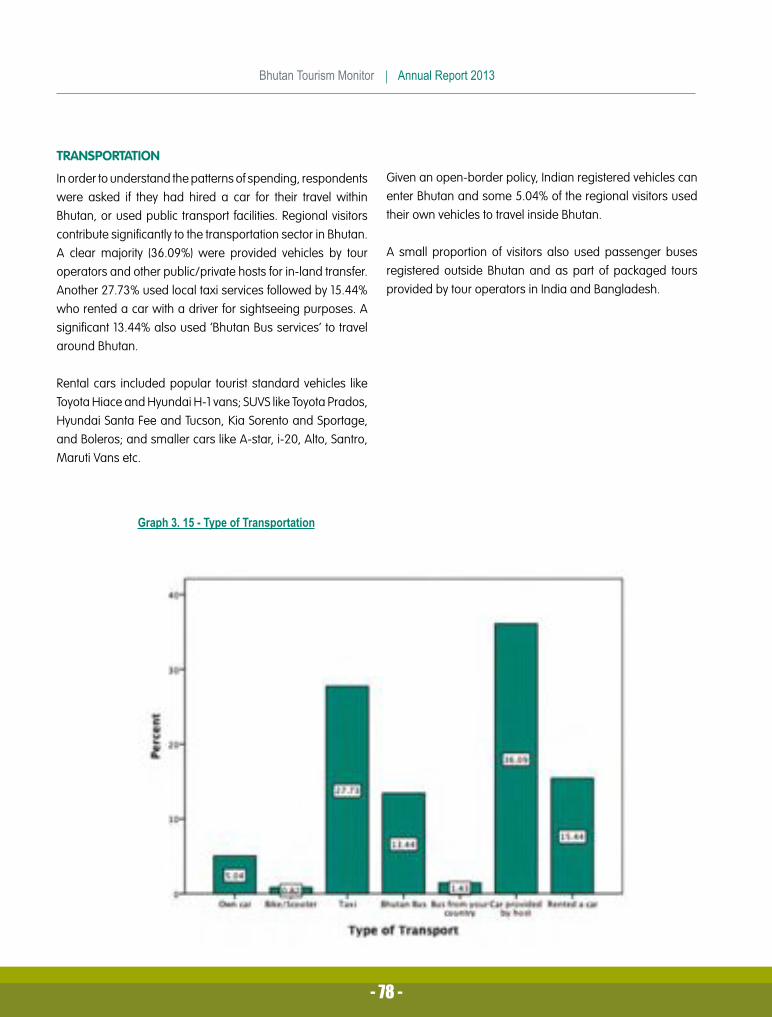
%KXWDQ�7RXULVP�0RQLWRU��������$QQXDO�5HSRUW�����
������
TRANSPORTATION
In order to understand the patterns of spending, respondents were asked if they had hired a car for their travel within Bhutan, or used public transport facilities. Regional visitors contribute significantly to the transportation sector in Bhutan. A clear majority (36.09%) were provided vehicles by tour operators and other public/private hosts for in-land transfer. Another 27.73% used local taxi services followed by 15.44% who rented a car with a driver for sightseeing purposes. A significant 13.44% also used ‘Bhutan Bus services’ to travel around Bhutan.
Rental cars included popular tourist standard vehicles like Toyota Hiace and Hyundai H-1 vans; SUVS like Toyota Prados, Hyundai Santa Fee and Tucson, Kia Sorento and Sportage, and Boleros; and smaller cars like A-star, i-20, Alto, Santro, Maruti Vans etc.
Given an open-border policy, Indian registered vehicles can enter Bhutan and some 5.04% of the regional visitors used their own vehicles to travel inside Bhutan.
A small proportion of visitors also used passenger buses registered outside Bhutan and as part of packaged tours provided by tour operators in India and Bangladesh.
*UDSK���������7\SH�RI�7UDQVSRUWDWLRQ

������
%KXWDQ�7RXULVP�0RQLWRU��������$QQXDO�5HSRUW�����
������
ACCOMMODATION IN BHUTAN
The Tourism Council of Bhutan accredits hotels and guesthouses as per the ‘Star Classification’ system of standardisation. Properties are now classified based on a set of criteria that ensures the “high value, low volume” tourism policy, and requires all visitors to stay in a minimum of a 3-star category hotel. In spite of this regulation, occupancy is varied across different standard hotels due to a high incidence of regional visitors who are also “budget conscious” travellers. As a result many regional visitors also stay in less than 3-star or even unaccredited hotels. As shown in the figure below, a clear majority of 60.20% of the total regional visitors indicated that ‘Pricing’ is the most important factor while choosing hotels, as opposed to a ‘Star Rating’, which was only considered by 14.70% of the visitors.
The high-end regional visitors usually book with Hotel Taj Tashi, a 5-star property in Thimphu. Tour groups from India organised by local travel agents are kept in hotels according
to their budget and package prices.
Other factors determining choice of accommodation were also the ‘location’ of the hotel with 32.70% of the visitors indicating that they preferred hotels with close proximity to tourism attractions, and another 32.20% of the respondents rated hotels with proper Internet facility as a major factor. The latter indicates that many regional visitors also work during their trip to Bhutan. A cross-tabulation with visitor’s purpose of visit illustrate that proper Internet and other communication facilities were rated highly amongst business travellers.
Almost one third (32.2%) of the total regional visitors indicated that they did not choose their hotels and were booked by their travel agents as part of their package inclusions. Only 7.20% choose their hotels based on online reviews.
*UDSK���������)DFWRUV�'HWHUPLQLQJ�&KRLFH�RI�+RWHOV

%KXWDQ�7RXULVP�0RQLWRU��������$QQXDO�5HSRUW�����
������
FACTORS DETERMINING VISITORS’ TIME OF VISIT
Visitors were asked what factors influenced them to choose the time of year to visit Bhutan. Findings show that a majority of regional visitors generally plan their travel based on their holiday timings, with 40.11% indicating that they visited Bhutan during their holiday time. Another 21.70% indicated that they visited Bhutan because of ‘Favourable Weather Conditions’ followed by another 19.40%, whose visitation time was based on their ‘Business Schedule’ in Bhutan. ‘Travel Agents’ and ‘Advice from Family/Friends’ influenced 6.20% and 5.86% of the respondents’ time of visit respectively. Unlike for international visitors, ‘Timing of Tsechu/Festival’ was not an important factor determining time of visit for visitors from the region.
*UDSK���������)DFWRUV�'HWHUPLQLQJ�7LPH�RI�9LVLWDWLRQ

������
%KXWDQ�7RXULVP�0RQLWRU��������$QQXDO�5HSRUW�����
������
VISITOR SATISFACTION LEVELS
Taking into account those who rated ‘Good’ and ‘Excellent’ for each of the aspects of their Bhutan holiday, the Tourism Satisfaction Index amongst regional visitors was at 73.85% in 2013.
*UDSK�������²�7RXULVW�6DWLVIDFWLRQ�,QGH[

%KXWDQ�7RXULVP�0RQLWRU��������$QQXDO�5HSRUW�����
������
Regional visitors do not have to pay the international tourist tariff to visit Bhutan. Goods and travel services are consumed on their own discretion and according to their spending capabilities. A clear majority (80.26%) of them expressed their satisfaction with the pricing and quality of goods and services, therefore suggesting that Bhutan is seen as an affordable destination for regional visitors. Only a negligible 5.25% expressed that it was very expensive for the quality of services availed.
*UDSK���������9DOXH�IRU�0RQH\�3HUFHSWLRQV
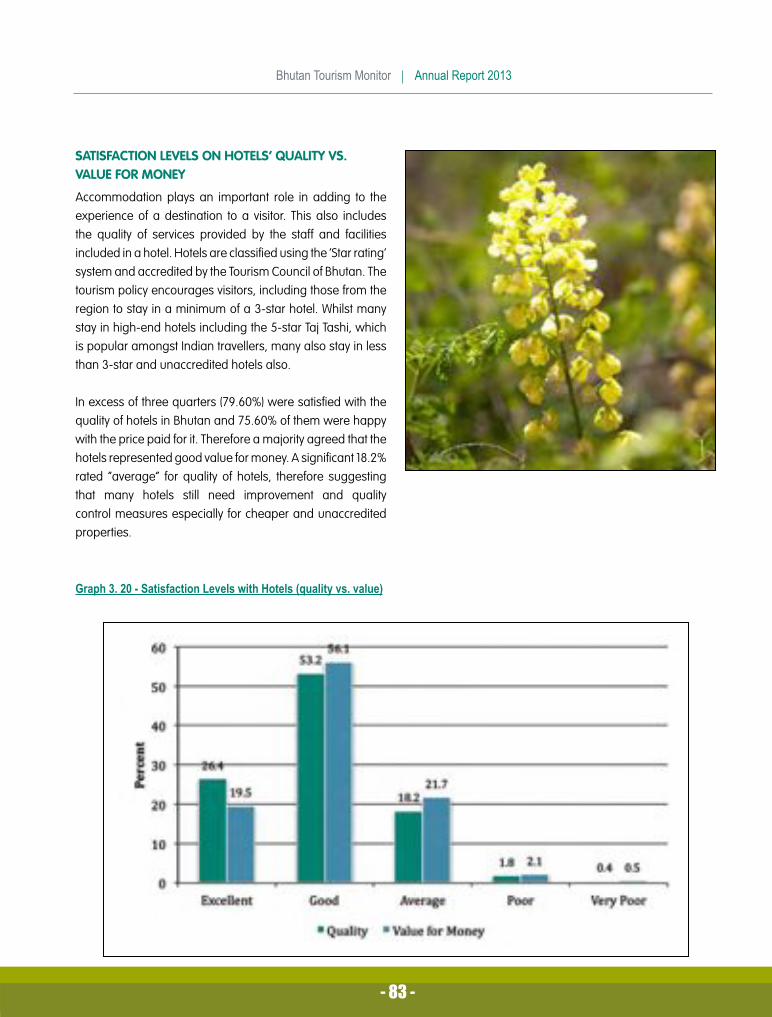
������
%KXWDQ�7RXULVP�0RQLWRU��������$QQXDO�5HSRUW�����
������
SATISFACTION LEVELS ON HOTELS’ QUALITY VS. VALUE FOR MONEY
Accommodation plays an important role in adding to the experience of a destination to a visitor. This also includes the quality of services provided by the staff and facilities included in a hotel. Hotels are classified using the ‘Star rating’ system and accredited by the Tourism Council of Bhutan. The tourism policy encourages visitors, including those from the region to stay in a minimum of a 3-star hotel. Whilst many stay in high-end hotels including the 5-star Taj Tashi, which is popular amongst Indian travellers, many also stay in less than 3-star and unaccredited hotels also.
In excess of three quarters (79.60%) were satisfied with the quality of hotels in Bhutan and 75.60% of them were happy with the price paid for it. Therefore a majority agreed that the hotels represented good value for money. A significant 18.2% rated “average” for quality of hotels, therefore suggesting that many hotels still need improvement and quality control measures especially for cheaper and unaccredited properties.
*UDSK���������6DWLVIDFWLRQ�/HYHOV�ZLWK�+RWHOV��TXDOLW\�YV��YDOXH�

%KXWDQ�7RXULVP�0RQLWRU��������$QQXDO�5HSRUW�����
������
SATISFACTION LEVELS ON RESTAURANTS’ QUALITY VS. VALUE FOR MONEY
A similar rating on satisfaction levels was also solicited for restaurants and food quality. Only 63.90% of the total regional visitors indicated that they were satisfied with the quality and diversity of food in Bhutan. Some 15.5% rated the food quality as ‘Excellent’ and another 48.40% rated it ‘Good’. Almost one third (29.90%) indicated that the food quality is average, and 28.10% indicated that the price paid for the quality was average. Some 6.20% of the regional visitors also mentioned that food quality and was poor vis-à-vis the price paid for it. As indicated by the international visitors also, the Food and Beverages (F&B) sector needs considerable improvements to cater to a diverse profile of visitors.
A few respondents suggested that there should be diversity in restaurants catering to “Pure vegetarians” as many visitors originating from India do not eat meat and egg products. Some also indicated that most restaurants and hotels are mainly targeting international visitors and the preferences of regional visitors seem to be overlooked.
*UDSK���������6DWLVIDFWLRQ�/HYHOV�ZLWK�5HVWDXUDQWV�DQG�)RRG��4XDOLW\�YV��9DOXH�

������
%KXWDQ�7RXULVP�0RQLWRU��������$QQXDO�5HSRUW�����
������
SATISFACTION LEVELS ON IN-LAND TRANSPORTATION
The transport sector is a major component in the tourism chain. As shown in Graph 3.22, regional visitors use all kinds of vehicles according to their budget and comfort requirements. Many hire vehicles with drivers for sightseeing purposes, and others commonly use local taxi services.
A clearly majority of 85.10% of regional visitors were satisfied with the quality and value of vehicles used for tourist transportation. Some 15.50% said that rates to hire vehicles could be cheaper as they rated ‘average’ for value for money. Only 2.90% were not satisfied with the quality of local vehicles used for their travel.
*UDSK���������6DWLVIDFWLRQ�/HYHOV�ZLWK�7UDQVSRUWDWLRQ��4XDOLW\�9V��9DOXH�

%KXWDQ�7RXULVP�0RQLWRU��������$QQXDO�5HSRUW�����
������
SATISFACTION LEVELS WITH CUSTOMER SERVICE
Professionalism in the service industry adds greatly to the satisfaction levels of visitors and the image of a destination. In 2013, the rating for satisfaction levels with quality of customer service in Bhutan increased to up to 82.14% from 65.0% as that of the previous year. Some 17.86% indicated that the quality of the hospitality staff could be improved. Respondents indicated that hotel related services such as F&B services, Front Desk Management, Room Keeping, Wait and Bell Services needed improvements.
DIVERSITY OF ATTRACTIONS
Findings indicated that regional visitors come to Bhutan for the specific purpose of experiencing the unique Bhutanese culture and the pristine environment. Many visitors indicated that they read about what to expect prior to their arrival and had realistic expectations about Bhutan. A clear majority of 74.34% of the visitors indicated that Bhutan had a good mix of attractions and places to see and do. The remaining 25.66% indicated that Bhutan needed more attractions and amenities to enhance visitor experiences for regional visitors. A few of them specifically expressed that Bhutan only focused on culture and nature and lacked “urban lifestyles with a vibrant entertainment, recreational and culinary culture” and “limited shopping opportunities” as these are important components a regional traveller looks for in a vacation. Visitors suggested that Bhutan should invest in proper cinema theatres that screen international films, swimming pools, live music facilities, good restaurants, shopping malls and better discotheques etc. as younger travellers associate these facilities as holiday activities. Given that India is the biggest market, these requirements should be available for the high-yield Indian holidaymakers who are younger and with a significant disposable income1. The India Outbound Report shows says that in terms of travel destination selection, the top five factors that influence destination selection for Indians are safety and security; variety of things to see and do; overall image of holiday destination; good tourist facilities; and infrastructure; and the ease of obtaining visas. The travel trade confirms that travellers will often change their mind about a travel destination if obtaining visas is a complex or time-consuming process2.��6RXUFH��,QGLD�2XWERXQG�0DUNHW�5HSRUW��6RXUFH��,QGLD�2XWERXQG�0DUNHW�5HSRUW
PRICING OF GOODS AND SOUVENIRS
One of the main activities of the regional visitors is shopping during their holiday to Bhutan. Only 47.25% of the respondents indicated that the pricing of goods were reasonable, the remaining 52.75% were of the opinion that shopping was expensive in Bhutan. This is however not surprising as Bhutan imports majority of the consumable goods from India, Bangladesh and Thailand where prices are comparatively cheaper. In concurrence to the opinions of international visitors to Bhutan, the regional market also mentioned that ‘souvenirs’ were priced at exorbitant rates.
EASE OF ORGANISING TRIPS TO BHUTAN
Regional visitors indicated that organising trips to Bhutan is very easy (78.28%). This is not a surprising finding because regional travellers are allowed to visit Bhutan freely and independently without having to pay a premium tariff that the international visitors are liable to, and do not necessarily have to avail the services of a local tour operator. Those who did mention difficulties with organising their trip to Bhutan
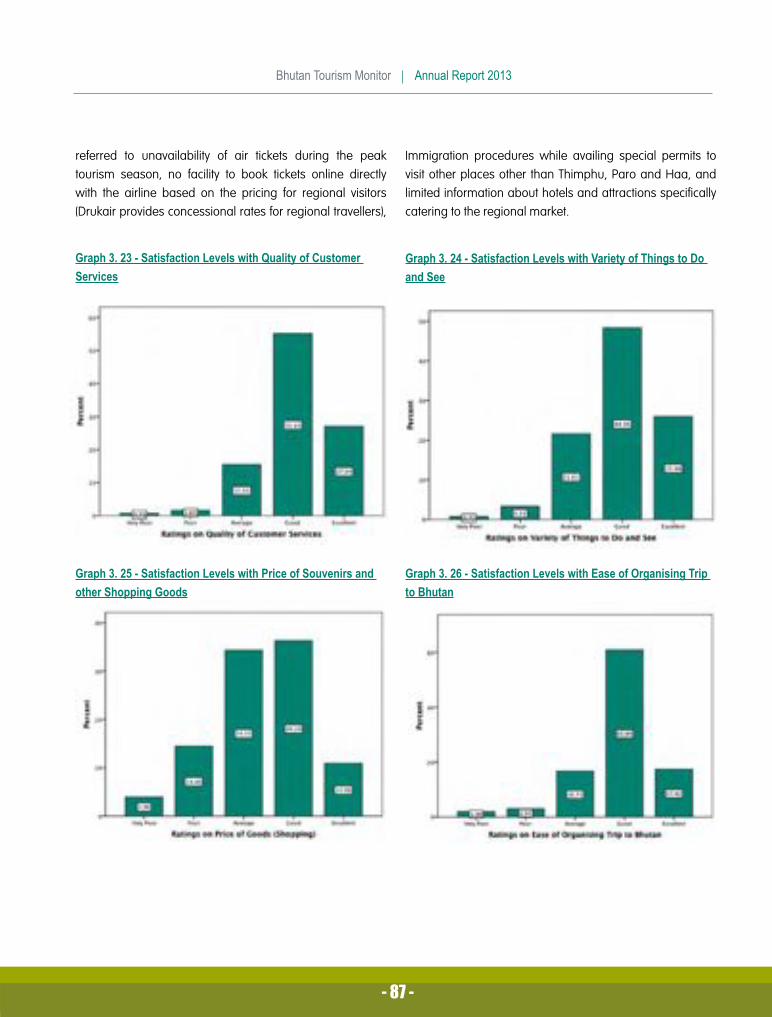
������
%KXWDQ�7RXULVP�0RQLWRU��������$QQXDO�5HSRUW�����
������
referred to unavailability of air tickets during the peak tourism season, no facility to book tickets online directly with the airline based on the pricing for regional visitors (Drukair provides concessional rates for regional travellers),
Immigration procedures while availing special permits to visit other places other than Thimphu, Paro and Haa, and limited information about hotels and attractions specifically catering to the regional market.
*UDSK���������6DWLVIDFWLRQ�/HYHOV�ZLWK�4XDOLW\�RI�&XVWRPHU�6HUYLFHV
*UDSK���������6DWLVIDFWLRQ�/HYHOV�ZLWK�9DULHW\�RI�7KLQJV�WR�'R�DQG�6HH
*UDSK���������6DWLVIDFWLRQ�/HYHOV�ZLWK�3ULFH�RI�6RXYHQLUV�DQG�RWKHU�6KRSSLQJ�*RRGV
*UDSK���������6DWLVIDFWLRQ�/HYHOV�ZLWK�(DVH�RI�2UJDQLVLQJ�7ULS�WR�%KXWDQ

%KXWDQ�7RXULVP�0RQLWRU��������$QQXDO�5HSRUW�����
������
SPENDING PATTERNS OF REGIONAL VISITORS
Besides the airfare paid by the regional visitors, respondents were asked to approximate the total amount of money they spent on their trip to Bhutan, even including the package rates for those who visited with a local tour company. Spending patterns differed given the varied profile of visitors. Most visitors’ individual spending ranged between INR 30,001 – 50,000, followed by INR 20,001 – 30,000 (16.75%) and INR 10,001 – 20,000 (16.50%). A significant 19.45% of regional visitors spent more than INR 50,000 albeit their short duration of stays. This indicates that a significant number of high-yield Indian visitors are travelling to Bhutan, especially as part of tour groups organised by big Indian tour operators from Mumbai. Their average individual spending is likely to be much higher if their airfare is included.
Owing to their short lengths of stays of regional visitors, around one third (35.90%) of the regional visitors spent less than INR 20,000. Those spending less than INR 1,000 were mostly day visitors who visited the border towns of Samdrup Jongkhar, Phuentsholing and Gelephug.
On an average, a regional visitor spends around INR 27,157.27 for a trip to Bhutan.
This finding suggests that the regional visitors should have contributed in excess of INR 1722 million (circa USD 28 million) in tourism receipts in the year 2013, even without including receipts from airfares.
The figures in the Table below show the segmentation of total spending on various services consumed during their trip. Out of the total, the average spending on accommodation amounts to INR 16,907. Similarly, average expenses for transportation services (in-country only) were valued at INR 7,489. Transportation services availed were mainly ‘car provided by host’ (36.09%), taxis (27.73%), rented cars (15.44%), and Bhutan Bus services (13.44%) for the purpose of sightseeing and other travel inside Bhutan.
Expenditure on food and beverages was scattered throughout all segments of spending brackets. The average spend was INR 6,002. Likewise, regional visitors spent INR 7,839 on average on shopping for souvenirs and handicrafts products and other shopping. They spent around INR 1,648 and INR 2,676 on ‘tipping/offerings in temples’ and ‘spa and wellness’ services on average respectively.
Respondents highlighted the lack of entertainment facilities like proper discotheques, cinema halls screening latest international movies, swimming pools, good bars with live music etc. As a result visitors spent less with an average of INR 2,200 on entertainment and other recreational activities. This is one area of spending which can needs to be improved for the purpose of contributing to more yields from regional visitors.
Regional visitors spent an average of INR 705 for Internet and Telephone services while in Bhutan.
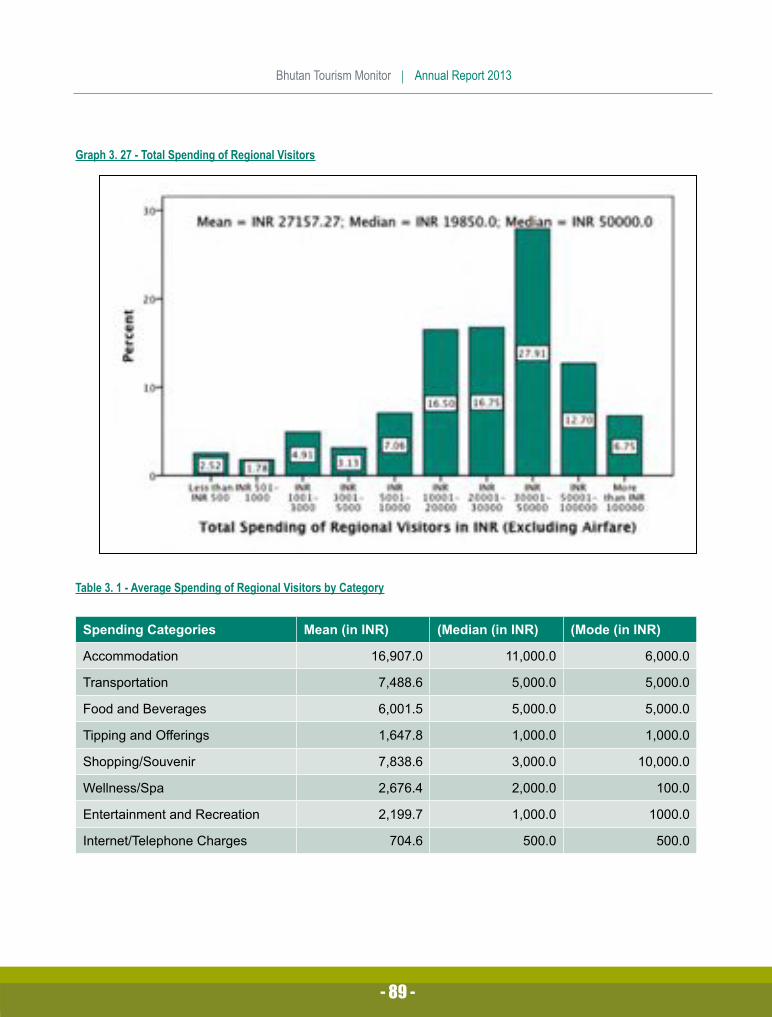
������
%KXWDQ�7RXULVP�0RQLWRU��������$QQXDO�5HSRUW�����
������
*UDSK���������7RWDO�6SHQGLQJ�RI�5HJLRQDO�9LVLWRUV
7DEOH��������$YHUDJH�6SHQGLQJ�RI�5HJLRQDO�9LVLWRUV�E\�&DWHJRU\
6SHQGLQJ�&DWHJRULHV 0HDQ��LQ�,15� �0HGLDQ��LQ�,15� �0RGH��LQ�,15�
$FFRPPRGDWLRQ �������� �������� �������
7UDQVSRUWDWLRQ ������� ������� �������
)RRG�DQG�%HYHUDJHV ������� ������� �������
7LSSLQJ�DQG�2IIHULQJV ������� ������� �������
6KRSSLQJ�6RXYHQLU� ������� ������� ��������
:HOOQHVV�6SD ������� ������� �����
(QWHUWDLQPHQW�DQG�5HFUHDWLRQ ������� ������� ������
,QWHUQHW�7HOHSKRQH�&KDUJHV ����� ����� �����

%KXWDQ�7RXULVP�0RQLWRU��������$QQXDO�5HSRUW�����
������
SUGGESTIONS FOR IMPROVEMENTS
Respondents were asked to make comments about tourism related services and infrastructures as well as suggest ways to enhance their experience in Bhutan. Of the total sampled, around 36.43% expressed dissatisfaction with at least one or more aspects of their Bhutan trip and made suggestions for improvements. The remaining did not complain about anything about their Bhutan trip.
The suggestions made by regional visitors shows that their concerns are different from the international visitors. Unlike the internationals who are more concerned with ‘roads’, ‘garbage management’, ‘better hotels’, ‘restroom facilities’ etc. the regional segment’s main concern was with ‘online booking facilities’ for hotels and airlines. Visitors who wanted to stay in accredited hotels during peak seasons had difficulty finding accommodation as the beds are reserved for international visitors in advance. Similarly with airline booking, visitors did not get tickets if not booked way in advance.
Airlines offer concessional airfare to regional visitors from India and Bangladesh at par with rates for Bhutanese travellers. However, this can be only availed through Drukair’s ticketing partners based in Kolkata, Delhi, Bagdogra, Guwahati and Bodh Gaya in India, and Dhaka in Bangladesh. Therefore, in absence of a direct online booking facility, visitors have to book through a third party to avail concessional fares. The rates on the B2C online booking facility of Drukair’s website is for the international tourists, payable in USD, and is considerably more expensive. Respondents indicated a need for online booking systems so that they can plan their Bhutan holiday without the involvement of third party ticketing agents.
Visitors complained about the lack of upfront information about regional visitors on the web and other information mediums. Respondents specifically mentioned that most travel sites on the Internet are focused on the international segment and did not cater to free independent travellers from the region. Attractions were mainly those included in set itineraries for the ‘Dollar paying tourist’.
Free independent travellers who did not avail a local travel agent’s assistance expressed cumbersome procedures with regards to availing permits to enter Bhutan while entering through road in Phuentsholing. There are two kinds of permits required for a visitor to enter Bhutan – an entry permit and a route permit. The entry permit limits visitors to visit only Thimphu, Chhukha, Paro and Haa Dzongkhags. The Department of Immigration issues entry permits for regional visitors only on working days and those arriving by land coinciding with weekends and national holidays had to wait till the next working day. Visitors intending to travel beyond the specified places as allowed by the entry permit need to apply for a route permit, which is only issued in DOI’s head office in Thimphu. That takes another day of paper work before the traveller can start holidaying.
The cumbersome procedures are mainly because of strict screening regulations for visitors entering through road, as the problem of illegal construction workers wanting to enter Bhutan for employment has been a perennial issue.
Respondents indicated that credit cards facilities were limited to Mastercard and Visa Card and many businesses did not have point of sales (POS) facilities which is used for payments through credit cards.
Respondents indicated that food quality and diversity was limited and needed improvement and there should be restaurants that are catering to “pure vegetarians”. Respondents indicated that Indian visitors are generally not “very adventurous” with foreign food and prefers good Indian restaurants while travelling.
Albeit most tourists are satisfied with their hotels, the need to improve hotel standards including services and food quality is still necessary. Some respondents mentioned that hotels were in bad conditions and needed improvements with room keeping, cleanliness, customer service etc. This suggests that some hotels may need to be upgraded both in terms of infrastructure and capacity development to deliver quality services, so as to remain competitive within the region.

������
%KXWDQ�7RXULVP�0RQLWRU��������$QQXDO�5HSRUW�����
������
A few of them specifically expressed that Bhutan only focused on culture and nature and lacked “urban lifestyles with a vibrant nightlife and culinary culture” and therefore did not appeal to Indian holidaymakers who are younger and with a significant disposable income. Visitors suggested that Bhutan should invest in proper cinema theatres that screen international films, swimming pools, live music facilities, good restaurants, shopping malls, cable cars, better discotheques etc. as younger travellers associate these facilities as holiday activities.
Like international visitors, regional visitors also highlighted the need for proper public toilets and restrooms along highways as it becomes very inconvenient during travel times.
Some mentioned that local businesses not accepting higher denominations of INR 500 and INR 1000 was inconvenient to travel with cash in hand.
%KXWDQ�7RXULVP�0RQLWRU��������$QQXDO�5HSRUW�����
������

������
%KXWDQ�7RXULVP�0RQLWRU��������$QQXDO�5HSRUW�����
������
*UDSK������9LVLWRU�$UULYDOV�IURP�WKH�8QLWHG�6WDWHV�RI�$PHULFD
6HFWLRQ���²�6RXUFH�0DUNHWV�6XPPDU\Section 4 of the report provides a country wise analysis of the top 10 international source markets independently. It is a collection of findings, which are summarised according to a particular source market to present various trends and patterns of behaviour of a particular market.
UNITED STATES OF AMERICA
After experiencing a slight decrease of -3.52% in arrivals in 2012, the United States rebounded well in 2013 with a +15.32% increase. In 2013, there were 6,927 tourists from USA, constituting 17.31% of the total bed night’s proportion. Tourists from USA stayed for 7.57 days on average and visited mainly in the months of (September –November) with 50.04% arriving during these months. Another 29.35% visited in March-May.
Responses from the tourists interviewed at the Paro Airport show that 88.54% of the visitors from USA have a university degree. Most Americans (34.20%) visited as part of an organised tour group followed by another 28.90% who visited as a couple. A significant 19.80% travelled as ‘Group of Friends’. Majority (92.50%) of them were visiting Bhutan for the first time and another 4.70% were visiting Bhutan for the second time. After this visit, some 80.40% indicated their interest to visit again in the near future. Whilst a quarter solely visited Bhutan during this trip, another 37.40% and 29.20% combined their Bhutan trip with Nepal and Thailand respectively. Another 27.20% combined their trip with India. A majority of 59.30% indicated that their vacation time is normally in between June to August.
Graph 4.2 below shows the entry sector of the USA source market. Americans mainly prefer Bangkok (45.86%) to enter Bhutan. A significant number of visitors from USA also entered through Kathmandu (21.13%), Delhi (18.67%) and Kolkata (6.78%). Only 5.55% of the total American arrivals entered by road via one of the over land ports bordering with India.
*UDSK������3RUW�RI�(QWU\�RI�86�$UULYDOV

%KXWDQ�7RXULVP�0RQLWRU��������$QQXDO�5HSRUW�����
������
CHINA
China represents the most promising international market for Bhutan surpassing Japan as the biggest Asian market. Tourist traffic from China has grown steadily and with substantial growth rates recorded in the last 5 years. In 2013, there were 4,764 Chinese visitors, resulting from a +26.92% growth rate from the previous year. Visitors from China visit Bhutan for a short holiday averaging 4.92 days and contributed 7.73% of the total bed nights share. Their time of visitation is spread throughout the year with a slight majority of 34.61% travelling between September - November months. Some 26.32% also travelled between March – May.
Visitors from China are highly educated with the majority holding university degrees. For 93.60%, this was their first visit to Bhutan. A significant 4.80% indicated that this was their second visit to the country. Data from exit surveys show that some 78.6% indicated their interest to revisit Bhutan within the next 5 years. Some 37.90% indicated that their trip was for the purpose of solely visiting Bhutan. Others combined it with Nepal (34.70%) and Thailand (17.1%). More than half of all Chinese visitors travelled as ‘group of friends’ (51.0%), as couples (20.80%) and as part of organised tour groups (19.70%). Majority of the Chinese respondents indicated that their main holiday timing is in June-August.
*UDSK������
9LVLWRU�$UULYDOV�IURP�&KLQD
The graph 4.4 below shows the port of entry for the Chinese visitors. The majority of the visitors preferred ‘Air’ as their mode of transport with 64.84% of them entering through Kathmandu, followed by 28.40% entering through Bangkok. Some 1.62% entered by road through Phuentsholing, and another 0.11 used Samdrup Jongkhar as their port of entry. There was also a chartered flight from Beijing for a Chinese group.
*UDSK������
3RUW�RI�(QWU\�IRU�9LVLWRUV�IURP�&KLQD

������
%KXWDQ�7RXULVP�0RQLWRU��������$QQXDO�5HSRUW�����
������
JAPAN
The dominance of Japan as the biggest international market in 2012 was short-lived as it experienced a substantial -42.37% decrease in 2013, corresponding to arrivals at 4,015 visitors. Japan’s share of bed nights was even lesser corresponding to only 6.32% in 2013. Their travel times are spread across the year with 29.09% travelling in between September-November, another 28.24% in between March-May, and a quarter 26.58% travelled during the lean months of June-August. The remaining 16.09% visited in between December-February. Average Length of Stay decreased slightly to 4.77 days in 2013.
Like most visitors who come to Bhutan, Japanese are highly educated with most of them holding university degrees. Japanese visitors travelled mainly as part of ‘Organised Tour Groups’ (45.30%) and as ‘Group of Friends’ (22.40%). A good proportion of 13.70% and 12.90% also travelled ‘as a couple’ and ‘alone’ respectively. Some 83.30% indicated that it was their first visit to Bhutan, thereby indicating a high repeat rate. For 8.8%, this trip was their second visit and another 2.8% had visited Bhutan before on 2 previous occasions. Out of the total Japanese visitors interviewed, a majority of 81.60% indicated their interest to visit again in the near future. Half of Japanese visitors to Bhutan visited solely to visit Bhutan and did not combine their trip with any other destinations in the region. Others combined mainly with Thailand (24.90%) and India (13.10%). Visitors indicated that their holiday time is generally in June- August as indicated by 59.90% of the total respondents. Some 18.30% indicated that their holiday time is in between March-May.
*UDSK������
9LVLWRU�$UULYDOV�IURP�-DSDQ
The graph 4.6 below shows the entry sector for the Japanese visitors. Majority of the visitors indicated that they entered through Bangkok (81.23%) as it the nearest port of embarkation. The only other port that rated significantly was Kathmandu with 6.68% entering from it. Only 4.79% of the Japanese visitors entered over land from Phuentsholing.
*UDSK������
3RUW�RI�(QWU\�IRU�9LVLWRUV�IURP�-DSDQ
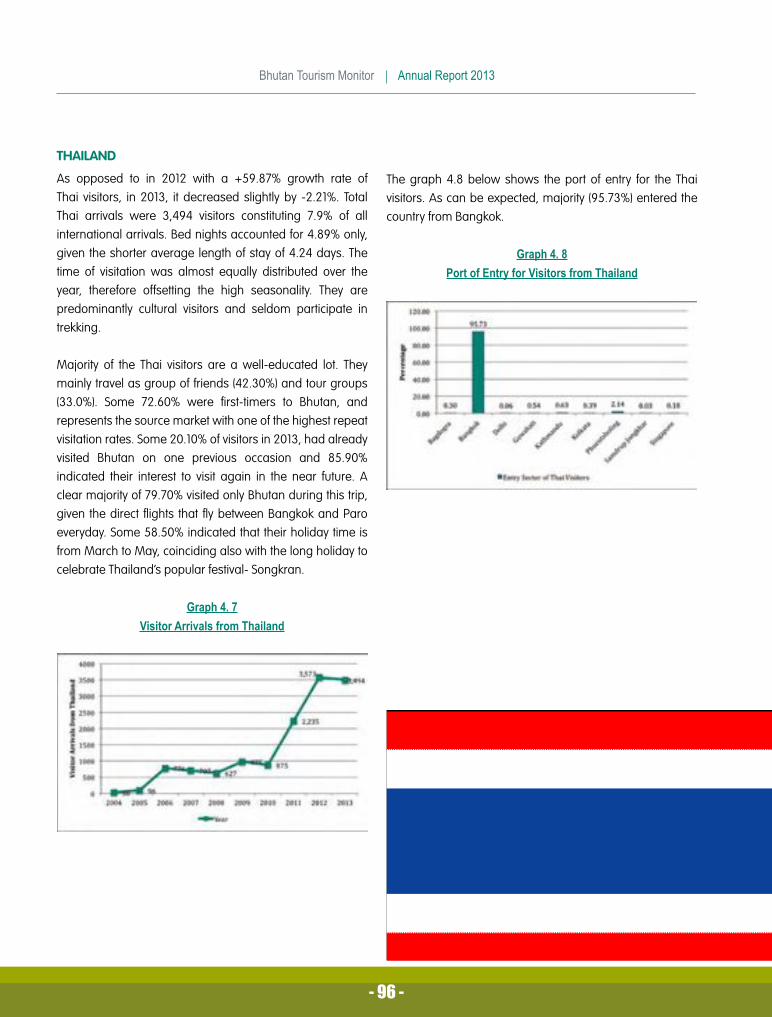
%KXWDQ�7RXULVP�0RQLWRU��������$QQXDO�5HSRUW�����
������
THAILAND
As opposed to in 2012 with a +59.87% growth rate of Thai visitors, in 2013, it decreased slightly by -2.21%. Total Thai arrivals were 3,494 visitors constituting 7.9% of all international arrivals. Bed nights accounted for 4.89% only, given the shorter average length of stay of 4.24 days. The time of visitation was almost equally distributed over the year, therefore offsetting the high seasonality. They are predominantly cultural visitors and seldom participate in trekking.
Majority of the Thai visitors are a well-educated lot. They mainly travel as group of friends (42.30%) and tour groups (33.0%). Some 72.60% were first-timers to Bhutan, and represents the source market with one of the highest repeat visitation rates. Some 20.10% of visitors in 2013, had already visited Bhutan on one previous occasion and 85.90% indicated their interest to visit again in the near future. A clear majority of 79.70% visited only Bhutan during this trip, given the direct flights that fly between Bangkok and Paro everyday. Some 58.50% indicated that their holiday time is from March to May, coinciding also with the long holiday to celebrate Thailand’s popular festival- Songkran.
*UDSK������9LVLWRU�$UULYDOV�IURP�7KDLODQG
The graph 4.8 below shows the port of entry for the Thai visitors. As can be expected, majority (95.73%) entered the country from Bangkok.
*UDSK������3RUW�RI�(QWU\�IRU�9LVLWRUV�IURP�7KDLODQG

������
%KXWDQ�7RXULVP�0RQLWRU��������$QQXDO�5HSRUW�����
������
GERMANY
A total of 2,753 tourists from Germany visited Bhutan in 2013, corresponding to 6.22% of the total international arrivals to Bhutan, and 8.43% of the total bed night’s share. The German market has shown some volatility in the last few years with a slight decrease of -4.41% again recorded in 2013. More than half (53.58%) of the total visitors from Germany visited Bhutan in the months of September, October, and November. The average length of stay of the Germans was recorded at 9.28 days, one of the longest stays amongst major source markets.
Like other markets, visitors from Germany are well educated with 87.37% holding university degrees. Germans travelled mainly as part of organised tour groups (39.90%) and ‘as a couple’ (31.10%). A majority of 88.60% indicated that this was their first trip to Bhutan. After their trip in Bhutan, some 78.0% indicated that they want to visit again, thereby suggesting high satisfaction rates. Whilst 26.90% indicated that their only destination on the trip was Bhutan, others combined it mainly with India (42.50%) and Nepal (23.35%). Respondents indicated that Germans normally travel in summer between June-August.
*UDSK������9LVLWRU�$UULYDOV�IURP�*HUPDQ\
The graph 4.10 below substantiates the fact that German visitors prefer to combine their Bhutan trip with India and Nepal with majority entering through Kathmandu (30.68%), followed by 17.72% entering through Delhi. A significant one third of German arrivals enter over land from Phuentsholing (22.63%), and Samdrup Jongkhar (8.50%) and Gelephu (0.81%). There was also a German group with a chartered flight from Mandalay In Myanmar.
*UDSK�������3RUW�RI�(QWU\�IRU�9LVLWRUV�IURP�*HUPDQ\�

%KXWDQ�7RXULVP�0RQLWRU��������$QQXDO�5HSRUW�����
������
UNITED KINGDOM
United Kingdom has also shown unsteady trends in the last few years, resulting in losing its place as the second biggest market 5 years ago. Arrivals declined in two consecutive years with a -7.10% dip in 2013. Total British visitors were 2,291, constituting 5.18% of the total arrivals. Their average length of stay was 8.80 days and constituted to 6.66% of the total bed nights. Similar to Germany, in excess of half the total British visitors (51.11%) visited during September, October, and November months. Another 32.39% visited between March - May.
Tourists from the United Kingdom are mostly of the ‘46+’ age bracket and 91.54% of them were highly educated holding at least a university degree. As opposed to earlier findings, a high number of 45.10% of British visitors travelled ‘as a couple’, followed by 23.20% joining a group-tour. A 91.20% majority visited Bhutan for the first time. Whilst 23.50% visited only Bhutan during this trip, others combined it mainly with Nepal (39.80%), India (34.30%) and Thailand (16.40%). Some 66.50% indicated that their holiday time is in between June-August.
*UDSK������9LVLWRU�$UULYDOV�IURP�8QLWHG�.LQJGRP
Graph below 4.12 shows the preferred entry sectors of the British visitors in 2013. Some 38.64% of the total preferred to enter through Kathmandu followed by Bangkok (21.84%). A significant 12.18% entered overland by road through one of the road access points in Southern Bhutan.
*UDSK�������3RUW�RI�(QWU\�RI�8.�$UULYDOV
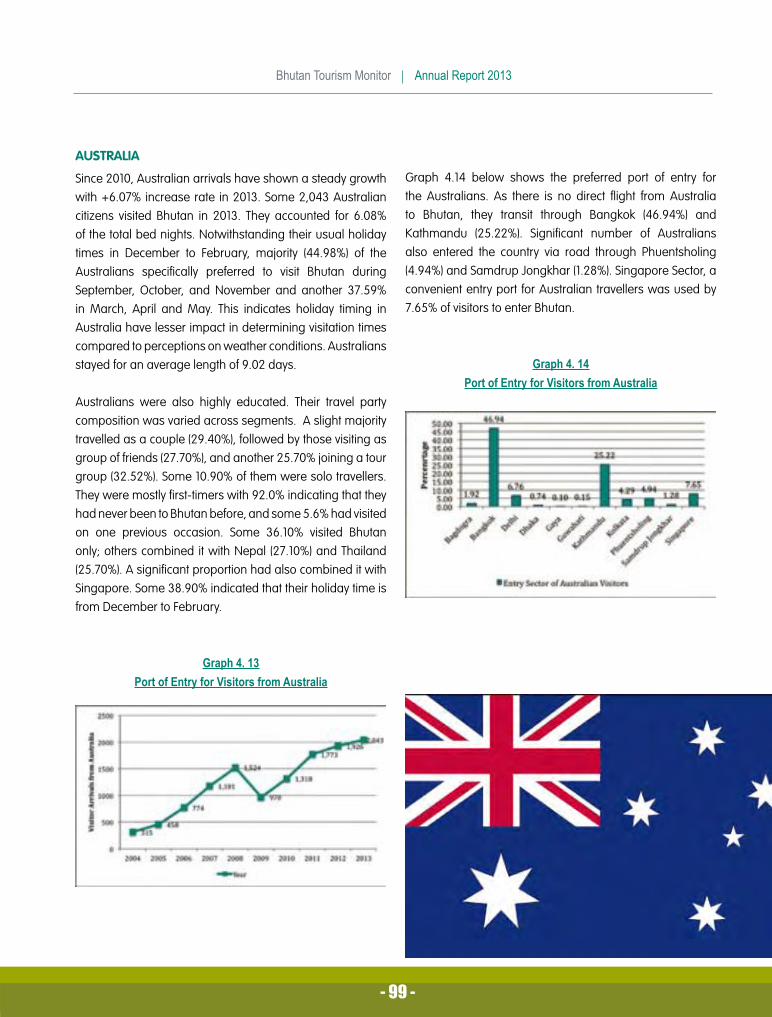
������
%KXWDQ�7RXULVP�0RQLWRU��������$QQXDO�5HSRUW�����
������
AUSTRALIA
Since 2010, Australian arrivals have shown a steady growth with +6.07% increase rate in 2013. Some 2,043 Australian citizens visited Bhutan in 2013. They accounted for 6.08% of the total bed nights. Notwithstanding their usual holiday times in December to February, majority (44.98%) of the Australians specifically preferred to visit Bhutan during September, October, and November and another 37.59% in March, April and May. This indicates holiday timing in Australia have lesser impact in determining visitation times compared to perceptions on weather conditions. Australians stayed for an average length of 9.02 days.
Australians were also highly educated. Their travel party composition was varied across segments. A slight majority travelled as a couple (29.40%), followed by those visiting as group of friends (27.70%), and another 25.70% joining a tour group (32.52%). Some 10.90% of them were solo travellers. They were mostly first-timers with 92.0% indicating that they had never been to Bhutan before, and some 5.6% had visited on one previous occasion. Some 36.10% visited Bhutan only; others combined it with Nepal (27.10%) and Thailand (25.70%). A significant proportion had also combined it with Singapore. Some 38.90% indicated that their holiday time is from December to February.
*UDSK�������3RUW�RI�(QWU\�IRU�9LVLWRUV�IURP�$XVWUDOLD
Graph 4.14 below shows the preferred port of entry for the Australians. As there is no direct flight from Australia to Bhutan, they transit through Bangkok (46.94%) and Kathmandu (25.22%). Significant number of Australians also entered the country via road through Phuentsholing (4.94%) and Samdrup Jongkhar (1.28%). Singapore Sector, a convenient entry port for Australian travellers was used by 7.65% of visitors to enter Bhutan.
*UDSK�������3RUW�RI�(QWU\�IRU�9LVLWRUV�IURP�$XVWUDOLD

%KXWDQ�7RXULVP�0RQLWRU��������$QQXDO�5HSRUW�����
�������
SINGAPORE
Singapore also represents a rapidly increasing Asian top market with 2,037 visitors in 2013, marking an increase of +26.92% compared to its previous high. Bed nights accounted for 4.86% of all international visitors. Their travel times are almost equally spread over the year, with the months between September and November recording a slightly higher visitation. Unlike the other major Asian markets, the Singaporeans stayed a bit longer with average length recorded at 7.24 days.
Singaporeans are highly educated with 97.66% of them holding a minimum of a university degree. Their travel party composition was mainly ‘as groups of friends’ (30.60%), followed by ‘as a couple’ (24.40%). A significant 13.50% also travelled as a ‘family group’. Majority (84.50%) were first timers and 9.80% of them had visited Bhutan on once before. Three quarters of all Singaporeans visited only Bhutan during this trip. Others mainly combined it with Thailand (14.0%). Singaporean respondents indicated that their main holiday timing is in summer in the months of June, July and August.
*UDSK�������9LVLWRU�$UULYDOV�IURP�6LQJDSRUH
The Graph below shows the entry sector of the Singaporeans in 2013. Given the direct flights, majority entered directly from Singapore. Some 9.77% entered from Bangkok.
*UDSK�������3RUW�RI�(QWU\�IRU�9LVLWRUV�IURP�6LQJDSRUH

�������
%KXWDQ�7RXULVP�0RQLWRU��������$QQXDO�5HSRUW�����
�������
MALAYSIA
With less than 100 visitors in 2005, Malaysia represents a rapidly increasing market. It recorded the highest growth rates amongst major markets with a +55.24% increase over the previous year, and as a result surpassing French arrivals. A total of 2,029 Malaysian visitors came to Bhutan in 2013 and contributed 3.47% of total international bed nights. Like Singapore, Malaysian travellers time of visit is spread over the year, offsetting the high incidence of seasonality to some extent. Like other Asian markets, Malaysians also have shorter stays with an average of 5.18 days.
They are also highly qualified with 96.64% of them holding a minimum of a university degree. Their travel party was spread across all categories with a slight majority travelling as couples. For the majority this was their first visit to Bhutan and almost two-thirds of them mentioned that Bhutan was their only destination on the trip. Others combined their trip with Thailand and Nepal. Holiday times in their country is in summer between the months of June-August.
*UDSK�������9LVLWRU�$UULYDOV�IURP�0DOD\VLD
The Graph below shows the entry sector of Malaysian visitors in 2013. Majority entered through Kathmandu (66.58%). Some 14.55% entered through Bangkok and another 11.27% from Singapore.
*UDSK�������3RUW�RI�(QWU\�IRU�9LVLWRUV�IURP�0DOD\VLD

%KXWDQ�7RXULVP�0RQLWRU��������$QQXDO�5HSRUW�����
�������
FRANCE
Like most European markets that are affected by the EU recession, France is no exception to exhibiting market volatility as it saw a -15.48% dip in 2013. Whilst experts suggest that the recession in Europe may well be over, the finding shows that it had affected travel patterns of outbound French visitors. The substantial decrease has resulted it to further plummet to 10th position in the top 10 list of markets. Bed night’s share was at 4.91% of all international bed nights. September, October and November months are the preferred months for French tourists with some 53.30% visiting during these months. Another 34.40% visited during the spring months of March, April and May. Average length of stay of the French market was recorded at 9.53 days.
French tourists are highly educated with 93.42% of them holding university degrees. They prefer to travel mostly as organised tour groups (42.0%), as couples (25.10%) and as group of friends (14.50%). A significant 13.0% were solo travellers. Most visitors had not visited Bhutan before, 89.0% indicated it was their first time. Whilst 31.60% only visited Bhutan during the trip, others mostly combined their Bhutan holiday with India (39.30%) and Nepal (23.0%). Their holiday timing is normally during summer in the months of June, July and August with 62.60% indicating it.
*UDSK�������9LVLWRU�$UULYDOV�IURP�)UDQFH
The graph below shows the port of embarkation for the visitors originating from France. A slight majority of 26.66% preferred to enter overland from Phuentsholing, followed by 25.62% entering through Delhi using the air mode. Another 16.45% and 13.0% entered through Kathmandu and Bangkok respectively. A substantial 10.08% also entered from Samdrup Jongkhar.
*UDSK�������3RUW�RI�(QWU\�IRU�9LVLWRUV�IURP�)UDQFH

�������
%KXWDQ�7RXULVP�0RQLWRU��������$QQXDO�5HSRUW�����
�������
��7KLQOH\�'RUML

%KXWDQ�7RXULVP�0RQLWRU��������$QQXDO�5HSRUW�����
�������


![NAME OF THE PROJECT: [DEVELOPMENT OF TOURISM …...NAME OF THE PROJECT: [DEVELOPMENT OF TOURISM RELATED INFRASTRUCTURE] Letter of Invitation The [Tourism Council of Bhutan] has a budget](https://img.dokumen.tips/doc/110x75/5e9be2731b419f124916b9be/name-of-the-project-development-of-tourism-name-of-the-project-development.jpg)