Embed Size (px)
Citation preview

BGC PARTNERS, INC.NASDAQ: BGCP ANNUAL STOCKHOLDERS MEETING
June 20, 2018

DISCLAIMER
Discussion of Forward-Looking Statements
Statements in this document regarding BGC Partners, Inc. (“BGC”, “BGC Partners” or the “Company”) (NASDAQ: BGCP) and Newmark Group, Inc. (“Newmark”) (NASDAQ:
NMRK) that are not historical facts are “forward-looking statements” that involve risks and uncertainties, which could cause actual results to differ from those contained in the
forward-looking statements. Except as required by law, BGC and Newmark undertake no obligation to update any forward-looking statements. For a discussion of additional
risks and uncertainties, which could cause actual results to differ from those contained in the forward-looking statements, see BGC’s and Newmark’s Securities and Exchange
Commission filings, including, but not limited to, the risk factors set forth in these filings and any updates to such risk factors contained in subsequent Forms 10-K, Forms 10-Q
or Forms 8-K.
Non-GAAP Financial Measures
This presentation should be read in conjunction with BGC’s and Newmark’s respective most recent financial results press releases. Throughout this presentation, BGC refers to
certain non-GAAP financial measures, including Adjusted Earnings, Adjusted EBITDA and Liquidity. Certain non-GAAP measures are presented for BGC excluding Newmark and
for Newmark on a stand-alone basis. For a complete description of Adjusted Earnings, Adjusted EBITDA and Liquidity, and how, when, and why management uses these and
other non-GAAP measures, as well as reconciliations of these measures to the comparable GAAP measures, and more information regarding GAAP and non-GAAP results, see
the “Appendix” section of this presentation. Below under “Highlights of Consolidated Results” is a summary of certain GAAP and non-GAAP results for BGC. Segment results
on a GAAP and non-GAAP basis are included towards the end of this presentation, with appropriate reconciliations provided in the “Appendix” section noted above.
Note Regarding Financial Tables and Metrics
Excel files with BGC’s quarterly financial results and metrics from the current period dating back to the full year 2008 are accessible in the various financial results press releases
at the “Investor Relations” section of http://www.bgcpartners.com. They are also available directly at http://ir.bgcpartners.com/news-releases/news-releases. Excel files with
Newmark’s quarterly financial results and metrics from the current period and full year 2017 are accessible in the financial results press releases at the “Investor Relations”
section of http://www.ngkf.com. They are also available directly at http://ir.ngkf.com/investors/news-releases/financial-and-corporate-releases/default.aspx.
Other Items
BGC’s financial results consolidate those of the Company’s publicly traded and majority-owned subsidiary, Newmark. Newmark is a leading commercial real estate advisory firm
that completed its initial public offering (“IPO”) on December 19, 2017, and unless otherwise stated, its results are recorded for the purposes of this document as BGC’s “Real
Estate Services” segment. Newmark reports its stand-alone results separately.
Newmark operates as “Newmark Knight Frank”, “Newmark”, “NKF”, or derivations of these names. The discussion of financial resu lts for BGC’s Real Estate Services segment
reflects only those businesses owned by us or our affiliates and subsidiaries and does not include the results for Knight Frank or for the independently-owned offices that use
some variation of the Newmark name in their branding or marketing. Berkeley Point Financial LLC and its wholly owned subsidiary Berkeley Point Capital LLC may together be
referred to as “Berkeley Point” or “BPF”. For its consolidated results, BGC classifies certain Newmark stand-alone expenses as Corporate Items. BGC calculates certain revenue
items slightly differently than Newmark. Accordingly, Newmark’s stand-alone revenues and pre-tax earnings will differ in certain respects from those recorded in BGC’s Real
Estate Services segment. Please see the “Appendix” section of this presentation, including the sections titled “Reconciliation of BGC Real Estate Segment Revenues to Newmark
Group, Inc. Stand-Alone for Revenues”, “Reconciliation of BGC Real Estate Segment to Newmark Group, Inc. Stand-Alone for GAAP Income (Loss) From Operations before
Income Taxes” and “Reconciliation of BGC Real Estate Segment to Newmark Group, Inc. Stand-Alone for Pre-Tax Adjusted Earnings.”
© 2018 BGC Partners, Inc. All rights reserved.2
2

On June 28, 2013, BGC sold eSpeed to Nasdaq, Inc. (“Nasdaq”). The purchase consideration consisted of $750 million in cash pa id upon closing, plus an expected payment of up
to 14.9 million shares of Nasdaq common stock to be paid ratably over 15 years beginning in 2013, assuming that Nasdaq, as a whole, generates at least $25 million in gross
revenues each of these years. Nasdaq “payments” may be used interchangeably with the Nasdaq share “earn-out”. The right to receive the remainder of the Nasdaq payment was
transferred from BGC to Newmark prior to the completion of the Newmark IPO. The future value of Nasdaq shares discussed in this presentation is based on the closing price
as of June 18, 2018. See section titled “Nasdaq monetization” in this presentation.
Consistent with Newmark’s methodology of recognizing income related to the receipt of Nasdaq payments in the third quarter under GAAP, BGC currently recognizes the
receipt of Nasdaq earn-out payments when earned in the third quarter for Adjusted Earnings instead of its previous practice of pro-rating the payments over the following four
quarters in its consolidated results. This GAAP methodology will lead to earlier recognition of the Nasdaq income. BGC’s consolidated results for Adjusted Earnings have been
recast to incorporate this change in Nasdaq earn-out methodology in other income from 2017 onward. See section titled “Nasdaq monetization” in this presentation.
For the purposes of this document, all of the Company’s fully electronic businesses in the Financial Services segment may be referred to interchangeably as “Fenics.” This includes
fees from fully electronic brokerage, as well as data, software, and post-trade services (formerly known as “market data and software solutions”). Fenics results do not include
those of Trayport, which are reported separately due to its sale to Intercontinental Exchange, Inc. (“ICE”) for approximately 2.5 million ICE common shares in December of
2015.
BGC’s financial statements are presented to include the results of Berkeley Point and Lucera for all periods in this document prior to their acquisitions because these
transactions involved reorganizations of entities under common control. On September 8, 2017, BGC acquired Berkeley Point Financial LLC, including its wholly owned
subsidiary Berkeley Point Capital LLC. On November 4, 2016, BGC acquired the 80 percent of LFI Holdings LLC (“Lucera”) interests not already owned by the Company.
Throughout this document the term “GSE” may refer to a government-sponsored enterprise such as Fannie Mae or Freddie Mac, “FHA” is used to refer to the Federal Housing
Administration.
BGC, BGC Trader, GFI, Fenics, Fenics.com, Capitalab, Swaptioniser, ColleX, Newmark, Grubb & Ellis, ARA, Computerized Facility Integration, Berkeley Point, Landauer, Lucera,
Excess Space, and Excess Space Retail Services, Inc. are trademarks/service marks, and/or registered trademarks/service marks of BGC Partners, Inc. and/or its affiliates. Knight
Frank is a service mark of Knight Frank (Nominees) Limited.
Certain reclassifications may have been made to previously reported amounts to conform to the current presentation and to show results on a consistent basis across periods.
Any such changes would have had no impact on consolidated revenues or earnings for GAAP and would either leave essentially unchanged or increase pre- and post-tax
Adjusted Earnings for the prior periods, all else being equal. Certain numbers in the tables throughout this document may not sum due to rounding. Rounding may have also
impacted the presentation of certain and year-on-year percentage changes. See the tables towards the end of this document under “Segment Overview” for additional
information about both Real Estate Services and Financial Services, as well as about Corporate Items, which are shown separately from the following segment results.
© 2018 BGC Partners, Inc. All rights reserved.3
DISCLAIMER (CONTINUED)
3
DISCLAIMER (CONTINUED)
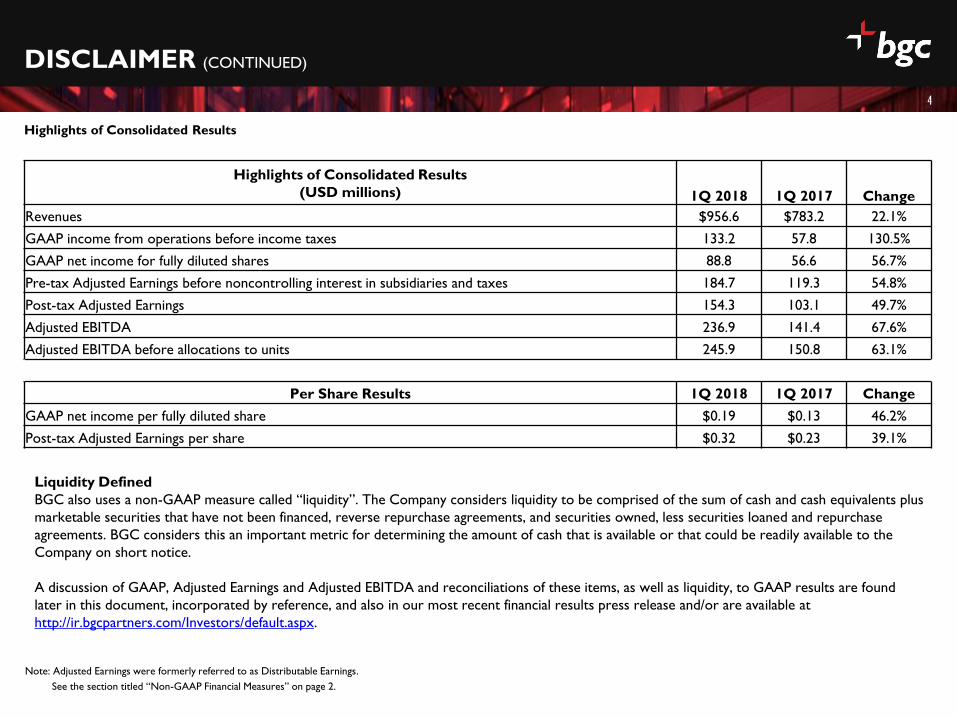
Note: Adjusted Earnings were formerly referred to as Distributable Earnings.
See the section titled “Non-GAAP Financial Measures” on page 2.
Highlights of Consolidated Results
(USD millions) 1Q 2018 1Q 2017 Change
Revenues $956.6 $783.2 22.1%
GAAP income from operations before income taxes 133.2 57.8 130.5%
GAAP net income for fully diluted shares 88.8 56.6 56.7%
Pre-tax Adjusted Earnings before noncontrolling interest in subsidiaries and taxes 184.7 119.3 54.8%
Post-tax Adjusted Earnings 154.3 103.1 49.7%
Adjusted EBITDA 236.9 141.4 67.6%
Adjusted EBITDA before allocations to units 245.9 150.8 63.1%
Per Share Results 1Q 2018 1Q 2017 Change
GAAP net income per fully diluted share $0.19 $0.13 46.2%
Post-tax Adjusted Earnings per share $0.32 $0.23 39.1%
Highlights of Consolidated Results
Liquidity Defined
BGC also uses a non-GAAP measure called “liquidity”. The Company considers liquidity to be comprised of the sum of cash and cash equivalents plus
marketable securities that have not been financed, reverse repurchase agreements, and securities owned, less securities loaned and repurchase
agreements. BGC considers this an important metric for determining the amount of cash that is available or that could be readily available to the
Company on short notice.
A discussion of GAAP, Adjusted Earnings and Adjusted EBITDA and reconciliations of these items, as well as liquidity, to GAAP results are found
later in this document, incorporated by reference, and also in our most recent financial results press release and/or are available at
http://ir.bgcpartners.com/Investors/default.aspx.
4

GENERAL OVERVIEW

SOLID FINANCIAL SERVICES BUSINESS WITH SIGNIFICANT OPPORTUNITIES
Intermediary-oriented, low-risk business model
Strong track record of accretive acquisitions and profitable hiring
Diversified revenues by geography & product
Dividend of $0.18 per share, for a 6.2% qualified dividend yield1
Continue to grow our highly profitable Fenics business
Developing new products and new verticals
Rising interest rates, and the end and/or tapering of QE are resulting in
increased volatility, activity and higher volumes for FS business
Regulatory reforms provide potential tailwinds and drive larger trading volumes
from FS traditional customers
CRE market fundamentals remain strong
1. Yield based on June 18, 2018 closing price of BGCP.
6

SELECT CONSOLIDATED ADJUSTED EARNINGS FINANCIAL RESULTS
BGC is expected to be around the high end of its previously stated consolidated outlook for revenues and Adjusted Earnings for the
second quarter of 2018.
Outlook for second quarter 20181
BGC anticipated second quarter 2018 consolidated revenues of between $890 million and $940 million, or 5 percent to 11 percent
higher compared with $849 million a year earlier.
BGC expected consolidated pre-tax Adjusted Earnings before noncontrolling interest in subsidiaries and taxes to be in the range of
$145 million and $165 million, or 7 percent to 22 percent higher versus $135 million in the prior-year period. The recast results for
the second quarter of 2017 excluded the Nasdaq earn-out.
Highlights of Consolidated Adjusted Earnings Results
(USD millions, except per share data)1Q 2018 1Q 2017
Change
(%)
1Q 2018
TTM
1Q 2017
TTM
Change
(%)
Revenues $956.6 $783.2 22.1% $3,526.8 $2,994.7 17.8%
Pre-tax Adjusted Earnings before non-controlling interest in
subsidiaries and taxes184.7 119.3 54.8% 685.9 521.8 31.4%
Post-tax Adjusted Earnings 154.3 103.1 49.7% 599.4 451.7 32.7%
Adjusted EBITDA 236.9 141.4 67.6% 747.8 623.8 19.9%
Adjusted EBITDA before allocations to units 245.9 150.8 63.1% 798.4 679.6 17.5%
Pre-tax Adjusted Earnings margin 19.3% 15.2% 19.4% 17.4%
Post-tax Adjusted Earnings margin 16.1% 13.2% 17.0% 15.1%
Note: See the section titled “Non-GAAP Financial Measures” on page 2.
7
1. This outlook was contained in BGC’s financial results press release issued on May 3, 2018, which can be found at http://ir.bgcpartners.com and was updated on June 20, 2018. BGC’s updated quarterly
guidance includes the full impact of the items discussed in this document.

Financial Services
Voice/Hybrid Fenics
TTM 1Q 2018
Revenues = $1,498 MM
TTM 1Q 2018
Revenues = $289 MM
Note: In addition to the results shown above, BGC’s consolidated TTM 1Q 2018 results also include Corporate revenues of $40.0 million not shown above. Fenics revenues include data, software, and post-trade
(inter-company) revenues of $57.5 million for TTM 1Q 2018, which are eliminated upon consolidation.
Real Estate Services
Commercial Real Estate
Brokerage & Financing Services:
• Leasing
• Investment Sales
• Commercial Mortgage Brokerage
• GSE and FHA Multifamily Lending
• Loan Servicing
Other Services:
• Global Corporate Services (consulting)
• Valuation & Appraisal
• Property & Facilities Management
• Due Diligence
• CRE Data &Technology
1,565 brokers & salespeople
Average revenue per broker up 15% YoY in 1Q 2018
Over 120 offices
TTM 1Q 2018
Revenues = $1,700 MM
1 FIRM, 2 SEGMENTS, MANY BUSINESSES
Key products include:
• Rates
• Foreign Exchange (“FX”)
• Credit
• Energy & Commodities
• Equities
• Insurance
2,468 brokers & salespeople (across entire financial services segment)
Average revenue per broker up 19% YoY in 1Q 2018
In 50+ cities
Key products include:
• Interest Rate Derivatives
• Credit
• FX
• Global Gov’t Bonds
• Market Data
• Software Solutions
• Post-trade Services
Proprietary network connected to the global financial community
8

Sound Financial Position
During May 2018, Fitch and S&P affirmed BGC’s investment grade rating at BBB- with “stable” outlook
following improved credit metrics on the basis of:
– Lower long term debt;
– Increased total capital and;
– Improving Adjusted EBITDA
Consolidated Leverage Ratio1 at 1.8x (1.4x excluding Newmark)
Interest Coverage Ratio1 at 8.4x (10.1x excluding Newmark)
Proposed Newmark Spin-off2
BGC currently intends to pursue a tax-free spin-off of Newmark
Key steps NMRK management intends to take
– Attain own credit rating
– Repay / refinance approximately $660 million of debt owed to or guaranteed by BGC (after $153
million repayment)
– This is necessary for the spin-off to be tax-free
Had the proposed spin-off of Newmark occurred immediately following the close of the first quarter of
2018, the ratio would have been approximately 0.4702 NMRK Class A share per BGCP Class A share1
LATEST KEY DEVELOPMENTS
1. Based on TTM Adjusted EBITDA and balance sheet as of March 31, 2018
2. The spin-off remains subject to a number of conditions. BGC may determine not to proceed with the spin-off including if not considered in the best interest of BGC and its stockholders or for any
other reason, in their sole discretion. Consequently, there can be no assurance as to when or if the spin-off will occur. Please see section on Proposed Spin-Off of Newmark toward the end of this
document for more information.
Note: See the section titled “Non-GAAP Financial Measures” on page 2.
9

NASDAQ MONETIZATION
10
Newmark has monetized the shares of Nasdaq it expects to receive in 2019 and 2020 for cash consideration of approximately $153
million via private transactions with a bank counterparty
Newmark intends to use the net proceeds of approximately $153 million from the monetization to repay a portion of the $400
million Converted Term Loan maturing September 8, 20191
The transactions included a forward, which is similar to at-the-money put options struck at Nasdaq’s June 18, 2018 closing price of
$94.21. This provides Newmark with downside protection on the shares while allowing Newmark to retain all appreciation related
to the 2019 and 2020 Nasdaq share earn-outs.
The following benefits will be achieved from the transactions:
Increases non-dilutive equity capital on BGC’s consolidated and Newmark’s stand-alone balance sheets
Improves liquidity
The preferred shares are not expected to increase Newmark’s fully diluted share count.2
Reduces debt by approximately $153 million and lowers interest expense
Newmark believes that the transaction increases the likelihood of obtaining an investment grade credit rating on a stand-alone
basis
1. Subject to certain exceptions, Newmark is required to use any cash proceeds from capital raises above $25 million, net of fees and anticipated taxes, to repay any balance on the Converted Term
Loan. See Newmark’s and/or BGC’s most recent SEC filing on Form 10-Q for more information on the Converted Term Loan.
2. Should Newmark Group’s consolidated revenues exceed $475 million in the third quarters of 2019 or 2020, the EPUs may be exchanged at Newmark’s election for Newmark Group common Class A
shares.

Q&A

SEGMENT OVERVIEW:
FINANCIAL SERVICES

Drivers
Highlights
1. Data, software, and post-trade excludes inter-company revenues.
Note: See the section titled “Non-GAAP Financial Measures” on page 2.
BUSINESS OVERVIEW: FINANCIAL SERVICES (1Q 2018)
$135,752 $160,772
$80,026
$99,050
$81,870
$82,050$53,145
$60,149$75,706
$97,754$13,087
$15,099
1Q 2017 1Q 2018
Other
Data, software, and post-trade
Equities, Insurance & Other
Energy and commodities
Credit
Foreign exchange
Rates
$1,592
1Q 2018 Revenue Breakdown
1Q 2018 Revenue Breakdown
$441,178
$516,621 $1,747
Fenics1
13%
Voice / Hybrid
& Other
87%
(USD $000s)
Total revenues increased 17% YoY
– Double-digit percentage increase in brokerage
revenues across rates, foreign exchange, equities,
insurance, and energy and commodities revenues
Pre-tax Adjusted Earnings increased approximately 31%
YoY (as a segment)
Pre-tax margin at 25%, approximately 270 basis points
higher YoY
Increased activity across rates, foreign exchange, and
energy and commodities
Over half the growth generated from equities, insurance,
and other asset classes was organic
Vast majority of growth from other products was organic
13

Across U.S.
Municipal Bonds
Wolfe & Hurst
Paris
Credit, Swaps
Ginalfi
U.K.
Rates
Sterling
Environmental
Brokerage
CO2e
Global
Commodities
Rates
FX
Credit
Equities
GFI Group
1. BGC acquired the rights of these businesses
New York / New
Jersey / Florida
Regional Power
Markets / Nat Gas
Mexico
Rates
Bonds
Remate Lince
London
Rates, FX
R.P. Martin1
HEAT Energy1
20132011 2012 2014 2015 2016
Electronic Fixed
Income / Futures
Trading
Perimeter
Technology Infra-
structure for OTC
Financial Markets
Lucera
Primarily Equity
Derivatives
Sunrise
Maxcor/Eurobrokers (2005)
ETC Pollack (2005)
Aurel Leven (2006)
AS Menkul (2006)
Marex Financial1 (2007)
Radix Energy (2008)
Liquidez (2009)
Mint Partners / Mint Equities1
8 Financial Services
Acquisitions
20172005 - 2010
Insurance brokerage
Besso
Rates, Credit, FX
South Africa
Micromega
Securities
Electronic trading
Emerging Markets
Bond Exchange Ltd
2018
Real-time pricing
and analytics
software
Kalahari Limited
STRONG RECORD OF SUCCESSFUL, ACCRETIVE ACQUISITIONS: FINANCIAL SERVICES
14

Date
BGC FS (excluding RE),
$1.7
All Other Wholesale Broker &
Execution Peers, $7.6
BGC, other wholesale financial brokerages, and their execution
peers currently comprise only a small percentage of the total
global sales & trading market
Reductions in Bank balance sheets may provide opportunities for
BGC’s Financial Services business
IB FICC, $98.0
IB Equities, $57.0
Wholesale & Execution,
$9.3
Other, $48.4
2017 Global Sales & Trading Revenues ≈ $213(in USD billions)
15
SMALL SLICE OF GLOBAL EXECUTION REVENUES = HUGE POTENTIAL FOR TRADITIONAL IDBs AND WHOLESALE BROKERS
Source: Morgan Stanley, Oliver Wyman, company filings, and BGC estimates. “Other” = exchanges, CCPs, all other execution venues, market data, technology providers, CSDs, or custodians and
other 3rd parties. Major Wholesale & Execution companies include BGC and BGC’s estimates in areas such as rates, credit, FX, equity, energy, and commodity brokerages of GFI, NEX Group (for
which we used Bloomberg consensus estimates for fiscal year-ended 3/31/2018) TP/ICAP, Tradition, ICE’s CDS execution business, Marex Spectron, ITG, MarketAxess, Thomson Reuters’ Financial
Risk Transactions revenue, FC Stone, and other non-public IDB and wholesale broker estimated revenues. Results for BGC exclude $1.6B of Real Estate Services revenues, which are thus
excluded from both the $9B industry-wide Wholesale & Execution and the $213B Sales & Trading figures. Note: figures may not sum due to rounding
FY 2017 Wholesale Broker & Execution
Revenues(in USD billions)
FICC (USD billions) Equities (USD billions)
Rates FX EM Credit and
SecuritizedCommodities Cash equities Derivatives
Prime and
synthetics
31 12 20 29 6 21 17 19

SEGMENT OVERVIEW:
REAL ESTATE SERVICES

1Q 2018 leasing and other services revenue increased
25% YoY
1Q 2018 real estate capital markets revenue increased
31% YoY
1Q 2018 management services, servicing fees and other
increased 58% YoY1
Drivers
Highlights
Nearly 90% of revenue growth was organic; front office
employees continued to improve their productivity
Leasing and investment sales significantly outpaced most
relevant industry-wide metrics2
Commercial real estate fundamentals remain strong
Valuation and Appraisal headcount increased by 270
professionals to a total of 300 professionals since the end of
1Q 2017
1Q 2018 Revenue Breakdown
1Q 2018 Revenue Growth
1. Approximately 38% of this growth was due to additional pass-through revenue related to ASC 606.
2. Sources: CoStar.
3. Investment sales, mortgage brokerage, and agency lending revenues represents two separate line items: 1) real estate capital markets (which consists of investment sales and mortgage brokerage), and
2) Gains from mortgage banking activities/originations, net (referred to here as “agency lending”).
Note: Certain numbers may not add due to rounding.
Management services,
servicing fees and other
Gains from mortgage banking
activities/originations, net
Real estate capital markets
Leasing and other services
(USD millions)
BUSINESS OVERVIEW: REAL ESTATE SERVICES (1Q 2018)
$128 $159
$77$101$45
$39$84
$132$334
$432
1Q 2017 1Q 2018
Management,
Servicing Fees
and Other
Revenues
31%
Leasing and
Other Services
37%
Investment
Sales, Mortgage
Brokerage, and
Agency Lending
32%Gains from
Mortgage
Banking Activities/
Originations, Net3
9%
Capital Markets3
23%
17

1. Based on revenues reported for BGC’s Real Estate Services segment for FY 2012, FY 2013, and FY 2014. Real Estate Services revenues include Berkeley Point revenues for FY 2014 onwards. FY 2011
revenues are based on unaudited full year 2011 revenues for Newmark & Co.
2. Based on Front Office Revenue (capital markets, leasing and other commissions, and gains from mortgage banking activities/originations, net) and average number of producers.
3. Chart based on revenue and other income related to the Nasdaq earn-out for the TTM ended March 31, 2018.
4. For the TTM ended March 31, 2018.
Newmark Revenue and Productivity Growth1 Diverse and Recurring Income Streams3
Excluding Berkeley Point, 37% of Newmark’s revenue growth
since 2011 has been organic
Companies acquired by Newmark, excluding Berkeley Point,
have organically grown their revenues 23% since being acquired
Balanced mix of revenue and other income with approximately
42% derived from recurring sources in TTM 1Q 2018
Ten largest customers represent approximately 7% of total
revenue4
(USD millions)
Revenue /
Producer2
($’000)
$474 $467 $622 $680 $707 $806
75%
growth
from 2012
$830
Organic Growth on AcquisitionsOrganic Acquisitions Acquisitions – Berkeley Point
$230
$632
$134
$592
$336
2011 2012 2013 2014 2015 2016 2017 TTM 1Q18
$1,694
NEWMARK FINANCIAL PERFORMANCE
42%35%
23%
Recurring
Transactional
Transactional
Recurring
Leasing
(tenant rep)
Leasing
(agency)
Valuation
Global
Corporate
Services
Loan
Servicing
Property &
Facilities
Mgmt.
Nasdaq
IncomeMortgage
Banking
Mortgage
Brokerage
Investment
Sales
18

1. Included 17 transactions not all of which were in 2014 with some completed after that year.
2. This acquisition is expected to close before the end of the year
Note: Certain of these acquisitions involved only the purchase of assets.
SUCCESSFUL TRACK RECORD OF ACCRETIVE ACQUISITIONS: REAL ESTATE SERVICES
20132011 2012 2014 2015 2016 2017 2018
Grubb & Ellis
Newmark Knight Frank
Frederick Ross
Smith Mack
2 Acquisitions
Cornish & Carey
Commercial
Apartment Realty Advisors
(ARA)1
18 Acquisitions
Excess Space
Computerized Facility
Integration
Cincinnati Commercial
Real Estate
Steffner Commercial Real
Estate d/b/a Newmark
Grubb Memphis
4 Acquisitions
The CRE Group
Rudesill-Pera Multifamily
Continental Realty
Newmark Grubb Mexico
City
Walchle Lear
5 Acquisitions
Berkeley Point
Financial
Regency Capital Partners
Spring11
6 former Integra Realty
Resources offices
9 Acquisitions
2 former Integra Realty
Resources offices
2 Acquisitions
On May 29, 2018 Newmark announced that it had agreed to acquire RKF Retail Holdings, LLC2
19

GLOBAL CRE SERVICES MARKET OPPORTUNITY
20
1. Represents actual revenues earned by global commercial real estate services firms as well as potential revenues from outsourcing opportunities
Sources: IBIS World, Bloomberg, public filings, CoStar and Newmark Knight Frank research. Top 6 CRE Brokerage and Services Companies as measured by FY17 global revenue prior to any
restatements related to ASC 606: Newmark, CBRE (fee-revenue), JLL (fee-revenue), Colliers, Savills, Cushman & Wakefield (estimated based on FY15 global revenues adjusted by the average
two-year growth rate of the other Top 6 companies)
Note: Chart has not been shown to scale. Prior versions of this chart did not include a complete estimate for commercial mortgage brokerage
$220+ BnTotal Revenue
Opportunity
(FY 2017)
$28Bn(<15%)
$1.6Bn(<1%)
1
Large and Highly
Fragmented Market
The Top 6 CRE Brokerage &
Services Firms
2017 Market Share <15%
$220B+Total Revenue Opportunity1
$28B(<15%)
$1.6B(<1%)
TOP 6 COMPANIES
MASSIVE POTENTIAL GLOBAL MARKET FOR BROKERAGE AND SERVICES

Pre-tax Adjusted Earnings and Adjusted EBITDA for Newmark Group, Inc. (stand-alone) increased 83.1%
and 67.8%, respectively, in 1Q 2018 on a year-over-year basis
SELECT FINANCIAL RESULTS OF NEWMARK GROUP, INC. (STAND-ALONE)
(USD millions)
Note: TTM 1Q 2018 includes Nasdaq payment of $77.0 million in Adjusted Earnings and Adjusted EBITDA, which is reflected in the Real Estate Services segment beginning Q3 2017.
Note: See the section titled “Non-GAAP Financial Measures” on page 2.
Financial Results Highlight of Newmark Group, Inc. (stand-alone) Q1 2018 Q1 2017
Change
(%)
Q1 2018
TTM
Q1 2017
TTM
Change
(%)
Revenues $430.5 $332.6 29.4% $1,694.3 $1,412.9 19.9%
Pre-tax Adjusted Earnings before noncontrolling interest in
subsidiaries and taxes63.6 34.8 83.1% 351.7 194.7 80.7%
Adjusted EBITDA before allocations to units 79.1 47.1 67.8% 405.5 233.8 73.4%
Pre-tax Adjusted Earnings margin 14.8% 10.5% 20.8% 13.8%
21

GAAP FINANCIAL RESULTS

SELECT CONSOLIDATED GAAP FINANCIAL RESULTS
23
Highlights of Consolidated GAAP Results (USD millions, except
per share data)1Q 2018 1Q 2017 Change (%)
Revenues under both U.S. Generally Accepted Accounting
Principles (“GAAP”) and Adjusted Earnings$956.6 $783.2 22.1%
Income from operations before income taxes 133.2 57.8 130.5%
Net income for fully diluted shares 88.8 56.6 56.7%
Net income per fully diluted share 0.19 0.13 46.2%
Pre-tax earnings margin 13.9% 7.4%
Post-tax earnings margin 9.3% 7.2%

BGC PARTNERS, INC. CONDENSED CONSOLIDATED STATEMENTS OF OPERATIONS (IN THOUSANDS, EXCEPT PER SHARE DATA) (UNAUDITED) (UNDER GAAP)
Revenues: 2018 2017
Commissions 668,599$ 545,720$
Principal transactions 91,918 85,743
Total brokerage revenues 760,517 631,463
Gains from mortgage banking activities/originations, net 38,914 45,261
Real estate management and other services 96,878 50,630
Servicing fees 28,926 24,832
Fees from related parties 6,590 6,938
Data, software and post-trade 15,099 13,087
Interest income 8,748 10,006
Other revenues 974 976
Total revenues 956,646 783,193
Expenses:
Compensation and employee benefits 534,811 460,631
Allocations of net income and grant of exchangeability to limited partnership units and FPUs 65,232 63,193
Total compensation and employee benefits 600,043 523,824
Occupancy and equipment 54,784 50,829
Fees to related parties 7,764 6,490
Professional and consulting fees 26,081 21,670
Communications 34,850 32,173
Selling and promotion 29,849 24,641
Commissions and floor brokerage 14,095 10,430
Interest expense 27,138 18,763
Other expenses 68,591 42,393
Total non-compensation expenses 263,152 207,389
Total expenses 863,195 731,213
Other income (losses), net:
Gain (loss) on divestiture and sale of investments - 557
Gains (losses) on equity method investments 5,801 237
Other income (loss) 33,942 5,020
Total other income (losses), net 39,743 5,814
Income (loss) from operations before income taxes 133,194 57,794
Provision (benefit) for income taxes 35,763 6,678
Consolidated net income (loss) 97,431$ 51,116$
Less: Net income (loss) attributable to noncontrolling interest in subsidiaries 38,657 14,291
Net income (loss) available to common stockholders 58,774$ 36,825$
Per share data:
Basic earnings per share
Net income (loss) available to common stockholders 58,774$ 36,825$
Basic earnings (loss) per share 0.19$ 0.13$
Basic weighted-average shares of common stock outstanding 307,728 283,399
Fully diluted earnings per share
Net income (loss) for fully diluted shares 88,757$ 56,634$
Fully diluted earnings (loss) per share 0.19$ 0.13$
Fully diluted weighted-average shares of common stock outstanding 478,935 444,826
Dividends declared per share of common stock 0.18$ 0.16$
Dividends declared and paid per share of common stock 0.18$ 0.16$
Three Months Ended March 31,
24

BGC PARTNERS, INC. CONDENSED CONSOLIDATED STATEMENTS OF OPERATIONS (IN THOUSANDS, EXCEPT PER SHARE DATA) (UNAUDITED) (UNDER GAAP)
Revenues: 2017 2016
Commissions 2,348,108$ 1,985,667$
Principal transactions 317,856 325,481
Total brokerage revenues 2,665,964 2,311,148
Gains from mortgage banking activities/originations, net 205,999 193,387
Real estate management and other services 233,063 196,801
Servicing fees 110,441 87,671
Fees from related parties 28,467 25,570
Data, software and post-trade 54,557 54,309
Interest income 51,103 33,876
Other revenues 3,762 5,334
Total revenues 3,353,356 2,908,096
Expenses:
Compensation and employee benefits 2,016,180 1,733,207
Allocations of net income and grant of exchangeability to limited partnership units and FPUs 286,628 192,934
Total compensation and employee benefits 2,302,808 1,926,141
Occupancy and equipment 205,332 203,947
Fees to related parties 29,028 24,143
Professional and consulting fees 97,639 67,208
Communications 131,188 125,592
Selling and promotion 114,906 100,602
Commissions and floor brokerage 44,086 38,515
Interest expense 102,504 71,365
Other expenses 198,562 144,213
Total non-compensation expenses 923,245 775,585
Total expenses 3,226,053 2,701,726
Other income (losses), net:
Gain (loss) on divestiture and sale of investments 561 7,044
Gains (losses) on equity method investments 6,189 3,543
Other income (loss) 97,944 97,213
Total other income (losses), net 104,694 107,800
Income (loss) from operations before income taxes 231,997 314,170
Provision (benefit) for income taxes 150,268 60,332
Consolidated net income (loss) 81,729$ 253,838$
Less: Net income (loss) attributable to noncontrolling interest in subsidiaries 30,254 68,816
Net income (loss) available to common stockholders 51,475$ 185,022$
Per share data:
Basic earnings per share
Net income (loss) available to common stockholders 51,475$ 185,022$
Basic earnings (loss) per share 0.18$ 0.67$
Basic weighted-average shares of common stock outstanding 287,378 277,073
Fully diluted earnings per share
Net income (loss) for fully diluted shares 75,256$ 283,525$
Fully diluted earnings (loss) per share 0.17$ 0.65$
Fully diluted weighted-average shares of common stock outstanding 454,256 433,226
Dividends declared per share of common stock 0.70$ 0.62$
` 0.70$ 0.62$
Year Ended December 31,
25

BGC PARTNERS, INC. CONDENSED CONSOLIDATED STATEMENTS OF FINANCIAL CONDITION (IN THOUSANDS, EXCEPT PER SHARE DATA) (UNAUDITED) (UNDER GAAP)
March 31, December 31,
2018 2017
Assets
Cash and cash equivalents 362,613$ 634,333$
Cash segregated under regulatory requirements 330,126 162,457
Securities owned 89,357 33,007
Securities borrowed 309 -
Marketable securities 96,061 208,176
Loans held for sale, at fair value 965,639 362,635
Receivables from broker-dealers, clearing organizations, customers and related broker-dealers 1,407,052 745,402
Mortgage servicing rights, net 381,526 392,626
Accrued commissions and other receivables, net 784,513 620,039
Loans, forgivable loans and other receivables from employees and partners, net 369,114 335,734
Fixed assets, net 196,906 189,347
Investments 153,452 141,788
Goodwill 944,795 945,582
Other intangible assets, net 307,183 311,021
Receivables from related parties 6,579 3,739
Other assets 382,271 343,826 Total assets 6,777,496$ 5,429,712$
Liabilities, Redeemable Partnership Interest, and Equity
Short-term borrowings 6,017$ 6,046$
Short-term borrowings from related parties 180,000 -
Repurchase agreements 985 -
Securities loaned 92,565 202,343
Warehouse notes payable 950,479 360,440
Accrued compensation 442,871 432,733
Payables to broker-dealers, clearing organizations, customers and related broker-dealers 1,219,815 607,580
Payables to related parties 45,682 40,988
Accounts payable, accrued and other liabilities 976,432 942,917
Notes payable and other borrowings 1,375,943 1,650,509 Total liabilities 5,290,789 4,243,556
Redeemable partnership interest 47,505 46,415
Equity
Stockholders' equity:
Class A common stock, par value $0.01 per share; 750,000 shares authorized; 328,529 and 306,218 shares
issued at March 31, 2018 and December 31, 2017, respectively; and 279,279 and 256,968 shares
outstanding at March 31, 2018 and December 31, 2017, respectively 3,286 3,063
Class B common stock, par value $0.01 per share; 150,000 shares authorized; 34,848 shares issued and
outstanding at March 31, 2018 and December 31, 2017, convertible into Class A common stock 348 348
Additional paid-in capital 1,984,297 1,763,371
Contingent Class A common stock 40,298 40,472
Treasury stock, at cost: 49,250 and 49,250 shares of Class A common stock at March 31, 2018 (303,873) (303,873)
and December 31, 2017, respectivelyRetained deficit (837,753) (859,009)Accumulated other comprehensive income (loss) (8,754) (10,486)
Total stockholders' equity 877,849 633,886 Noncontrolling interest in subsidiaries 561,353 505,855
Total equity 1,439,202 1,139,741
Total liabilities, redeemable partnership interest and equity 6,777,496$ 5,429,712$
26

NASDAQ MONETIZATION

EXECUTIVE SUMMARY
28
Newmark has monetized the shares of Nasdaq it expects to receive in 2019 and 2020 for cash consideration of approximately $153
million in a private transaction with a bank counterparty
Newmark intends to use the net proceeds of approximately $153 million from the monetization to repay a portion of the $400
million Converted Term Loan1 maturing September 8, 2019
An indirect subsidiary of Newmark entered into two variable postpaid forward transactions (together, the “Forward”) with the bank
counterparty on the same day as the transaction
The Forward is economically similar to at-the-money put options struck at Nasdaq’s June 18, 2018 closing price of $94.21, and
provides Newmark with downside protection on the shares while allowing Newmark to retain all appreciation related to the 2019
and 2020 Nasdaq share earn-outs.
The following benefits will be achieved from the transactions:
Increases non-dilutive equity capital on BGC’s consolidated and Newmark’s stand-alone balance sheets
Improves liquidity
The preferred shares are not expected to increase Newmark’s fully diluted share count.2
Reduces debt by approximately $153 million and lowers interest expense
Newmark believes that the transaction increases the likelihood of obtaining an investment grade credit rating on a stand-alone
basis
1. Subject to certain exceptions, Newmark is required to use any cash proceeds from capital raises above $25 million, net of fees and anticipated taxes, to repay any balance on the Converted Term
Loan. See Newmark’s and/or BGC’s most recent SEC filing on Form 10-Q for more information on the Converted Term Loan.
2. Should Newmark Group’s consolidated revenues exceed $475 million in the third quarters of 2019 or 2020, the EPUs may be exchanged at Newmark’s election for Newmark Group common Class A
shares.

DETAILS OF TRANSACTIONS
29
Introduction
Newmark developed an innovative financing structure enabling it to raise capital in an efficient manner
The structure combined entering into the Forward while simultaneously issuing an exchangeable preferred security to generate
upfront proceeds that improved permanent equity capital on BGC’s consolidated and Newmark’s stand-alone balance sheet
The payoff profile of the Forward was structured to replicate buying an at-the-money put option on Nasdaq shares
With Nasdaq shares trading near all-time high price levels, the Forward will provide protection against any decrease in Nasdaq’s
share price while still allowing Newmark to participate in any upside to the stock
The structure also allowed Newmark to defer any tax obligations associated with the Nasdaq shares until 2019 and 2020
Overview
Newmark monetized a portion of its deferred stock earn-out from Nasdaq through the Forward
As consideration for the e-Speed sale to Nasdaq in 2013, Newmark holds a deferred earn-out from Nasdaq that entitles
Newmark to receive ~992k Nasdaq shares each year through 2027, subject to Nasdaq’s consolidated gross revenue
exceeding $25 million in the relevant year (Nasdaq’s consolidated “gross” revenue was more than $2.4 billion for each of the
past ten years)
Due to the remote contingency, the earn-out payments are not currently recognized as a balance sheet asset of Newmark or
in Nasdaq’s share count
Newmark monetized the 2019 and 2020 Nasdaq earn-outs and retains the flexibility to monetize some or all of the expected more
than $650 million worth of remaining seven Nasdaq earn-outs from 2021 through 2027.
Newmark also issued Exchangeable Preferred Units (“EPUs”) to raise cash proceeds upfront that increase non-dilutive equity capital
by $153 million (net of transaction costs)
Newmark expects the rating agencies to consider the cash proceeds as an increase in equity

DETAILS OF TRANSACTIONS (CONTINUED)
30
At Inception
Newmark Partners, L.P. issued EPUs to the bank counterparty and received cash proceeds upfront
The Nasdaq deferred consideration rights were transferred to a newly-formed special purpose vehicle (“SPV”) which in turn
entered into the Forward with the bank counterparty
Obligations under the Forward are recourse solely to the SPV whose sole asset is the Nasdaq deferred consideration
At Settlement
The SPV expects to settle the Forward by delivering Nasdaq shares
Full underlying shares are delivered for shares prices below the put strike, while a decreasing number of shares are delivered
for prices above the put strike enabling Newmark to retain upside exposure to Nasdaq shares
The bank counterparty will in turn deliver the exchangeable preferred
Newmark does not have any obligation to deliver cash or other property
At its sole election, Newmark can elect to exchange the preferred for Newmark Group common stock after certain contingencies
are met and raise additional equity capital. The preferred shares are not expected to increase Newmark’s fully diluted share count1
1. Should Newmark Group’s consolidated revenues exceed $475 million in the third quarters of 2019 or 2020, the EPUs may be exchanged at Newmark’s election for Newmark Group common Class A
shares.

APPENDIX

EXECUTIVE MANAGEMENT TEAM
BGC LEADERSHIP Experience
Howard Lutnick Chairman and Chief Executive Officer 30+ Years
Shaun Lynn President 35+ Years
Sean Windeatt Chief Operating Officer 20+ Years
Stephen Merkel General Counsel and Secretary 30+ Years
Steve McMurray Chief Financial Officer 20+ Years
NEWMARK LEADERSHIP Experience
Howard Lutnick Chairman 30+ Years
Barry Gosin Chief Executive Officer 40+ Years
James Ficarro Chief Operating Officer 30+ Years
Michael Rispoli Chief Financial Officer 20+ Years
32

Rates, 15%
FX, 10%
Credit, 8%
Energy &
Commodities,
6%Equities,
insurance, and
other asset
classes, 10%
Data, Software,
Post-trade and
Other, 2%
Leasing
and Other
Services,
18%
Real Estate
Capital
Markets,
12%
Gains from
mortgage
banking
activities/
originations,
net, 6%Management,
Servicing
Fees and
Other, 11%
Corporate, 1%
Financial
Services
51%
Real Estate
Services
48%
Corporate
1%
Note: Percentages may not sum to 100% due to rounding.
Total Americas revenue up 15% and 23% in FY17 and 1Q18,
respectively
Europe, Middle East & Africa revenue up 17% and 22% in
FY17 and 1Q18, respectively
Asia Pacific revenue up 15% and 13% in FY17 and 1Q18,
respectively
FY 2017 Segment Revenue Breakdown FY 2017 & 1Q 2018 Global Revenue Breakdown
REVENUE BREAKDOWN
EMEA
31%
Americas FS
17%
Americas RE
45%
APAC
7%
EMEA
28%
Americas FS
17%
Americas RE
47%APAC
7%
FY17
1Q18
33

Fenics Net Revenue Growth1 1Q 2018 Fenics Revenue Breakdown2
Overall Fenics revenues up 17%3; Fenics brokerage revenues increased 15% year-over-year in 1Q 2018
1Q 2018 Fenics revenues comprised 13% of total Financial Services revenues versus approximately 3% in 2010 (net
of inter-company eliminations)
Data, software and post-trade revenues up 15% to $15 million
Rates
27%
Credit
27%
FX
8%
Data, software
and post trade
(inter-company)
21%Data, software
and post trade
18%
1. Excludes inter-company revenues and revenues related to eSpeed (sold in June 2013), and revenues related to Trayport (sold in December 2015). Results shown by segment or business exclude
revenues, earnings and/or losses associated with Corporate items.
2. Excludes a de minimis amount of revenues related to equities and other products.
3. Includes inter-company revenues.
BUSINESS OVERVIEW: FENICS
(USD millions)
$48
$71 $78 $81$101
$192$209
$223$232
FY10 FY11 FY12 FY13 FY14 FY15 FY16 FY17 TTM1Q18
Fenics Revenue
34

SELECT FINANCIAL RESULTS OF BGC PARTNERS, INC. (EXCLUDING NEWMARK GROUP, INC.)
1. TTM 1Q 2017 includes Nasdaq payment of $67.0 million in Adjusted Earnings and Adjusted EBITDA, which is no longer reflected in the Financial Services segment for TTM 1Q 2018.
Note: These figures reflect BGC Financial Services segment plus its pro-rata portion of corporate items.
Note: See the section titled “Non-GAAP Financial Measures” on page 2.
Pre-tax Adjusted Earnings and Adjusted EBITDA for BGCP (excluding Newmark Group, Inc.) stand-alone
results, increased 43.0% and 43.8%, respectively, in 1Q 2018 on a year-over-year basis
Financial Results Highlight of BGC Partners, Inc. (excluding
Newmark Group, Inc.)1Q 2018 1Q 2017
Change
(%)
1Q 2018
TTM
1Q 2017
TTM
Change
(%)
Revenues $524.8 $449.5 16.8% $1,826.3 $1,577.6 15.8%
Pre-tax Adjusted Earnings before non-controlling interest in
subsidiaries and taxes121.0 84.6 43.0% 336.0 328.5 2.3%
Pre-tax Adjusted Earnings - Excluding Nasdaq payments1 121.0 84.6 43.0% 336.0 261.5 28.5%
Adjusted EBITDA before allocations to units 158.5 110.2 43.8% 419.4 448.8 -6.6%
Adjusted EBITDA before allocations to units - Excluding Nasdaq
payment1 158.5 110.2 43.8% 419.4 381.8 9.8%
Pre-tax Adjusted Earnings margin 23.1% 18.8% 18.4% 20.8%
Pre-tax Adjusted Earnings margin - Excluding Nasdaq payment1 23.1% 18.8% 18.4% 16.6%
(USD millions)
35

FINANCIAL REVIEW

$584 $652
$748
20.1% 19.5% 21.2%
$0
$200
$400
$600
$800
2016 2017 2018 TTM
Adjusted EBITDA Adjusted EBITDA Margin
Revenue and Other Income1
Adjusted EBITDA
1. Total revenue per GAAP as previously presented including other income (loss).
Note: Certain numbers may not add due to rounding.
Note: See the section titled “Non-GAAP Financial Measures” on page 2.
Consistently grown revenues and Adjusted EBITDA
Profitability continues to be enhanced by:
Accretive hiring of new brokers
Successfully integrating bolt-on
acquisitions with similar
business models
Ongoing conversion to fully electronic improving margins
Increase in average revenue per broker (10% YoY in 2017 and 17% in 1Q 2018)
(USD
mill
ions)
(USD
mill
ions)
REVENUE AND ADJUSTED EBITDA GROWTH
$2,908$3,353 $3,527
$108$105 $139$3,016
$3,458 $3,665
$0
$1,000
$2,000
$3,000
$4,000
2016 2017 TTM 1Q 2018
GAAP Total Revenue Other Income (Loss)
37

Pre-tax margins were 19.3% in 1Q 2018 vs. 15.2% in 1Q 2017
Non-compensation expenses include $18 million due to the impact of ASC 606 on Newmark’s pass-through revenues and non-
compensation expenses
$1,705$1,925
$459 $533
58.6% 57.4% 58.7% 55.8%
0%
10%
20%
30%
40%
50%
60%
70%
$0
$500
$1,000
$1,500
$2,000
$2,500
FY 2016 FY 2017 1Q 2017 1Q 2018
(USD
mill
ions)
Compensation and Employee Benefits Compensation and Employee Benefits as % of Total Revenue
Note: % of revenue numbers do not sum primarily due to the large amount of other income related to the Nasdaq earn-out.
Note: See the section titled “Non-GAAP Financial Measures” on page 2.
16.4% 18.5%15.2%
19.3%
23.6% 23.6% 23.1%24.5%
0%
5%
10%
15%
20%
25%
30%
35%
0%
5%
10%
15%
20%
25%
30%
FY 2016 FY 2017 1Q 2017 1Q 2018
Pre-tax Margin Non-compensation Expense as a % of Total Revenue
ADJUSTED EARNINGS EXPENSE & PRE-TAX MARGIN TRENDS
38

BGC Partners, Inc.
(Consolidated)
BGC Partners, Inc. (excl.
Newmark Group Inc.)
Cash and Cash Equivalents $362,613 $314,544
Repurchase Agreements (985) (985)
Securities Owned 89,357 89,357
Marketable Securities (net) 3,496 3,496
Total Liquidity1 $454,481 $406,412
Issuer Maturity
8.375% Senior Notes GFI 07/19/2018 $241,323 $241,323
Unsecured senior converted term loan credit agreement BGC / NMRK2 09/08/2019 397,709 -
5.375% Senior Notes BGC / NMRK2 12/09/2019 298,310 -
5.125% Senior Notes BGC 05/27/2021 297,198 297,198
Collateralized Borrowings BGC 05/31/2021 31,976 31,976
8.125% Senior Notes3
BGC / NMRK2
06/15/2042 109,427 -
Total Notes payable and other borrowings $1,375,943 $570,497
Credit Ratios (Adj. EBITDA and Ratios as of TTM 1Q 2018)
Adjusted EBITDA $747,783 $397,756
Leverage Ratio: Total Notes payable and other borrowings / Adjusted EBITDA 1.8x 1.4x
Net Leverage Ratio: Net Notes payable and other borrowings / Adjusted EBITDA 1.2x 0.4x
Adjusted EBITDA / Interest Expense4 8.4x 10.1x
As of 3/31/2018
1. As of March 31, 2018, $92.6 million of Marketable Securities on our balance sheet were lent out in Securities Loaned transactions and therefore are not included in Total Liquidity.
2. Debt assumed by Newmark Group, Inc. in connection with the Newmark IPO and proposed tax-free spin-off.
3. Callable at par beginning June 26, 2017.
4. Interest expense excludes $22.1 million of operating interest on Warehouse notes payable. In addition, BGC Partners, Inc. (excluding Newmark Group Inc.) Interest expense excludes $31.1 million
of interest incurred prior to the Newmark IPO on the debt assumed by Newmark.
Note: BGC’s balance sheet does not reflect the impact of the Nasdaq monetization transaction (see section titled “Nasdaq monetization” in this document). BGC’s balance sheet also does not include the
more than $650 million worth of remaining seven Nasdaq earn-outs (based on June 18, 2018 closing price) expected to be received from 2021 through 2027.
This table does not include short-term borrowings, of which there were $202 million of inter-company debt related to Newmark’s credit facility with BGC as of March 31, 2018.
See the section titled “Non-GAAP Financial Measures” on page 2.
STRONGLY CAPITALIZED; INVESTMENT GRADE CREDIT PROFILE
(USD $000s)
39

1. Class A shares owned by employees only includes restricted shares. Any Class A share owned by an employee without restriction is included in the “Class A owned by Public”.
2. Partnership units owned by employees include founding/working partner units and limited partnership units. In conjunction with the proposed spin-off of Newmark, the Partnership units are owned by
employees of both Newmark and BGC. Over time, virtually all of the partners of Newmark are expected to only own units and/or shares of Newmark and virtually all of the partners of BGC are
expected to only own units and/or shares of BGC. Going forward, partners of BGC will be compensated with BGC partnership units and partners of Newmark will be compensated with Newmark
partnership units.
3. Excludes approximately 1.7 million standalone LPUs, 0.5 million standalone FPUs, 2.1 million standalone Cantor units, and 0.1 million standalone other units owned by employees. After the spin-off of
Newmark, these standalone BGC limited partnership interests can then become exchangeable into BGC Class A or Class B common stock.
4. These primarily represent contingent shares and/or units for which all necessary conditions have been satisfied except for the passage of time.
5. Includes 15.8 million Cantor distribution rights.
BGC Partners, Inc. Fully Diluted Share Count Summary Fully-diluted
(as of March 31, 2018) Shares (MM) Ownership (%)
Class A owned by Public 247.2 51%
Class A owned by executives, board members and employees1 17.4 4%
Partnership units owned by employees2,3
112.6 23%
Other owned by employees3,4
5.0 1%
Class A owned by Cantor 14.7 3%
Class B owned by Cantor 34.8 7%
Partnership units owned by Cantor3,5 50.3 10%
Total 482.0 100%
BGC Partners, Inc. Fully Diluted Share Count Summary Fully-diluted
(as of March 31, 2018) Shares (MM) Ownership (%)
Public 247.2 51%
Employees 134.9 28%
Cantor 99.8 21%
BGC’S FULLY DILUTED SHARE COUNT SUMMARY AS OF MARCH 31, 2018
40

CORPORATE SOCIAL RESPONSIBILITY
41

CHARITY DAY
CHARITY DAY
• Distributes 100 percent of firms’ revenues on September 11th to hundreds of charities around the world
• Raised $147 million globally since its inception
• Celebrity ambassadors volunteer to broker trades with proceeds going to charities
THE CANTOR FITZGERALD RELIEF FUND
• Contributed to Hurricane Harvey, the California Wildfires, Hurricane Sandy, Hurricane Katrina, the Haiti
earthquake and many other critical relief efforts and causes
42

CORPORATE SOCIAL RESPONSIBILITY (CONTINUED)
DIVERSITY RECRUITMENT PROGRAMS
Hampton Fellowships for HBCU recruiting (provide Street comparable salary, housing and travel for
selected interns from under-represented groups)
NETWORK OF WOMEN (NOW)
Introduced to support the recruitment, development and retention of women across the organization
Provides opportunities for female employees to expand networks and develop new skills
SUSTAINABILITY AND GREEN INITIATIVES
BGC Environmental Brokerage Services, with its roots beginning in 1992, is the oldest environmental
brokerage business in existence and specializes in emission, renewable energy and emerging environmental
product markets
BGC offers Green-e renewable energy certificates (REC) and carbon offsets to public and private
institutions for greening up their electricity usage
Newmark uses EnergyStar and LEED to benchmark “green” performance of its properties
Newmark has Green Centers of Excellence in three key global markets: India, Europe and North America
43

ADJUSTED EARNINGS DEFINED
Adjusted Earnings Defined
BGC Partners uses non-GAAP financial measures including, but not limited to, “pre-tax Adjusted Earnings” and “post-tax Adjusted Earnings,” which are
supplemental measures of operating results that are used by management to evaluate the financial performance of the Company and its consolidated subsidiaries.
BGC believes that Adjusted Earnings best reflect the operating earnings generated by the Company on a consolidated basis and are the earnings which management
considers when managing its business.
As compared with “income (loss) from operations before income taxes”, and “net income (loss) per fully diluted share”, all prepared in accordance with GAAP,
Adjusted Earnings calculations primarily exclude certain non-cash items and other expenses that generally do not involve the receipt or outlay of cash by the
Company and/or which do not dilute existing stockholders, as described below. In addition, Adjusted Earnings calculations exclude certain gains and charges that
management believes do not best reflect the ordinary results of BGC.
Adjustments Made to Calculate Pre-Tax Adjusted Earnings
BGC defines pre-tax Adjusted Earnings as GAAP income (loss) from operations before income taxes and noncontrolling interest in subsidiaries, excluding items
such as:
The impact of any unrealized non-cash mark-to-market gains or losses on “other income (loss)” related to the variable share forward (the “Nasdaq
Forward”) agreement with respect to Newmark’s expected receipt of the Nasdaq payments in 2019 and 2020;
Non-cash asset impairment charges, if any;
Allocations of net income to limited partnership units;
Non-cash charges related to the amortization of intangibles with respect to acquisitions; and
Non-cash charges relating to grants of exchangeability to limited partnership units that reflect the value of the shares of common stock into which the unit is
exchangeable when the unit holder is granted exchangeability not previously expensed in accordance with GAAP.
Virtually all of BGC’s key executives and producers have partnership or equity stakes in the Company and receive deferred equity or limited partnership units as
part of their compensation. A significant percentage of the Company’s fully diluted shares are owned by its executives, partners and employees. The Company issues
limited partnership units and grant exchangeability to unit holders to provide liquidity to its employees, to align the interests of its employees and management with
those of common stockholders, to help motivate and retain key employees, and to encourage a collaborative culture that drives cross-selling and revenue growth.
When the Company issues limited partnership units, the shares of common stock into which the units can be ultimately exchanged are included in BGC’s fully
diluted share count for Adjusted Earnings at the beginning of the subsequent quarter after the date of grant. BGC includes such shares in the Company’s fully diluted
share count when the unit is granted because the unit holder is expected to be paid a pro-rata distribution based on BGC’s calculation of Adjusted Earnings per fully
diluted share and because the holder could be granted the ability to exchange their units into shares of common stock in the future. Non-cash charges with respect
to grants of exchangeability reflect the value of the shares of common stock into which the unit is exchangeable when the unit holder is granted exchangeability not
previously expensed in accordance with GAAP. The amount of non-cash charges relating to grants of exchangeability the Company uses to calculate pre-tax
Adjusted Earnings on a quarterly basis is based upon the Company’s estimate of expected grants of exchangeability to limited partnership units during the annual
period, as described further below under “Adjustments Made to Calculate Post-Tax Adjusted Earnings.”
44

ADJUSTED EARNINGS DEFINED (CONTINUED)
Adjusted Earnings also excludes non-cash GAAP gains attributable to originated mortgage servicing rights (which Newmark refer to as “OMSRs”) and non-cash
GAAP amortization of mortgage servicing rights (which the Company refers to as “MSRs”). Under GAAP, the Company recognizes OMSRs gains equal to the fair
value of servicing rights retained on mortgage loans originated and sold. Subsequent to the initial recognition at fair value, MSRs are carried at the lower of
amortized cost or fair value and amortized in proportion to the net servicing revenue expected to be earned. However, it is expected that any cash received with
respect to these servicing rights, net of associated expenses, will increase Adjusted Earnings (and Adjusted EBITDA) in future periods.
Additionally, Adjusted Earnings calculations exclude certain unusual, one-time, non-ordinary or non-recurring items, if any. These items are excluded from Adjusted
Earnings because the Company views excluding such items as a better reflection of the ongoing operations of BGC. BGC’s definition of Adjusted Earnings also
excludes certain gains and charges with respect to acquisitions, dispositions, or resolutions of litigation. Management believes that excluding such gains and charges
also best reflects the ongoing performance of BGC.
Adjustments Made to Calculate Post-Tax Adjusted Earnings
Because Adjusted Earnings are calculated on a pre-tax basis, BGC also intends to report post-tax Adjusted Earnings on a consolidated basis. The Company defines
post-tax Adjusted Earnings as pre-tax Adjusted Earnings reduced by the non-GAAP tax provision described below and Adjusted Earnings attributable to
noncontrolling interest in subsidiaries.
The Company calculates its tax provision for post-tax Adjusted Earnings using an annual estimate similar to how it accounts for its income tax provision under
GAAP. To calculate the quarterly tax provision under GAAP, BGC estimates its full fiscal year GAAP income (loss) from operations before income taxes and
noncontrolling interests in subsidiaries and the expected inclusions and deductions for income tax purposes, including expected grants of exchangeability to limited
partnership units during the annual period. The resulting annualized tax rate is applied to BGC’s quarterly GAAP income (loss) from operations before income taxes
and noncontrolling interests in subsidiaries. At the end of the annual period, the Company updates its estimate to reflect the actual tax amounts owed for the
period.
To determine the non-GAAP tax provision, BGC first adjusts pre-tax Adjusted Earnings by recognizing any, and only, amounts for which a tax deduction applies
under applicable law. The amounts include non-cash charges with respect to grants of exchangeability; certain charges related to employee loan forgiveness; certain
net operating loss carryforwards when taken for statutory purposes; certain charges related to tax goodwill amortization; and deductions with respect to charitable
contributions. These adjustments may also reflect timing and measurement differences, including treatment of employee loans, changes in the value of units between
the dates of grants of exchangeability and the date of actual unit exchange, variations in the value of certain deferred tax assets and liabilities and the different timing
of permitted deductions for tax under GAAP and statutory tax requirements.
After application of these previously described adjustments, the result is the Company’s taxable income for its pre-tax Adjusted Earnings, to which BGC then applies
the statutory tax rates. This amount is the Company’s non-GAAP tax provision. BGC views the effective tax rate on pre-tax Adjusted Earnings as equal to the
amount of its non-GAAP tax provision divided by the amount of pre-tax Adjusted Earnings.
45

ADJUSTED EARNINGS DEFINED (CONTINUED)
Generally, the most significant factor affecting this non-GAAP tax provision is the amount of non-cash charges relating to the grants of exchangeability to limited
partnership units. Because the non-cash charges relating to the grants of exchangeability are deductible in accordance with applicable tax laws, increases in
exchangeability have the effect of lowering the Company’s non-GAAP effective tax rate and thereby increasing its post-tax Adjusted Earnings.
Management uses post-tax Adjusted Earnings in part to help it evaluate, among other things, the overall performance of the business, to make decisions with respect
to the Company’s operations, and to determine the amount of dividends payable to common stockholders and distributions payable to holders of limited
partnership units.
BGC incurs income tax expenses based on the location, legal structure and jurisdictional taxing authorities of each of its subsidiaries. Certain of the Company’s
entities are taxed as U.S. partnerships and are subject to the Unincorporated Business Tax (“UBT”) in New York City. Any U.S. federal and state income tax liability
or benefit related to the partnership income or loss, with the exception of UBT, rests with the unit holders rather than with the partnership entity. The Company’s
consolidated financial statements include U.S. federal, state and local income taxes on the Company’s allocable share of the U.S. results of operations. Outside of the
U.S., BGC operates principally through subsidiary corporations subject to local income taxes. For these reasons, taxes for Adjusted Earnings are expected to be
presented to show the tax provision the consolidated Company would expect to pay if 100 percent of earnings were taxed at global corporate rates.
Adjusted Earnings Attributable to Noncontrolling Interest in Subsidiaries
Adjusted Earnings attributable to noncontrolling interest in subsidiaries is calculated based on the relevant noncontrolling interest existing on the balance sheet date.
Until the proposed spin-off of Newmark occurs, noncontrolling interest will reflect the allocation of income to Newmark’s public shareholders and the pro-rata
ownership of certain shares and/or units of BGC and Newmark.
Calculations of Pre-Tax and Post-Tax Adjusted Earnings per Common Share
BGC’s Adjusted Earnings per common share calculations assume either that:
The fully diluted share count includes the shares related to any dilutive instruments, but excludes the associated expense, net of tax, when the impact would
be dilutive; or
The fully diluted share count excludes the shares related to these instruments, but includes the associated expense, net of tax.
The share count for Adjusted Earnings excludes certain shares expected to be issued in future periods but not yet eligible to receive dividends and/or distributions.
Each quarter, the dividend payable to BGC’s common stockholders, if any, is expected to be determined by the Company’s Board of Directors with reference to a
number of factors, including post-tax Adjusted Earnings per common share. BGC may also pay a pro-rata distribution of net income to limited partnership units, as
well as to Cantor for its noncontrolling interest. The amount of this net income, and therefore of these payments per unit, would be determined using the above
definition of post-tax Adjusted Earnings per common share.
The declaration, payment, timing and amount of any future dividends payable by the Company will be at the discretion of its board of directors.
46

ADJUSTED EARNINGS DEFINED (CONTINUED)
Other Matters with Respect to Adjusted Earnings
The term “Adjusted Earnings” should not be considered in isolation or as an alternative to GAAP net income (loss). The Company views Adjusted Earnings as a
metric that is not indicative of liquidity or the cash available to fund its operations, but rather as a performance measure. Pre- and post-tax Adjusted Earnings, as
well as related measures, are not intended to replace the Company’s presentation of its GAAP financial results. However, management believes that these measures
help provide investors with a clearer understanding of BGC’s financial performance and offer useful information to both management and investors regarding certain
financial and business trends related to the Company’s financial condition and results of operations. Management believes that Adjusted Earnings measures and the
GAAP measures of financial performance should be considered together.
BGC anticipates providing forward-looking guidance for GAAP revenues and for certain Adjusted Earnings measures from time to time. However, the Company
does not anticipate providing an outlook for other GAAP results. This is because certain GAAP items, which are excluded from Adjusted Earnings, are difficult to
forecast with precision before the end of each period. The Company therefore believes that it is not possible to forecast GAAP results or to quantitatively reconcile
GAAP results to non-GAAP results with sufficient precision unless BGC makes unreasonable efforts. The items that are difficult to predict on a quarterly basis with
precision and which can have a material impact on the Company’s GAAP results include, but are not limited, to the following:
Allocations of net income and grants of exchangeability to limited partnership units, which are determined at the discretion of management throughout and
up to the period-end;
The impact of certain marketable securities, as well as any gains or losses related to associated mark-to- market movements and/or hedging, including with
respect to the Nasdaq Forward. These items are calculated using period-end closing prices;
Non-cash asset impairment charges, which are calculated and analyzed based on the period-end values of the underlying assets. These amounts may not be
known until after period-end; and
Acquisitions, dispositions and/or resolutions of litigation, which are fluid and unpredictable in nature.
Please see our most recent financial results press release available at http://ir.bgcpartners.com/Investors/default.aspx for a discussion of Adjusted Earnings and
adjusted EBITDA and reconciliations of these items, as well as liquidity, to GAAP results, and for more information on BGC’s non-GAAP results.
47

ADJUSTED EBITDA DEFINED
Adjusted EBITDA and Adjusted EBITDA Before Allocations to Units Defined
BGC also provides an additional non-GAAP financial performance measure, “Adjusted EBITDA”, which it defines as GAAP “Net income (loss) available to common
stockholders”, adjusted to add back the following items:
Interest expense;
Fixed asset depreciation and intangible asset amortization;
Impairment charges;
Employee loan amortization and reserves on employee loans;
Provision (benefit) for income taxes;
Net income (loss) attributable to noncontrolling interest in subsidiaries;
Non-cash charges relating to grants of exchangeability to limited partnership interests;
Non-cash charges related to issuance of restricted shares;
Non-cash earnings or losses related to BGC’s equity investments; and
Net non-cash GAAP gains related to OMSR gains and MSR amortization.
The Company also discloses “Adjusted EBITDA before allocations to units”, which is Adjusted EBITDA excluding GAAP charges with respect to allocations of net
income to limited partnership units. Such allocations represent the pro-rata portion of pre-tax earnings available to such unit holders. These units are in the fully
diluted share count, and are exchangeable on a one-to-one basis into common stock. As these units are exchanged into common shares, unit holders become
entitled to cash dividends rather than cash distributions. The Company views such allocations as intellectually similar to dividends on common shares. Because
dividends paid to common shares are not an expense under GAAP, management believes similar allocations of income to unit holders should also be excluded by
investors when analyzing BGC’s results on a fully diluted share basis with respect to Adjusted EBITDA.
The Company’s management believes that these Adjusted EBITDA measures are useful in evaluating BGC’s operating performance, because the calculation of this
measure generally eliminates the effects of financing and income taxes and the accounting effects of capital spending and acquisitions, which would include
impairment charges of goodwill and intangibles created from acquisitions. Such items may vary for different companies for reasons unrelated to overall operating
performance. As a result, the Company’s management uses these measures to evaluate operating performance and for other discretionary purposes. BGC believes
that Adjusted EBITDA is useful to investors to assist them in getting a more complete picture of the Company’s financial resu lts and operations.
Since these Adjusted EBITDA measures are not recognized measurements under GAAP, investors should use these measures in addition to GAAP measures of net
income when analyzing BGC’s operating performance. Because not all companies use identical EBITDA calculations, the Company’s presentation of these Adjusted
EBITDA measures are may not be comparable to similarly titled measures of other companies. Furthermore, these Adjusted EBITDA measures are not intended to
be a measure of free cash flow or GAAP cash flow from operations, because these Adjusted EBITDA measures do not consider certain cash requirements, such as
tax and debt service payments.
For a reconciliation of these non-GAAP measures to GAAP “Net income (loss) available to common stockholders”, the most comparable financial measure
calculated and presented in accordance with GAAP, see the section of this document titled “Reconciliation of GAAP Income (Loss) to Adjusted EBITDA”.
48

IMPACT OF ASC 606 NEWMARK’S RESULTS
Impact of ASC 606 on Newmark’s Future Results
As was discussed in BGC’s financial results press release dated February 9, 2018: From 2014 through 2016, the Financial Accounting Standards Board (“FASB”)
issued several accounting standard updates, which together comprise Accounting Standards Codification Topic 606, Revenue from Contracts with Customers
(“ASC 606”). Beginning in the first quarter of 2018, the Company is recording its financial results to conform to ASC 606. ASC 606 does not currently impact the
results of BGC’s Financial Services segment, but does impact the results of Newmark. The consolidated Company has elected to adopt the guidance using the
modified retrospective approach to ASC 606, under which the consolidated Company applied the new standard only to new contracts initiated on or after January
1, 2018 and recorded the transition adjustments as part of “Total equity”.
Due to the adoption of ASC 606, for all periods from the first quarter of 2018 onward, Newmark did not and will not record revenues or earnings related to
“Leasing and other commissions” with respect to contingent revenue expected to be received in future periods as of December 31, 2017, in relation to contracts
signed prior to January 1, 2018, for which services have already been completed. Instead, the Company recorded this contingent revenue and related commission
payments on the balance sheet on January 1, 2018, with a corresponding pre-tax improvement of approximately $23 million to “Total equity”. Over time, the
Company expects to receive $23 million of cash related to these “Leasing and other commissions” receivables, primarily over the course of 2018 and 2019. This
cash, however, will not be recorded as GAAP net income, Adjusted Earnings, or Adjusted EBITDA.
The adoption of ASC 606 also impacted the consolidated Company’s recognition of revenue from its outsourcing businesses, which are recorded as part of “Real
estate management and other services.” Implementation of the updated principal versus agent considerations under ASC 606 increased the proportion of
reimbursable non-compensation expenses related to the Company’s outsourcing business accounted for as revenue on a gross basis. This resulted in an increase in
revenue and a corresponding increase in cost of revenue, with no impact on earnings for periods from January 1, 2018 onward. For the first quarter of 2018, this
increased Newmark’s management services revenues by approximately $18 million, with a corresponding increase in non-compensation costs attributable to these
revenues. Because BGC’s financial results consolidate those of Newmark, the consolidated Company’s quarterly revenues and expenses increased by the same
amount.
For additional information regarding the adoption of ASC 606, please see the section titled “Recently Adopted Accounting Pronouncements” in both BGC’s and
Newmark’s Quarterly Reports on Forms 10-Q as filed with the Securities and Exchange Commission.
49

PROPOSED SPIN-OFF OF NEWMARK
Proposed Spin-Off of Newmark
BGC expects to pursue a distribution to its stockholders of all of the Class A common shares and Class B common shares of Newmark (collectively, the “Newmark
common shares”) that BGC then owns in a manner that is intended to qualify as generally tax-free for U.S. federal income tax purposes (the “spin-off”). As currently
contemplated, shares of Class A common stock of Newmark held by BGC would be distributed to the holders of shares of Class A common stock of BGC, and
shares of Class B common stock of Newmark held by BGC would be distributed to the holders of shares of Class B common stock of BGC.
Had the spin-off occurred immediately following close of the first quarter of 2018, the ratio of Newmark common shares to be distributed in respect of each BGC
common share would have been approximately 0.4702. However, the exact ratio of Newmark common shares to be distributed in respect of each BGC common
share in the spin-off will depend on, among other things, the number of BGC common shares outstanding and the number of Newmark common shares (including
Newmark common shares underlying units of Newmark Partners, L.P.) owned by BGC as of the record date of the spin-off. The spin-off is subject to a number of
conditions, and BGC may determine not to proceed with the spin-off if the BGC board of directors determines, in its sole discretion, that the spin-off is not in the
best interest of the Company and its stockholders. Accordingly, the spin-off may not occur on any expected timeframe, or at all.
For additional information regarding the proposed spin-off, please see the sections titled “Item 1—Business—Structure of Newmark—Structure of Newmark
Following the Separation and Newmark IPO” in BGC’s Annual Report on Form 10-K as well the sections titled "Item 13—Certain Relationships and Related
Transactions, and Director Independence—Separation and Distribution Agreement—The Distribution” and “Item 13—Certain Relationships and Related
Transactions, and Director Independence—Separation and Distribution Agreement— BGC Partners Contribution of Newmark OpCo Units Prior to the
Distribution” in Newmark’s amended 2017 annual report on Form 10-K/A for additional information regarding the proposed spin-off.
50

RECONCILIATION OF GAAP INCOME (LOSS) TO ADJUSTED EARNINGS AND GAAP FULLY DILUTED EPS TO POST-TAX ADJUSTED EPS
(IN THOUSANDS, EXCEPT PER SHARE DATA) (UNAUDITED)
(a) Q1 2018 includes $20.6 million of a GAAP fair value adjustment on an investment held by BGC, which was excluded from Adjusted Earnings.
Note: Certain numbers may not add due to rounding.
Q1 2018 Q1 2017
GAAP income (loss) before income taxes 133,194$ 57,794$
Pre-tax adjustments:
Non-cash (gains) losses related to equity investments, net (2,625) (237)
Allocations of net income and grant of exchangeability to limited partnership units and FPUs 65,232 63,193
Non-cash MSR income, net of amortization (3,273) (15,434)
(Gains) and charges with respect to acquisitions, dispositions and / or resolutions of litigation, and other non-cash, non-dilutive items, net (a) (7,843) 14,007
Total pre-tax adjustments 51,491 61,529
Pre-tax adjusted earnings 184,685$ 119,323$
GAAP net income (loss) available to common stockholders 58,774$ 36,825$
Allocation of net income (loss) to noncontrolling interest in subsidiaries 29,710 14,529
Total pre-tax adjustments (from above) 51,491 61,529
Income tax adjustment to reflect adjusted earnings taxes 14,340 (9,804)
Post-tax adjusted earnings 154,315$ 103,079$
Per Share Data
GAAP fully diluted earnings per share 0.19 0.13
Less: Allocations of net income to limited partnership units, FPUs, and noncontrolling interest in subsidiaries, net of tax (0.01) (0.02)
Total pre-tax adjustments (from above) 0.11 0.14
Income tax adjustment to reflect adjusted earnings taxes 0.03 (0.02)
Post-tax adjusted earnings per share 0.32$ 0.23$
Fully diluted weighted-average shares of common stock outstanding 478,935 444,826
51

DIVIDEND POLICIES
BGC Partners Dividend Policy
Our board of directors has authorized a dividend policy which provides that we expect to pay a quarterly cash dividend to our common stockholders based on
our “post-tax adjusted earnings per fully diluted share.” Our board of directors declared a dividend of 18 cents per share for the first quarter of 2018 and has
indicated that it expects to maintain such 18 cent quarterly dividend until the completion of the proposed distribution. The balance of any remaining adjusted
earnings will be available to repurchase shares of our Class A common stock or redeem or purchase BGC Holdings limited partnership interests or other equity
interests in our subsidiaries, including from Cantor, our executive officers, other employees, partners and others. Please see above for a detailed definition of “post-tax
adjusted earnings per fully diluted share.”
Our board of directors and our Audit Committee have authorized repurchases of shares of our Class A common stock and redemptions of BGC Holdings
limited partnership interests or other equity interests in us or in subsidiaries, including Newmark and its subsidiaries, from Cantor, our executive officers, other
employees, partners and others. As of March 31, 2018, we had approximately $172.2 million remaining under this authorization and may continue to actively make
repurchases or purchases, or cease to make such repurchases or purchases, from time to time.
We expect to pay such dividends, if and when declared by our board of directors, on a quarterly basis. The dividend to our common stockholders is expected
to be calculated based on post-tax adjusted earnings allocated to us and generated over the fiscal quarter ending prior to the record date for the dividend. No
assurance can be made, however, that a dividend will be paid each quarter.
The declaration, payment, timing and amount of any future dividends payable by us will be at the sole discretion of our board of directors. We are a holding
company, with no direct operations, and therefore we are able to pay dividends only from our available cash on hand and funds received from distributions from
BGC U.S. and BGC Global and dividends from Newmark and distributions from Newmark Holdings and Newmark OpCo. Please see below “Newmark Dividend
Policy.” Our ability to pay dividends may also be limited by regulatory considerations as well as by covenants contained in financing or other agreements. In
addition, under Delaware law, dividends may be payable only out of surplus, which is our net assets minus our capital (as defined under Delaware law), or, if we
have no surplus, out of our net profits for the fiscal year in which the dividend is declared and/or the preceding fiscal year. Accordingly, any unanticipated
accounting, tax, regulatory or other charges against net income may adversely affect our ability to declare and pay dividends. While we intend to declare and pay
dividends quarterly, there can be no assurance that our board of directors will declare dividends at all or on a regular basis or that the amount of our dividends will
not change.
Newmark Dividend Policy
Newmark’s board of directors has authorized a dividend policy that reflects its intention to pay a quarterly dividend, starting with the first quarter of 2018.
Any dividends to Newmark’s common stockholders will be calculated based on its expected post-tax Adjusted Earnings per fully diluted share, as a measure of net
income for the year. See Newmark’s 10-Q for a definition of “post-tax Adjusted Earnings” per fully diluted share.
Newmark currently expects that, in any year, its aggregate quarterly dividends will be equal to or less than its estimate at the end of the first quarter of such
year of 25% of its post-tax Adjusted Earnings per fully diluted share to its common stockholders for such year. The declaration, payment, timing and amount of any
future dividends payable by Newmark will be at the discretion of its board of directors; provided that any dividend to its common stockholders that would result in
the dividends for a year exceeding 25% of its post-tax Adjusted Earnings per fully diluted share for such year shall require the consent of the holder of a majority of
the Newmark Holdings exchangeable limited partnership interests, which is currently Cantor.
For the first quarter of 2018, Newmark’s board of directors declared a dividend of 9 cents per share based on management’s current expectation of its post-tax
Adjusted Earning per fully diluted share for the year, and has indicated that it expects such dividend to remain consistent for the full year. To the extent that
25% of Newmark’s post-tax Adjusted Earnings per fully diluted share for the year exceeds this dividend on an annualized basis (i.e. an expected aggregate of $0.36
for four quarters), Newmark does not expect that its board of directors will increase the amount of the quarterly dividend payment during the year, or make
downward adjustments in the event of a shortfall, although no assurance can be given that adjustments will not be made during the year. Newmark has indicated
that it expects to announce the annual expected dividend rate in the first quarter of each year.
52

RECONCILIATION OF GAAP INCOME (LOSS) TO ADJUSTED EARNINGS AND GAAP FULLY DILUTED EPS TO POST-TAX ADJUSTED EPS
(IN THOUSANDS) (UNAUDITED)
(a) Q1 2018 includes $20.6 million of a GAAP fair value adjustment on an investment held by BGC, which was excluded from Adjusted Earnings.
Note: Certain numbers may not add due to rounding.
TTM Q1 2018 TTM Q1 2017
GAAP income (loss) before income taxes 307,397$ 340,551$
Pre-tax adjustments:
Non-cash (gains) losses related to equity investments, net (8,577) (2,892)
Allocations of net income and grant of exchangeability to limited partnership units and FPUs 288,667 223,203
Non-cash MSR income, net of amortization (36,290) (79,136)
(Gains) and charges with respect to acquisitions, dispositions and / or resolutions of litigation, and other non-cash, non-dilutive items, net (a) 134,654 40,077
Total pre-tax adjustments 378,454 181,252
Pre-tax adjusted earnings 685,851$ 521,803$
GAAP net income (loss) available to common stockholders 73,424$ 201,395$
Allocation of net income (loss) to noncontrolling interest in subsidiaries 40,900 75,761
Total pre-tax adjustments (from above) 378,454 181,252
Income tax adjustment to reflect adjusted earnings taxes 106,607 (6,697)
Post-tax adjusted earnings 599,385$ 451,711$
53

RECONCILIATION OF GAAP INCOME (LOSS) TO ADJUSTED EARNINGS AND GAAP FULLY DILUTED EPS TO POST-TAX ADJUSTED EPS
(IN THOUSANDS, EXCEPT PER SHARE DATA) (UNAUDITED)
FY 2017 FY 2016
GAAP income (loss) before income taxes 231,997$ 314,170$
Pre-tax adjustments:
Non-cash (gains) losses related to equity investments, net (6,189) (3,543)
Allocations of net income and grant of exchangeability to limited partnership units and FPUs 286,628 192,934
Non-cash MSR income, net of amortization (48,451) (66,223)
(Gains) and charges with respect to acquisitions, dispositions and / or resolutions of litigation, and
other non-cash, non-dilutive items, net 156,504 39,296
Total pre-tax adjustments 388,492 162,464
Pre-tax adjusted earnings 620,489$ 476,634$
GAAP net income (loss) available to common stockholders 51,475$ 185,022$
Allocation of net income (loss) to noncontrolling interest in subsidiaries 25,719 67,203
Total pre-tax adjustments (from above) 388,492 162,464
Income tax adjustment to reflect adjusted earnings taxes 82,463 (2,000)
Post-tax adjusted earnings 548,149$ 412,689$
Per Share Data
GAAP fully diluted earnings per share 0.17$ 0.65$
Less: Allocations of net income to limited partnership units, FPUs, and noncontrolling interest in
subsidiaries, net of tax (0.00) (0.05)
Total pre-tax adjustments (from above) 0.86 0.38
Income tax adjustment to reflect adjusted earnings taxes 0.18 (0.00)
Post-tax adjusted earnings per share (a) 1.21$ 0.97$
Fully diluted weighted-average shares of common stock outstanding 454,256 433,226
(a) On July 29, 2011, BGC Partners issued $160 million in 4.50 percent Convertible Senior Notes, which matured and were settled for cash and
6.9 thousand Class A common shares in Q3 2016. The adjusted earnings per share calculations above included the potential additional shares
under the if converted method, but excluded the interest expense, net of tax, associated with these Notes during the periods when the Notes
were outstanding.
Note: Certain numbers may not add due to rounding.
54

RECONCILIATION OF GAAP INCOME (LOSS) TO ADJUSTED EBITDA (IN THOUSANDS) (UNAUDITED)
(1) The Interest expense add back for Adjusted EBITDA excludes $3.7 million and $1.9 million for Q1 2018 and Q1 2017, respectively, of operating
interest on Warehouse notes payable.
(2) Represents non-cash and non-dilutive charges relating to grants of exchangeability to limited partnership units.
Q1 2018 Q1 2017
GAAP Net income (loss) available to common stockholders 58,774$ 36,825$
Add back:
Provision (benefit) for income taxes 35,763 6,678
Net income (loss) attributable to noncontrolling interest in subsidiaries 38,657 14,291
Employee loan amortization and reserves on employee loans 7,578 7,663
Interest expense (1) 23,446 16,889
Fixed asset depreciation and intangible asset amortization 22,318 19,503
Non-cash MSR income, net of amortization (3,273) (15,434)
Impairment of long-lived assets 56 1,424
Exchangeability charges (2) 56,227 53,793
(Gains) losses on equity investments (2,625) (237)
Adjusted EBITDA 236,921$ 141,395$
Allocations of net income to limited partnership units and FPUs 9,005 9,400
Adjusted EBITDA before allocations to limited partnership units and FPUs 245,926$ 150,795$
55

RECONCILIATION OF GAAP INCOME (LOSS) TO ADJUSTED EBITDA (IN THOUSANDS) (UNAUDITED)
(1) The Interest expense add back for Adjusted EBITDA excludes $22.1 million and $8.5 million for TTM Q1 2018 and TTM Q1 2017, respectively, of
operating interest on Warehouse notes payable.
(2) Represents non-cash and non-dilutive charges relating to grants of exchangeability to limited partnership units.
TTM Q1 2018 TTM Q1 2017
GAAP Net income (loss) available to common stockholders 73,424$ 201,395$
Add back:
Provision (benefit) for income taxes 179,353 62,136
Net income (loss) attributable to noncontrolling interest in subsidiaries 54,620 77,020
Employee loan amortization and reserves on employee loans 61,265 54,421
Interest expense (1) 88,788 63,288
Fixed asset depreciation and intangible asset amortization 85,156 76,137
Non-cash MSR income, net of amortization (36,290) (79,136)
Impairment of long-lived assets 11,990 4,015
Exchangeability charges (2) 238,054 167,403
(Gains) losses on equity investments (8,577) (2,892)
Adjusted EBITDA 747,783$ 623,787$
Allocations of net income to limited partnership units and FPUs 50,613 55,800
Adjusted EBITDA before allocations to limited partnership units and FPUs 798,396$ 679,587$
56

RECONCILIATION OF GAAP INCOME (LOSS) TO ADJUSTED EBITDA (IN THOUSANDS, EXCEPT PER SHARE DATA) (UNAUDITED)
FY 2017 FY 2016
GAAP Net income (loss) available to common stockholders 51,475$ 185,022$
Add back:
Provision (benefit) for income taxes 150,268 60,332
Net income (loss) attributable to noncontrolling interest in subsidiaries 30,254 68,816
Employee loan amortization and reserves on employee loans 61,350 57,417
Interest expense (1) 82,231 59,887
Fixed asset depreciation and intangible asset amortization 82,341 76,606
Non-cash MSR income, net of amortization (48,451) (66,223)
Impairment of long-lived assets 13,358 4,393
Exchangeability charges (2) 235,620 141,392
(Gains) losses on equity investments (6,189) (3,543)
Adjusted EBITDA 652,257$ 584,099$
Allocations of net income to limited partnership units and FPUs 51,008 51,542
Adjusted EBITDA before allocations to limited partnership units and FPUs 703,265$ 635,641$
(1) The Interest expense add back for Adjusted EBITDA excludes $20.3 million and $11.5 million for FY 2017 and FY 2016,
respectively, of operating interest on Warehouse notes payable.
(2) Represents non-cash and non-dilutive charges relating to grants of exchangeability to limited partnership units.
57

LIQUIDITY ANALYSIS (IN THOUSANDS) (UNAUDITED)
March 31, 2018 December 31, 2017 December 31, 2016
Cash and cash equivalents 362,613$ 634,333$ 535,613$
Repurchase agreements (985) - 54,659
Securities owned 89,357 33,007 35,357
Marketable securities (1) 3,496 5,833 164,820
Total 454,481$ 673,173$ 790,449$
(1) As of March 31, 2018 and December 31, 2017, $92.6 million and $202.3 million, respectively, of Marketable securities on our balance
sheet were lent out in Securities loaned transactions and therefore are not included as part of our Liquidity Analysis.
58

RECONCILIATION OF BGCP CONSOLIDATED TO BGCP (EXCLUDING NEWMARK) FOR LIQUIDITY ANALYSIS
(IN THOUSANDS) (UNAUDITED)
March 31, 2018 December 31, 2017 December 31, 2016
BGCP Consolidated Liquidity 454,481$ 673,173$ 790,449$
Less Newmark Liquidity:
Cash and cash equivalents (48,069) (121,027) (66,627)
BGCP Consolidated (Excluding Newmark) Liquidity 406,412$ 552,146$ 723,822$
59
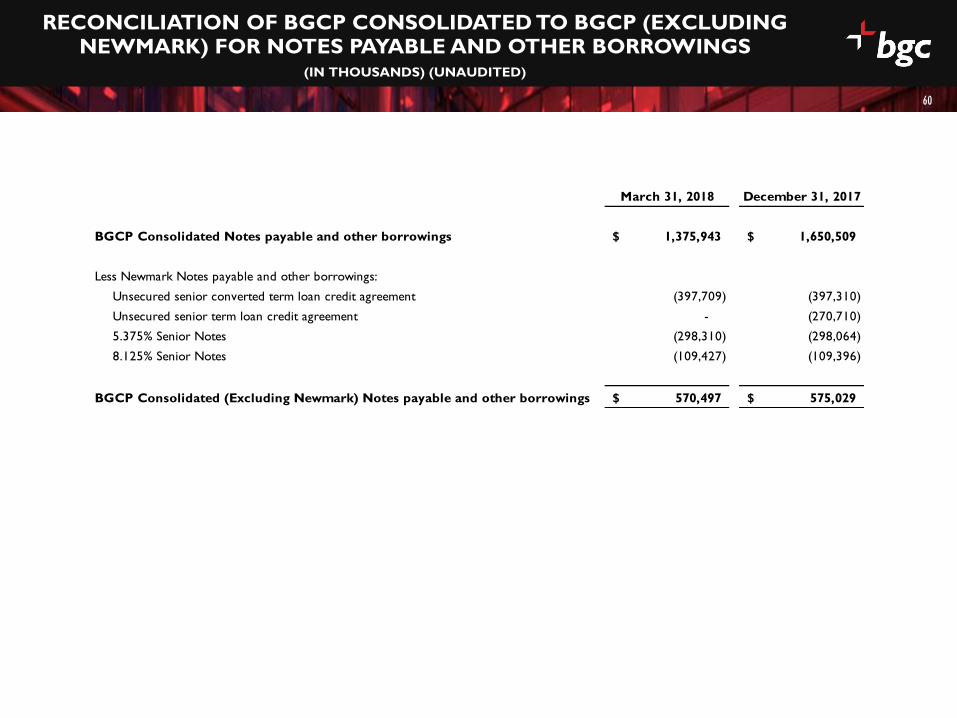
RECONCILIATION OF BGCP CONSOLIDATED TO BGCP (EXCLUDING NEWMARK) FOR NOTES PAYABLE AND OTHER BORROWINGS
(IN THOUSANDS) (UNAUDITED)
March 31, 2018 December 31, 2017
BGCP Consolidated Notes payable and other borrowings 1,375,943$ 1,650,509$
Less Newmark Notes payable and other borrowings:
Unsecured senior converted term loan credit agreement (397,709) (397,310)
Unsecured senior term loan credit agreement - (270,710)
5.375% Senior Notes (298,310) (298,064)
8.125% Senior Notes (109,427) (109,396)
BGCP Consolidated (Excluding Newmark) Notes payable and other borrowings 570,497$ 575,029$
60

RECONCILIATION OF BGCP CONSOLIDATED TO BGCP (EXCLUDING NEWMARK) FOR REVENUES
(IN THOUSANDS) (UNAUDITED)
Summary Q1 2018 Q1 2017
Q1 2018
TTM
Q1 2017
TTM
BGCP Consolidated revenues 956,646 783,193 3,526,809 2,994,716
Real Estate revenues (431,872) (333,720) (1,700,556) (1,417,114)
BGCP Consolidated (Excluding Newmark) revenues 524,774 449,473 1,826,253 1,577,602
Q1 2018 Q1 2017
Q1 2018
TTM
Q1 2017
TTM
BGCP Consolidated revenues 956,646 783,193 3,526,809 2,994,716
Less:
BGC Real Estate segment revenues (431,872) (333,720) (1,699,571) (1,417,047)
BGC Corporate Items relating to Real Estate - - (985) (67)
BGCP Consolidated (Excluding Newmark) revenues 524,774 449,473 1,826,253 1,577,602
61

RECONCILIATION OF BGCP CONSOLIDATED TO BGCP (EXCLUDING NEWMARK) FOR PRE-TAX ADJUSTED EARNINGS
(IN THOUSANDS) (UNAUDITED)
Summary Q1 2018 Q1 2017
Q1 2018
TTM
Q1 2017
TTM
BGCP Consolidated pre-tax adjusted earnings 184,685 119,323 685,852 521,803
Real Estate pre-tax adjusted earnings (63,693) (34,692) (349,895) (193,309)
BGCP Consolidated (Excluding Newmark) pre-tax adjusted earnings 120,992 84,631 335,956 328,494
62
Q1 2018 Q1 2017
Q1 2018
TTM
Q1 2017
TTM
BGCP Consolidated pre-tax adjusted earnings 184,685 119,323 685,852 521,803
BGC Real Estate segment pre-tax adjusted earnings (80,626) (38,475) (374,487) (204,232)
BGC Corporate Items related to Real Estate:
Interest income - - (984) (69)
Compensation and employee benefits 783 560 2,445 771
Fees to related parties 1,361 1,078 4,812 4,422
Professional fees 154 (34)
Interest expense 14,820 2,074 18,084 4,300
Other expenses 25 7 (154) 185
Gains (losses) on equity method investments - - (1,561) -
Total BGC Corporate Items 16,989 3,719 22,796 9,575
Other Consolidation differences Newmark standalone to BGCP (56) 64 1,796 1,348
BGCP Consolidated (Excluding Newmark) pre-tax adjusted earnings 120,992 84,631 335,956 328,494
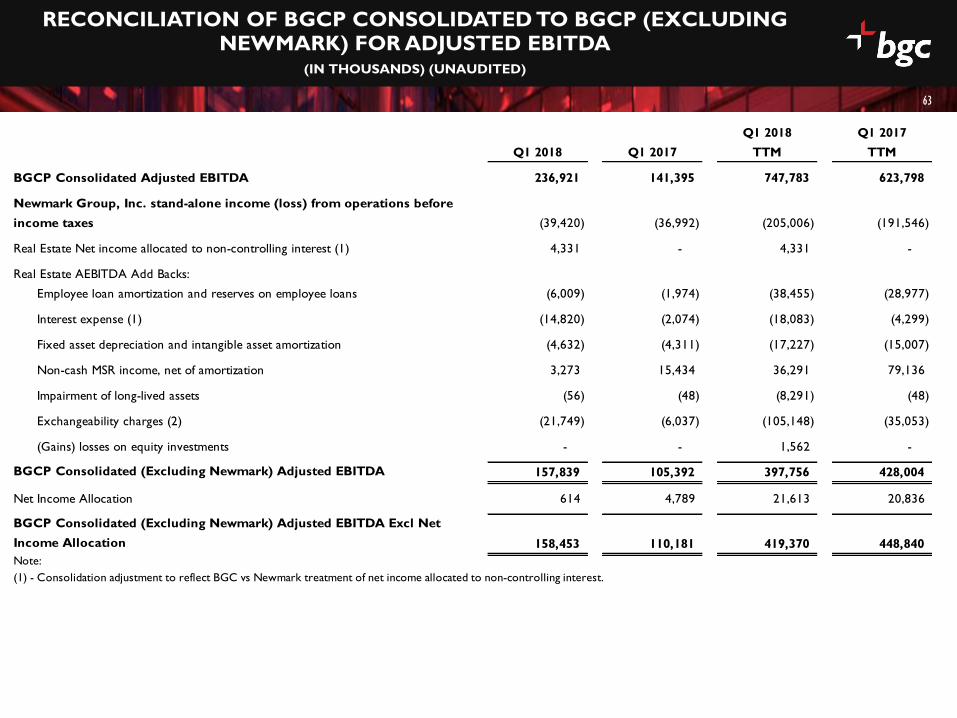
RECONCILIATION OF BGCP CONSOLIDATED TO BGCP (EXCLUDING NEWMARK) FOR ADJUSTED EBITDA
(IN THOUSANDS) (UNAUDITED)
Q1 2018 Q1 2017
Q1 2018
TTM
Q1 2017
TTM
BGCP Consolidated Adjusted EBITDA 236,921 141,395 747,783 623,798
Newmark Group, Inc. stand-alone income (loss) from operations before
income taxes (39,420) (36,992) (205,006) (191,546)
Real Estate Net income allocated to non-controlling interest (1) 4,331 - 4,331 -
Real Estate AEBITDA Add Backs:
Employee loan amortization and reserves on employee loans (6,009) (1,974) (38,455) (28,977)
Interest expense (1) (14,820) (2,074) (18,083) (4,299)
Fixed asset depreciation and intangible asset amortization (4,632) (4,311) (17,227) (15,007)
Non-cash MSR income, net of amortization 3,273 15,434 36,291 79,136
Impairment of long-lived assets (56) (48) (8,291) (48)
Exchangeability charges (2) (21,749) (6,037) (105,148) (35,053)
(Gains) losses on equity investments - - 1,562 -
BGCP Consolidated (Excluding Newmark) Adjusted EBITDA 157,839 105,392 397,756 428,004
Net Income Allocation 614 4,789 21,613 20,836
BGCP Consolidated (Excluding Newmark) Adjusted EBITDA Excl Net
Income Allocation 158,453 110,181 419,370 448,840
Note:
(1) - Consolidation adjustment to reflect BGC vs Newmark treatment of net income allocated to non-controlling interest.
63

RECONCILIATION OF BGCP CONSOLIDATED TO BGCP (EXCLUDING NEWMARK) FOR ADJUSTED EBITDA
(IN THOUSANDS) (UNAUDITED)
64
Summary Q1 2018 Q1 2017
Q1 2018
TTM
Q1 2017
TTM
BGCP Consolidated Adjusted EBITDA 236,921 141,395 747,782 623,798
Real Estate AEBITDA (79,082) (36,003) (350,027) (195,794)
BGCP Consolidated (Excluding Newmark) Adjusted EBITDA 157,839 105,392 397,755 428,004
Net Income Allocation 614 4,789 21,613 20,836
BGCP Consolidated (Excluding Newmark) Adjusted EBITDA Excl Net
Income Allocation 158,453 110,181 419,369 448,840
Note:
(1) - Consolidation adjustment to reflect BGC vs Newmark treatment of net income allocated to non-controlling interest.

FULLY DILUTED WEIGHTED-AVERAGE SHARE COUNT FOR GAAP AND ADJUSTED EARNINGS
(IN THOUSANDS) (UNAUDITED)
Q1 2018 Q1 2017
Common stock outstanding 307,728 283,399
Limited partnership units 104,892 94,298
Cantor units 51,815 51,183
Founding partner units 12,511 13,790
RSUs 604 677
Other 1,385 1,479
Fully diluted weighted-average share count for GAAP and AE 478,935 444,826
65

FULLY DILUTED WEIGHTED-AVERAGE SHARE COUNT FOR GAAP AND ADJUSTED EARNINGS
(IN THOUSANDS) (UNAUDITED)
FY 2017 FY 2016
Common stock outstanding 287,378 277,073
Limited partnership units 100,215 79,727
Cantor units 51,361 50,653
Founding partner units 13,474 14,563
4.50% Convertible debt shares (Matured July 15, 2016) - 8,598
RSUs 521 452
Other 1,307 2,160
Fully diluted weighted-average share count for GAAP and AE 454,256 433,226
66

SEGMENT DISCLOSURE – 1Q 2018 VS 1Q 2017(IN THOUSANDS) (UNAUDITED)
67
Financial
Services
Real
Estate Services
Corporate
Items Total
Financial
Services
Real
Estate Services
Corporate
Items Total
Total revenues 516,621$ 431,871$ 8,154$ 956,646$ 441,178$ 333,720$ 8,295$ 783,193$
Total expenses 403,821 355,119 104,255 863,195 353,906 281,166 96,141 731,213
Total other income (losses), net 10,935 5,609 23,199 39,743 4,648 - 1,166 5,814
Income (loss) from operations before
income taxes 123,735$ 82,361$ (72,902)$ 133,194$ 91,920$ 52,554$ (86,680)$ 57,794$
Pre-tax adjustments:
Non-cash (gains) losses related to equity
investments, net - - (2,625) (2,625) - - (237) (237)
Allocations of net income and grant of
exchangeability to limited partnership units and
FPUs - - 65,232 65,232 - - 63,193 63,193
Non-cash MSR income, net of amortization - (3,273) - (3,273) - (15,434) - (15,434)
(Gains) and charges with respect to acquisitions,
dispositions and / or resolutions of litigation, and
other non-cash, non-dilutive items, net
5,765 1,538 (15,146) (7,843) 6,751 1,355 5,901 14,007
Total pre-tax adjustments 5,765 (1,735) 47,461 51,491 6,751 (14,079) 68,857 61,529
Pre-tax adjusted earnings 129,500$ 80,626$ (25,441)$ 184,685$ 98,671$ 38,475$ (17,823)$ 119,323$
Q1 2018 Q1 2017

SEGMENT DISCLOSURE – FY 2017 VS FY 2016(IN THOUSANDS) (UNAUDITED)
68
Financial
Services
Real
Estate Services
Corporate
Items Total
Financial
Services
Real
Estate Services
Corporate
Items Total
Total revenues 1,711,824$ 1,601,420$ 40,112$ 3,353,356$ 1,523,235$ 1,353,720$ 31,141$ 2,908,096$
Total expenses 1,398,264 1,301,503 526,286 3,226,053 1,275,397 1,099,196 327,133 2,701,726
Total other income (losses), net 19,727 76,332 8,635 104,694 78,701 - 29,099 107,800
Income (loss) from operations before
income taxes 333,287$ 376,249$ (477,539)$ 231,997$ 326,539$ 254,524$ (266,893)$ 314,170$
Pre-tax adjustments:
Non-cash (gains) losses related to equity
investments, net - - (6,189) (6,189) - - (3,543) (3,543)
Allocations of net income and grant of
exchangeability to limited partnership units and
FPUs - - 286,628 286,628 - - 192,934 192,934
Non-cash MSR income, net of amortization - (48,451) - (48,451) - (66,223) - (66,223)
(Gains) and charges with respect to
acquisitions, dispositions and / or resolutions of
litigation, and other non-cash, non-dilutive 26,320 4,538 125,646 156,504 24,384 4,384 10,528 39,296
Total pre-tax adjustments 26,320 (43,913) 406,085 388,492 24,384 (61,839) 199,919 162,464
Pre-tax adjusted earnings 359,607$ 332,336$ (71,454)$ 620,489$ 350,923$ 192,685$ (66,974)$ 476,634$
FY 2017 FY 2016

RECONCILIATION OF BGC REAL ESTATE SEGMENT REVENUES TO NEWMARK GROUP, INC. STAND-ALONE REVENUES
(IN THOUSANDS) (UNAUDITED)
69
Q1 2018 Q1 2017
BGC Real Estate segment revenues 431,871 333,720
Interest income (1) (1,411) (1,138)
Newmark Group, Inc. stand-alone revenues 430,460 332,582
(1) This is not included as part of Total revenues in Newmark Group, Inc.'s stand-alone
financial statements.

RECONCILIATION OF BGC REAL ESTATE SEGMENT REVENUES TO NEWMARK GROUP, INC. STAND-ALONE REVENUES
(IN THOUSANDS) (UNAUDITED)
70
FY 2017 FY 2016
BGC Real Estate segment revenues 1,601,420 1,353,720
Interest income (1) (4,970) (3,737)
Newmark Group, Inc. stand-alone revenues 1,596,450 1,349,983
(1) This is not included as part of Total revenues in Newmark Group, Inc.'s stand-alone
financial statements.

RECONCILIATION OF BGC REAL ESTATE SEGMENT TO NEWMARK GROUP, INC. STAND-ALONE FOR GAAP INCOME (LOSS) FROM
OPERATIONS BEFORE INCOME TAXES (IN THOUSANDS) (UNAUDITED)
71
Q1 2018 Q1 2017
BGC Real Estate segment income (loss) from operations before 82,361 52,554
BGC Corporate Items:
Compensation and employee benefits (783) (560)
Allocations of net income and grant of exchangeability to limited
partnership units and FPUs (25,809) (10,649)
Fees to related parties (1,361) (1,078)
Professional and consulting fees (146) (609)
Interest expense (14,820) (2,074)
Other expenses (120) -
Other income (loss) 98 (592)
Total BGC Corporate Items (42,941) (15,562)
Newmark Group, Inc. stand-alone income (loss) from operations
before income taxes 39,420 36,992

RECONCILIATION OF BGC REAL ESTATE SEGMENT TO NEWMARK GROUP, INC. STAND-ALONE FOR GAAP INCOME (LOSS) FROM
OPERATIONS BEFORE INCOME TAXES (IN THOUSANDS) (UNAUDITED)
72
FY 2017 FY 2016
BGC Real Estate segment income (loss) from operations before 376,249 254,524
BGC Corporate Items:
Interest income 984 75
Compensation and employee benefits (38,276) (18,912)
Allocations of net income and grant of exchangeability to limited
partnership units and FPUs (114,657) (72,319)
Fees to related parties (4,529) (4,618)
Professional and consulting fees (2,832) (479)
Interest expense (5,338) (2,267)
Other expenses (6,335) (80)
Gains (losses) on equity method investments 1,561 -
Other income (loss) (4,252) 15,279
Total BGC Corporate Items (173,674) (83,321)
Newmark Group, Inc. stand-alone income (loss) from operations
before income taxes 202,575 171,203

RECONCILIATION OF BGC REAL ESTATE SEGMENT TO NEWMARK GROUP, INC. STAND-ALONE FOR PRE-TAX ADJUSTED EARNINGS
(IN THOUSANDS) (UNAUDITED)
73
Q1 2018 Q1 2017
BGC Real Estate segment pre-tax adjusted earnings 80,626 38,475
BGC Corporate Items:
Compensation and employee benefits (783) (560)
Fees to related parties (1,361) (1,078)
Interest expense (14,820) (2,074)
Other expenses (25) (7)
Total BGC Corporate Items (16,989) (3,719)
Newmark Group, Inc. stand-alone pre-tax adjusted earnings 63,637 34,756

RECONCILIATION OF BGC REAL ESTATE SEGMENT TO NEWMARK GROUP, INC. STAND-ALONE FOR PRE-TAX ADJUSTED EARNINGS
(IN THOUSANDS) (UNAUDITED)
74
FY 2017 FY 2016
BGC Real Estate segment pre-tax adjusted earnings 332,336 192,685
BGC Corporate Items:
Interest income 984 75
Compensation and employee benefits (2,222) (768)
Fees to related parties (4,529) (4,618)
Professional fees (154) 311
Interest expense (5,338) (2,267)
Other expenses 172 (259)
Gains (losses) on equity method investments 1,561 -
Total BGC Corporate Items (9,526) (7,526)
Newmark Group, Inc. stand-alone pre-tax adjusted earnings 322,810 185,159

75
ir.bgcpartners.com
twitter.com/bgcpartners
linkedin.com/company/bgc-partners
Media Contact:
Karen Laureano-Rikardsen
+1 212-829-4975
Investor Contact:
Jason McGruder Ujjal Basu Roy
+1 212-610-2426 +1 212-610-2426
75