Embed Size (px)
Citation preview
1
BGAA-Report 1/99eExisting commercial chemicals – Exposure at the workplace
Contributions to the assessment of the risk of chemical substances at the workplace under the EU programme on existing chemicals
HVBGHauptverband dergewerblichenBerufsgenossenschaften
2
Written by: W. Bock, T.H. Brock, R. Stamm, V. Wittneben
Publisher: Hauptverband der gewerblichenBerufsgenossenschaften (HVBG)Alte Heerstraße 111, D–53754 Sankt AugustinTelephone: +49 (0) 22 41 / 2 31 - 01Fax: +49 (0) 22 41 / 2 31 - 13 33Internet: www.hvbg.de– August 2000 –
Typesetting and layout: HVBG, Public Relations
Printed by: Druckerei Plump OHG, Rheinbreitbach
ISBN 3-88383-573-0
3
Produced with the help of:
Dipl.-Geogr. Wolfgang BockDr. Roger StammMargret StückrathDipl.-Chem. Rainer Van Gelder
Dr. Giso SchmeißerDr. Ullrich Welzbacher
Dr. Dirk Dahmann
Dr. Uwe Kern
Dipl.-Ing. Kurt Kolmsee
Dipl.-Ing. Olaf Pruski
Dr. Joachim Gebert
Dipl.-Ing. Günther Sonnenschein
Dipl.-Chem. Michael Rocker
Dr. Johannes Hüdepohl
Dr. Thomas H. BrockDr. Werner ErnstProf. Dr. Harald FrohbergDr. Volker Wittneben
Dipl.-Ing. Marnix Poppe
Dr. Ehler CunoDr. Thomas Hensel
Dr. Siegfried HoffmannDr. Lothar Neumeister
Dr. Uwe MusankeDr. Reinhold Rühl
Berufsgenossenschaftliches Institut für Arbeitssicherheit – BIA des HVBG,Sankt Augustin
Hauptverband der gewerblichen Berufsgenossenschaften (HVBG), Sankt Augustin
Bergbau-Berufsgenossenschaft, Bochum
Steinbruchs-Berufsgenossenschaft, Karlsruhe
Steinbruchs-Berufsgenossenschaft, Hannover
Berufsgenossenschaft der keramischen und Glas-Industrie, Neuwied
Hütten- und Walzwerks-Berufsgenossenschaft, Essen
Maschinenbau- und Metall-Berufsgenossenschaft, Düsseldorf
Süddeutsche Metall-Berufsgenossenschaft, Mainz
Berufsgenossenschaft der Feinmechanik und Elektrotechnik, Köln
Berufsgenossenschaft der chemischen Industrie, Heidelberg
Holz-Berufsgenossenschaft, Köln
Berufsgenossenschaft Druck und Papierverarbeitung, Wiesbaden
Textil- und Bekleidungs-Berufsgenossenschaft, Augsburg
Bau-Berufsgenossenschaft Frankfurt am Main, Frankfurt am Main

4
Produced with the help of:
Dr. Joachim Schwalb
Dr. Valerie Wilms
Dr. Christian Felten
Großhandels- und Lagerei-Berufsgenossenschaft, Mannheim
Berufsgenossenschaft der Straßen-, U-Bahnen und Eisenbahnen, Hamburg
Berufsgenossenschaft für Fahrzeughaltungen, Hamburg
5
This report contains the substance data and exposure descriptions prepared by the Berufsgenossenschaften’s* working group on existing commercial chemicals (BGAA) for 44 existing commercial chemicals chosen from the first three EU priority lists and the OECD priority list.
These exposure descriptions focus pre-dominantly on the areas where the substances in question are used and are based on measurements taken at the workplace since 1990 by the Berufs-genossenschaften for the industrial sector and municipal accident insurance asso-ciations. The exposure descriptions have already been made available to
the competent authorities appointed under the EU programme on existing chemicals. This publication is intended to make them available to a wider professional circle. They can be used for identifying key areas in which preventive measures need to be implemented, for discussing acceptable limits and for assessing risks.
All data analysed for this report are stored in the MEGA database (Messdaten zur Exposi-tion gegenüber Gefahrstoffen am Arbeits-platz – measurements of exposure to hazardous chemicals at the workplace) at the Berufsgenossenschaften’s Institute for Occu-pational Safety (Berufsgenossenschaftliches Institut für Arbeitssicherheit – BIA).
Abstract
*Institutions for Statutory Accident Insurance and Prevention
6
Als Arbeitsergebnis des Berufsgenossen-schaftlichen Arbeitskreises Altstoffe (BGAA) werden Stoffdaten und Expositionsbeschrei-bungen zu 44 ausgewählten Altstoffen aus den ersten drei Prioritätenlisten der EU und der OECD-Prioritätenliste vorgestellt.
Diese Expositionsbeschreibungen beziehen sich im Wesentlichen auf Verwendungs-bereiche der jeweiligen Substanzen und basieren auf betrieblichen Messungen der gewerblichen Berufsgenossenschaften und Gemeindeunfallversicherungsverbände im Zeitraum seit 1990. Die Expositionsbeschrei-
bungen wurden den zuständigen Stellen im EU-Altstoffprogramm zur Verfügung gestellt. Mit dieser Veröffentlichung werden sie der breiteren Fachöffentlichkeit übergeben, sie können z.B. Verwendung finden bei der Iden-tifikation von Präventionsschwerpunkten, im Rahmen der Erörterung von Grenzwerten oder auch zur Risikoabschätzung.
Alle für diesen Report ausgewerteten Daten liegen in der Datenbank MEGA (Messdaten zur Exposition gegenüber Gefahrstoffen am Arbeitsplatz) beim Berufsgenossenschaft-lichen Institut für Arbeitssicherheit – BIA vor.
Kurzfassung
7
Les données des matériaux et les descriptions d'exposition de 44 substances existantes, choisies parmi les trois premières listes de priorités de l'UE et les listes de l'organisation de coopération et de développement écono-miques (OECD), sont présentées comme résultats du travail effectué par le cercle de travail substances existantes (BGAA) des Berufsgenossenschaften.
Les descriptions d'exposition se réfèrent essentiellement aux secteurs d'utilisation des substances correspondantes et se basent sur des mesurages effectués dans des entreprises membres par les Berufsgenossenschaften et les et des caisses d'assurance accident communales, dans la période depuis 1990.
Ces descriptions d'exposition ont été mises à la disposition des services compétents dans le programme des substances existantes de l'UE. Grâce à cette publication, elles seront transmises à un large public professionnel. Elles pourront être utilisées, par exemple, pour l'identification des priorités de préven-tion , dans le cadre du débat des valeurslimites et aussi pour l'estimation des risques.
Toutes les données analysées pour ce rap-port se trouvent dans la banque de données MEGA (Données de mesurage en ce qui con-cerne l'exposition aux matières dangereuses sur les lieux de travail) à l'Institut des Berufs-genossenschaften pour la sécurité du travail – BIA.
Résumé
8
El resultado de las actividades desempeña-das por el grupo de trabajo de las Berufs-genossenschaften sobre Materiales Viejos (BGAA) es una presentación de datos sobre materiales y descripciones de la exposición respecto a 44 materiales viejos que se han seleccionado de las tres primeras listas de prioridad de la UE y de la lista de priorida-des de la OECD.
Estas descripciones de exposición se refieren fundamentalmente a los campos de utiliza-ción de las respectivas sustancias y se basan en mediciones que las Berufsgenossenschaf-ten de la industria y las asociaciones muni-cipales de seguros de accidente han efec-tuado en empresas desde 1990. Las descripciones de la exposición se han puesto
a disposición de los órganos competentes en el marco del programa de materias viejas de la UE. Con esta publicación se entre-gan a un público más amplio de expertos. Estos datos pueden utilizarse p.ej. para identificar preferencias de la prevención en el marco de la discusión de valores límite o para realizar una evaluación de riesgos.
Todos los datos evaluados para este informe están disponibles en el banco de datos MEGA (datos de medición respecto a la exposición ante sustancias peligrosas en el puesto de trabajo) del Berufsgenossenschaft-liches Institut für Arbeitssicherheit – BIA (Insti-tuto de la Berufsgenossenschaften para la seguridad en el trabajo).
Resumen
9
Contents
Page
1 Introduction....................................................................................... 13
1.1 Regulation on the evaluation and control of the risks of existing substances and the EU programme on existing chemicals ........................... 13
1.2 Involvement of the Berufsgenossenschaften ............................................... 151.3 BGAA Report ..................................................................................... 17
2 Analysis and presentation of exposure data .......................................... 19
2.1 Data base ......................................................................................... 192.2 Selection criteria ................................................................................. 202.3 Parameters applied in statistical evaluation............................................... 22
3 Exposure descriptions......................................................................... 23
3.1 Acetone ............................................................................................ 233.2 Acetonitrile ........................................................................................ 283.3 Acrylaldehyde.................................................................................... 303.4 Acrylamide ........................................................................................ 333.5 Acrylonitrile........................................................................................ 353.6 Aniline .............................................................................................. 383.7 Benzene ........................................................................................... 403.8 1,3-Butadiene .................................................................................... 453.9 2-(2-Butoxyethoxy)ethanol ..................................................................... 473.10 Butyl acetate ...................................................................................... 483.11 Cadmium .......................................................................................... 533.12 Chlorine............................................................................................ 583.13 Cyclohexane ..................................................................................... 603.14 4,4’-Diaminodiphenylmethane............................................................... 64
10
Page
3.15 Dibutyl phthalate ................................................................................ 663.16 1,4-Dichlorobenzene........................................................................... 683.17 Di-(2-ethylhexyl) phthalate ..................................................................... 703.18 Dioxane............................................................................................ 723.19 1,2-Epoxypropane.............................................................................. 743.20 2-Ethoxyethanol.................................................................................. 753.21 2-Ethoxyethyl acetate........................................................................... 783.22 Ethyl acetate...................................................................................... 813.23 Ethylbenzene ..................................................................................... 863.24 2-Furaldehyde.................................................................................... 913.25 Isopropylbenzene ............................................................................... 933.26 2-Methoxyethyl acetate........................................................................ 963.27 2-Methoxy-1-methylethyl acetate ............................................................ 993.28 Methyl acetate ................................................................................... 1023.29 Methyl methacrylate ............................................................................ 1063.30 Naphthalene ..................................................................................... 1103.31 Nickel .............................................................................................. 1123.32 Nitrobenzene .................................................................................... 1173.33 n-Pentane .......................................................................................... 1193.34 Phenol .............................................................................................. 1213.35 1-Propanol ........................................................................................ 1253.36 Styrene ............................................................................................. 1283.37 Tetrachloroethene ............................................................................... 1323.38 Tetrahydrofuran .................................................................................. 1363.39 Toluene ............................................................................................ 1383.40 Trichloroethene................................................................................... 1453.41 Trichloromethane ................................................................................ 1483.42 Vinyl acetate...................................................................................... 1503.43 Hydrogen peroxide............................................................................. 1523.44 Zinc oxide fumes ................................................................................ 154
Contents
11
Page
4 List of abbreviations and units.............................................................. 155
5 Appendix – Priority Lists...................................................................... 157
6 Index ............................................................................................... 167
7 References ........................................................................................ 181

12
13
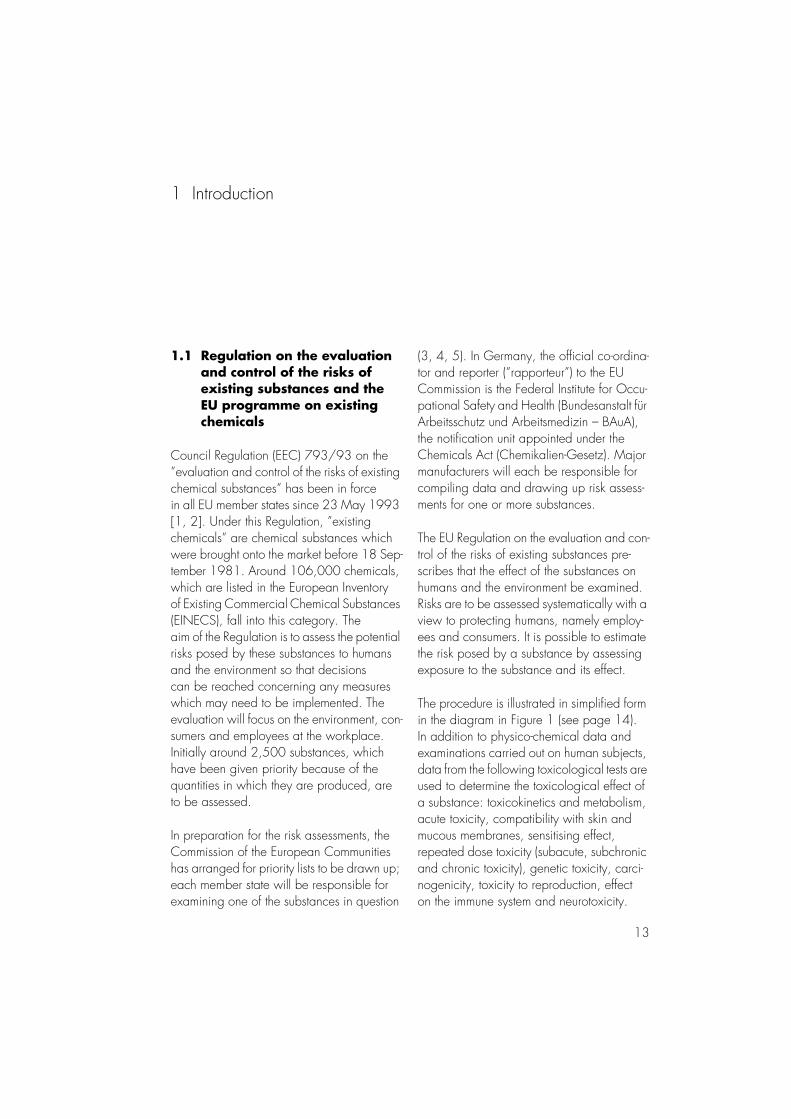
1.1 Regulation on the evaluation and control of the risks of existing substances and the EU programme on existing chemicals
Council Regulation (EEC) 793/93 on the ”evaluation and control of the risks of existing chemical substances” has been in force in all EU member states since 23 May 1993 [1, 2]. Under this Regulation, ”existing chemicals” are chemical substances which were brought onto the market before 18 Sep-tember 1981. Around 106,000 chemicals, which are listed in the European Inventory of Existing Commercial Chemical Substances (EINECS), fall into this category. The aim of the Regulation is to assess the potential risks posed by these substances to humans and the environment so that decisions can be reached concerning any measures which may need to be implemented. The evaluation will focus on the environment, con-sumers and employees at the workplace. Initially around 2,500 substances, which have been given priority because of the quantities in which they are produced, are to be assessed.
In preparation for the risk assessments, the Commission of the European Communities has arranged for priority lists to be drawn up; each member state will be responsible for examining one of the substances in question
(3, 4, 5). In Germany, the official co-ordina-tor and reporter (”rapporteur”) to the EU Commission is the Federal Institute for Occu-pational Safety and Health (Bundesanstalt für Arbeitsschutz und Arbeitsmedizin – BAuA), the notification unit appointed under the Chemicals Act (Chemikalien-Gesetz). Major manufacturers will each be responsible for compiling data and drawing up risk assess-ments for one or more substances.
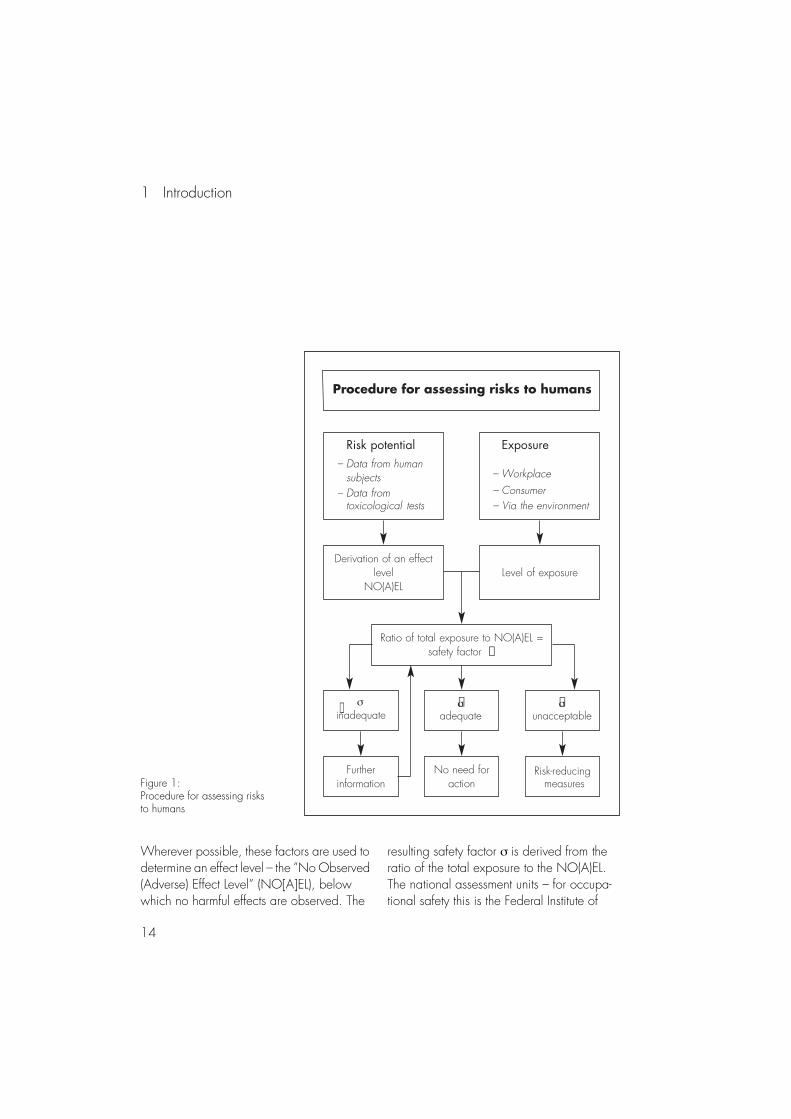
The EU Regulation on the evaluation and con-trol of the risks of existing substances pre-scribes that the effect of the substances on humans and the environment be examined. Risks are to be assessed systematically with a view to protecting humans, namely employ-ees and consumers. It is possible to estimate the risk posed by a substance by assessing exposure to the substance and its effect.
The procedure is illustrated in simplified form in the diagram in Figure 1 (see page 14). In addition to physico-chemical data and examinations carried out on human subjects, data from the following toxicological tests are used to determine the toxicological effect of a substance: toxicokinetics and metabolism, acute toxicity, compatibility with skin and mucous membranes, sensitising effect, repeated dose toxicity (subacute, subchronic and chronic toxicity), genetic toxicity, carci-nogenicity, toxicity to reproduction, effect on the immune system and neurotoxicity.
1 Introduction
1 Introduction
14
Wherever possible, these factors are used to determine an effect level – the ”No Observed (Adverse) Effect Level” (NO[A]EL), below which no harmful effects are observed. The
resulting safety factor σ is derived from the ratio of the total exposure to the NO(A)EL. The national assessment units – for occupa-tional safety this is the Federal Institute of
Risk potential– Data from human
subjects– Data from toxicological tests
Exposure
– Workplace– Consumer– Via the environment
Derivation of an effectlevel
NO(A)ELLevel of exposure
Ratio of total exposure to NO(A)EL =safety factor �
�
inadequate�σ
adequate�σ
unacceptable
Furtherinformation
No need foraction
Risk-reducing measures
Procedure for assessing risks to humans
σ
Figure 1:Procedure for assessing risks to humans
15
Occupational Safety and Health (Bundes-anstalt für Arbeitsschutz und Arbeitsmedizin – BAuA), for consumer protection the Federal Institute for Consumer Health Protec-tion and Veterinary Medicine (Bundesinstitut für gesundheitlichen Verbraucherschutz und Veterinärmedizin – BgVV) and for environmental protection the Federal Environ-mental Agency (Umweltbundesamt – UBA) – and the expert committees, in particular the Society of German Chemists’ Advisory Committee for Existing Chemicals (Berater-gremium für Altstoffe der GDCh – BUA) and the Berufsgenossenschaften’s working group on existing commercial chemicals (Berufsgenossenschaftlicher Arbeitskreis Alt-stoffe – BGAA), use this safety factor as a basis for deciding whether further action is required.
1.2 Involvement of the Berufs-genossenschaften
The Berufsgenossenschaften are involved in assessing the risks to humans at the work-place. Exposure at the workplace is one of three factors which have to be taken into consideration in order to determine the over-all exposure level, the other two factors being exposure as a consumer and exposure via the environment.
Manufacturers and importers of substances, the two main target groups of the Regulation,
can generally only determine the exposure levels occurring during the manufacture of the substance in question. In 1994, therefore, the Berufsgenossenschaften offered to assist with the examination of existing chemicals under the Regulation on the evaluation and control of the risks of existing substances by providing the Federal Ministry of Employment and Social Affairs (Bundesministerium für Arbeit und Sozialordnung – BMA) with facts and figures concerning the procedures fol-lowed by users of harmful substances in each area of industry. The BMA welcomed the opportunity to involve the Berufsgenossen-schaften more closely in the assessment of existing chemicals. To enable the Berufs-genossenschaften to participate in the imple-mentation of the Regulation, the Berufsgenos-senschaften’s working group on existing com-mercial chemicals (BGAA), directed by the Berufsgenossenschaft for the chemical indus-try (Berufsgenossenschaft der chemischen Industrie), was founded by decision of the conference of chief executives in December 1994. The BGAA compiles the measure-ments from the MEGA database (MEGA = Messdaten zur Exposition von Gefahrstoffen am Arbeitsplatz – measurements of exposure to hazardous substances at the workplace) maintained by the Berufsgenossenschaften’s Institute for Occupational Safety (Berufs-genossenschaftliches Institut für Arbeitssicher-heit – BIA) in Sankt Augustin and uses them as a basis for preparing exposure descrip-
1 Introduction
16
tions [6]. The MEGA database has been used to document extensive measurements taken within the framework of the Berufs-genossenschaften’s measurement system forhazardous substances (Berufsgenossenschaft-liches Messsystem Gefahrstoffe – BGMG) for 25 years [7].
The BGAA’s duties cover the following areas:
1. Investigating and providing advice on how the Berufsgenossenschaften can actively contribute to documenting the risks posed by existing substances.
2. Providing a point of contact between the Berufsgenossenschaften and other bodies involved in the programme on existing chemicals, for example the notification unit and the national assessment unit at the BAuA, the national assessment units of other EU states and major companies participating in the programme.
3. Developing criteria for producing expo-sure descriptions.
4. Setting priorities for examining substances. 5. Establishing a regulatory framework to
ensure that the Berufsgenossenschaften incorporate all available exposure data correctly.
6. Promoting and facilitating the exchange of information between the Berufsgenos-senschaften concerning the substances and their areas of application with a view to improving safety at the workplace, in-cluding existing chemicals being assessed by other EU member states.
7. Comparing and co-ordinating German data with information from other EU states. The aim is that the criteria applied in determining exposure levels be assessed uniformly.
8. Investigating existing chemicals for which action is currently needed but which are not considered priority substances under the EU Regulation on the evaluation and control of the risks of existing substances. This could possibly result in suggestions for further EU priority lists.
The BGAA is composed of representatives of the Berufsgenossenschaften. It is directed by the Berufsgenossenschaft for the chemical industry and works in close co-operation with the BIA. Correspondence should be addressed to:
Dr Thomas H. BrockBerufsgenossenschaftlicher Arbeitskreis Altstoffe – BGAA, c/o Berufsgenossenschaft der chemischen Industrie, Postfach 101480, 69004 Heidelberg, Germany
17
The BGAA has developed a system for draw-ing up exposure descriptions for the pro-gramme on existing chemicals. The ”BGAA format” is based on guidelines set down by the national assessment unit (BAuA). The exposure descriptions drawn up by the BGAA are forwarded to the competent body of the German programme on existing chemicals (rapporteur at the BAuA) in this format.
If the requisite measurements are available, the BGAA also prepares exposure descrip-tions for existing chemicals which other EU members are responsible for investigat-ing. It passes these on to the German rapporteur, who subsequently forwards them to the appropriate rapporteur in the other EU country.
1.3 BGAA Report
The BGAA feels that its exposure descriptions should be made accessible to a wider (pro-fessional) circle and has therefore decided to have them published by the German Feder-ation of Institutions for Statutory Accident Insurance and Prevention (Hautverband der gewerblichen Berufsgenossenschaften – HVBG).
The aim is to provide accurate information containing facts of relevance to the issue
of risks posed by hazardous substances at the workplace, such as advice on admissible levels, and identifying key areas in which preventive measures need to be implement-ed. It should be noted that, statistically speak-ing, some of the measurements contained in the exposure descriptions in this report are presented in a rather generalised form in line with the requirements of the programme on existing chemicals. A more detailed data analysis is often required for the purposes of practical prevention at the workplace and for attributing symptoms of a suspected occupa-tional disease to conditions in which an employee has worked. Nevertheless, the exposure descriptions drawn up by the BGAA provide useful information and guide-lines.
This first report contains the BGAA’s exposure descriptions for the priority substances appearing on the lists drawn up under the EU Regulation on the evaluation and control of the risks of existing substances and for the substances selected by the OECD (Chapter 5 ”Priority Lists”), where the Berufsgenossen-schaften have measurements for the exposure situation at the workplace at their disposal. It is not always the case that all work areas of relevance to the substance in question will have been monitored by the Berufsgenossen-schaften; for example, large companies often have internal departments which take the measurements for them.
1 Introduction
18
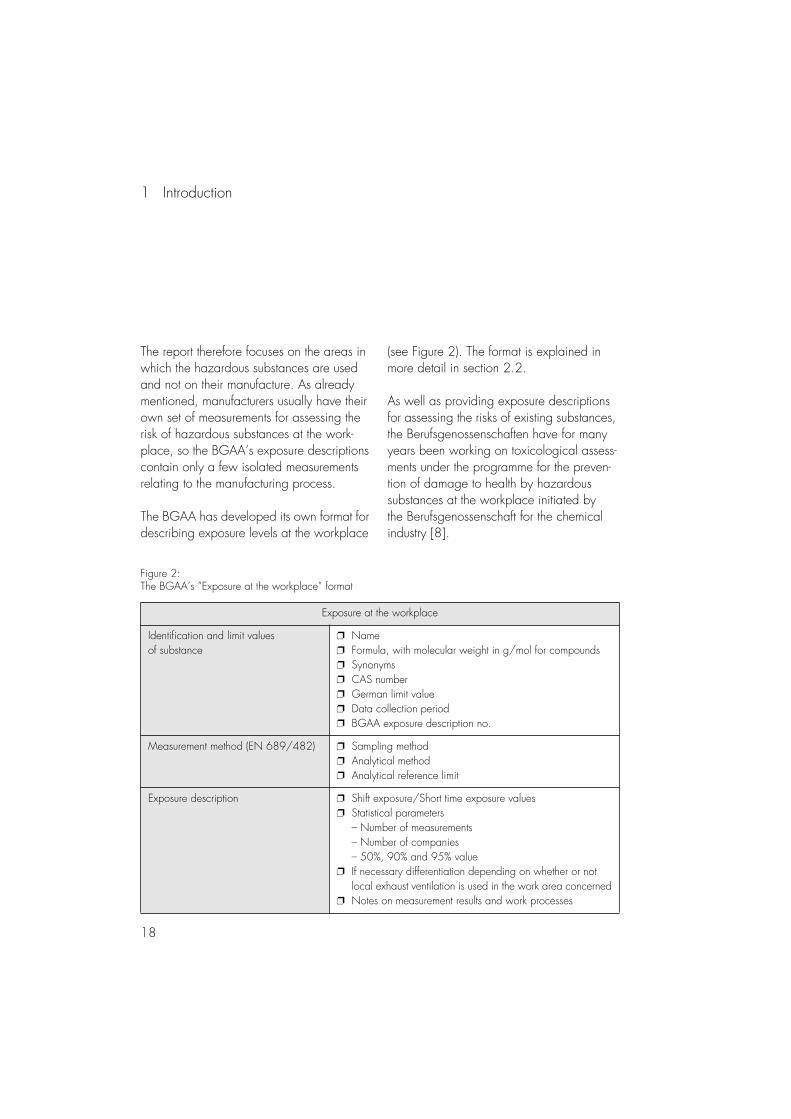
The report therefore focuses on the areas in which the hazardous substances are used and not on their manufacture. As already mentioned, manufacturers usually have their own set of measurements for assessing the risk of hazardous substances at the work-place, so the BGAA’s exposure descriptions contain only a few isolated measurements relating to the manufacturing process.
The BGAA has developed its own format for describing exposure levels at the workplace
(see Figure 2). The format is explained in more detail in section 2.2.
As well as providing exposure descriptions for assessing the risks of existing substances, the Berufsgenossenschaften have for many years been working on toxicological assess-ments under the programme for the preven-tion of damage to health by hazardous substances at the workplace initiated by the Berufsgenossenschaft for the chemical industry [8].
Figure 2:The BGAA’s ”Exposure at the workplace” format
Exposure at the workplace
Identification and limit values of substance
❐ Name❐ Formula, with molecular weight in g/mol for compounds❐ Synonyms❐ CAS number❐ German limit value❐ Data collection period❐ BGAA exposure description no.
Measurement method (EN 689/482) ❐ Sampling method❐ Analytical method❐ Analytical reference limit
Exposure description ❐ Shift exposure/Short time exposure values❐ Statistical parameters
– Number of measurements– Number of companies– 50%, 90% and 95% value
❐ If necessary differentiation depending on whether or not local exhaust ventilation is used in the work area concerned
❐ Notes on measurement results and work processes
19
2.1 Data base
The measurements used in the following exposure descriptions were collected using the ”Berufsgenossenschaften’s Measurement System for Hazardous Sub-stances” (BGMG) and stored in the MEGA database [7].
Thanks to the extensive measurement activi-ties which the Berufsgenossenschaften carry out at their member companies, approx. 60,000 air samples are currently analysed at around 4,000 companies every year. The measurements are recorded together with operational, exposure and sampling data in the BIA’s MEGA documen-tation system.
To ensure that the exposure descriptions are as up to date as possible, the analyses incor-porate data from the last five years. As the BGAA began its work at the start of 1995, the analyses for the first hazardous sub-stances examined relate to the period from 1990 to 1994; the analyses of all the haz-ardous substances examined subsequently were based on the following five-year periods.
With the co-operation of experts from the industries in question, the data were grouped
into similar work areas and work processes [9] on the basis of key inventories of com-pany types (area of industry) and work areas. The term ”work area” indicates a physically and organisationally separate part of a com-pany, which may incorporate one or more workplaces.
The measurements in the BGMG system were taken for a variety of reasons, the most com-mon being:
❐ Measurements taken as part of a super-visory duty for various reasons. These also include measurements which were taken because of suspected exposure during a work process but which revealed no or only negligible exposure. This obviously results in a very wide spread of measurements in accor-dance with the variety of work areas examined and the various conditions affecting the measurements in each case.
❐ Measurements taken on the grounds of a suspected occupational disease. These measurements are often taken in ”worst-case” conditions. Because of the variety of exposure situations examined, the spread of the measure-ments is similar to that for the measure-ments taken as part of a supervisory duty.
2 Analysis and presentation of exposure data
2 Analysis and presentation of exposure data
20
2.2 Selection criteria
Only personal exposure levels measured in the air at the workplace which met the follow-ing conditions were taken into consideration in the analysis:
❐ The measurement method meets the measurement strategy requirements of (DIN) EN 689 [10] / TRGS 402 and the measurement method requirements of (DIN) EN 382 [11]. This also includes measurements taken using respiratory pro-tective devices. Not included, however, are measurements obtained from the area behind the gas mask.
❐ The measurements were taken using the sampling systems (sampling methods/sampling media) specified by the BGMG at the time the measurements were taken [12].
❐ The analyses were carried out in accord-ance with the analysis procedures speci-fied by the BGMG at the time of analysis [12]. Please note: The analytical refer-ence limit of an analytical procedure refers to the smallest quantity of a sub-stance considered to be of statistical rele-vance which can be proven to be present with a certainty of 95%. In other words, quantitative concentration data are only listed if the result of the analysis is the
same or higher than the analytical refer-ence limit. Concentration data with a ”low analytical reference limit” indicate the relative reference limit, which is not constant but depends on analytical and sampling conditions.
❐ The process prescribed in ZH 1/120 (now BGI 505) was applied for carcino-genic substances [13].
The measurements were analysed separately wherever possible:
❐ Average exposure levels per shift: measurements taken for an exposure time of tE ≥ 1 hour, which were converted to average levels per shift in accordance with the specified exposure time (8-hour exposure) where appropriate. However, the measurements generally related to an 8-hour exposure time and therefore did not need to be converted. The con-version of the few measurements relating to an exposure time of less than 8 hours has no significant influence on the dis-tribution parameters of the data set as a whole.
❐ Activity-related measurements taken for an exposure time of tE < 1 hour: the measurements relating to exposure times of < 1 hour are activity-related concentra-tion measurements. For shorter exposure
21
times the measurements can be used as average exposure levels per shift in ”worst case” estimates.
In the BGMG both stationary sampling sys-tems and personal (worn) sampling devices are used for measuring personal related exposure at the workplace. As both systems provide personal related measurements and are therefore both equally suitable for deter-mining exposure levels, evaluations were not categorised according to the sampling system used.
To produce a specific evaluation, work areas and work processes occurring in more than one industry have been grouped together wherever possible. Explanations of individual exposure levels are only given if further process-specific data are available.
Measurement activities were distributed more or less equally among companies of different sizes – size being evaluated in terms of the number of employees [7]. In most of the eval-uations no distinction is made between small, medium-sized and large companies because experience has shown that it is usually the processes and substances in question which are of relevance to the exposure situation rather than the size of the company.
As far as possible, separate evaluations were carried out for work areas which did and
did not use technical protection measures to reduce exposure (local exhaust ventilation). The following should be noted in this connec-tion:
Technical measures are usually implemented in cases where the specific workplace situation leads to higher emissions of gas, vapour, mist or dust. This can be the case, for example, if large quantities of a substance are handled in an open environment, if a sub-stance evaporates after being applied to large areas or if it is processed at high tem-peratures. In contrast, emissions are compar-atively low if the same substance is used in small quantities, if the substance is applied over small areas or if it is processed at or below room temperature. The result of using technical measures is usually that the expo-sure level in workplaces with high emissions is brought roughly into line with the level in workplaces with low emissions and no tech-nical measures. Hence the apparent para-dox of workplaces with local exhaust ventilation often having the same or even higher exposure levels than those without local exhaust ventilation.
The total number of measurements taken with and without local exhaust ventilation may be lower than the number of measurements taken for the company type/work area in question as the measurement data do not always contain any information about local
2 Analysis and presentation of exposure data
22
exhaust ventilation. The following exposure descriptions indicate only whether or not local exhaust ventilation is used.
2.3 Parameters applied in statistical evaluation
The evaluation was carried out in accord-ance with an agreement concluded between the Berufsgenossenschaften and the HVBG concerning the use of DOK-MEGA: To ensure that evaluations are as accurate as possible, data sets shall only be created and subjected to statistical evaluation if more than nine measurements from at least five
companies and two Berufsgenossenschaften are available.
50%, 90% and 95% values were used for the exposure data in the tables, irrespective of the categorisation criteria applied for the set of measurements in question. These figures mean that 50%, 90% or 95% of all available exposure measurements are below the pre-scribed limit, while the remaining 50%, 10% or 5% are above this limit [14].
Unlike other statistical parameters, these val-ues enable various data sets to be compared directly so that different exposure conditions can be examined.
23
3.1 Acetone
Identification and limit values
Formula
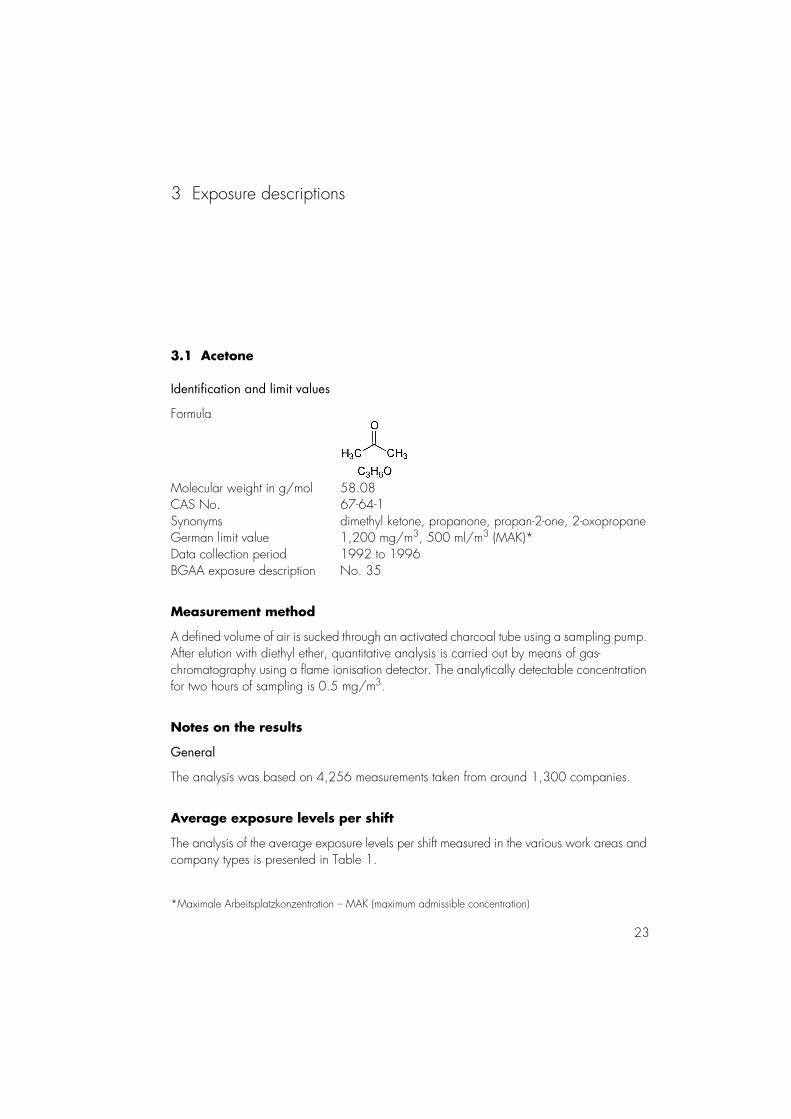
Molecular weight in g/mol 58.08CAS No. 67-64-1Synonyms dimethyl ketone, propanone, propan-2-one, 2-oxopropaneGerman limit value 1,200 mg/m3, 500 ml/m3 (MAK)*Data collection period 1992 to 1996BGAA exposure description No. 35
Measurement method
A defined volume of air is sucked through an activated charcoal tube using a sampling pump. After elution with diethyl ether, quantitative analysis is carried out by means of gas-chromatography using a flame ionisation detector. The analytically detectable concentration for two hours of sampling is 0.5 mg/m3.
Notes on the results
General
The analysis was based on 4,256 measurements taken from around 1,300 companies.
Average exposure levels per shift
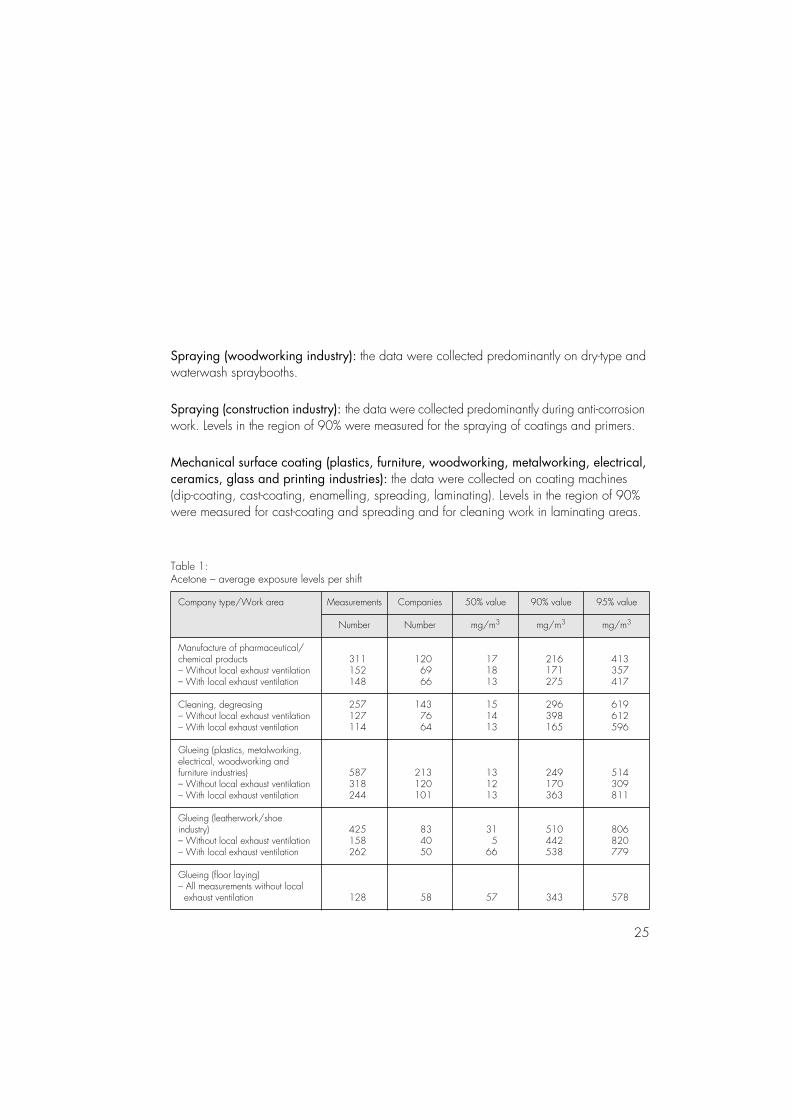
The analysis of the average exposure levels per shift measured in the various work areas and company types is presented in Table 1.
3 Exposure descriptions
*Maximale Arbeitsplatzkonzentration – MAK (maximum admissible concentration)
3 Exposure descriptions
24
Manufacture of pharmaceutical/chemical products: the data were collected on dissolvers, bead mills and decanting equipment. Levels in the region of 90% were measured for the preparation and dispensing of paints.
Cleaning, degreasing: the data were collected predominantly in the metalworking, elec-trical, woodworking and chemical industries. Levels in the region of 90% were measured for the manual cleaning of containers (e.g. paint manufacture) and machine parts (removal of plastic and adhesive residues).
Glueing (plastics, metalworking, electrical, woodworking, furniture industries): levels in the region of 90% were measured for the glueing over large areas.
Glueing (leather/shoe industries): levels in the region of 90% were measured for the manual and mechanical glueing in rooms with unfavourable conditions.
Glueing, floor laying (wood, textiles, plastics): levels in the region of 90% were measured for the application of parquet adhesives and fillers in rooms without ventilation.
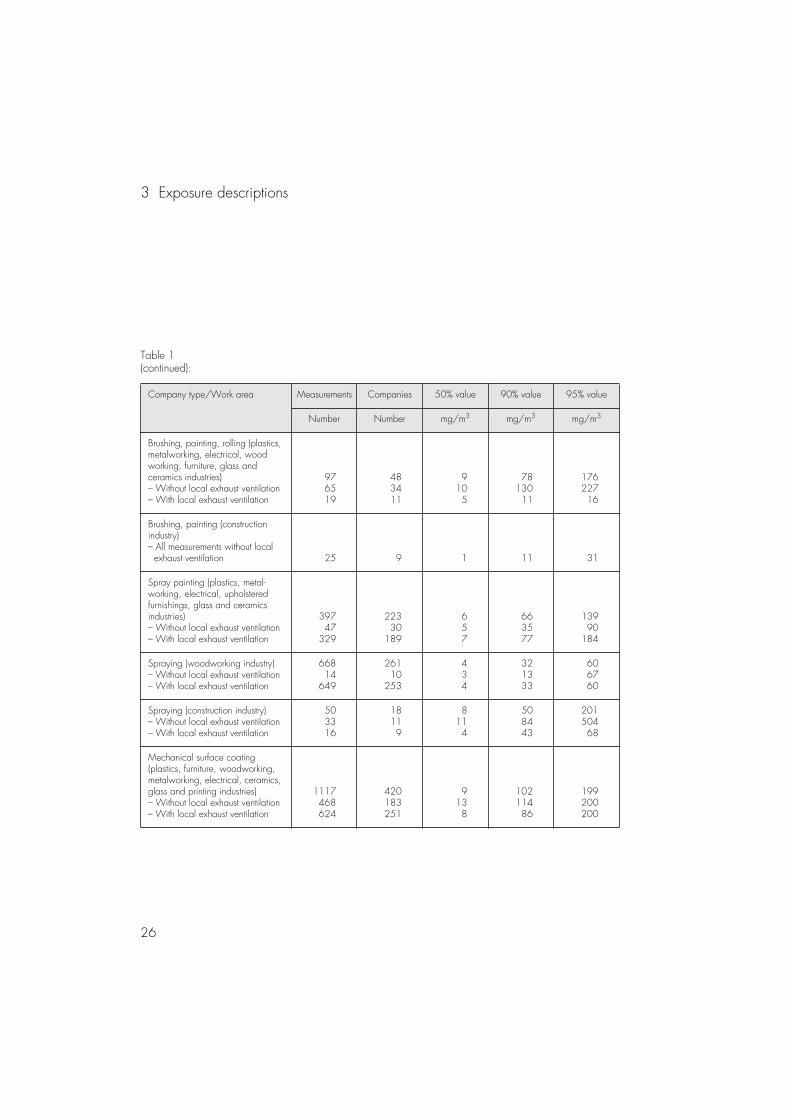
Brushing, painting, rolling (plastics, metalworking, electrical, woodworking, furniture, glass and ceramics industries): levels in the region of 90% were measured for manual painting without local exhaust ventilation.
Brushing, painting, rolling (construction industry): the data were collected during the paint-ing of walls, windows and domestic installations. Levels in the region of 90% were measured for the application of primers.
Spray painting (plastics, metalworking, electrical, upholstered furniture, glass and ceram-ics industries): the data were collected predominantly on dry-type and waterwash spray-booths. Levels in the region of 90% were measured for the spraying of coatings (for example polyurethanes).
25
Spraying (woodworking industry): the data were collected predominantly on dry-type and waterwash spraybooths.
Spraying (construction industry): the data were collected predominantly during anti-corrosion work. Levels in the region of 90% were measured for the spraying of coatings and primers.
Mechanical surface coating (plastics, furniture, woodworking, metalworking, electrical, ceramics, glass and printing industries): the data were collected on coating machines (dip-coating, cast-coating, enamelling, spreading, laminating). Levels in the region of 90% were measured for cast-coating and spreading and for cleaning work in laminating areas.
Table 1:Acetone – average exposure levels per shift
Company type/Work area Measurements Companies 50% value 90% value 95% value
Number Number mg/m3 mg/m3 mg/m3
Manufacture of pharmaceutical/chemical products– Without local exhaust ventilation– With local exhaust ventilation
311152148
1206966
171813
216171275
413357417
Cleaning, degreasing– Without local exhaust ventilation– With local exhaust ventilation
257127114
1437664
151413
296398165
619612596
Glueing (plastics, metalworking, electrical, woodworking and furniture industries)– Without local exhaust ventilation– With local exhaust ventilation
587318244
213120101
131213
249170363
514309811
Glueing (leatherwork/shoe industry)– Without local exhaust ventilation– With local exhaust ventilation
425158262
834050
315
66
510442538
806820779
Glueing (floor laying)– All measurements without local exhaust ventilation 128 58 57 343 578
3 Exposure descriptions
26
Company type/Work area Measurements Companies 50% value 90% value 95% value
Number Number mg/m3 mg/m3 mg/m3
Brushing, painting, rolling (plastics, metalworking, electrical, woodworking, furniture, glass and ceramics industries)– Without local exhaust ventilation– With local exhaust ventilation
976519
483411
9105
7813011
17622716
Brushing, painting (construction industry)– All measurements without local exhaust ventilation 25 9 1 11 31
Spray painting (plastics, metal-working, electrical, upholstered furnishings, glass and ceramics industries)– Without local exhaust ventilation– With local exhaust ventilation
39747
329
22330
189
657
663577
13990
184
Spraying (woodworking industry)– Without local exhaust ventilation– With local exhaust ventilation
66814
649
26110
253
434
321333
606760
Spraying (construction industry)– Without local exhaust ventilation– With local exhaust ventilation
503316
18119
8114
508443
20150468
Mechanical surface coating (plastics, furniture, woodworking, metalworking, electrical, ceramics, glass and printing industries)– Without local exhaust ventilation– With local exhaust ventilation
1117468624
420183251
9138
10211486
199200200
Table 1(continued):
27
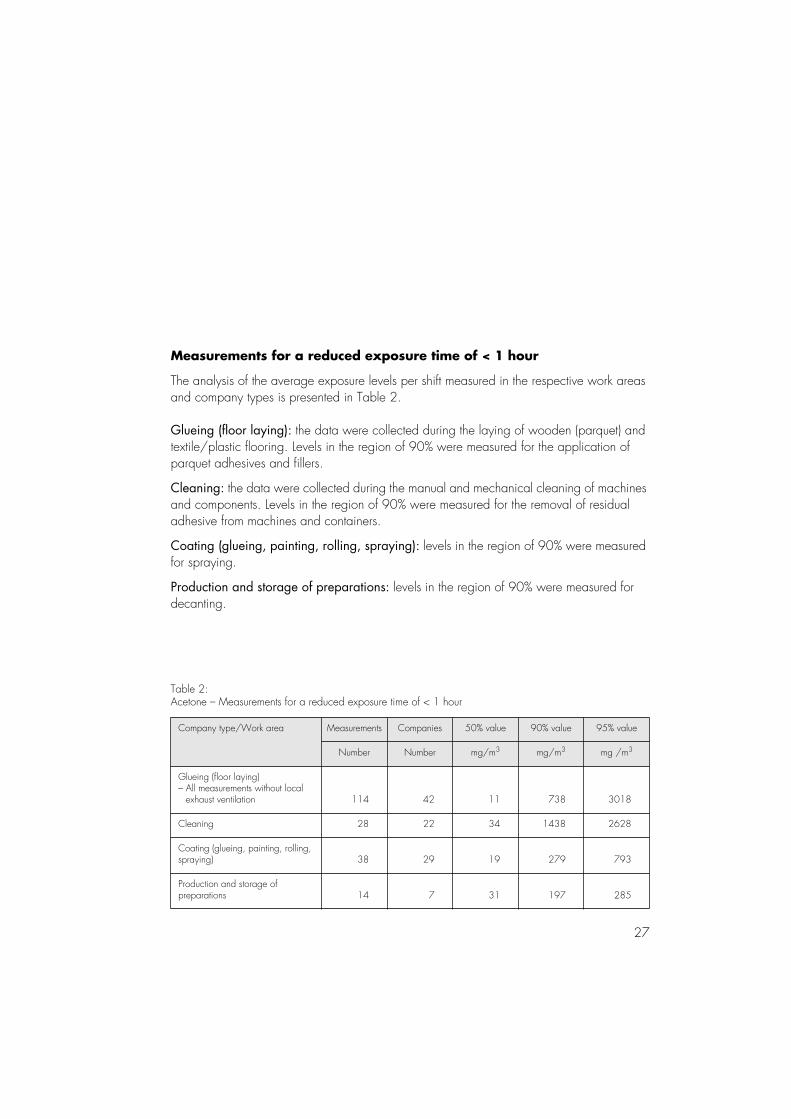
Measurements for a reduced exposure time of < 1 hour
The analysis of the average exposure levels per shift measured in the respective work areas and company types is presented in Table 2.
Glueing (floor laying): the data were collected during the laying of wooden (parquet) and textile/plastic flooring. Levels in the region of 90% were measured for the application of parquet adhesives and fillers.
Cleaning: the data were collected during the manual and mechanical cleaning of machines and components. Levels in the region of 90% were measured for the removal of residual adhesive from machines and containers.
Coating (glueing, painting, rolling, spraying): levels in the region of 90% were measured for spraying.
Production and storage of preparations: levels in the region of 90% were measured for decanting.
Table 2:Acetone – Measurements for a reduced exposure time of < 1 hour
Company type/Work area Measurements Companies 50% value 90% value 95% value
Number Number mg/m3 mg/m3 mg /m3
Glueing (floor laying)– All measurements without local exhaust ventilation 114 42 11 738 3018
Cleaning 28 22 34 1438 2628
Coating (glueing, painting, rolling, spraying) 38 29 19 279 793
Production and storage of preparations 14 7 31 197 285
3 Exposure descriptions
28
3.2 Acetonitrile
Identification and limit values
Formula
Molecular weight in g/mol 41.05CAS No. 75-05-8Synonyms methyl cyanide, cyanomethaneGerman limit value 70 mg/m3, 40 ml/m3 (MAK)Data collection period 1991 to 1995BGAA exposure description No. 9
Measurement method
A defined volume of air is sucked through an activated charcoal tube using a sampling pump. After elution with acetone, quantitative analysis is carried out by means of gaschromato-graphy using a flame ionisation detector. The analytically detectable concentration for two hours of sampling is 0.1 mg/m3.
Notes on the results
General
The measurements come from the chemical industry (plastics and pharmaceuticals industries and research laboratories).
29
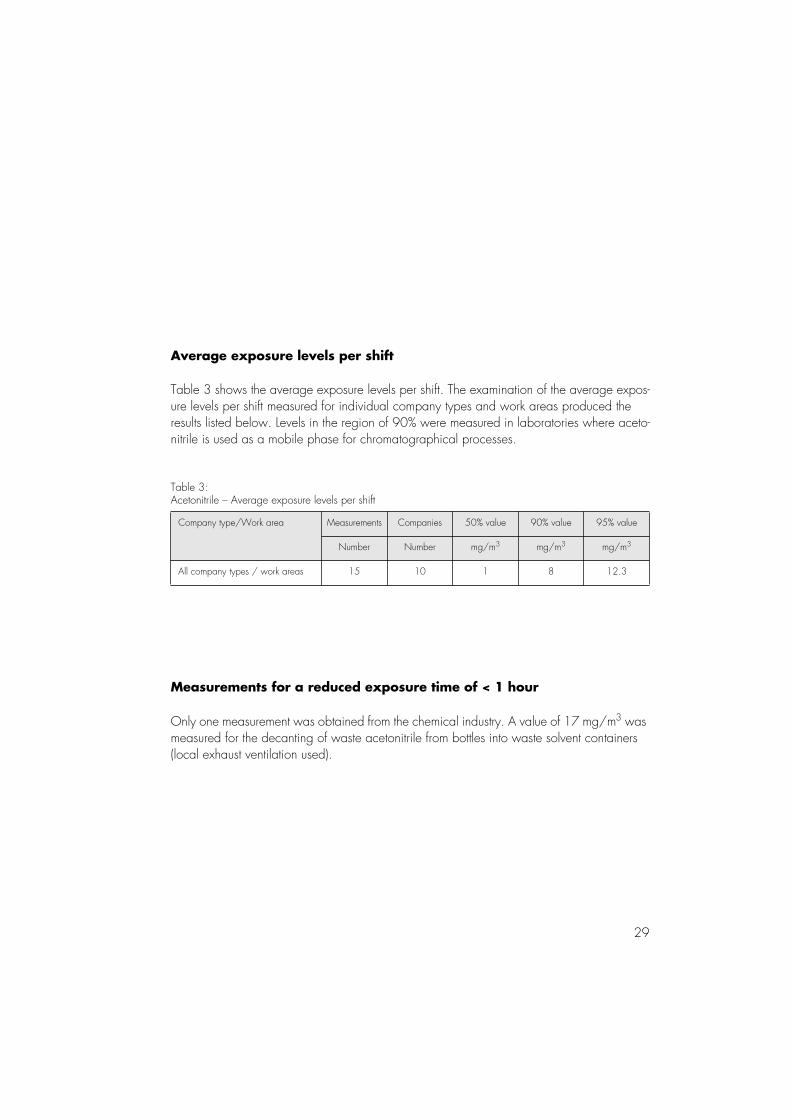
Average exposure levels per shift
Table 3 shows the average exposure levels per shift. The examination of the average expos-ure levels per shift measured for individual company types and work areas produced the results listed below. Levels in the region of 90% were measured in laboratories where aceto-nitrile is used as a mobile phase for chromatographical processes.
Table 3:Acetonitrile – Average exposure levels per shift
Company type/Work area Measurements Companies 50% value 90% value 95% value
Number Number mg/m3 mg/m3 mg/m3
All company types / work areas 15 10 1 8 12.3
Measurements for a reduced exposure time of < 1 hour
Only one measurement was obtained from the chemical industry. A value of 17 mg/m3 was measured for the decanting of waste acetonitrile from bottles into waste solvent containers (local exhaust ventilation used).
3 Exposure descriptions
30
3.3 Acrylaldehyde
Identification and limit values
Formula
Molecular weight in g/mol 56.06CAS No. 107-02-8Synonyms acrolein, 2-propenalGerman limit value 0.25 mg/m3, 0.1 ml/m3 (MAK)Data collection period 1991 to 1995BGAA exposure description No. 14
Measurement method
A defined volume of air is sucked through an impregnated glass fibre filter using a sampling pump with a chemisorber. After extraction with acetonitrile, quantitative analysis is carried out by means of gas chromatography using a flame ionisation detector. The analyticallydetectable concentration for two hours of sampling is 0.01 mg/m3.
Notes on the results
General
A total of 352 measurements from 172 companies in the chemical, plastics, rubber, ceram-ics, glass, metalworking, mechanical engineering, electronics, precision mechanics, wood-working and construction industries and other branches of industry were analysed.
31
As all the measurements taken for surface coating, mechanical machining processes and in offices were below the analytically detectable concentration, no statistical analysis was carried out for these work processes and areas.
Average exposure levels per shift
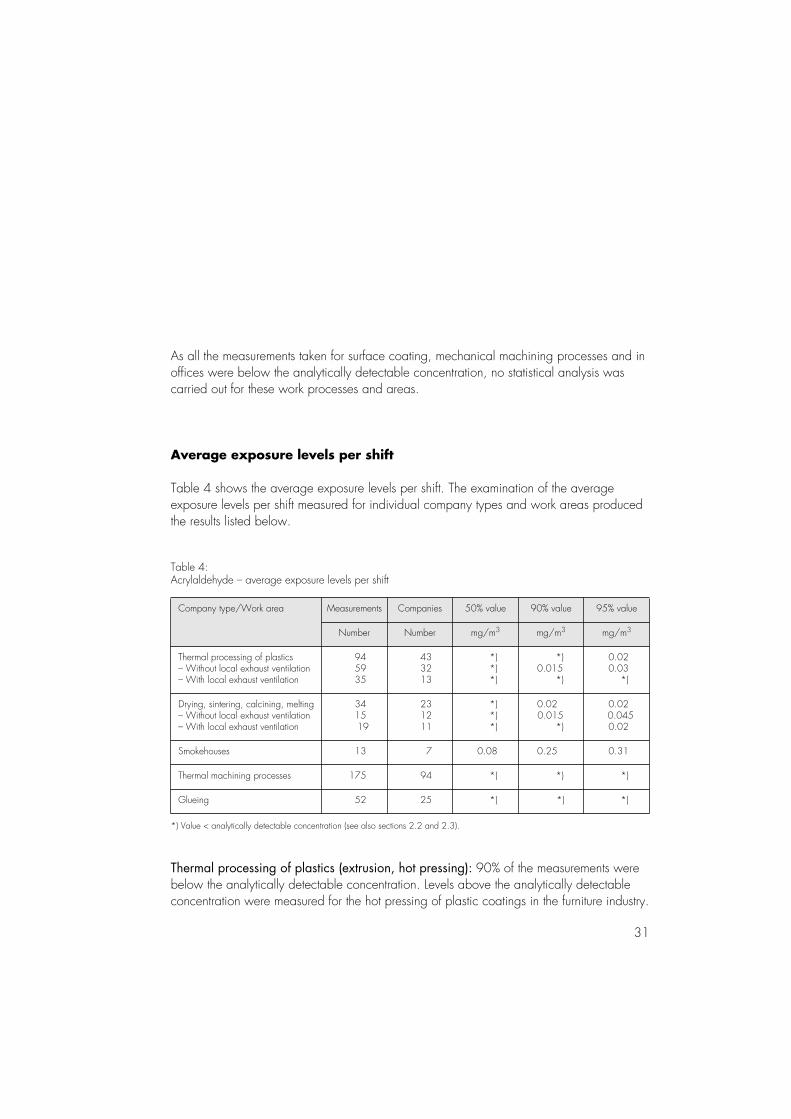
Table 4 shows the average exposure levels per shift. The examination of the average exposure levels per shift measured for individual company types and work areas produced the results listed below.
Table 4:Acrylaldehyde – average exposure levels per shift
Company type/Work area Measurements Companies 50% value 90% value 95% value
Number Number mg/m3 mg/m3 mg/m3
Thermal processing of plastics– Without local exhaust ventilation– With local exhaust ventilation
945935
433213
*)*)*)
*)0.015
*)
0.020.03
*)
Drying, sintering, calcining, melting– Without local exhaust ventilation– With local exhaust ventilation
341519
231211
*)*)*)
0.02 0.015
*)
0.020.0450.02
Smokehouses 13 7 0.08 0.25 0.31
Thermal machining processes 175 94 *) *) *)
Glueing 52 25 *) *) *)
*) Value < analytically detectable concentration (see also sections 2.2 and 2.3).
Thermal processing of plastics (extrusion, hot pressing): 90% of the measurements were below the analytically detectable concentration. Levels above the analytically detectable concentration were measured for the hot pressing of plastic coatings in the furniture industry.
3 Exposure descriptions
32
Smokehouses: in smokehouses no-one stays for longer than four hours in the areas in question.
Thermal machining operations (welding, soldering, flame cutting): more than 95% of the measurements were below the analytically detectable concentration. Levels above the ana-lytically detectable concentrationt occurred in individual cases for the welding of plastic bags and the soldering of printed circuit boards.
Glueing: 95% of the measurements were below the analytically detectable concentration. Levels above the analytically detectable concentration occurred in individual cases forthe processing of hot-melt adhesives.
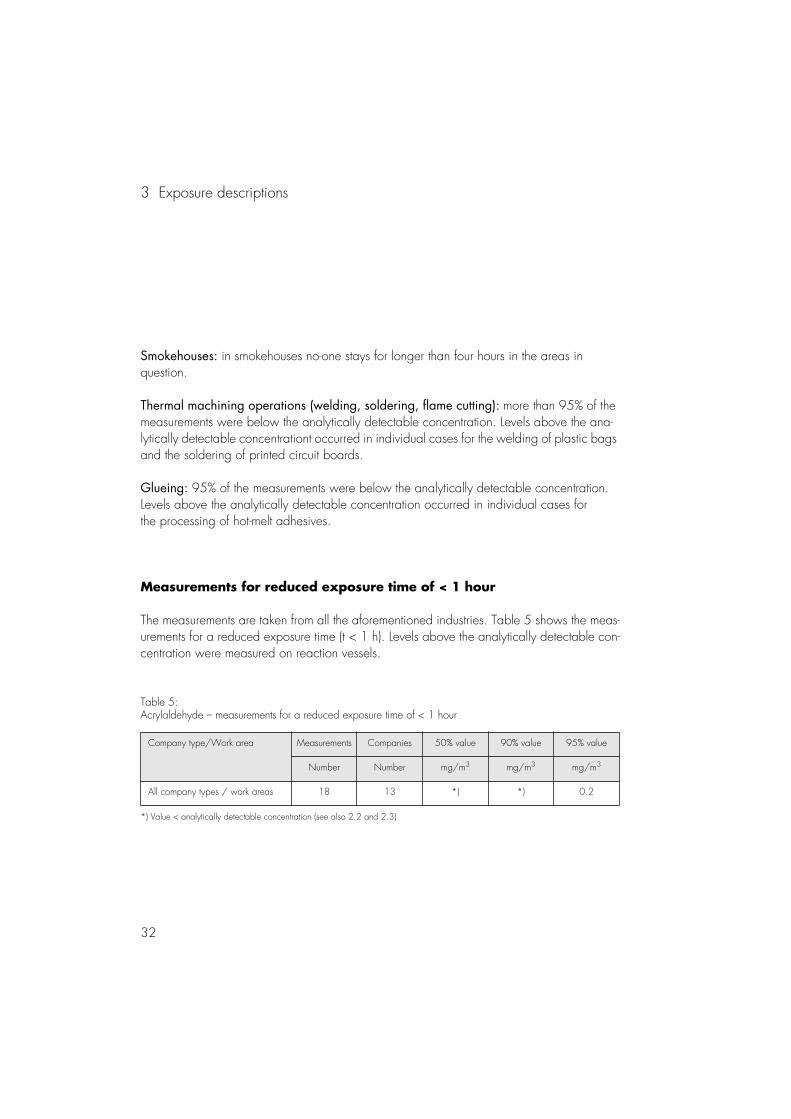
Measurements for reduced exposure time of < 1 hour
The measurements are taken from all the aforementioned industries. Table 5 shows the meas-urements for a reduced exposure time (t < 1 h). Levels above the analytically detectable con-centration were measured on reaction vessels.
Table 5:Acrylaldehyde – measurements for a reduced exposure time of < 1 hour
Company type/Work area Measurements Companies 50% value 90% value 95% value
Number Number mg/m3 mg/m3 mg/m3
All company types / work areas 18 13 *) *) 0.2
*) Value < analytically detectable concentration (see also 2.2 and 2.3)
33
3.4 Acrylamide
Identification and limit values
Formula
Molecular weight in g/mol 71.01CAS No 79-06-1Synonyms propenamideGerman limit value 0.06 mg/m3 (TRK* for the use of solid acrylamide,
otherwise a TRK of 0.03 mg/m3 applies)Data collection period 1990 to 1995BGAA exposure description No. 12
Measurement method
A defined volume of air is sucked through a GGP sampling system. The system contains a glass fibre filter for particle separation and is filled with an activated charcoal tube in a glass cartridge for the adsorption of gaseous acrylamide. After one hour of desorption with dichloromethane/methanol (9 : 1), quantitative analysis is carried out by means of gas-chromatography using a flame ionisation detector. The analytically detectable concentration for two hours of sampling is 0.005 mg/m3 (see also [15]).
Notes on the results
General
28 measurements from 11 companies were analysed. The measurements come from the chemical industry and flat glass industry. Table 6 shows the average exposure levels per shift.
*Technische Richtkonzentration – TRK (technical reference concentration)
3 Exposure descriptions
34
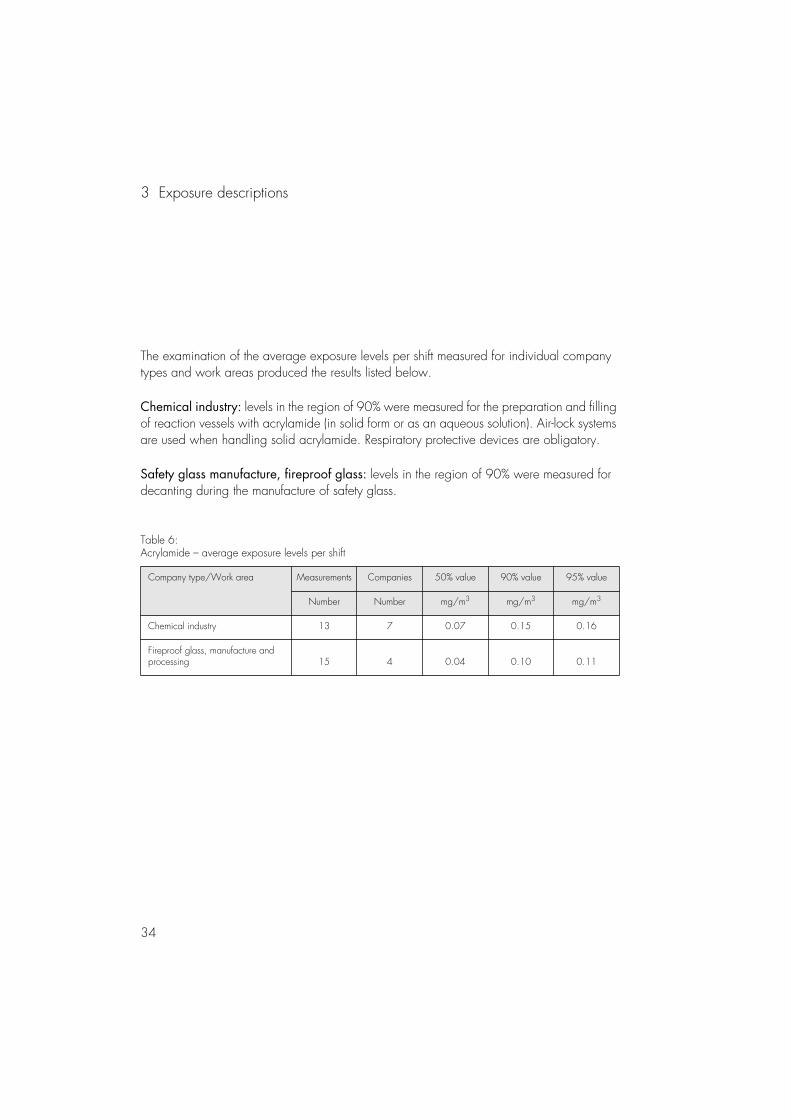
The examination of the average exposure levels per shift measured for individual company types and work areas produced the results listed below.
Chemical industry: levels in the region of 90% were measured for the preparation and filling of reaction vessels with acrylamide (in solid form or as an aqueous solution). Air-lock systems are used when handling solid acrylamide. Respiratory protective devices are obligatory.
Safety glass manufacture, fireproof glass: levels in the region of 90% were measured for decanting during the manufacture of safety glass.
Table 6:Acrylamide – average exposure levels per shift
Company type/Work area Measurements Companies 50% value 90% value 95% value
Number Number mg/m3 mg/m3 mg/m3
Chemical industry 13 7 0.07 0.15 0.16
Fireproof glass, manufacture and processing 15 4 0.04 0.10 0.11
35
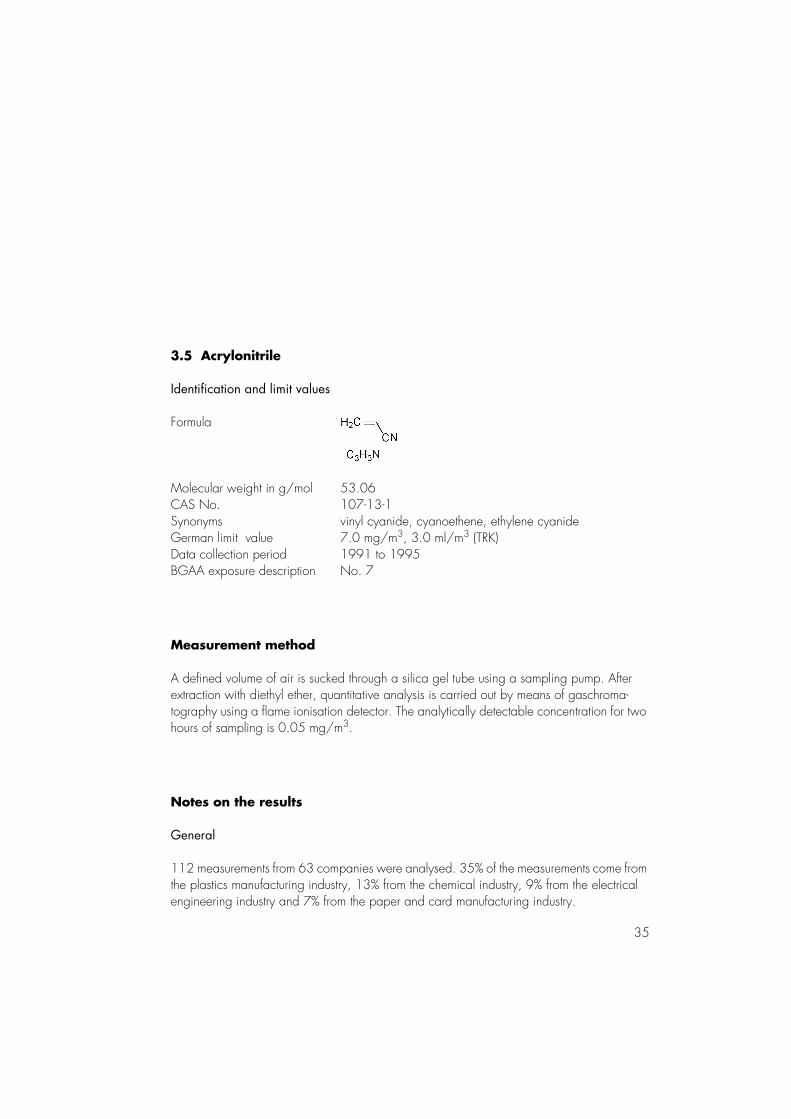
3.5 Acrylonitrile
Identification and limit values
Formula
Molecular weight in g/mol 53.06CAS No. 107-13-1Synonyms vinyl cyanide, cyanoethene, ethylene cyanideGerman limit value 7.0 mg/m3, 3.0 ml/m3 (TRK)Data collection period 1991 to 1995BGAA exposure description No. 7
Measurement method
A defined volume of air is sucked through a silica gel tube using a sampling pump. After extraction with diethyl ether, quantitative analysis is carried out by means of gaschroma-tography using a flame ionisation detector. The analytically detectable concentration for two hours of sampling is 0.05 mg/m3.
Notes on the results
General
112 measurements from 63 companies were analysed. 35% of the measurements come from the plastics manufacturing industry, 13% from the chemical industry, 9% from the electrical engineering industry and 7% from the paper and card manufacturing industry.
3 Exposure descriptions
36
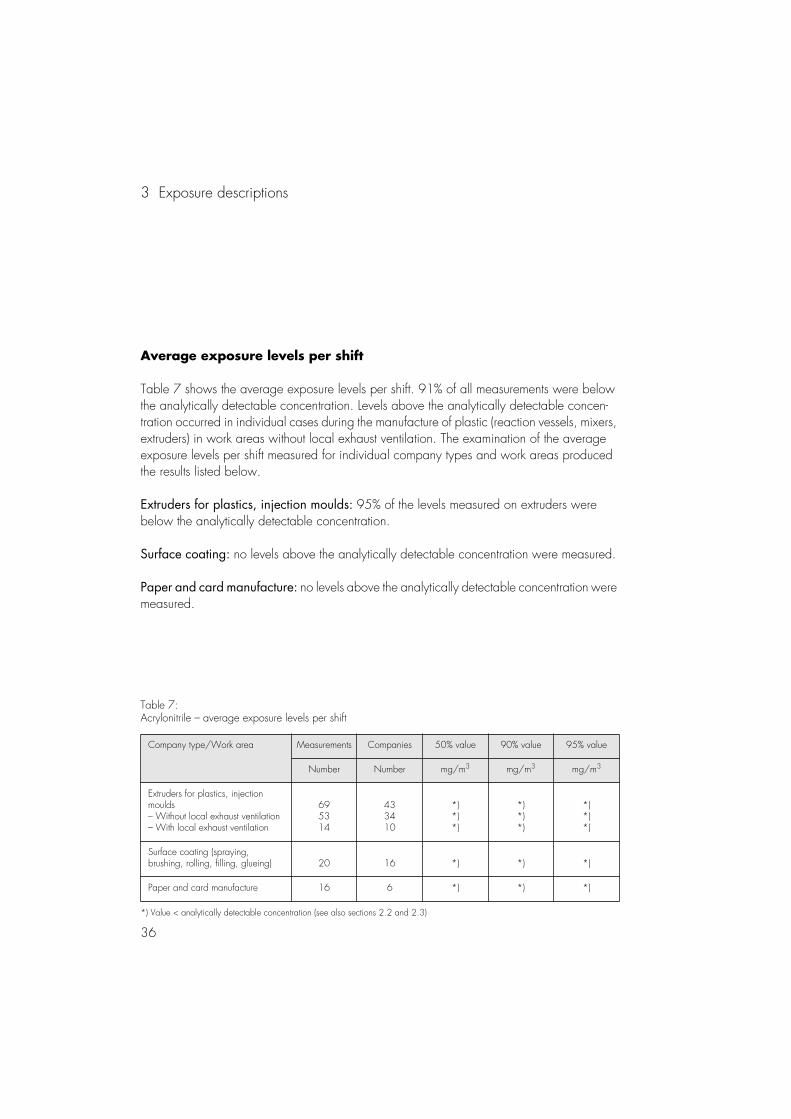
Average exposure levels per shift
Table 7 shows the average exposure levels per shift. 91% of all measurements were below the analytically detectable concentration. Levels above the analytically detectable concen-tration occurred in individual cases during the manufacture of plastic (reaction vessels, mixers, extruders) in work areas without local exhaust ventilation. The examination of the average exposure levels per shift measured for individual company types and work areas produced the results listed below.
Extruders for plastics, injection moulds: 95% of the levels measured on extruders were below the analytically detectable concentration.
Surface coating: no levels above the analytically detectable concentration were measured.
Paper and card manufacture: no levels above the analytically detectable concentration were measured.
Table 7:Acrylonitrile – average exposure levels per shift
Company type/Work area Measurements Companies 50% value 90% value 95% value
Number Number mg/m3 mg/m3 mg/m3
Extruders for plastics, injection moulds– Without local exhaust ventilation– With local exhaust ventilation
695314
433410
*)*)*)
*)*)*)
*)*)*)
Surface coating (spraying, brushing, rolling, filling, glueing) 20 16 *) *) *)
Paper and card manufacture 16 6 *) *) *)
*) Value < analytically detectable concentration (see also sections 2.2 and 2.3)
37
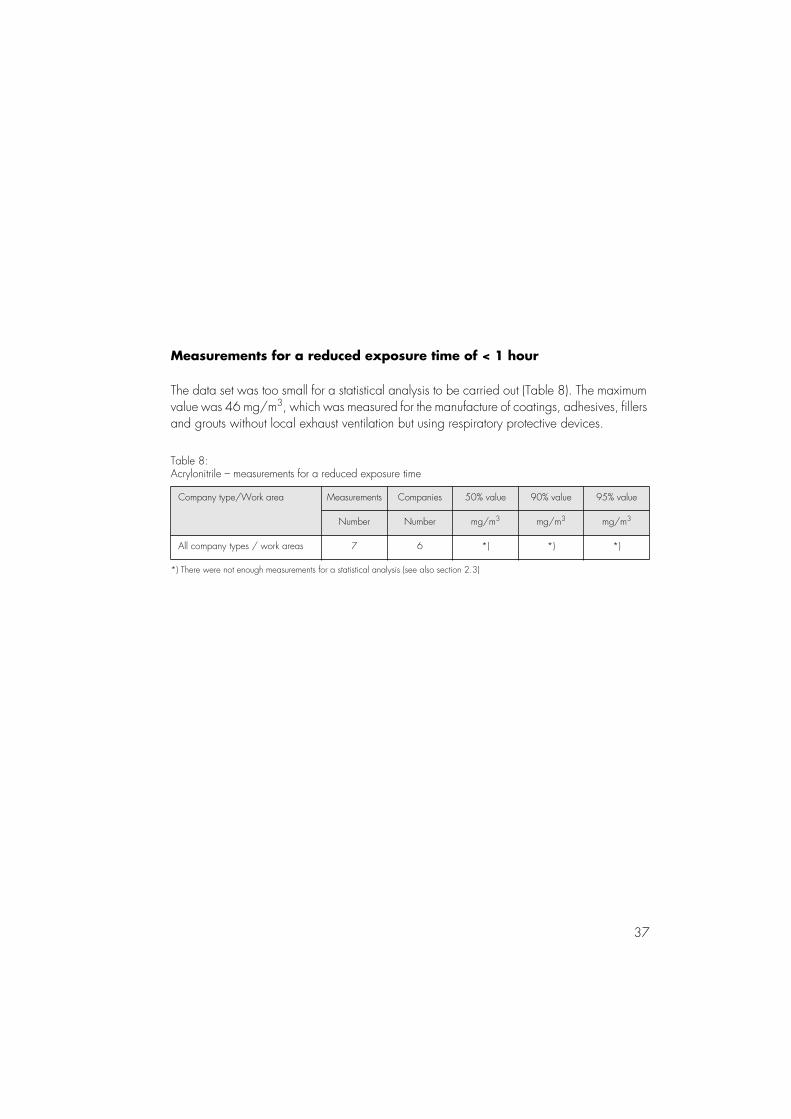
Measurements for a reduced exposure time of < 1 hour
The data set was too small for a statistical analysis to be carried out (Table 8). The maximum value was 46 mg/m3, which was measured for the manufacture of coatings, adhesives, fillers and grouts without local exhaust ventilation but using respiratory protective devices.
Table 8:Acrylonitrile – measurements for a reduced exposure time
Company type/Work area Measurements Companies 50% value 90% value 95% value
Number Number mg/m3 mg/m3 mg/m3
All company types / work areas 7 6 *) *) *)
*) There were not enough measurements for a statistical analysis (see also section 2.3)
3 Exposure descriptions
38
3.6 Aniline
Identification and limit values
Formula
Molecular weight in g/mol 93.12CAS-No. 62-53-3Synonyms aminobenzene, phenyl amineGerman limit value 8.0 mg/m3, 2.0 ml/m3 (MAK)Data collection period 1990 to 1995BGAA exposure description No. 34
Measurement method
A defined volume of air is sucked through an activated charcoal tube using a sampling pump. After extraction with methanol with 2% KOH, quantitative analysis is carried out by means of gaschromatography using a nitrogen-selective detector. The detectable concentration for two hours of sampling is 0.05 mg/m3.
Notes on the results
General
The measurements come from all areas of industry and work areas (for example plastics man-ufacture, glueing, waste disposal). 85% of the measurements are below the analytically detectable concentration.
39
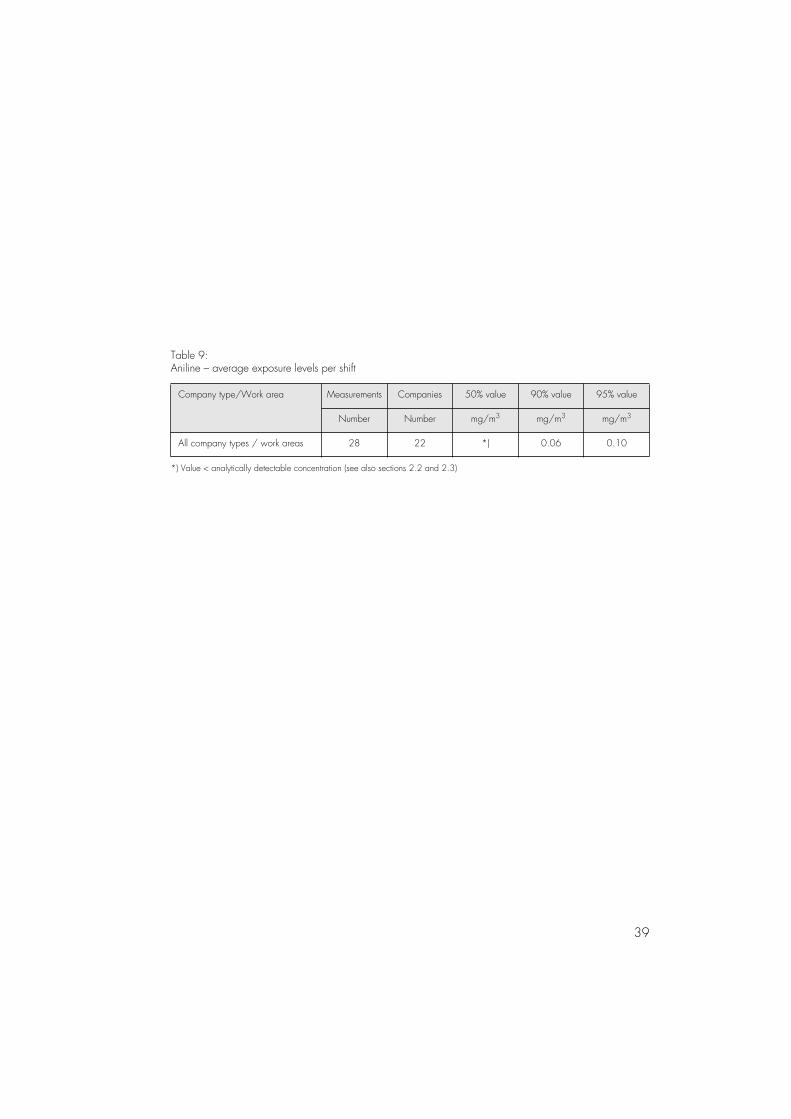
Table 9:Aniline – average exposure levels per shift
Company type/Work area Measurements Companies 50% value 90% value 95% value
Number Number mg/m3 mg/m3 mg/m3
All company types / work areas 28 22 *) 0.06 0.10
*) Value < analytically detectable concentration (see also sections 2.2 and 2.3)
3 Exposure descriptions
40
3.7 Benzene
Identification and limit values
Formula
Molecular weight in g/mol 78.11CAS-No. 71-43-2Synonyms –German limit value 8.0 mg/m3, 2.5 ml/m3 (TRK) for coke oven plants
(crude tar separators, condensers, gas exhauster), tank farms in the mineral oil industry and the repair and maintenance of petrol- or benzene-carrying components, otherwise 3.2 mg/m3, 1.0 ml/m3 (TRK)
Data collection period 1991 to 1995BGAA exposure description No. 13
Measurement method
A defined volume of air is sucked through an activated charcoal tube using a sampling pump. After extraction with carbon disulphide, quantitative analysis is carried out by means of gas-chromatography using a flame ionisation detector. The analytically detectable concentration for two hours of sampling was 1.0 mg/m3 until 1992 and since then has been 0.1 mg/m3 [12] (see also [16]).
Notes on the results
General
940 measurements were analysed from around 370 companies in the chemical, plastics, rubber, ceramics, glass, metalworking, mechanical engineering, electronics, precision
41
mechanics, construction, wholesale and transport industries, vehicle repair shops, foundries and other areas.
In most areas of the mineral oil industry, the chemical industry and coke-oven plants, measure-ments are generally taken by corporate and external bodies. These results are not included in the MEGA documentation. Measurements from these sectors are given in BIA Report 3/93 ”Arbeitsumweltdossier Benzol” (report on benzene in the working environment) [17].
Average exposure levels per shift
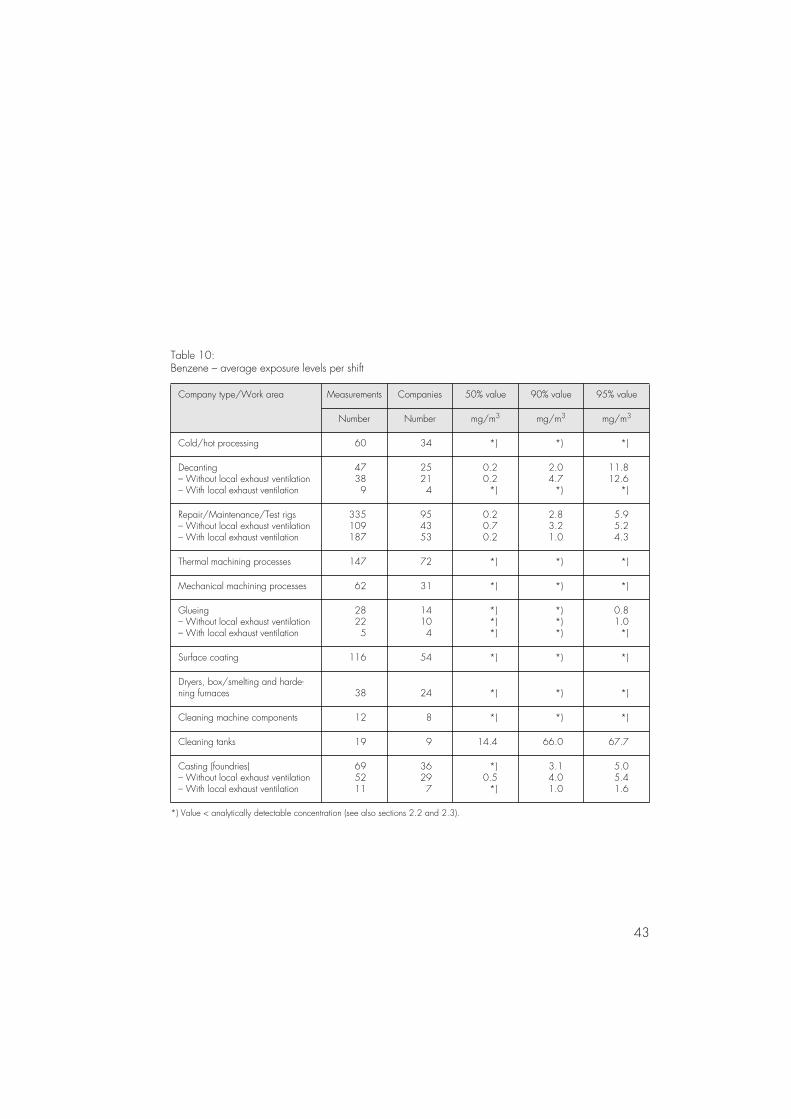
Table 10 shows the average exposure levels per shift. The examination of the average expo-sure levels per shift measured for individual company types and work areas produced the results listed below.
Cold/hot processing of plastics (kneading, pressing, extrusion): the measurements come from the plastics processing and electrical engineering sectors. All measurements were below the analytically detectable concentration.
Decanting: 85% of the measurements were taken in the chemical industry and the wholesale sector. Levels in the region of 90% occurred, for example, for decanting fuels or other mixtures with a high benzene content when no technical protective measures had been implemented.
Repair/Maintenance/Test rigs: the measurements were taken in the metalworking/mechan-ical engineering industries and at vehicle repair shops. Levels in the region of 90% were measured on engine test rigs and during petrol pumps and engine repairs (particularly carbu-rettors, fuel filters and fuel lines).
Thermal machining processes (welding, laser cutting, electrical cavity sinking): more than 80% of the measurements were taken for electrical cavity sinking operations in the metal-working and electrical engineering industries and for laser cutting in the plastics processing industry. The measurements were below the analytically detectable concentration.
Mechanical machining processes: the analysis focused on the metalworking and mechani-cal engineering industries. No levels above the analytically detectable concentration were measured.
3 Exposure descriptions
42
Glueing: the measurements were taken primarily in the plastics, rubber and shoe manufactur-ing industries. 90% of the levels measured were in the region of the analytically detectable concentration.
Surface coating (spray painting, brush/roller application, screen printing): the measure-ments were taken in all sectors of the processing industry. No levels above the analytically detectable concentration were measured.
Dryers, box/smelting and hardening furnaces: the measurements come predominantly from the metalworking industry (surface finishing). In all cases the measurements were below the analytically detectable concentration.
Cleaning machine components: the measurements were taken in the chemical industry and in printing works. No levels above the analytically detectable concentration were measured.
Cleaning tanks: the measurements were taken during the manual cleaning of tanks and on tank cleaning machines. Measurements for the cleaning of fuel oil and diesel tanks were below the 50% value, while levels above 50% were measured for the cleaning of crude ben-zene tankers. Local exhaust ventilation was either not used or had little effect.
Casting (foundries): levels in the region of 90% were measured for casting in resin-bonded moulds (furan and phenolic resins).
43
Table 10:Benzene – average exposure levels per shift
Company type/Work area Measurements Companies 50% value 90% value 95% value
Number Number mg/m3 mg/m3 mg/m3
Cold/hot processing 60 34 *) *) *)
Decanting– Without local exhaust ventilation– With local exhaust ventilation
47389
25214
0.20.2
*)
2.04.7
*)
11.812.6
*)
Repair/Maintenance/Test rigs– Without local exhaust ventilation– With local exhaust ventilation
335109187
954353
0.20.70.2
2.83.21.0
5.95.24.3
Thermal machining processes 147 72 *) *) *)
Mechanical machining processes 62 31 *) *) *)
Glueing– Without local exhaust ventilation– With local exhaust ventilation
28225
14104
*)*)*)
*)*)*)
0.81.0
*)
Surface coating 116 54 *) *) *)
Dryers, box/smelting and harde-ning furnaces 38 24 *) *) *)
Cleaning machine components 12 8 *) *) *)
Cleaning tanks 19 9 14.4 66.0 67.7
Casting (foundries)– Without local exhaust ventilation– With local exhaust ventilation
695211
36297
*)0.5
*)
3.14.01.0
5.05.41.6
*) Value < analytically detectable concentration (see also sections 2.2 and 2.3).
3 Exposure descriptions
44
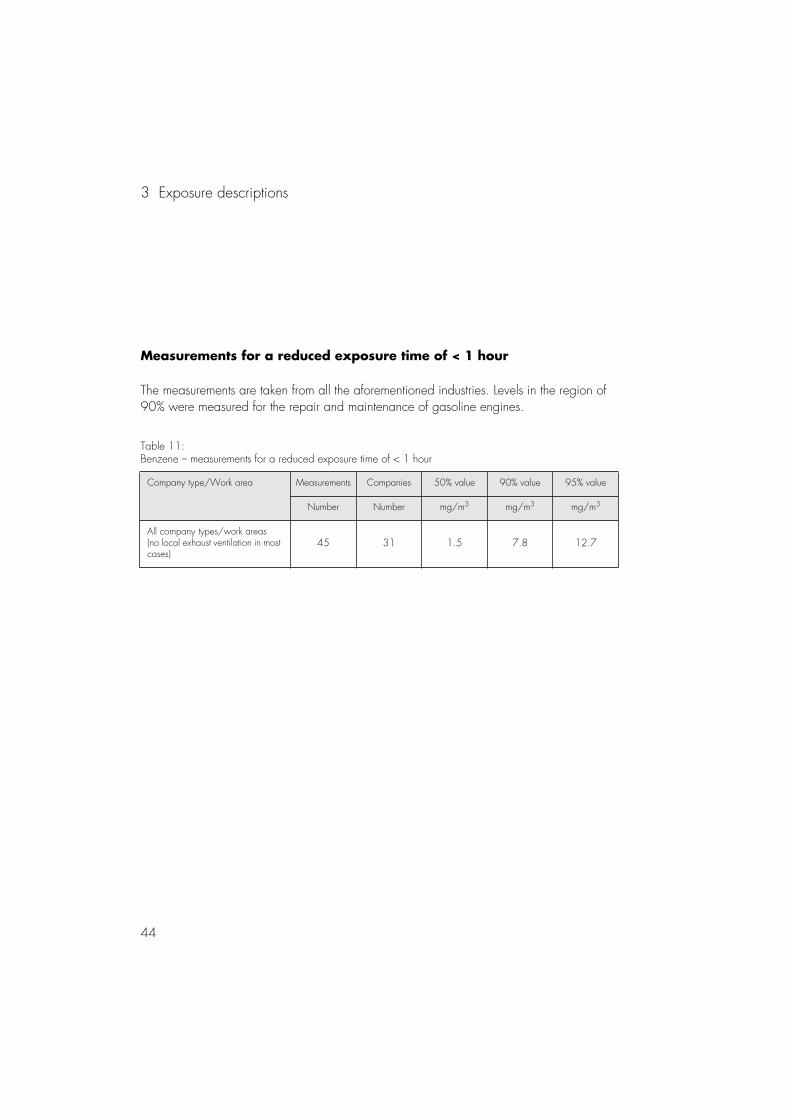
Measurements for a reduced exposure time of < 1 hour
The measurements are taken from all the aforementioned industries. Levels in the region of 90% were measured for the repair and maintenance of gasoline engines.
Table 11:Benzene – measurements for a reduced exposure time of < 1 hour
Company type/Work area Measurements Companies 50% value 90% value 95% value
Number Number mg/m3 mg/m3 mg/m3
All company types/work areas(no local exhaust ventilation in most cases)
45 31 1.5 7.8 12.7
45
3.8 1,3-Butadiene
Identification and limit values
Formula
Molecular weight in g/mol 54.09CAS No. 106-99-0Synonyms buta-1,3-diene, butadiene-1,3German limit value 11 mg/m3, 5 ml/m3 (34 mg/m3, 5 ml/m3 for processing
after polymerisation and for transportation (TRK)Data collection period 1990 to 1955BGAA exposure description No. 6
Measurement method
A defined volume of air is sucked through an activated charcoal tube using a sampling pump. After extraction with carbon disulphide, quantitative analysis is carried out by means of gaschromatography using a flame ionisation detector. The analytically detectable concen-tration for two hours of sampling is 1.0 mg/m3 (see also [18]).
Notes on the results
General
195 measurements from 104 companies were analysed. The processing of monomeric 1,3-butadiene occurs almost exclusively in the chemical industry.
3 Exposure descriptions
46
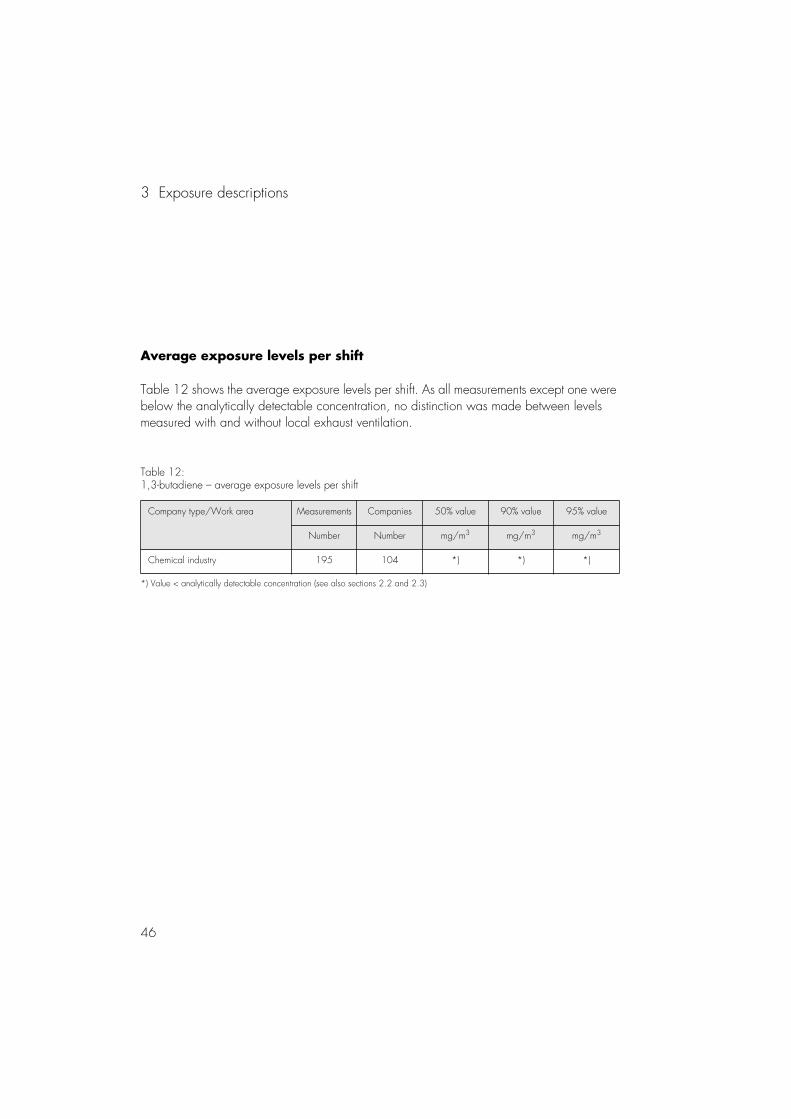
Average exposure levels per shift
Table 12 shows the average exposure levels per shift. As all measurements except one were below the analytically detectable concentration, no distinction was made between levels measured with and without local exhaust ventilation.
Table 12:1,3-butadiene – average exposure levels per shift
Company type/Work area Measurements Companies 50% value 90% value 95% value
Number Number mg/m3 mg/m3 mg/m3
Chemical industry 195 104 *) *) *)
*) Value < analytically detectable concentration (see also sections 2.2 and 2.3)
47
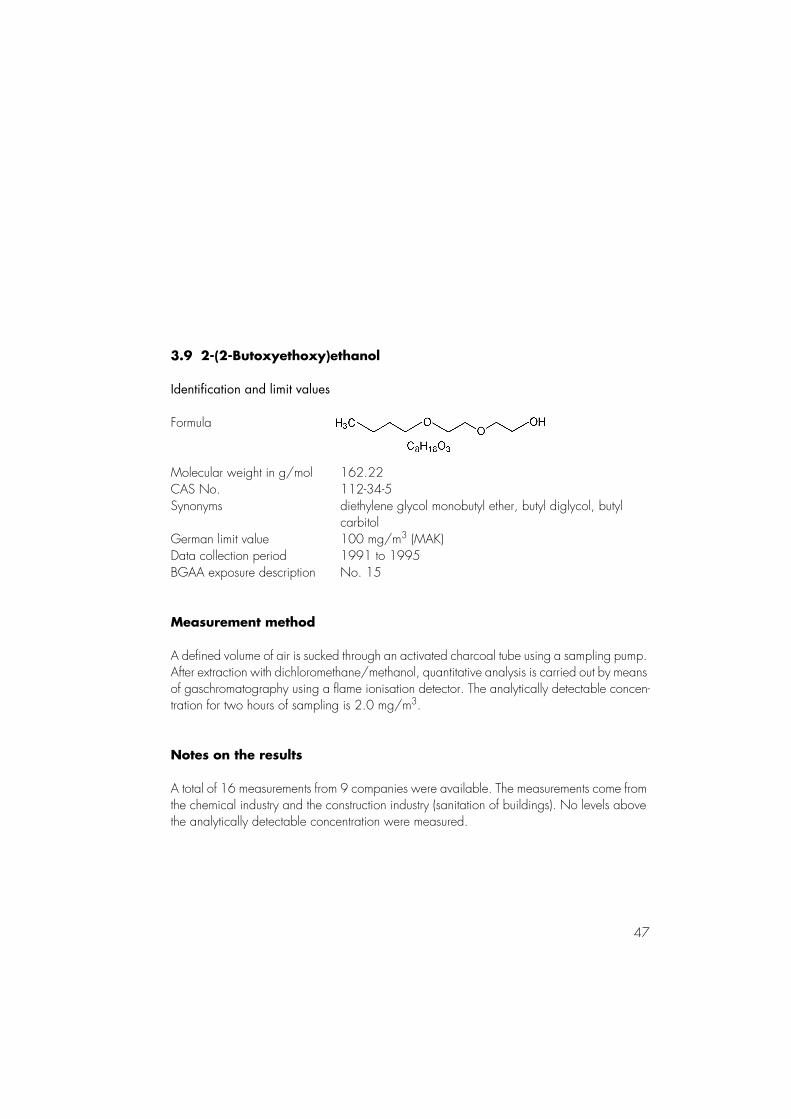
3.9 2-(2-Butoxyethoxy)ethanol
Identification and limit values
Formula
Molecular weight in g/mol 162.22CAS No. 112-34-5Synonyms diethylene glycol monobutyl ether, butyl diglycol, butyl
carbitolGerman limit value 100 mg/m3 (MAK)Data collection period 1991 to 1995BGAA exposure description No. 15
Measurement method
A defined volume of air is sucked through an activated charcoal tube using a sampling pump. After extraction with dichloromethane/methanol, quantitative analysis is carried out by means of gaschromatography using a flame ionisation detector. The analytically detectable concen-tration for two hours of sampling is 2.0 mg/m3.
Notes on the results
A total of 16 measurements from 9 companies were available. The measurements come from the chemical industry and the construction industry (sanitation of buildings). No levels above the analytically detectable concentration were measured.
3 Exposure descriptions
48
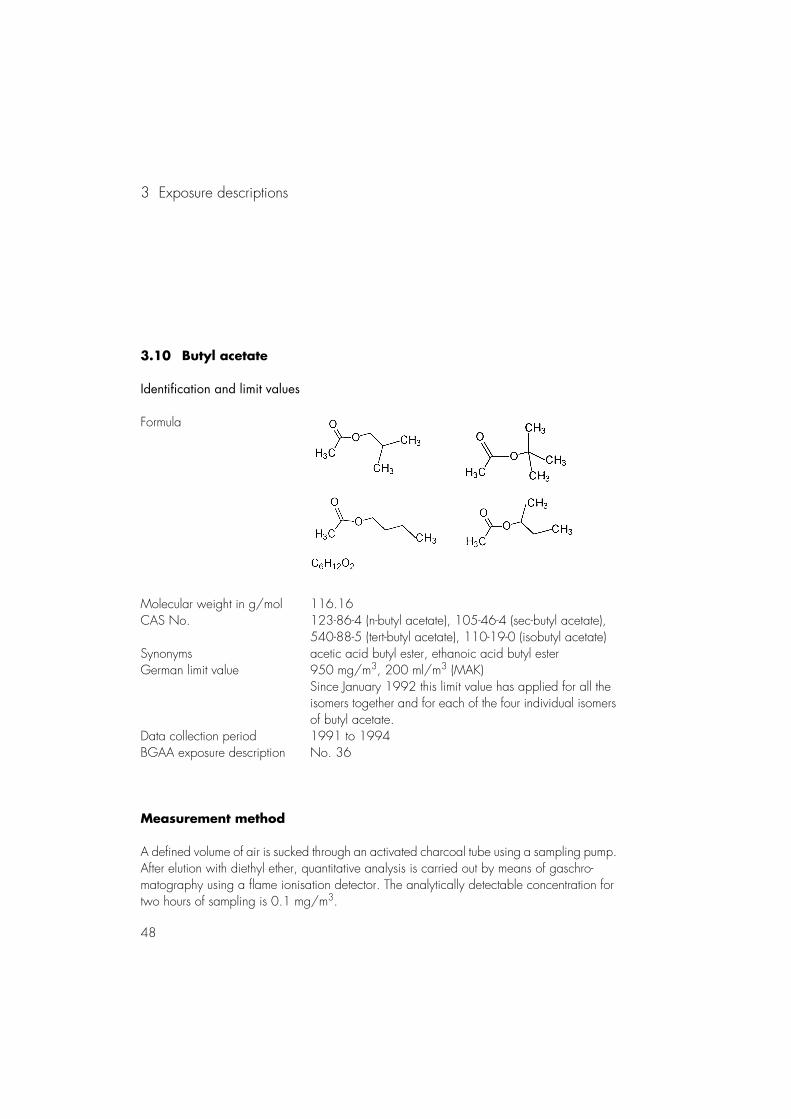
3.10 Butyl acetate
Identification and limit values
Formula
Molecular weight in g/mol 116.16CAS No. 123-86-4 (n-butyl acetate), 105-46-4 (sec-butyl acetate),
540-88-5 (tert-butyl acetate), 110-19-0 (isobutyl acetate)Synonyms acetic acid butyl ester, ethanoic acid butyl esterGerman limit value 950 mg/m3, 200 ml/m3 (MAK)
Since January 1992 this limit value has applied for all the isomers together and for each of the four individual isomers of butyl acetate.
Data collection period 1991 to 1994BGAA exposure description No. 36
Measurement method
A defined volume of air is sucked through an activated charcoal tube using a sampling pump. After elution with diethyl ether, quantitative analysis is carried out by means of gaschro-matography using a flame ionisation detector. The analytically detectable concentration for two hours of sampling is 0.1 mg/m3.
49
Notes on the results
General
Since 1995 the four isomeric butyl acetates have been analysed separately. Until 1994 an overall analysis was performed on the isomeric mix. It was for this reason that the period from 1991 to 1994 was chosen for the evaluation, although there is no reason to assume that the exposure situation changed significantly in the subsequent period. Although the OECD substances list only contains the CAS number for n-butyl acetate, it seems appropriate to examine all the isomers as it has to be assumed that isomeric mixes are used in industrial pro-duction.
The present analysis is based on 5,153 measurements from around 1,500 companies.
Average exposure levels per shift
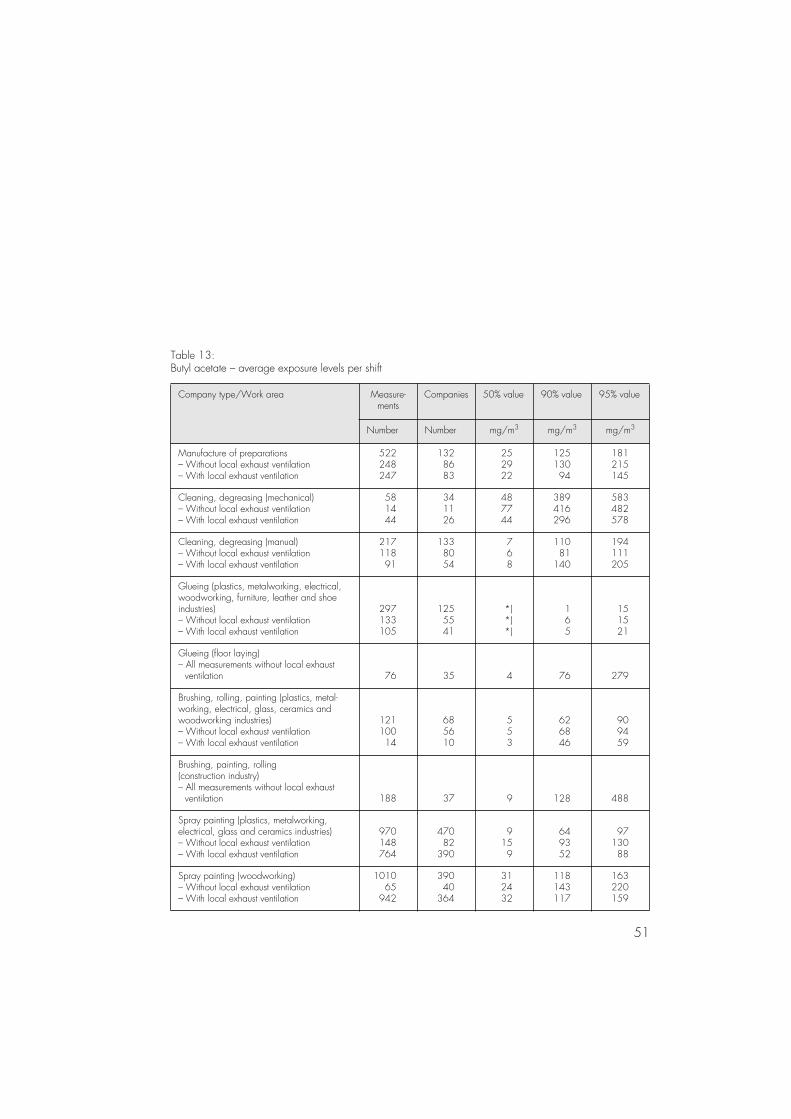
Table 13 shows the average exposure levels per shift. The examination of the average expo-sure levels per shift measured for individual company types and work areas produced the results listed below.
Manufacture of preparations: the data were collected from dissolvers, bead mills and de-canting machines. Levels in the region of 90% were measured for preparation and decanting.
Cleaning, degreasing, mechanical: the data were collected predominantly in the metal-working and chemical industries. Levels in the region of 90% were measured on container cleaning machines in paint production plants.
Cleaning, degreasing, manual: the data were collected predominantly in the metalworking and woodworking industries and in paint production plants. Levels in the region of 90% were measured for the cleaning of machines and containers (for example in paint production plants).
3 Exposure descriptions
50
Glueing (plastics, metalworking, electrical, woodworking, furniture, leather and shoe industries): levels in the region of 90% were measured for the spraying of adhesives in the furniture industry.
Glueing (floor laying with wood, textiles, plastics): levels in the region of 90% were meas-ured for the spreading of adhesives in rooms without ventilation.
Brushing, rolling, painting (plastics, metalworking, electrical, glass, ceramics and wood-working industries): levels in the region of 90% were measured for painting in areas without local exhaust ventilation.
Brushing, rolling, painting (construction industry): the data were collected during the paint-ing of walls, windows and domestic installations. Levels in the region of 90% were measured for the roller application of primers in rooms without ventilation.
Spray painting (plastics, metalworking, electrical, glass and ceramics industries): the data were collected predominantly on dry-type and waterwash spraybooths.
Spray painting (construction industry): the data were collected predominantly during the painting of metal components.
Spray painting (woodworking): the data were collected predominantly on dry-type and waterwash spraybooths.
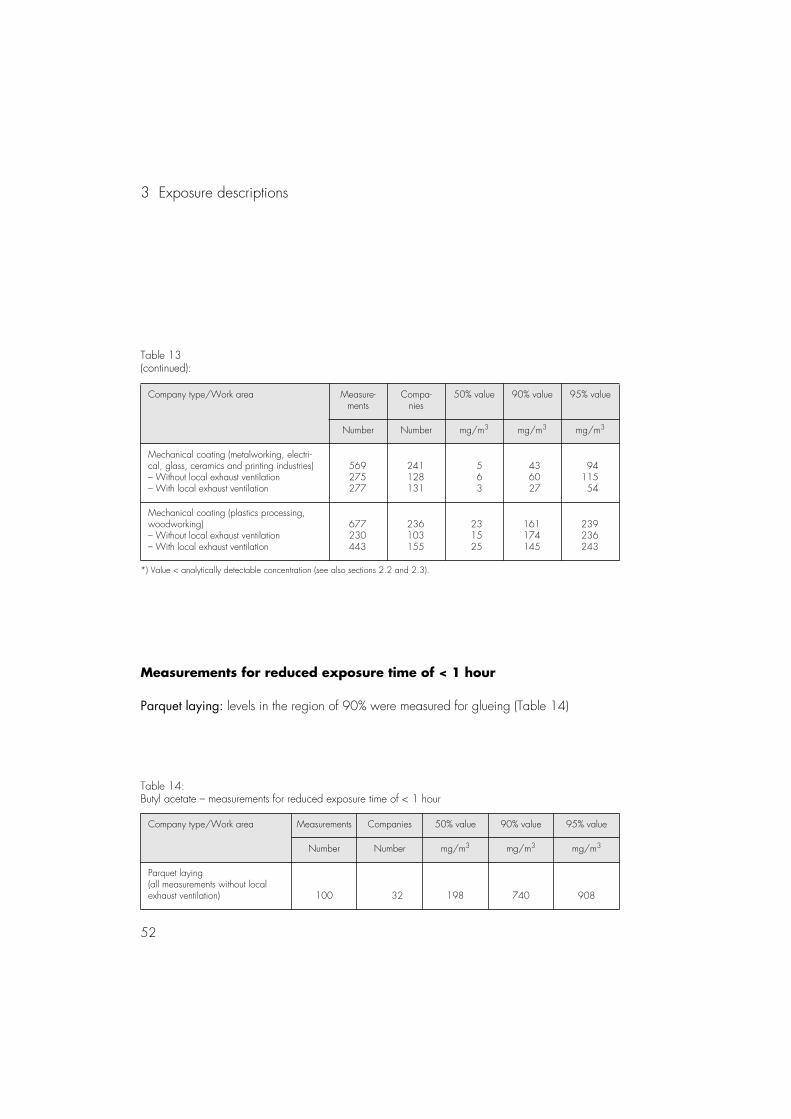
Mechanical coating (metalworking, electrical, glass, ceramics and printing industries): the data were collected during dip-coating, casting and spreading (paints) and during laminating. Levels in the region of 90% were measured for paint immersion baths (some open, without local exhaust ventilation).
Mechanical coating (plastics processing, woodworking): the measurements for areas with-out local exhaust ventilation were taken predominantly on (paint) cast-coating machines, where extractors cannot generally be used for technical reasons (the film of paint starts to come away if there is strong air movement). The measurements for areas with local exhaust ventilation were taken on operators/supervisors of spray robots on enamelling lines. These facilities are generally enclosed.
51
Table 13:Butyl acetate – average exposure levels per shift
Company type/Work area Measure-ments
Companies 50% value 90% value 95% value
Number Number mg/m3 mg/m3 mg/m3
Manufacture of preparations– Without local exhaust ventilation– With local exhaust ventilation
522248247
1328683
252922
12513094
181215145
Cleaning, degreasing (mechanical)– Without local exhaust ventilation– With local exhaust ventilation
581444
341126
487744
389416296
583482578
Cleaning, degreasing (manual)– Without local exhaust ventilation– With local exhaust ventilation
21711891
1338054
768
11081
140
194111205
Glueing (plastics, metalworking, electrical, woodworking, furniture, leather and shoe industries)– Without local exhaust ventilation– With local exhaust ventilation
297133105
1255541
*)*)*)
165
151521
Glueing (floor laying)– All measurements without local exhaust ventilation 76 35 4 76 279
Brushing, rolling, painting (plastics, metal-working, electrical, glass, ceramics and woodworking industries)– Without local exhaust ventilation– With local exhaust ventilation
12110014
685610
553
626846
909459
Brushing, painting, rolling (construction industry)– All measurements without local exhaust ventilation 188 37 9 128 488
Spray painting (plastics, metalworking, electrical, glass and ceramics industries)– Without local exhaust ventilation– With local exhaust ventilation
970148764
47082
390
9159
649352
9713088
Spray painting (woodworking)– Without local exhaust ventilation– With local exhaust ventilation
101065
942
39040
364
312432
118143117
163220159
3 Exposure descriptions
52
Table 13(continued):
Company type/Work area Measure-ments
Compa-nies
50% value 90% value 95% value
Number Number mg/m3 mg/m3 mg/m3
Mechanical coating (metalworking, electri-cal, glass, ceramics and printing industries)– Without local exhaust ventilation– With local exhaust ventilation
569275277
241128131
563
436027
9411554
Mechanical coating (plastics processing, woodworking)– Without local exhaust ventilation– With local exhaust ventilation
677230443
236103155
231525
161174145
239236243
*) Value < analytically detectable concentration (see also sections 2.2 and 2.3).
Measurements for reduced exposure time of < 1 hour
Parquet laying: levels in the region of 90% were measured for glueing (Table 14)
Table 14:Butyl acetate – measurements for reduced exposure time of < 1 hour
Company type/Work area Measurements Companies 50% value 90% value 95% value
Number Number mg/m3 mg/m3 mg/m3
Parquet laying(all measurements without local exhaust ventilation) 100 32 198 740 908
53
3.11 Cadmium
Identification and limit values
Formula CdCAS No. 7440-43-9Synonyms –German limit value 15 mg/m3 (0.015 mg/m3, TRK) for battery manufacture,
30 µg/m3 (0.03 mg/m3, TRK) for thermal zinc, lead and copper extraction and the welding of cadmium-containing alloys
Data collection period 1991 to 1996BGAA exposure description No. 37
Measurement method
The methods used determine the levels of cadmium together with its compounds in the form of dusts and aerosols.
A defined volume of air is sucked through a glass fibre filter (stationary sampling) or membrane filter (sampling carried out with apparatus worn by a human subject) using a sampling pump. After dissolution, the cadmium contained in the overall volume of dust is measured by means of atomic absorption spectrometry (flame or graphite tube) or X-ray fluorescence spectrometry. Depending on the measurement method used, the analytically detectable concentration for two hours of sampling is 2.0 µg/m3 or 0.07 µg/m3 (see also [19]).
Notes on the results
General
1,101 measurements from around 300 companies were analysed in compliance with the Data Protection Act.
3 Exposure descriptions
54
The individual cadmium compounds contained in the EU and OECD lists were measured to-gether to give the overall level of cadmium as the active component. Conclusions regarding the presence of specific cadmium compounds can be drawn by referring to the literature.
Average exposure levels per shift
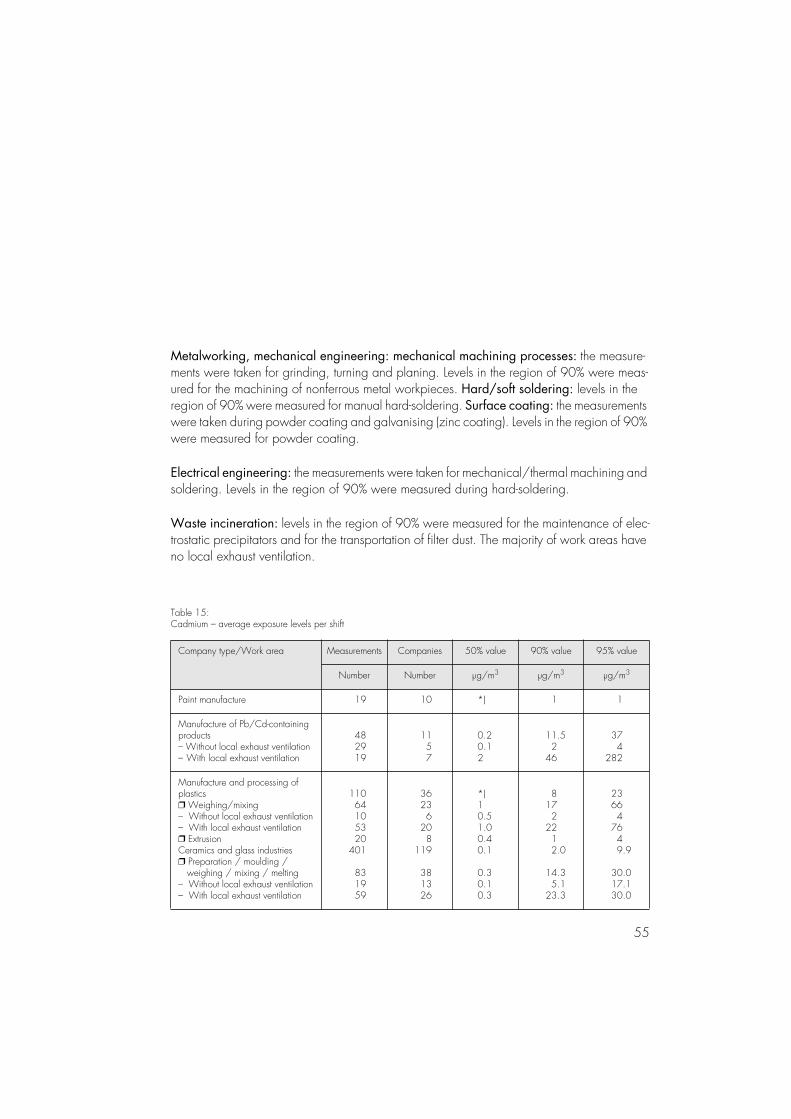
Table 15 shows the average exposure levels per shift. The examination of the average exposure levels per shift measured for individual company types and work areas produced the results listed below.
Paint manufacture: the measurements were taken during the preparation (weighing, mixing) of pigments and other colour components. Levels in the region of 90% were measured during screening and emptying processes.
Manufacture of Pb/Cd-containing products: the measurements were taken for preparation, weighing, mixing and smelting during the manufacture of red lead, lead monoxide and lead-containing stabilisers. No local exhaust ventilation was used in the majority of the smelting furnaces.
Manufacture and processing of plastics: weighing/mixing: levels in the region of 90% were measured during the processing of cadmium-containing pigments. Extrusion: levels in the region of 90% were measured during the processing of cadmium-containing stabilisers.
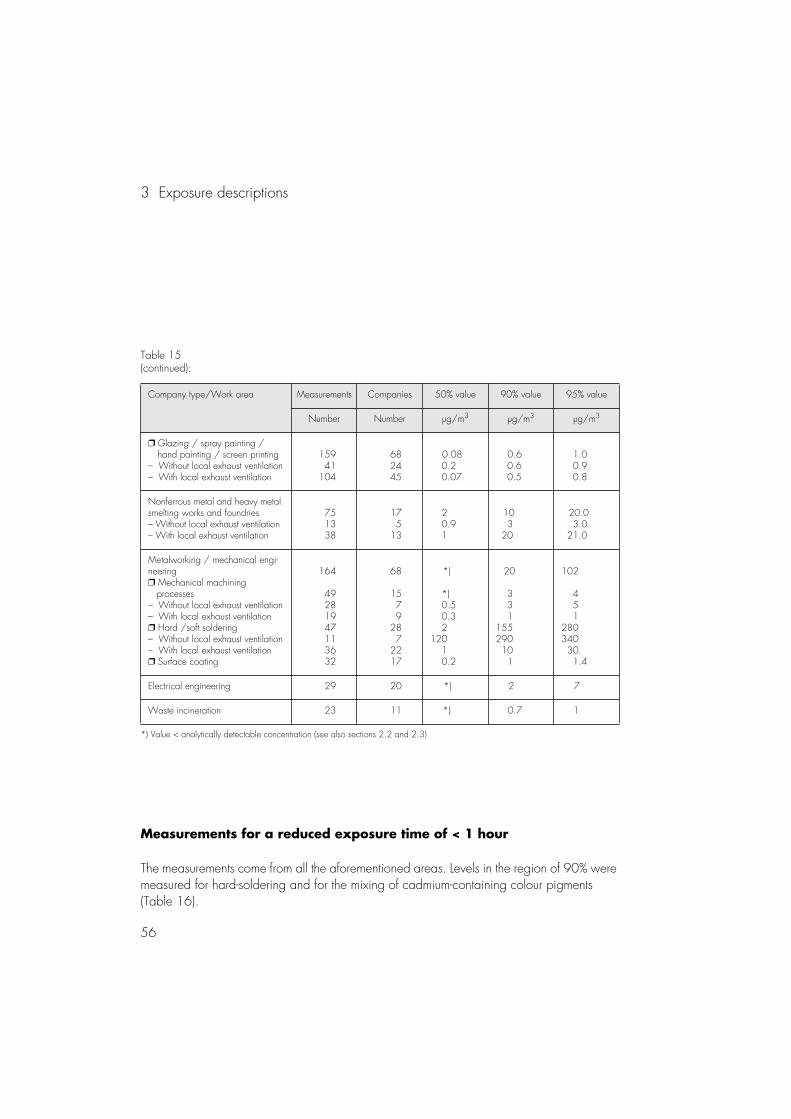
Ceramics and glass industries, screen printing: preparation / moulding / weighing / mixing / melting: levels in the region of 90% were measured for the processing of powdered cadmium-containing pigments to make glazes and printing inks for ceramics. Glazing / spray painting / hand painting / screen printing: processing cadmium-containing pigments in solutions involves lower exposure levels. Levels in the region of 90% were measured for spray painting.
Nonferrous metal and heavy metal smelting works and foundries: the measurements were taken during preparation, smelting (various processes) and casting. Levels in the region of 90% were measured for the smelting of recyclable process material (slag, scrap).
55
Metalworking, mechanical engineering: mechanical machining processes: the measure-ments were taken for grinding, turning and planing. Levels in the region of 90% were meas-ured for the machining of nonferrous metal workpieces. Hard/soft soldering: levels in the region of 90% were measured for manual hard-soldering. Surface coating: the measurements were taken during powder coating and galvanising (zinc coating). Levels in the region of 90% were measured for powder coating.
Electrical engineering: the measurements were taken for mechanical/thermal machining and soldering. Levels in the region of 90% were measured during hard-soldering.
Waste incineration: levels in the region of 90% were measured for the maintenance of elec-trostatic precipitators and for the transportation of filter dust. The majority of work areas have no local exhaust ventilation.
Table 15:Cadmium – average exposure levels per shift
Company type/Work area Measurements Companies 50% value 90% value 95% value
Number Number µg/m3 µg/m3 µg/m3
Paint manufacture 19 10 *) 1 1
Manufacture of Pb/Cd-containing products– Without local exhaust ventilation– With local exhaust ventilation
482919
1157
0.20.12
11.52
46
374
282
Manufacture and processing of plastics❒ Weighing/mixing– Without local exhaust ventilation– With local exhaust ventilation❒ ExtrusionCeramics and glass industries❒ Preparation / moulding / weighing / mixing / melting– Without local exhaust ventilation– With local exhaust ventilation
11064105320
401
831959
36236
208
119
381326
*)10.51.00.40.1
0.30.10.3
8172
2212.0
14.35.1
23.3
23664
7649.9
30.017.130.0
3 Exposure descriptions
56
Table 15(continued):
Company type/Work area Measurements Companies 50% value 90% value 95% value
Number Number µg/m3 µg/m3 µg/m3
❒ Glazing / spray painting / hand painting / screen printing– Without local exhaust ventilation– With local exhaust ventilation
15941
104
682445
0.08 0.2 0.07
0.6 0.6 0.5
1.0 0.9 0.8
Nonferrous metal and heavy metal smelting works and foundries– Without local exhaust ventilation– With local exhaust ventilation
751338
175
13
2 0.9 1
10 3 20
20.0 3.0 21.0
Metalworking / mechanical engi-neering❒ Mechanical machining processes– Without local exhaust ventilation– With local exhaust ventilation❒ Hard /soft soldering– Without local exhaust ventilation– With local exhaust ventilation❒ Surface coating
164
49281947113632
68
1579
287
2217
*)
*) 0.5 0.3 2120 1 0.2
20
3 3 1155290 10 1
102
4 5 1280340 30. 1.4
Electrical engineering 29 20 *) 2 7
Waste incineration 23 11 *) 0.7 1
*) Value < analytically detectable concentration (see also sections 2.2 and 2.3)
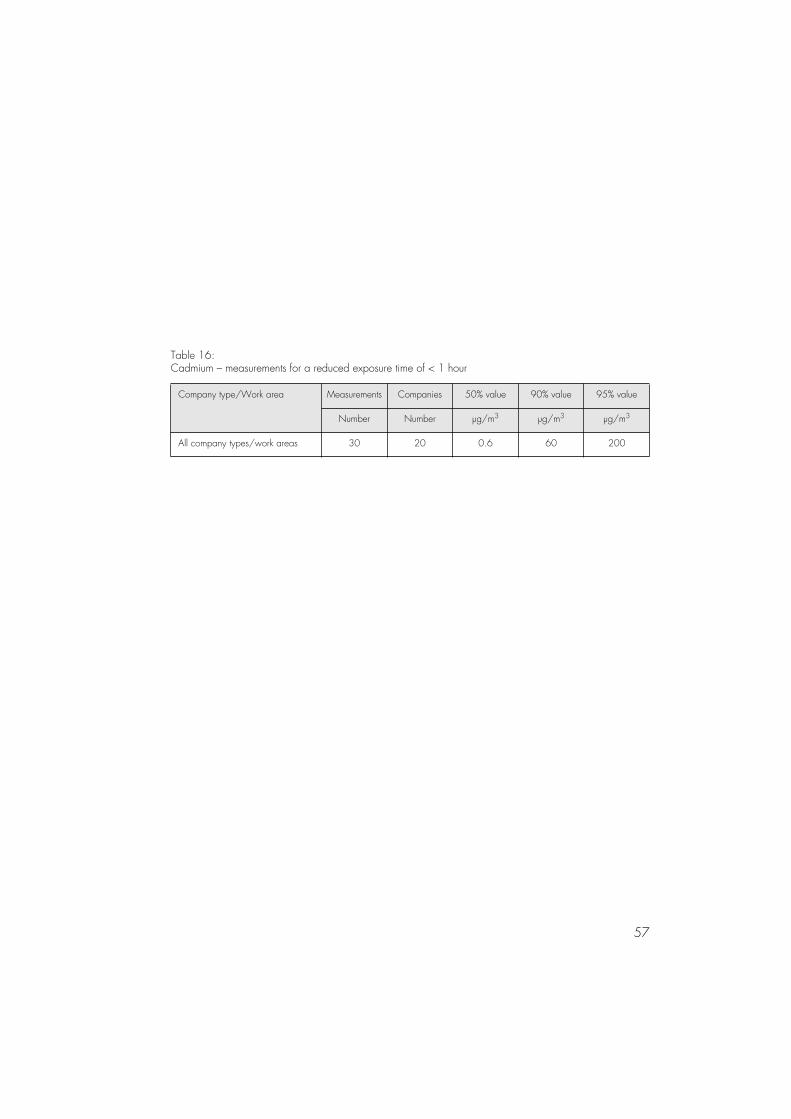
Measurements for a reduced exposure time of < 1 hour
The measurements come from all the aforementioned areas. Levels in the region of 90% were measured for hard-soldering and for the mixing of cadmium-containing colour pigments (Table 16).
57
Table 16:Cadmium – measurements for a reduced exposure time of < 1 hour
Company type/Work area Measurements Companies 50% value 90% value 95% value
Number Number µg/m3 µg/m3 µg/m3
All company types/work areas 30 20 0.6 60 200
3 Exposure descriptions
58
3.12 Chlorine
Identification and limit values
Formula Cl2CAS No. 7782-50-5Synonyms -German limit value 1.5 mg/m3, 0.5 ml/m3 (MAK)Data collection period 1992 to 1997BGAA exposure description No. 41
Measurement method
A defined volume of air is sucked through an activated charcoal tube (0.1 M sodium hydrox-ide solution) using a sampling pump. Quantitative analysis is carried out using a potentio-meter. The analytically detectable concentration for two hours of sampling is 0.1 mg/m3.
Notes on the results
General
55 measurements from 28 companies were analysed in compliance with the Data Protection Act.
Average exposure levels per shift
Table 17 shows the average exposure levels per shift. The examination of the average expo-sure levels per shift measured for individual company types and work areas produced the results listed below.
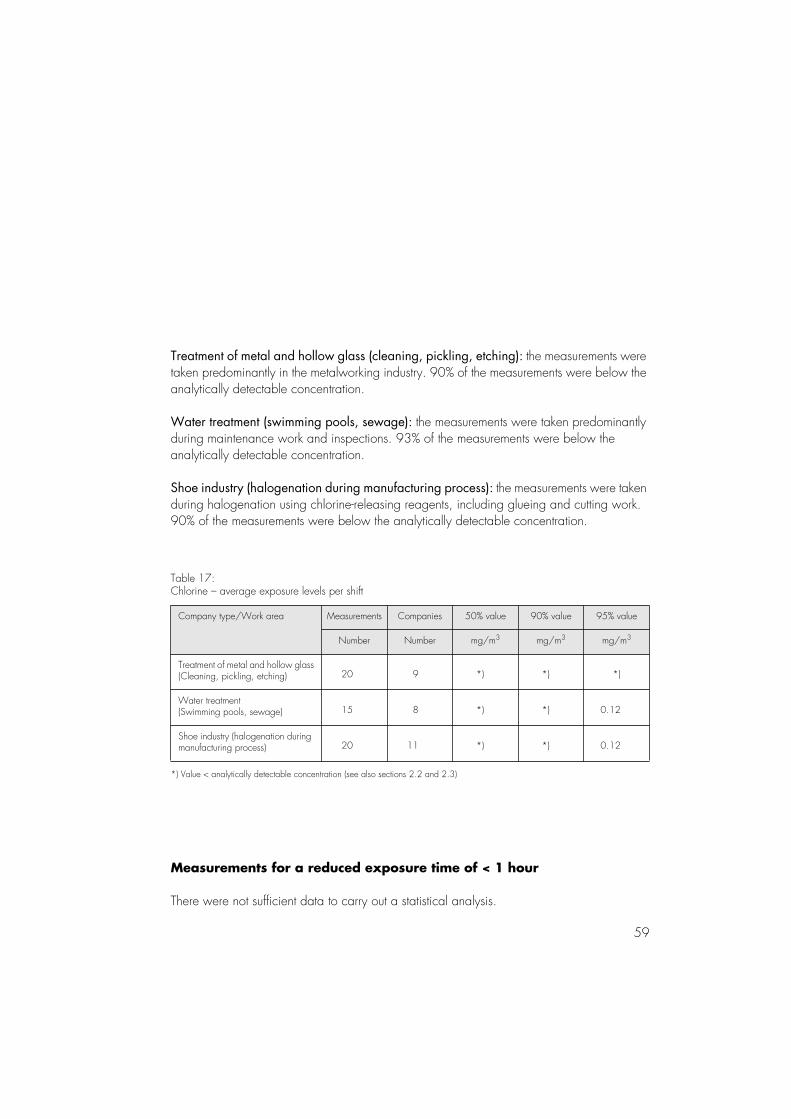
59
Treatment of metal and hollow glass (cleaning, pickling, etching): the measurements were taken predominantly in the metalworking industry. 90% of the measurements were below the analytically detectable concentration.
Water treatment (swimming pools, sewage): the measurements were taken predominantly during maintenance work and inspections. 93% of the measurements were below the analytically detectable concentration.
Shoe industry (halogenation during manufacturing process): the measurements were taken during halogenation using chlorine-releasing reagents, including glueing and cutting work. 90% of the measurements were below the analytically detectable concentration.
Table 17:Chlorine – average exposure levels per shift
Company type/Work area Measurements Companies 50% value 90% value 95% value
Number Number mg/m3 mg/m3 mg/m3
Treatment of metal and hollow glass(Cleaning, pickling, etching) 20 9 *) *) *)
Water treatment (Swimming pools, sewage) 15 8 *) *) 0.12
Shoe industry (halogenation during manufacturing process) 20 11 *) *) 0.12
*) Value < analytically detectable concentration (see also sections 2.2 and 2.3)
Measurements for a reduced exposure time of < 1 hour
There were not sufficient data to carry out a statistical analysis.
3.73.83.93.103.113.12
3.13.23.33.43.53.6
3 Exposure descriptions
60
3.13 Cyclohexane
Identification and limit values
Formula
Molecular weight in g/mol 84.16CAS No. 110-82-7Synonyms hexaethyleneGerman limit value 1050 mg/m3, 300 ml/m3 (MAK)Data collection period 1991 to 1995BGAA exposure description No. 17
Measurement method
A defined volume of air was sucked through an activated charcoal tube using a sampling pump. After elution with diethyl ether, quantitative analysis was carried out by means of gaschromatography using a flame ionisation detector. The analytically detectable concen-tration for two hours of sampling is 0.1 mg/m3.
Notes on the results
General
A total of 1,644 measurements from around 50 companies were available.
Average exposure levels per shift
Table 18 shows the average exposure levels per shift. The examination of the average expo-sure levels per shift measured for individual company types and work areas produced the results listed below.
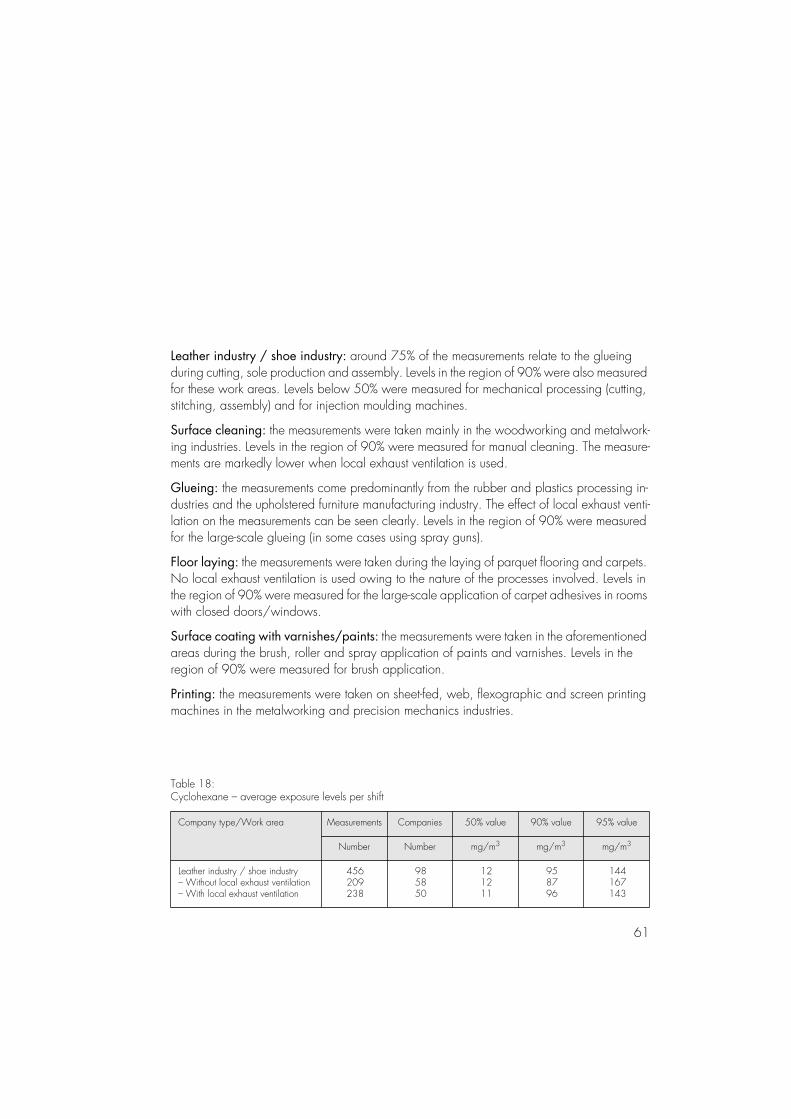
61
Leather industry / shoe industry: around 75% of the measurements relate to the glueing during cutting, sole production and assembly. Levels in the region of 90% were also measured for these work areas. Levels below 50% were measured for mechanical processing (cutting, stitching, assembly) and for injection moulding machines.
Surface cleaning: the measurements were taken mainly in the woodworking and metalwork-ing industries. Levels in the region of 90% were measured for manual cleaning. The measure-ments are markedly lower when local exhaust ventilation is used.
Glueing: the measurements come predominantly from the rubber and plastics processing in-dustries and the upholstered furniture manufacturing industry. The effect of local exhaust venti-lation on the measurements can be seen clearly. Levels in the region of 90% were measured for the large-scale glueing (in some cases using spray guns).
Floor laying: the measurements were taken during the laying of parquet flooring and carpets. No local exhaust ventilation is used owing to the nature of the processes involved. Levels in the region of 90% were measured for the large-scale application of carpet adhesives in rooms with closed doors/windows.
Surface coating with varnishes/paints: the measurements were taken in the aforementioned areas during the brush, roller and spray application of paints and varnishes. Levels in the region of 90% were measured for brush application.
Printing: the measurements were taken on sheet-fed, web, flexographic and screen printing machines in the metalworking and precision mechanics industries.
Table 18:Cyclohexane – average exposure levels per shift
Company type/Work area Measurements Companies 50% value 90% value 95% value
Number Number mg/m3 mg/m3 mg/m3
Leather industry / shoe industry– Without local exhaust ventilation– With local exhaust ventilation
456209238
985850
121211
958796
144167143
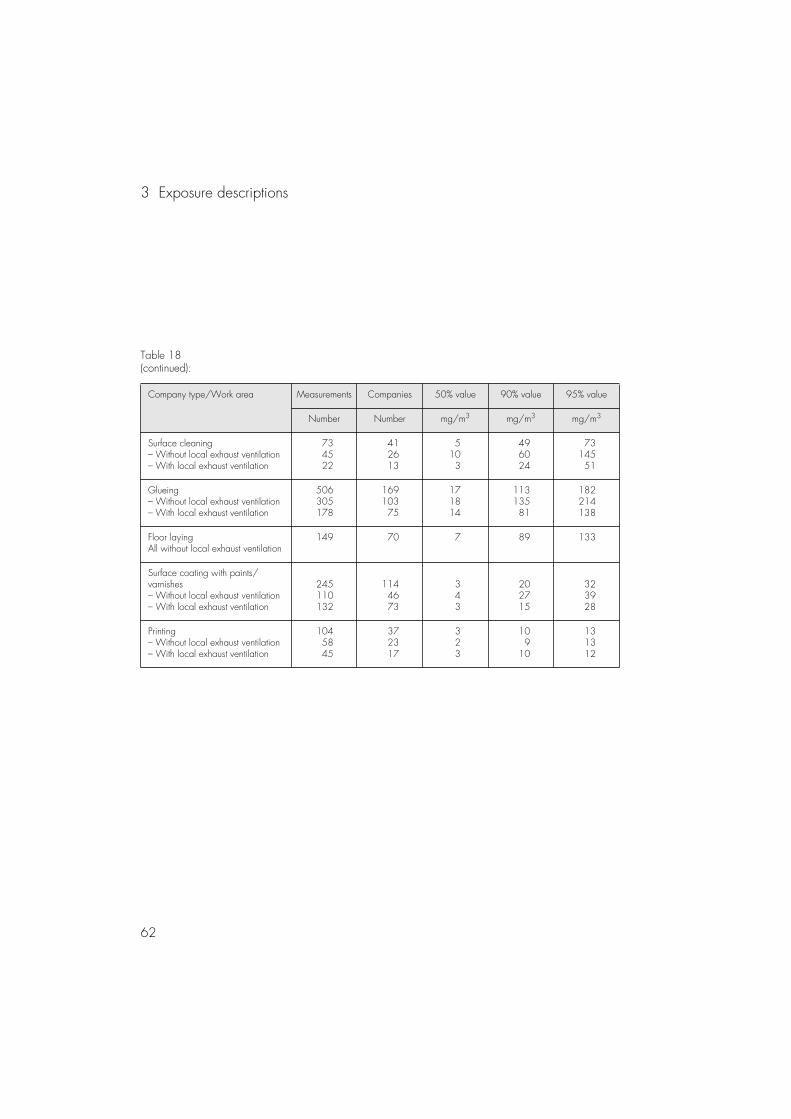
3 Exposure descriptions
62
Table 18(continued):
Company type/Work area Measurements Companies 50% value 90% value 95% value
Number Number mg/m3 mg/m3 mg/m3
Surface cleaning– Without local exhaust ventilation– With local exhaust ventilation
734522
412613
5103
496024
7314551
Glueing– Without local exhaust ventilation– With local exhaust ventilation
506305178
16910375
171814
11313581
182214138
Floor layingAll without local exhaust ventilation
149 70 7 89 133
Surface coating with paints/varnishes– Without local exhaust ventilation– With local exhaust ventilation
245110132
1144673
343
202715
323928
Printing– Without local exhaust ventilation– With local exhaust ventilation
1045845
372317
323
109
10
131312
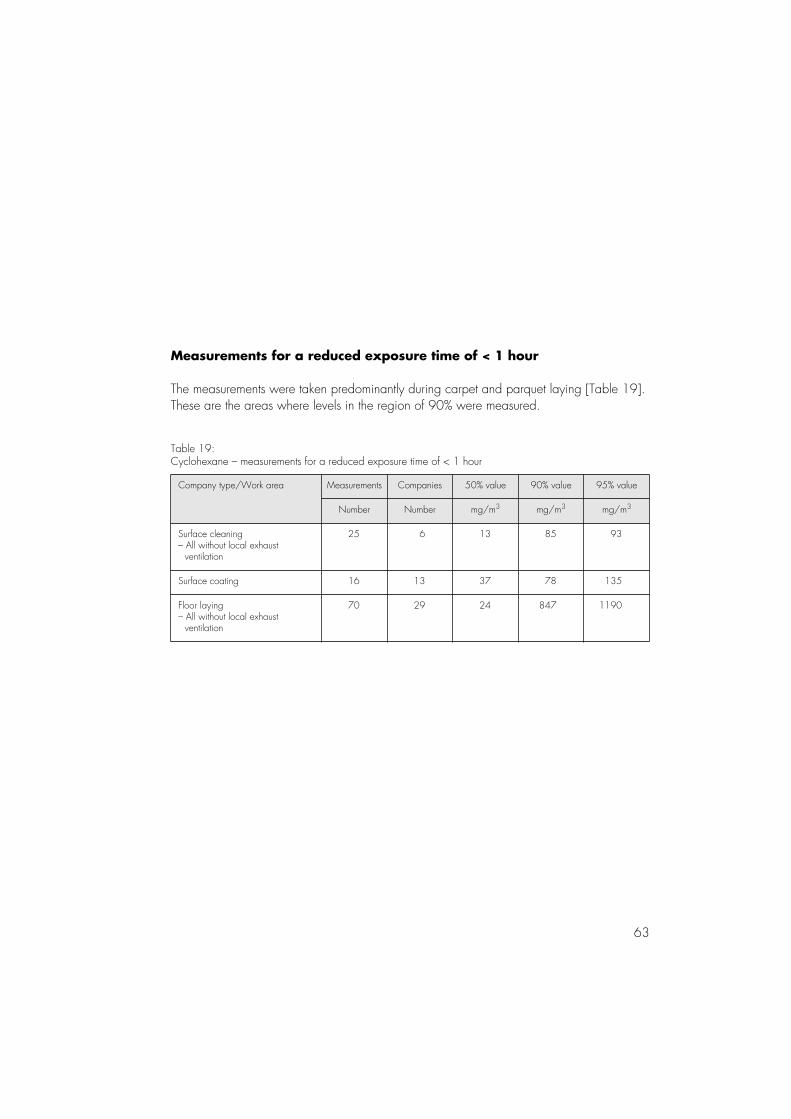
63
Measurements for a reduced exposure time of < 1 hour
The measurements were taken predominantly during carpet and parquet laying [Table 19]. These are the areas where levels in the region of 90% were measured.
Table 19:Cyclohexane – measurements for a reduced exposure time of < 1 hour
Company type/Work area Measurements Companies 50% value 90% value 95% value
Number Number mg/m3 mg/m3 mg/m3
Surface cleaning– All without local exhaust ventilation
25 6 13 85 93
Surface coating 16 13 37 78 135
Floor laying– All without local exhaust ventilation
70 29 24 847 1190
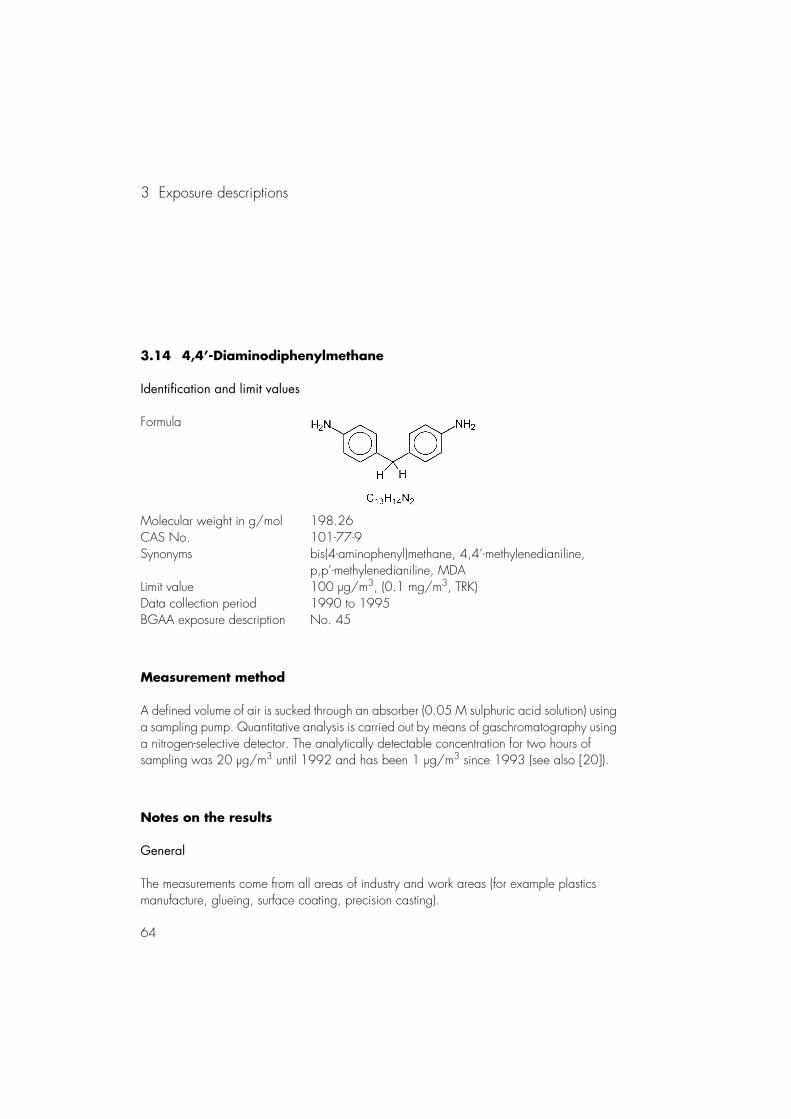
3 Exposure descriptions
64
3.14 4,4’-Diaminodiphenylmethane
Identification and limit values
Formula
Molecular weight in g/mol 198.26CAS No. 101-77-9Synonyms bis(4-aminophenyl)methane, 4,4’-methylenedianiline,
p,p’-methylenedianiline, MDALimit value 100 µg/m3, (0.1 mg/m3, TRK)Data collection period 1990 to 1995BGAA exposure description No. 45
Measurement method
A defined volume of air is sucked through an absorber (0.05 M sulphuric acid solution) using a sampling pump. Quantitative analysis is carried out by means of gaschromatography using a nitrogen-selective detector. The analytically detectable concentration for two hours of sampling was 20 µg/m3 until 1992 and has been 1 µg/m3 since 1993 (see also [20]).
Notes on the results
General
The measurements come from all areas of industry and work areas (for example plastics manufacture, glueing, surface coating, precision casting).
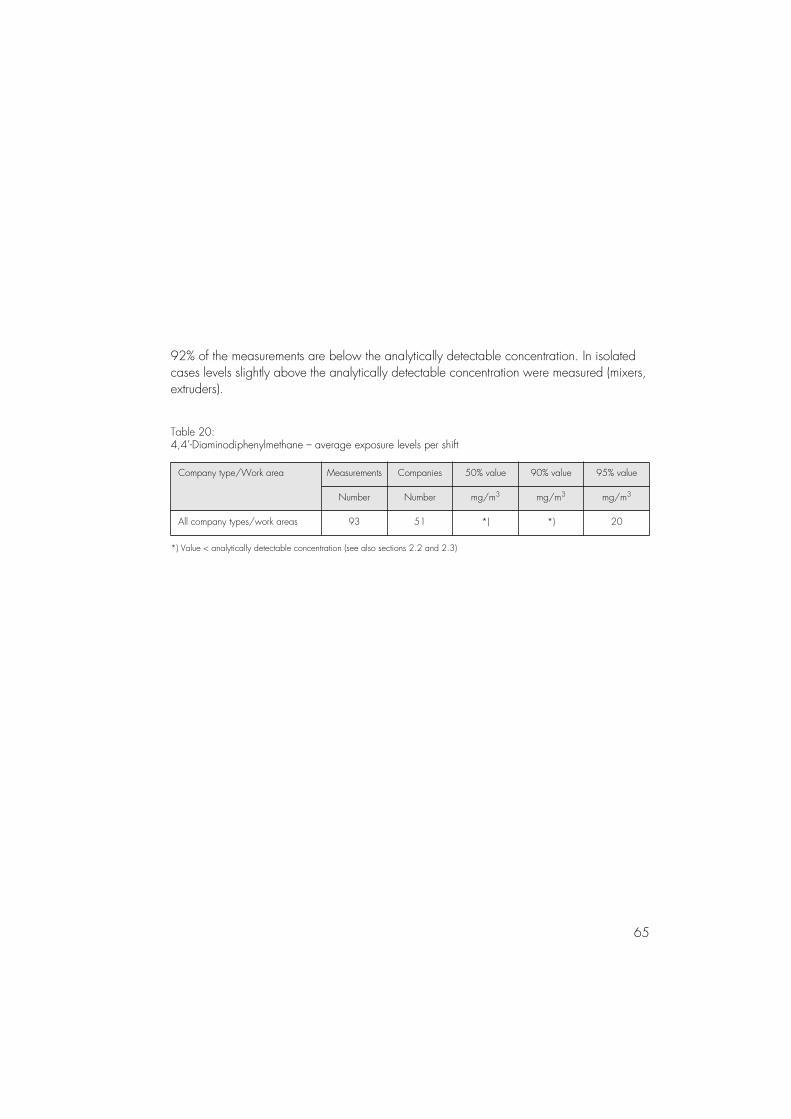
65
92% of the measurements are below the analytically detectable concentration. In isolated cases levels slightly above the analytically detectable concentration were measured (mixers, extruders).
Table 20:4,4’-Diaminodiphenylmethane – average exposure levels per shift
Company type/Work area Measurements Companies 50% value 90% value 95% value
Number Number mg/m3 mg/m3 mg/m3
All company types/work areas 93 51 *) *) 20
*) Value < analytically detectable concentration (see also sections 2.2 and 2.3)
3 Exposure descriptions
66
3.15 Dibutyl phthalate
Identification and limit values
Formula
Molecular weight in g/mol 278.34CAS No. 84-74-2Synonyms phthalic acid dibutyl esterGerman limit value no German limit valueData collection period 1991 to 1995BGAA exposure description No. 4
Measurement method
A defined volume of air is sucked through a membrane filter attached to a silica gel tube using a sampling pump. After elution with methanol, quantitative analysis is carried out by means of high-performance liquid chromatography. The analytically detectable concentration for two hours of sampling is 0.007 mg/m3.
Notes on the results
General
56 measurements from 31 companies were analysed. 40% of the measurements come from the plastics processing industry.
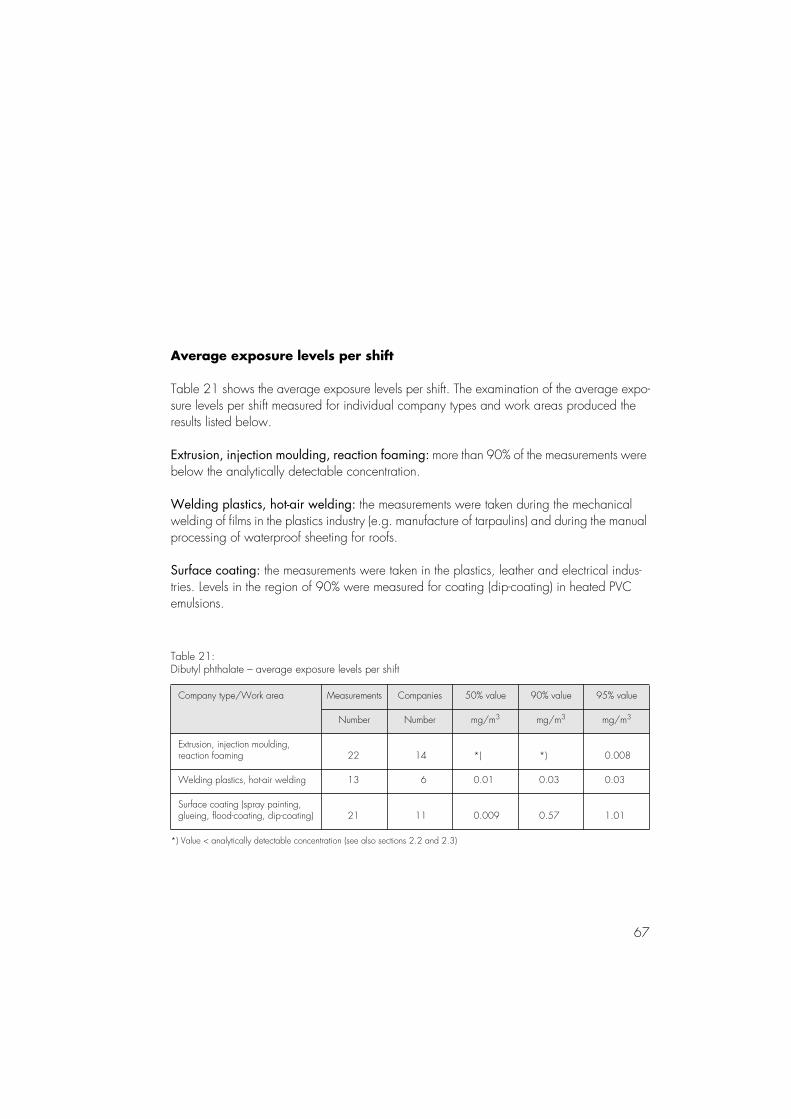
67
Average exposure levels per shift
Table 21 shows the average exposure levels per shift. The examination of the average expo-sure levels per shift measured for individual company types and work areas produced the results listed below.
Extrusion, injection moulding, reaction foaming: more than 90% of the measurements were below the analytically detectable concentration.
Welding plastics, hot-air welding: the measurements were taken during the mechanical welding of films in the plastics industry (e.g. manufacture of tarpaulins) and during the manual processing of waterproof sheeting for roofs.
Surface coating: the measurements were taken in the plastics, leather and electrical indus-tries. Levels in the region of 90% were measured for coating (dip-coating) in heated PVCemulsions.
Table 21:Dibutyl phthalate – average exposure levels per shift
Company type/Work area Measurements Companies 50% value 90% value 95% value
Number Number mg/m3 mg/m3 mg/m3
Extrusion, injection moulding, reaction foaming 22 14 *) *) 0.008
Welding plastics, hot-air welding 13 6 0.01 0.03 0.03
Surface coating (spray painting, glueing, flood-coating, dip-coating) 21 11 0.009 0.57 1.01
*) Value < analytically detectable concentration (see also sections 2.2 and 2.3)
3 Exposure descriptions
68
3.16 1,4-Dichlorobenzene
Identification and limit values
Formula
Molecular weight in g/mol 147.00CAS No. 106-46-7Synonyms p-dichlorobenzeneGerman limit value 300 mg/m3, 50 ml/m3 (MAK)Data collection period 1991 to 1995BGAA exposure description No. 16
Measurement method
A defined volume of air is sucked through a silica gel tube using a sampling pump. After extraction with diethyl ether, quantitative analysis is carried out by means of gaschromatog-raphy using a flame ionisation detector. The analytically detectable concentration for two hours of sampling is 0.5 mg/m3.
Notes on the results
108 measurements from 55 companies were analysed. 20% of the measurements come from the chemical industry; less than 10% of the measurements were taken in areas such as mechanical engineering, electrical engineering, the construction industry and the services sector.
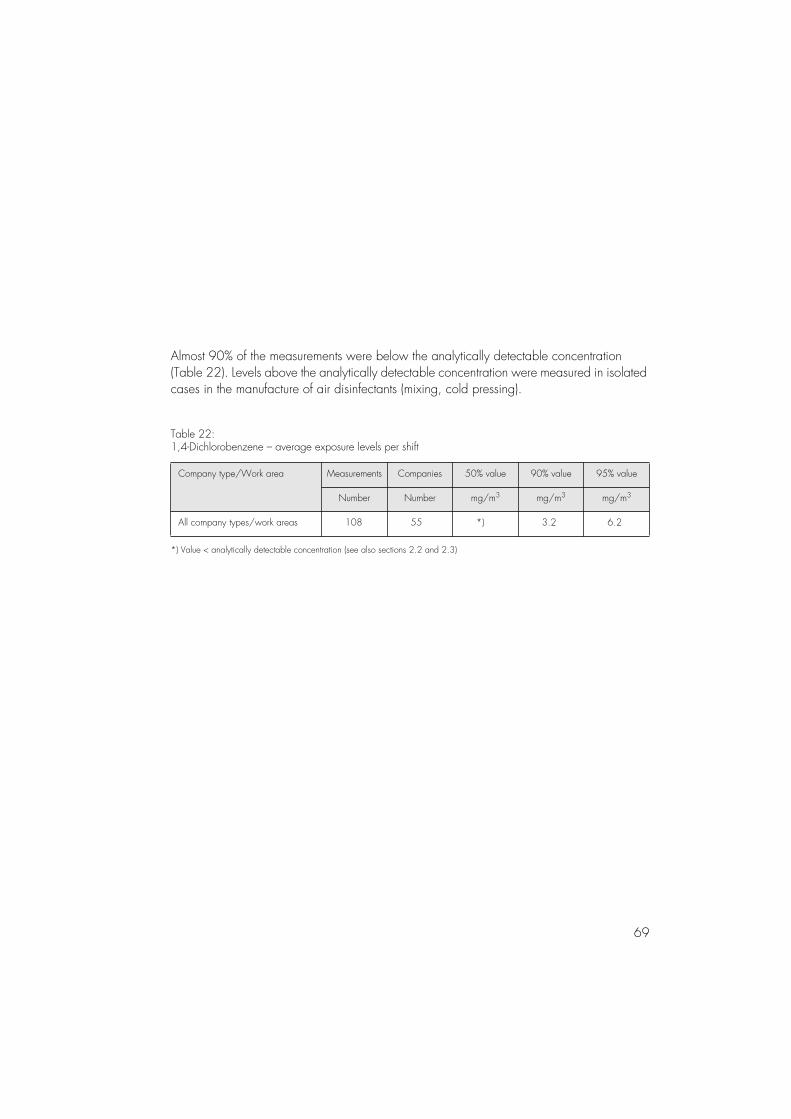
69
Almost 90% of the measurements were below the analytically detectable concentration (Table 22). Levels above the analytically detectable concentration were measured in isolated cases in the manufacture of air disinfectants (mixing, cold pressing).
Table 22:1,4-Dichlorobenzene – average exposure levels per shift
Company type/Work area Measurements Companies 50% value 90% value 95% value
Number Number mg/m3 mg/m3 mg/m3
All company types/work areas 108 55 *) 3.2 6.2
*) Value < analytically detectable concentration (see also sections 2.2 and 2.3)
3 Exposure descriptions
70
3.17 Di-(2-ethylhexyl) phthalate
Identification and limit values
Formula
Molecular weight in g/mol 390.56CAS No. 117-81-7Synonyms phthalic acid bis(2-ethylhexyl) ester, dioctyl phthalate,
di-sec-octyl phthalate, DEHP, DOPGerman limit value 10 mg/m3 (MAK)Data collection period 1991 to 1995BGAA exposure description No. 22
Measurement method
A defined volume of air is sucked through a membrane filter attached to a silica gel tube using a sampling pump. After elution with methanol, quantitative analysis is carried out by means of high-performance liquid chromatography. The analytically detectable concentration for two hours of sampling is 0.025 mg/m3.
Notes on the results
The data (Table 23) come exclusively from the plastics processing industry and were collected during calendering, extrusion, glueing and welding. Levels in the region of 90% were meas-ured for calendering (including use of recycled materials).
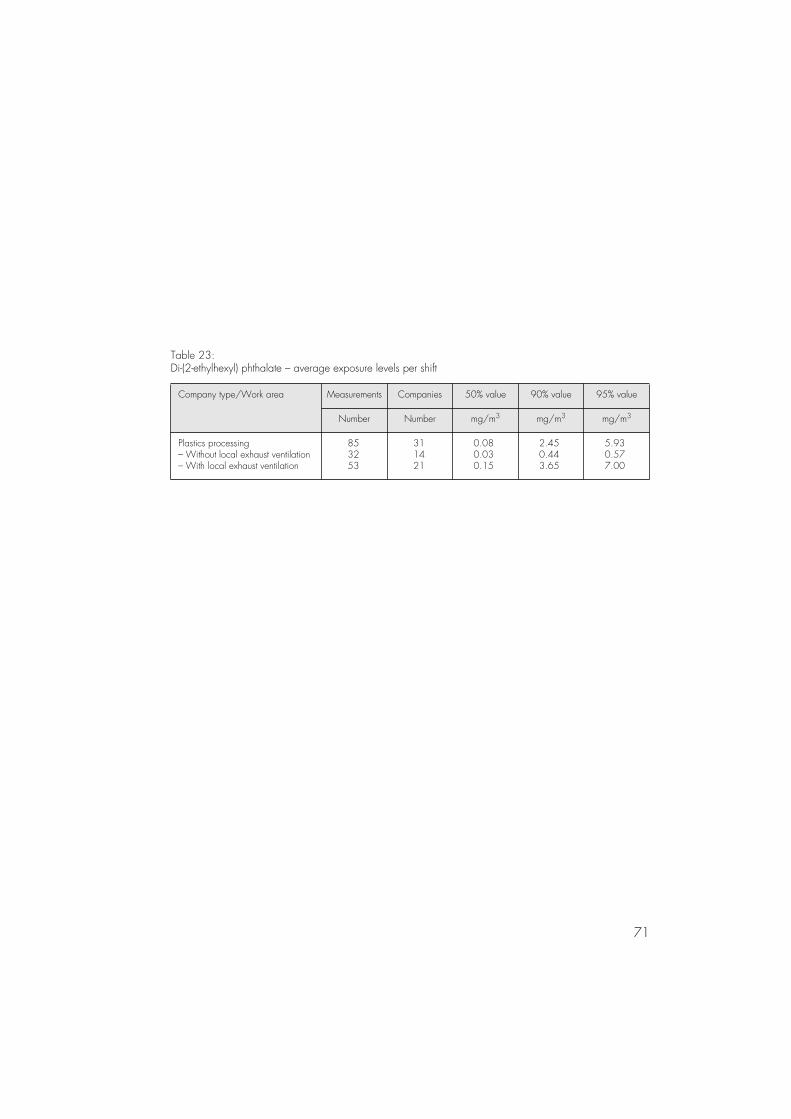
71
Table 23:Di-(2-ethylhexyl) phthalate – average exposure levels per shift
Company type/Work area Measurements Companies 50% value 90% value 95% value
Number Number mg/m3 mg/m3 mg/m3
Plastics processing– Without local exhaust ventilation– With local exhaust ventilation
853253
311421
0.080.030.15
2.450.443.65
5.930.577.00
3 Exposure descriptions
72
3.18 Dioxane
Identification and limit values
Formula
Molecular weight in g/mol 88.10CAS No. 123-91-1Synonyms p-dioxane, 1,4-dioxane, diethylene dioxide, diethylene
oxide, 1,4-dioxacyclohexaneGerman limit value 180 mg/m3, 50 ml/m3 (MAK)Data collection period 1991 to 1995BGAA-Expositionsbeschreibung No. 23
Measurement method
A defined volume of air is sucked through an activated charcoal tube using a sampling pump. After elution with diethyl ether, quantitative analysis is carried out by means of gaschromatog-raphy using a flame ionisation detector. The analytically detectable concentration for two hours of sampling is 1.0 mg/m3.
Notes on the results
40 measurements from 9 companies were analysed. The data were collected predominantly during the processing of plastics (Table 24). 63% of the measurements were below the analytically detectable concentration. Levels in the region of 90% were measured for glueing while using a spray gun.
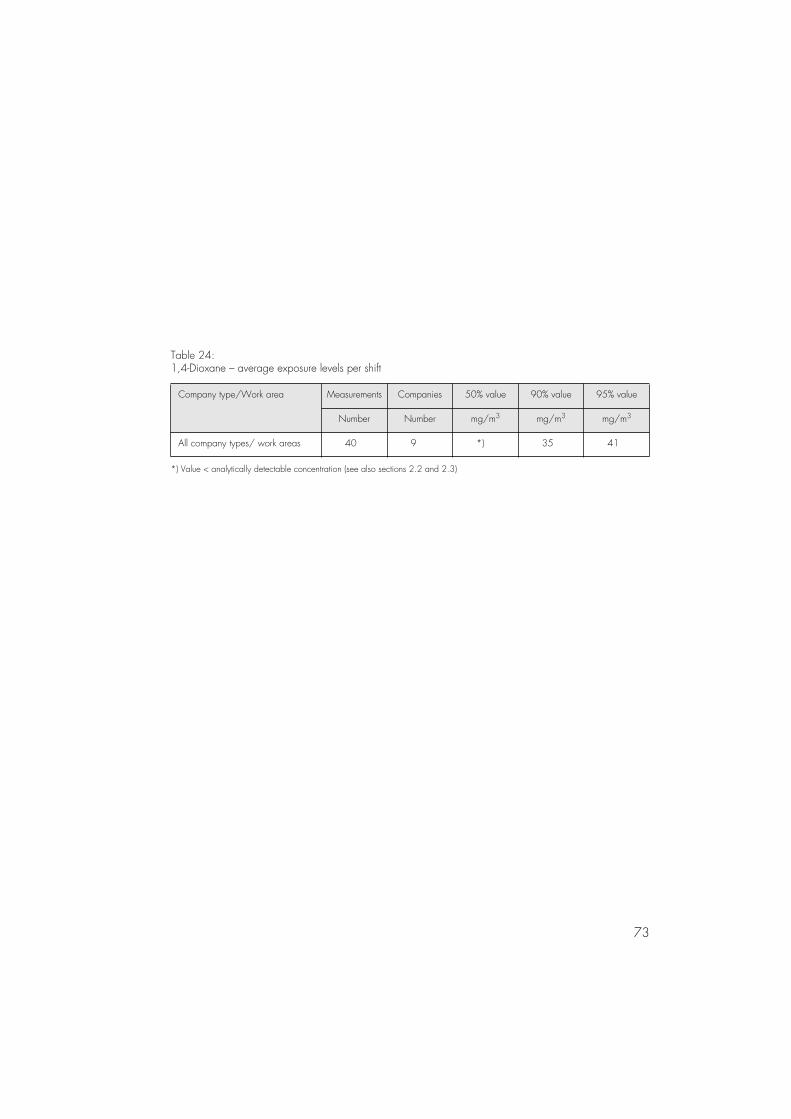
73
Table 24:1,4-Dioxane – average exposure levels per shift
Company type/Work area Measurements Companies 50% value 90% value 95% value
Number Number mg/m3 mg/m3 mg/m3
All company types/ work areas 40 9 *) 35 41
*) Value < analytically detectable concentration (see also sections 2.2 and 2.3)
3 Exposure descriptions
74
3.19 1,2-Epoxypropane
Identification and limit values
Formula
Molecular weight in g/mol 58.08CAS No. 75-56-9Synonyms 1,2-propylene oxide, methyl oxirane,
2-methyloxacyclopropaneGerman limit value 6 mg/m3, 2.5 ml/m3 (TRK)Data collection period 1991 to 1995BGAA exposure description No. 25
Measurement method
A defined volume of air is sucked through an activated charcoal tube using a sampling pump. After extraction with diethyl ether, quantitative analysis is carried out by means of gas-chromatography using a flame ionisation detector. The analytically detectable concentration for two hours of sampling is 0.5 mg/m3 (see also [21]).
Notes on the results
The data come predominantly from the chemical industry. Levels in the region of 90% were measured during the decanting of 1,2-epoxypropane (Table 25).
Table 25:1,2-Epoxypropane – average exposure levels per shift
Company type/Work area Measurements Companies 50% value 90% value 95% value
Number Number mg/m3 mg/m3 mg/m3
All company types/ work areas 25 14 0.5 5.8 7.0
75
3.20 2-Ethoxyethanol
Identification and limit values
Formula
Molecular weight in g/mol 90.12CAS No. 110-80-5Synonyms ethyl glycol, ethylene glycol monoethyl etherGerman limit value 75 mg/m3, 20 ml/m3 (MAK)Data collection period 1991 to 1995BGAA exposure description No. 28
Measurement method
A defined volume of air is sucked through an activated charcoal tube using a sampling pump. After elution with diethyl ether, quantitative analysis is carried out by means of gaschromatog-raphy using a flame ionisation detector. The analytically detectable concentration for two hours of sampling is 0.5 mg/m3.
Notes on the results
General
548 measurements were analysed from around 210 companies in the paint manufacturing, plastics, rubber, ceramics, glass, metalworking/mechanical engineering, electronical/preci-sion mechanics, printing/paper processing and construction industries and other areas.
Average exposure levels per shift
Table 26 shows the average exposure levels per shift. The examination of the average expo-sure levels per shift measured for individual company types and work areas produced the results listed below.
3 Exposure descriptions
76
Paint manufacture: the data were collected predominantly during mixing, stirring, dissolving and decanting. Levels in the region of 90% were measured for decanting and on stirringmachines.
Manual coating (excluding spraying): the data come predominantly from the construction industry. No local exhaust ventilation was used. 88% of the measurements were below the analytically detectable concentration. Levels in the region of 90% were measured for manual varnishing and soaking.
Manual coating (spraying): the data were collected in the construction, timber, electrical engineering and metalworking industries. 86% of the measurements were below the ana-lytically detectable concentration.
Mechanical coating, printing: the data were collected in the aforementioned areas. Around 80% of the measurements were below the analytically detectable concentration. Levels in the region of 90% were measured for screen printing.
Cleaning processes: these processes were carried out in all the aforementioned areas. 81% of the measurements were below the analytically detectable concentration. The effect of local exhaust ventilation on exposure levels can be seen clearly. Levels in the region of 90% occurred on container cleaning machines.
Table 26:2-Ethoxyethanol – average exposure levels per shift
Company type/Work area Measurements Companies 50% value 90% value 95% value
Number Number mg/m3 mg/m3 mg/m3
Paint manufacture– Without local exhaust ventilation– With local exhaust ventilation
341518
18109
333
171814
252522
Manual coating (excluding spraying)– All measurements without local exhaust ventilation
35 15 *) 11 44
77
Measurements for a reduced exposure time of < 1 hour
The data were collected predominantly in the construction industry for manual coating (e.g. roller application).
Table 26(continued):
Company type/Work area Measurements Companies 50% value 90% value 95% value
Number Number mg/m3 mg/m3 mg/m3
Manual coating (spraying)– Without local exhaust ventilation– With local exhaust ventilation
1232591
671154
*)*)*)
98
11
211722
Mechanical coating, printing– Without local exhaust ventilation– With local exhaust ventilation
1939594
753844
*)*)*)
151414
352829
Cleaning processes– Without local exhaust ventilation– With local exhaust ventilation
431923
251214
*)*)*)
565
10286
*) Value < analytically detectable concentration (see also sections 2.2 and 2.3)
Table 27:2-Ethoxyethanol – measurements for a reduced exposure time of < 1 hour
Company type/Work area Measurements Companies 50% value 90% value 95% value
Number Number mg/m3 mg/m3 mg/m3
All company types/work areas 23 9 *) 2 3
*) Value < analytically detectable concentration (see also sections 2.2 and 2.3)
3 Exposure descriptions
78
3.21 2-Ethoxyethyl acetate
Identification and limit values
Formula
Molecular weight in g/mol 132.15CAS No. 115-15-9Synonyms ethyl glycol acetate, ethylene glycol monoethyl ether
acetate, acetic acid (2-ethoxyethyl) esterGerman limit value 110 mg/m3, 20 ml/m3 (MAK)Data collection period 1991 to 1995BGAA exposure description No. 27
Measurement method
A defined volume of air is sucked through an activated charcoal tube using a sampling pump. After elution with diethyl ether, quantitative analysis is carried out by means of gaschromatog-raphy using a flame ionisation detector. The analytically detectable concentration for two hours of sampling is 0.1 mg/m3.
Notes on the results
General
598 measurements from around 270 companies were analysed.
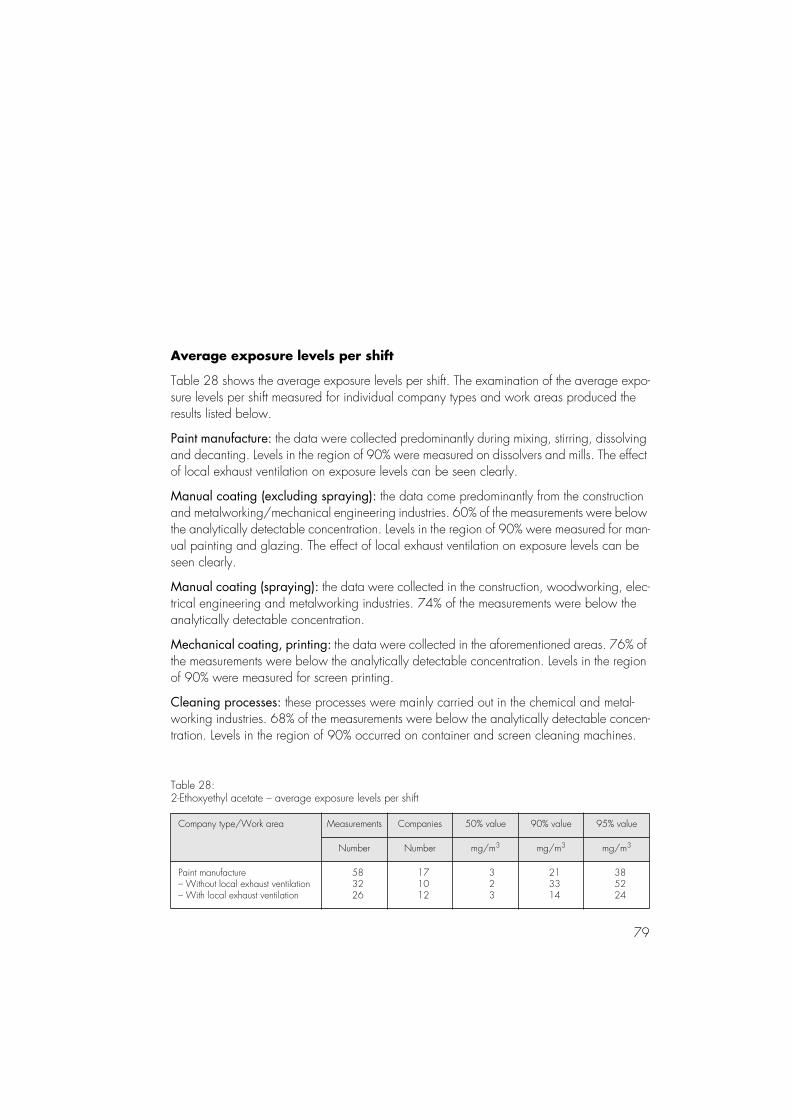
79
Average exposure levels per shift
Table 28 shows the average exposure levels per shift. The examination of the average expo-sure levels per shift measured for individual company types and work areas produced theresults listed below.
Paint manufacture: the data were collected predominantly during mixing, stirring, dissolving and decanting. Levels in the region of 90% were measured on dissolvers and mills. The effect of local exhaust ventilation on exposure levels can be seen clearly.
Manual coating (excluding spraying): the data come predominantly from the construction and metalworking/mechanical engineering industries. 60% of the measurements were below the analytically detectable concentration. Levels in the region of 90% were measured for man-ual painting and glazing. The effect of local exhaust ventilation on exposure levels can be seen clearly.
Manual coating (spraying): the data were collected in the construction, woodworking, elec-trical engineering and metalworking industries. 74% of the measurements were below the analytically detectable concentration.
Mechanical coating, printing: the data were collected in the aforementioned areas. 76% of the measurements were below the analytically detectable concentration. Levels in the region of 90% were measured for screen printing.
Cleaning processes: these processes were mainly carried out in the chemical and metal-working industries. 68% of the measurements were below the analytically detectable concen-tration. Levels in the region of 90% occurred on container and screen cleaning machines.
Table 28:2-Ethoxyethyl acetate – average exposure levels per shift
Company type/Work area Measurements Companies 50% value 90% value 95% value
Number Number mg/m3 mg/m3 mg/m3
Paint manufacture– Without local exhaust ventilation– With local exhaust ventilation
583226
171012
323
213314
385224
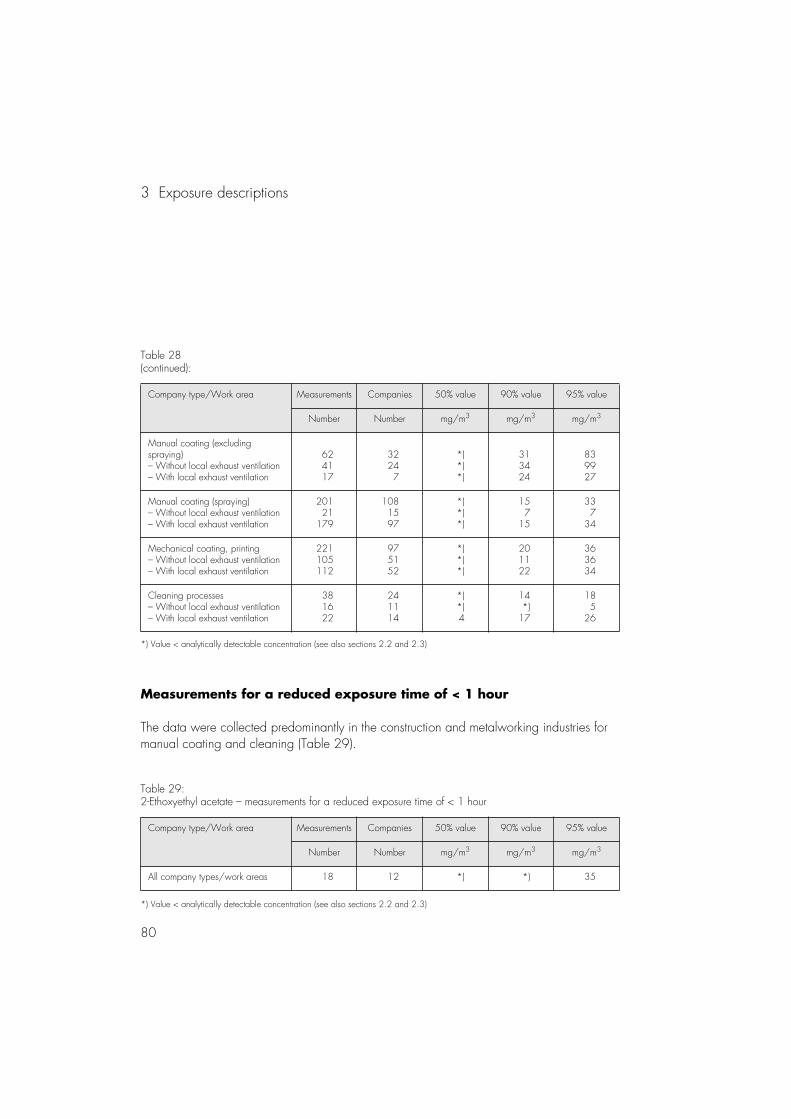
3 Exposure descriptions
80
Measurements for a reduced exposure time of < 1 hour
The data were collected predominantly in the construction and metalworking industries for manual coating and cleaning (Table 29).
Table 28(continued):
Company type/Work area Measurements Companies 50% value 90% value 95% value
Number Number mg/m3 mg/m3 mg/m3
Manual coating (excluding spraying)– Without local exhaust ventilation– With local exhaust ventilation
624117
32247
*)*)*)
313424
839927
Manual coating (spraying)– Without local exhaust ventilation– With local exhaust ventilation
20121
179
1081597
*)*)*)
157
15
337
34
Mechanical coating, printing– Without local exhaust ventilation– With local exhaust ventilation
221105112
975152
*)*)*)
201122
363634
Cleaning processes– Without local exhaust ventilation– With local exhaust ventilation
381622
241114
*)*)4
14*)
17
185
26
*) Value < analytically detectable concentration (see also sections 2.2 and 2.3)
Table 29:2-Ethoxyethyl acetate – measurements for a reduced exposure time of < 1 hour
Company type/Work area Measurements Companies 50% value 90% value 95% value
Number Number mg/m3 mg/m3 mg/m3
All company types/work areas 18 12 *) *) 35
*) Value < analytically detectable concentration (see also sections 2.2 and 2.3)
81
3.22 Ethyl acetate
Identification and limit values
Formula C4H8O2
Molecular weight in g/mol 88.10CAS No. 141-78-6Synonyms acetic acid ethyl ester, acetic ester, ethanoic acid ethyl esterGerman limit value 1,400 mg/m3, 400 ml/m3 (MAK)Data collection period 1992 to 1996BGAA exposure description No. 38
Measurement method
A defined volume of air is sucked through an activated charcoal tube using a sampling pump. After elution with diethyl ether, quantitative analysis is carried out by means of gaschromatog-raphy using a flame ionisation detector. The analytically detectable concentration for two hours of sampling is 1.2 mg/m3.
Notes on the results
General
6,324 measurements from around 1,900 companies were included in the analysis.
3 Exposure descriptions
82
Average exposure levels per shift
Table 30 shows the average exposure levels per shift. The examination of the average expo-sure levels per shift measured for individual company types and work areas produced theresults listed below.
Manufacture of preparations: the data were collected on dissolvers, bead mills and decant-ing machines. Levels in the region of 90% were measured for preparation and decanting.
Cleaning, degreasing: the data were collected in the metalworking, woodworking and chemical industries. Levels in the region of 90% were measured for the cleaning of equipment and containers in paint production and solvent recovery plants.
Glueing (plastics, metalworking, electrical, woodworking, furniture, leather and shoeindustries): levels in the region of 90% were measured for the spraying of adhesives in the upholstered furniture industry and for manual glueing (brush application, e.g. in the shoe industry).
Glueing (floor laying with wood, textiles, plastics): levels in the region of 90% were meas-ured for the application of parquet adhesives and fillers in rooms without ventilation.
Brushing, painting, rolling (plastics, metalworking, electrical, glass, ceramics and wood-working industries): levels in the region of 90% were measured for brush application over large areas.
Brushing, painting, rolling (construction industry): the data were collected during the paint-ing of walls, windows and domestic installations. Levels in the region of 90% were measured for the roller application of primers in rooms without ventilation.
Spray painting (plastics, metalworking, electrical, furniture, glass and ceramics indus-tries): the data were collected predominantly on dry-type and waterwash spraybooths. Levels in the region of 90% were measured predominantly for large-scale spraying.
Spray painting (construction industry): the data were collected predominantly during the painting of metal components. Levels in the region of 90% were measured for spraying in rooms without ventilation.
Spray painting (woodworking): the data were collected predominantly on dry-type and waterwash spraybooths.
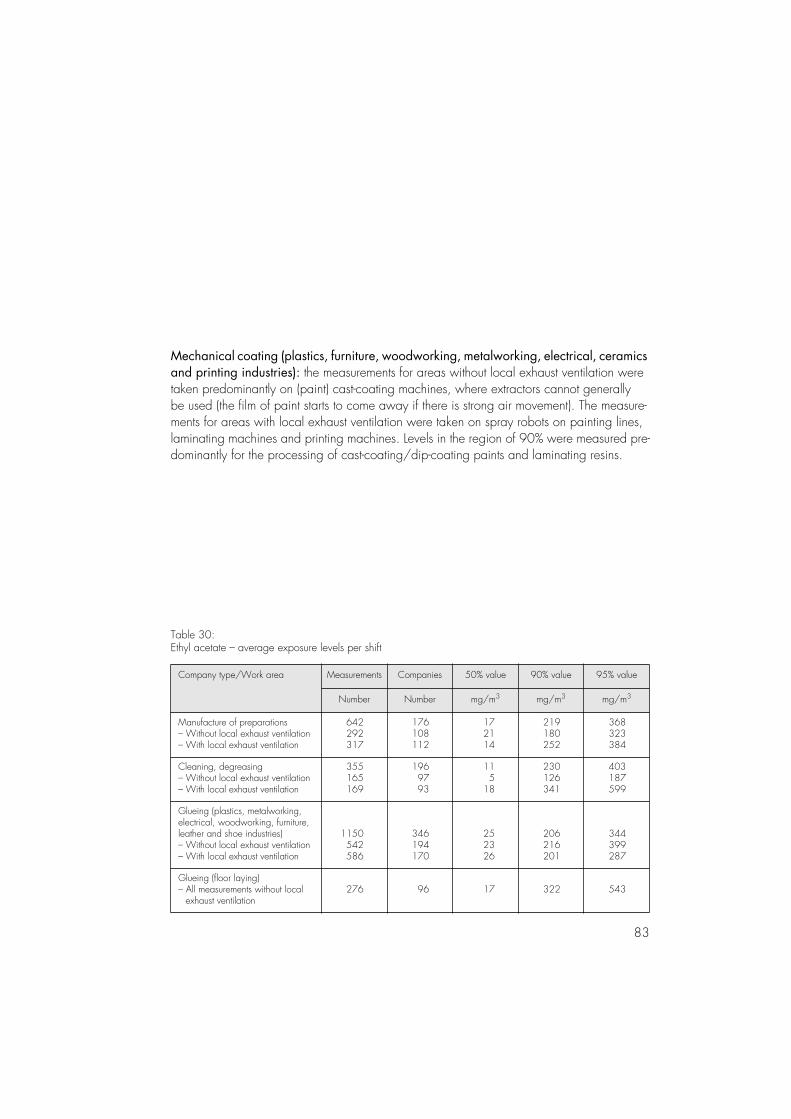
83
Mechanical coating (plastics, furniture, woodworking, metalworking, electrical, ceramics and printing industries): the measurements for areas without local exhaust ventilation were taken predominantly on (paint) cast-coating machines, where extractors cannot generally be used (the film of paint starts to come away if there is strong air movement). The measure-ments for areas with local exhaust ventilation were taken on spray robots on painting lines, laminating machines and printing machines. Levels in the region of 90% were measured pre-dominantly for the processing of cast-coating/dip-coating paints and laminating resins.
Table 30:Ethyl acetate – average exposure levels per shift
Company type/Work area Measurements Companies 50% value 90% value 95% value
Number Number mg/m3 mg/m3 mg/m3
Manufacture of preparations– Without local exhaust ventilation– With local exhaust ventilation
642292317
176108112
172114
219180252
368323384
Cleaning, degreasing– Without local exhaust ventilation– With local exhaust ventilation
355165169
1969793
115
18
230126341
403187599
Glueing (plastics, metalworking, electrical, woodworking, furniture, leather and shoe industries)– Without local exhaust ventilation– With local exhaust ventilation
1150542586
346194170
252326
206216201
344399287
Glueing (floor laying)– All measurements without local exhaust ventilation
276 96 17 322 543
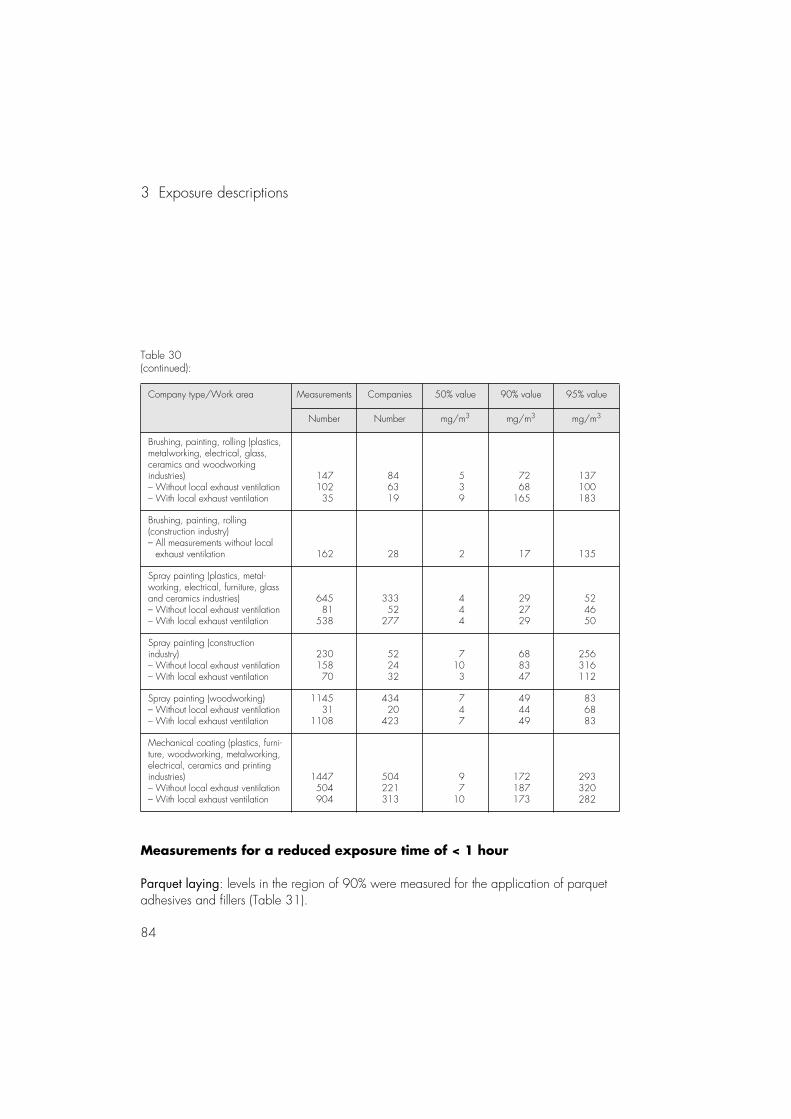
3 Exposure descriptions
84
Measurements for a reduced exposure time of < 1 hour
Parquet laying: levels in the region of 90% were measured for the application of parquet adhesives and fillers (Table 31).
Table 30(continued):
Company type/Work area Measurements Companies 50% value 90% value 95% value
Number Number mg/m3 mg/m3 mg/m3
Brushing, painting, rolling (plastics, metalworking, electrical, glass, ceramics and woodworking industries)– Without local exhaust ventilation– With local exhaust ventilation
14710235
846319
539
7268
165
137100183
Brushing, painting, rolling (construction industry)– All measurements without local exhaust ventilation 162 28 2 17 135
Spray painting (plastics, metal-working, electrical, furniture, glass and ceramics industries)– Without local exhaust ventilation– With local exhaust ventilation
64581
538
33352
277
444
292729
524650
Spray painting (construction industry)– Without local exhaust ventilation– With local exhaust ventilation
23015870
522432
7103
688347
256316112
Spray painting (woodworking)– Without local exhaust ventilation– With local exhaust ventilation
114531
1108
43420
423
747
494449
836883
Mechanical coating (plastics, furni-ture, woodworking, metalworking, electrical, ceramics and printing industries)– Without local exhaust ventilation– With local exhaust ventilation
1447504904
504221313
97
10
172187173
293320282
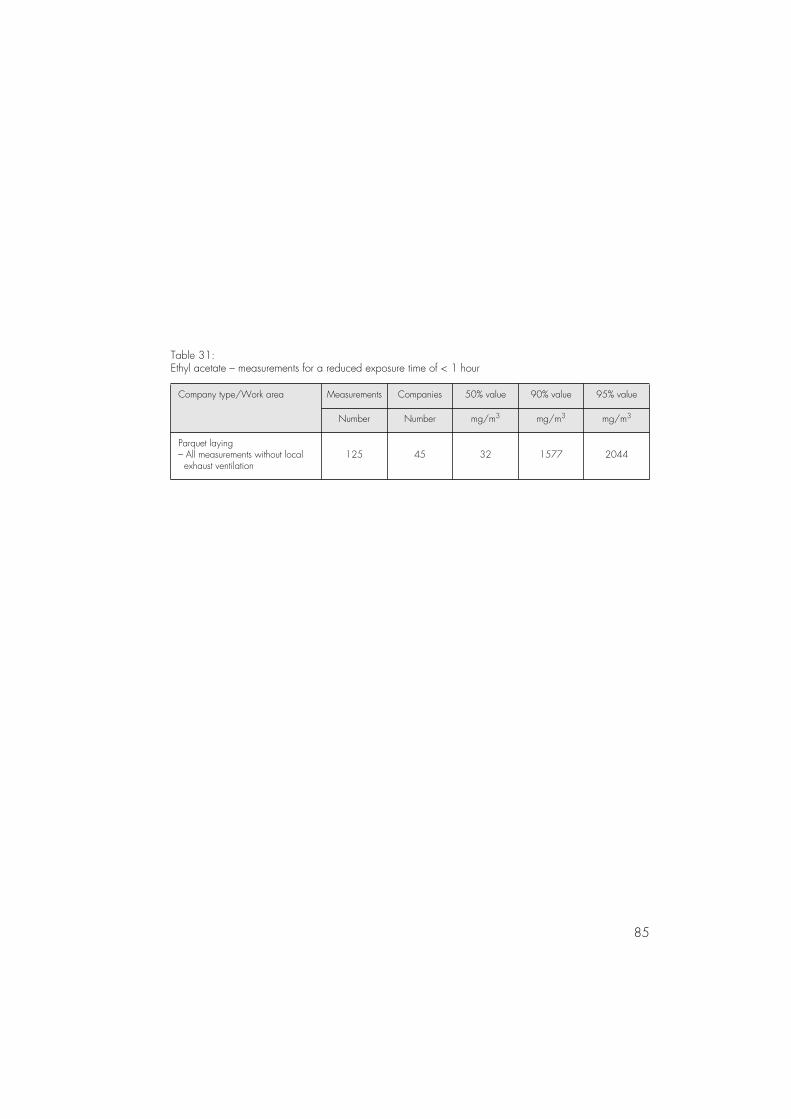
85
Table 31:Ethyl acetate – measurements for a reduced exposure time of < 1 hour
Company type/Work area Measurements Companies 50% value 90% value 95% value
Number Number mg/m3 mg/m3 mg/m3
Parquet laying– All measurements without local exhaust ventilation
125 45 32 1577 2044
3 Exposure descriptions
86
3.23 Ethylbenzene
Identification and limit values
Formula
Molecular weight in g/mol 106.16CAS No. 100-41-4Synonyms phenylethaneGerman limit value 440 mg/m3, 100 ml/m3 (MAK)Data collection period 1991 to 1995BGAA exposure description No. 18
Measurement method
A defined volume of air is sucked through an activated charcoal tube using a sampling pump. After desorption with diethyl ether, quantitative analysis is carried out by means of gas-chromatography using a flame ionisation detector. The analytically detectable concentration for two hours of sampling is 0.5 mg/m3.
Notes on the results
General
6,125 measurements were analysed from around 2,400 companies in the paint manufactur-ing, plastics, rubber, ceramics, glass, metalworking/mechanical engineering, electronics/precision mechanics, woodworking and construction industries and other areas.
87
Average exposure levels per shift
Table 32 shows the average exposure levels per shift. The examination of the average expo-sure levels per shift measured for individual company types and work areas produced theresults listed below.
Mixers, dissolvers, impeller-type mixers: around 80% of the measurements come from the paint manufacturing industry. Local exhaust ventilation was used in most of the work areas.
Surface cleaning: the measurements were taken in the woodworking, metalworking/mechanical engineering and precision mechanics industries. Around 50% of the measure-ments relate to manual cleaning processes. The measurements for work areas with local exhaust ventilation are markedly lower.
Container cleaning: 90% of the measurements were taken in the paint manufacturing indus-try. Local exhaust ventilation was used in most of the work areas. The measurements for work areas with local exhaust ventilation are markedly lower.
Decanting, weighing: 90% of the measurements were taken in the wholesale and paint man-ufacturing industries. Levels in the region of 90% occurred mainly in work areas using mills in addition to metering equipment (decanting, weighing).
Laboratories: the measurements were taken in the chemical and paint manufacturing indus-tries. The use of local exhaust ventilation (fume cupboards) has a marked effect on the exposure levels measured.
Glueing, floor laying: the measurements were taken predominantly in the woodworking and plastics processing industries and for floor laying (parquet, carpet). No local exhaust ventila-tion is generally used in these work areas. Levels in the region of 90% occurred during the laying of parquet flooring.
Surface coating, brush/roller application: the measurements are distributed evenly among the aforementioned areas. Around 80% of the work areas do not have local exhaust ventila-tion. Levels in the region of 90% occurred during the roller application of coatings to
3 Exposure descriptions
88
large areas. In the metalworking industry brush application is used for small parts and repair work.
Surface coating, spraying: the measurements were taken in the aforementioned areas. In contrast to the manual processes, local exhaust ventilation is used in around 70% of the work areas. The effect of local exhaust ventilation on the exposure levels measured can be seen clearly.
Ethylbenzene is a component – found mainly in conjunction with xylene – of the solvents used in surface coatings. Ethylbenzene is not added to the solvent mixture on its own but as a com-ponent of a hydrocarbon mixture.
During the coating process, for example in the construction industry, solvent-containing coat-ings are applied to a surface using a spray gun. In the metalworking industry spray painting (compressed-air spraying) is the standard process used for coating small, flat structural com-ponents, while high-pressure spraying (airless spraying) is used for large structural compo-nents. Processes involving local exhaust ventilation are often carried out in booths with from one to three water-washed walls, in front of which the workpieces are sprayed. The resulting mist of paint is extracted through the floor of the booth. Another form of local exhaust ven-tilation, for example for painting lorries and car parts, involves blowing in cleaned air from above and extracting the contaminated air via holes in the floor.
Extremely large workpieces, which are often treated in the middle of the shop after the end of a shift, are sprayed without local exhaust ventilation.
Surface coating, mechanical: the measurements were taken in the woodworking, metalwork-ing/mechanical engineering and electrical engineering industries. Levels in the region of 90% were measured for dip-coating processes.
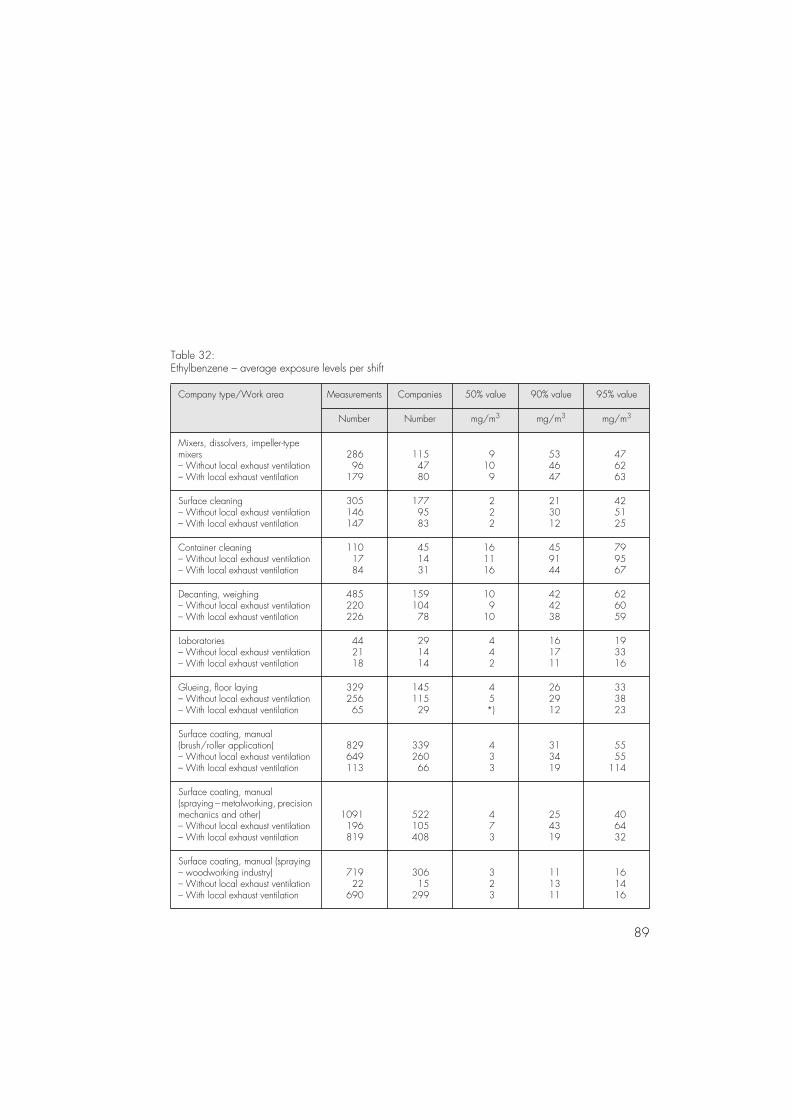
89
Table 32:Ethylbenzene – average exposure levels per shift
Company type/Work area Measurements Companies 50% value 90% value 95% value
Number Number mg/m3 mg/m3 mg/m3
Mixers, dissolvers, impeller-type mixers– Without local exhaust ventilation– With local exhaust ventilation
28696
179
1154780
9109
534647
476263
Surface cleaning– Without local exhaust ventilation– With local exhaust ventilation
305146147
1779583
222
213012
425125
Container cleaning– Without local exhaust ventilation– With local exhaust ventilation
1101784
451431
161116
459144
799567
Decanting, weighing– Without local exhaust ventilation– With local exhaust ventilation
485220226
15910478
109
10
424238
626059
Laboratories– Without local exhaust ventilation– With local exhaust ventilation
442118
291414
442
161711
193316
Glueing, floor laying– Without local exhaust ventilation– With local exhaust ventilation
32925665
14511529
45*)
262912
333823
Surface coating, manual (brush/roller application)– Without local exhaust ventilation– With local exhaust ventilation
829649113
33926066
433
313419
5555
114
Surface coating, manual (spraying – metalworking, precision mechanics and other)– Without local exhaust ventilation– With local exhaust ventilation
1091196819
522105408
473
254319
406432
Surface coating, manual (spraying – woodworking industry)– Without local exhaust ventilation– With local exhaust ventilation
71922
690
30615
299
323
111311
161416
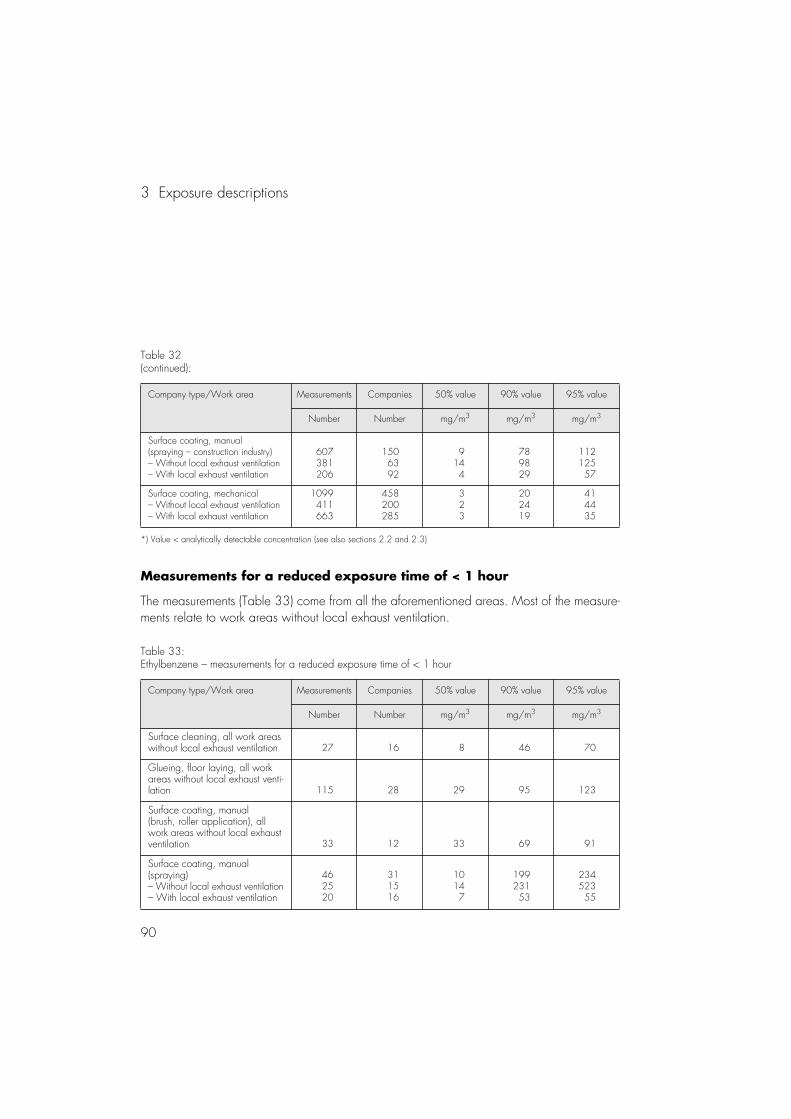
3 Exposure descriptions
90
Measurements for a reduced exposure time of < 1 hour
The measurements (Table 33) come from all the aforementioned areas. Most of the measure-ments relate to work areas without local exhaust ventilation.
Table 32(continued):
Company type/Work area Measurements Companies 50% value 90% value 95% value
Number Number mg/m3 mg/m3 mg/m3
Surface coating, manual (spraying – construction industry)– Without local exhaust ventilation– With local exhaust ventilation
607381206
1506392
9144
789829
11212557
Surface coating, mechanical– Without local exhaust ventilation– With local exhaust ventilation
1099411663
458200285
323
202419
414435
*) Value < analytically detectable concentration (see also sections 2.2 and 2.3)
Table 33:Ethylbenzene – measurements for a reduced exposure time of < 1 hour
Company type/Work area Measurements Companies 50% value 90% value 95% value
Number Number mg/m3 mg/m3 mg/m3
Surface cleaning, all work areas without local exhaust ventilation 27 16 8 46 70
Glueing, floor laying, all work areas without local exhaust venti-lation 115 28 29 95 123
Surface coating, manual(brush, roller application), all work areas without local exhaust ventilation 33 12 33 69 91
Surface coating, manual (spraying)– Without local exhaust ventilation– With local exhaust ventilation
462520
311516
10147
19923153
23452355
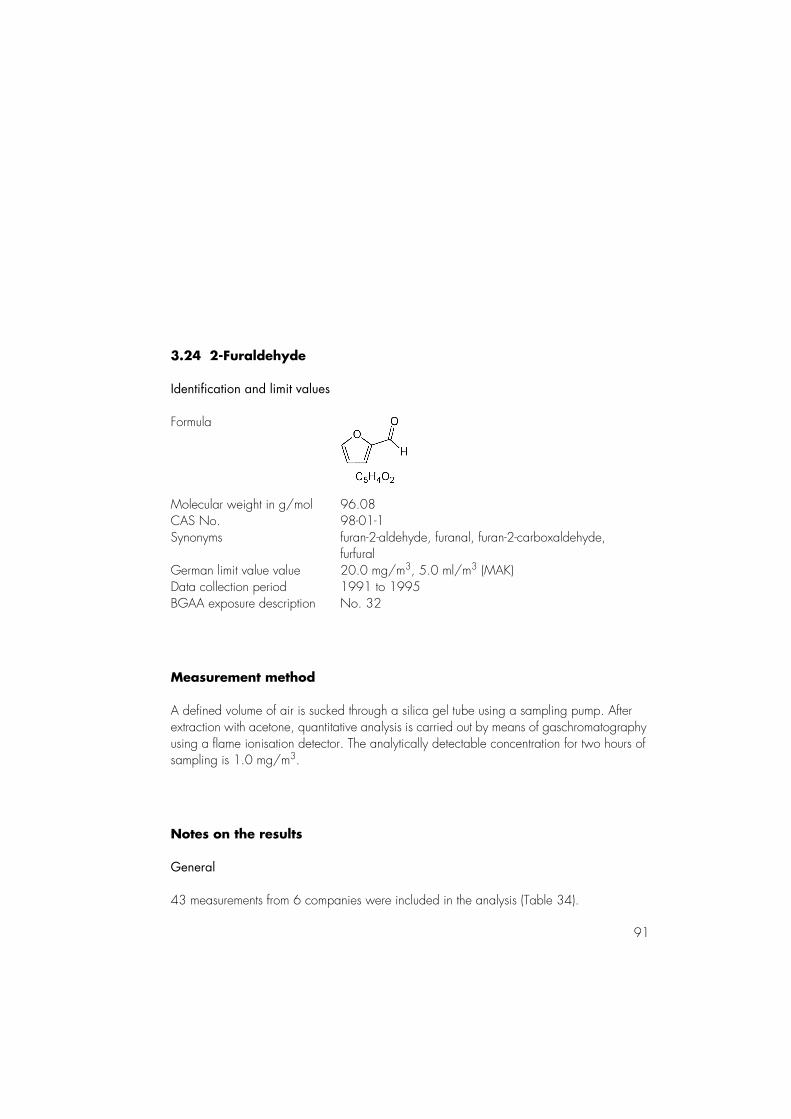
91
3.24 2-Furaldehyde
Identification and limit values
Formula
Molecular weight in g/mol 96.08CAS No. 98-01-1Synonyms furan-2-aldehyde, furanal, furan-2-carboxaldehyde,
furfuralGerman limit value value 20.0 mg/m3, 5.0 ml/m3 (MAK)Data collection period 1991 to 1995BGAA exposure description No. 32
Measurement method
A defined volume of air is sucked through a silica gel tube using a sampling pump. Afterextraction with acetone, quantitative analysis is carried out by means of gaschromatography using a flame ionisation detector. The analytically detectable concentration for two hours of sampling is 1.0 mg/m3.
Notes on the results
General
43 measurements from 6 companies were included in the analysis (Table 34).
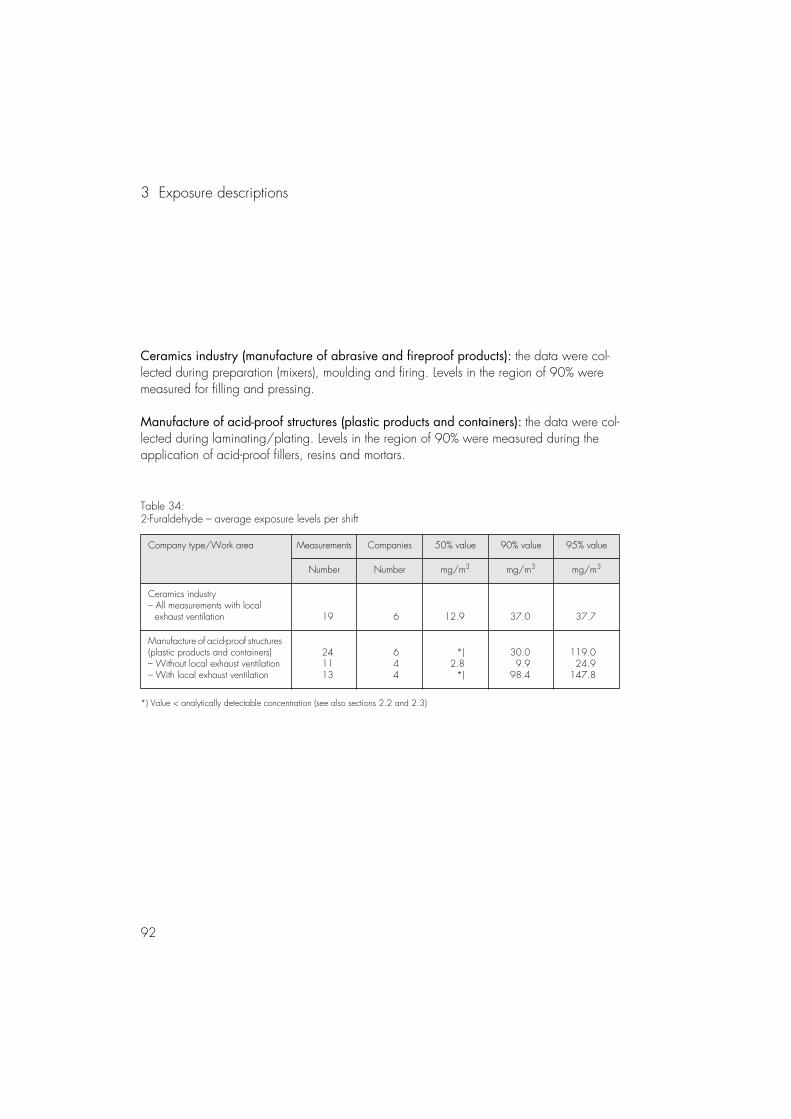
3 Exposure descriptions
92
Ceramics industry (manufacture of abrasive and fireproof products): the data were col-lected during preparation (mixers), moulding and firing. Levels in the region of 90% were measured for filling and pressing.
Manufacture of acid-proof structures (plastic products and containers): the data were col-lected during laminating/plating. Levels in the region of 90% were measured during the application of acid-proof fillers, resins and mortars.
Table 34:2-Furaldehyde – average exposure levels per shift
Company type/Work area Measurements Companies 50% value 90% value 95% value
Number Number mg/m3 mg/m3 mg/m3
Ceramics industry– All measurements with local exhaust ventilation 19 6 12.9 37.0 37.7
Manufacture of acid-proof structures (plastic products and containers)– Without local exhaust ventilation– With local exhaust ventilation
241113
644
*)2.8
*)
30.09.9
98.4
119.024.9
147.8
*) Value < analytically detectable concentration (see also sections 2.2 and 2.3)
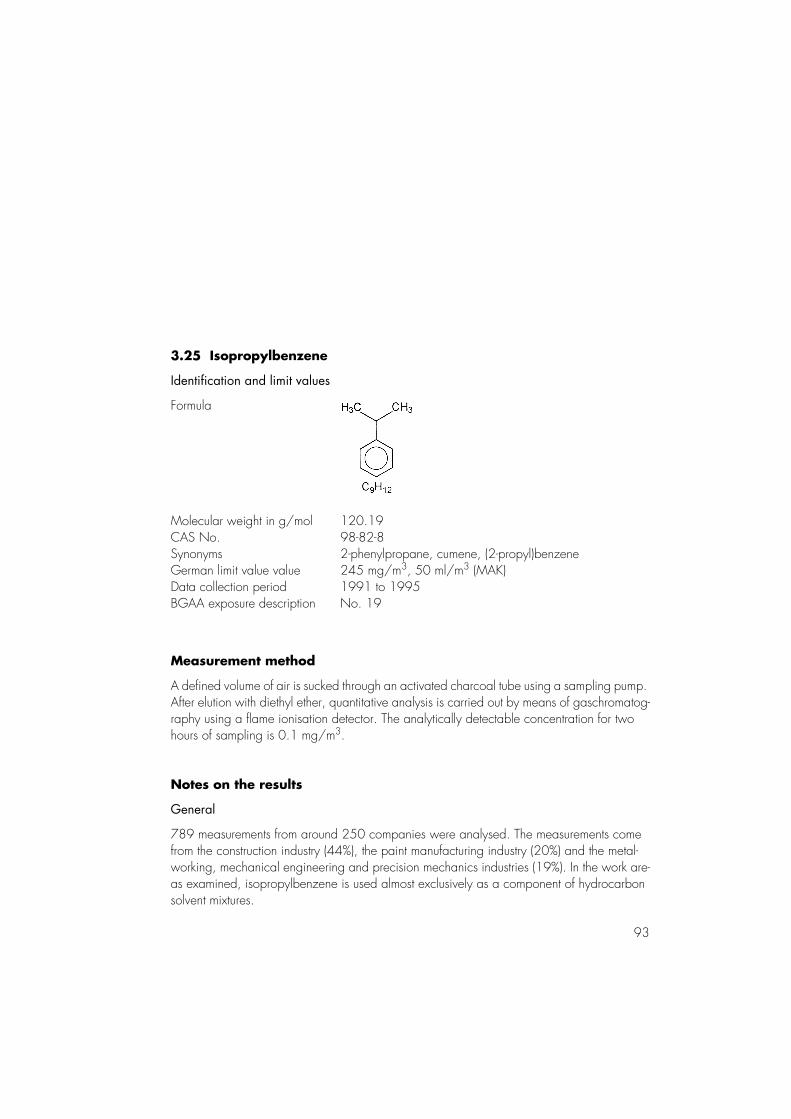
93
3.25 Isopropylbenzene
Identification and limit values
Formula
Molecular weight in g/mol 120.19CAS No. 98-82-8Synonyms 2-phenylpropane, cumene, (2-propyl)benzeneGerman limit value value 245 mg/m3, 50 ml/m3 (MAK)Data collection period 1991 to 1995BGAA exposure description No. 19
Measurement method
A defined volume of air is sucked through an activated charcoal tube using a sampling pump. After elution with diethyl ether, quantitative analysis is carried out by means of gaschromatog-raphy using a flame ionisation detector. The analytically detectable concentration for two hours of sampling is 0.1 mg/m3.
Notes on the results
General
789 measurements from around 250 companies were analysed. The measurements come from the construction industry (44%), the paint manufacturing industry (20%) and the metal-working, mechanical engineering and precision mechanics industries (19%). In the work are-as examined, isopropylbenzene is used almost exclusively as a component of hydrocarbon solvent mixtures.
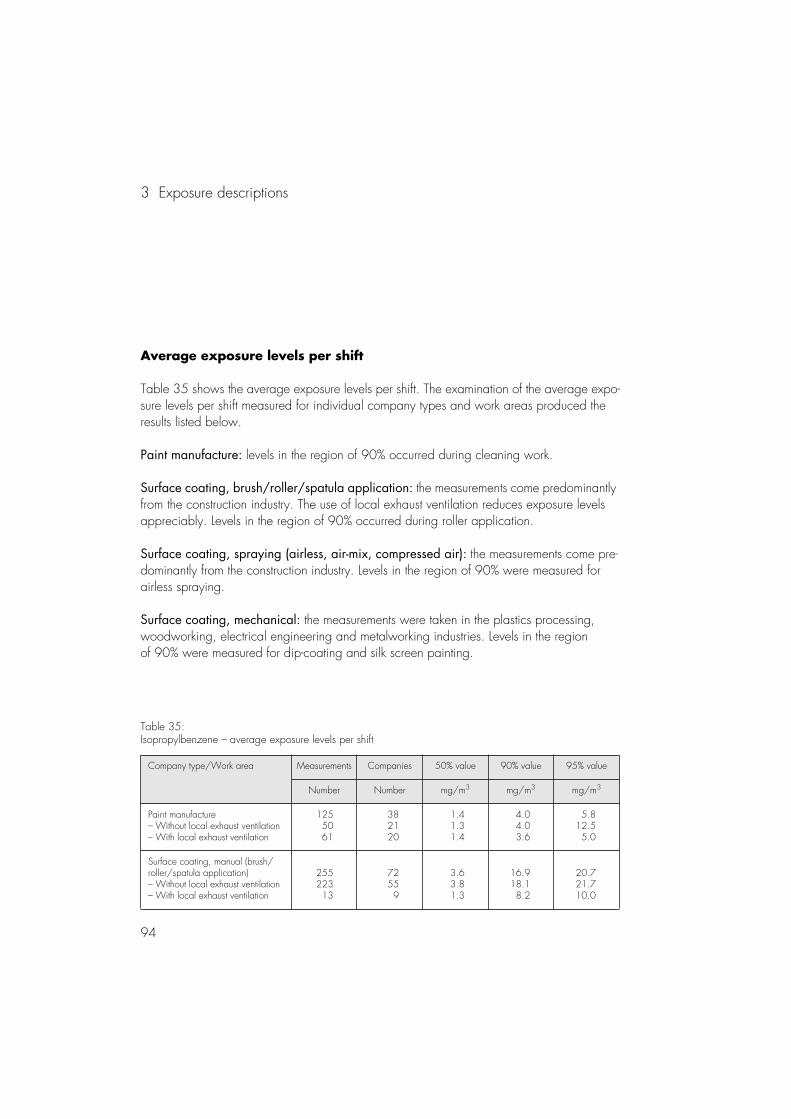
3 Exposure descriptions
94
Average exposure levels per shift
Table 35 shows the average exposure levels per shift. The examination of the average expo-sure levels per shift measured for individual company types and work areas produced the results listed below.
Paint manufacture: levels in the region of 90% occurred during cleaning work.
Surface coating, brush/roller/spatula application: the measurements come predominantly from the construction industry. The use of local exhaust ventilation reduces exposure levels appreciably. Levels in the region of 90% occurred during roller application.
Surface coating, spraying (airless, air-mix, compressed air): the measurements come pre-dominantly from the construction industry. Levels in the region of 90% were measured for airless spraying.
Surface coating, mechanical: the measurements were taken in the plastics processing, woodworking, electrical engineering and metalworking industries. Levels in the region of 90% were measured for dip-coating and silk screen painting.
Table 35:Isopropylbenzene – average exposure levels per shift
Company type/Work area Measurements Companies 50% value 90% value 95% value
Number Number mg/m3 mg/m3 mg/m3
Paint manufacture– Without local exhaust ventilation– With local exhaust ventilation
1255061
382120
1.41.31.4
4.04.03.6
5.812.55.0
Surface coating, manual (brush/roller/spatula application)– Without local exhaust ventilation– With local exhaust ventilation
25522313
72559
3.63.81.3
16.918.18.2
20.721.710.0
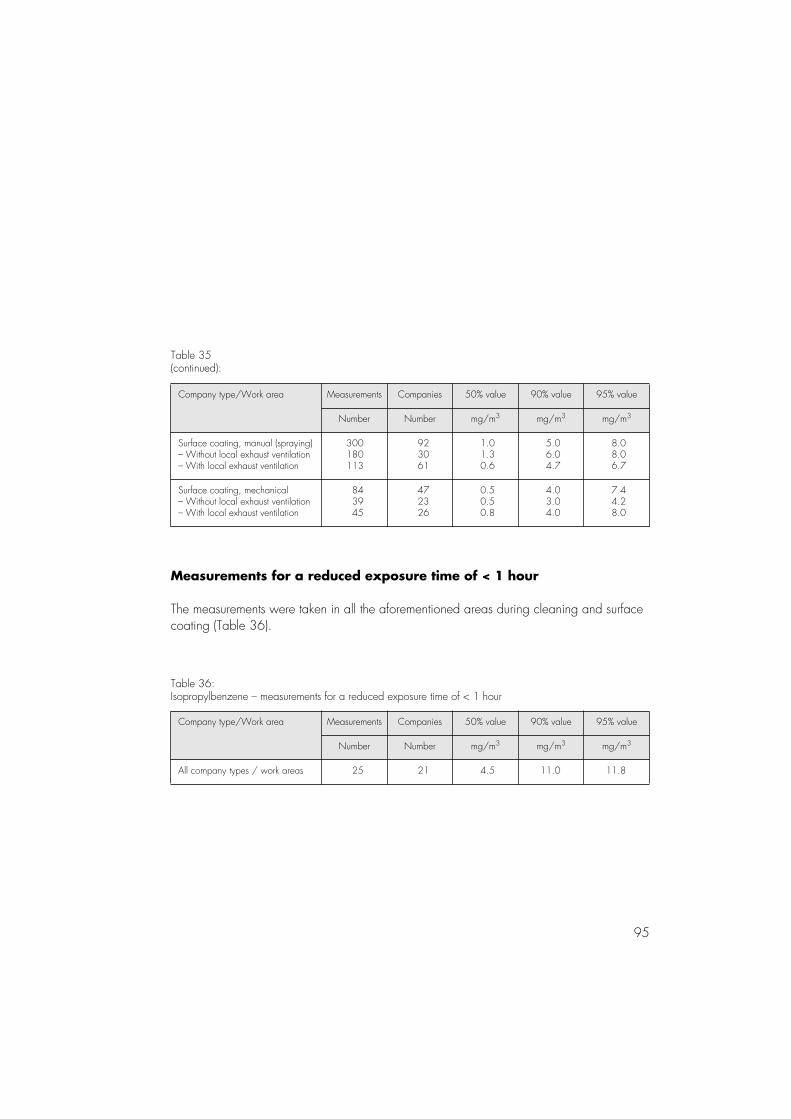
95
Measurements for a reduced exposure time of < 1 hour
The measurements were taken in all the aforementioned areas during cleaning and surface coating (Table 36).
Table 35(continued):
Company type/Work area Measurements Companies 50% value 90% value 95% value
Number Number mg/m3 mg/m3 mg/m3
Surface coating, manual (spraying)– Without local exhaust ventilation– With local exhaust ventilation
300180113
923061
1.01.30.6
5.06.04.7
8.08.06.7
Surface coating, mechanical– Without local exhaust ventilation– With local exhaust ventilation
843945
472326
0.50.50.8
4.03.04.0
7.44.28.0
Table 36:Isopropylbenzene – measurements for a reduced exposure time of < 1 hour
Company type/Work area Measurements Companies 50% value 90% value 95% value
Number Number mg/m3 mg/m3 mg/m3
All company types / work areas 25 21 4.5 11.0 11.8
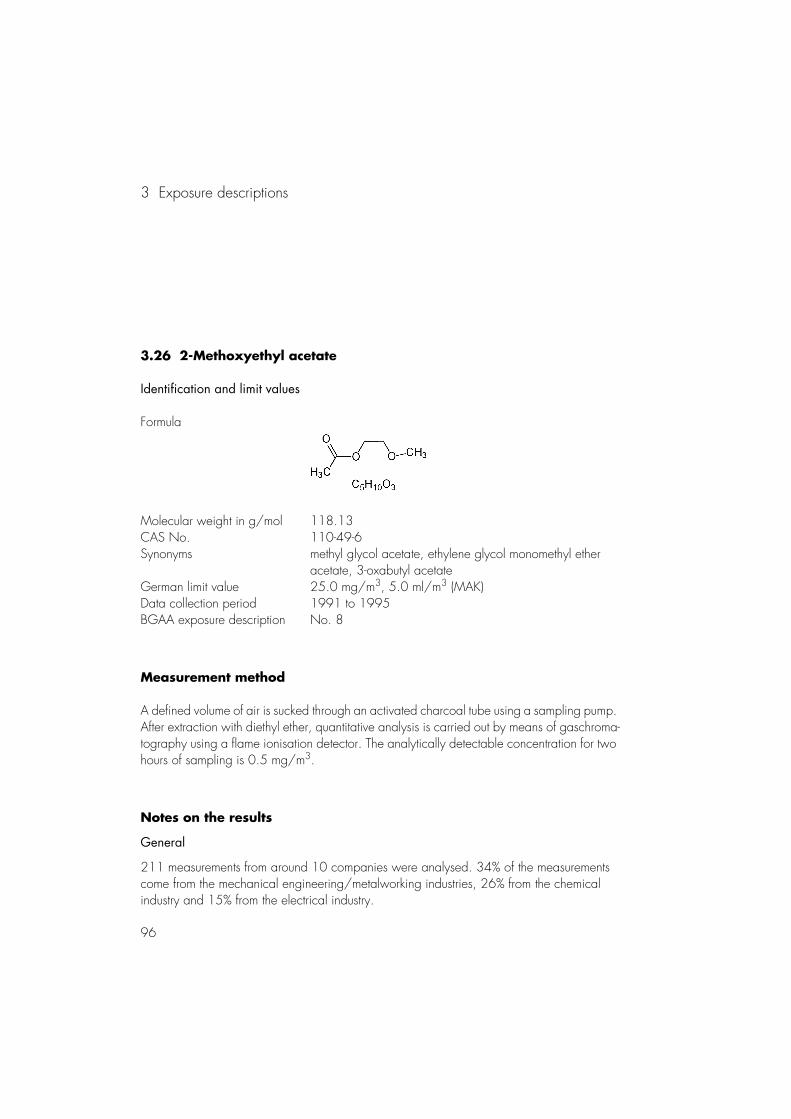
3 Exposure descriptions
96
3.26 2-Methoxyethyl acetate
Identification and limit values
Formula
Molecular weight in g/mol 118.13CAS No. 110-49-6Synonyms methyl glycol acetate, ethylene glycol monomethyl ether
acetate, 3-oxabutyl acetateGerman limit value 25.0 mg/m3, 5.0 ml/m3 (MAK)Data collection period 1991 to 1995BGAA exposure description No. 8
Measurement method
A defined volume of air is sucked through an activated charcoal tube using a sampling pump. After extraction with diethyl ether, quantitative analysis is carried out by means of gaschroma-tography using a flame ionisation detector. The analytically detectable concentration for two hours of sampling is 0.5 mg/m3.
Notes on the results
General
211 measurements from around 10 companies were analysed. 34% of the measurements come from the mechanical engineering/metalworking industries, 26% from the chemical industry and 15% from the electrical industry.
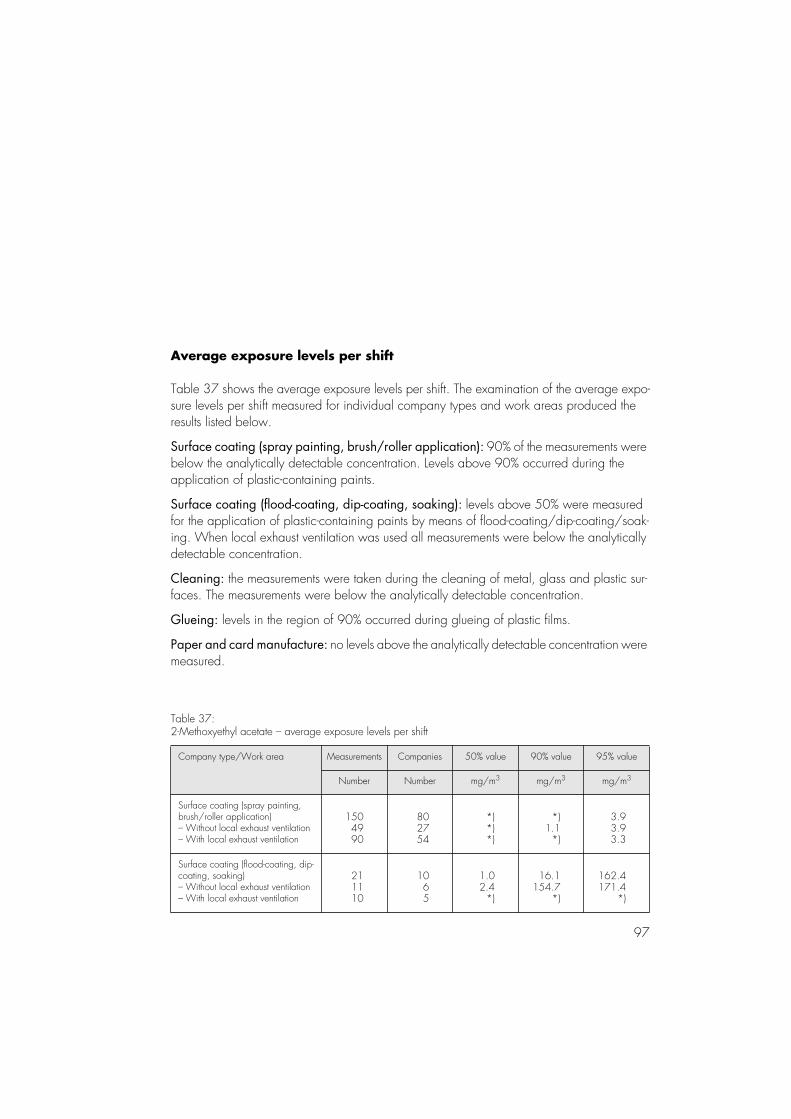
97
Average exposure levels per shift
Table 37 shows the average exposure levels per shift. The examination of the average expo-sure levels per shift measured for individual company types and work areas produced theresults listed below.
Surface coating (spray painting, brush/roller application): 90% of the measurements were below the analytically detectable concentration. Levels above 90% occurred during the application of plastic-containing paints.
Surface coating (flood-coating, dip-coating, soaking): levels above 50% were measured for the application of plastic-containing paints by means of flood-coating/dip-coating/soak-ing. When local exhaust ventilation was used all measurements were below the analytically detectable concentration.
Cleaning: the measurements were taken during the cleaning of metal, glass and plastic sur-faces. The measurements were below the analytically detectable concentration.
Glueing: levels in the region of 90% occurred during glueing of plastic films.
Paper and card manufacture: no levels above the analytically detectable concentration were measured.
Table 37:2-Methoxyethyl acetate – average exposure levels per shift
Company type/Work area Measurements Companies 50% value 90% value 95% value
Number Number mg/m3 mg/m3 mg/m3
Surface coating (spray painting, brush/roller application)– Without local exhaust ventilation– With local exhaust ventilation
1504990
802754
*)*)*)
*)1.1
*)
3.93.93.3
Surface coating (flood-coating, dip-coating, soaking)– Without local exhaust ventilation– With local exhaust ventilation
211110
1065
1.02.4
*)
16.1154.7
*)
162.4171.4
*)
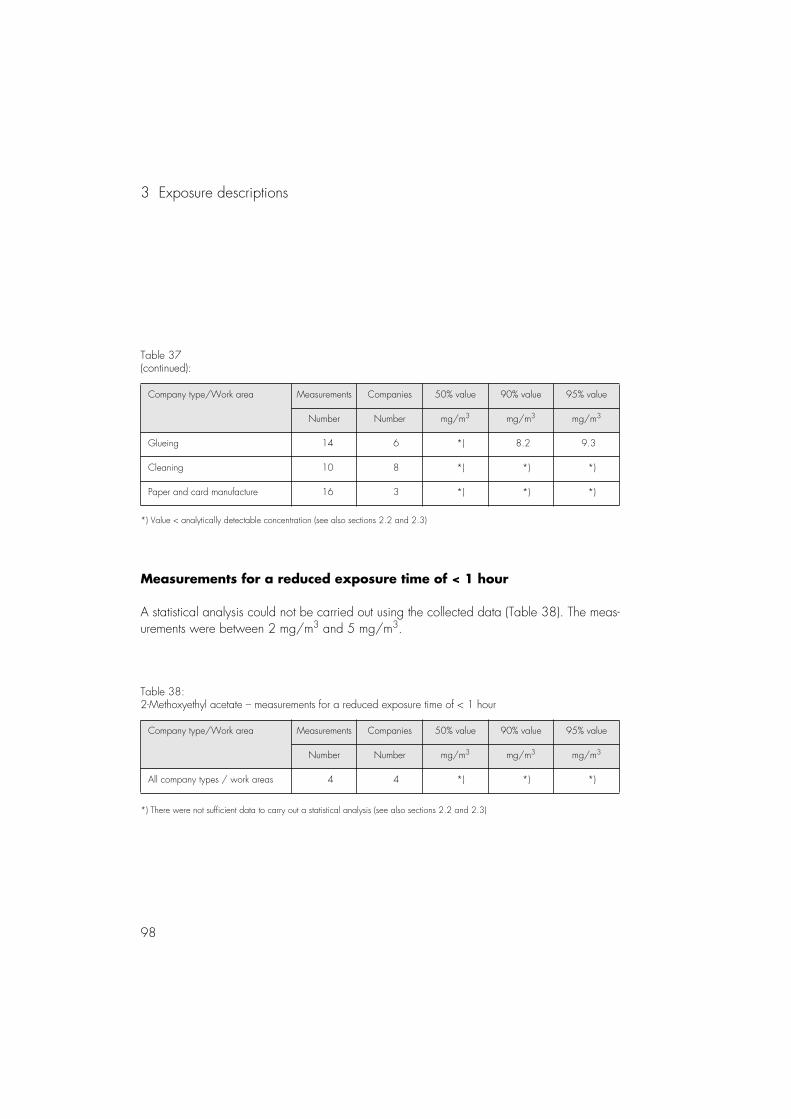
3 Exposure descriptions
98
Measurements for a reduced exposure time of < 1 hour
A statistical analysis could not be carried out using the collected data (Table 38). The meas-urements were between 2 mg/m3 and 5 mg/m3.
Table 37(continued):
Company type/Work area Measurements Companies 50% value 90% value 95% value
Number Number mg/m3 mg/m3 mg/m3
Glueing 14 6 *) 8.2 9.3
Cleaning 10 8 *) *) *)
Paper and card manufacture 16 3 *) *) *)
*) Value < analytically detectable concentration (see also sections 2.2 and 2.3)
Table 38:2-Methoxyethyl acetate – measurements for a reduced exposure time of < 1 hour
Company type/Work area Measurements Companies 50% value 90% value 95% value
Number Number mg/m3 mg/m3 mg/m3
All company types / work areas 4 4 *) *) *)
*) There were not sufficient data to carry out a statistical analysis (see also sections 2.2 and 2.3)
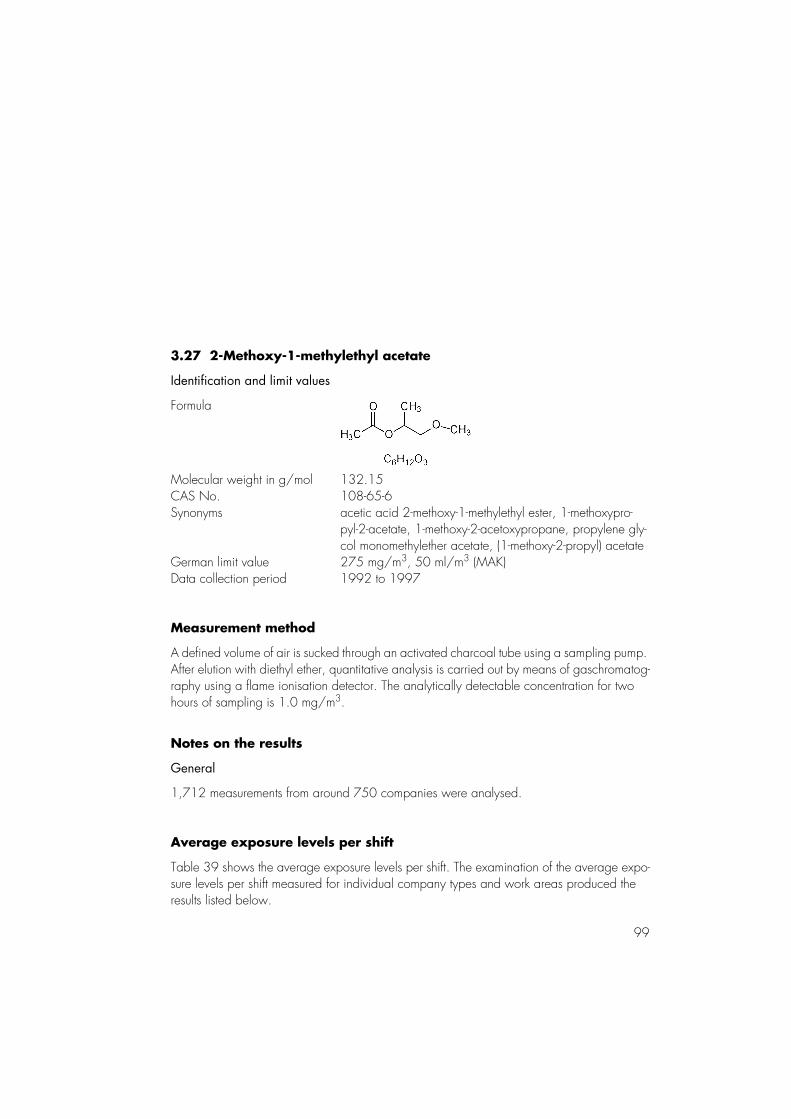
99
3.27 2-Methoxy-1-methylethyl acetate
Identification and limit values
Formula
Molecular weight in g/mol 132.15CAS No. 108-65-6Synonyms acetic acid 2-methoxy-1-methylethyl ester, 1-methoxypro-
pyl-2-acetate, 1-methoxy-2-acetoxypropane, propylene gly-col monomethylether acetate, (1-methoxy-2-propyl) acetate
German limit value 275 mg/m3, 50 ml/m3 (MAK)Data collection period 1992 to 1997
Measurement method
A defined volume of air is sucked through an activated charcoal tube using a sampling pump. After elution with diethyl ether, quantitative analysis is carried out by means of gaschromatog-raphy using a flame ionisation detector. The analytically detectable concentration for two hours of sampling is 1.0 mg/m3.
Notes on the results
General
1,712 measurements from around 750 companies were analysed.
Average exposure levels per shift
Table 39 shows the average exposure levels per shift. The examination of the average expo-sure levels per shift measured for individual company types and work areas produced the results listed below.
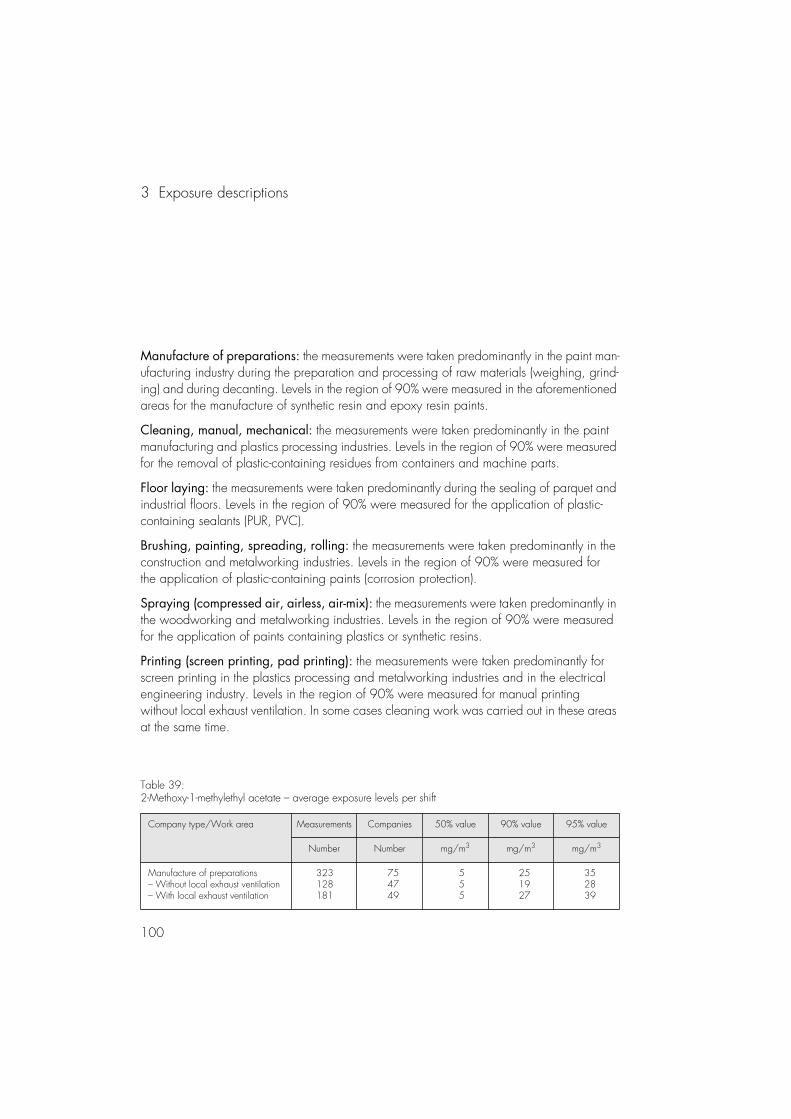
3 Exposure descriptions
100
Manufacture of preparations: the measurements were taken predominantly in the paint man-ufacturing industry during the preparation and processing of raw materials (weighing, grind-ing) and during decanting. Levels in the region of 90% were measured in the aforementioned areas for the manufacture of synthetic resin and epoxy resin paints.
Cleaning, manual, mechanical: the measurements were taken predominantly in the paint manufacturing and plastics processing industries. Levels in the region of 90% were measured for the removal of plastic-containing residues from containers and machine parts.
Floor laying: the measurements were taken predominantly during the sealing of parquet and industrial floors. Levels in the region of 90% were measured for the application of plastic-containing sealants (PUR, PVC).
Brushing, painting, spreading, rolling: the measurements were taken predominantly in the construction and metalworking industries. Levels in the region of 90% were measured for the application of plastic-containing paints (corrosion protection).
Spraying (compressed air, airless, air-mix): the measurements were taken predominantly in the woodworking and metalworking industries. Levels in the region of 90% were measured for the application of paints containing plastics or synthetic resins.
Printing (screen printing, pad printing): the measurements were taken predominantly for screen printing in the plastics processing and metalworking industries and in the electrical engineering industry. Levels in the region of 90% were measured for manual printing without local exhaust ventilation. In some cases cleaning work was carried out in these areas at the same time.
Table 39:2-Methoxy-1-methylethyl acetate – average exposure levels per shift
Company type/Work area Measurements Companies 50% value 90% value 95% value
Number Number mg/m3 mg/m3 mg/m3
Manufacture of preparations– Without local exhaust ventilation– With local exhaust ventilation
323128181
754749
555
251927
352839
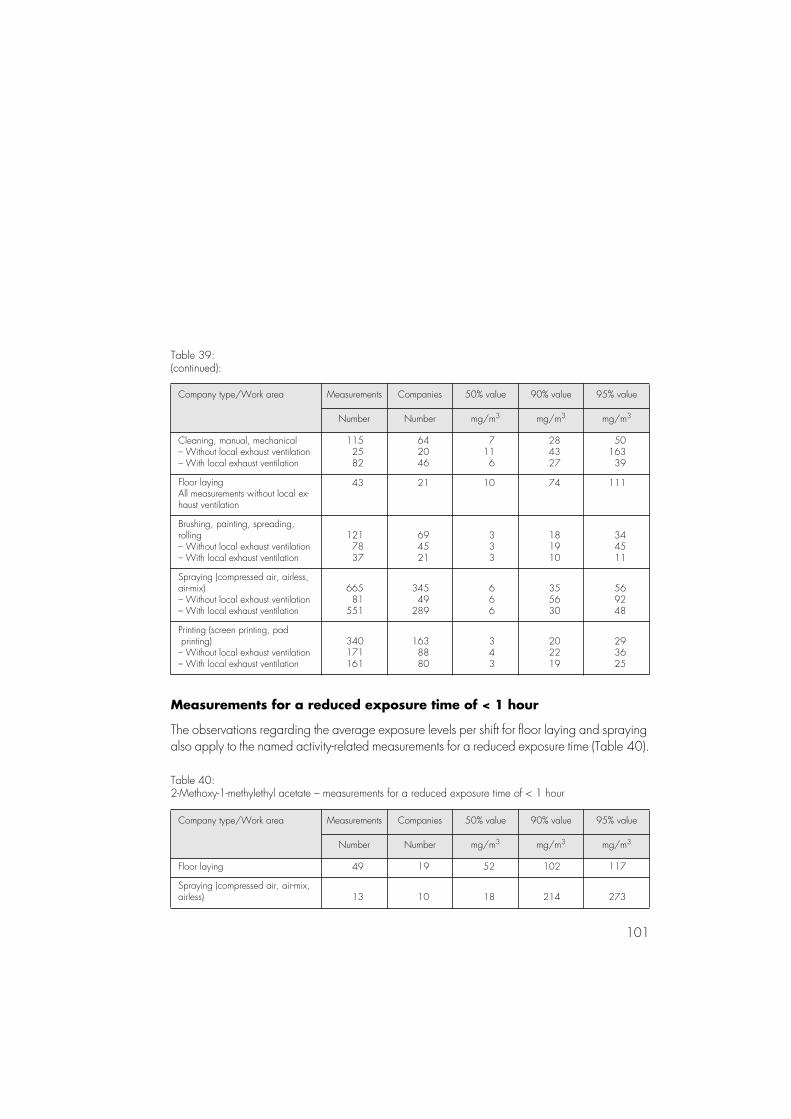
101
Measurements for a reduced exposure time of < 1 hour
The observations regarding the average exposure levels per shift for floor laying and spraying also apply to the named activity-related measurements for a reduced exposure time (Table 40).
Table 39:(continued):
Company type/Work area Measurements Companies 50% value 90% value 95% value
Number Number mg/m3 mg/m3 mg/m3
Cleaning, manual, mechanical– Without local exhaust ventilation– With local exhaust ventilation
1152582
642046
7116
284327
5016339
Floor layingAll measurements without local ex-haust ventilation
43 21 10 74 111
Brushing, painting, spreading, rolling– Without local exhaust ventilation– With local exhaust ventilation
1217837
694521
333
181910
344511
Spraying (compressed air, airless, air-mix)– Without local exhaust ventilation– With local exhaust ventilation
66581
551
34549
289
666
355630
569248
Printing (screen printing, pad printing)– Without local exhaust ventilation– With local exhaust ventilation
340171161
1638880
343
202219
293625
Table 40:2-Methoxy-1-methylethyl acetate – measurements for a reduced exposure time of < 1 hour
Company type/Work area Measurements Companies 50% value 90% value 95% value
Number Number mg/m3 mg/m3 mg/m3
Floor laying 49 19 52 102 117
Spraying (compressed air, air-mix, airless) 13 10 18 214 273
3 Exposure descriptions
102
3.28 Methyl acetate
Identification and limit values
Formula
Molecular weight in g/mol 74.07CAS No. 79-20-9Synonyms acetic acid methyl ester, ethanoic acid methyl esterGerman limit value 610 mg/m3, 200 ml/m3 (MAK)Data collection period 1990 to 1995BGAA exposure description No. 20
Measurement method
A defined volume of air is sucked through an activated charcoal tube using a sampling pump. After extraction with diethyl ether, quantitative analysis is carried out by means of gas-chromatography using a flame ionisation detector. The analytically detectable concentration for two hours of sampling is 1.0 mg/m3.
Notes on the results
General
1,523 measurements from 563 companies were analysed. The analysis focused on the woodworking industry and floor laying.
Average exposure levels per shift
Table 41 shows the average exposure levels per shift. The examination of the average expo-sure levels per shift measured for individual company types and work areas produced the results listed below.

103
Mixing, decanting, weighing: 90% of the measurements were taken in the paint manufac-turing industry. Around 20% of the measurements were below the analytically detectable con-centration. Levels above 95% were measured during the manufacture of parquet adhesives.
Surface cleaning: The measurements come from the metalworking, electrical engineering and woodworking industries. More than 30% of the measurements were in the region of theanalytically detectable concentration. Levels above 90% were measured for large-scale cleaning.
Glueing (construction industry: floor laying): more than 50% of the measurements were taken during the laying of floor coverings. In most cases no local exhaust ventilation was used during this work owing to the nature of the processes involved. Exposure levels below 50% were measured for glueing in the woodworking industry. Exposure levels above 90% were measured for the application of parquet adhesives.
Methyl acetate is a component of the solvent mixture used in primers and adhesives for floor coverings. The primers are usually applied to the floor using a roller. Large quantities are applied in a relatively short time. When adhesive is applied to floor coverings (except parquet floors) it is distributed over several square metres using a serrated spatula and the floor cover-ing is subsequently fixed in place. When laying parquet floors, a smaller quantity of adhesive is applied as more care is required when fixing this type of floor covering in position. Primers contain up to 50% methyl acetate, adhesives up to 15% and parquet adhesives up to 25%.
Glueing (plastics / plastic foam processing): levels in the region of 90% were measured for the spraying of adhesives without the use of local exhaust ventilation.
Glueing (woodworking): levels in the region of 90% were measured for the spraying of adhesives without the use of local exhaust ventilation.
Spray painting (metalworking, plastics processing, precision mechanics): no special work-ing conditions were observed for the levels in the region of 90%.
Spray painting (construction industry): methyl acetate is a component of the solvent mixture in some of the paints used for buildings. They are sprayed onto surfaces using a spray gun. No special working conditions were observed for the levels in the region of 90%.
Spray painting (woodworking): in the woodworking industry local exhaust ventilation is gen-erally used during spray painting. The work areas without local exhaust ventilation are airing and drying areas.
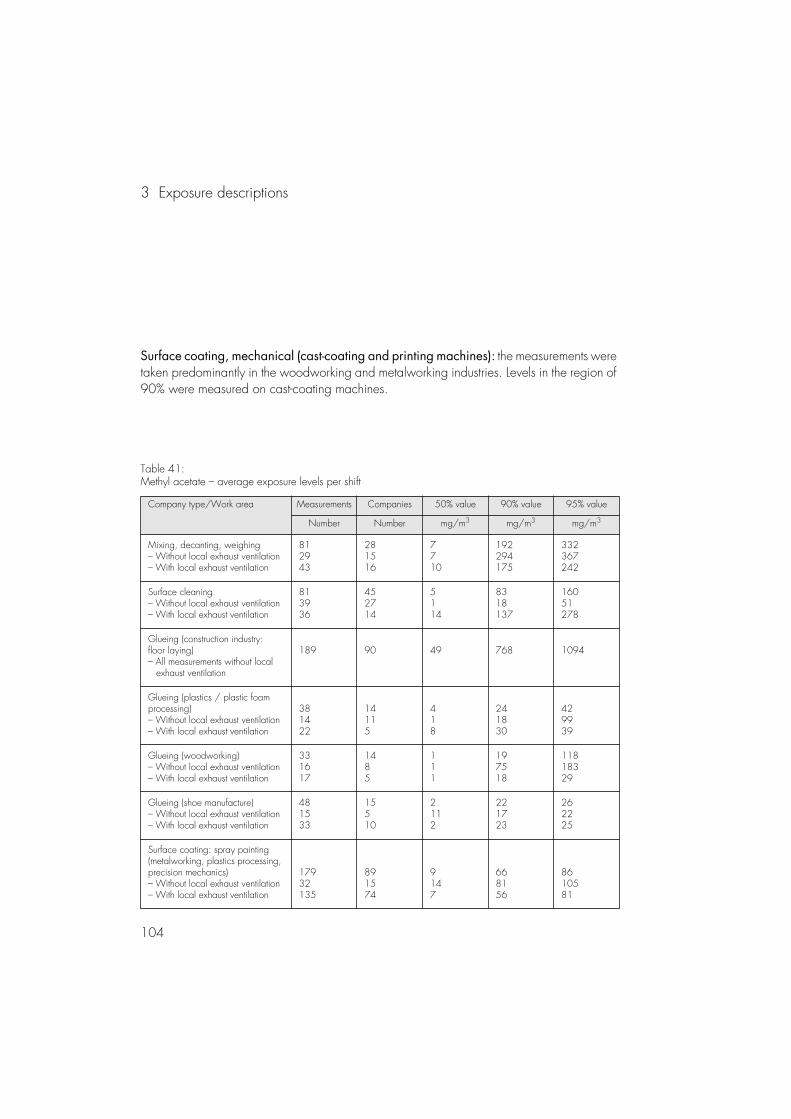
3 Exposure descriptions
104
Surface coating, mechanical (cast-coating and printing machines): the measurements were taken predominantly in the woodworking and metalworking industries. Levels in the region of 90% were measured on cast-coating machines.
Table 41:Methyl acetate – average exposure levels per shift
Company type/Work area Measurements Companies 50% value 90% value 95% value
Number Number mg/m3 mg/m3 mg/m3
Mixing, decanting, weighing– Without local exhaust ventilation– With local exhaust ventilation
812943
281516
7710
192294175
332367242
Surface cleaning– Without local exhaust ventilation– With local exhaust ventilation
813936
452714
5114
8318137
16051278
Glueing (construction industry: floor laying)– All measurements without local exhaust ventilation
189 90 49 768 1094
Glueing (plastics / plastic foam processing)– Without local exhaust ventilation– With local exhaust ventilation
381422
14115
418
241830
429939
Glueing (woodworking)– Without local exhaust ventilation– With local exhaust ventilation
331617
1485
111
197518
11818329
Glueing (shoe manufacture)– Without local exhaust ventilation– With local exhaust ventilation
481533
15510
2112
221723
262225
Surface coating: spray painting (metalworking, plastics processing, precision mechanics)– Without local exhaust ventilation– With local exhaust ventilation
17932135
891574
9147
668156
8610581
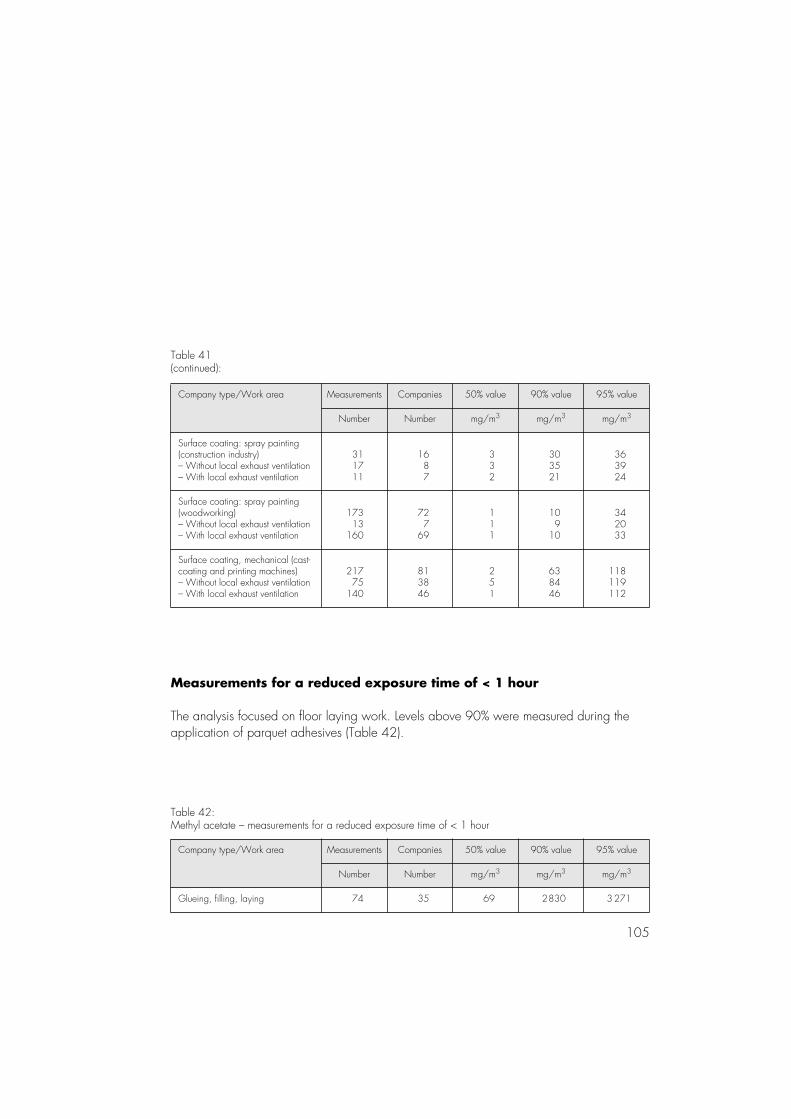
105
Measurements for a reduced exposure time of < 1 hour
The analysis focused on floor laying work. Levels above 90% were measured during the application of parquet adhesives (Table 42).
Table 41(continued):
Company type/Work area Measurements Companies 50% value 90% value 95% value
Number Number mg/m3 mg/m3 mg/m3
Surface coating: spray painting (construction industry)– Without local exhaust ventilation– With local exhaust ventilation
311711
1687
332
303521
363924
Surface coating: spray painting (woodworking)– Without local exhaust ventilation– With local exhaust ventilation
17313
160
727
69
111
109
10
342033
Surface coating, mechanical (cast-coating and printing machines)– Without local exhaust ventilation– With local exhaust ventilation
21775
140
813846
251
638446
118119112
Table 42:Methyl acetate – measurements for a reduced exposure time of < 1 hour
Company type/Work area Measurements Companies 50% value 90% value 95% value
Number Number mg/m3 mg/m3 mg/m3
Glueing, filling, laying 74 35 69 2830 3 271
3 Exposure descriptions
106
3.29 Methyl methacrylate
Identification and limit values
Formula
Molecular weight in g/mol 100.11CAS No. 80-62-6Synonyms methacrylic acid methyl ester, α-methacrylic acid
methyl ester, 2-methylpropenoic acid methyl esterGerman limit value 210 mg/m3, 50 ml/m3 (MAK)Data collection period 1990 to 1995BGAA exposure description No. 2
Measurement method
A defined volume of air is sucked through an activated charcoal tube using a sampling pump. After extraction with diethyl ether, quantitative analysis is carried out by means of gas- chromatography using a flame ionisation detector. The analytically detectable concentration for two hours of sampling is 1.0 mg/m3.
Notes on the results
General
503 measurements from around 170 companies were analysed. 20% of the measurements relate to interior work in industrial and manufacturing facilities (plastic coatings and special coatings), a further 20% relate to plastics processing. With regard to the selected data
107
collection period, it should be noted that measurements from the period before 1990 are available for areas other than those featured here, for example for the dental sector. After 1990, however, no further measurements were taken in this area as the exposure levels were so low.
Average exposure levels per shift
Table 43 shows the average exposure levels per shift. The examination of the average expo-sure levels per shift measured for individual company types and work areas produced the results listed below.
Plastics manufacture: the measurements taken on extruders were in the region of the ana-lytically detectable concentration. Levels in the region of 90% were measured on reaction vessels.
Decanting, weighing, mixing: levels below 50% were measured during decanting (for example paint manufacture, wholesale industry). Levels in the region of 90% were measured for manual mixing in the paint manufacturing industry.
Glueing: 40% of the measurements were taken in the plastics processing sector (for example glueing of Plexiglas). In cases where adhesives were applied to smaller surface areas(for example spot glueing in the electrical engineering and shoe manufacturing industries) measurements were below the 50% level. Levels in the region of 90% were measured for the large-scale glueing.
Coating with paints/varnishes/casting resins: measurements focused on the woodworking, glass manufacturing and metalworking sectors. Levels in the region of the analytically detect-able concentration (50% level) occurred during the processing of paints and varnishes. Levels in the region of 90% were measured for the application of cast resins (for example in the manufacture of orthopaedic equipment).
Application of floor coatings: measurements focused on interior work in industrial and man-ufacturing facilities. High exposure levels were measured in all work areas (cast-coating, filling, sealing) in this section. Local exhaust ventilation was rarely used owing to the nature of the processes involved.
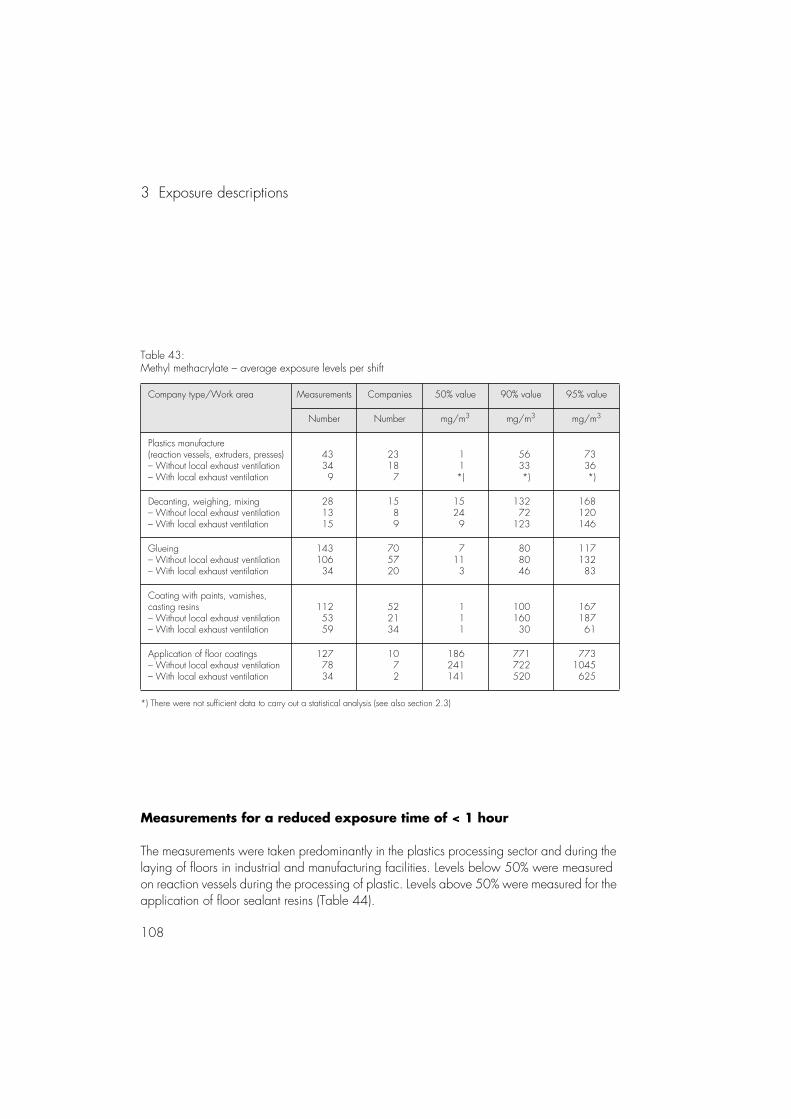
3 Exposure descriptions
108
Measurements for a reduced exposure time of < 1 hour
The measurements were taken predominantly in the plastics processing sector and during the laying of floors in industrial and manufacturing facilities. Levels below 50% were measured on reaction vessels during the processing of plastic. Levels above 50% were measured for the application of floor sealant resins (Table 44).
Table 43:Methyl methacrylate – average exposure levels per shift
Company type/Work area Measurements Companies 50% value 90% value 95% value
Number Number mg/m3 mg/m3 mg/m3
Plastics manufacture(reaction vessels, extruders, presses)– Without local exhaust ventilation– With local exhaust ventilation
43349
23187
11*)
5633*)
7336*)
Decanting, weighing, mixing– Without local exhaust ventilation– With local exhaust ventilation
281315
1589
15249
13272
123
168120146
Glueing– Without local exhaust ventilation– With local exhaust ventilation
14310634
705720
7113
808046
11713283
Coating with paints, varnishes, casting resins– Without local exhaust ventilation– With local exhaust ventilation
1125359
522134
111
10016030
16718761
Application of floor coatings– Without local exhaust ventilation– With local exhaust ventilation
1277834
1072
186241141
771722520
7731045625
*) There were not sufficient data to carry out a statistical analysis (see also section 2.3)

109
Table 44:Methyl methacrylate – measurements for a reduced exposure time of < 1 hour
Company type/Work area Measurements Companies 50% value 90% value 95% value
Number Number mg/m3 mg/m3 mg/m3
All company types/ work areas 50 14 195 521 683
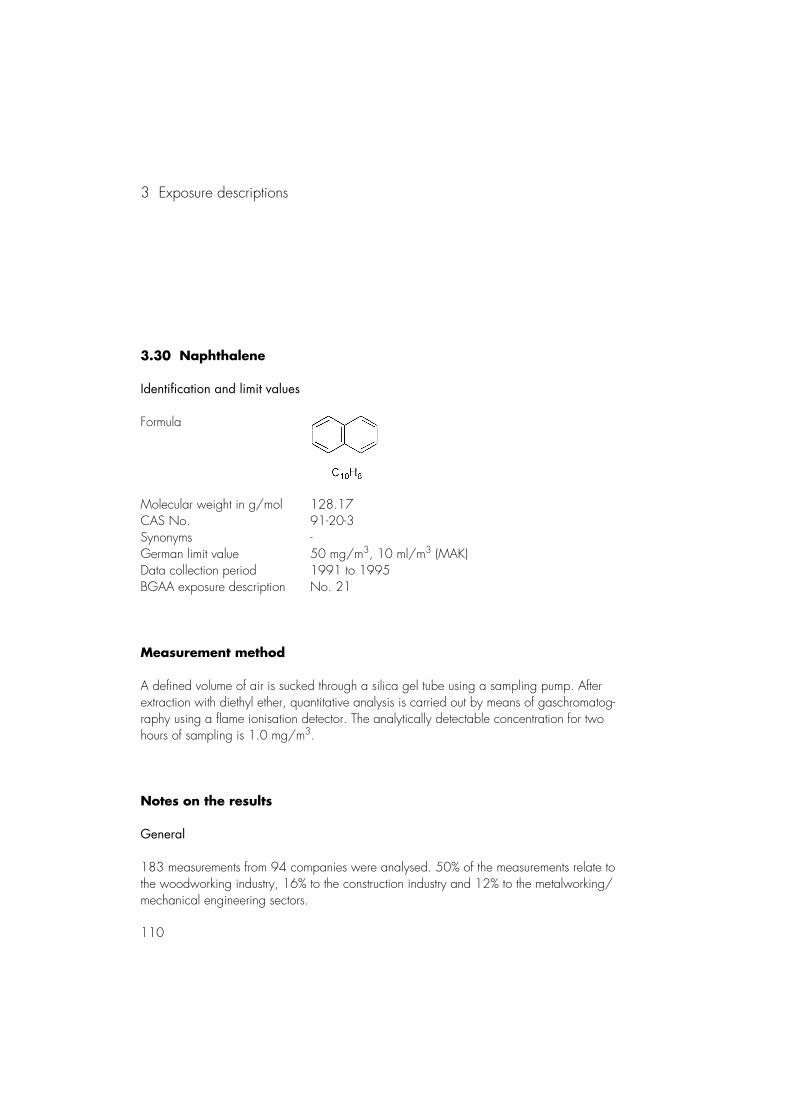
3 Exposure descriptions
110
3.30 Naphthalene
Identification and limit values
Formula
Molecular weight in g/mol 128.17CAS No. 91-20-3Synonyms -German limit value 50 mg/m3, 10 ml/m3 (MAK)Data collection period 1991 to 1995BGAA exposure description No. 21
Measurement method
A defined volume of air is sucked through a silica gel tube using a sampling pump. After extraction with diethyl ether, quantitative analysis is carried out by means of gaschromatog-raphy using a flame ionisation detector. The analytically detectable concentration for two hours of sampling is 1.0 mg/m3.
Notes on the results
General
183 measurements from 94 companies were analysed. 50% of the measurements relate to the woodworking industry, 16% to the construction industry and 12% to the metalworking/mechanical engineering sectors.
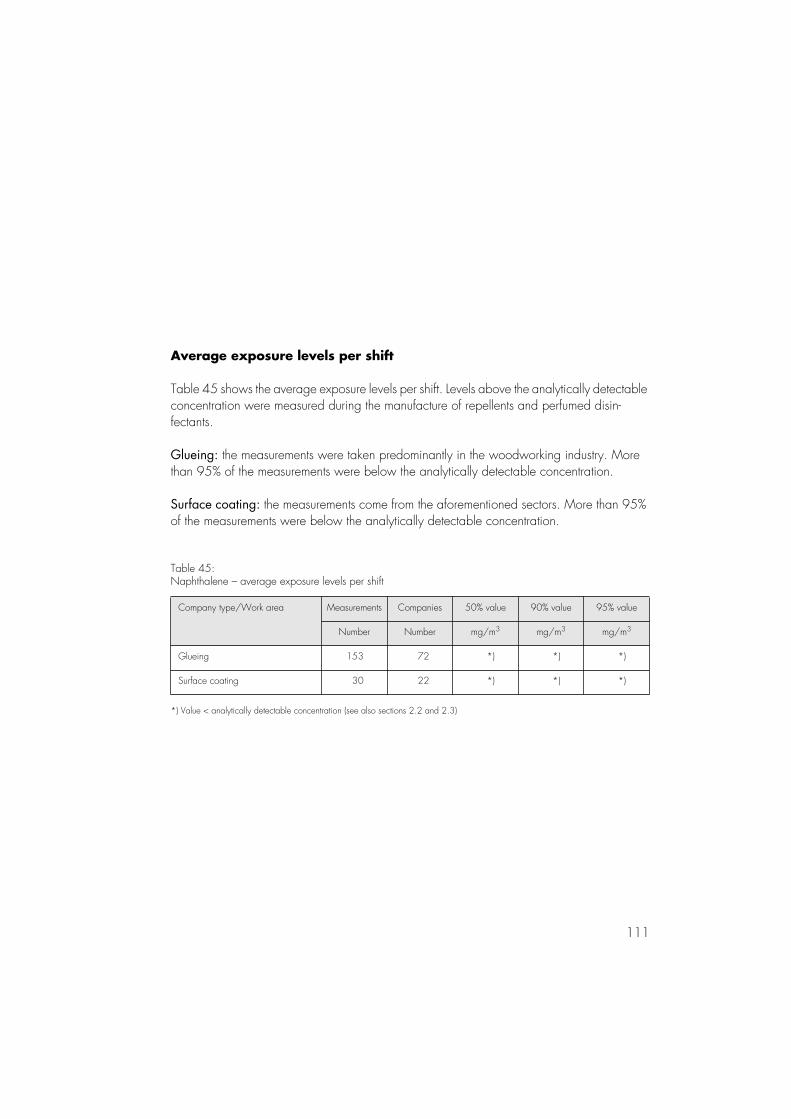
111
Average exposure levels per shift
Table 45 shows the average exposure levels per shift. Levels above the analytically detectable concentration were measured during the manufacture of repellents and perfumed disin-fectants.
Glueing: the measurements were taken predominantly in the woodworking industry. More than 95% of the measurements were below the analytically detectable concentration.
Surface coating: the measurements come from the aforementioned sectors. More than 95% of the measurements were below the analytically detectable concentration.
Table 45:Naphthalene – average exposure levels per shift
Company type/Work area Measurements Companies 50% value 90% value 95% value
Number Number mg/m3 mg/m3 mg/m3
Glueing 153 72 *) *) *)
Surface coating 30 22 *) *) *)
*) Value < analytically detectable concentration (see also sections 2.2 and 2.3)
3 Exposure descriptions
112
3.31 Nickel
Identification and limit values
Formula NiCAS No. 7440-02-0Synonyms –German limit value Nickel and its compounds: 0.5 mg/m3 for Ni as a metal
and carbonate (MAK), 0.5 mg/m3 for NiO, NiS and sulphidic ores (TRK), 0.05 mg/m3 for Ni compounds in the form of respirable droplets (TRK)
Data collection period 1991 to 1996BGAA exposure description No. 43
Measurement method
The methods used determine the levels of nickel together with its compounds in the form of dusts and aerosols. A defined volume of air is sucked through a membrane filter or quartz fibre double filter (measurement in galvanising shops or in workplaces with relative air mois-ture contents of > 50%) using a sampling pump. After dissolution, the nickel contained in the overall volume of dust is measured by means of atomic absorption spectrometry (graphite tube) or X-ray fluorescence spectrometry. The analytically detectable concentration for two hours of sampling is 10-8 g/m3 (0.00001 mg/m3) (see also [22]).
Notes on the results
General
2,879 measurements from around 1,050 companies were analysed in compliance with the Data Protection Act.
113
The individual nickel compounds contained in the EU and OECD lists were measured together to give the overall level of nickel as the active component. Conclusions regarding the pres-ence of specific nickel compounds can be drawn by referring to the literature.
Average exposure levels per shift
Table 46 shows the average exposure levels per shift. The examination of the average expo-sure levels per shift measured for individual company types and work areas produced the results listed below.
Surface finishing / galvanising: the measurements were taken predominantly during the manufacture of nickel coatings (for example using Watts electrolyte).
Foundries (smelting, casting): the measurements were taken predominantly during smelting. Levels in the region of 90% were measured during smelting of nonferrous metal-containing res-idues.
Grinding / polishing: the measurements were taken predominantly in the mechanical engi-neering industry. Levels in the region of 90% were measured during the machining of nickel-containing materials (CrNi steels, nickel-plated workpieces).
Manual arc welding: the measurements were taken predominantly in the metalworking industry.
Tungsten inert-gas welding: the measurements were taken predominantly in the metalwork-ing industry. The effect of local exhaust ventilation on exposure levels can be seen clearly.
Inert-gas metal-arc welding: the measurements were taken predominantly in the metalwork-ing industry.
Active-gas metal-arc welding: the measurements were taken predominantly in the metalwork-ing industry. Levels in the region of 90% were measured, inter alia, during welding in confined spaces (for example container manufacture).
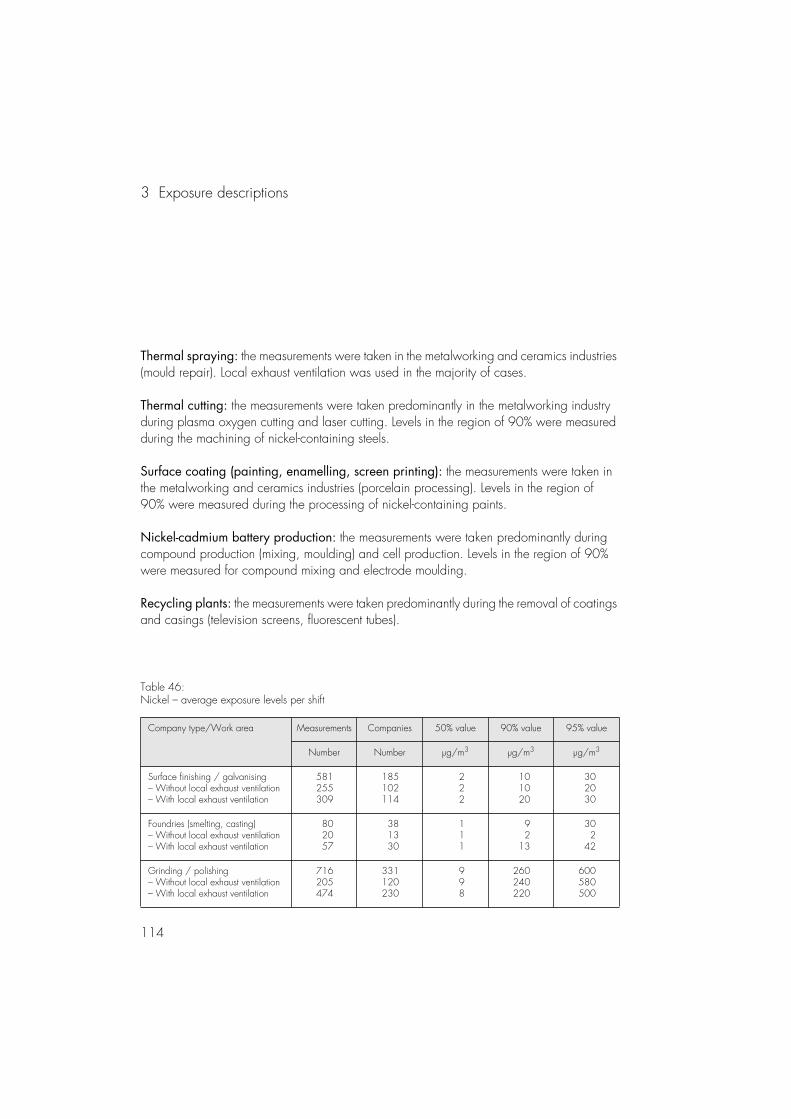
3 Exposure descriptions
114
Thermal spraying: the measurements were taken in the metalworking and ceramics industries (mould repair). Local exhaust ventilation was used in the majority of cases.
Thermal cutting: the measurements were taken predominantly in the metalworking industry during plasma oxygen cutting and laser cutting. Levels in the region of 90% were measured during the machining of nickel-containing steels.
Surface coating (painting, enamelling, screen printing): the measurements were taken in the metalworking and ceramics industries (porcelain processing). Levels in the region of 90% were measured during the processing of nickel-containing paints.
Nickel-cadmium battery production: the measurements were taken predominantly during compound production (mixing, moulding) and cell production. Levels in the region of 90% were measured for compound mixing and electrode moulding.
Recycling plants: the measurements were taken predominantly during the removal of coatings and casings (television screens, fluorescent tubes).
Company type/Work area Measurements Companies 50% value 90% value 95% value
Number Number µg/m3 µg/m3 µg/m3
Surface finishing / galvanising– Without local exhaust ventilation– With local exhaust ventilation
581255309
185102114
222
101020
302030
Foundries (smelting, casting)– Without local exhaust ventilation– With local exhaust ventilation
802057
381330
111
92
13
302
42
Grinding / polishing– Without local exhaust ventilation– With local exhaust ventilation
716205474
331120230
998
260240220
600580500
Table 46:Nickel – average exposure levels per shift
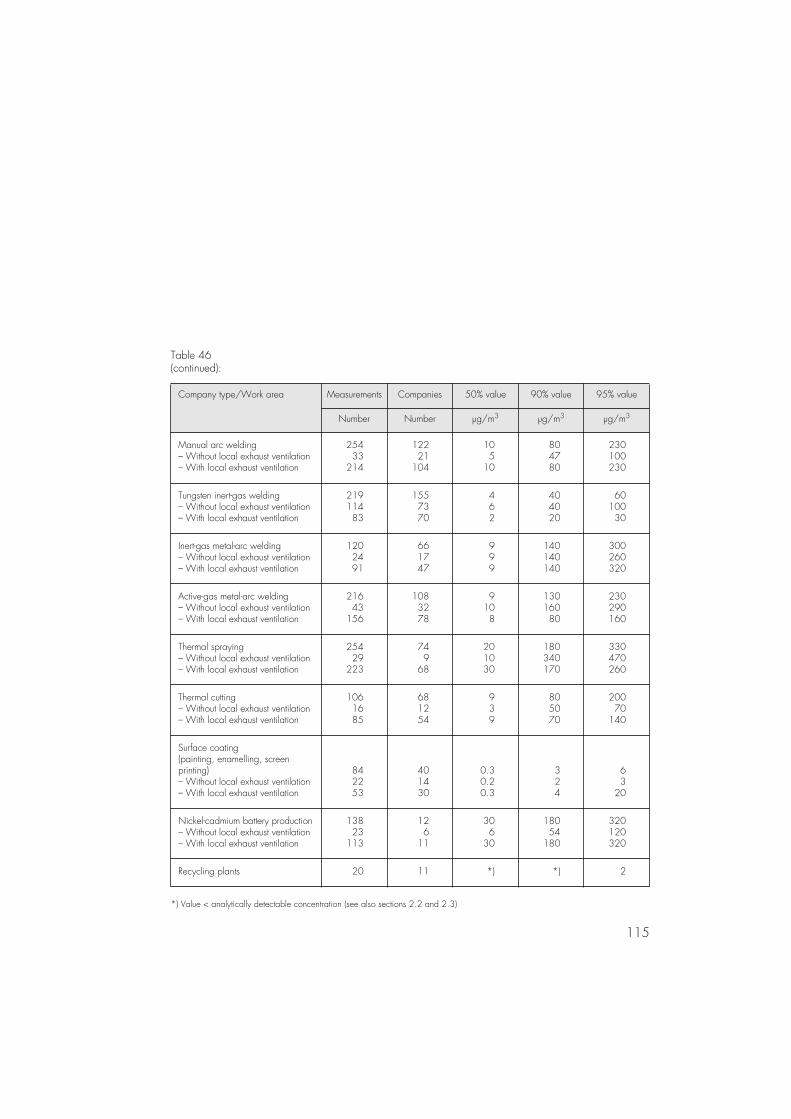
115
Table 46(continued):
Company type/Work area Measurements Companies 50% value 90% value 95% value
Number Number µg/m3 µg/m3 µg/m3
Manual arc welding– Without local exhaust ventilation– With local exhaust ventilation
25433
214
12221
104
105
10
804780
230100230
Tungsten inert-gas welding– Without local exhaust ventilation– With local exhaust ventilation
21911483
1557370
462
404020
6010030
Inert-gas metal-arc welding– Without local exhaust ventilation– With local exhaust ventilation
1202491
661747
999
140140140
300260320
Active-gas metal-arc welding– Without local exhaust ventilation– With local exhaust ventilation
21643
156
1083278
9108
13016080
230290160
Thermal spraying– Without local exhaust ventilation– With local exhaust ventilation
25429
223
749
68
201030
180340170
330470260
Thermal cutting– Without local exhaust ventilation– With local exhaust ventilation
1061685
681254
939
805070
20070
140
Surface coating(painting, enamelling, screen printing)– Without local exhaust ventilation– With local exhaust ventilation
842253
401430
0.30.20.3
324
63
20
Nickel-cadmium battery production– Without local exhaust ventilation– With local exhaust ventilation
13823
113
126
11
306
30
18054
180
320120320
Recycling plants 20 11 *) *) 2
*) Value < analytically detectable concentration (see also sections 2.2 and 2.3)
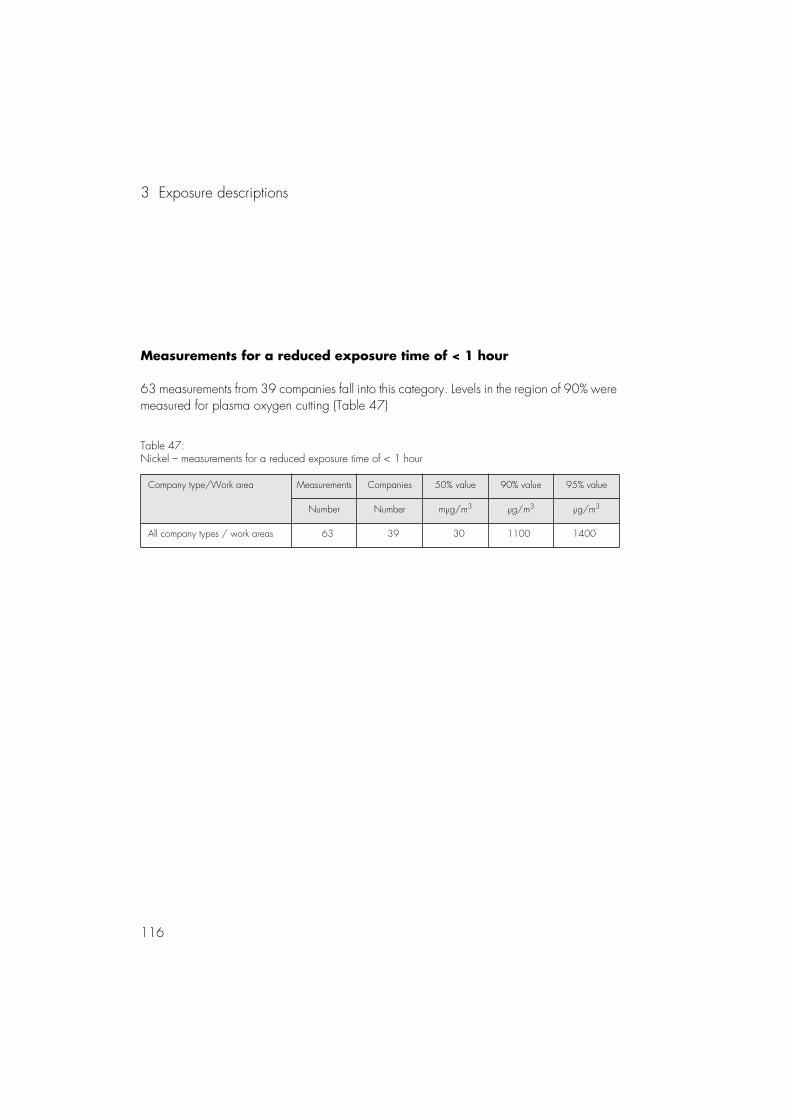
3 Exposure descriptions
116
Measurements for a reduced exposure time of < 1 hour
63 measurements from 39 companies fall into this category. Levels in the region of 90% were measured for plasma oxygen cutting (Table 47)
Table 47:Nickel – measurements for a reduced exposure time of < 1 hour
Company type/Work area Measurements Companies 50% value 90% value 95% value
Number Number mµg/m3 µg/m3 µg/m3
All company types / work areas 63 39 30 1100 1400
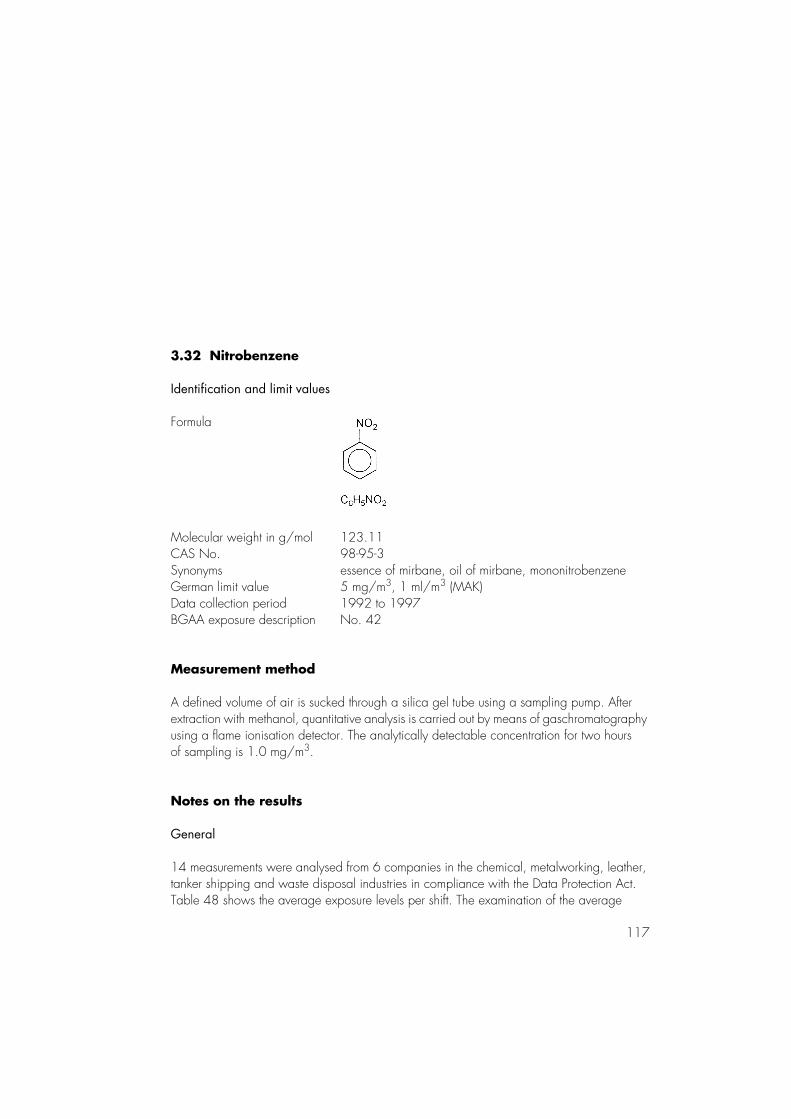
117
3.32 Nitrobenzene
Identification and limit values
Formula
Molecular weight in g/mol 123.11CAS No. 98-95-3Synonyms essence of mirbane, oil of mirbane, mononitrobenzeneGerman limit value 5 mg/m3, 1 ml/m3 (MAK)Data collection period 1992 to 1997BGAA exposure description No. 42
Measurement method
A defined volume of air is sucked through a silica gel tube using a sampling pump. After extraction with methanol, quantitative analysis is carried out by means of gaschromatography using a flame ionisation detector. The analytically detectable concentration for two hours of sampling is 1.0 mg/m3.
Notes on the results
General
14 measurements were analysed from 6 companies in the chemical, metalworking, leather, tanker shipping and waste disposal industries in compliance with the Data Protection Act. Table 48 shows the average exposure levels per shift. The examination of the average
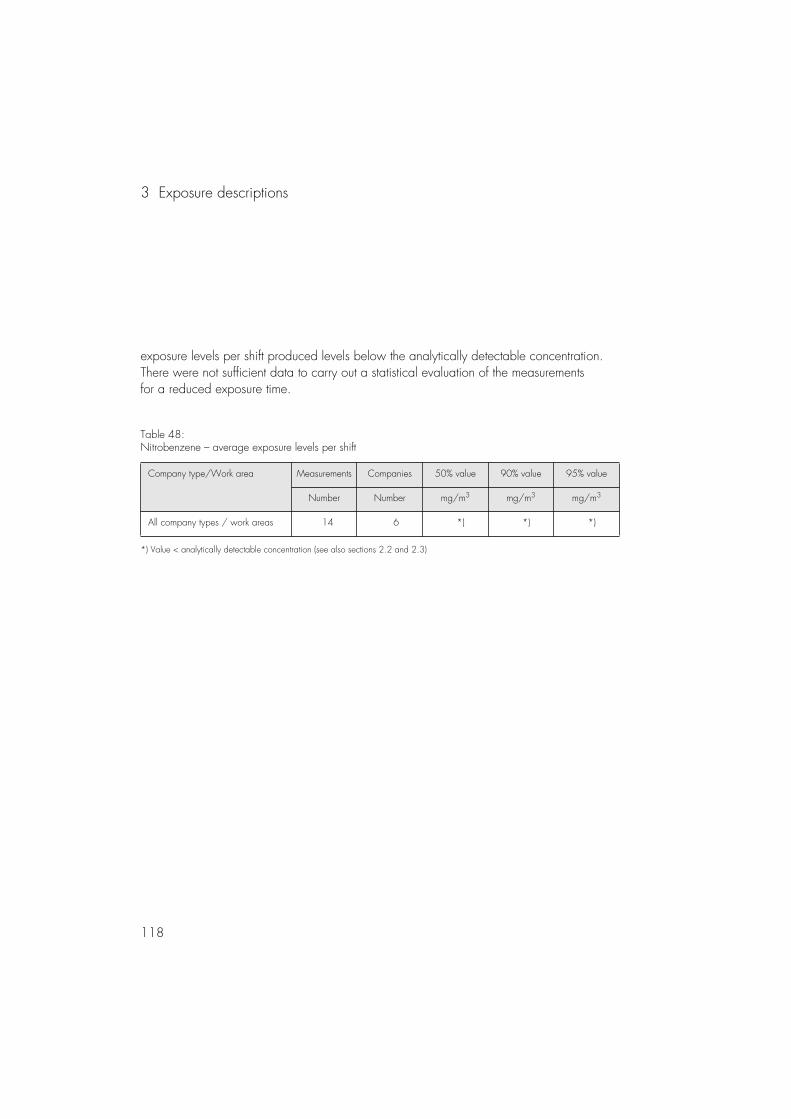
3 Exposure descriptions
118
exposure levels per shift produced levels below the analytically detectable concentration. There were not sufficient data to carry out a statistical evaluation of the measurements for a reduced exposure time.
Table 48:Nitrobenzene – average exposure levels per shift
Company type/Work area Measurements Companies 50% value 90% value 95% value
Number Number mg/m3 mg/m3 mg/m3
All company types / work areas 14 6 *) *) *)
*) Value < analytically detectable concentration (see also sections 2.2 and 2.3)
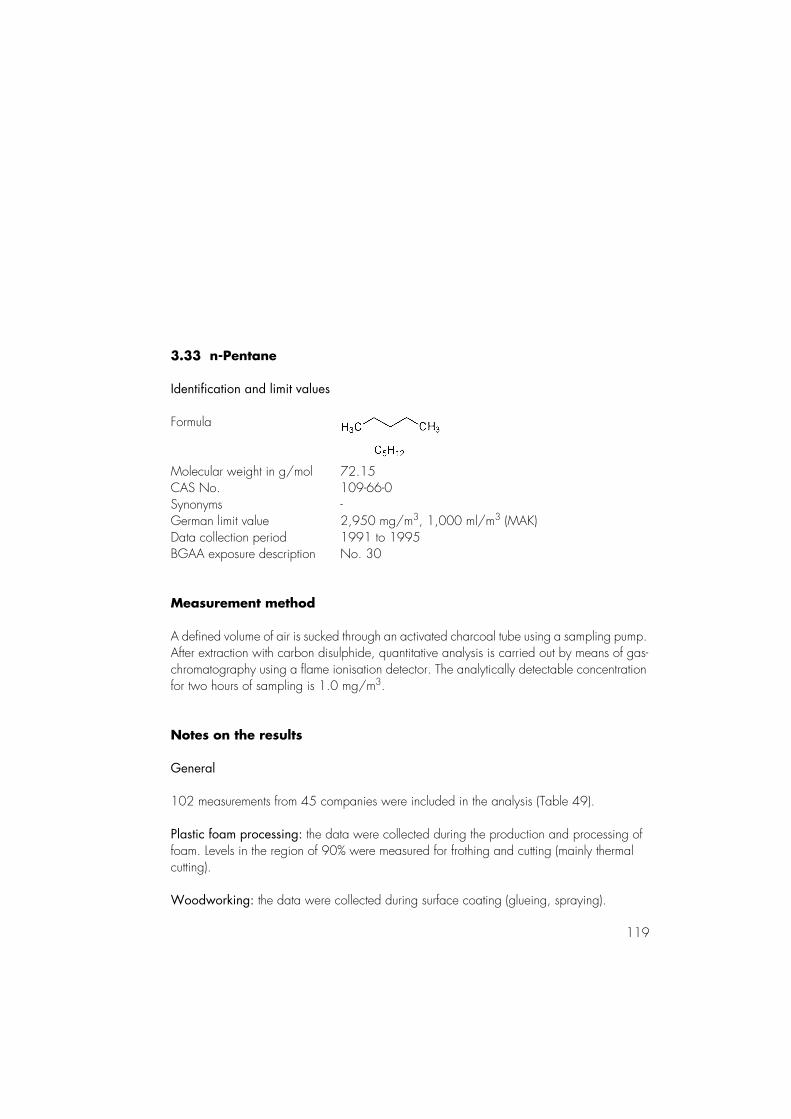
119
3.33 n-Pentane
Identification and limit values
Formula
Molecular weight in g/mol 72.15CAS No. 109-66-0Synonyms -German limit value 2,950 mg/m3, 1,000 ml/m3 (MAK)Data collection period 1991 to 1995BGAA exposure description No. 30
Measurement method
A defined volume of air is sucked through an activated charcoal tube using a sampling pump. After extraction with carbon disulphide, quantitative analysis is carried out by means of gas-chromatography using a flame ionisation detector. The analytically detectable concentration for two hours of sampling is 1.0 mg/m3.
Notes on the results
General
102 measurements from 45 companies were included in the analysis (Table 49).
Plastic foam processing: the data were collected during the production and processing of foam. Levels in the region of 90% were measured for frothing and cutting (mainly thermal cutting).
Woodworking: the data were collected during surface coating (glueing, spraying).
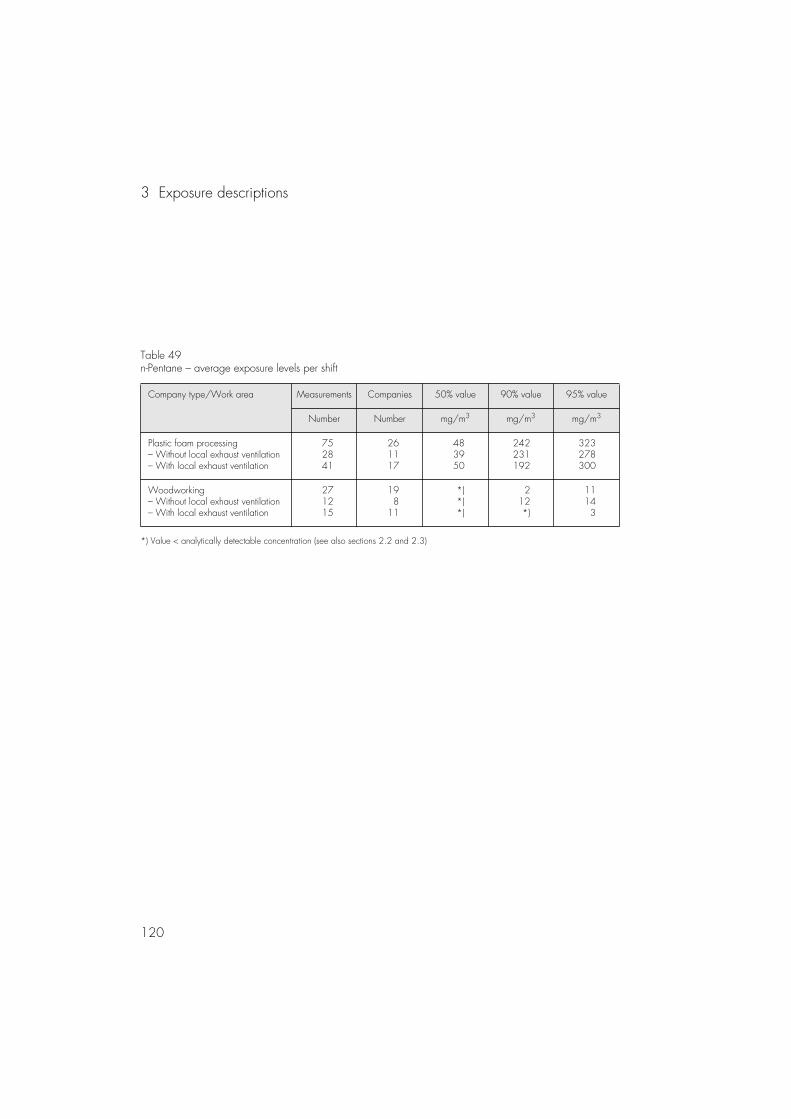
3 Exposure descriptions
120
Table 49n-Pentane – average exposure levels per shift
Company type/Work area Measurements Companies 50% value 90% value 95% value
Number Number mg/m3 mg/m3 mg/m3
Plastic foam processing– Without local exhaust ventilation– With local exhaust ventilation
752841
261117
483950
242231192
323278300
Woodworking– Without local exhaust ventilation– With local exhaust ventilation
271215
198
11
*)*)*)
212*)
11143
*) Value < analytically detectable concentration (see also sections 2.2 and 2.3)
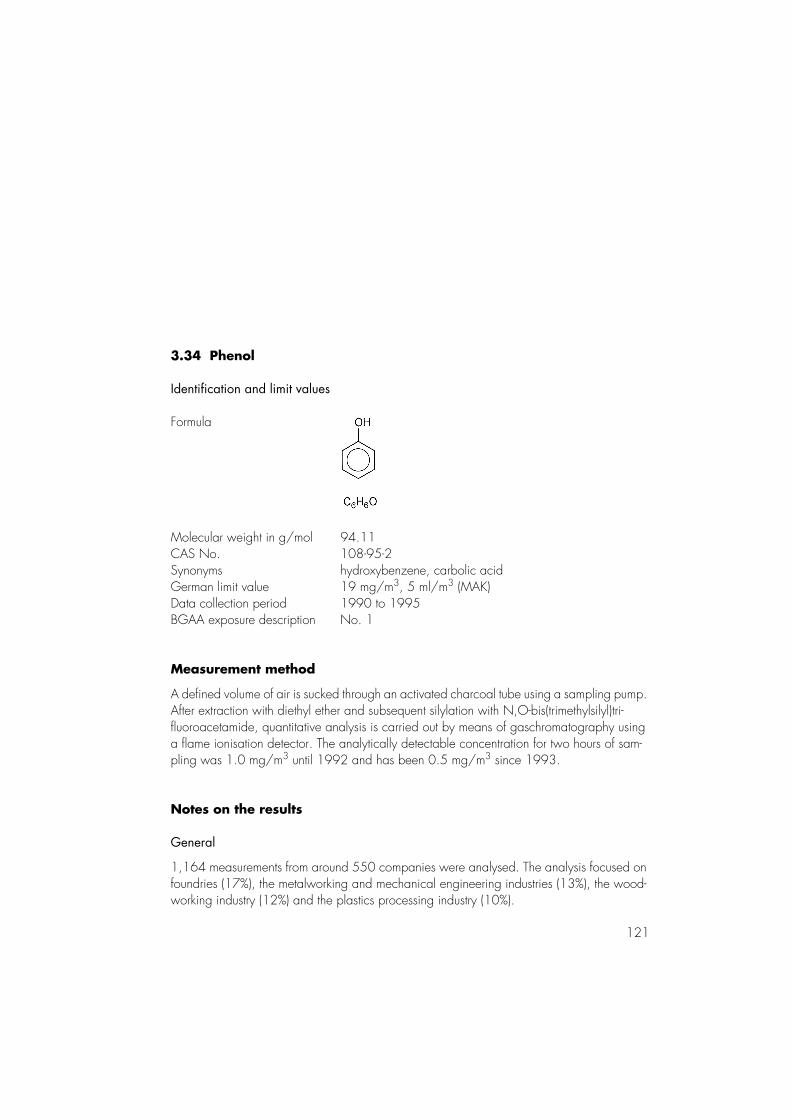
121
3.34 Phenol
Identification and limit values
Formula
Molecular weight in g/mol 94.11CAS No. 108-95-2Synonyms hydroxybenzene, carbolic acidGerman limit value 19 mg/m3, 5 ml/m3 (MAK)Data collection period 1990 to 1995BGAA exposure description No. 1
Measurement method
A defined volume of air is sucked through an activated charcoal tube using a sampling pump. After extraction with diethyl ether and subsequent silylation with N,O-bis(trimethylsilyl)tri-fluoroacetamide, quantitative analysis is carried out by means of gaschromatography using a flame ionisation detector. The analytically detectable concentration for two hours of sam-pling was 1.0 mg/m3 until 1992 and has been 0.5 mg/m3 since 1993.
Notes on the results
General
1,164 measurements from around 550 companies were analysed. The analysis focused on foundries (17%), the metalworking and mechanical engineering industries (13%), the wood-working industry (12%) and the plastics processing industry (10%).
3 Exposure descriptions
122
The measurements for the processing of phenol-formaldehyde foams in the mining industry (for sealing cavities) are below the analytically detectable concentration (up to 2.0 mg/m3). As such a small number of cases were recorded, the measurements were not subjected to statistical analysis.
Average exposure levels per shift
Table 50 shows the average exposure levels per shift. The examination of the average expo-sure levels per shift measured for individual company types and work areas produced the results listed below.
Processing of phenolic resins in the plastics processing and woodworking industries: the measurements were taken for moulding, kneading, extrusion and injection moulding. More than 90% of the measurements were in the region of the analytically detectable concentration. Levels above the analytically detectable concentration (1.0 mg/m3) were measured during the moulding of wooden panels and abrasive discs.
Processing of phenolic resins in foundries: around 90% of the measurements were in the region of the analytically detectable concentration. Levels above 90% were measured during the manufacture of cores using phenol-containing resins.
Dryers, box / smelting and hardening furnaces: around half of the measurements were taken during the manufacture of abrasive products. 85% of the measurements were in the region of the analytically detectable concentration.
Mechanical machining processes: the measurements were taken in the metalworking, mechanical engineering, vehicle manufacture and electrical engineering industries. No levels above the analytically detectable concentration were measured.
Glueing: the majority of the measurements came from the metalworking/mechanical engi-neering, woodworking and plastics processing industries. In more than 95% of cases the measurements were in the region of the analytically detectable concentration.
Surface coating: the majority of the measurements came from the metalworking/mechanical engineering, woodworking and plastics processing industries. In more than 95% of cases the

123
measurements were in the region of the analytically detectable concentration. Levels above the analytically detectable concentration were measured for the application of phenol-contain-ing materials using compressed-air spray guns and brushes (coatings for the preservation of tanks, drums and floors).
Decanting, weighing, mixing: the majority of the measurements came from the metalwork-ing/mechanical engineering, woodworking and plastics processing industries. 75% of the measurements were in the region of the analytically detectable concentration. Levels above 90% were measured during the mixing of phenol-containing materials (manufacture of abra-sive discs, ceramic compounds, phenolic resins).
Table 50:Phenol – average exposure levels per shift
Company type/Work area Measurements Companies 50% value 90% value 95% value
Number Number mg/m3 mg/m3 mg/m3
Processing of phenolic resins in the woodworking and plastics proces-sing industries– Without local exhaust ventilation– With local exhaust ventilation
329196128
1369156
*)*)*)
1.01.01.0
1.32.01.0
Processing of phenolic resins in foundries– Without local exhaust ventilation– With local exhaust ventilation
26398
158
984765
*)*)*)
2.02.01.1
2.92.03.0
Dryers, box / smelting and harde-ning furnaces– Without local exhaust ventilation– With local exhaust ventilation
934543
452223
*)*)*)
2.01.82.0
3.34.02.0
Mechanical machining processes– Without local exhaust ventilation– With local exhaust ventilation
763635
411823
*)*)*)
1.0*)
0.8
1.00.61.0
Glueing– Without local exhaust ventilation– With local exhaust ventilation
603821
422717
*)*)*)
1.01.0
*)
2.02.03.8
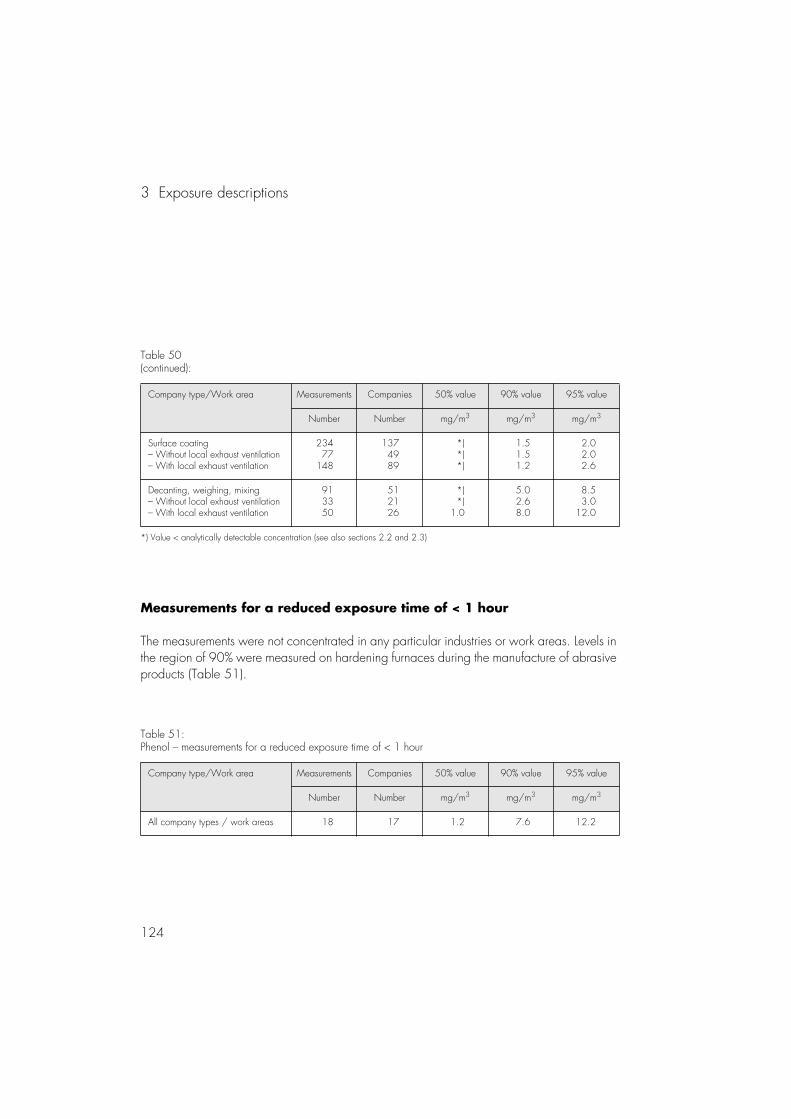
3 Exposure descriptions
124
Measurements for a reduced exposure time of < 1 hour
The measurements were not concentrated in any particular industries or work areas. Levels in the region of 90% were measured on hardening furnaces during the manufacture of abrasive products (Table 51).
Table 50(continued):
Company type/Work area Measurements Companies 50% value 90% value 95% value
Number Number mg/m3 mg/m3 mg/m3
Surface coating– Without local exhaust ventilation– With local exhaust ventilation
23477
148
1374989
*)*)*)
1.51.51.2
2.02.02.6
Decanting, weighing, mixing– Without local exhaust ventilation– With local exhaust ventilation
913350
512126
*)*)
1.0
5.02.68.0
8.53.0
12.0
*) Value < analytically detectable concentration (see also sections 2.2 and 2.3)
Table 51:Phenol – measurements for a reduced exposure time of < 1 hour
Company type/Work area Measurements Companies 50% value 90% value 95% value
Number Number mg/m3 mg/m3 mg/m3
All company types / work areas 18 17 1.2 7.6 12.2
125
3.35 1-Propanol
Identification and limit values
Formula
Molecular weight in g/mol 60.09CAS No. 71-23-8Synonyms propanol, n-propanol, propan-1-ol, propanol-1, propyl
alcohol, n-propyl alcohol, 1-hydroxypropaneGerman limit value no limit valueData collection period 1991 to 1995BGAA exposure description No. 26
Measurement method
A defined volume of air is sucked through an activated charcoal tube using a sampling pump. After elution with diethyl ether, quantitative analysis is carried out by means of gaschromatog-raphy using a flame ionisation detector. The analytically detectable concentration for two hours of sampling is 1.0 mg/m3.
Notes on the results
General
433 measurements from around 170 companies were analysed.
Average exposure levels per shift
Table 52 shows the average exposure levels per shift. The examination of the average expo-sure levels per shift measured for individual company types and work areas produced the results listed below.
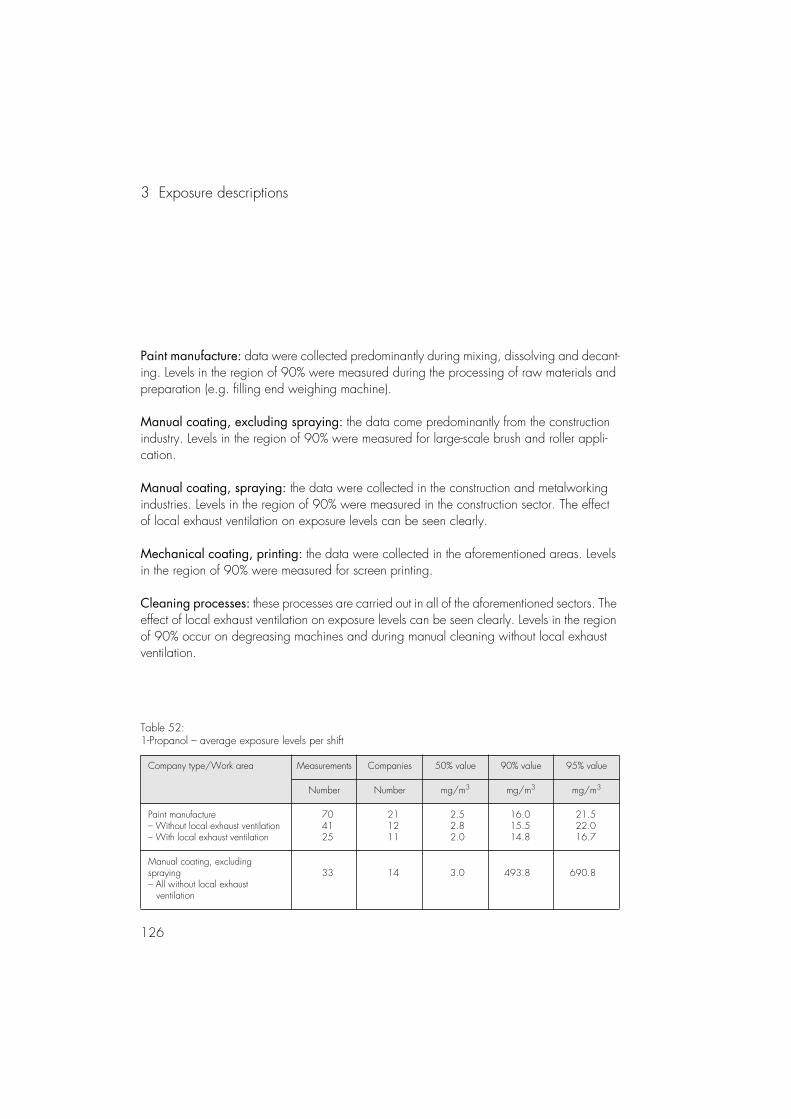
3 Exposure descriptions
126
Paint manufacture: data were collected predominantly during mixing, dissolving and decant-ing. Levels in the region of 90% were measured during the processing of raw materials and preparation (e.g. filling end weighing machine).
Manual coating, excluding spraying: the data come predominantly from the construction industry. Levels in the region of 90% were measured for large-scale brush and roller appli-cation.
Manual coating, spraying: the data were collected in the construction and metalworking industries. Levels in the region of 90% were measured in the construction sector. The effect of local exhaust ventilation on exposure levels can be seen clearly.
Mechanical coating, printing: the data were collected in the aforementioned areas. Levels in the region of 90% were measured for screen printing.
Cleaning processes: these processes are carried out in all of the aforementioned sectors. The effect of local exhaust ventilation on exposure levels can be seen clearly. Levels in the region of 90% occur on degreasing machines and during manual cleaning without local exhaust ventilation.
Table 52:1-Propanol – average exposure levels per shift
Company type/Work area Measurements Companies 50% value 90% value 95% value
Number Number mg/m3 mg/m3 mg/m3
Paint manufacture– Without local exhaust ventilation– With local exhaust ventilation
704125
211211
2.52.82.0
16.015.514.8
21.522.016.7
Manual coating, excluding spraying– All without local exhaust ventilation
33 14 3.0 493.8 690.8
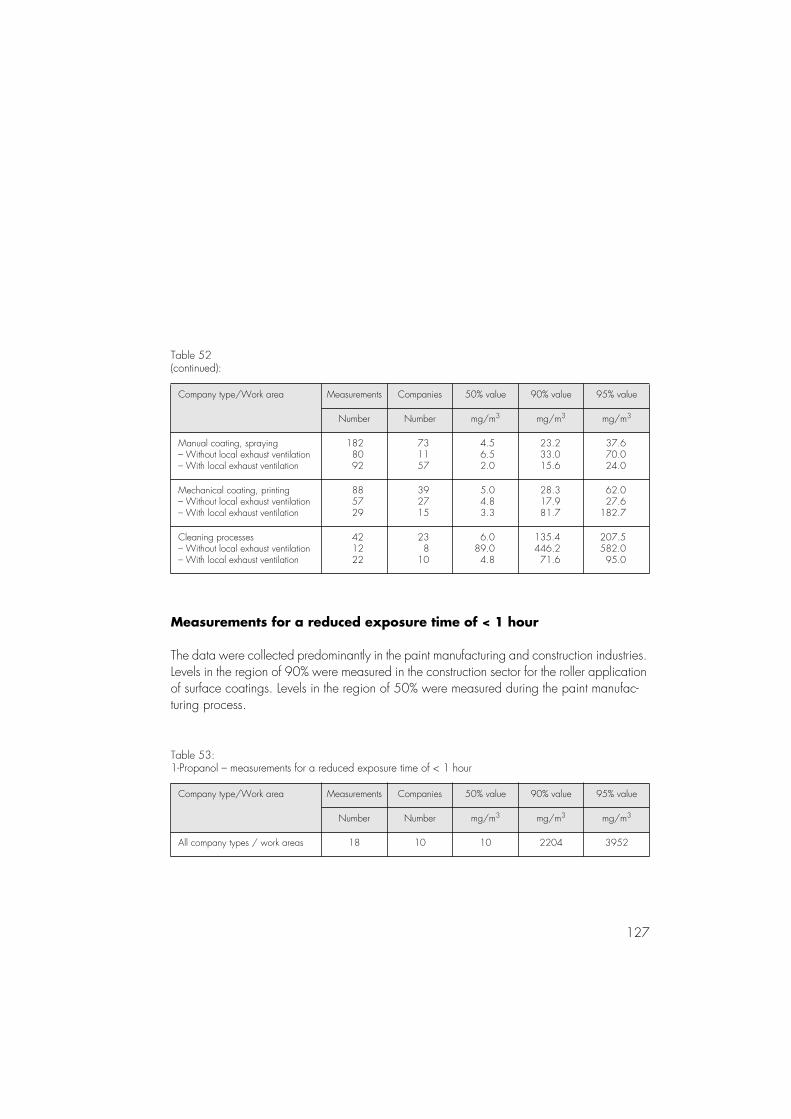
127
Measurements for a reduced exposure time of < 1 hour
The data were collected predominantly in the paint manufacturing and construction industries. Levels in the region of 90% were measured in the construction sector for the roller application of surface coatings. Levels in the region of 50% were measured during the paint manufac-turing process.
Table 52(continued):
Company type/Work area Measurements Companies 50% value 90% value 95% value
Number Number mg/m3 mg/m3 mg/m3
Manual coating, spraying– Without local exhaust ventilation– With local exhaust ventilation
1828092
731157
4.56.52.0
23.233.015.6
37.670.024.0
Mechanical coating, printing– Without local exhaust ventilation– With local exhaust ventilation
885729
392715
5.04.83.3
28.317.981.7
62.027.6
182.7
Cleaning processes– Without local exhaust ventilation– With local exhaust ventilation
421222
238
10
6.089.04.8
135.4446.271.6
207.5582.095.0
Table 53:1-Propanol – measurements for a reduced exposure time of < 1 hour
Company type/Work area Measurements Companies 50% value 90% value 95% value
Number Number mg/m3 mg/m3 mg/m3
All company types / work areas 18 10 10 2204 3952
3 Exposure descriptions
128
3.36 Styrene
Identification and limit values
Formula
Molecular weight in g/mol 104.15CAS No. 100-42-5Synonyms vinyl benzene, ethenylbenzene, phenylethyleneGerman limit value 85 mg/m3, 20 ml/m3 (MAK)Data collection period 1990 to 1995BGAA exposure description No. 10
Measurement method
A defined volume of air is sucked through an activated charcoal tube using a sampling pump. After elution with carbon disulphide, quantitative analysis is carried out by means of gas-chromatography using a flame ionisation detector. The analytically detectable concentration for two hours of sampling is 1.0 mg/m3.
Notes on the results
General
1,522 measurements from around 460 companies were analysed. The measurements come predominantly from the plastics processing industry (58%) and relate mainly to laminating (20%). Only measurements taken using sampling apparatus worn by human subjects were included in the analysis.
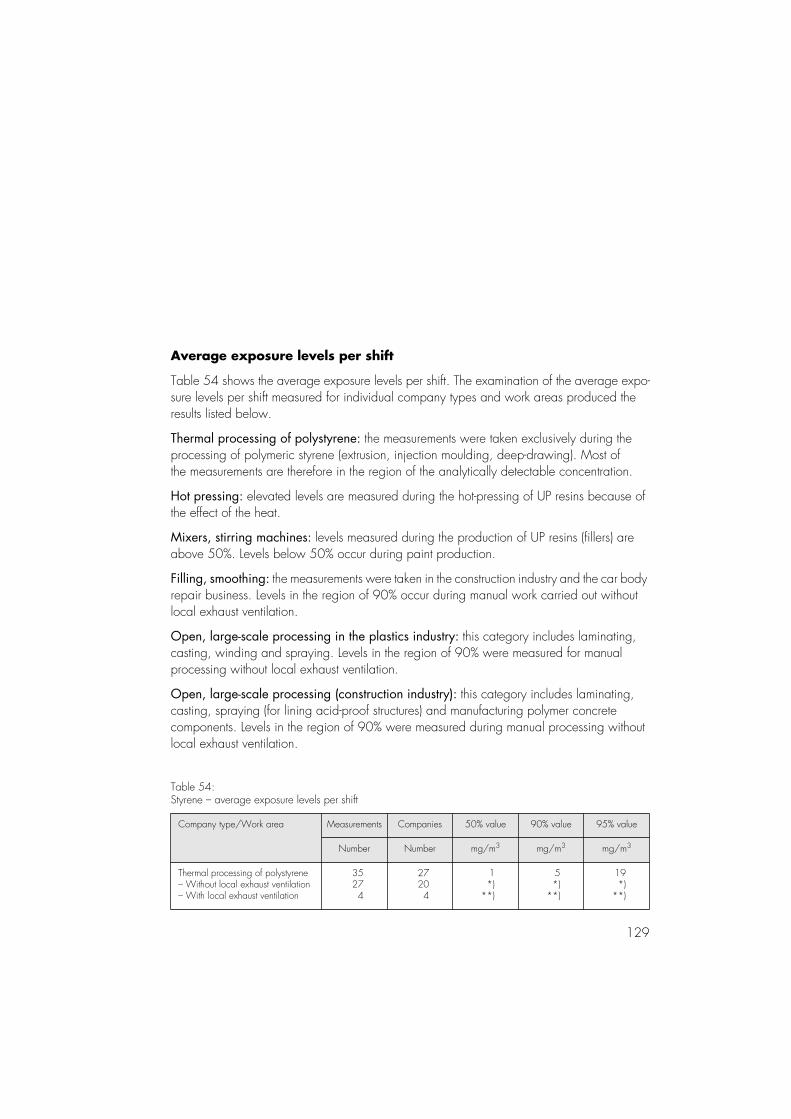
129
Average exposure levels per shift
Table 54 shows the average exposure levels per shift. The examination of the average expo-sure levels per shift measured for individual company types and work areas produced the results listed below.
Thermal processing of polystyrene: the measurements were taken exclusively during the processing of polymeric styrene (extrusion, injection moulding, deep-drawing). Most of the measurements are therefore in the region of the analytically detectable concentration.
Hot pressing: elevated levels are measured during the hot-pressing of UP resins because of the effect of the heat.
Mixers, stirring machines: levels measured during the production of UP resins (fillers) are above 50%. Levels below 50% occur during paint production.
Filling, smoothing: the measurements were taken in the construction industry and the car body repair business. Levels in the region of 90% occur during manual work carried out without local exhaust ventilation.
Open, large-scale processing in the plastics industry: this category includes laminating, casting, winding and spraying. Levels in the region of 90% were measured for manual processing without local exhaust ventilation.
Open, large-scale processing (construction industry): this category includes laminating, casting, spraying (for lining acid-proof structures) and manufacturing polymer concrete components. Levels in the region of 90% were measured during manual processing without local exhaust ventilation.
Table 54:Styrene – average exposure levels per shift
Company type/Work area Measurements Companies 50% value 90% value 95% value
Number Number mg/m3 mg/m3 mg/m3
Thermal processing of polystyrene– Without local exhaust ventilation– With local exhaust ventilation
35274
27204
1*)
**)
5*)
**)
19*)
**)
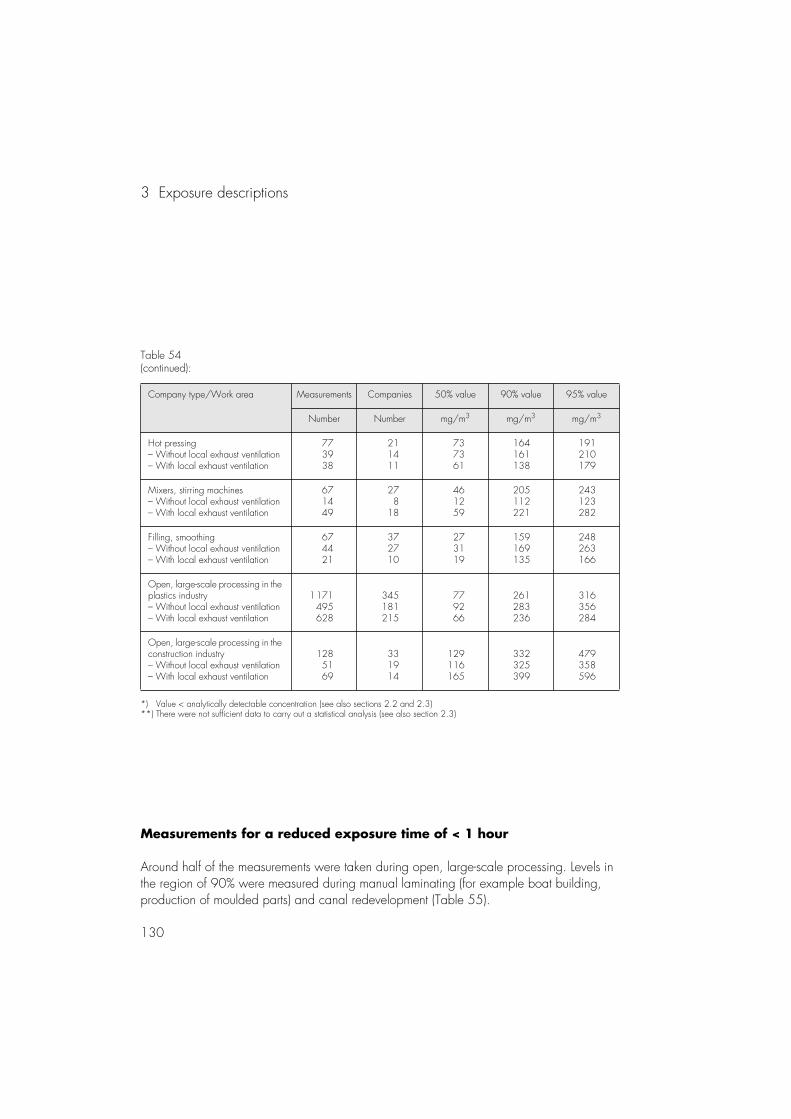
3 Exposure descriptions
130
Measurements for a reduced exposure time of < 1 hour
Around half of the measurements were taken during open, large-scale processing. Levels in the region of 90% were measured during manual laminating (for example boat building, production of moulded parts) and canal redevelopment (Table 55).
Table 54(continued):
Company type/Work area Measurements Companies 50% value 90% value 95% value
Number Number mg/m3 mg/m3 mg/m3
Hot pressing– Without local exhaust ventilation– With local exhaust ventilation
773938
211411
737361
164161138
191210179
Mixers, stirring machines– Without local exhaust ventilation– With local exhaust ventilation
671449
278
18
461259
205112221
243123282
Filling, smoothing– Without local exhaust ventilation– With local exhaust ventilation
674421
372710
273119
159169135
248263166
Open, large-scale processing in the plastics industry– Without local exhaust ventilation– With local exhaust ventilation
1171495628
345181215
779266
261283236
316356284
Open, large-scale processing in the construction industry– Without local exhaust ventilation– With local exhaust ventilation
1285169
331914
129116165
332325399
479358596
*) Value < analytically detectable concentration (see also sections 2.2 and 2.3) **) There were not sufficient data to carry out a statistical analysis (see also section 2.3)
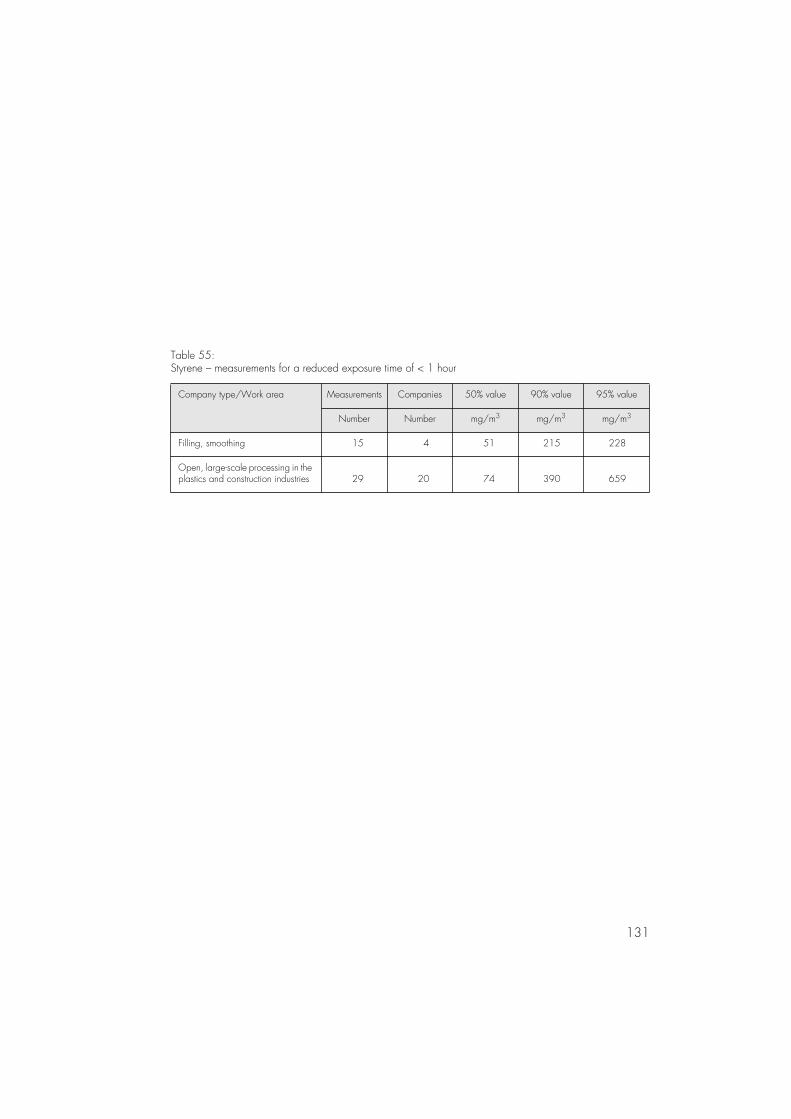
131
Table 55:Styrene – measurements for a reduced exposure time of < 1 hour
Company type/Work area Measurements Companies 50% value 90% value 95% value
Number Number mg/m3 mg/m3 mg/m3
Filling, smoothing 15 4 51 215 228
Open, large-scale processing in the plastics and construction industries 29 20 74 390 659
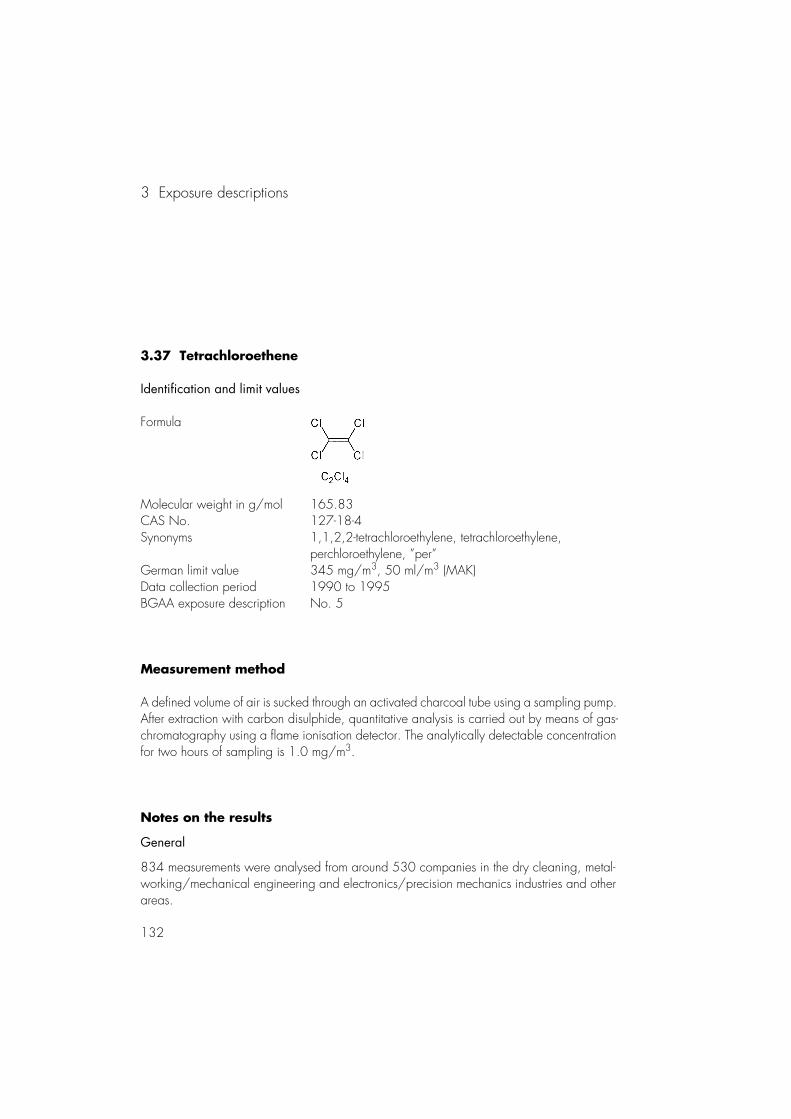
3 Exposure descriptions
132
3.37 Tetrachloroethene
Identification and limit values
Formula
Molecular weight in g/mol 165.83CAS No. 127-18-4Synonyms 1,1,2,2-tetrachloroethylene, tetrachloroethylene,
perchloroethylene, ”per”German limit value 345 mg/m3, 50 ml/m3 (MAK)Data collection period 1990 to 1995BGAA exposure description No. 5
Measurement method
A defined volume of air is sucked through an activated charcoal tube using a sampling pump. After extraction with carbon disulphide, quantitative analysis is carried out by means of gas-chromatography using a flame ionisation detector. The analytically detectable concentration for two hours of sampling is 1.0 mg/m3.
Notes on the results
General
834 measurements were analysed from around 530 companies in the dry cleaning, metal-working/mechanical engineering and electronics/precision mechanics industries and other areas.
133
Average exposure levels per shift
Table 56 shows the average exposure levels per shift. The examination of the average expo-sure levels per shift measured for individual company types and work areas produced the results listed below.
Decanting, distillation: 95% of the measurements were taken in the chemical industry (includ-ing the wholesale trading of chemical products). Levels in the region of 90% were measured for the manual emptying of drums.
Surface coating (laminating, cladding, spraying): the measurements are distributed evenly among the aforementioned industries. Around 90% of the measurements were in the region of the analytically detectable concentration.
Manual surface cleaning: the measurements come from the electrical engineering/precision mechanics and metalworking/mechanical engineering industries. Levels above 50% were measured for the manual cleaning of surfaces without local exhaust ventilation.
Surface cleaning machines: half of the measurements come from the electrical engineering and precision mechanics industries and half from the metalworking and mechanical engineer-ing industries.
Dry cleaning: from 1990 to 1994 measurements were only taken if there were clear signs of elevated exposure levels, for example evidence collected during investigations into occu-pational diseases.
Exposure levels were also measured in Germany’s new federal states. Levels of up to 95% level of the overall data set were recorded during the use of Spezima dry cleaning machines.
Since the last transitional regulations became invalid on 1 January 1995, all dry cleaning machines using tetrachloroethylene as a solvent have had to comply with the requirements of the 2nd Ordinance for the Implementation of the Federal Emissions Control Act (2. Verordnung zur Durchführung des Bundesimmissionsschutzgesetzes [2. BImSchV]) of 10 December 1990. Under these regulations dry cleaning equipment must be monitored continually by means
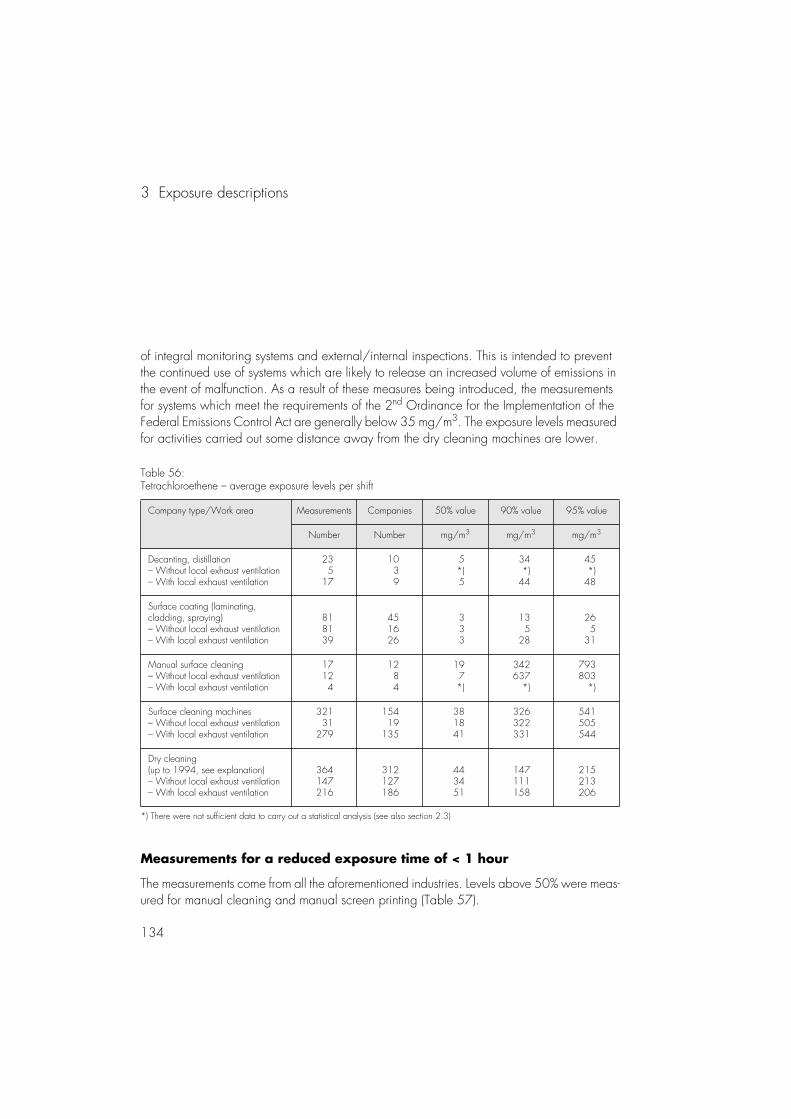
3 Exposure descriptions
134
of integral monitoring systems and external/internal inspections. This is intended to prevent the continued use of systems which are likely to release an increased volume of emissions in the event of malfunction. As a result of these measures being introduced, the measurements for systems which meet the requirements of the 2nd Ordinance for the Implementation of the Federal Emissions Control Act are generally below 35 mg/m3. The exposure levels measured for activities carried out some distance away from the dry cleaning machines are lower.
Table 56:Tetrachloroethene – average exposure levels per shift
Company type/Work area Measurements Companies 50% value 90% value 95% value
Number Number mg/m3 mg/m3 mg/m3
Decanting, distillation– Without local exhaust ventilation– With local exhaust ventilation
235
17
1039
5*)5
34*)
44
45*)
48
Surface coating (laminating, cladding, spraying)– Without local exhaust ventilation– With local exhaust ventilation
818139
451626
333
135
28
265
31
Manual surface cleaning– Without local exhaust ventilation– With local exhaust ventilation
17124
1284
197*)
342637
*)
793803
*)
Surface cleaning machines– Without local exhaust ventilation– With local exhaust ventilation
32131
279
15419
135
381841
326322331
541505544
Dry cleaning(up to 1994, see explanation)– Without local exhaust ventilation– With local exhaust ventilation
364147216
312127186
443451
147111158
215213206
*) There were not sufficient data to carry out a statistical analysis (see also section 2.3)
Measurements for a reduced exposure time of < 1 hour
The measurements come from all the aforementioned industries. Levels above 50% were meas-ured for manual cleaning and manual screen printing (Table 57).
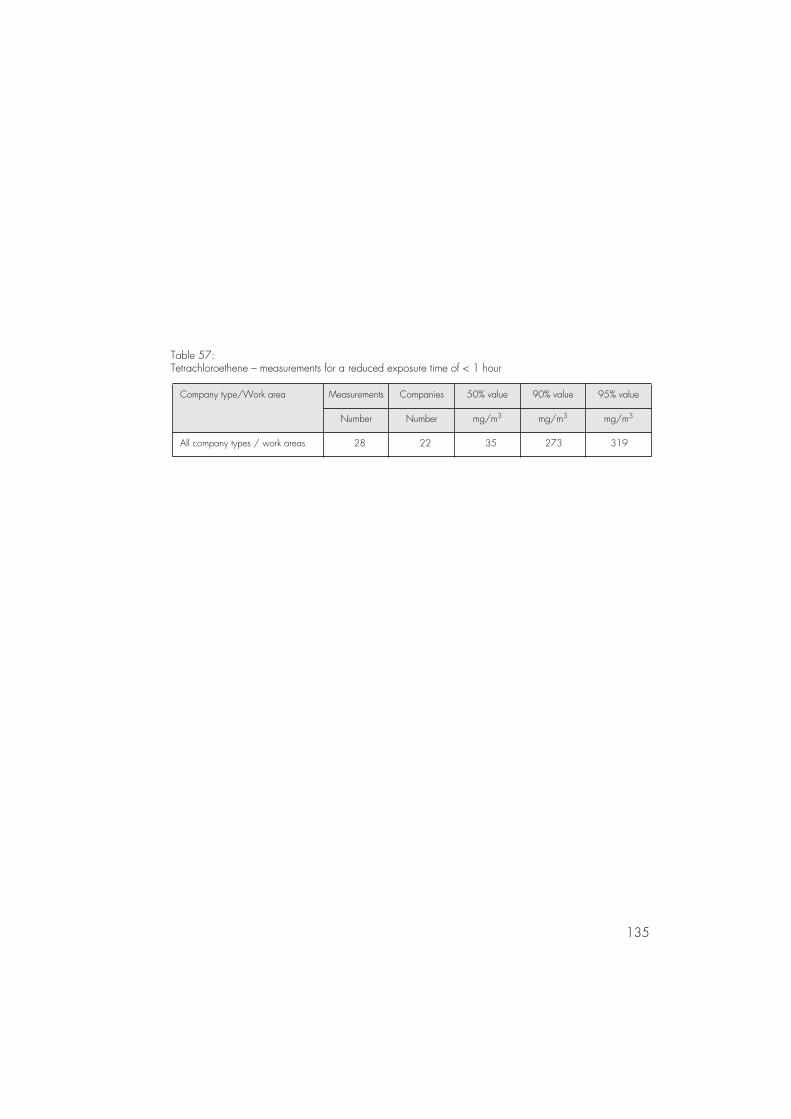
135
Table 57:Tetrachloroethene – measurements for a reduced exposure time of < 1 hour
Company type/Work area Measurements Companies 50% value 90% value 95% value
Number Number mg/m3 mg/m3 mg/m3
All company types / work areas 28 22 35 273 319
3 Exposure descriptions
136
3.38 Tetrahydrofuran
Identification and limit values
Formula
Molecular weight in g/mol 72.10CAS No. 199-99-9Synonyms tetramethylene oxide, oxolane, diethylene monoxide, THFGerman limit value 590 mg/m3, 200 ml/m3 (MAK)Data collection period 1991 to 1996BGAA exposure description No. 39
Measurement method
A defined volume of air is sucked through an activated charcoal tube using a sampling pump. After elution with diethyl ether, quantitative analysis is carried out by means of gaschromatog-raphy using a flame ionisation detector. The analytically detectable concentration for two hours of sampling is 0.1 mg/m3.
Notes on the results
General
357 measurements from approx. 120 companies were included in the analysis.
Average exposure levels per shift
Table 58 shows the average exposure levels per shift. The examination of the average expo-sure levels per shift measured for individual company types and work areas produced the results listed below.
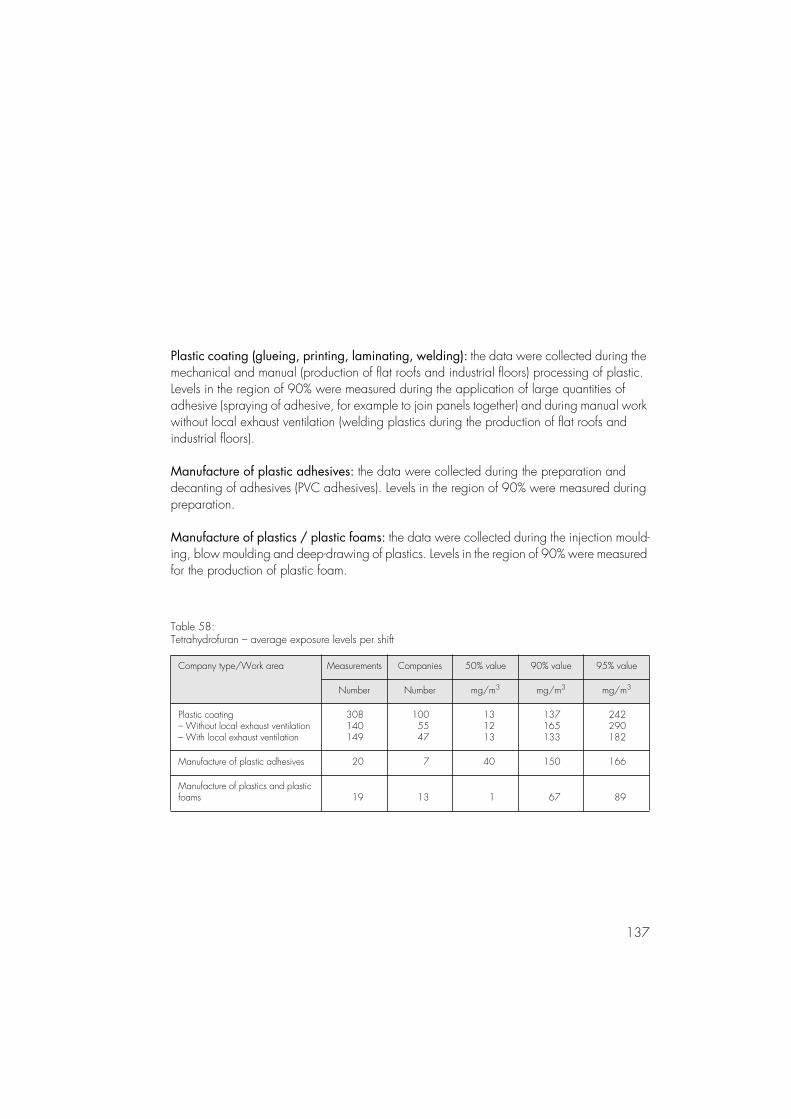
137
Plastic coating (glueing, printing, laminating, welding): the data were collected during the mechanical and manual (production of flat roofs and industrial floors) processing of plastic. Levels in the region of 90% were measured during the application of large quantities of adhesive (spraying of adhesive, for example to join panels together) and during manual work without local exhaust ventilation (welding plastics during the production of flat roofs and industrial floors).
Manufacture of plastic adhesives: the data were collected during the preparation and decanting of adhesives (PVC adhesives). Levels in the region of 90% were measured during preparation.
Manufacture of plastics / plastic foams: the data were collected during the injection mould-ing, blow moulding and deep-drawing of plastics. Levels in the region of 90% were measured for the production of plastic foam.
Table 58:Tetrahydrofuran – average exposure levels per shift
Company type/Work area Measurements Companies 50% value 90% value 95% value
Number Number mg/m3 mg/m3 mg/m3
Plastic coating– Without local exhaust ventilation– With local exhaust ventilation
308140149
1005547
131213
137165133
242290182
Manufacture of plastic adhesives 20 7 40 150 166
Manufacture of plastics and plastic foams 19 13 1 67 89
3 Exposure descriptions
138
3.39 Toluene
Identification and limit values
Formula
Molecular weight in g/mol 92.14CAS No. 108-88-3Synonyms methylbenzene, phenyl methaneGerman limit value 190 mg/m3, 50 ml/m3 (MAK)Data collection period 1991 to 1995BGAA exposure description No. 40
Measurement method
A defined volume of air is sucked through an activated charcoal tube using a sampling pump. After elution with diethyl ether, quantitative analysis is carried out by means of gaschromatog-raphy using a flame ionisation detector. The analytically detectable concentration for two hours of sampling is 0.3 mg/m3.
Notes on the results
General
7,782 measurements from around 2,200 companies were included in the analysis.
Average exposure levels per shift
Table 59 shows the average exposure levels per shift. The examination of the average expo-sure levels per shift measured for individual company types and work areas produced theresults listed below.
139
Manufacture of preparations: the data were collected on dissolvers, bead mills and decant-ing equipment. Levels in the region of 90% were measured during mixing and decanting.
Cleaning, degreasing (mechanical): the data were collected predominantly in the metal-working and chemical industries. Levels in the region of 90% were measured on container cleaning machines.
Cleaning, degreasing (manual): the data were collected predominantly in the metalworking, woodworking and chemical industries. Levels in the region of 90% were measured during the cleaning of machines (for example in paint manufacturing plants).
Glueing (plastic / rubber processing): levels in the region of 90% were measured during the spraying of adhesives.
Glueing (woodworking): levels in the region of 90% were measured during the large-scale glueing.
Glueing (manufacture of upholstered furniture): levels in the region of 90% were measured during the spraying of adhesives.
Glueing (leatherwork / shoe manufacture): the focus was on workplaces thought to be in need of attention. Levels in the region of 90% and 95% were measured during the manual glueing in slipper factories. The highest levels were measured in a factory where parts which had been coated with adhesive were left to dry in the work area itself (the weather was cold so the doors and windows were closed).
In recent years formulas have changed and the toluene content of most adhesives has been reduced appreciably.
Glueing, floor laying (wood, textiles, plastics): levels in the region of 90% were measured during glueing with spreaders in rooms without ventilation, particularly at the start of the data collection period. An appreciable decrease in exposure levels was recorded towards the end of the data collection period after formulas were changed.
Painting (brush, roller, spreader application) (metalworking, electrical engineering): levels in the region of 90% were measured for painting without local exhaust ventilation.
3 Exposure descriptions
140
Painting (brush, roller, spreader application) (construction industry): the data were col-lected during the painting of walls, windows and domestic installations. Levels in the region of 90% were measured, for example, during the painting of metal.
Hand painting (porcelain manufacture): no local exhaust ventilation was used in the work-places examined.
Spray painting (metalworking, electrical engineering): the data were collected predomi-nantly on dry-type and waterwash spraybooths.
Spray painting (woodworking): the data were collected predominantly on dry-type and waterwash spraybooths. The measurements for areas where no local exhaust ventilation is used were taken in airing and drying areas of painting facilities.
Spray painting (construction industry): the data were collected during corrosion protection work. Levels in the region of 90% were measured during high-pressure spraying.
Mechanical surface coating (plastics / rubber industries): the measurements were taken on flexographic, pad and screen printing machines. Levels in the region of 90% were measured during the application of rubber coatings (e.g. mats, seals).
Mechanical surface coating (metalworking, electrical engineering): the measurements were taken on flexographic, pad and screen printing machines, cast-coating machines and painting lines. Levels in the region of 90% were measured on pad printing machines.
Mechanical surface coating (woodworking): the measurements for areas without localexhaust ventilation were taken predominantly on (paint) cast-coating machines, where extrac-tors cannot generally be used for technical reasons (the film of paint starts to come away if there is strong air movement). The measurements for areas with local exhaust ventilation were taken on operators/supervisors of spray robots on painting lines. These facilities are generally enclosed.
Screen printing, manual (construction industry): levels in the region of 90% were measured during manual screen printing (for example sign painters).
Screen printing, manual (ceramics, glass and printing industries): levels in the region of 90% were measured during the processing of porcelain.
Gravure illustration printing: the data were collected for monocausal exposure to toluene during gravure illustration printing. Levels in the region of 90% were measured for cleaning work.
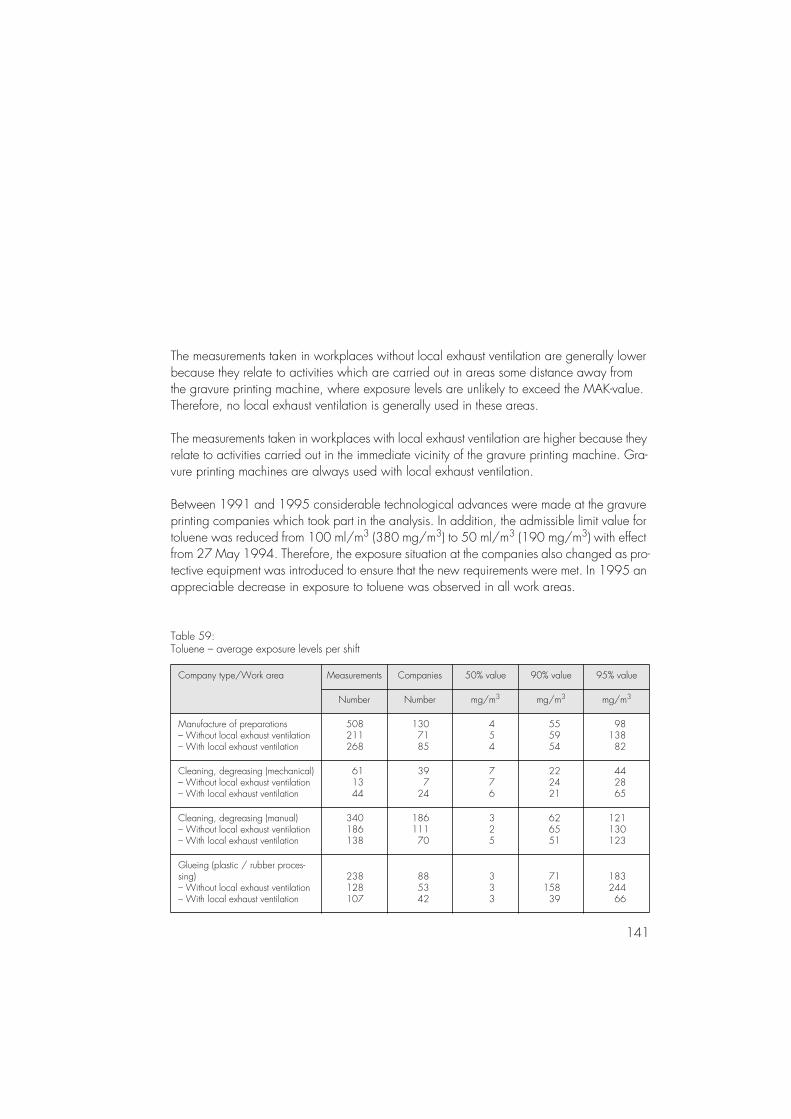
141
The measurements taken in workplaces without local exhaust ventilation are generally lower because they relate to activities which are carried out in areas some distance away from the gravure printing machine, where exposure levels are unlikely to exceed the MAK-value. Therefore, no local exhaust ventilation is generally used in these areas.
The measurements taken in workplaces with local exhaust ventilation are higher because they relate to activities carried out in the immediate vicinity of the gravure printing machine. Gra-vure printing machines are always used with local exhaust ventilation.
Between 1991 and 1995 considerable technological advances were made at the gravure printing companies which took part in the analysis. In addition, the admissible limit value for toluene was reduced from 100 ml/m3 (380 mg/m3) to 50 ml/m3 (190 mg/m3) with effect from 27 May 1994. Therefore, the exposure situation at the companies also changed as pro-tective equipment was introduced to ensure that the new requirements were met. In 1995 an appreciable decrease in exposure to toluene was observed in all work areas.
Table 59:Toluene – average exposure levels per shift
Company type/Work area Measurements Companies 50% value 90% value 95% value
Number Number mg/m3 mg/m3 mg/m3
Manufacture of preparations– Without local exhaust ventilation– With local exhaust ventilation
508211268
1307185
454
555954
9813882
Cleaning, degreasing (mechanical)– Without local exhaust ventilation– With local exhaust ventilation
611344
397
24
776
222421
442865
Cleaning, degreasing (manual)– Without local exhaust ventilation– With local exhaust ventilation
340186138
18611170
325
626551
121130123
Glueing (plastic / rubber proces-sing)– Without local exhaust ventilation– With local exhaust ventilation
238128107
885342
333
7115839
18324466
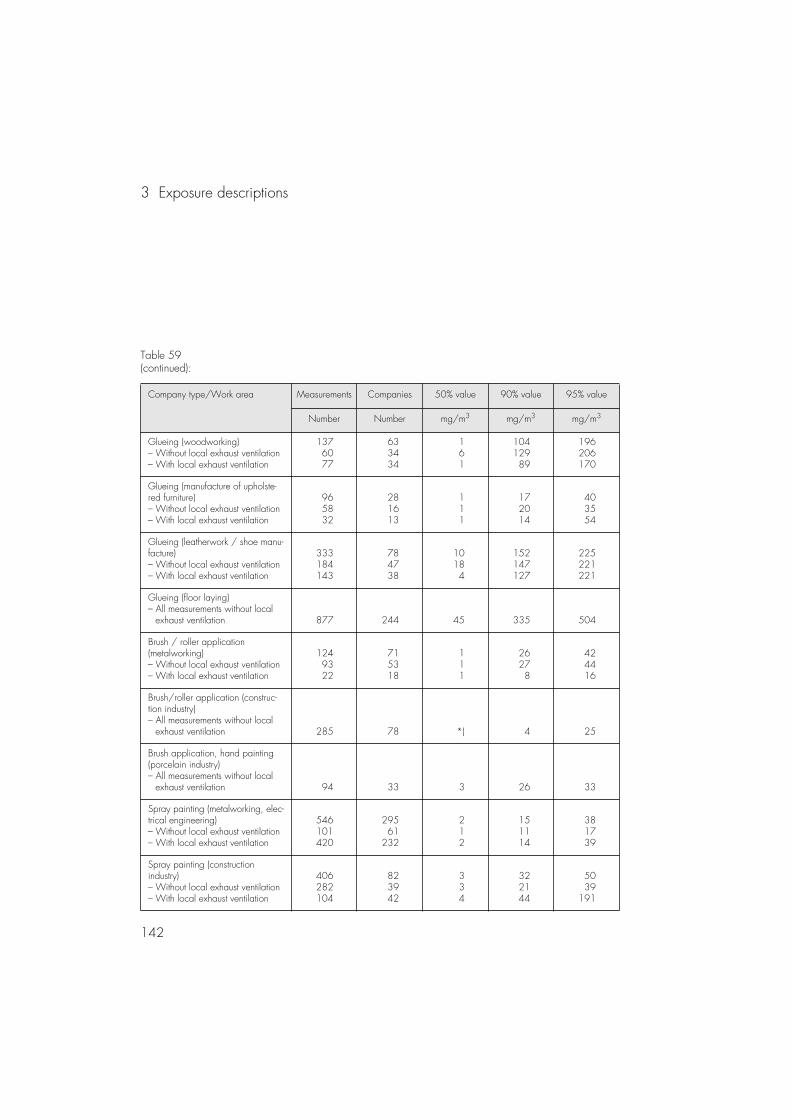
3 Exposure descriptions
142
Table 59 (continued):
Company type/Work area Measurements Companies 50% value 90% value 95% value
Number Number mg/m3 mg/m3 mg/m3
Glueing (woodworking)– Without local exhaust ventilation– With local exhaust ventilation
1376077
633434
161
10412989
196206170
Glueing (manufacture of upholste-red furniture)– Without local exhaust ventilation– With local exhaust ventilation
965832
281613
111
172014
403554
Glueing (leatherwork / shoe manu-facture)– Without local exhaust ventilation– With local exhaust ventilation
333184143
784738
10184
152147127
225221221
Glueing (floor laying)– All measurements without local exhaust ventilation 877 244 45 335 504
Brush / roller application (metalworking)– Without local exhaust ventilation– With local exhaust ventilation
1249322
715318
111
26278
424416
Brush/roller application (construc-tion industry)– All measurements without local exhaust ventilation 285 78 *) 4 25
Brush application, hand painting (porcelain industry)– All measurements without local exhaust ventilation 94 33 3 26 33
Spray painting (metalworking, elec-trical engineering)– Without local exhaust ventilation– With local exhaust ventilation
546101420
29561
232
212
151114
381739
Spray painting (construction industry)– Without local exhaust ventilation– With local exhaust ventilation
406282104
823942
334
322144
5039
191
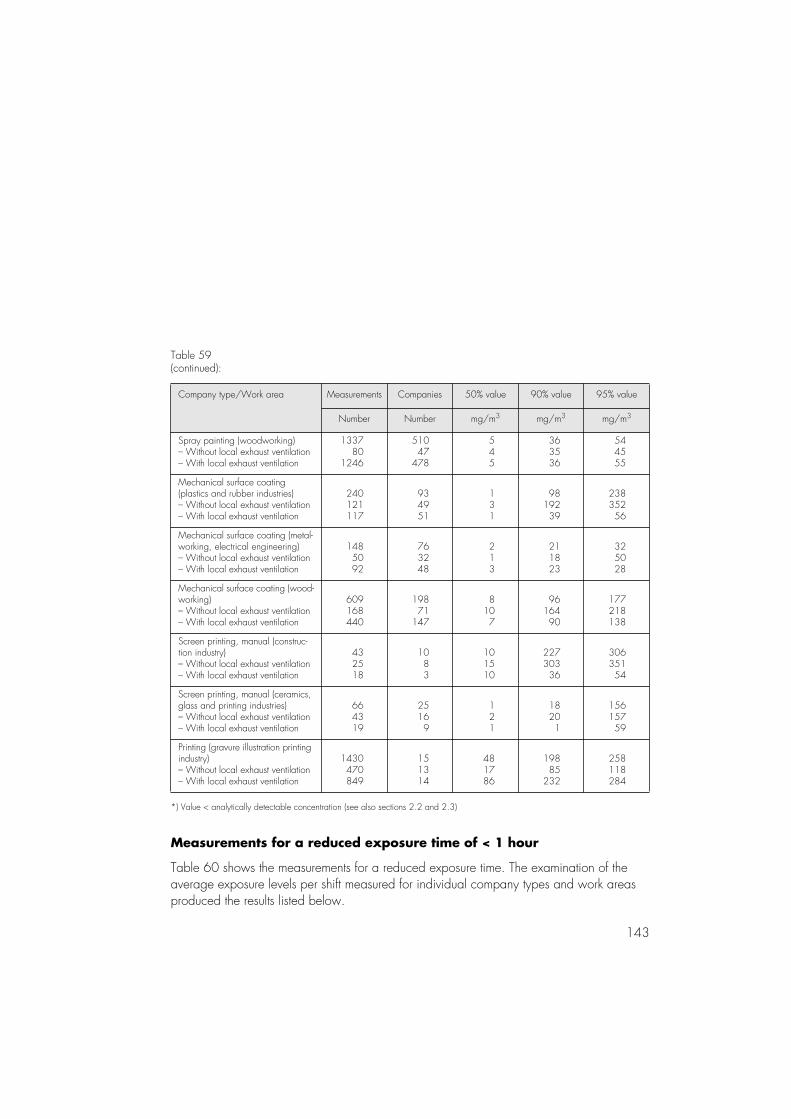
143
Table 59(continued):
Company type/Work area Measurements Companies 50% value 90% value 95% value
Number Number mg/m3 mg/m3 mg/m3
Spray painting (woodworking)– Without local exhaust ventilation– With local exhaust ventilation
133780
1246
51047
478
545
363536
544555
Mechanical surface coating (plastics and rubber industries)– Without local exhaust ventilation– With local exhaust ventilation
240121117
934951
131
9819239
23835256
Mechanical surface coating (metal-working, electrical engineering)– Without local exhaust ventilation– With local exhaust ventilation
1485092
763248
213
211823
325028
Mechanical surface coating (wood-working)– Without local exhaust ventilation– With local exhaust ventilation
609168440
19871
147
8107
9616490
177218138
Screen printing, manual (construc-tion industry)– Without local exhaust ventilation– With local exhaust ventilation
432518
1083
101510
22730336
30635154
Screen printing, manual (ceramics, glass and printing industries)– Without local exhaust ventilation– With local exhaust ventilation
664319
25169
121
18201
15615759
Printing (gravure illustration printing industry)– Without local exhaust ventilation– With local exhaust ventilation
1430470849
151314
481786
19885
232
258118284
*) Value < analytically detectable concentration (see also sections 2.2 and 2.3)
Measurements for a reduced exposure time of < 1 hour
Table 60 shows the measurements for a reduced exposure time. The examination of the average exposure levels per shift measured for individual company types and work areas produced the results listed below.
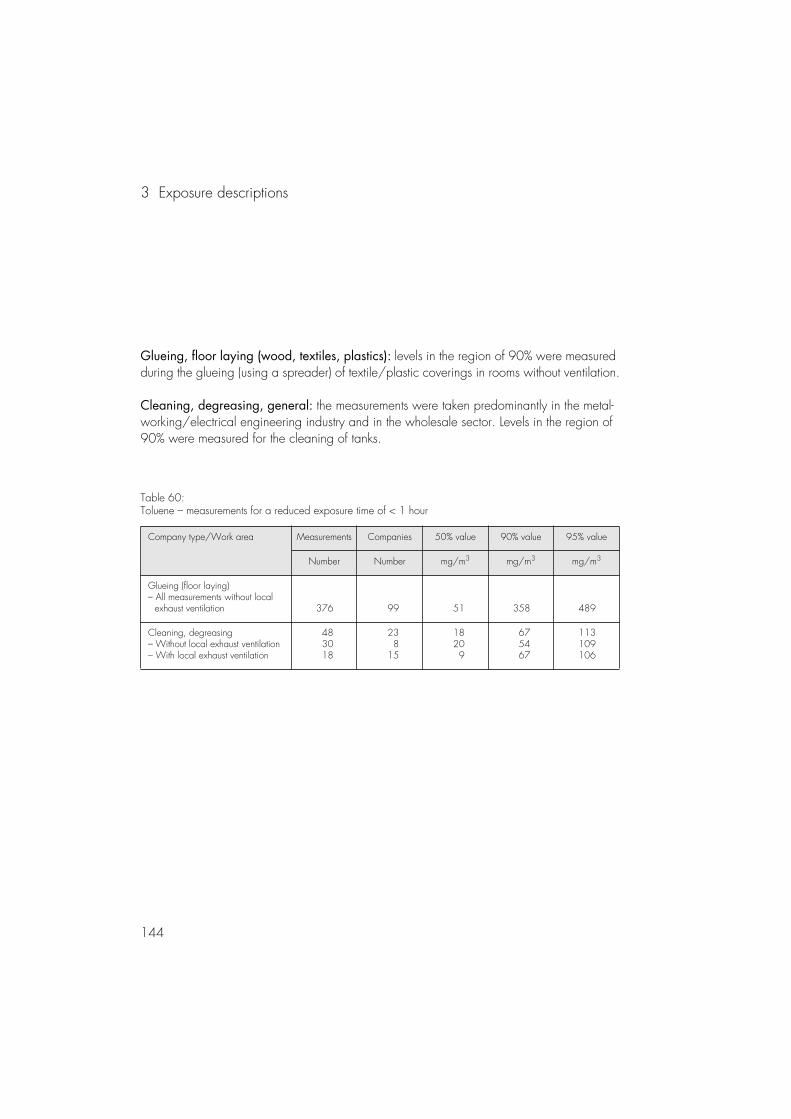
3 Exposure descriptions
144
Glueing, floor laying (wood, textiles, plastics): levels in the region of 90% were measured during the glueing (using a spreader) of textile/plastic coverings in rooms without ventilation.
Cleaning, degreasing, general: the measurements were taken predominantly in the metal-working/electrical engineering industry and in the wholesale sector. Levels in the region of 90% were measured for the cleaning of tanks.
Table 60:Toluene – measurements for a reduced exposure time of < 1 hour
Company type/Work area Measurements Companies 50% value 90% value 95% value
Number Number mg/m3 mg/m3 mg/m3
Glueing (floor laying)– All measurements without local exhaust ventilation 376 99 51 358 489
Cleaning, degreasing– Without local exhaust ventilation– With local exhaust ventilation
483018
238
15
18209
675467
113109106
145
3.40 Trichloroethene
Identification and limit values
Formula
Molecular weight in g/mol 131.38CAS No. 79-01-6Synonyms 1,1,2-trichloroethylene, ethylene trichloride, ”tri”German limit value 270 mg/m3, 50 ml/m3 (MAK)Data collection period 1990 to 1995BGAA exposure description No. 3
Measurement method
A defined volume of air is sucked through an activated charcoal tube using a sampling pump. After extraction with carbon disulphide, quantitative analysis is carried out by means of gas-chromatography using a flame ionisation detector. The analytically detectable concentration for two hours of sampling is 0.1 mg/m3.
Notes on the results
General
407 measurements were analysed from around 190 companies in the dry cleaning, metal-working/mechanical engineering and electronics/precision mechanics industries and other areas.
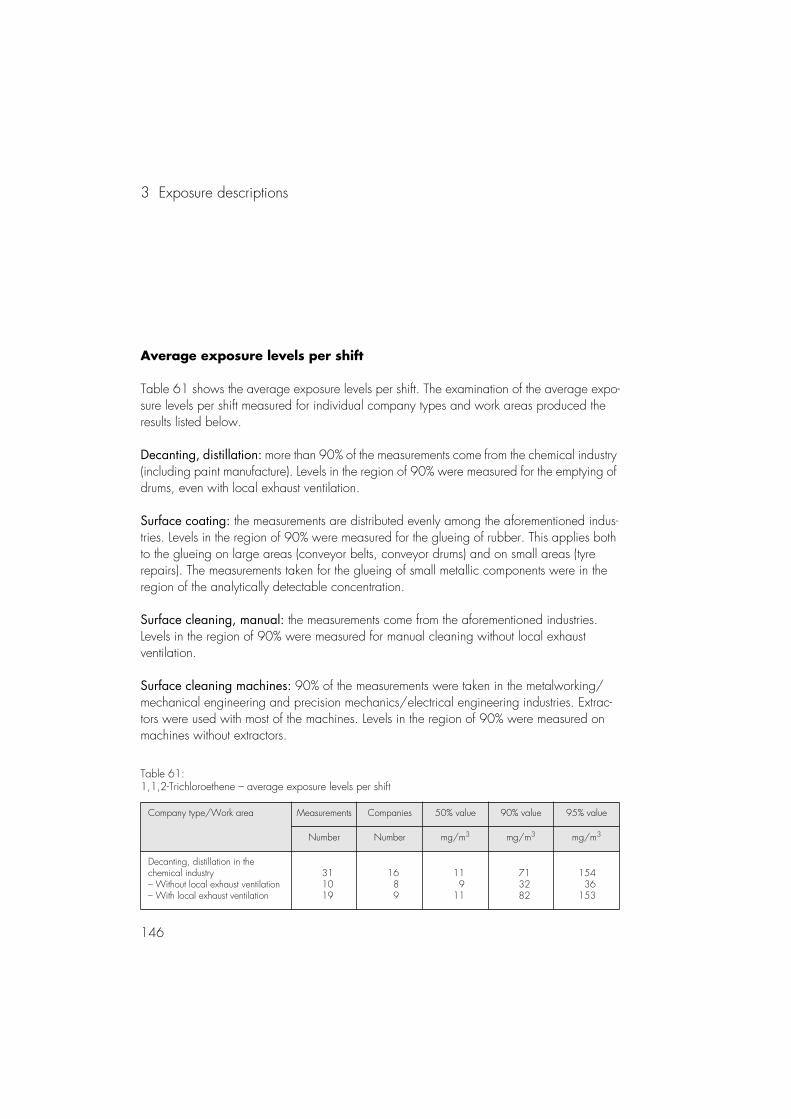
3 Exposure descriptions
146
Average exposure levels per shift
Table 61 shows the average exposure levels per shift. The examination of the average expo-sure levels per shift measured for individual company types and work areas produced the results listed below.
Decanting, distillation: more than 90% of the measurements come from the chemical industry (including paint manufacture). Levels in the region of 90% were measured for the emptying of drums, even with local exhaust ventilation.
Surface coating: the measurements are distributed evenly among the aforementioned indus-tries. Levels in the region of 90% were measured for the glueing of rubber. This applies both to the glueing on large areas (conveyor belts, conveyor drums) and on small areas (tyrerepairs). The measurements taken for the glueing of small metallic components were in the region of the analytically detectable concentration.
Surface cleaning, manual: the measurements come from the aforementioned industries. Levels in the region of 90% were measured for manual cleaning without local exhaustventilation.
Surface cleaning machines: 90% of the measurements were taken in the metalworking/mechanical engineering and precision mechanics/electrical engineering industries. Extrac-tors were used with most of the machines. Levels in the region of 90% were measured on machines without extractors.
Table 61:1,1,2-Trichloroethene – average exposure levels per shift
Company type/Work area Measurements Companies 50% value 90% value 95% value
Number Number mg/m3 mg/m3 mg/m3
Decanting, distillation in the chemical industry– Without local exhaust ventilation– With local exhaust ventilation
311019
1689
119
11
713282
15436
153
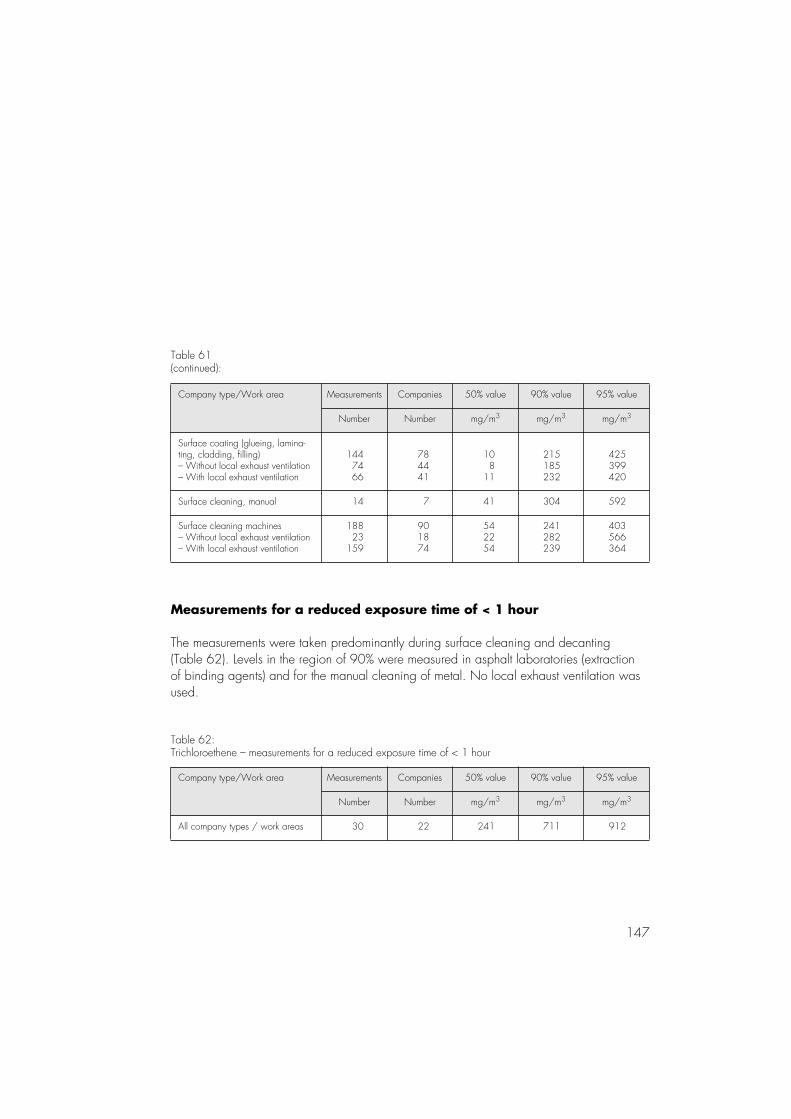
147
Measurements for a reduced exposure time of < 1 hour
The measurements were taken predominantly during surface cleaning and decanting (Table 62). Levels in the region of 90% were measured in asphalt laboratories (extraction of binding agents) and for the manual cleaning of metal. No local exhaust ventilation was used.
Table 61(continued):
Company type/Work area Measurements Companies 50% value 90% value 95% value
Number Number mg/m3 mg/m3 mg/m3
Surface coating (glueing, lamina-ting, cladding, filling)– Without local exhaust ventilation– With local exhaust ventilation
1447466
784441
108
11
215185232
425399420
Surface cleaning, manual 14 7 41 304 592
Surface cleaning machines– Without local exhaust ventilation– With local exhaust ventilation
18823
159
901874
542254
241282239
403566364
Table 62:Trichloroethene – measurements for a reduced exposure time of < 1 hour
Company type/Work area Measurements Companies 50% value 90% value 95% value
Number Number mg/m3 mg/m3 mg/m3
All company types / work areas 30 22 241 711 912
3 Exposure descriptions
148
3.41 Trichloromethane
Identification and limit values
Formula CHCl3Molecular weight in g/mol 117.38CAS No. 67-66-3Synonyms chloroformGerman limit value 50 mg/m3, 10 ml/m3 (MAK)Data collection period 1991 to 1995BGAA exposure description No. 33
Measurement method
A defined volume of air is sucked through an activated charcoal tube using a sampling pump. After extraction with carbon disulphide, quantitative analysis is carried out by means of gaschromatography using a flame ionisation detector. The analytically detectable concen-tration for two hours of sampling is 0.1 mg/m3.
Notes on the results
Laboratories: the data were collected in the chemical industry and in research and analytical institutes (Table 63). Local exhaust ventilation was used in all workplaces. Laboratories are generally fitted with fume cupboards, whose effectiveness (i.e. ability to extract harmful sub-stances from the air) depends mainly on whether there is a sufficiently strong flow of exhaust air, whether work is carried out inside the fume cupboard keeping the sliding front panel closed whenever possible and whether the fume cupboard is used correctly so as to keep it functioning effectively. The measurements depend on the substance being extracted, the size and quantity of the air extraction systems used and the effectiveness of the protective equip-ment used. Exposure can also be expected when extracts are shaken out and dried. Exposure
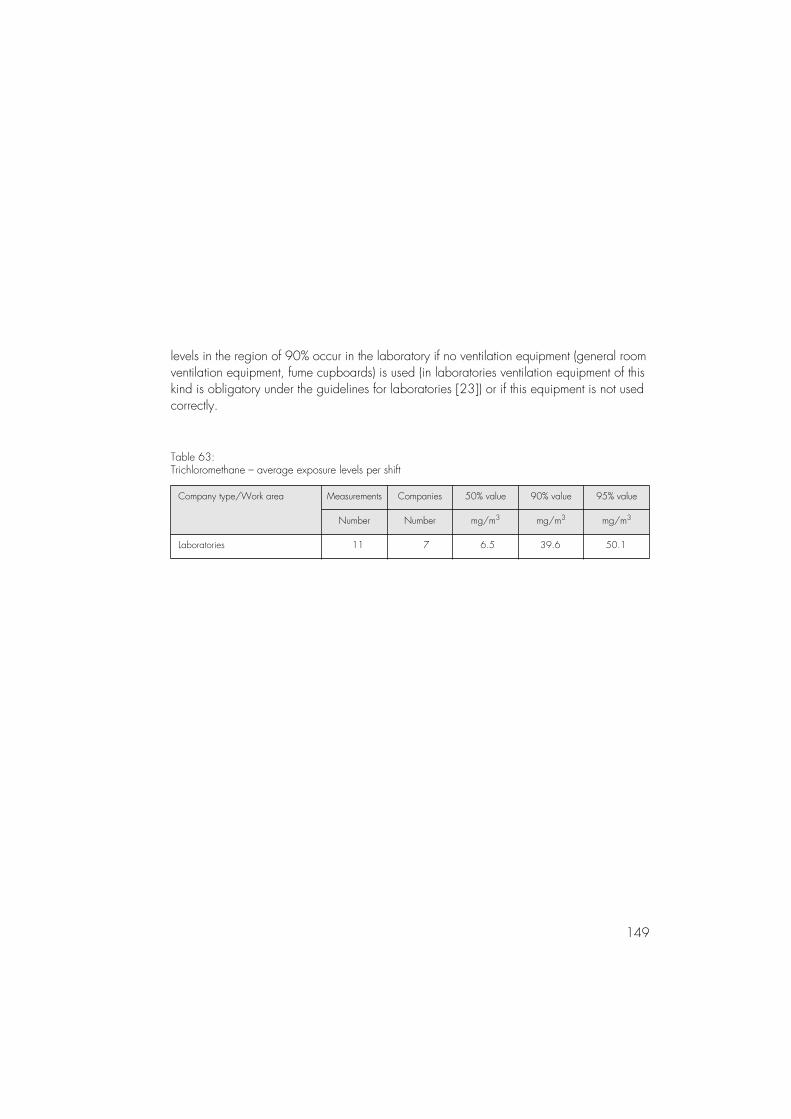
149
levels in the region of 90% occur in the laboratory if no ventilation equipment (general room ventilation equipment, fume cupboards) is used (in laboratories ventilation equipment of this kind is obligatory under the guidelines for laboratories [23]) or if this equipment is not used correctly.
Table 63:Trichloromethane – average exposure levels per shift
Company type/Work area Measurements Companies 50% value 90% value 95% value
Number Number mg/m3 mg/m3 mg/m3
Laboratories 11 7 6.5 39.6 50.1
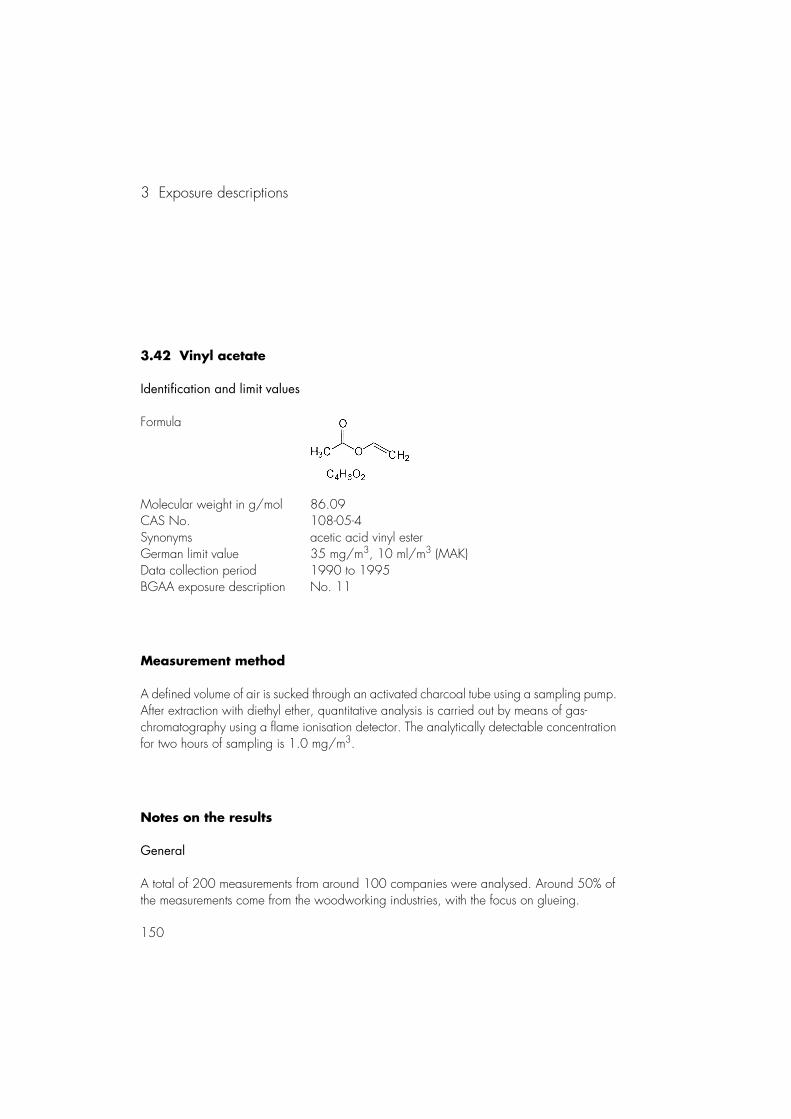
3 Exposure descriptions
150
3.42 Vinyl acetate
Identification and limit values
Formula
Molecular weight in g/mol 86.09CAS No. 108-05-4Synonyms acetic acid vinyl esterGerman limit value 35 mg/m3, 10 ml/m3 (MAK)Data collection period 1990 to 1995BGAA exposure description No. 11
Measurement method
A defined volume of air is sucked through an activated charcoal tube using a sampling pump. After extraction with diethyl ether, quantitative analysis is carried out by means of gas- chromatography using a flame ionisation detector. The analytically detectable concentration for two hours of sampling is 1.0 mg/m3.
Notes on the results
General
A total of 200 measurements from around 100 companies were analysed. Around 50% of the measurements come from the woodworking industries, with the focus on glueing.
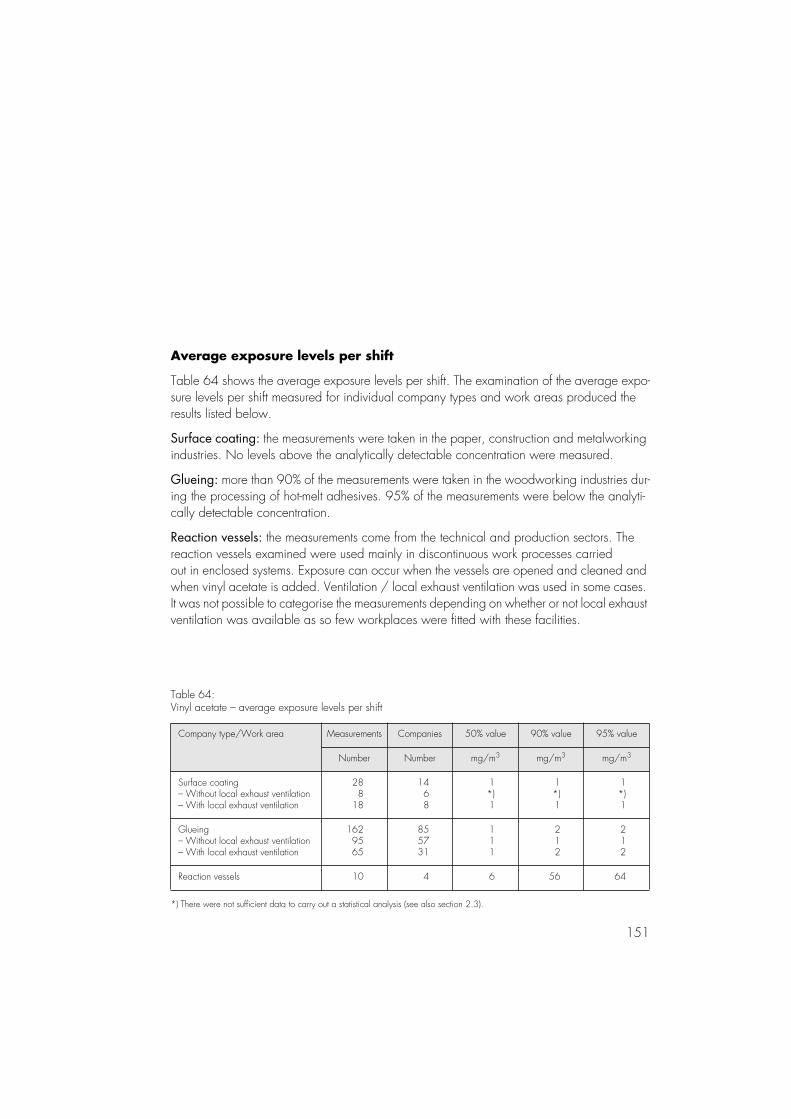
151
Average exposure levels per shift
Table 64 shows the average exposure levels per shift. The examination of the average expo-sure levels per shift measured for individual company types and work areas produced the results listed below.
Surface coating: the measurements were taken in the paper, construction and metalworking industries. No levels above the analytically detectable concentration were measured.
Glueing: more than 90% of the measurements were taken in the woodworking industries dur-ing the processing of hot-melt adhesives. 95% of the measurements were below the analyti-cally detectable concentration.
Reaction vessels: the measurements come from the technical and production sectors. The reaction vessels examined were used mainly in discontinuous work processes carried out in enclosed systems. Exposure can occur when the vessels are opened and cleaned and when vinyl acetate is added. Ventilation / local exhaust ventilation was used in some cases. It was not possible to categorise the measurements depending on whether or not local exhaust ventilation was available as so few workplaces were fitted with these facilities.
Table 64:Vinyl acetate – average exposure levels per shift
Company type/Work area Measurements Companies 50% value 90% value 95% value
Number Number mg/m3 mg/m3 mg/m3
Surface coating– Without local exhaust ventilation– With local exhaust ventilation
288
18
1468
1*)1
1*)1
1*)1
Glueing– Without local exhaust ventilation– With local exhaust ventilation
1629565
855731
111
212
212
Reaction vessels 10 4 6 56 64
*) There were not sufficient data to carry out a statistical analysis (see also section 2.3).
3 Exposure descriptions
152
3.43 Hydrogen peroxide
Identification and limit values
Formula H2O2Molecular weight in g/mol 34.01CAS No. 7722-81-1Synonyms perhydrol, ”hydrogen superoxide”German limit value 1.4 mg/m3, 1.0 ml/m3 (MAK)Data collection period 1991 to 1995BGAA exposure description No. 31
Measurement method
A defined volume of air is sucked through a tube (liquid matrix saturated with potassium titanium oxalate solution) using a sampling pump. Quantitative analysis is carried out photometrically. The analytically detectable concentration for two hours of sampling is 0.01 mg/m3.
Notes on the results
General
92 measurements from 12 companies were included in the analysis.
Average exposure levels per shift
Table 65 shows the average exposure levels per shift. The examination of the average expo-sure levels per shift measured for individual company types and work areas produced theresults listed below.
Hairdressing profession: 37 out of 39 measurements were taken while hairdressers bleached their customers’ hair at one of the BIA’s test facilities, which is fitted out like a hair-dressing salon. The test facility is equipped with a ventilation system. The product used on customers was prepared prior to treatment by mixing a bleaching agent (powder or granules)
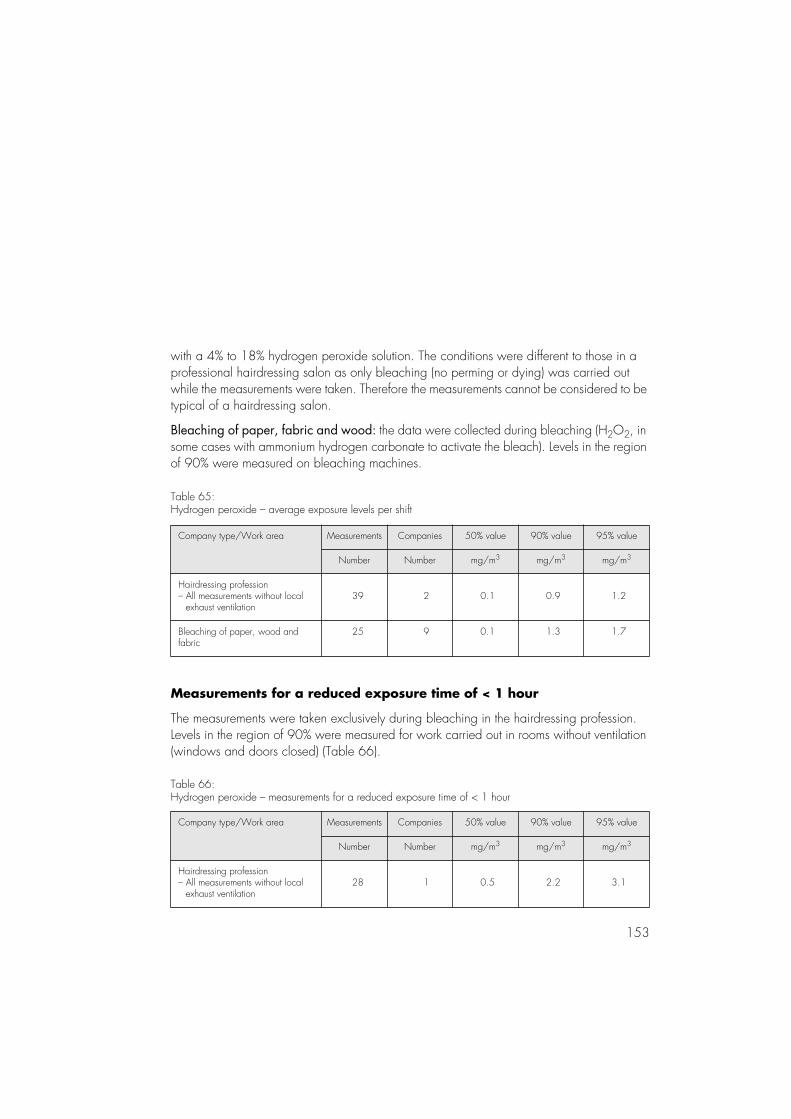
153
with a 4% to 18% hydrogen peroxide solution. The conditions were different to those in a professional hairdressing salon as only bleaching (no perming or dying) was carried out while the measurements were taken. Therefore the measurements cannot be considered to be typical of a hairdressing salon.
Bleaching of paper, fabric and wood: the data were collected during bleaching (H2O2, in some cases with ammonium hydrogen carbonate to activate the bleach). Levels in the region of 90% were measured on bleaching machines.
Table 65:Hydrogen peroxide – average exposure levels per shift
Company type/Work area Measurements Companies 50% value 90% value 95% value
Number Number mg/m3 mg/m3 mg/m3
Hairdressing profession– All measurements without local exhaust ventilation
39 2 0.1 0.9 1.2
Bleaching of paper, wood andfabric
25 9 0.1 1.3 1.7
Measurements for a reduced exposure time of < 1 hour
The measurements were taken exclusively during bleaching in the hairdressing profession. Levels in the region of 90% were measured for work carried out in rooms without ventilation (windows and doors closed) (Table 66).
Table 66:Hydrogen peroxide – measurements for a reduced exposure time of < 1 hour
Company type/Work area Measurements Companies 50% value 90% value 95% value
Number Number mg/m3 mg/m3 mg/m3
Hairdressing profession– All measurements without local exhaust ventilation
28 1 0.5 2.2 3.1
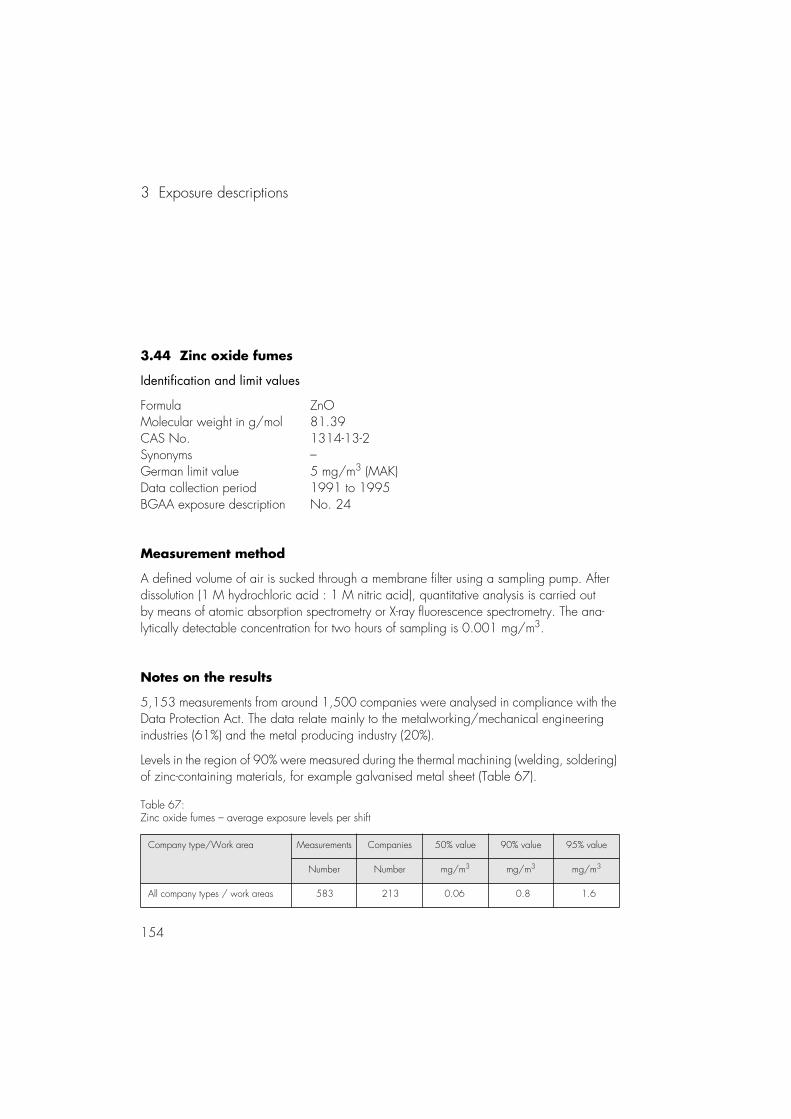
3 Exposure descriptions
154
3.44 Zinc oxide fumes
Identification and limit values
Formula ZnOMolecular weight in g/mol 81.39CAS No. 1314-13-2Synonyms –German limit value 5 mg/m3 (MAK)Data collection period 1991 to 1995BGAA exposure description No. 24
Measurement method
A defined volume of air is sucked through a membrane filter using a sampling pump. After dissolution (1 M hydrochloric acid : 1 M nitric acid), quantitative analysis is carried out by means of atomic absorption spectrometry or X-ray fluorescence spectrometry. The ana-lytically detectable concentration for two hours of sampling is 0.001 mg/m3.
Notes on the results
5,153 measurements from around 1,500 companies were analysed in compliance with the Data Protection Act. The data relate mainly to the metalworking/mechanical engineering industries (61%) and the metal producing industry (20%).
Levels in the region of 90% were measured during the thermal machining (welding, soldering) of zinc-containing materials, for example galvanised metal sheet (Table 67).
Table 67:Zinc oxide fumes – average exposure levels per shift
Company type/Work area Measurements Companies 50% value 90% value 95% value
Number Number mg/m3 mg/m3 mg/m3
All company types / work areas 583 213 0.06 0.8 1.6
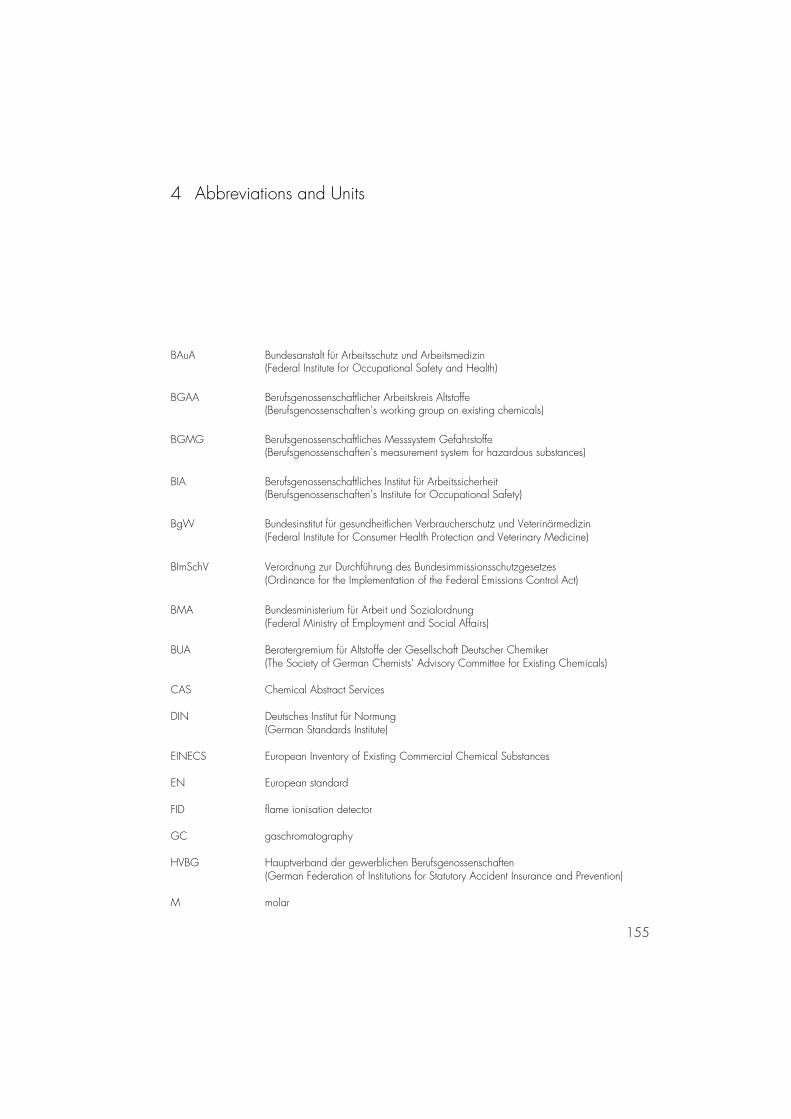
155
BAuA Bundesanstalt für Arbeitsschutz und Arbeitsmedizin(Federal Institute for Occupational Safety and Health)
BGAA Berufsgenossenschaftlicher Arbeitskreis Altstoffe(Berufsgenossenschaften’s working group on existing chemicals)
BGMG Berufsgenossenschaftliches Messsystem Gefahrstoffe(Berufsgenossenschaften’s measurement system for hazardous substances)
BIA Berufsgenossenschaftliches Institut für Arbeitssicherheit(Berufsgenossenschaften’s Institute for Occupational Safety)
BgW Bundesinstitut für gesundheitlichen Verbraucherschutz und Veterinärmedizin(Federal Institute for Consumer Health Protection and Veterinary Medicine)
BImSchV Verordnung zur Durchführung des Bundesimmissionsschutzgesetzes(Ordinance for the Implementation of the Federal Emissions Control Act)
BMA Bundesministerium für Arbeit und Sozialordnung(Federal Ministry of Employment and Social Affairs)
BUA Beratergremium für Altstoffe der Gesellschaft Deutscher Chemiker(The Society of German Chemists’ Advisory Committee for Existing Chemicals)
CAS Chemical Abstract Services
DIN Deutsches Institut für Normung(German Standards Institute)
EINECS European Inventory of Existing Commercial Chemical Substances
EN European standard
FID flame ionisation detector
GC gaschromatography
HVBG Hauptverband der gewerblichen Berufsgenossenschaften(German Federation of Institutions for Statutory Accident Insurance and Prevention)
M molar
4 Abbreviations and Units
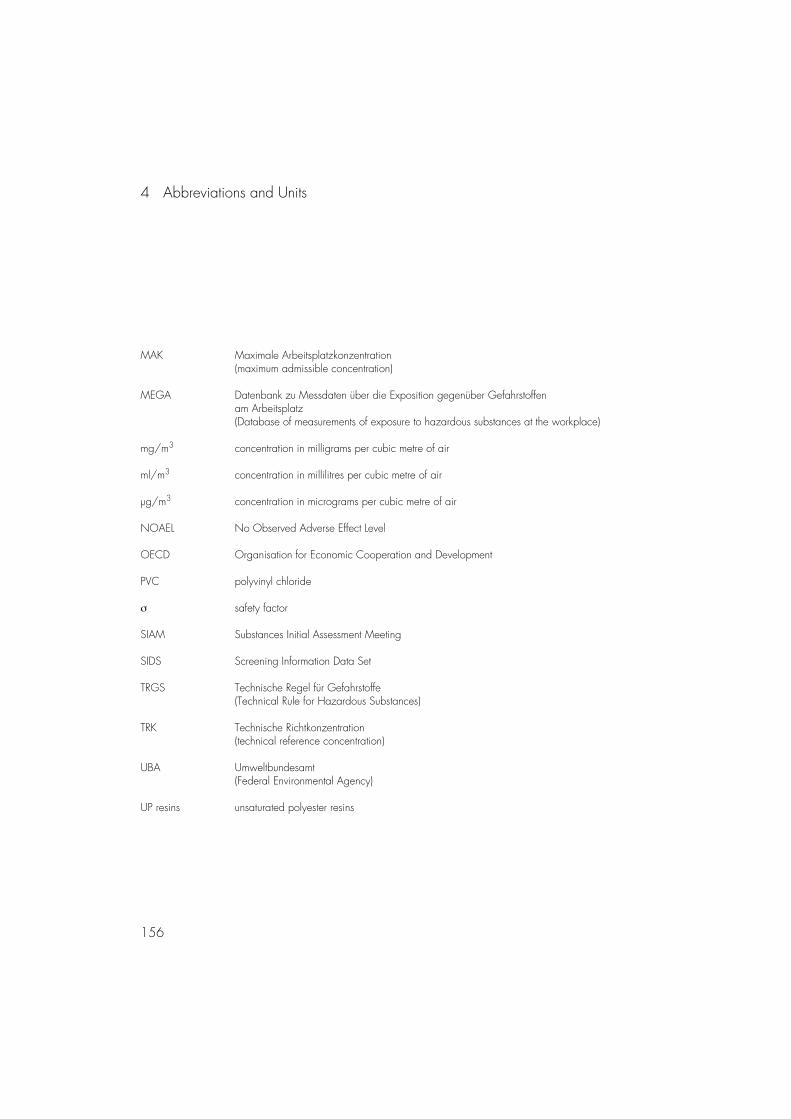
4 Abbreviations and Units
156
MAK Maximale Arbeitsplatzkonzentration(maximum admissible concentration)
MEGA Datenbank zu Messdaten über die Exposition gegenüber Gefahrstoffen am Arbeitsplatz(Database of measurements of exposure to hazardous substances at the workplace)
mg/m3 concentration in milligrams per cubic metre of air
ml/m3 concentration in millilitres per cubic metre of air
µg/m3 concentration in micrograms per cubic metre of air
NOAEL No Observed Adverse Effect Level
OECD Organisation for Economic Cooperation and Development
PVC polyvinyl chloride
σ safety factor
SIAM Substances Initial Assessment Meeting
SIDS Screening Information Data Set
TRGS Technische Regel für Gefahrstoffe(Technical Rule for Hazardous Substances)
TRK Technische Richtkonzentration(technical reference concentration)
UBA Umweltbundesamt(Federal Environmental Agency)
UP resins unsaturated polyester resins
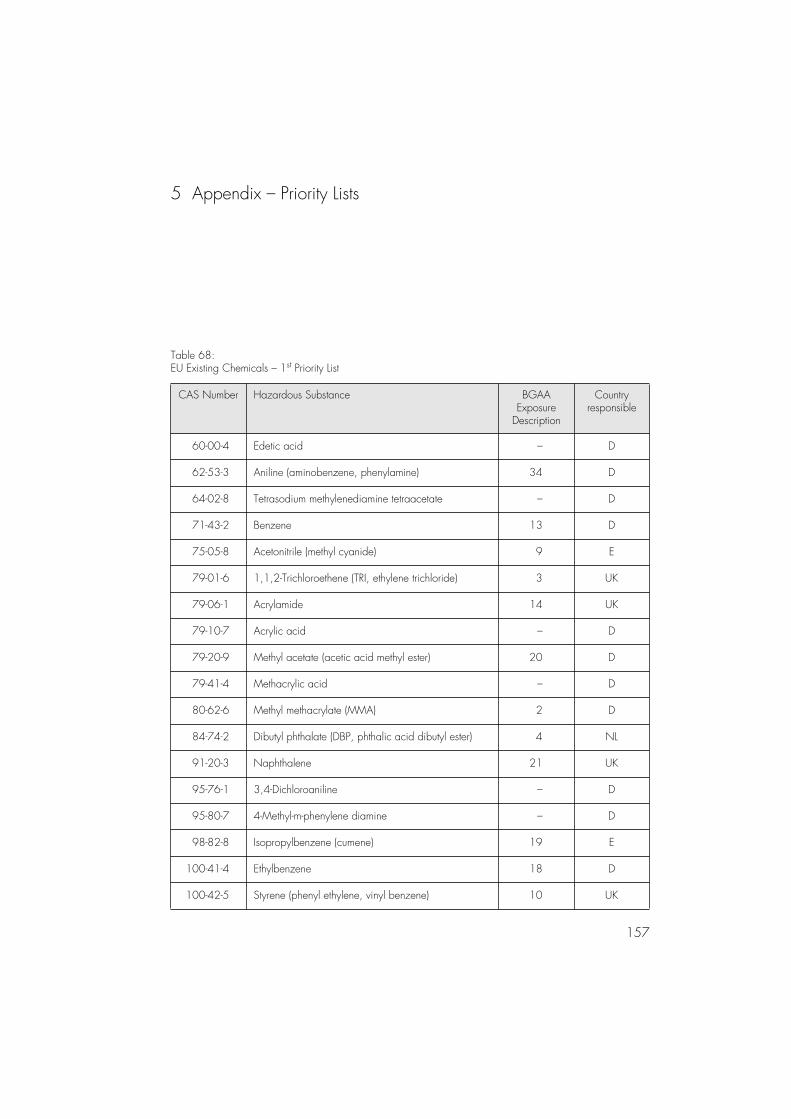
157
5 Appendix – Priority Lists
Table 68:EU Existing Chemicals – 1st Priority List
CAS Number Hazardous Substance BGAAExposure
Description
Countryresponsible
60-00-4 Edetic acid – D
62-53-3 Aniline (aminobenzene, phenylamine) 34 D
64-02-8 Tetrasodium methylenediamine tetraacetate – D
71-43-2 Benzene 13 D
75-05-8 Acetonitrile (methyl cyanide) 9 E
79-01-6 1,1,2-Trichloroethene (TRI, ethylene trichloride) 3 UK
79-06-1 Acrylamide 14 UK
79-10-7 Acrylic acid – D
79-20-9 Methyl acetate (acetic acid methyl ester) 20 D
79-41-4 Methacrylic acid – D
80-62-6 Methyl methacrylate (MMA) 2 D
84-74-2 Dibutyl phthalate (DBP, phthalic acid dibutyl ester) 4 NL
91-20-3 Naphthalene 21 UK
95-76-1 3,4-Dichloroaniline – D
95-80-7 4-Methyl-m-phenylene diamine – D
98-82-8 Isopropylbenzene (cumene) 19 E
100-41-4 Ethylbenzene 18 D
100-42-5 Styrene (phenyl ethylene, vinyl benzene) 10 UK
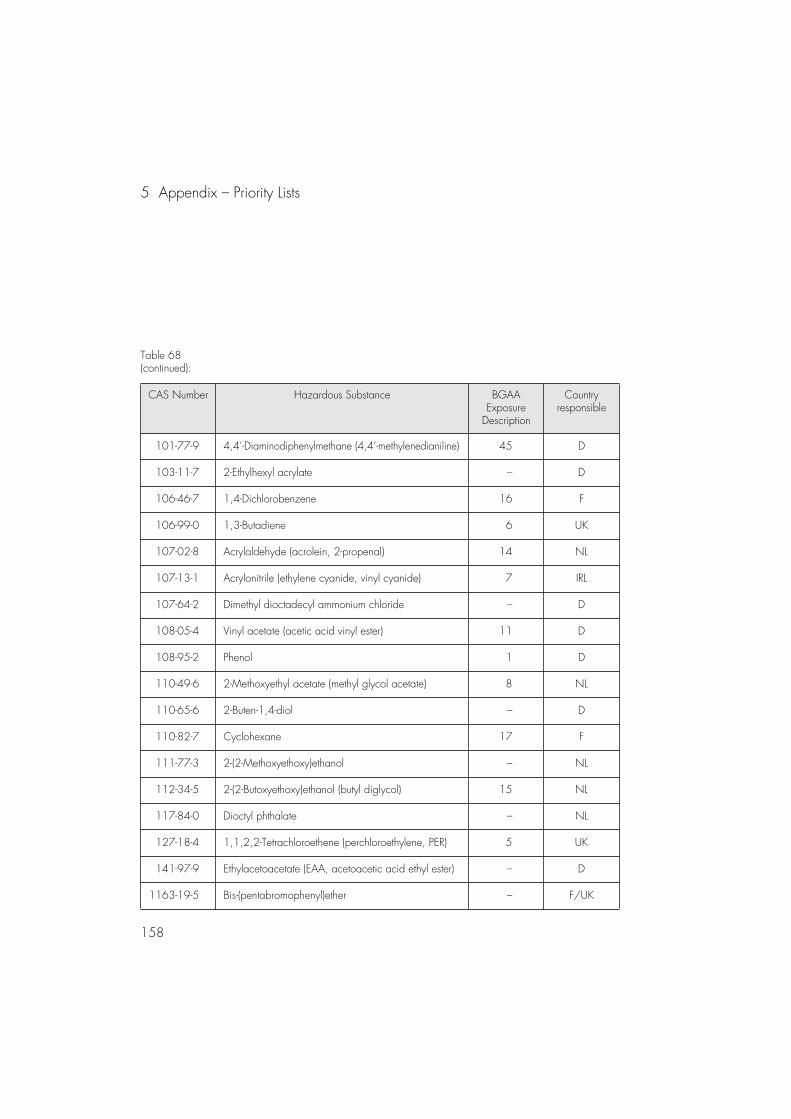
5 Appendix – Priority Lists
158
Table 68(continued):
CAS Number Hazardous Substance BGAAExposure
Description
Countryresponsible
101-77-9 4,4’-Diaminodiphenylmethane (4,4’-methylenedianiline) 45 D
103-11-7 2-Ethylhexyl acrylate – D
106-46-7 1,4-Dichlorobenzene 16 F
106-99-0 1,3-Butadiene 6 UK
107-02-8 Acrylaldehyde (acrolein, 2-propenal) 14 NL
107-13-1 Acrylonitrile (ethylene cyanide, vinyl cyanide) 7 IRL
107-64-2 Dimethyl dioctadecyl ammonium chloride – D
108-05-4 Vinyl acetate (acetic acid vinyl ester) 11 D
108-95-2 Phenol 1 D
110-49-6 2-Methoxyethyl acetate (methyl glycol acetate) 8 NL
110-65-6 2-Buten-1,4-diol – D
110-82-7 Cyclohexane 17 F
111-77-3 2-(2-Methoxyethoxy)ethanol – NL
112-34-5 2-(2-Butoxyethoxy)ethanol (butyl diglycol) 15 NL
117-84-0 Dioctyl phthalate – NL
127-18-4 1,1,2,2-Tetrachloroethene (perchloroethylene, PER) 5 UK
141-97-9 Ethylacetoacetate (EAA, acetoacetic acid ethyl ester) – D
1163-19-5 Bis-(pentabromophenyl)ether – F/UK
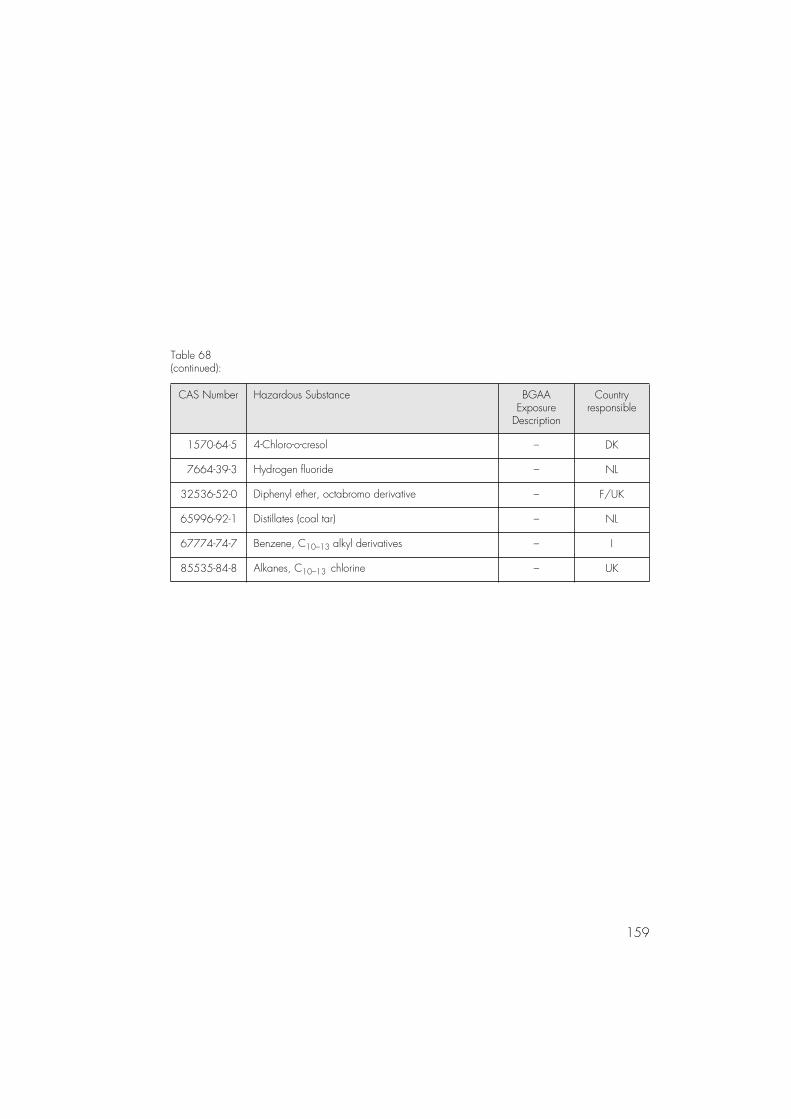
159
Table 68(continued):
CAS Number Hazardous Substance BGAAExposure
Description
Countryresponsible
1570-64-5 4-Chloro-o-cresol – DK
7664-39-3 Hydrogen fluoride – NL
32536-52-0 Diphenyl ether, octabromo derivative – F/UK
65996-92-1 Distillates (coal tar) – NL
67774-74-7 Benzene, C10–13 alkyl derivatives – I
85535-84-8 Alkanes, C10–13 chlorine – UK
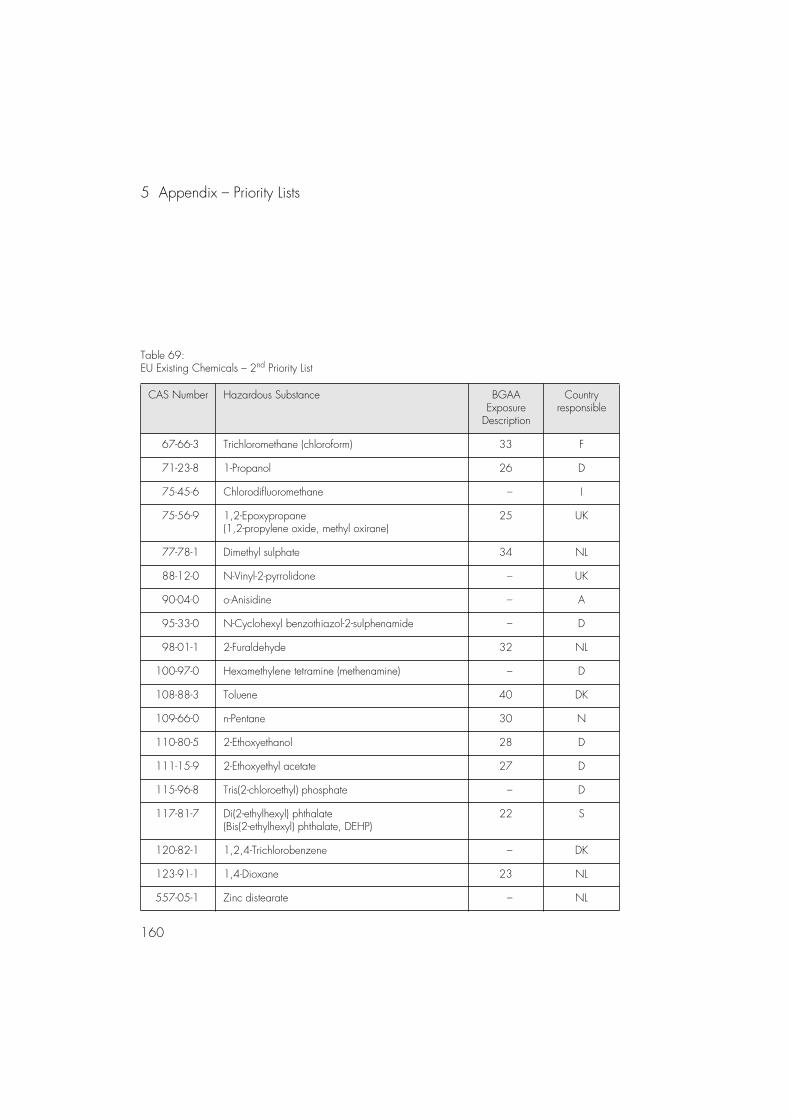
5 Appendix – Priority Lists
160
Table 69:EU Existing Chemicals – 2nd Priority List
CAS Number Hazardous Substance BGAAExposure
Description
Countryresponsible
67-66-3 Trichloromethane (chloroform) 33 F
71-23-8 1-Propanol 26 D
75-45-6 Chlorodifluoromethane – I
75-56-9 1,2-Epoxypropane (1,2-propylene oxide, methyl oxirane)
25 UK
77-78-1 Dimethyl sulphate 34 NL
88-12-0 N-Vinyl-2-pyrrolidone – UK
90-04-0 o-Anisidine – A
95-33-0 N-Cyclohexyl benzothiazol-2-sulphenamide – D
98-01-1 2-Furaldehyde 32 NL
100-97-0 Hexamethylene tetramine (methenamine) – D
108-88-3 Toluene 40 DK
109-66-0 n-Pentane 30 N
110-80-5 2-Ethoxyethanol 28 D
111-15-9 2-Ethoxyethyl acetate 27 D
115-96-8 Tris(2-chloroethyl) phosphate – D
117-81-7 Di(2-ethylhexyl) phthalate(Bis(2-ethylhexyl) phthalate, DEHP)
22 S
120-82-1 1,2,4-Trichlorobenzene – DK
123-91-1 1,4-Dioxane 23 NL
557-05-1 Zinc distearate – NL
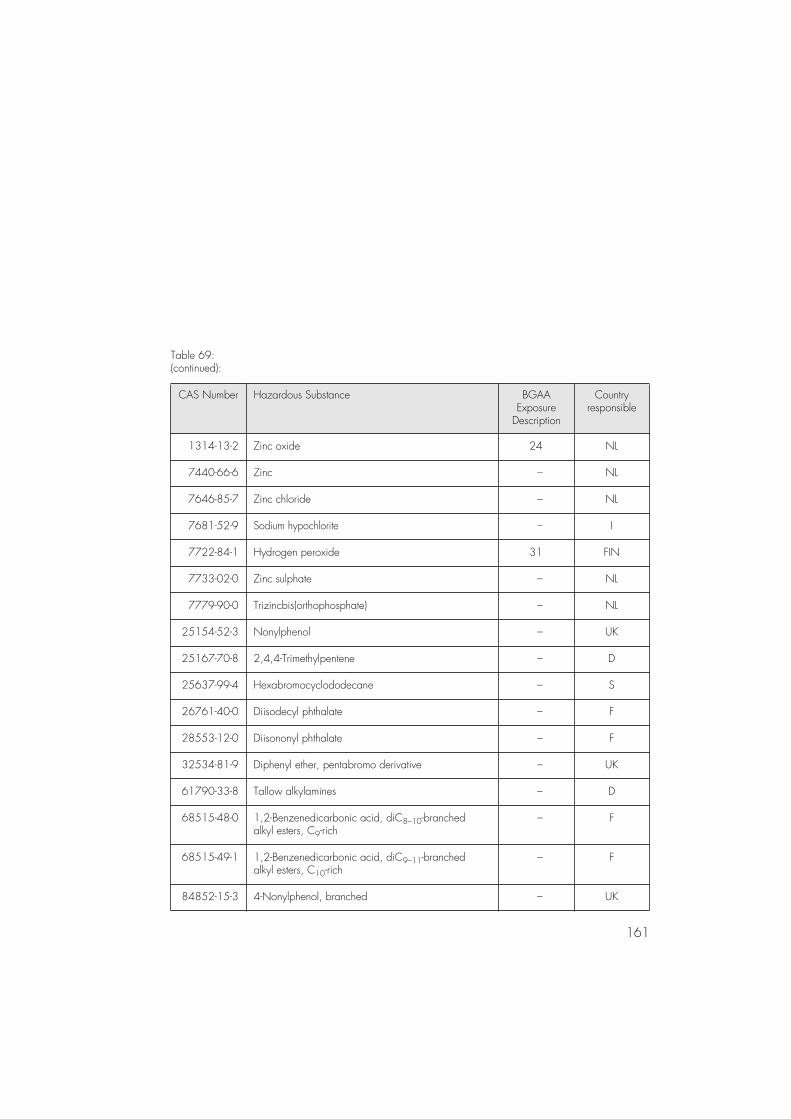
161
Table 69:(continued):
CAS Number Hazardous Substance BGAAExposure
Description
Countryresponsible
1314-13-2 Zinc oxide 24 NL
7440-66-6 Zinc – NL
7646-85-7 Zinc chloride – NL
7681-52-9 Sodium hypochlorite – I
7722-84-1 Hydrogen peroxide 31 FIN
7733-02-0 Zinc sulphate – NL
7779-90-0 Trizincbis(orthophosphate) – NL
25154-52-3 Nonylphenol – UK
25167-70-8 2,4,4-Trimethylpentene – D
25637-99-4 Hexabromocyclododecane – S
26761-40-0 Diisodecyl phthalate – F
28553-12-0 Diisononyl phthalate – F
32534-81-9 Diphenyl ether, pentabromo derivative – UK
61790-33-8 Tallow alkylamines – D
68515-48-0 1,2-Benzenedicarbonic acid, diC8–10-branched alkyl esters, C9-rich
– F
68515-49-1 1,2-Benzenedicarbonic acid, diC9–11-branched alkyl esters, C10-rich
– F
84852-15-3 4-Nonylphenol, branched – UK
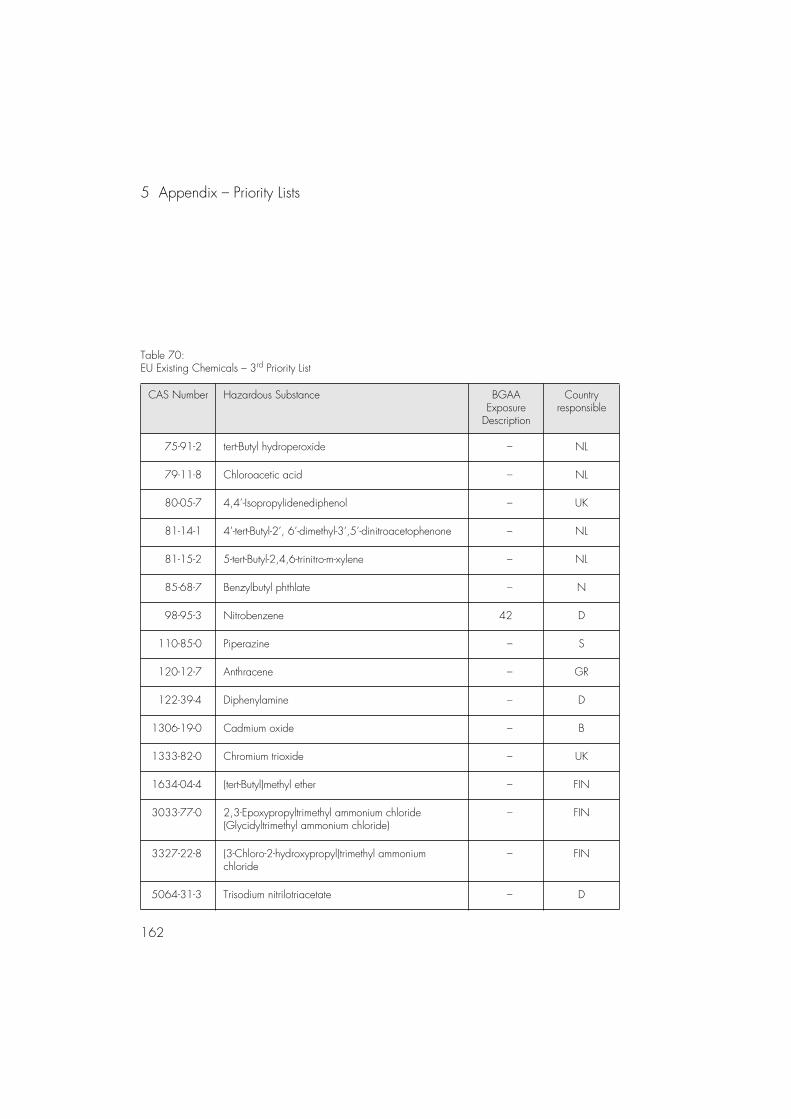
5 Appendix – Priority Lists
162
Table 70:EU Existing Chemicals – 3rd Priority List
CAS Number Hazardous Substance BGAAExposure
Description
Countryresponsible
75-91-2 tert-Butyl hydroperoxide – NL
79-11-8 Chloroacetic acid – NL
80-05-7 4,4’-Isopropylidenediphenol – UK
81-14-1 4’-tert-Butyl-2’, 6’-dimethyl-3’,5’-dinitroacetophenone – NL
81-15-2 5-tert-Butyl-2,4,6-trinitro-m-xylene – NL
85-68-7 Benzylbutyl phthlate – N
98-95-3 Nitrobenzene 42 D
110-85-0 Piperazine – S
120-12-7 Anthracene – GR
122-39-4 Diphenylamine – D
1306-19-0 Cadmium oxide – B
1333-82-0 Chromium trioxide – UK
1634-04-4 (tert-Butyl)methyl ether – FIN
3033-77-0 2,3-Epoxypropyltrimethyl ammonium chloride(Glycidyltrimethyl ammonium chloride)
– FIN
3327-22-8 (3-Chloro-2-hydroxypropyl)trimethyl ammonium chloride
– FIN
5064-31-3 Trisodium nitrilotriacetate – D
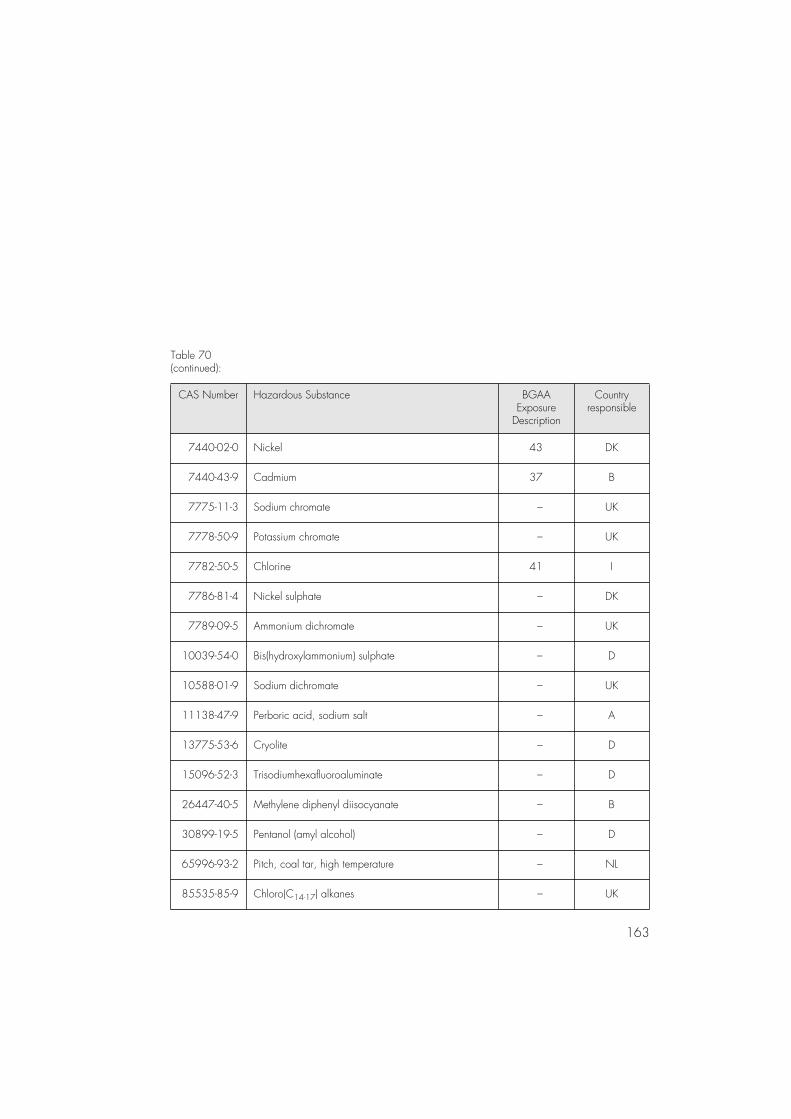
163
Table 70(continued):
CAS Number Hazardous Substance BGAAExposure
Description
Countryresponsible
7440-02-0 Nickel 43 DK
7440-43-9 Cadmium 37 B
7775-11-3 Sodium chromate – UK
7778-50-9 Potassium chromate – UK
7782-50-5 Chlorine 41 I
7786-81-4 Nickel sulphate – DK
7789-09-5 Ammonium dichromate – UK
10039-54-0 Bis(hydroxylammonium) sulphate – D
10588-01-9 Sodium dichromate – UK
11138-47-9 Perboric acid, sodium salt – A
13775-53-6 Cryolite – D
15096-52-3 Trisodiumhexafluoroaluminate – D
26447-40-5 Methylene diphenyl diisocyanate – B
30899-19-5 Pentanol (amyl alcohol) – D
65996-93-2 Pitch, coal tar, high temperature – NL
85535-85-9 Chloro(C14-17) alkanes – UK
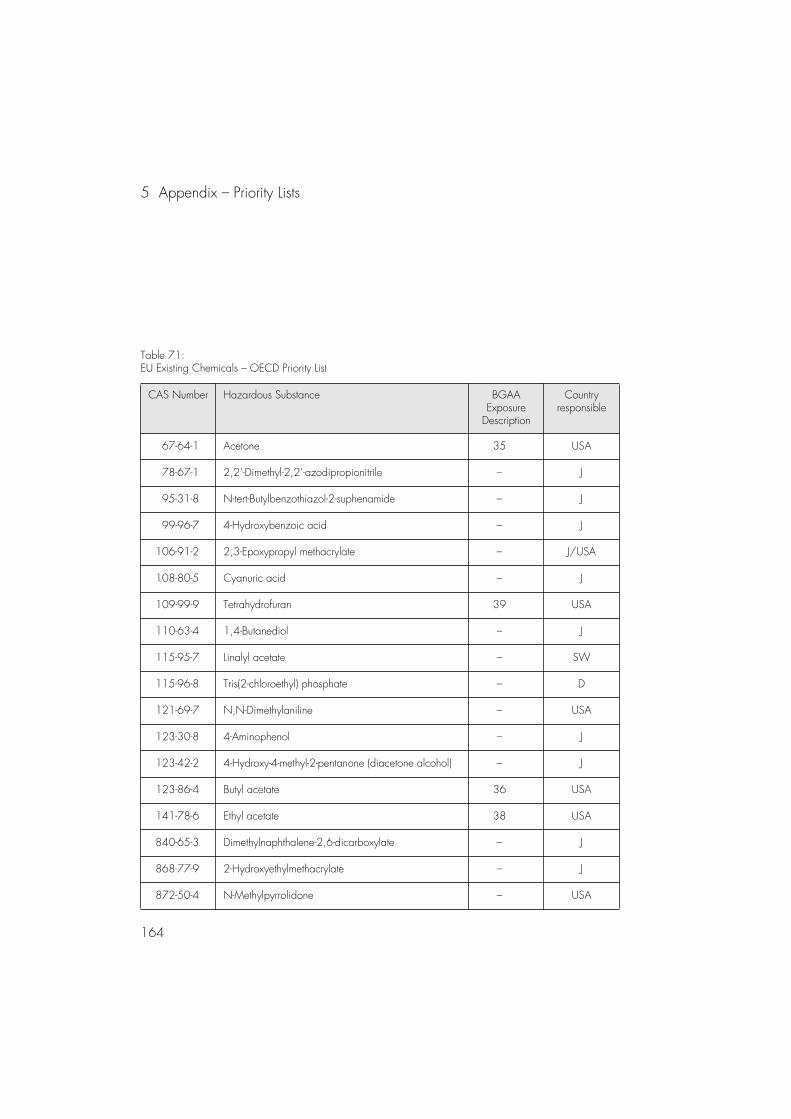
5 Appendix – Priority Lists
164
Table 71:EU Existing Chemicals – OECD Priority List
CAS Number Hazardous Substance BGAAExposure
Description
Countryresponsible
67-64-1 Acetone 35 USA
78-67-1 2,2’-Dimethyl-2,2’-azodipropionitrile – J
95-31-8 N-tert-Butylbenzothiazol-2-suphenamide – J
99-96-7 4-Hydroxybenzoic acid – J
106-91-2 2,3-Epoxypropyl methacrylate – J/USA
108-80-5 Cyanuric acid – J
109-99-9 Tetrahydrofuran 39 USA
110-63-4 1,4-Butanediol – J
115-95-7 Linalyl acetate – SW
115-96-8 Tris(2-chloroethyl) phosphate – D
121-69-7 N,N-Dimethylaniline – USA
123-30-8 4-Aminophenol – J
123-42-2 4-Hydroxy-4-methyl-2-pentanone (diacetone alcohol) – J
123-86-4 Butyl acetate 36 USA
141-78-6 Ethyl acetate 38 USA
840-65-3 Dimethylnaphthalene-2,6-dicarboxylate – J
868-77-9 2-Hydroxyethylmethacrylate – J
872-50-4 N-Methylpyrrolidone – USA
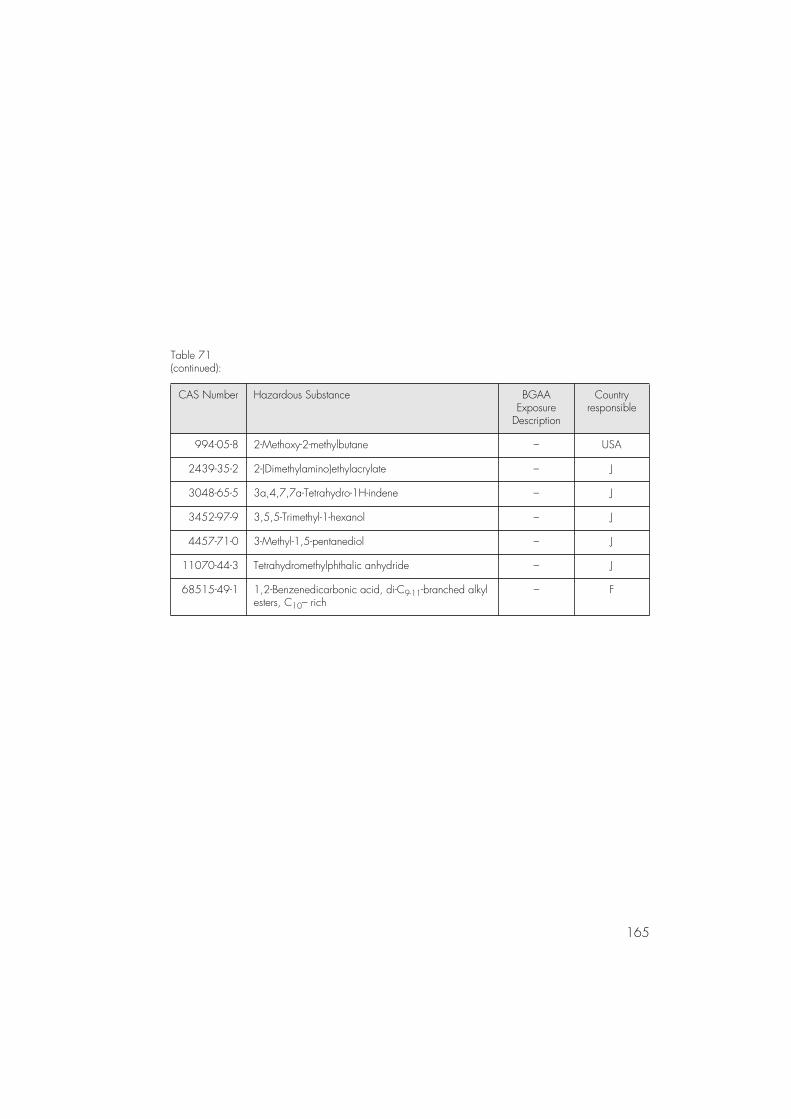
165
Table 71(continued):
CAS Number Hazardous Substance BGAAExposure
Description
Countryresponsible
994-05-8 2-Methoxy-2-methylbutane – USA
2439-35-2 2-(Dimethylamino)ethylacrylate – J
3048-65-5 3a,4,7,7a-Tetrahydro-1H-indene – J
3452-97-9 3,5,5-Trimethyl-1-hexanol – J
4457-71-0 3-Methyl-1,5-pentanediol – J
11070-44-3 Tetrahydromethylphthalic anhydride – J
68515-49-1 1,2-Benzenedicarbonic acid, di-C9-11-branched alkyl esters, C10– rich
– F

5 Appendix – Priority Lists
166
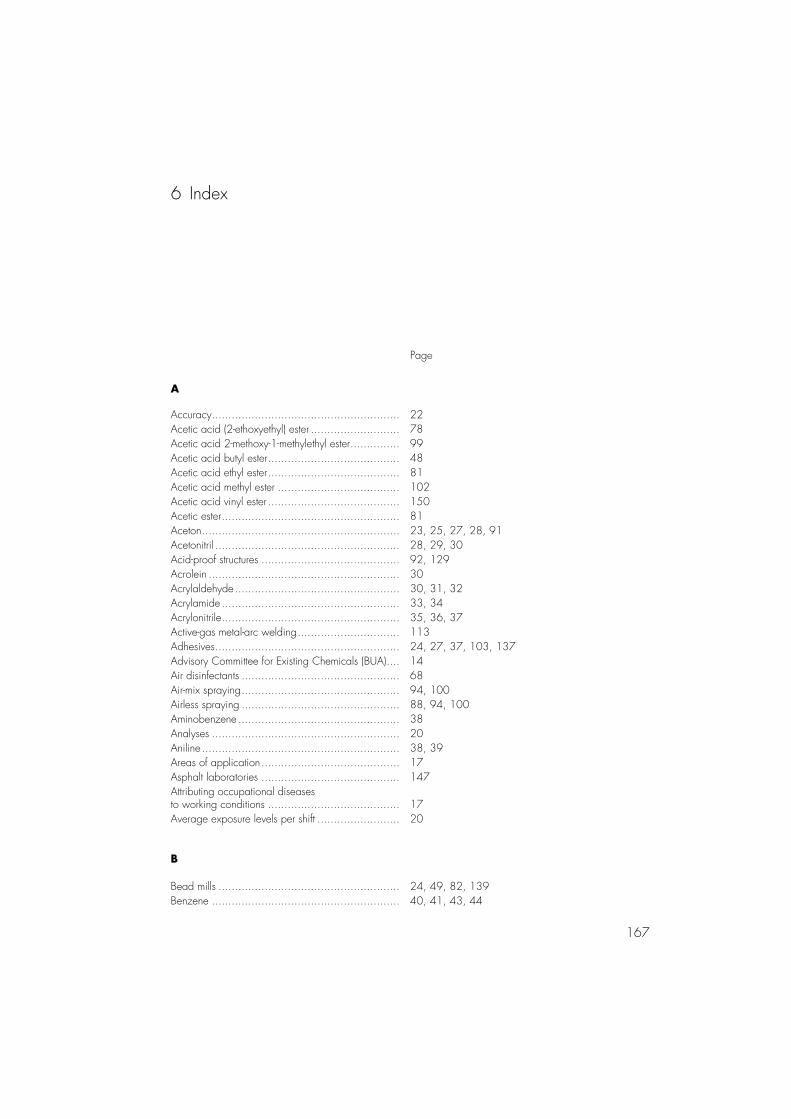
6 Index
167
A
Accuracy......................................................... 22Acetic acid (2-ethoxyethyl) ester ........................... 78Acetic acid 2-methoxy-1-methylethyl ester............... 99Acetic acid butyl ester........................................ 48Acetic acid ethyl ester........................................ 81Acetic acid methyl ester ..................................... 102Acetic acid vinyl ester ........................................ 150Acetic ester...................................................... 81Aceton............................................................ 23, 25, 27, 28, 91Acetonitril ........................................................ 28, 29, 30Acid-proof structures .......................................... 92, 129Acrolein .......................................................... 30Acrylaldehyde.................................................. 30, 31, 32Acrylamide ...................................................... 33, 34Acrylonitrile...................................................... 35, 36, 37Active-gas metal-arc welding............................... 113Adhesives........................................................ 24, 27, 37, 103, 137Advisory Committee for Existing Chemicals (BUA).... 14Air disinfectants ................................................ 68Air-mix spraying................................................ 94, 100Airless spraying ................................................ 88, 94, 100Aminobenzene ................................................. 38Analyses ......................................................... 20Aniline ............................................................ 38, 39Areas of application.......................................... 17Asphalt laboratories .......................................... 147Attributing occupational diseases to working conditions ........................................ 17Average exposure levels per shift ......................... 20
B
Bead mills ....................................................... 24, 49, 82, 139Benzene ......................................................... 40, 41, 43, 44
Page
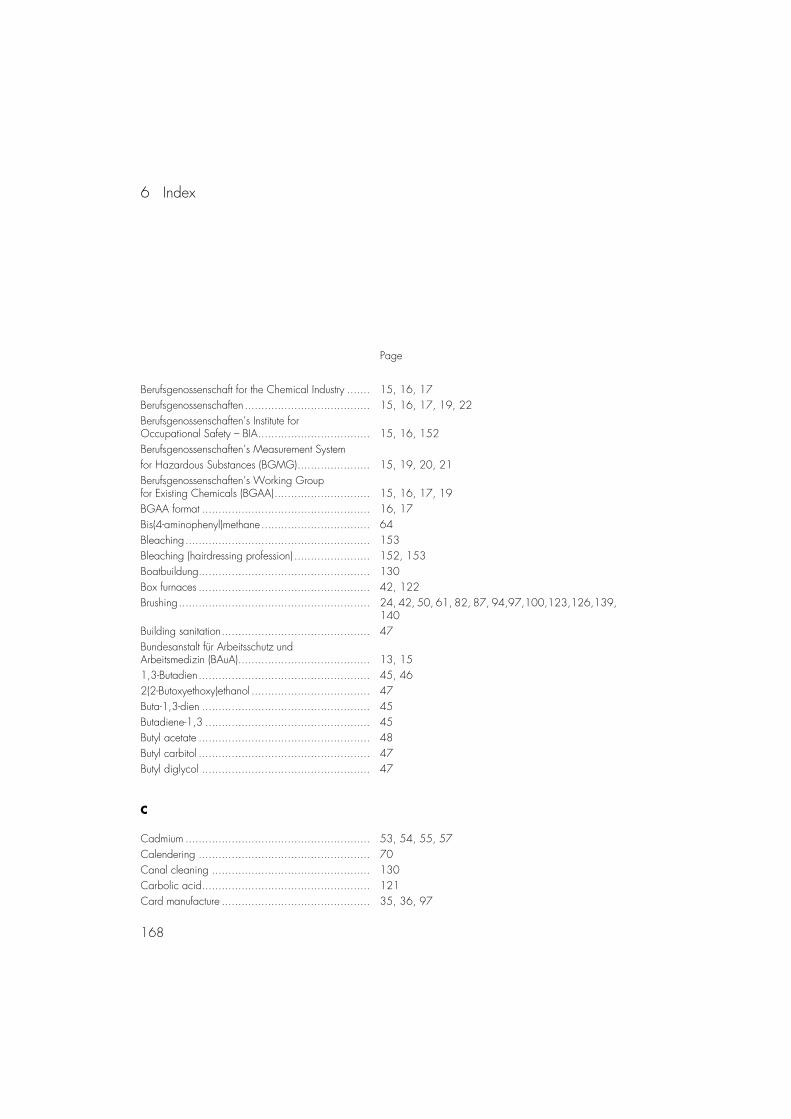
6 Index
168
Berufsgenossenschaft for the Chemical Industry ....... 15, 16, 17Berufsgenossenschaften ...................................... 15, 16, 17, 19, 22Berufsgenossenschaften’s Institute for Occupational Safety – BIA.................................. 15, 16, 152Berufsgenossenschaften’s Measurement System for Hazardous Substances (BGMG)...................... 15, 19, 20, 21Berufsgenossenschaften’s Working Groupfor Existing Chemicals (BGAA)............................. 15, 16, 17, 19BGAA format ................................................... 16, 17Bis(4-aminophenyl)methane................................. 64Bleaching........................................................ 153Bleaching (hairdressing profession) ....................... 152, 153Boatbuildung.................................................... 130Box furnaces .................................................... 42, 122Brushing.......................................................... 24, 42, 50, 61, 82, 87, 94,97,100,123,126,139,
140Building sanitation............................................. 47Bundesanstalt für Arbeitsschutz und Arbeitsmedizin (BAuA)........................................ 13, 151,3-Butadien.................................................... 45, 462(2-Butoxyethoxy)ethanol .................................... 47Buta-1,3-dien ................................................... 45Butadiene-1,3 .................................................. 45Butyl acetate .................................................... 48Butyl carbitol .................................................... 47Butyl diglycol ................................................... 47
C
Cadmium ........................................................ 53, 54, 55, 57Calendering .................................................... 70Canal cleaning ................................................ 130Carbolic acid................................................... 121Card manufacture ............................................. 35, 36, 97
Page
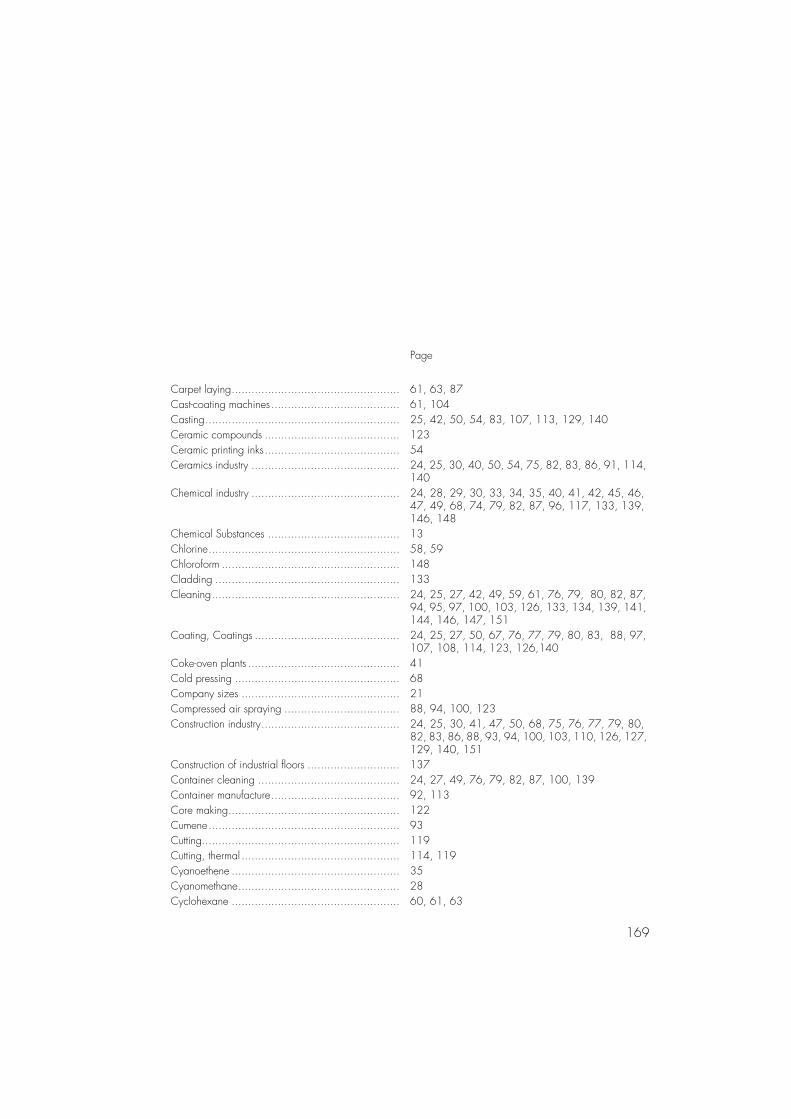
169
Carpet laying................................................... 61, 63, 87Cast-coating machines....................................... 61, 104Casting........................................................... 25, 42, 50, 54, 83, 107, 113, 129, 140Ceramic compounds ......................................... 123Ceramic printing inks......................................... 54Ceramics industry ............................................. 24, 25, 30, 40, 50, 54, 75, 82, 83, 86, 91, 114,
140Chemical industry ............................................. 24, 28, 29, 30, 33, 34, 35, 40, 41, 42, 45, 46,
47, 49, 68, 74, 79, 82, 87, 96, 117, 133, 139, 146, 148
Chemical Substances ........................................ 13Chlorine.......................................................... 58, 59Chloroform ...................................................... 148Cladding ........................................................ 133Cleaning......................................................... 24, 25, 27, 42, 49, 59, 61, 76, 79, 80, 82, 87,
94, 95, 97, 100, 103, 126, 133, 134, 139, 141, 144, 146, 147, 151
Coating, Coatings ............................................ 24, 25, 27, 50, 67, 76, 77, 79, 80, 83, 88, 97, 107, 108, 114, 123, 126,140
Coke-oven plants .............................................. 41Cold pressing .................................................. 68Company sizes ................................................ 21Compressed air spraying ................................... 88, 94, 100, 123Construction industry.......................................... 24, 25, 30, 41, 47, 50, 68, 75, 76, 77, 79, 80,
82, 83, 86, 88, 93, 94, 100, 103, 110, 126, 127, 129, 140, 151
Construction of industrial floors ............................ 137Container cleaning ........................................... 24, 27, 49, 76, 79, 82, 87, 100, 139Container manufacture....................................... 92, 113Core making.................................................... 122Cumene.......................................................... 93Cutting............................................................ 119Cutting, thermal ................................................ 114, 119Cyanoethene ................................................... 35Cyanomethane................................................. 28Cyclohexane ................................................... 60, 61, 63
Page
6 Index
170
D
Data set .......................................................... 22, 37, 984,4’-Diaminodiphenylmethane ............................. 64, 651,4-Dichlorobenzene ......................................... 68, 691,4-Dioxacyclohexane ....................................... 721,4-Dioxane .................................................... 72Decanting........................................................ 24, 27, 29, 34, 41, 49, 74, 76, 79, 82, 87, 100,
103, 107, 123, 126, 133, 137, 139, 146, 147Deep drawing.................................................. 129, 137Degreasing...................................................... 24, 49, 82, 139, 144Degreasing machines ........................................ 126DEHP ............................................................. 70Di-(2-ethylhexyl) phthalate ................................... 70, 71Di-sec-octyl phthalate ......................................... 70Dibutyl phthalate ............................................... 66, 67Diethylene dioxide ............................................ 72Diethylene glycol monobutyl ether ........................ 47Diethylene monoxide ......................................... 136Diethylene oxide ............................................... 72Dimethyl ketone ................................................ 23Dioctyl phthalate ............................................... 70Dioxane .......................................................... 72Dip-coating...................................................... 25, 50, 67, 83, 88, 94, 97Dissolvers ........................................................ 24, 49, 76, 79, 82, 87, 126, 139Distillation........................................................ 133, 146DOP............................................................... 70Dry cleaning .................................................... 132, 133, 145Dry-type spraybooths ......................................... 24, 50, 82, 83, 140Dryers ............................................................. 42, 122
E
2-Ethoxyethanol ................................................ 75, 76, 772-Ethoxyethyl acetate ......................................... 78, 79, 80
Page
171
Effect, toxicological ........................................... 13Electrical cavity sinking ...................................... 41Electrical engineering ........................................ 41, 55, 68, 76, 79, 88, 94, 100, 103, 107, 122,
133, 139, 140, 146Electrical industry .............................................. 24, 25, 35, 50, 67, 82, 83, 96, 144Electronics ....................................................... 30, 41, 75, 86, 132, 145Electrostatic precipitators .................................... 55Engine test rigs ................................................. 411,2-Epoxypropane............................................ 74Epoxy resin...................................................... 100Ethanoic acid butyl ester .................................... 48Ethanoic acid ethyl ester..................................... 81Ethanoic acid methyl ester .................................. 102Ethenylbenzene ................................................ 128Ethyl acetate .................................................... 81, 83, 85Ethyl glycol ...................................................... 75Ethyl glycol acetate ........................................... 78Ethylbenzene ................................................... 86, 89, 90Ethylene cyanide .............................................. 35Ethylene glycol monoethyl ether ........................... 75Ethylene glycol monoethyl ether acetate ................ 78Ethylene glycol monomethyl ether acetate .............. 96Ethylene trichloride ............................................ 145European Inventory of Existing Commercial Evaluations ...................................................... 19, 21Exposure ......................................................... 13, 15, 16, 17, 19, 20, 21, 22Extruders ......................................................... 31, 36, 41, 54, 65, 67, 70, 107, 122, 129
F
2-Furylaldehyde ................................................ 91, 92Filler ............................................................... 24, 26, 82, 84Fillers.............................................................. 24, 26, 37, 82, 84, 92, 129Filling ............................................................. 50, 94, 100, 107, 129, 139, 140, 144Filter dust......................................................... 55Fireproof glass ................................................. 34
Page
6 Index
172
Fireproof products ............................................. 91Firing.............................................................. 92Flame cutting.................................................... 32Flat glass manufacture........................................ 33Flat roof construction.......................................... 137Flexographic printing ......................................... 61, 140Flood-coating ................................................... 67, 97Floor coverings ................................................. 107Floor laying ..................................................... 24, 26, 50, 61, 82, 87, 90, 100, 101, 102, 103,
139, 144Foams............................................................. 67, 119, 122, 137Foundries ........................................................ 41, 42, 54, 64, 121, 122Frothing........................................................... 119Furan-2-aldehyde .............................................. 91Furan-2-carboxaldehyde ..................................... 91Furanal ........................................................... 91Furfural............................................................ 91Furniture industry ............................................... 24, 25, 31, 50, 61, 82, 83, 139
G
Galvanisation................................................... 55, 112, 113Glass industry................................................... 24, 25, 30, 40, 50, 54, 75, 82, 86, 140Glazing .......................................................... 54, 79Glueing .......................................................... 24, 26, 27, 32, 38, 42, 50, 52, 61, 64, 67, 70,
72, 82, 84, 87, 90, 97, 103, 105, 107, 111, 119, 122, 137, 139, 144, 146, 150, 151
Gravure illustration printing ................................. 141Gravure printing machines .................................. 141Grinding ......................................................... 55, 100, 113
H
1-Hydroxypropane ............................................ 125Hairdressing profession ...................................... 152, 153Hand painting.................................................. 24Hardening furnaces ........................................... 42, 122, 124
Page
173
Hexaethylen .................................................... 60High-pressure spraying....................................... 88Hot pressing .................................................... 31, 129Hot-air welding ................................................ 67Hydrogen peroxide........................................... 152, 153Hydrogen superoxide ........................................ 152Hydroxybenzene .............................................. 121
I
Impeller-type mixers ........................................... 87Importers ......................................................... 15Inert-gas metal-arc welding ................................. 113Injection moulding............................................. 67, 122, 129, 137Isobutyl acetate ................................................ 48Isopropylbenzene ............................................. 93, 94, 95
K
Kneading ........................................................ 41, 122
L
Laboratories ..................................................... 28, 29, 87, 147, 148, 149Laminating....................................................... 25, 50, 83, 92, 128, 129, 130, 133, 137Laser cutting..................................................... 41, 114Lead monoxide................................................. 54Leather industry................................................. 24, 50, 61, 67, 82, 117, 139Limit values ...................................................... 17
M
Machine cleaning............................................. 24, 27, 42, 49, 82, 100, 1391-Methoxy-2-acetoxypropane .............................. 99
Page
6 Index
174
1-Methoxypropyl acetate.................................... 992-Methoxy-1-methyl ethyl acetate.......................... 99, 100, 1012-Methoxyethyl acetate ...................................... 96, 97, 982-Methyl propenoic acid methyl ester.................... 1064,4’-Methylenedianiline ..................................... 642-Methyloxacyclopropane .................................. 74Maintenance work ............................................ 41, 44, 55, 59Manual arc welding.......................................... 113Manufacture of abrasive products ........................ 91, 122, 123, 124Manufacturers .................................................. 13, 15Manufacturing .................................................. 15, 17, 27, 49, 54, 82, 100, 111, 129, 139MDA .............................................................. 64Measurement methods ....................................... 20Measurements .................................................. 15, 17, 19, 20, 22Mechanical engineering..................................... 30, 41, 42, 55, 68, 75, 79, 86, 87, 88, 93, 96,
110, 113, 121, 122, 123, 132, 133, 145, 146, 154
Metal industry .................................................. 24, 25, 50, 82, 83, 144, 151Metalworking................................................... 30, 40, 41, 42, 49, 55, 59, 61, 75, 76, 79, 80,
82, 86, 87, 88, 93, 94, 96, 100, 103, 104, 107, 110, 113, 114, 117, 121, 122, 123, 126, 132, 133, 139, 140, 145, 146, 154
Methacrylic acid methyl ester .............................. 106Methyl acetate ................................................. 102, 104, 105Methyl cyanide................................................. 28Methyl glycol acetate ........................................ 96Methyl methacrylate .......................................... 106, 108, 109Methyl oxirane ................................................. 74Methylbenzene................................................. 138Milling ............................................................ 24, 79, 87Mineral oil industry............................................ 41Mixing............................................................ 54, 56, 65, 68, 76, 79, 87, 91, 103, 107, 114,
123, 126, 129, 139, 153Mortar, acid-proof............................................. 92Moulds, moulding, shaping ................................ 36, 42, 54, 91, 114, 130, 137
Page
175
N
n-Butyl acetate.................................................. 48, 49, 51, 52n-Pentane ........................................................ 119, 120n-Propanol ....................................................... 125n-Propyl alcohol ................................................ 125Napthalene ..................................................... 110, 111Nickel ............................................................ 112, 114, 116Nickel paint..................................................... 114Nickel-cadmium battery manufacture .................... 114Nitrobenzene................................................... 117, 118Notification unit ................................................ 13, 15
O
2-Oxopropane ................................................. 233-Oxabutylacetate ............................................ 96Oxalane ......................................................... 136
P
p,p’-Methylenedianiline...................................... 64p-Dichlorobenzene ............................................ 68, 69p-Dioxane ....................................................... 72Pad printing ..................................................... 100, 140Paint manufacture ............................................. 24, 37, 49, 54, 75, 76, 79, 82, 86, 87, 93, 94,
100, 103, 107, 126, 127, 139, 146Paint/varnish manufacture .................................. 129Painting .......................................................... 24, 27, 50, 54, 79, 82, 88, 100, 114, 139, 140Painting/Varnishing........................................... 25, 50, 76, 83, 88, 94, 114, 140Paints ............................................................. 54, 56, 61, 107, 114Paints/varnishes ............................................... 24, 25, 50, 61, 83, 97, 100, 103, 107, 140Paper industry .................................................. 151Paper manufacture ............................................ 35, 36, 97
Page
6 Index
176
Paper processing .............................................. 75Parquet adhesives ............................................. 103Parquet laying .................................................. 52, 61, 63, 84, 87Per ................................................................. 132Perchloroethylene .............................................. 132Perfumed disinfectants ........................................ 111Perhydrol ......................................................... 152Pharmaceutical industry ...................................... 24, 28Phenol ............................................................ 121, 123, 124Phenolic resins.................................................. 42, 122, 123Phenyl methane ................................................ 138Phenylamine .................................................... 38Phenylethane.................................................... 86Phenylethylene.................................................. 1282-Phenylpropane............................................... 93Phthalic acid dibutyl ester ................................... 66Phthalic acid-bis(2-ethylhexyl) ester........................ 70Pickling ........................................................... 59Pigments.......................................................... 54, 56Planing ........................................................... 55Plasma oxygen cutting ....................................... 114, 116Plastic adhesives ............................................... 137Plastic coating .................................................. 31, 137Plastic foam processing ...................................... 103, 119Plastic foam production ...................................... 137Plastics industry................................................. 24, 25, 28, 30, 40, 42, 50, 67, 75, 82, 83, 86,
129, 140Plastics manufacture........................................... 35, 36, 38, 54, 64, 107, 137Plastics processing ............................................ 31, 41, 50, 54, 61, 66, 70, 72, 87, 92, 94, 100,
103, 106, 107, 108, 121, 122, 123, 128, 129, 139
Plating ............................................................ 92Polishing ......................................................... 113Polymer concrete .............................................. 129Polystyrene....................................................... 129Polyurethane .................................................... 24Powder coating ................................................ 55
Page
177
Precision mechanics .......................................... 30, 41, 61, 75, 86, 87, 93, 103, 132, 133, 145, 146
Preparation...................................................... 24, 34, 49, 82, 137Preparations..................................................... 27, 49, 82, 100, 139Pressing .......................................................... 41, 91, 114, 122Prevention ....................................................... 17Primers............................................................ 24, 25, 50, 82, 103Printers............................................................ 42, 61, 75, 140Printing ........................................................... 76, 79, 100, 126, 137Printing industry ................................................ 25, 50, 83Printing machines .............................................. 83, 104Priority lists....................................................... 13, 16, 17Programme on existing chemicals......................... 13Propan-1-ol ...................................................... 125Propan-2-one ................................................... 231-Propanol....................................................... 125, 126, 127Propanol ......................................................... 125Propanol-1....................................................... 125Propanone....................................................... 232-Propenal....................................................... 30Propenamide ................................................... 33Propyl alcohol .................................................. 1252-Propylbenzene............................................... 93Propylene glycol monomethylether acetate ............. 991,2-Propylene oxide .......................................... 74PVC adhesives ................................................. 137PVC emulsions.................................................. 67
R
Rapporteurs ..................................................... 13, 16Reaction vessels................................................ 32, 34, 36, 107, 108, 151Recycling plants................................................ 114Red lead ......................................................... 54Repair work ..................................................... 40, 41, 44, 88, 129Repellents ........................................................ 111
Page
6 Index
178
Resins ............................................................. 42, 83, 92, 107, 108, 122, 123, 129Results............................................................. 17, 19, 21Risk assessment................................................. 13, 15, 17Rolling ............................................................ 24, 27, 42, 50, 61, 77, 82, 87, 90, 94, 97, 100,
126, 127, 139, 140Rubber industry ................................................. 30, 40, 42, 75, 86, 140Rubber processing............................................. 61, 139
S
Safety glass ..................................................... 34Sampling systems.............................................. 20, 21Screen cleaning................................................ 79Screen printing ................................................. 42, 54, 61, 76, 79, 94, 100, 114, 126, 134, 140Sealing ........................................................... 100, 107sec-Butyl acetate ............................................... 48Sewage .......................................................... 59Shoe industry ................................................... 24, 42, 50, 59, 61, 82, 107, 139Slag ............................................................... 54Smelting.......................................................... 54, 113Smelting furnaces .............................................. 42, 54, 122Smelting works ................................................. 54Smokehouses ................................................... 32Smoothing ....................................................... 129Soaking .......................................................... 76, 97Sobutyl acetate................................................. 48Soldering ........................................................ 32, 55, 56, 154Spezima machines ............................................ 133Spray painting.................................................. 24, 42, 50, 54, 67, 82, 83, 88, 97, 103, 104,
140Spray robots .................................................... 50, 83, 140Spraybooths..................................................... 24, 82, 83, 140Spraying ......................................................... 24, 25, 27, 50, 61, 76, 82, 83, 88, 90, 94, 100,
101, 103, 119, 126, 129, 133, 137, 139, 140Spraying, thermal.............................................. 114Spreading ....................................................... 25, 50
Page
179
Statistical parameters ......................................... 22Stirring............................................................ 76, 79Stirring machines .............................................. 76, 129Styrene ........................................................... 128, 129, 131Substance priority lists ........................................ 13Surface cleaning............................................... 61, 63, 87, 90, 103, 133, 146, 147Surface coating ................................................ 25, 31, 36, 42, 55, 61, 64, 67, 87, 88, 90, 94,
95, 97, 103, 104, 107, 111, 114, 119, 122, 127, 133, 140, 146, 151
Surface finishing ............................................... 42, 113Swimming pools ............................................... 59Synthetic resin .................................................. 42, 100
T
Tank cleaning .................................................. 42, 144Technical protective measures ............................. 21tert-Butyl acetate ............................................... 48Test rig ........................................................... 41Tetrachloroethene ............................................. 132, 134, 1351,1,2,2-Tetrachloroethylene................................ 1321,1,2-Trichloroethylene ...................................... 145Tetrachloroethylene ........................................... 132Tetrahydrofuran ................................................ 136, 137Tetramethylene oxide......................................... 136Thermal machining processes .............................. 32, 41, 55, 154THF................................................................ 136Toluene........................................................... 138, 141, 144Toxicological effect ........................................... 13Tri .................................................................. 145Trichloroethene................................................. 145, 146, 147Trichloromethane .............................................. 148, 149Tungsten inert-gas welding.................................. 113Turning ........................................................... 55Tyre repair....................................................... 146
Page
6 Index
180
V
Vinyl acetate .................................................... 150, 151Vinyl benzene .................................................. 128Vinyl cyanide .................................................. 35
W
Waste disposal ................................................ 38Waste incineration............................................ 55Waterproof sheeting for roofs.............................. 67Weighing........................................................ 54, 87, 100, 103, 107, 123, 126Welding ......................................................... 32, 41, 113, 154Welding plastics .............................................. 32, 67, 70, 137Wholesale industry............................................ 41, 87, 107, 133, 144Winding ......................................................... 129Woodworking.................................................. 24, 49, 50, 61, 82, 83, 87, 94, 100, 102, 103,
104, 107, 110, 111, 119, 121, 122, 123, 139, 140, 150, 151
Woodworking industry....................................... 24, 25, 30, 50, 76, 79, 82, 83, 86, 87, 88, 104Work areas ..................................................... 17, 19, 21Work processes................................................ 19, 21
Z
Zinc coating .................................................... 55Zinc oxide fumes .............................................. 154, 155
Page
181
[1] Chemikaliengesetz, Europäisches Recht: Verordnung (EWG) Nr. 793/93 des Rates zur Bewertung und Kontrolle der Umweltrisi-ken chemischer Altstoffe, 23. März 1993. Amtsblatt der Europäischen Gemeinschaften L 84, 36. Jahrgang, 5. April 1993
[2] Chemikaliengesetz, Europäisches Recht: Verordnung (EG) Nr. 1488/94 der Kommission zur Festlegung von Grundsätzen für die Bewertung der von Altstoffen ausge-henden Risiken für Mensch und Umwelt ge-mäß der Verordnung (EWG) Nr. 793/93 des Rates, 28. Juni 1994
[3] Chemikaliengesetz, Europäisches Recht: Verordnung (EG) Nr. 1179/94 der Kommission über die erste Prioritätenliste ge-mäß der Verordnung (EWG) Nr. 793/93 des Rates, 25. Mai 1994.
[4] Chemikaliengesetz, Europäisches Recht: Verordnung (EG) Nr. 2268/95 der Kommission über die zweite Prioritätenliste gemäß der Verordnung (EWG) Nr. 793/93 des Rates, 27. September 1995
[5] Chemikaliengesetz, Europäisches Recht: Verordnung (EG) Nr. 143/97 der Kommission über die dritte Prioritätenliste ge-mäß der Verordnung (EWG) Nr. 793/93 des Rates, 27. Januar 1997
[6] Stamm, R.: Die BIA-Dokumentation von Meßdaten zur Gefahrstoffexposition am
Arbeitsplatz. Staub – Reinhalt. Luft 55 (1995) Nr. 5, S. 193 - 194
[7] Berufsgenossenschaftliches Institut für Arbeitssicherheit des Hauptverbandes der gewerblichen Berufsgenossenschaften e.V. Berufgenossenschaftliches Messsystem Gefahrstoffe der gewerblichen Berufsgenos-senschaften BGMG, 4. Auflage. Hauptver-band der gewerblichen Berufsgenossen-schaften – HVBG, Sankt Augustin 1999
[8] Berufsgenossenschaft der chemischen Industrie (Hrsg.): Programm zur Verhütung von Gesundheitsschädigungen durch Arbeits-stoffe – Toxikologische Bewertungen. Berufs-genossenschaft der chemischen Industrie, Heidelberg
[9] Schlüsselverzeichnisse für die Dokumen-tation von Meß- und Betriebsdaten. (Kenn-zahlen 4050–4291). In: BIA-Arbeitsmappe Messung von Gefahrstoffen. Hrsg.: Berufs-genossenschaftliches Institut für Arbeitssicher-heit – BIA, Sankt Augustin. 15. Lfg. IX/95, Erich Schmidt, Bielefeld 1989 – Loseblatt-Ausg.
[10] EN 689: Anleitung zur Ermittlung der inhalativen Exposition gegenüber chemi-schen Stoffen zum Vergleich mit Grenzwer-ten und Meßstrategie (Workplace atmosphe-res – Guidance for the assessment of exposure by inhalation to chemical agents for
7 References
7 References
182
comparison with limit values and measure-ment strategy)
[11] EN 482: Arbeitsplatzatmosphäre – All-gemeine Anforderungen an Verfahren für die Messung von chemischen Arbeitsstoffen (Workplace atmosphere – General require-ments for the performance of procedures for the measurements of chemical agents)
[12] Stoffe und BIA-Probenahmeverfahren. (Kennzahl 3200, S. 3–77). Meßverfahren für Gefahrstoffe (Kennzahl 6010 ff). In: BIA-Arbeitsmappe Messung von Gefahrstof-fen. Hrsg.: Berufsgenossenschaftliches Institut für Arbeitssicherheit – BIA, Sankt Augustin. 15. Lfg. IX/95, Erich Schmidt, Bielefeld 1989 – Loseblatt-Ausg.
[13] Hauptverband der gewerblichen Berufs-genossenschaften (Hrsg.): Von den Berufs-genossenschaften anerkannte Analysenver-fahren zur Feststellung der Konzentrationen krebserzeugender Arbeitsstoffe in der Luft in Arbeitsbereichen (ZH1/120; jetzt: BGI 505). Carl Heymanns, Köln (12.1983 bis 07.1997)
[14] Jambu, M.: Explorative Datenanalyse. Stuttgart: Gustav Fischer Verlag (1992)
[15] Von den Berufsgenossenschaften aner-kannte Analysenverfahren zur Feststellung der Konzentrationen krebserzeugender
Arbeitsstoffe in der Luft in Arbeitsbereichen (ZH1/120). Nr. 37: Verfahren zur Bestim-mung von Acrylamid (jetzt: BGI 505-37)
[16] Von den Berufsgenossenschaften aner-kannte Analysenverfahren zur Feststellung der Konzentrationen krebserzeugender Arbeits-stoffe in der Luft in Arbeitsbereichen (ZH1/120). Nr. 4: Verfahren zur Bestimmung von Benzol (jetzt: BGI 505-4)
[17] Pflaumbaum, W., Bock, W., Wil-lert, G., Stückrath, M., Blome, H.: Arbeitsumweltdossier Benzol. BIA-Report 3/93. Hrsg.: Hauptverband der gewerb-lichen Berufsgenossenschaften (HVBG), Sankt Augustin 1993
[18] Von den Berufsgenossenschaften aner-kannte Analysenverfahren zur Feststellung der Konzentrationen krebserzeugender Arbeits-stoffe in der Luft in Arbeitsbereichen (ZH1/120). Nr. 26: Verfahren zur Bestimmung von 1,3-Butadien (jetzt: BGI 505-26)
[19] Von den Berufsgenossenschaften aner-kannte Analysenverfahren zur Feststellung der Konzentrationen krebserzeugender Arbeits-stoffe in der Luft in Arbeitsbereichen (ZH1/120). Nr. 54: Verfahren zur Bestimmung von Cadmium (jetzt: BGI 505-54)
[20] Von den Berufsgenossenschaften aner-kannte Analysenverfahren zur Feststellung der
183
Konzentrationen krebserzeugender Arbeits-stoffe in der Luft in Arbeitsbereichen (ZH1/120). Nr. 39: Verfahren zur Bestimmungvon 4,4’-Diaminodiphenylmethan (jetzt: BGI 505-39)
[21] Von den Berufsgenossenschaften aner-kannte Analysenverfahren zur Feststellung der Konzentrationen krebserzeugender Arbeits-stoffe in der Luft in Arbeitsbereichen (ZH1/120). Nr. 28: Verfahren zur Bestimmung von 1,2-Epoxypropan (jetzt: BGI 505-28)
[22] Von den Berufsgenossenschaften aner-kannte Analysenverfahren zur Feststellung der Konzentrationen krebserzeugender Arbeits-stoffe in der Luft in Arbeitsbereichen (ZH1/120). Nr. 10: Verfahren zur Bestimmung von Nickel (jetzt: BGI 505-10)
[23] Hauptverband der gewerblichen Berufs-genossenschaften: Richtlinien für Laboratorien (ZH1/119; jetzt: BGR 120). Fassung vom 1. Oktober 1993. Carl Heymanns, Köln 1993


![Untitled-2 [] · Dr. Akshay Dr. Gade Dr. pratiksha Pat" Dr. Suresh Dr. AmitRajput Bensley Dr. Shefali Karkhanis Dr. Patil Dr. S Mulay Dr. Kamini Lakhiani Dr. Shah Dr. Jaydeep Rev](https://img.dokumen.tips/doc/110x75/5adee08b7f8b9a8f298c298a/untitled-2-akshay-dr-gade-dr-pratiksha-pat-dr-suresh-dr-amitrajput-bensley.jpg)