Embed Size (px)
Citation preview

Bezabeh, M., Tesfamariam, S., Popovski, M., Goda, K., & Stiemer, S.(2017). Seismic Base Shear Modification Factors for Timber-SteelHybrid Structure: Collapse Risk Assessment Approach. Journal ofStructural Engineering, 143(10), [04017136].https://doi.org/10.1061/(ASCE)ST.1943-541X.0001869
Peer reviewed version
Link to published version (if available):10.1061/(ASCE)ST.1943-541X.0001869
Link to publication record in Explore Bristol ResearchPDF-document
This is the author accepted manuscript (AAM). The final published version (version of record) is available onlinevia ASCE at https://ascelibrary.org/doi/10.1061/%28ASCE%29ST.1943-541X.0001869. Please refer to anyapplicable terms of use of the publisher.
University of Bristol - Explore Bristol ResearchGeneral rights
This document is made available in accordance with publisher policies. Please cite only thepublished version using the reference above. Full terms of use are available:http://www.bristol.ac.uk/red/research-policy/pure/user-guides/ebr-terms/

1
SEISMIC BASE SHEAR MODIFICATION FACTORS FOR TIMBER-STEEL HYBRID 1
STRUCTURE: A COLLAPSE RISK ASSESSMENT APPROACH 2
M.A. Bezabeh1, S. Tesfamariam, M.ASCE2‡, M. Popovski3, K. Goda4 and S.F. Stiemer5 3
Abstract: 4
In this paper, to supplement the National Building Code of Canada, over-strength and ductility-5
related force modification factors are developed and validated using a collapse risk assessment 6
approach for a timber-steel hybrid structure. The hybrid structure incorporates Cross Laminated 7
Timber (CLT) infill walls within steel moment resisting frames. Following the FEMA P695 8
procedure, initially, archetype buildings of 3-, 6-, and 9-storey height with middle bay infilled with 9
CLT were developed. Subsequently, a nonlinear static pushover analysis is performed to quantify 10
the actual over-strength factors of the hybrid archetype buildings. To check the FEMA P695 11
acceptable collapse probabilities and Adjusted Collapse Margin Ratios (ACMRs), Incremental 12
Dynamic Analysis is carried out using 60 ground motion records that are selected to regional 13
seismic hazard characteristics in southwestern British Columbia, Canada. Considering the total 14
system uncertainty, comparison of the calculated ACMRs with the FEMA P695 requirement 15
indicates the acceptability of the proposed over-strength and ductility factors. 16
Keywords: Wood-hybrid system; CLT infill walls; Force modification factors; Incremental dynamic 17
analysis; Adjusted collapse margin ratio 18
19
20
1 PhD student, School of Engineering, University of British Columbia, 3333 University Way, Kelowna, BC, Canada, V1V 1V7, Tel: (250)-808-
3864, E-mail: [email protected]
2 Associate Professor, School of Engineering, University of British Columbia, 3333 University Way, Kelowna, BC, Canada, V1V 1V7, Tel: (250)-
807-8185, E-mail: [email protected]; ‡Corresponding author
3 Principal Scientist, FPInnovations, and Adjunct Professor, University of BC, 2665 East Mall, Vancouver, BC, Canada, V6T 1W5, Tel: (604)-222-
5739, E-mail: [email protected]
4 Senior Lecture, Department of Civil Engineering, University of Bristol, United Kingdom; Queen’s Building, University Walk, Bristol, United
Kingdom, BS8 1TR, Tel: 0117-33-15516; E-mail: [email protected]
5 Emeritus Professor, Dept. of Civil Engineering, The University of British Columbia, Vancouver Campus, 6250 Applied Science Lane,
Vancouver, B.C., Canada, V6T 1Z4, Tel: (604) 822-6301; E-mail: [email protected]

2
INTRODUCTION 21
The recent worldwide surge in research to enhance the sustainability of the current urban-form 22
draws the attention of construction stakeholders towards the use of timber buildings. In Canada, 23
the 2015 edition of the National Building Code (NBC) has raised the height limits for wood-frame 24
buildings from four to six storeys. Recently, new design provisions for Cross Laminated Timber 25
(CLT) have been included in the 2016 to supplement the 2014 CSAO86, the Canadian Standard 26
for Engineering Design in Wood. While wood-frame construction is limited to six storeys, some 27
innovative CLT-hybrid systems can use the alternative solution path available in the Codes, and 28
can go to greater heights. To this end, several mid- and high-rise CLT-based buildings are 29
constructed in Europe, North America, and Australia (Fragiacomo and van de Lindt 2016; Pie et 30
al. 2014). To increase the applicability of CLT constructions located in moderate- and high-seismic 31
risk, several experimental and numerical researches have been recently conducted (Poh’sié et al. 32
2015; Popovski and Garvic 2015; Yasamura et al. 2015; Ceccotti et al. 2013; Gagnon and Pirvu 33
2011; Popovski et al. 2010). For CLT system and mass-timber hybrid building, Pie et al. (2013) 34
and Zhang et al. (2015) have developed seismic force reductions factors, respectively. 35
Recently, a novel steel-timber hybrid building system was developed and investigated at The 36
University of British Columbia and FPInnovations (Dickof 2013, Stiemer et al. 2012a, b). The 37
hybrid structure contains CLT-infill walls in steel moment resisting frames (SMRFs) as shown in 38
Figure 1. This hybrid system is achieved by L-shaped steel connection brackets and aimed at 39
combining light-weight and stiff CLT panels with ductile and strong SMRFs. The seismic capacity 40
and structural efficiency of these types of connections have been reported elsewhere (Schneider et 41
al. 2014; Pozza et al. 2014; Flatscher et al. 2014; Rinaldin et al. 2013; Fragiacomo et al. 2011). 42
Earlier studies on this hybrid structure considered CLT infill walls as non-structural elements 43
(Dickof et al. 2014, Dickof 2013). Tesfamariam et al. (2014) showed the significance of CLT infill 44
walls on seismic capacity of steel moment frame structures, and suggested the implication of 45
considering the panels as a structural element. In Canada, for seismic design of structures, the NBC 46
allows the use of an Equivalent Static Force Procedure (ESFP) design method with appropriate 47
overstrength factor Ro and ductility factor Rd. However, the Ro and Rd factors for the proposed 48
hybrid structure are not available in the NBC (NRC 2010). Dickof et al. (2014) developed 49
preliminary values of Ro and Rd factors using static pushover analysis and did not consider the 50

3
collapse risk. Bezabeh et al. (2015) developed performance-based design approach for this hybrid 51
structure. In this paper, following FEMA’s Quantification of Building Seismic Performance 52
Factors document (FEMA P695, 2009), the Ro and Rd factors are developed. 53
BASE SHEAR MODIFICATION FACTORS QUANTIFICATION FRAMEWORK 54
FEMA’s Quantification of Building Seismic Performance Factors document (FEMA P695, 2009) 55
has been followed for the development of base shear modification factors of the hybrid structure 56
under consideration. FEMA’s quantification process is based on probabilistic collapse risk 57
assessment of selected archetype buildings. This procedure comprises selection and development 58
of archetype buildings, accurate nonlinear modeling, representative ground motion record 59
selection and scaling, advanced static and dynamic analysis, and collapse risk assessment. In each 60
of these analysis steps, uncertainties in ground motions, design, modeling, and testing are explicitly 61
considered. However, in this paper, certain modifications were made in the FEMA P695 procedure 62
to suit the NBC design practice and Vancouver’s seismic hazard conditions. The modifications 63
were: (1) the R factor that is investigated in FEMA P695 (2009) and that is used in the US (ASCE7-64
15) was substituted by an equivalent ductility related factor (Rd) and overstrength related factor 65
(Ro), as per NBC, and (2) probabilistic seismic hazard assessment and deaggregation was carried 66
out for the City of Vancouver, BC considering the contributions from crustal (shallow), sub-crustal 67
(deep), and subduction earthquakes. Figure 2 shows the framework to quantify the base shear 68
modification factors. 69
ARCHETYPE DEVELOPMENT AND DESIGN 70
The archetype buildings were selected based on the FEMA P695 guideline. Regular in the plan, 71
index archetype buildings were selected based on previous studies (Bezabeh 2014 and Bezabeh et 72
al. 2015). The selection was aimed at assessing different building heights and fundamental periods 73
that represent the typical application of these hybrid buildings. Therefore, 3-, 6-, and 9-storey 74
middle bay infilled hybrid structures were considered representing low-, mid-, and high-rise hybrid 75
buildings, respectively. Initial preliminary optimization analysis showed the middle bay infilled 76
hybrid buildings with 800 mm bracket spacing has acceptable seismic performance in terms of 77
maximum and residual deformation responses. The bay widths considered were: 9 m for the 78
exterior bay and 6 m for the interior bay (Figure 3). The first storey height was 4.5 m and the height 79

4
of all other storeys above was 3.65 m. A bracket spacing of 800 mm and three layers of CLT panel 80
(99 mm thickness) were considered. Panel crushing strength was equal to 11.5 MPa. 81
Seismic design category dictates special design and detailing requirements, and subsequently 82
influences inelastic deformation capacity at component level. As a result, steel design category of 83
Limited Ductility (LD) of the NBC 2010 (NRC 2010) was used during the design process. All the 84
index archetype buildings were designed and detailed as perimeter frames with seismic to gravity 85
weight of 4. Each building was designed using the ESP by considering a live load of 4.8 kPa for 86
typical office floors and a load of 2.4 kPa elsewhere. Dead loads were considered for floors and 87
roofs as 4.05 kPa and 3.4 kPa, respectively, according to the NBC 2010. The buildings studied 88
were assumed to be located in Vancouver, BC, Canada on class C soil condition (dense soil and 89
soft rock). The steel members designed were assumed to have properties of common hot-rolled 90
steel, such as yield strength Fy of 350 MPa and modulus of elasticity Es of 200 GPa. As per the 91
FEMA P695 requirement, initially base shear modification factors were assumed as Rd = 4 and Ro 92
= 1.5 based on initial seismic performance and iterative design checks. An equivalent static load 93
calculation method from the NBC 2010 was adopted to distribute the design base shear along the 94
height of the building. Tables 1 and 2, respectively, summarize the design details of the beam and 95
column sections for the hybrid buildings. 96
NONLINEAR STRUCTURAL MODELING OF ARCHETYPE BUILDINGS 97
To perform nonlinear static and dynamic analysis of the developed archetype buildings, accurate 98
and representative nonlinear numerical models are needed. For this purpose, numerical modeling 99
was carried out using the Open System for Earthquake Engineering Simulation (OpenSees) finite 100
element program (Mazzoni et al. 2006). Figure 4 shows the modeling and calibration process. The 101
procedure outlined in Figure 4 entails: 102
Carrying out component level experimental tests 103
Numerical modeling of bracket connection and CLT wall 104
Calibrating the numerical models of components using the experimental data 105
Assembling the components to form the hybrid system 106

5
Component level testing, modeling, and calibration 107
Modeling of steel frame members, spread inelasticity principle 108
The steel frame members were modelled with nonlinear displacement-based beam-column 109
elements and linear-elastic beam-column elements. The nonlinear beam-column elements were 110
used at the end of the member (to represent the spreading plastic hinge zone) as displayed in Figure 111
4, and linear beam-column elements were for the middle portion of each member. This modeling 112
approach reduces the computational time without compromising the quality of simulation outputs. 113
Three Gauss integration points were considered to model the spread of plasticity in nonlinear 114
elements. The nonlinear parts of steel elements use the modified-Ibarra-Krawinkler-Deterioration 115
model (Lignos and Krawinkler 2010) with a bilinear material property. The backbone parameters 116
of this material property, with appropriate plastic hinge length, were calculated based on the 117
moment-curvature relationships of ASCE 41-06 (ASCE 2007). 118
Modeling of CLT panels 119
A CLT panel is a light-weight and strong pre-engineered wood product. Typically, CLT is made 120
by gluing and pressing lumber boards in sandwich form (alternate direction) to form a stable 121
rectangular shaped panel. For various connections and configurations, Popovski et al. (2010) 122
performed extensive amount of testing on CLT walls (Figure 4). Based on their experimental 123
observations and results, in this paper, CLT panels were simplified and numerically modeled as 124
2D linear-elastic, homogenous, and isotropic single 99 mm panel using shell-elements as shown 125
in Figure 4. As the behaviour of the panels in the in-plane direction is of interest, the formulation 126
of shell-elements were simplified to FourNodeQuad-elements. The ndMaterial-ElasticIsotropic of 127
OpenSees was used as a material model for these elements based on the values given in Table 3. 128
As the deformation and nonlinearity of CLT panels are localized on the connections, the adopted 129
modeling approaches are deemed as reasonable and accurate (Shen et al. 2013, Rinalidin et al. 130
2013). 131
Modeling of connection between CLT panels and steel frames 132
The connection between the steel frames and CLT walls was achieved by L-shaped steel brackets; 133
which are bolted to the steel frames and nailed to the CLT panels. A Zero-length two-node link 134
nonlinear spring element was used to represent the behaviour of the bracket that connects CLT 135
6
with steel frame as shown in Figure 4. A Pinching4-uniaxial material model was used to represent 136
the axial and shear behavior of these elements. Moreover, since this element has zero length, P-Δ 137
effects along the local axis were neglected. It was also assumed that these elements do not 138
contribute to the Rayleigh damping during the nonlinear stage of loading. Shen et al. (2013) 139
showed a more realistic characterization of the CLT to frame connection with a Pinching4-uniaxial 140
material model. Therefore, by considering the experimental data of Schneider et al. (2014) as 141
benchmark (Figure 5), calibration of Pinching4-uniaxial material was carried out on SIMPSON 142
Strong-Tie connector (90483.016) with 18 screws (590mm). The cyclic loading analyses 143
were conducted by using the CUREE loading protocol that consists of primary and trailing cycles. 144
Numerical calibration was carried out in both axial and shear directions. The numerical results and 145
experimental data are compared in Figures 5 (a and b) for tests along axial (parallel to the grain) 146
and shear (longitudinal to the grain) loading directions, respectively. Figure 5 shows better 147
agreement in the initial loading stiffness. However, the failure displacement of the experiment was 148
shown to be larger than the numerical model prediction. 149
System level modeling (Assembly) 150
Following the component level experimental tests and numerical modeling, a typical CLT infilled 151
SMRF system was developed. This hybrid system combines ductile steel frames with CLT walls 152
using angular L-shaped steel bracket connections. At the interface of the wall and frame, a gap 153
was provided in order to allow the brackets to deform and dissipate energy during lateral loading. 154
The behaviour of the bracket and the confinement (due to axial contact between the frame and 155
panel) were combined to form the axial component of the two-node link element. The confinement 156
behaviour to account for the space between the frame and panel was modeled using the elastic-157
perfectly-plastic-gap uniaxial material (EPPG). The EPPG is a trilinear hysteretic uniaxial 158
material model which consists of a physical gap with zero stiffness and strength, linear elastic 159
region, and post-yielding plastic region. For the current case, the compression only gap model was 160
considered to represent the confinement property. Since wood crushing is a local phenomenon 161
around the steel brackets, the stress at which the material reaches a plastic state was calculated by 162
considering the wood strength in parallel and perpendicular directions over a 200mm contact 163
length. In order to account for densification of wood after initial fracture, the post-yield stiffness 164
of the panel was assigned to be 1% of the elastic panel stiffness. The EPPG gap material and the 165

7
two-node link element of bracket connection were combined using the parallel material 166
combination approach as shown in Figure 6. In this approach, strains are kept equal while the 167
stresses are added up to form a single unidirectional material model. 168
GROUND MOTIONS 169
The ground motion records selected for the FEMA P695 guideline may not be applicable to 170
southwestern BC directly for several reasons. The regional seismicity in southwestern BC is 171
contributed by not only shallow crustal earthquakes, but also mega-thrust Cascadia interface events 172
and deep intraplate events (Atkinson and Goda 2011). The dominant frequency content and 173
duration for these earthquakes are significantly different from those for the FEMA P695 far-field 174
record set containing 22 records from worldwide shallow crustal earthquakes. In this study, the 175
record selection was conducted based on a multiple conditional mean spectra (CMS) method 176
(Goda and Atkinson 2011). 177
The method takes into account multiple target spectra representing distinct response spectral 178
features of different earthquake types (i.e. crustal versus interface versus intraplate) and their 179
relative contributions to overall seismic hazard. It utilizes uniform hazard spectrum and seismic 180
deaggregation scenarios that are available from probabilistic seismic hazard analysis at a site of 181
interest. Figure 7 (a) compares the uniform hazard spectrum at the return period (TR) of 2500 years 182
for Vancouver with three CMS for crustal, interface, and intraplate earthquakes for the anchor 183
vibration period of 0.8 s, showing different spectral shapes for these events. It is noteworthy that 184
in the FEMA P695 approach, the effect of using ground motion records with different features is 185
taken into account through the spectral shape factor. On the other hand, the multiple CMS approach 186
accounts for this effect more explicitly and rigorously. 187
The record database is an extended dataset of real mainshock-aftershock sequences by combing 188
the PEER-NGA database (Goda and Taylor 2012) with the updated version of the Japanese 189
earthquake database (Goda et al. 2015). The number of available mainshock-aftershock sequences 190
is 606; among them, there are 197 crustal earthquakes, 340 interface earthquakes, and 69 intraplate 191
earthquakes. The interface events are from the 2003 Tokachi-oki earthquake or the 2011 Tohoku 192
earthquake (which have similar event characteristics as the expected Cascadia subduction 193
earthquake). In this study, mainshock records of the developed database are considered. 194
8
Using the target CMS (Figure 7 (a)), a set of ground motion records was selected by comparing 195
response spectra of candidate mainshock records with the target spectra. The total number of 196
selected records is set to 30 (two horizontal components per record; in total, 60 record 197
components). For instance, for the 3-storey hybrid structure, 11, 10, and 9 records are selected for 198
the crustal, interface, and intraplate earthquakes, respectively. Because the relative contributions 199
of the Cascadia subduction events increase with the anchor vibration period, larger-magnitude 200
records are selected more frequently for the 9-storey structure. In the CMS-based method, response 201
spectral matching is conducted in a least squares sense by considering the geometric mean of the 202
response spectra of two horizontal components. For the 3-storey structure, Figures 7 (b, c, d) show 203
the response spectra of the selected records with the target CMS for crustal, interface, and 204
intraplate events. The detailed results for the other cases can be found in Tesfamariam et al. (2015). 205
NONLINEAR STATIC AND DYNAMIC ANALYSES 206
The OpenSees (Mazzoni et al. 2006) was used to perform both static and dynamic analyses. The 207
presence of infill walls, steel bracket connections, and distributed plasticity elements in steel 208
frames makes nonlinear analysis of these hybrid structures computationally intensive (Bezabeh 209
2014). To overcome this issue, a high-performance, task-parallel approach was implemented on 210
200 clusters of computers at the UBC research computing service centre. 211
NONLINEAR STATIC ANALYSIS 212
In order to quantify the actual overstrength factors of the archetype hybrid buildings, static lateral 213
loads with an inverted triangular shape were used to push the structure until either model instability 214
or formation of enough plastic hinges to create a sway mode of collapse. The capacity (pushover) 215
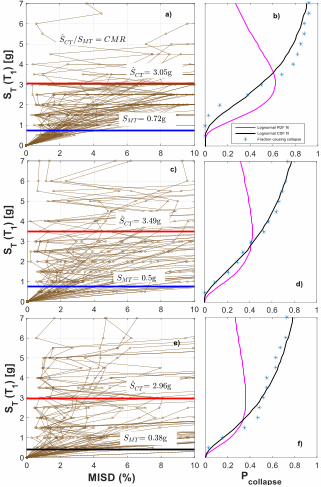
curves are given in Figures 8 (a, c, e) for the 3-, 6-, and 9- middle bay infilled archetype hybrid 216
buildings, respectively. Moreover, Figures 8 (b, d, f) depict the height-wise distribution of 217
maximum interstorey drift (MISD) of the buildings at yield, maximum strength, and collapse 218
points. It can be inferred from the figure that the maximum collapse MISD values decrease as the 219
height of the building increases. A storey-level localized collapse mechanism is observed for the 220
3-storey hybrid building. Moreover, the normalized drift at yielding is found to be independent of 221
the height of the hybrid buildings. Subsequently, the collapse MISD values of Figure 8 were used 222
to define collapse and scale the ground motion records for Incremental Dynamic Analysis (IDA). 223

9
An equivalent energy elastic-plastic (EEEP) approximation curve (blue line on Figure 8 (a)) 224
according to ASTM 2126-09 (2009) was used to calculate the system yielding point. 225
Mitchel et al. (2003) explicitly defined the overstrength-related factor as an aggregated effects due 226
to size (Rsize), differences between nominal and factored resistances (Rф), difference between the 227
actual yield strength and minimum specified yield strength (Ryield), due to strain hardening (Rsh), 228
and additional strength before collapse mechanism (Rmech). In this study, due to the complexity of 229
computing the above overstrength components for the hybrid structural elements and connections, 230
the aggregated overstrength factor (Ro) is implicitly computed using Equation 1, as the ratio of 231
maximum shear strength of the EEEP approximation curve (Vmax,EEEP) to the design base shear 232
(Vdesign). 233
𝑅𝑜 = 𝑉𝑚𝑎𝑥,𝐸𝐸𝐸𝑃
𝑉𝑑𝑒𝑠𝑖𝑔𝑛 (1) 234
The Ro factors computed for the 3-, 6-, and 9- storey archetype hybrid buildings are 3.54, 2.81, 235
and 2.46, respectively. Considering practical design approaches, however, the NBC 2010 (NRC 236
2010) sets an upper bound limit of Ro at 1.7. 237
INCREMENTAL DYNAMIC ANAYLSIS 238
To verify the acceptability of the presumed Rd factor, FEMA P695 (2009) recommends the use of 239
partial IDA (Vamvatsikos and Cornell 2002) to calculate the median collapse capacity �̂�CT and 240
collapse margin ratio (CMR). 241
where SMT = spectral acceleration value from the 2% in 50 years hazard spectrum at the 242
fundamental period of the archetype structure. 243
In IDA, each ground motion is scaled up until sway mode collapse is achieved. Typically, IDA 244
curves are defined using an intensity measure (IM) and corresponding engineering demand 245
parameter (EDP). In this paper, 5% damped spectral acceleration at the fundamental period ST(T1) 246
and MISD are considered as IM and EDP, respectively. The median collapse intensity (�̂�CT) is 247
evaluated using the IDA results. A conservative collapse criteria was used to define the dynamic 248
sway mode collapse of buildings. Structural hardening was only considered for MISD values less 249
MT
CT
S
SCMR
ˆ (2)

10
than 10% and the spectral acceleration value corresponding to the dynamic instability was 250
considered as a collapse limit state point. The IDA results are plotted in Figure 9. In Figures 9 (a, 251
c, e), each line represents the time history response of the building under single ground motion 252
record. The points on each line show the MISD value corresponding to the intensity level of the 253
ground motion. 254
COLLAPSE FRAGILITY CURVES 255
To relate the scaled spectral acceleration values with the probability of collapse, collapse fragility 256
curves are developed from the IDA analysis results. Collapse fragility curves represent the collapse 257
probability of the hybrid buildings when subjected to scaled ground motion records. These curves 258
are cumulative distribution functions (CDF) that were developed by fitting a lognormal 259
distribution through collapse data points. Figures 8 (b, d, f) show the lognormal probability 260
distribution and collapse fragility curves for the 3-, 6-, and 9-strorey hybrid buildings. According 261
to FEMA P695, the CMR from IDA, calculated using Equation 2, should be modified to adjusted 262
collapse margin ratio (ACMR) to account spectral shape effects and uncertainties. The spectral 263
shape effects and uncertainties can be accounted for by evaluating the spectral shape factor and 264
total collapse uncertainty (βTOT), respectively. 265
In this paper, however, the effect of spectral shapes was taken into account by selecting unique 266
ground motion records for each archetype building. Therefore, numerically AMCR and CMR are 267
equivalent. The average ACMR within each performance group and ACMR of individual 268
archetype buildings will be compared to the FEMA’s pre-determined acceptable ACMR values. 269
In FEMA P695 (2009), the total collapse uncertainty (βTOT) is defined as a function of other 270
uncertainty sources, such as record-to-record (βRTR), design requirement (βDR), modeling (βMDL), 271
and test data (βTD). Because of its insignificant effect on the final ACMR value, FEMA P695 fixes 272
βRTR to 0.4 for structures with significant period of elongation. Even though, the period based 273
ductility for the 9-storey hybrid building is 2.42; it is still conservative to assume βRTR as 0.4. 274
Based on FEMA P695, the design requirement uncertainty is selected as fair (βDR = 0.35). For this 275
selection the confidence in the bases of design requirement was considered as medium. Moreover, 276
considering CLT as a new construction material and the complexity in characterizing the structural 277
behaviour of wood, the completeness and robustness in the design method for this hybrid building 278
was tagged as medium. Since the experimental tests on this hybrid structure are limited to its 279

11
component level, the uncertainty related to test data was selected as fair (βTD = 0.35). In the near 280
future, the authors intend to perform full and reduced scale shaking table experimental tests on the 281
hybrid structure. The uncertainty related to modeling was selected as fair (βMDL = 0.35). Finally, 282
based on these selected values, the total uncertainty was calculated using Equation 3 to be 0.726 283
(βTOT ~ 0.75). It should be noted that the above four variables are assumed statically independent. 284
2222
MDLTDDRRTRTOT (3)
The increase in uncertainty from record-to-record to the total collapse uncertainty (0.75) changes 285
the shape of the collapse fragility curves. In Figure 10, two curves are shown to illustrate the 286
influence of uncertainty on the collapse fragility curves. The collapse fragility curve with the red 287
line was developed by the actual obtained lognormal standard deviation of collapse data points, 288
and the curve in blue is the “adjusted curve” developed with the same median but a standard 289
deviation of βTOT = 0.75. Even though the median collapse acceleration value is unchanged, as 290
depicted in the figures, the additional uncertainty increases the collapse probability of the 3-storey 291
hybrid building. 292
EVALUATION OF THE PROPOSED BASE SHEAR MODIFICATION FACTORS 293
FEMA P695 (2009) provides acceptability criteria to verify the adequacy of initially assumed force 294
reduction factors based on the accepted collapse probabilities and total uncertainty. The acceptable 295
values of adjusted collapse margin ratios are ACMR10% and ACMR20%, which correspond to 296
10% and 20% probability of collapse, respectively. The assumed Rd factor is acceptable if the 297
calculated ACMR values within the performance group and individually exceed ACMR10% and 298
ACMR20%, respectively. The ACMR10% and ACMR20% requirements corresponding to βTOT = 299
0.75 are 2.61 and 1.88, respectively. Table 4 summarizes the performance evaluation process. The 300
SMT values in the table are obtained from the 2% in 50 years uniform hazard spectrum of 301
Vancouver at the theoretical fundamental period of the hybrid buildings. For design base shear 302
calculations, FEMA P695 (2009) suggests the use of the theoretical fundamental period over the 303
periods from modal analysis. Tesfamariam et al. (2015) used the analytical period values for SMT 304
calculations and obtained conservative collapse risk for the same hybrid buildings. As summarized 305
in the table, for all considered archetype buildings, the calculated individual and average ACMR 306
values within the considered performance group exceed the FEMA P695 (2009) acceptability 307

12
requirements. FEMA P695 (2009) recommends the largest overstrength value from all considered 308
index archetypes as a system overstrength factor (Ro). From the static pushover analysis, the 309
highest overstrength factor is 3.54. However, from a pragmatic perspective, the NBC 2010 (NRC 310
2010) limits the largest overstrength factor as 1.7. Based on this upper bound cutoff limit, for CLT 311
infilled SMRFs, an overstrength factor of 1.5 is proposed. 312
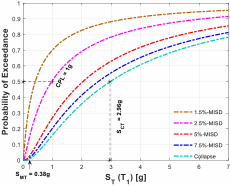
DRIFT-EXCEEDANCE FRAGILITY CURVES 313
Seismic drift-exceedance fragility curves were developed from the IDA results corresponding to 314
five EDP values: 1.5%, 2.5%, 5%, 7.5%, and collapse. The results are shown in Figure 11. These 315
curves show the MISD exceedance probability when the structure is subjected to a given ground 316
motion record. A fragility modeling algorithm developed by Baker (2014) was used to develop the 317
CDFs by fitting a lognormal distribution of IMs at EDP of interest. The NBC 2010 (NRC 2010) 318
and FEMA-356 (2000) represent an extensive damage (collapse prevention limit state) on SMRFs 319
by MISD of 2.5% and 5%, respectively. For the 3-storey hybrid building, at SMT = 0.72g, there is 320
approximately 27.3% probability that the collapse prevention limit state of the NBC 2010 will be 321
exceeded. Moreover, the probability of exceeding 5% MISD (collapse prevention limit state of the 322
FEMA-356) is only 8%. Considering the drift exceedance fragility curves of the mid-rise hybrid 323
building, as shown in Figure 11 (b), the probability of exceeding 2.5% MISD at SMT = 0.5g, is 324
32.4%. The lowest exceedance probability is obtained for the 9-storey hybrid building; there is a 325
25.8% probability that the 2% in 50 years ground motion records will create an extensive damage 326
on the building. 327
CONCLUSIONS 328
In this paper, seismic base shear modification factors were developed and validated using the 329
collapse risk assessment approach of FEMA P695 for innovative timber-steel hybrid buildings. 330
Archetype buildings of various heights were developed and designed according to the equivalent 331
static load procedure of the NBC 2010. Nonlinear finite element models were developed using the 332
OpenSees finite element package to perform nonlinear static and dynamic analyses. These models 333
use experimentally calibrated connection material models and account for the frame-wall 334
interaction using gap elements, which are implemented in a parallel fashion with the axial 335
behaviour of the connections. Subsequently, a nonlinear static pushover analysis was performed 336
to quantify the actual overstrength factors of the hybrid archetype buildings. 337

13
To check the FEMA P695 acceptable collapse probabilities, IDA was carried out using 60 ground 338
motion records that are selected carefully to reflect regional seismicity in Vancouver, BC. Due to 339
the complexity and the contributions of sub-crustal and subduction type earthquakes to the total 340
seismic hazard, new ground motion selection criteria that considers all sources of earthquake for 341
the given hazard, was developed. The adopted record selection method includes the effects of 342
‘epsilon’. The data from IDA were then used to calculate the median collapse intensity and collapse 343
margin ratio. Significant strain hardening was observed in the IDA responses. From IDA analysis 344
results, to relate the scaled spectral acceleration values with the probability of collapse, collapse 345
fragility curves were developed. Of all the analyzed buildings, the mid-rise hybrid building shows 346
higher collapse safety. 347
The collapse safety and the exceedance probability of collapse prevention limit states were 348
evaluated using ACMR values and seismic fragility curves, respectively. In general, for low and 349
high-rise hybrid buildings, the probability of exceeding 2.5% MISD by the maximum considered 350
earthquake, is less than 35%. From the static pushover analysis, the highest overstrength factor is 351
3.54. However, from the practicality perspective, the NBC 2010 limits the largest overstrength 352
factor as 1.7. Based on this upper bound cutoff limit, for CLT infilled SMRFs, an overstrength 353
factor of 1.5 is proposed. For all considered archetype buildings, the calculated individual and 354
average ACMR values within the considered performance group exceeded the FEMA P695 355
acceptability requirements. From this research, it can be concluded that Ro = 1.5 and Rd = 4 will 356
yield a safe and economical design of the proposed hybrid structure. The proposed values, 357
however, should further be validated with experimental tests. 358
ACKNOWLEDGEMENTS 359
Funding for this research was provided by the British Columbia Forestry Innovation Investment's 360
(FII) Wood First Program and the Natural Science Engineering Research Council of Canada 361
Discovery Grant (RGPIN-2014-05013). 362
REFERENCES 363
ASCE. (2006). “Seismic rehabilitation of existing buildings.” ASCE 41-06, Reston, VA. 364

14
ASTM E 2126 (2009). “Standard Test Methods for Cyclic (Reversed) Load Test for Shear 365
Resistance of Vertical Elements of the Lateral Load Resisting Systems for Buildings.” ASTM 366
International, West Conshohocken, PA, USA. 367
Atkinson, G.M. and Goda, K. (2011). Effects of seismicity models and new ground motion 368
prediction equations on seismic hazard assessment for four Canadian cities. Bulletin of the 369
Seismological Society of America, 101, 176-189. 370
Bezabeh, M. (2014). “Lateral behaviour and direct displacement based design of a novel hybrid 371
structure: Cross laminated timber infilled steel moment resisting frames.” M.A.Sc. thesis, School 372
of Engineering, Univ. of British Columbia, Canada. 373
Bezabeh, M., Tesfamariam, S., Stiemer, S., Popovski, M., Karacabeyli, E. (2015). “Direct 374
displacement based design of a novel hybrid structure: steel moment-resisting frames with cross 375
laminated timber infill walls.” Earthquake Spectra, in-press. 376
Ceccotti, A., Sandhaas, C., Okabe, M., Yasumura, M., Minowa, C., and Kawai, N. (2013). “SOFIE 377
project—3D shaking table test on a seven storey full-scale cross-laminated building.” Earthquake 378
Eng. Struct. Dyn., 42(13), 2003–2021. 379
Dickof, C. (2013). “CLT infill panels in steel moment resisting frames as a hybrid seismic force 380
resisting system.” M.A.Sc. thesis, Univ. of British Columbia, Canada. 381
Dickof, C., Stiemer, S., Bezabeh, M., and Tesfamariam, S. (2014). "CLT–steel hybrid system: 382
ductility and overstrength values based on static pushover analysis." J. Perform. Constr. Facil., 383
10.1061/(ASCE)CF.1943-5509.0000614, A4014012. 384
FEMA P695. 2009. Quantification of Building Seismic Performance Factors. Redwood City, 385
California: Applied Technology Council. 386
Flatscher, G., Bratulic, K., & Schickhofer, G. (2014). “Screwed joints in cross laminated timber 387
structures.” In Proceedings of the 13th World Conference on Timber Engineering, WCTE (2014), 388
August 10-14, Quebec City, Canada. 389
Fragiacomo, M., Dujic, B., & Sustersic, I. (2011). “Elastic and ductile design of multi-storey 390
crosslam massive wooden buildings under seismic actions.” Engineering structures, 33(11), 3043-391
3053. 392

15
Fragiacomo, M. and van de Lindt, J. (2016). "Special Issue on Seismic Resistant Timber 393
Structures." J. Struct. Eng., 10.1061/(ASCE)ST.1943-541X.0001509, E2016001. 394
Gagnon, S., and Pirvu, C. (2011). Cross Laminated Timber Handbook, FPInnovations, Vancouver, 395
Canada. 396
Goda, K. and Atkinson, G.M. (2011). Seismic performance of wood-frame houses in south-397
western British Columbia. Earthquake Eng. Struct. Dyn.,, 40, 903-924. 398
Goda, K. and Taylor, C.A. (2012). Effects of aftershocks on peak ductility demand due to strong 399
ground motion records from shallow crustal earthquakes. Earthquake Eng. Struct. Dyn.,, 41, 2311-400
2330. 401
Goda, K., Wenzel, F., and De Risi, R. (2015). Empirical assessment of nonlinear seismic demand 402
of mainshock-aftershock ground motion sequences for Japanese earthquakes. Frontiers in Built 403
Environment, 1(6), doi: 10.3389/fbuil.2015.00006. 404
Hervé Poh’sié, G., Chisari, C., Rinaldin, G., Fragiacomo, M., Amadio, C., and Ceccotti, A. (2015). 405
"Application of a translational tuned mass damper designed by means of genetic algorithms on a 406
multistory cross-laminated timber building." J. Struct. Eng., 10.1061/(ASCE)ST.1943-407
541X.0001342, E4015008. 408
Lignos, D. G., and Krawinkler, H. (2010). “Deterioration modeling of steel components in support 409
of collapse prediction of steel moment frames under earthquake loading.” J. Struct. Eng., 410
10.1061/(ASCE)ST.1943 -541X.0000376, 1291–1302. 411
Mazzoni, S., McKenna, F., Scott, M., Fenves, G., and Jeremic, B. (2006). Open System for 412
Earthquake Engineering Simulation, OpenSees, Berkeley, CA. 413
Mitchell, D., Tremblay, R., Karacabeyli, E., Paultre, P., Saatcioglu, M. and Anderson, D.L. (2003). 414
“Seismic force modification factors for the proposed 2005 edition of the National Building Code 415
of Canada.” Can. J. Civ. Eng., 30(2), 308-327. 416
NRCC (National Research Council of Canada). (2010). “National building code of Canada.” 417
Associate Committee on the National Building Code, Ottawa. 418
16
Pei, S., Popovski, M., and van de Lindt, J. W. (2013). “Analytical study on seismic force 419
modification factors for cross-laminated timber buildings.” Can. J. Civ. Eng., 40(9), 887–896. 420
Pei, S., van de Lindt, J., Popovski, M., Berman, J., Dolan, J., Ricles, J., Sause, R., Blomgren, H., 421
and Rammer, D. (2014). "Cross-laminated timber for seismic regions: Progress and challenges for 422
research and implementation." J. Struct. Eng., 10.1061/(ASCE)ST.1943-541X.0001192, 423
E2514001. 424
Popovski, M. and Gavric, I. (2015). "Performance of a 2-Story CLT House Subjected to Lateral 425
Loads." J. Struct. Eng., 10.1061/(ASCE)ST.1943-541X.0001315, E4015006. 426
Popovski, M., Schneider, J., and Schweinsteiger, M. (2010). “Lateral load resistance of cross-427
laminated wood panels.” Proc., 11th World Conf. on Timber Engineering (WCTE 2010), Riva del 428
Garda, Italy. 429
Pozza, L., and Scotta, R. (2014). “Influence of wall assembly on behaviour of cross-laminated 430
timber buildings.” Proceedings of the ICE-Structures and Buildings, 168(4), 275-286. 431
Rinaldin, G., Amadio, C., and Fragiacomo, M. (2013). “A component approach for the hysteretic 432
behaviour of connections in cross-laminated wooden structures.” Earthquake Eng. Struct. Dyn., 433
42(13), 2023–2042. 434
Schneider, J., Karacabeyli, E., Popovski, M., Stiemer, S., and Tesfamariam, S. (2014). “Damage 435
assessment of connections used in cross-laminated timber subject to cyclic loads.” J. Perform. 436
Constr. Facil., 28, A4014008. 437
Shen, Y. L., Schneider, J., Tesfamariam, S., Stiemer, S. F., and Mu, Z. G. (2013). “Hysteresis 438
behavior of bracket connection in cross-laminated timber shear walls.” Constr. Build. Mater., 48, 439
980–991. 440
Stiemer, F., Dickof, C., and Tesfamariam, S. (2012a). “Timber-steel hybrid systems: Seismic 441
overstrength and ductility factors.” Proc., 10th Int. Conf. on Advances in Steel Concrete 442
Composite and Hybrid Structures, National Univ. of Singapore, Singapore, 2–4. 443
Stiemer, S., Tesfamariam, S., Karacabeyli, E., and Propovski, M. (2012b). “Development of steel-444
wood hybrid systems for buildings under dynamic loads.” STESSA 2012, Behaviour of Steel 445
Structures in Seismic Areas. Santiago, Chile, January 9–11. 446
17
Tesfamariam, S., Stiemer, S. F., Dickof, C., and Bezabeh, M. A. (2014). “Seismic vulnerability 447
assessment of hybrid steel-timber structure: Steel moment resisting frames with CLT infill.” J. 448
Earthquake Eng., 18(6), 929–944 449
Tesfamariam, S., Stiemer, S. F., Bezabeh, M., Goertz, C., Popovski, M., and Goda, K. (2015). 450
“Force based design guideline for timber-steel hybrid structures : steel moment resisting frames 451
with CLT infill walls.” doi:http://dx.doi.org/10.14288/1.0223405. 452
Vamvatsikos, D. and Cornell, C.A. (2002). “Incremental dynamic analysis.” Earthquake Eng. 453
Struct. Dyn., 31, 491-514. doi: 10.1002/eqe.141. 454
Yasumura, M., Kobayashi, K., Okabe, M., Miyake, T., and Matsumoto, K. (2015). "Full-scale tests 455
and numerical analysis of low-rise CLT structures under lateral loading." J. Struct. Eng., 456
10.1061/(ASCE)ST.1943-541X.0001348, E4015007. 457
Zhang, X., Fairhurst, M., and Tannert, T. (2015). "Ductility estimation for a novel timber–steel 458
hybrid system." J. Struct. Eng., 10.1061/(ASCE)ST.1943-541X.0001296, E4015001. 459
460
461
462
463
464
465
466
467
468
469

18
List of Figures 470
Fig. 1. A steel-timber hybrid structure, CLT infilled SMRFs 471
Fig. 2. Framework to quantify the base shear modification factors of the hybrid structure 472
Fig. 3. Elevation views of archetype buildings; a) 3-storey hybrid building; b) 6-storey hybrid 473
building; c) 9-storey hybrid building 474
Fig. 4. Testing, modeling, and calibration procedures 475
Fig. 5. Comparison of experimental and OpenSees pinching4 material model for steel bracket 476
connection; a) perpendicular to the grain direction b) parallel to the grain direction 477
Fig. 6. Parallel formulation to combine the EPPG gap material and the two-node link element of 478
bracket connection 479
Fig. 7. (a) Comparison of uniform hazard spectrum with three conditional men spectra for different 480
earthquake types, (b) matching of the selected crustal records with the target CMS spectrum, (c) 481
matching of the selected interface records with the target CMS spectrum, (d) matching of the 482
selected intraplate records with the target CMS spectrum for the 3-storey building 483
Fig. 8. Capacity curves of the hybrid buildings a) pushover curve of 3-storey hybrid building; b) 484
MISD curves of 3-storey hybrid building; c) pushover curve of 6-storey hybrid building; d) MISD 485
curves of 6-storey hybrid building; e) pushover curve of 9-storey hybrid building; f) MISD curves 486
of 9-storey hybrid building 487
Fig. 9. IDA results and collapse fragility curves a) IDA results of 3-storey hybrid building; b) 488
collapse fragility and collapse probability curves for 3-storey building; c) IDA results of 6-storey 489
hybrid building; b) collapse fragility and collapse probability curves for 6-storey building; e) IDA 490
results of 9-storey hybrid building; f) collapse fragility and collapse probability curves for 9-storey 491
building 492
Fig. 10. Influence of total uncertainty on the collapse fragility curves for 3-storey middle bay 493
infilled archetype model 494
Fig. 11. Seismic drift-exceedance fragility curves; a) 3-storey hybrid building; b) 6-storey hybrid 495
building; c) 9-storey hybrid building 496

19
497

20
List of Tables 498
Table 1: Designed beam dimensions 499
Table 2: Designed column dimensions 500
Table 3. CLT material properties 501
Table 4. Performance evaluation table 502
503
504
505
506
507
508
509
510
511
512
513
514
515
516
517
518
519
520
521

21
522

22
Table 1: Designed beam dimensions 523
Building storey Storey no External Internal
3 1,2,3 W310 W310
6 1,2,3,4 W310 W310
5,6 W310 W310
9
1,2,3,4 W310107 W310107
5,6,7 W310 W310
8,9 W310 W310
524
525
526
527
528
529
530
531
532
533
534
535
536
537
538
539
540
541
542

23
543

24
Table 2: Designed column dimensions 544
Building storey Storey no Left External Right External Internal
3 1 W310 W310 W310
2, 3 W310 W310 W310
6 1,2,3,4 W310 W310 W310
5,6 W310 W310 W310
9
1,2,3 W310143 W310143 W310143
4,5 W310143 W310143 W310143
7,8 W310129 W310129 W310129
9 W310129 W310129 W310129
545
546
547
548
549
550
551
552
553
554
555
556
557
558
559
560
561
562

25
563
Table 3. CLT material properties 564
Material Property Major Strength
Direction
Minor Strength
Direction
Elastic modulus, E0 and E90 (MPa) 9500 9500
Compression strength, fc0 and fc90 (MPa) 11.5 11.5
Shear strength, fv0, fv90 (MPa) 1.5 1.5
Bending at extreme fiber, fbo, fb90 (MPa) 11.8 11.8
Tensile strength, ft0 and ft90 (MPa) 5.5 5.5
565
566
567
568
569
570
571
572
573
574
575
576
577
578
579
580
581
582

26
583
Table 4. Performance evaluation table 584
Performance
group
Hybrid Building
Configuration Calculated Ro and ACMR Evaluation
No. of
storey
Infilled
bays Ro
SCT
(g) SMT (g) ACMR
FEMA P695
requirement Pass/fail
Low-rise 3 1 3.54 3.05 0.72 4.24 1.88 Pass
Average 3.54 4.24 2.61 Pass
Mid-rise 6 1 2.82 3.49 0.50 6.98 1.88 Pass
Average 2.82 6.98 2.61 Pass
High-rise 9 1 2.46 2.96 0.38 7.78 1.88 Pass
Average 2.46 7.78 2.61 Pass
585


Conceptual design of CLT-SMRFs
Archetype buildings development
Probabilistic Seismic Hazard Assessment (PSHA)
Nonlinear modeling
Performance evaluation
Nonlinear analysis
Document results
Adjusted Collapse Margin Ratio (ACMR) is ok?
Component level study
System level study
Experimental test
Calibration of OpenSees
Models
Assembly
CLT infill configuration and height limitation
issues
Index archetype building design
Development of UHS and CMS
Seismic hazard of Vancouver
Hazard deaggregation Ground motion selection
Assume Rd and Ro
factors
Nonlinear modeling
Modeling of connections
Modeling of CLT wall
Modeling of steel moment frame
Modeling of gap
Nonlinear analysis
Nonlinear Static Pushover (NLSP)
Incremental Dynamic Analysis (IDA) ACMRi
ACMRi > ACMR20%
.and.average AMCRi > ACMR10%
Assumed Rd factor is acceptable
Evaluation of Ro
factorDocument the
results
Yes
Actual Ro
Yes
No
No

4.5
m3
.65
mTY
P
a) c)b)

2D elastic shell element for CLT
2 node link element
Elastic
Shear deformation
Compression gap
Stress force
Tension gap
$Fy (-ve value)
$gap (-ve value)
$E
$gap (+ve value)
$Fy
$E
Nonlinear displacement
based beam-column
Gap elements
Beam-column element
Ass
em
bly
[C
LT-S
MR
Fs)
CLT panel
Axial and combined EPPG
Steel frame
Shear (horizontal) behavior of bracket
Exp
eri
me
nta
l te
sts
Op
en
See
s m
od
elin
gL-shaped steel brackets
Calibration
CLT wall
Calibration
Perpendicular to the grainParallel to the grain
Quad-elements
Elastic shell element
two-node link elements
Contact-element
Rocking movement
Displacement control loading
M-θ

−80 −60 −40 −20 0 20 40 60 80−60
−40
−20
0
20
40
60
Displacement (mm)
Lo
ad (
kN)
0 10 20 30 40 50−20
0
20
40
60
Displacement (mm)
Experimental testPinching4 model

Shear deformation
Compression gap
Stress force
$Fy (-ve value)
$gap (-ve value)
$E
Two node link element representing L-steel brackets
EPPG uniaxial element
CLT panel
Steel frame element

VancouverSite class CTR = 2500 years
CMS-CrustalCMS-InterfaceCMS-IntraplateUniform hazard spectrum
5.0
2.0
1.0
0.2
0.1
0.5
Spec
tral a
ccel
erat
ion
(g)
0.1PGA 0.2 0.5 1 2 5Vibration period (s)
3-storey building
CMS-InterfaceMedian16th/84th curveSelected records
0.1
5.0
2.0
1.0
0.2
0.1
0.5
Spec
tral a
ccel
erat
ion
(g)
PGA 0.2 0.5 1 2 5Vibration period (s)
3-storey building
CMS-CrustalMedian16th/84th curveSelected records
0.1
5.0
2.0
1.0
0.2
0.1
0.5
Spec
tral a
ccel
erat
ion
(g)
PGA 0.2 0.5 1 2 5Vibration period (s)
CMS-IntraplateMedian16th/84th curveSelected records
3-storey building
0.1
5.0
2.0
1.0
0.2
0.1
0.5
Spec
tral a
ccel
erat
ion
(g)
PGA 0.2 0.5 1 2 5Vibration period (s)
(a) (b)
(c) (d)