Embed Size (px)
Citation preview
1
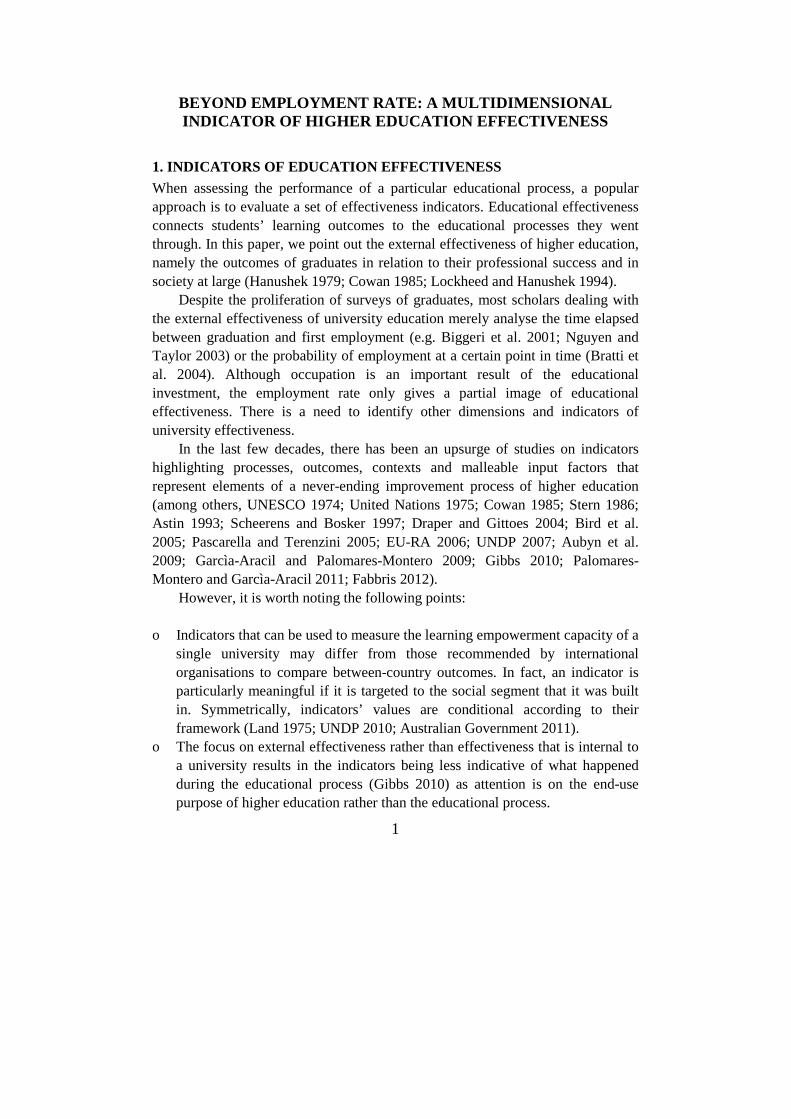
BEYOND EMPLOYMENT RATE: A MULTIDIMENSIONAL INDICATOR OF HIGHER EDUCATION EFFECTIVENESS
1. INDICATORS OF EDUCATION EFFECTIVENESS
When assessing the performance of a particular educational process, a popular approach is to evaluate a set of effectiveness indicators. Educational effectiveness connects students’ learning outcomes to the educational processes they went through. In this paper, we point out the external effectiveness of higher education, namely the outcomes of graduates in relation to their professional success and in society at large (Hanushek 1979; Cowan 1985; Lockheed and Hanushek 1994).
Despite the proliferation of surveys of graduates, most scholars dealing with the external effectiveness of university education merely analyse the time elapsed between graduation and first employment (e.g. Biggeri et al. 2001; Nguyen and Taylor 2003) or the probability of employment at a certain point in time (Bratti et al. 2004). Although occupation is an important result of the educational investment, the employment rate only gives a partial image of educational effectiveness. There is a need to identify other dimensions and indicators of university effectiveness.
In the last few decades, there has been an upsurge of studies on indicators highlighting processes, outcomes, contexts and malleable input factors that represent elements of a never-ending improvement process of higher education (among others, UNESCO 1974; United Nations 1975; Cowan 1985; Stern 1986; Astin 1993; Scheerens and Bosker 1997; Draper and Gittoes 2004; Bird et al. 2005; Pascarella and Terenzini 2005; EU-RA 2006; UNDP 2007; Aubyn et al. 2009; Garcìa-Aracil and Palomares-Montero 2009; Gibbs 2010; Palomares-Montero and Garcìa-Aracil 2011; Fabbris 2012).
However, it is worth noting the following points: o Indicators that can be used to measure the learning empowerment capacity of a
single university may differ from those recommended by international organisations to compare between-country outcomes. In fact, an indicator is particularly meaningful if it is targeted to the social segment that it was built in. Symmetrically, indicators’ values are conditional according to their framework (Land 1975; UNDP 2010; Australian Government 2011).
o The focus on external effectiveness rather than effectiveness that is internal to a university results in the indicators being less indicative of what happened during the educational process (Gibbs 2010) as attention is on the end-use purpose of higher education rather than the educational process.

2
For measuring effectiveness, no simple measures are sufficiently valid in
terms of relevance1 and reliability2. Rather, a general framework is needed to encompass complex concepts such as educational quality, stakeholder satisfaction, student retention and learning outcomes (Finnie and Usher 2005; Chalmers 2008).
A system for evaluating educational effectiveness requires that outputs and outcomes of a process or a system be placed in relation with antecedent (academic inputs and educational processes) and concomitant (social, economical and physical systems) factors. The relationships that exist among higher education factors may be represented as shown in Figure 1.
Fig. 1 here
Fig. 1 Effectiveness of education delivered by universities In this paper, we propose a multidimensional indicator of higher education
effectiveness and evaluate the relationships among its dimensions and with the common concept of external effectiveness. Our perspective is based on the assumption that there is no unique indicator of education effectiveness but rather that some indicators (amongst all the reliable ones) describe the target issue better than others.
The types of indicators that can be considered for assessing the external effectiveness of higher education are:
a) Employability rate. The employability of a graduate varies with time, and
the time reference has to be fixed to allow for a comparison of outputs in space and time and across categories. It can be computed as an employment rate with reference to a cohort of graduates who have all looked for a job during a certain time interval. Six months, 1 year or 3 years after graduation are typical intervals at the end of which an output can be estimated (with reference to Italy, see Istat 2009; Fabbris 2010; Cammelli and Gasperoni 2012; Lucarelli et al. 2012). Educational effectiveness may also be viewed as a long-term concept. It could be
1 Relevant is an indicator of what we need to know. This property implies that the indicator is designed to match the research objectives (i.e. ‘design validity’, see Bockstaller and Girardin 2003); from the stakeholders’ and decision-makers’ viewpoints, an indicator’s output is expected to be useful to inform their decisions. 2 Reliable is an indicator’s measure that can be trusted. This property basically refers to the consistency of outputs in repeated trials under the same essential conditions (‘output validity’).
3
evaluated several years after graduation, although, as time goes by, the effects of inherited skills and those that stem from society may overcome those learnt at university (Dey et al. 1999).
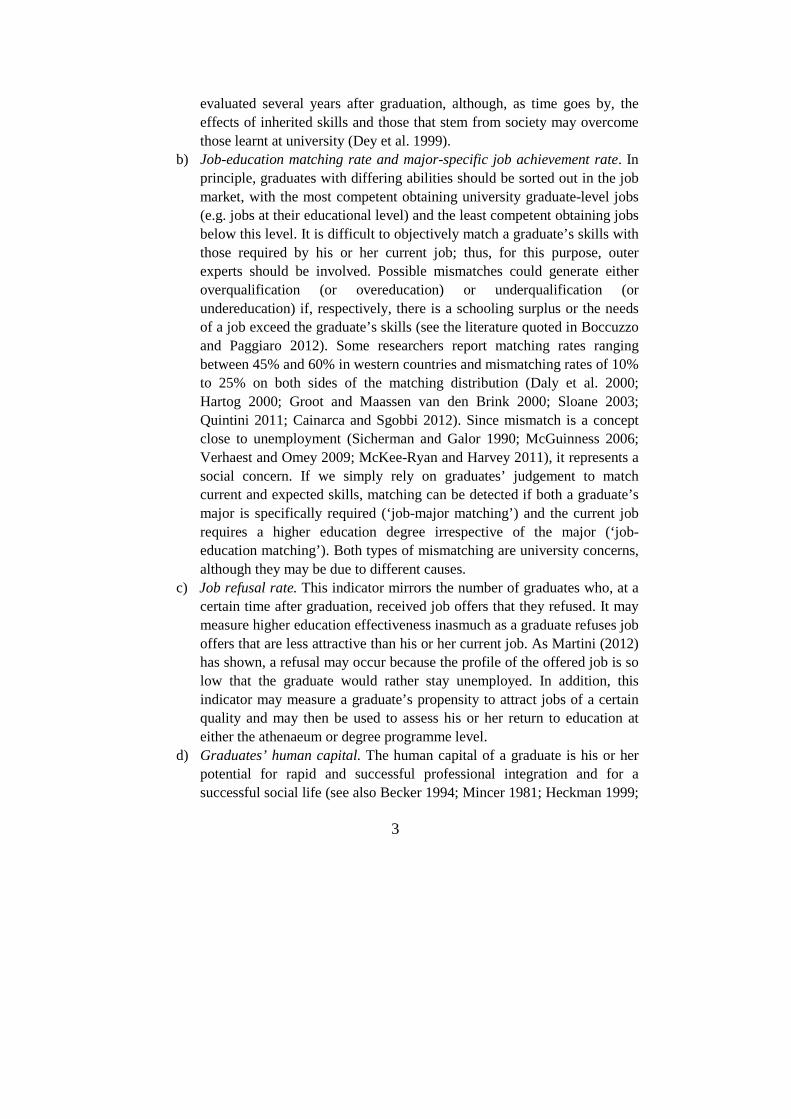
b) Job-education matching rate and major-specific job achievement rate. In principle, graduates with differing abilities should be sorted out in the job market, with the most competent obtaining university graduate-level jobs (e.g. jobs at their educational level) and the least competent obtaining jobs below this level. It is difficult to objectively match a graduate’s skills with those required by his or her current job; thus, for this purpose, outer experts should be involved. Possible mismatches could generate either overqualification (or overeducation) or underqualification (or undereducation) if, respectively, there is a schooling surplus or the needs of a job exceed the graduate’s skills (see the literature quoted in Boccuzzo and Paggiaro 2012). Some researchers report matching rates ranging between 45% and 60% in western countries and mismatching rates of 10% to 25% on both sides of the matching distribution (Daly et al. 2000; Hartog 2000; Groot and Maassen van den Brink 2000; Sloane 2003; Quintini 2011; Cainarca and Sgobbi 2012). Since mismatch is a concept close to unemployment (Sicherman and Galor 1990; McGuinness 2006; Verhaest and Omey 2009; McKee-Ryan and Harvey 2011), it represents a social concern. If we simply rely on graduates’ judgement to match current and expected skills, matching can be detected if both a graduate’s major is specifically required (‘job-major matching’) and the current job requires a higher education degree irrespective of the major (‘job-education matching’). Both types of mismatching are university concerns, although they may be due to different causes.
c) Job refusal rate. This indicator mirrors the number of graduates who, at a certain time after graduation, received job offers that they refused. It may measure higher education effectiveness inasmuch as a graduate refuses job offers that are less attractive than his or her current job. As Martini (2012) has shown, a refusal may occur because the profile of the offered job is so low that the graduate would rather stay unemployed. In addition, this indicator may measure a graduate’s propensity to attract jobs of a certain quality and may then be used to assess his or her return to education at either the athenaeum or degree programme level.
d) Graduates’ human capital. The human capital of a graduate is his or her potential for rapid and successful professional integration and for a successful social life (see also Becker 1994; Mincer 1981; Heckman 1999;

4
Blöndal et al. 2002; Lovaglio and Vittadini 2007; Hanushek and Woessmann 2008; Rindermann 2008). From an economic viewpoint, human capital is a body of knowledge, skills and attitudes that the economy requires to realise products and services and to enhance productive capability. Fabbris and Favaro (2012) have analysed three aspects of human capital that all graduates possess to varying degrees: (i) technical-specific competence (i.e., technical knowledge and know-how that are major specific), (ii) cross-occupation competence (i.e., technical competencies that are needed to perform most university graduate-level jobs) and (iii) psychological and ethical inclinations that are relevant to working. Information on the portfolio of competencies and values relevant to obtaining a job can be collected from graduates. When referring to those who are employed, it is possible to measure a correspondence between the skills achieved at university and those needed at work. Also, through surveys, the unemployed can provide information on the perceived match between education and work, but their judgements might be barely aware of the labour market needs.
e) Additional training rate. While they are looking for a job, many university graduates may enrol in courses with various content. Typically, they enrol in language, computer science or other skill-improving courses. The training that graduates add to their already-achieved higher education can be determined by either their desire to acquire further professional skills or by their sense of insecurity about the market value of their degree. Hence, additional training could be due to a lack of basic education. The rate of postuniversity training can be measured by asking graduates to report their specific experiences after achieving their degree. According to study objectives, this may or may not include on-the-job training.
f) Adequacy of professional specialisation rate. It may be that either underspecialisation or overspecialisation of achieved skills hinders a graduate’s search for a job or affects the quality of obtainable jobs. The good dose of specialised competencies achievable from attending a study programme may aid graduates both in finding a job and in career development and, in turn, may lead to a successful social life. Hence, the search for equilibrium between overspecialisation and underspecialisation may be an objective of university decision makers. Therefore, it makes sense to investigate — both before and after gaining a job — graduates’ feelings about the adequacy of their degree specialisation.
5
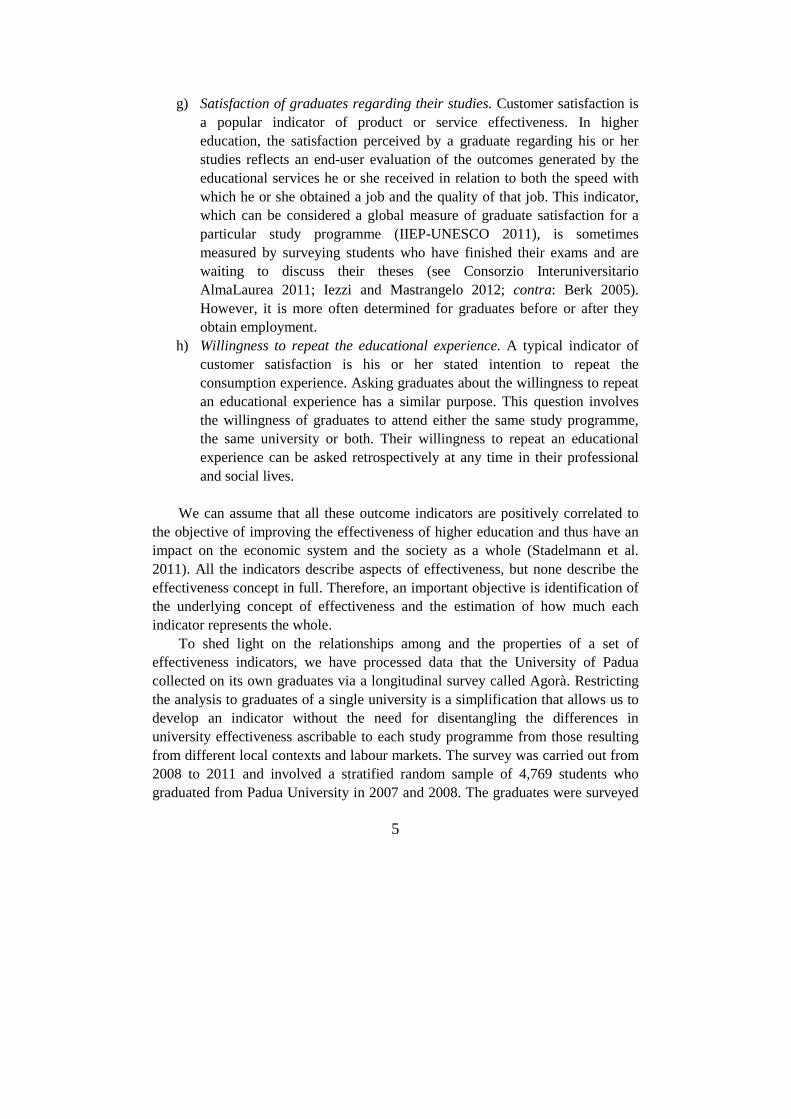
g) Satisfaction of graduates regarding their studies. Customer satisfaction is a popular indicator of product or service effectiveness. In higher education, the satisfaction perceived by a graduate regarding his or her studies reflects an end-user evaluation of the outcomes generated by the educational services he or she received in relation to both the speed with which he or she obtained a job and the quality of that job. This indicator, which can be considered a global measure of graduate satisfaction for a particular study programme (IIEP-UNESCO 2011), is sometimes measured by surveying students who have finished their exams and are waiting to discuss their theses (see Consorzio Interuniversitario AlmaLaurea 2011; Iezzi and Mastrangelo 2012; contra: Berk 2005). However, it is more often determined for graduates before or after they obtain employment.
h) Willingness to repeat the educational experience. A typical indicator of customer satisfaction is his or her stated intention to repeat the consumption experience. Asking graduates about the willingness to repeat an educational experience has a similar purpose. This question involves the willingness of graduates to attend either the same study programme, the same university or both. Their willingness to repeat an educational experience can be asked retrospectively at any time in their professional and social lives.
We can assume that all these outcome indicators are positively correlated to
the objective of improving the effectiveness of higher education and thus have an impact on the economic system and the society as a whole (Stadelmann et al. 2011). All the indicators describe aspects of effectiveness, but none describe the effectiveness concept in full. Therefore, an important objective is identification of the underlying concept of effectiveness and the estimation of how much each indicator represents the whole.
To shed light on the relationships among and the properties of a set of effectiveness indicators, we have processed data that the University of Padua collected on its own graduates via a longitudinal survey called Agorà. Restricting the analysis to graduates of a single university is a simplification that allows us to develop an indicator without the need for disentangling the differences in university effectiveness ascribable to each study programme from those resulting from different local contexts and labour markets. The survey was carried out from 2008 to 2011 and involved a stratified random sample of 4,769 students who graduated from Padua University in 2007 and 2008. The graduates were surveyed

6
at 6, 12 and 36 months after completing their university studies (for a total of 3 waves). The sample sizes for each survey were as follows: 4,544 graduates responded to the first wave; 3,392 responded to the second; and 2,855 responded to the third (for more details, see Fabbris 2010).
The list of the indicators analysed in this study and their measurement peculiarities are presented in Section 2. In Sections 3 and 4, the results of the analyses are presented, and Section 5 is the conclusion.
2. DATA AND METHODS
The indicators that we analysed are presented in Section 2.1, and the model that we used to define the final set of external effectiveness indicators of higher education programmes, institutions or systems is described in Section 2.2. How these indicators can be aggregated to define a composite indicator of effectiveness is presented in Section 2.3.
2.1. INDICATORS
We examined the following 11 indicators:
1. Employability rate, computed as the number of graduates employed, irrespective of their job status at graduation, divided by the number of graduates who were no longer studying.
2. Job-education matching rate, computed as the proportion of employed graduates who stated that their job required skills that could only be learnt at a university3.
3. Job-major matching rate, computed as the proportion of employed graduates who stated that the attended major is required for the job4.
4. Overall job consistency rate, computed in reference to graduates who were working5.
3 The question on matching was posed this way to graduates: ‘Is the university degree you achieved specifically required for your job, can your job be performed with similar results by other graduates, or would a high school degree or even a degree lower than high school suffice?’ 4 The question is constructed with the responses to the same question as the previous indicator. 5 The question on job-education consistency was posed differently in the three survey waves; in waves 1 and 2, graduates answered the question, ‘How much is your occupation consistent with your studies?’ using an ordinal scale (not at all, a little, somewhat, very

7
5. Job refusal rate, computed as the proportion of graduates who refused one or more jobs offered to them within a certain time period following graduation, regardless of whether or not they had a job.
6. Additional training rate, computed as the proportion of unemployed graduates attending one or more extra courses within a certain time period following graduation. On-the-job courses were excluded from the numerator.
7. Adequacy of professional specialisation rate, computed as the proportion of graduates stating that the level of professional specialisation they achieved at university was adequate for the job they were searching for or had gained6.
8. Mean satisfaction for achieved competence rate, computed in reference to all graduates, regardless of whether or not they had a job7.
9. Willingness to repeat the educational experience rate, computed as the number of graduates willing to repeat their educational experience if it were possible to do so8. This calculation included both employed and unemployed graduates.
10. Mean job satisfaction, computed in reference to graduates who had jobs9. 11. Overall assessment of educational experience, computed as the mean of
the responses to this evaluation question on the questionnaire that was administered at graduation10.
much), while in wave 3 they used a cardinal scale (‘On a 1 to 10 scale, where 10 is the maximum, how much is your occupation consistent with your studies?’). 6 The question on professional specialisation adequacy was posed this way to the graduates: ‘Do you feel that the degree of professional specialisation achieved at university is too high, too low, or adequate for (…)?’ The question was specified differently according to the position of graduates: for the employed, it referred to their current job; for the unemployed, to their ideal job. 7 The question on graduates’ satisfaction of the skills they achieved at university was posed this way: ‘On a 1 to 10 scale, where 10 is the maximum, are the skills you achieved at university adequate (...)?’ The question was specified differently according to the position of graduates: for the employed, it referred to their current job; for the unemployed, to the job they desired. 8 The question on willingness to repeat their educational experience was posed this way: ‘If you could go back in time, would you wish to attend the same study programme, the same faculty, the same university or none of them?’ The question was further specified by asking graduates what programme they would attend if they stated they would not repeat the experience. 9 The question on job satisfaction was posed this way: ‘On a 1 to 10 scale, where 10 is the maximum, do you feel satisfied with your current occupation?’

8
For analytical purposes, all indicators were coded so that ‘high is good’.
2.2. SELECTION OF A SUBSET OF SUITABLE INDICATORS
The appropriate units of analysis to define and evaluate university effectiveness are not graduates but rather degree programmes. The reasons for this choice are manifold: First, from a theoretical point of view, the concept of educational effectiveness applies to the delivery of a service (i.e. university teaching) and is indiscriminate to its achievers (i.e. the students). Therefore, if we look at applications of effectiveness indices, they are typically used to evaluate and rank educational programmes, institutions and national or regional systems. Moreover, considering the indicators proposed in Section 2.1, some cannot even be computed for graduates; for instance, indicators of job-education matching, job-major matching, job satisfaction and job consistency cannot be applied to the unemployed11.
We also had to solve the problem raised by asking questions in different ways to graduates who had a job and to those who did not. For example, the mean satisfaction of achieved competence and the adequacy of professional specialisation referred to the current job of the employed graduate and to an ideal job for the unemployed. This meant that the questions asked of these two subgroups were not comparable, so we only examined the data collected for these questions from the employed graduates.
The Agorà survey collected data from graduates of the 130 different study programmes offered at the University of Padua. In this study, 4 programmes were excluded because they had less than 6 responses, which resulted in a total of 126
10 The question on overall satisfaction was posed this way: ‘On a 1 to 5 scale, where 5 is the maximum, do you feel satisfied with your global university experience?’ 11 To analyse and summarise the indicators at the individual level, we initially forced the missing variables to 0 or to a minimum that was equivalent to the statement that people who do not work also do not have a consistent job or do not have a job requiring a university degree, etc. This procedure generated spurious correlations between the indicators that were either very low or artificially high. The artificially high correlations may have been due to the fact that people who do not work are forced to have analogous values on a number of other indicators. Another possibility to compute the composite indicator of effectiveness at the individual level could be to exclude from the analysis all graduates who do not work, but this shortcut would exclude employability as a dimension of higher education effectiveness.
9
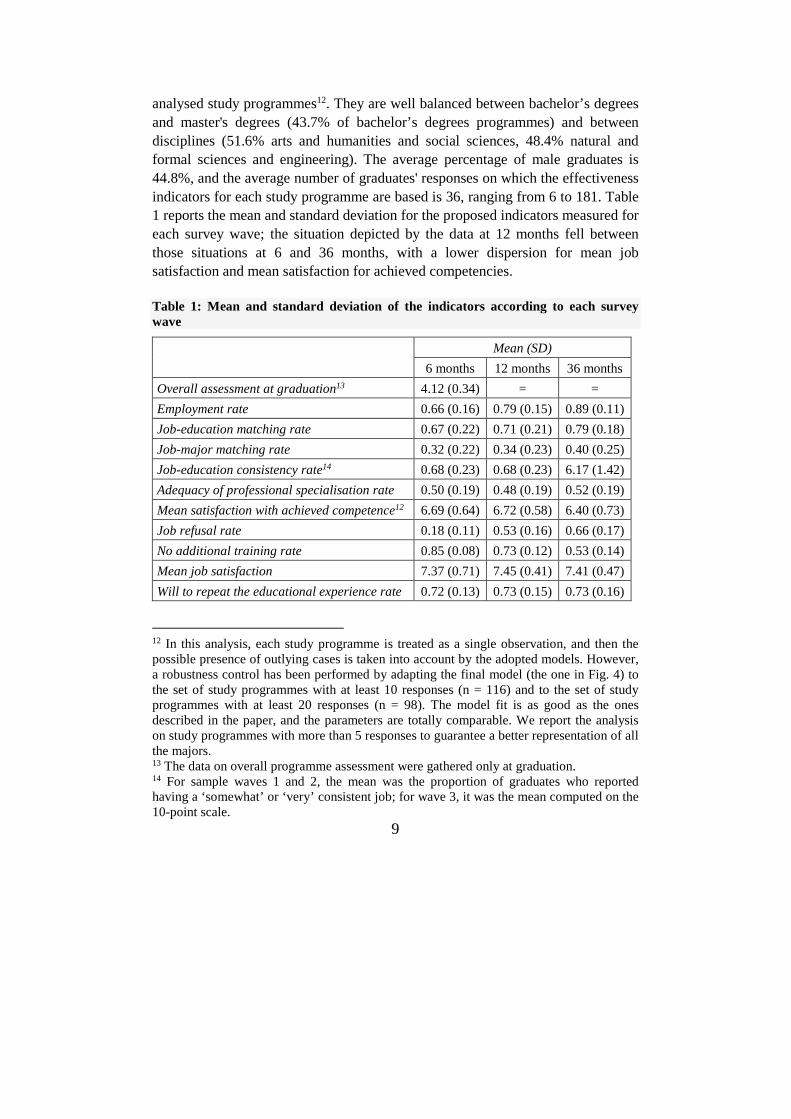
analysed study programmes12. They are well balanced between bachelor’s degrees and master's degrees (43.7% of bachelor’s degrees programmes) and between disciplines (51.6% arts and humanities and social sciences, 48.4% natural and formal sciences and engineering). The average percentage of male graduates is 44.8%, and the average number of graduates' responses on which the effectiveness indicators for each study programme are based is 36, ranging from 6 to 181. Table 1 reports the mean and standard deviation for the proposed indicators measured for each survey wave; the situation depicted by the data at 12 months fell between those situations at 6 and 36 months, with a lower dispersion for mean job satisfaction and mean satisfaction for achieved competencies.
Table 1: Mean and standard deviation of the indicators according to each survey wave
Mean (SD)
6 months 12 months 36 months
Overall assessment at graduation13 4.12 (0.34) = =
Employment rate 0.66 (0.16) 0.79 (0.15) 0.89 (0.11)
Job-education matching rate 0.67 (0.22) 0.71 (0.21) 0.79 (0.18)
Job-major matching rate 0.32 (0.22) 0.34 (0.23) 0.40 (0.25)
Job-education consistency rate14 0.68 (0.23) 0.68 (0.23) 6.17 (1.42)
Adequacy of professional specialisation rate 0.50 (0.19) 0.48 (0.19) 0.52 (0.19)
Mean satisfaction with achieved competence12 6.69 (0.64) 6.72 (0.58) 6.40 (0.73)
Job refusal rate 0.18 (0.11) 0.53 (0.16) 0.66 (0.17)
No additional training rate 0.85 (0.08) 0.73 (0.12) 0.53 (0.14)
Mean job satisfaction 7.37 (0.71) 7.45 (0.41) 7.41 (0.47)
Will to repeat the educational experience rate 0.72 (0.13) 0.73 (0.15) 0.73 (0.16)
12 In this analysis, each study programme is treated as a single observation, and then the possible presence of outlying cases is taken into account by the adopted models. However, a robustness control has been performed by adapting the final model (the one in Fig. 4) to the set of study programmes with at least 10 responses (n = 116) and to the set of study programmes with at least 20 responses (n = 98). The model fit is as good as the ones described in the paper, and the parameters are totally comparable. We report the analysis on study programmes with more than 5 responses to guarantee a better representation of all the majors. 13 The data on overall programme assessment were gathered only at graduation. 14 For sample waves 1 and 2, the mean was the proportion of graduates who reported having a ‘somewhat’ or ‘very’ consistent job; for wave 3, it was the mean computed on the 10-point scale.

10
To select the most qualified indicators, it is important to examine their
distributional dispersion and their proximity to the core of the effectiveness concept using the composite indicator as a benchmark (see also Nardo et al. 2005; Zhou and Ang 2009; Spiegelhalter et al. 2012). Thus, it is possible to determine the best time for an indicator to be measured by detecting the time at which it is least deviant from the composite indicator of effectiveness. We examined the reliability measures of the analyses conducted on the data collected for the three survey waves (6 months, 1 year and 3 years after graduation). The results are summarised in Table 2.
Table 2: Item-to-total correlation and Cronbach’s Alpha of the preliminary reliability analyses conducted on the basic indicators
6 months 12 months 36 months
Overall assessment at graduation 0.332 0.414 0.384
Employment rate 0.361 0.303 0.223
Job-education matching rate 0.705 0.674 0.770
Job-major matching rate 0.703 0.705 0.701
Job-education consistency rate 0.741 0.760 0.748
Adequacy of professional specialisation rate 0.600 0.726 0.577
Mean satisfaction with achieved competence 0.246 0.539 0.713
Job refusal rate 0.464 0.328 0.361
No additional training rate 0.075 0.177 0.271
Mean job satisfaction 0.256 0.327 0.481
Will to repeat the educational experience rate 0.573 0.488 0.378
Cronbach’s alpha 0.672 0.781 0.726
Standardised Cronbach’s alpha 0.816 0.827 0.821
Cronbach’s alpha showed higher reliability for the data collected 1 year after
graduation. The item-to-total correlations, which measure the correlation between each single indicator and the remaining set of matched indicators, showed that in all three datasets, the additional training rate15 was barely correlated to the other indicators, with a value as low as 0.075 for the data collected 6 months after graduation. Additional training was almost completely unrelated to the other 15 This indicator was formulated as the rate of graduates who attended a non-university course in the period after university graduation and until the interview, in order to be consistently oriented with the other indicators.

11
indicators, reflecting a mixture of personal choice and preference more than the general outcome of an educational path. The item-to-total correlation for the employability rate of the three observational occasions was also mild, but the employability rate is so relevant to the construction of a global effectiveness indicator that the variables were kept in the analysis even though the data suggested the existence of a separate dimension.
2.3. A COMPOSITE INDICATOR OF EFFECTIVENESS
Separate factor analyses were conducted on the three datasets to determine the main dimensions underlying the proposed elementary indicators. Here we report the results from the data collected 1 year after graduation since the reliability of these data were higher and the dimensions were clearer than the data from the other time points. However, the primary indications are analogous regardless of which wave is analysed.
The analysis of the eigenvalues suggests the existence of three main dimensions, accounting for 65.9% of the total variance. Table 3 reports the eigenvalues and the pattern matrix (i.e. the partial correlations between simple indicators and factors) after an oblique (‘Oblimin’) rotation and a Kaiser normalisation were performed16.
Table 3: Pattern matrix and eigenvalues for the three dimensions of the factor analysis performed on the simple indicators measured 1 year after graduation, after Oblimin rotation
Pattern Matrix
Factor I Factor II Factor III
Overall assessment at graduation 0.510 -0.471 0.327 Employment rate 0.249 0.626 -0.068 Job-education matching rate 0.708 0.400 0.040 Job-major matching rate 0.731 0.212 0.103 Job-education consistency rate 0.701 0.240 0.201 Adequacy of professional specialisation rate 0.785 -0.011 0.082 Mean satisfaction with university-achieved
competencies 0.890 -0.145 -0.174
Job refusal rate 0.009 0.632 0.363
16 An oblique rotation was applied because subdimensions of a common construct (i.e. effectiveness) are expected to be, at least to some extent, correlated.

12
Mean job satisfaction -0.079 0.157 0.778 Will to repeat the educational experience rate 0.156 -0.188 0.777 Eigenvalues 3.92 1.58 2.36
The first factor refers to the professional empowerment achievable by a higher
education programme; it includes the need for a general university degree and/or a specific degree/major, the consistency between one’s job and education and the adequacy of the achieved competencies and of the level of specialisation of the study programme. The second factor is the employability dimension, which incorporates the rate of job refusals. The third factor represents fulfilment and general satisfaction, including job satisfaction and student retention (e.g. the will to enrol in the same study programme if one could go back in time).
The overall assessment of the university experience expressed at graduation did not have a clear position in this architecture and was therefore excluded from further analyses.
We also excluded the job refusal rate indicator; when we looked at what happened to graduates within the first year after graduation (i.e. both in the first and second survey waves), the rate of job refusals was connected to the employability rate since most refusals came from graduates who had already gained a position (Martini 2012). However, the data collected in the third wave showed a lower correlation, indicating that the far-from-graduation refusal events were affected by individual factors rather than employability. Thus, the short-term refusal rate showed merely a time-specific affinity with the employability dimension.
3. WEIGHTS FOR A COMPOSITE INDICATOR
In light of our preliminary analyses, it can be hypothesised that three correlated latent traits exist: professional empowerment, employability and personal fulfilment.
To account for the different dynamics of the graduates’ entry into the labour force, and to avoid the employment rate indicator being the only indicator for the employability dimension, we considered the rates of employment at 6 months (emp06), 1 year (emp1) and 3 years (emp3) after graduation. Cronbach’s alpha was 0.798 (standardised as 0.793).
Analogously, in the fulfilment dimension, we included the openness to repeat the educational experience at 6 months (rep06), 1 year (rep1) and 3 years (rep3) after graduation as well as job satisfaction at 1 (jsat1) and 3 years

13
(jsat3) after graduation. We did not consider job satisfaction 6 months after graduation for two reasons: First, since the employment rate at 6 months post graduation is only 66% (and as low as 9% for law degree programmes), most data on the employed could be affected by personal situations, especially for some study programmes. This is probably why the reliability of measures referring to 6 months after graduation is low. Second, in the preliminary factor analysis conducted separately for each wave, job satisfaction at 6 months did not correlate with the openness to repeat the educational experience, but it did correlate with the professional empowerment dimension.
Cronbach’s alpha for the fulfilment dimension was quite low (0.600), but the means and variances of job satisfaction and openness to repeat were totally different. Therefore, a standardised version of Cronbach’s alpha (equalling 0.786) was considered to be more appropriate.
Professional empowerment was constructed with indicators pertaining to jobs that require higher qualifications (deg1) or a particular degree (hdeg1), job-major consistency (cons1) and satisfaction of the achieved competencies (comp1)17, all at 1 year after graduation (Cronbach’s alpha = 0.740; standardised alpha = 0.865).
The decision to include only data collected 1 year after graduation was based on theoretical and empirical considerations: the professional improvement indicators were more consistent and reliable in reference to data collected in this survey wave, thus suggesting that there is a ‘right time’ when graduates can most accurately evaluate their educational returns because they have sufficient knowledge of the labour market and a vivid enough memory of their university experience. Moreover, when we tried to introduce one or more work-related indicators surveyed at either 6 months or 3 years after graduation into the measurement model, all the fit indices worsened dramatically.
Table 4 reports the correlation coefficients between the selected indicators and their significance levels. We observed that the indicators of professional empowerment were correlated with almost all the other indicators, while the employability and fulfilment indicators tended to correlate mainly, if not only, with the indicators that belonged to the same dimension.
We validated the measurement model described above using structural equation modelling (Jöreskog and Sörbom 1979); we obtained our parameter
17 The graduates’ specialisation rate was excluded from our analysis because it correlated so strongly with graduates’ satisfaction of their achieved competencies and for their gained job that the measurement model did not fit the data (the modification indices equalled 14.96 and 11.06, respectively).

14
estimates using Lisrel 8.7 (Jöreskog and Sörbom 2004). Since the basic indicators were measured on a quantitative scale and their distribution was non-normal, we applied a robust maximum likelihood method (Browne 1987) and the Satorra–Bentler scaled Chi-square (Satorra and Bentler 1988; Jöreskog et al. 2001).
Our conjectured measurement model is presented in Figure 2. The Satorra–Bentler scaled Chi-square was 33.20 (p = 0.97), indicating that the measurement model fit the data very well. All the other indices also indicated an extremely good fit (RMSEA < 0.0001; 90% RMSEA C.I. = [0.0 ; 0.0]; probability of close fit = 0.85; SRMR = 0.063; GFI = 0.93; AGFI = 0.90; CFI = 1.00; NFI = 0.97; Hoelter’s critical N = 299)18.
Fig. 2 here
Fig. 2 Measurement model for the three dimensions of university effectiveness We found that the three dimensions were significantly intercorrelated. We
assessed the discriminant validity by testing whether the 95% confidence interval did not include the value 1 and by comparing the nested models with and without restrictions on single correlations (Anderson and Gerbing 1988). Both procedures confirmed discriminant validity. The most correlated constructs were fulfilment and professional empowerment, whereas employability was only moderately correlated to the other two dimensions. All the factor loadings were significant at the 95% level; those on job satisfaction, however, were below the 0.5 threshold, which, as suggested by Nunally (1978), indicates that the fulfilment dimension is determined essentially by the ‘willingness to repeat the experience’ indicators.
In fact, we found that if the job satisfaction indicators were omitted, a model with equal or better fit was obtained19. The factor loadings and the correlations were the same (the larger difference a size of 0.01). Hence, job satisfaction cannot be considered a meaningful and adequate indicator of fulfilment because it does not add information to what is already covered by the willingness-to-repeat items.
The second-order model, represented in Figure 3, was assessed on a reduced number of simple indicators (i.e. after excluding the job satisfaction items). The fit
18 An RMSEA below 0.06 and SRMR below 0.08, as well as an NFI and CFI above 0.95, indicate a good fit (Hu and Bentler 1999); for the GFI and AGFI, values of 0.90 or greater are recommended (Hooper et al. 2008); a critical N of 200 or larger indicates a satisfactory fit (Hoelter 1983). 19 The Satorra–Bentler scaled Chi-square was 17.23 (p-value = 0.98; RMSEA < 0.0001; 90% RMSEA C.I. = [0.0 ; 0.0]; probability of close fit = 0.94; SRMR = 0.048; GFI = 0.96; AGFI = 0.93; CFI = 1.00; NFI = 0.97; and Hoelter’s critical N = 398).

15
measures had a very good fit20, confirming the existence of an underlying common trait, namely university effectiveness. It should be noted that university effectiveness is mainly determined by the self-perception of professional empowerment and only marginally by employability.
Fig. 3 here
Fig. 3 Second-order model for the university effectiveness construct and its subdimensions
As previously described, we reduced the original 31 measures21 of effectiveness to 10, though some redundancies remained. For the employability dimension, the indicator measured 3 years after graduation could be removed with no harm since the employment rate was quite high and homogeneous for all majors/courses of study. This reduction slightly increased the weight of the employability dimension on the global latent variable of effectiveness (see Figure 4). Similarly, the three indicators of fulfilment were, to some extent, redundant; therefore, we removed the intermediate observation to take into account the short- and long-term evaluations. Finally, regarding the professional empowerment dimension, the loading for the average satisfaction with the achieved competencies was lower and therefore eliminated. The ‘reduced’ model is shown in Figure 4, and its fit indices suggest a very good fit22. The contribution of the three dimensions is much more balanced than in the model in Figure 3, and the loadings are homogeneous. However, the number of indicators for each subdimension is so limited that this solution cannot be generally recommended until its robustness can be further assessed.
Fig. 4 here
Fig. 4 Reduced version of the second-order model for the university effectiveness construct and its subdimensions
20 All the fit measures listed in footnote 18 for the first-order measurement model without the job satisfaction items were exactly the same for the second-order model (at least at the precision level reported here). 21 Ten indices, each measured at three time points, and one measured at graduation, as reported in Section 2.1 and in Table 1. 22 The Satorra–Bentler scaled Chi-square was 5.65 (p-value = 0.90; RMSEA < 0.0001; 90% RMSEA C.I. = [0.00 ; 0.04]; probability of close fit = 0.875; SRMR = 0.021; GFI = 0.98; AGFI = 0.955; CFI = 1.00; NFI = 0.99; Hoelter’s critical N = 561).

16
Table 4: Correlation coefficients between indicators of educational effectiveness for graduates of Padua University
Indicators emp06 emp1 emp3 rep06 rep1 rep3 jsat1 jsat3 deg1 hdeg1 comp1 cons1
emp06 1.000
emp1 0.787** 1.000
emp3 0.409** 0.485** 1.000
rep06 0.212* 0.193* 0.106 1.000
rep1 0.156 0.094 0.119 0.818** 1.000
rep3 0.131 0.114 0.111 0.662** 0.706** 1.000
jsat1 0.147 0.164 0.261** 0.275** 0.364** 0.366** 1.000
jsat3 0.283** 0.275** 0.022 0.312** 0.273** 0.214* 0.245** 1.000
deg1 0.278** 0.320** 0.062 0.409** 0.304** 0.321** 0.257** 0.300** 1.000
hdeg1 0.319** 0.244** 0.106 0.447** 0.342** 0.368** 0.353** 0.309** 0.755** 1.000
comp1 0.192* 0.182* -0.034 0.381** 0.279** 0.359** 0.107 0.258** 0.453** 0.483** 1.000
cons1 0.280** 0.259** 0.073 0.409** 0.407** 0.374** 0.361** 0.287** 0.757** 0.727** 0.517** 1.000
** p-value < 0.01; *p-value < 0.05

17
4. DISCUSSION
The main finding of our analyses presented in Section 3 is that the educational effectiveness construct is multidimensional. The underlying common dimension is external effectiveness, but there are distinct subdimensions — employability, professional empowerment and personal fulfilment — that cannot be ignored. Hence, the habit of only using employability as a measure of external effectiveness provides a limited picture of university outcomes.
The relationship between university and the labour market plays a crucial role in the definition of subdimensions of effectiveness. In addition to employability, one should also take the potential for skill improvement and the marketability of degree programmes into account. Nonetheless, the labour market is not the only reference frame since graduates consider personal fulfilment to be a relevant dimension of their investments in higher education. It is worth noting that Mainardes et al. (2012) identified the labour market and personal fulfilment as the two main dimensions of expectations of students enrolled at 11 Portuguese universities. Although the third dimension identified by these authors — the level of academic effort — does not apply to graduates and cannot be related to external effectiveness, there is a clear parallelism between students’ expectations and graduates’ experiences.
Some of the examined indicators turned out to be inadequate as measures of university effectiveness. The additional training rate, for example, cannot be considered an adequate measure because postgraduation training course rates do not distinguish between graduates who attend courses because they feel their degrees are not enough marketable and those who have personal interests in learning new things.
In addition, the role of the job refusal rate is controversial since these refusals may be due to already having attained a position, but they may also be an effect of a wide and untargeted job search as well as the consequence of personality traits and subjective evaluations on the adequacy of the job offers (Martini 2012).
Other indicators have proved to be correlated to university effectiveness but did not fit adequately into the emerging dimensions, such as the overall assessment of the study programme expressed by students at graduation, or they were overly correlated with the other indicators, such as the rate of graduates who considered their specialisation level to be adequate.
Average job satisfaction, which was initially included as an indicator of the personal fulfilment dimension, was also removed from the model because job satisfaction incorporates subjective evaluations and different expectations.

18
Moreover, job satisfaction might be affected, at least to some extent, by personality traits (see, among others, Judge at al. 2002; Furnham et al. 2002).
The right time for collecting relevant data on educational outcomes is another important issue. Our analyses have shown that 1 year after graduation is the most suitable of the examined time points: The 1-year indicators were less dispersed than those constructed with data collected 6 months or 3 years after graduation. In fact, at 6 months, the graduates’ views were still dominated by their university attitudes, and the rate of employed graduates varied substantially among majors and individual life stories, making the measures unreliable. On the other side, at 3 years, the graduates’ work experiences, together with personal endowments and social life, were more dominant in determining the quality and quantity of their used skills and career acknowledgment.
However, the best time to survey data to build a composite indicator cannot be determined in absolute terms. For instance, any change in labour market dynamics could result in a change in the optimal time to survey data. Moreover, the right time might be different for different subgroups of graduates. For example, for law and psychology graduates, these data were collected at 18, 24 and 36 months after graduation to limit the effect of mandatory professional traineeships.
The optimal time for data collection may also differ according to the various indicators. For example, data collected 1 year after graduation are useful for measuring the skills empowerment dimension, while the employability and personal fulfilment dimensions can be enriched by using all the available survey waves.
5. CONCLUSIONS AND CONSIDERATIONS
This work has focussed on a basket of various indicators of the external effectiveness of higher education with the purpose of determining the most relevant among the reliable indicators. Relevance was based on university graduates’ views, who were the higher education stakeholders easiest to survey to measure external effectiveness. The unit of analysis of the indicators was degree programmes.
The results would have been much more relevant if applied to universities located in different countries or, at least, in different geographical areas of the country, given the diversities encountered in different labour markets and local contexts. At this stage of the study, the main purpose was to define a number of subdimensions of the university effectiveness construct and a set of possible indicators for each dimension. Nevertheless, a future prospect of the study should
19
involve more universities, assess the invariance of the main findings across different regions or countries and find a way to guarantee the comparability of the indicators (especially those based on the job experience) when measured in non-homogeneous labour markets.
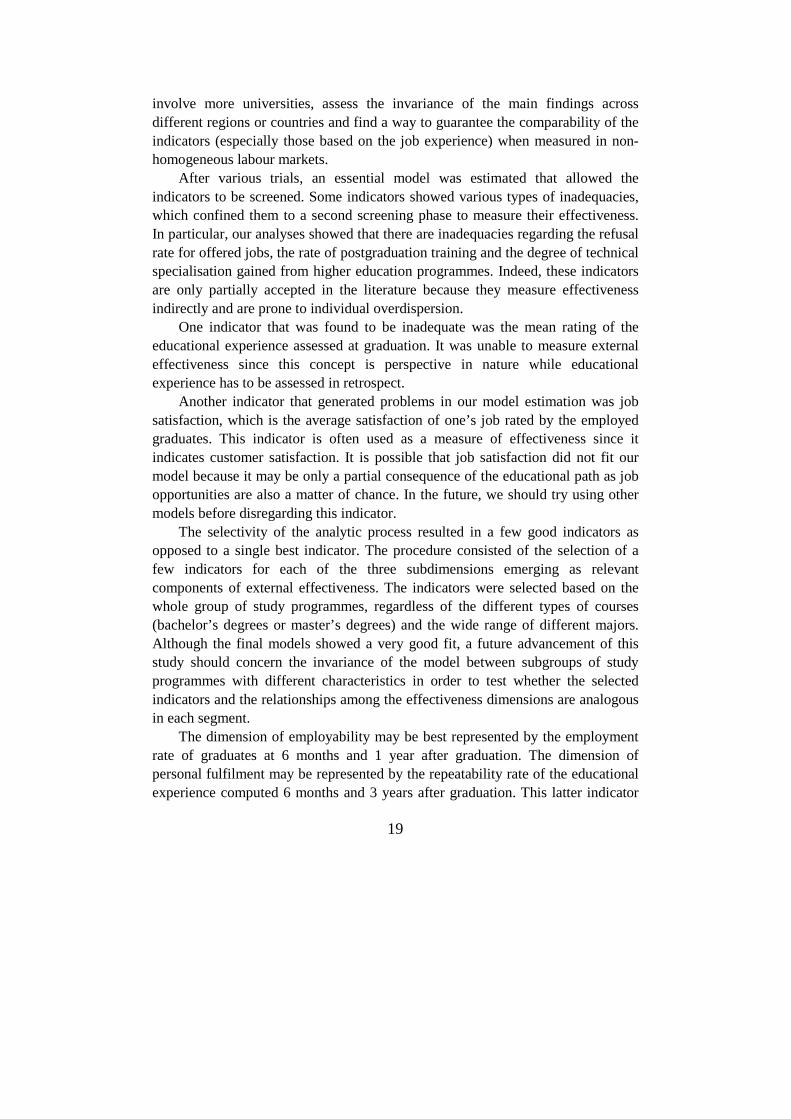
After various trials, an essential model was estimated that allowed the indicators to be screened. Some indicators showed various types of inadequacies, which confined them to a second screening phase to measure their effectiveness. In particular, our analyses showed that there are inadequacies regarding the refusal rate for offered jobs, the rate of postgraduation training and the degree of technical specialisation gained from higher education programmes. Indeed, these indicators are only partially accepted in the literature because they measure effectiveness indirectly and are prone to individual overdispersion.
One indicator that was found to be inadequate was the mean rating of the educational experience assessed at graduation. It was unable to measure external effectiveness since this concept is perspective in nature while educational experience has to be assessed in retrospect.
Another indicator that generated problems in our model estimation was job satisfaction, which is the average satisfaction of one’s job rated by the employed graduates. This indicator is often used as a measure of effectiveness since it indicates customer satisfaction. It is possible that job satisfaction did not fit our model because it may be only a partial consequence of the educational path as job opportunities are also a matter of chance. In the future, we should try using other models before disregarding this indicator.
The selectivity of the analytic process resulted in a few good indicators as opposed to a single best indicator. The procedure consisted of the selection of a few indicators for each of the three subdimensions emerging as relevant components of external effectiveness. The indicators were selected based on the whole group of study programmes, regardless of the different types of courses (bachelor’s degrees or master’s degrees) and the wide range of different majors. Although the final models showed a very good fit, a future advancement of this study should concern the invariance of the model between subgroups of study programmes with different characteristics in order to test whether the selected indicators and the relationships among the effectiveness dimensions are analogous in each segment.
The dimension of employability may be best represented by the employment rate of graduates at 6 months and 1 year after graduation. The dimension of personal fulfilment may be represented by the repeatability rate of the educational experience computed 6 months and 3 years after graduation. This latter indicator

20
does not require graduates to be employed. On the other hand, the dimension of professional empowerment may be represented by the rates of job-major (perceived) consistency and graduates’ average satisfaction of the competencies they gained at university. The optimum measurement time is about 1 year after graduation. The responses obtained to the question ‘ Is the university degree you achieved specifically required for your job, can your job be performed with similar results by other graduates or would a high school degree or even a title lower than high school suffice?’ showed high importance for the definition of professional empowerment. Moreover, it can help determine if a gained job is a ‘university graduate-level job’.
Among the dimensions of university effectiveness obtained through our analyses, personal fulfilment highlights the ‘stakeholder sensitivity’ for any definition of effectiveness, meaning that the definition of external effectiveness and, consequently, the relevance of each subdimension and simple indicator might vary according to the perspective of different categories of stakeholders.
This draws attention to the main limitation of our approach. All the indicators came from surveys administered to recent university graduates, who only expressed their experiences. However, graduates are only one possible informant for university effectiveness. It is easy to expect different results from different classes of stakeholders; that is, different subdimensions of effectiveness and different relationships among the indicators. Moreover, only data collected at 6, 12 and 36 months after graduation were available, preventing inclusion of the possible effect of long-term returns on the university effectiveness indicator.
These considerations raise the need for further surveys to collect data several years after graduation and for alternative categories of stakeholders (e.g. employers, university delegates, policymakers, students’ parents or other social representatives) to look for new and/or different dimensions of external effectiveness and to gather suggestions of alternate or additional simple indicators. Moreover, a comparison of different time perspectives and different points of view would highlight the common denominator and the specificities of the definition of effectiveness among various categories of stakeholders. ACKNOWLEDGMENTS This work was pursued as part of two projects: (1) PRIN 2007 (CUP C91J11002460001) ‘Models, indicators and methods for the analysis of the educational effectiveness of a university study programme with the purpose of its accreditation and improvement’, jointly funded by the Ministry of Education and the University of Padua, and (2) a 2008 project of Padua University (CUP CPDA081538) titled ‘Effectiveness indicators of tertiary education and methodological outcomes of the research on University of Padua graduates’,

21
both coordinated by L. Fabbris. The authors share the responsibility of the whole paper; L. Fabbris edited Sections 1, 2.1 and 5, and M.C. Martini edited all other sections.
REFERENCES
Anderson, J.C. and Gerbing, D.W. (1988) Structural equation modelling in practice: A review and recommended two-step approach. Psychological Bulletin, 103(3): 411-423.
Astin, A. (1993) What Matters in College, Jossey-Bass, San Francisco.
Aubyn, M.S., Pina, A., Garcia, F. and Pais, J. (2009) Study on the Efficiency and Effectiveness of Public Spending on Tertiary Education, European Economy, European Commission, Economic and Financial Affairs, Brussels.
Australian Government (2011) Review of the Report on Government Services’ Performance Indicator Framework: Report to the Steering Committee for the Review of Government Service Provision (http://www.pc.gov.au/__data/assets/ pdf_file/0006/102957/independent-reference-group-report.pdf)
Becker, G.S. (1994) Human Capital: A Theoretical and Empirical Analysis with Special Reference to Education, The University of Chicago Press, Chicago, IL.
Berk, R.A. (2005) Survey of 12 strategies to measure teaching effectiveness, International Journal of Teaching and Learning in Higher Education, 17(1): 48-62.
Biggeri, L., Bini, M., Grilli, L. (2001) The transition from university to work: a multilevel approach to the analysis of the time to obtain the first job. Journal of the Royal Statistical Society, Ser. A, 164: 293-305.
Bird, S.M., Cox, D., Farewell, V.T., Goldstein, H., Holt, T. and Smith, P.C. (2005) Performance indicators: Good, bad, and ugly, Journal of the Royal Statistical Society, Series A, 168(1): 1-27.
Blöndal, S., Field, S. and Girouard, N. (2002) Investment in Human Capital through Upper-Secondary and Tertiary Education, OECD Economic Studies, No. 34, OECD, Paris.
Boccuzzo, G. and Paggiaro, A. (2012) Facets of graduates’ job satisfaction, in: Fabbris, L. (ed) Indicators of Higher Education Effectiveness, McGraw-Hill Education, Milan: 133-146.
Bockstaller, C. and Girardin, P. (2003) How to validate environmental indicators, Agricultural Systems, 76: 639-653.
Bratti M., McKnight, A., Naylor, R., Smith, J. (2004) Higher education outcomes, graduate employment and university performance indicators. Journal of the Royal Statistical Society, Ser. A, 167: 475-496.
Browne, M.W. (1987) Robustness in statistical inference in factor analysis and related model. Biometrika, 74: 375-384.
Cainarca, G.C. and Sgobbi, F. (2012) The return to education and skills in Italy, International Journal of Manpower, 33(2): 187-205.

22
Cammelli, A. and Gasperoni, G. (2012) Higher education external effectiveness indicators with reference to Italian universities, in: Fabbris, L. (ed) Indicators of Higher Education Effectiveness, McGraw-Hill Education, Milan: 171-182.
Chalmers, D. (2008) Defining Quality Indicators in the Context of Quality Models. Australian Learning and Teaching Council, Strawberry Hills, NSW, Australia.
Chee Tahir, A. and Darton, R.C. (2010) The process analysis method of selection indicators to quantify the sustainability performance of a business operation, Journal of Cleaner Production, 18: 1598-1607.
Consorzio Interuniversitario AlmaLaurea (2011) XII Profilo dei laureati italiani. L’istruzione universitaria nell'ultimo decennio: All’esordio dell’European Higher Education Area, Il Mulino, Bologna.
Cowan, J. (1985) Effectiveness and efficiency in higher education, Higher Education, 14(3): 235-239.
Daly, M.C., Büchel, F. and Duncan, G.J. (2000) Premiums and penalties for over- and undereducation: Cross-time and cross-national comparisons in the United States and Germany, Economics of Education Review, 19(2): 169-178.
Dey, E.L., Wimsatt, L.A., Rhee, B.S., Meader, E.W. (1999) Long-term effect of college quality on the occupational status of students, National Center for Postsecondary Improvement, Stanford University, Technical Report Number 5-06.
Draper, D. and Gittoes, M. (2004) Statistical analysis of performance indicators in UK higher education (with discussion). Journal of the Royal Statistical Society, Series A, 167: 449-474.
EU-RA – European Research Association (2006) Key Education Indicators on Social Inclusion and Efficiency, Final Project Report, European Commission, Education and Culture DG, Brussels.
Fabbris, L. (2010) Il Progetto Agorà dell’Università di Padova, in: Fabbris, L. (ed) Dal Bo’ all’Agorà, il capitale umano investito nel lavoro, Cleup, Padova: V-XLVI.
Fabbris, L. (2012) Concepts, dimensions and indicators for measuring higher education effectiveness, in: Fabbris, L. (ed) Indicators of Higher Education Effectiveness, McGraw-Hill Education, Milan: 1-20.
Fabbris, L. and Favaro, D. (2012) Graduates’ human capital: An outcome in itself or an instrument for achieving outcomes? in: Fabbris, L. (ed) Indicators of Higher Education Effectiveness, McGraw-Hill Education, Milan: 61-74.
Finnie, R. and Usher, A. (2005) Measuring the Quality of Post-Secondary Education: Concepts, Current Practices and a Strategic Plan, CPRN-RCRPP, Canada
Furnham, A., Petrides, K.V., Jackson, C.J. and Cotter, T. (2002) Do personality factors predict job satisfaction? Personality and Individual Differences, 33: 1325-1342.
Garcìa-Aracil, A. and Palomares-Montero, D. (2009) Examining benchmark indicator systems for the evaluation of higher education institutions, Higher Education, 60(2): 217-234.
Gibbs, G. (2010) Dimensions of Quality, The Higher Education Academy, Heslington, UK.

23
Groot, W. and Maassen van den Brink, H. (2000) Overeducation in the labour market:
A meta-analysis, Economics of Education Review, 19(2): 149-158.
Hanushek, E.R. (1979) Conceptual and empirical issues in the estimation of educational production functions, Journal of Human Resources, 14: 351-388.
Hanushek, E.R. and Woessmann, L. (2008) The role of cognitive skills in economic development, Journal of Economic Literature, 46: 607-668.
Hartog, J. (2000) Over-education and earnings: Where are we, where should we go? , Economics of Education Review, 19(2): 131-147.
Heckman, J.J. (1999) Policies to Foster Human Capital, Discussion paper No. 7288,
National Bureau of Economic Research, New York.
Hoelter, D.R. (1983) The analysis of covariance structures: Goodness-of-fit indices. Sociological Methods and Research, 11: 325-344.
Hooper, D., Coughlan, J. and Mullen, M.R. (2008) Structural equation modelling: Guidelines for determining model fit, The Electronic Journal of Business Research Methods, 6(1): 53-60.
Hu, L. and Bentler, P.M. (1999) Cutoff criteria for fit indexes in covariance structure analysis: Conventional criteria versus new alternatives, Structural Equation Modeling, 6(1), 1-55.
Iezzi, D.F. and Mastrangelo, M. (2012) Final-year students’ study satisfaction as a measure of educational effectiveness, in: Fabbris, L. (ed) Indicators of Higher Education Effectiveness, McGraw-Hill Education, Milan: 21-34.
IIEP-UNESCO (2011) External Quality Assurance: Options for Higher Education Managers, Module 4: Understanding and Assessing Quality, UNESCO-IIEP (International Institute for Educational Planning), Paris (www.iiep.unesco.org).
Istat (2009) I laureati e lo studio. Inserimento professionale dei laureati. Indagine 2007, Istat, Roma.
Jöreskog, K.G. and Sörbom, D. (eds) (1979) Advances in Factor Analysis and Structural Equation Models. Abt Books, Cambridge.
Jöreskog, K.G. and Sörbom, D. (2004) Lisrel 8.7 for Windows. Scientific Software International, Inc., Lincolnwood, IL.
Jöreskog, K.G., Sörbom, D., Du Toit, S.H.C. and Du Toit, M. (2001) Lisrel 8: New Statistical Features (Third Printing with Revisions), Scientific Software International, Inc., Lincolnwood, IL.
Judge, T.A., Heller, D. and Mount, M.K. (2002) Five-factor model of personality and job satisfaction: A meta-analysis, Journal of Applied Psychology, 87: 530-541.
Land, K.C. (1975) Theories, models and indicators of social change, International Social Science Journal, XXVII(1) : 7-37.
Lockheed, M.E. and Hanushek E.A. (1994) Concepts of Educational Efficiency and Effectiveness, Human Resources Development and Operations Policy, HRO Working Paper 24.
Lovaglio, P.G. and Vittadini, G. (2007) Human capital growth for university education evaluation, in: Fabbris, L. (ed) Effectiveness of University Education in Italy:
24
Employability, Competences, Human Capital, Physica-Verlag, Heidelberg-Berlin: 357-368.
Lucarelli, C., Ungaro, P. and Verzicco L. (2012) Employment rate as a measure of educational return, in: Fabbris, L. (ed) Indicators of Higher Education Effectiveness, McGraw-Hill Education, Milan: 35-48.
Mainardes, E.W., Raposo, M. and Alves, H. (2012) Public university students’ expectations: An empirical study based on the stakeholders theory, Transylvanian Review of Administrative Sciences, 35: 173-196.
Martini, M.C. (2012) The refusal of offered jobs, in: Fabbris, L. (ed) Indicators of Higher Education Effectiveness, McGraw-Hill, Milano: 49-60.
McGuinness, S. (2006) Overeducation in the labour market, Journal of Economic Surveys, 20: 387-418.
McKee-Ryan, F.M. and Harvey, J. (2011) ‘I have a job, but..’: A review of underemployment, Journal of Management, 37(4): 962-996.
Mincer, J. (1981) Human Capital and Economic Growth, NBER Working Paper Series, No. 803.
Nardo, M., Saisana, M., Saltelli, A. and Tarantola, S. (2005) Handbook on Constructing Composite Indicators: Methodology and User Guide, OECD Statistics Working Paper, STD/DOC(2005)3 (http://www.oecd.org/std/research)
Nguyen, A.N., Taylor, J. (2003) Transition from school to first job: the influence of educational attainment. Lancaster University Management School, Working paper 2003/009.
Nunally, J.C. (1978) Psychometric Theory, McGraw-Hill Book Company, New York, NY.
Palomares-Montero, D. and Garcìa-Aracil, A. (2011) What are the key indicators for evaluating the activities of universities? Research Evaluation, 20(5): 353-363.
Pascarella, E.T. and Terenzini, P. (2005) How College Affects Students: A Third Decade of Research, Volume 2, Jossey-Bass, San Francisco, CA.
Quintini, G. (2011) Over-Qualified or Under-Skilled: A Review of Existing Literature, OECD Social Employment and Migration Working Papers, No. 121, OECD Publishing.
Rindermann, H. (2008) Relevance of education and intelligence at the national level for the economic welfare of people, Intelligence, 36: 127-142.
Satorra, A. and Bentler, P.M. (1988) Scaling corrections for chi-square statistics in covariance structure analysis, Proceedings of the Business and Economic Statistics Section of the American Statistical Association: 308-313.
Scheerens, J. and Bosker, R.J. (1997) The Foundations of Educational Effectiveness, Elsevier Science Ltd., Oxford.
Sicherman, N. and Galor, O (1990) A theory of career mobility, The Journal of Political Economy, 98(1): 169-192.
Sloane, P.J. (2003) Much ado about nothing? What does the over-education literature really tell us? in: Büchel, F., de Grip, A. and Mertens, A. (eds) Overeducation in Europe: Current Issues in Theory and Policy, Edward Elgar, Chelterham: 11-48.

25
Spiegelhalter, D.J., Sherlaw-Johnson, C., Bardsley, M., Blunt, I., Wood, C. and Grigg, O. (2012) Statistical methods for healthcare regulation: Rating, screening and surveillance, Journal of the Royal Statistical Society, Series A, 179(1): 1-25.
Stadelmann, M., Michaelowa, A., Butzengeiger-Geyer, S. and Köhler, M. (2011) Universal Metrics to Compare the Effectiveness of Climate Change Adaptation Projects, Center for Comparative and International Studies, University of Zurich.
Stern, J.D. (1986) The Educational Indicators Project at the U.S. Department of Education, Center for Statistics, U.S. Department of Education.
UN – United Nations (1975) Towards a System of Social and Demographic Statistics, Studies in Methods F-18, Department of Social and Economic Affairs, United Nations, Geneva.
UNDP – United Nations Development Program (2007) Evaluation of Results Based Management at UNDP, United Nations Development Program, Evaluation Office, New York.
UNDP – United Nations Development Program (2010) Results Based Management Handbook: Strengthening RBM Harmonization for Improved Development Results, United Nations Development Group, New York.
UNESCO (1974) Social Indicators: Problems of Definition and of Selection, Reports and Papers in the Social Sciences No. 30, UNESCO, Paris.
Verhaest, D. and Omey, E. (2009) Objective over-education and worker well-being: A shadow price approach, Journal of Economic Psychology, 30: 469-481.
Zhou, P. and Ang, B.W. (2009) Comparing MCDA aggregation methods in constructing composite indicators using the Shannon-Spearman measure, Social Indicators Research, 94(1): 83-96.