Embed Size (px)
Citation preview

Better Performance through Better Project Management
ACEC Indiana – Engineering Leadership Program February 14, 2018 Presented by: Brad Wilson, PSMJ Resources

Traits of the Best Project Manager You Know?

Traits of the Best PMs as Defined by a Major Client
1. Follows through On his/her commitments On others’ commitments
2. Good listener
3. Proactive
4. On top of every aspect of
the job
5. Leads by example
6. Good communicator
7. Backs decisions of team members
8. Organized
9. Handles multiple priorities well
10. Technically proficient
11. Holds people accountable
12. Delegates well

The Most Successful PMs
Manages the proposal effort Little involvement in marketing
Prepares the fee budget Gets fee budgets from others
Participates in fee negotiation Accepts whatever is negotiated
Participates in team selection Relies on dept. heads for staffing
Gets non-performers removed Blames dept. heads for poor performers
Controls technical direction Delegates tech. matters to dept. heads
Controls budget & schedule Monitors budget & schedule
Maintains rapport with client Reports status to client
Directs fee collection efforts Lets accounting handle collections
Accountable for success or failure Keeps records of who is responsible
Strong Project Manager Project Administrator
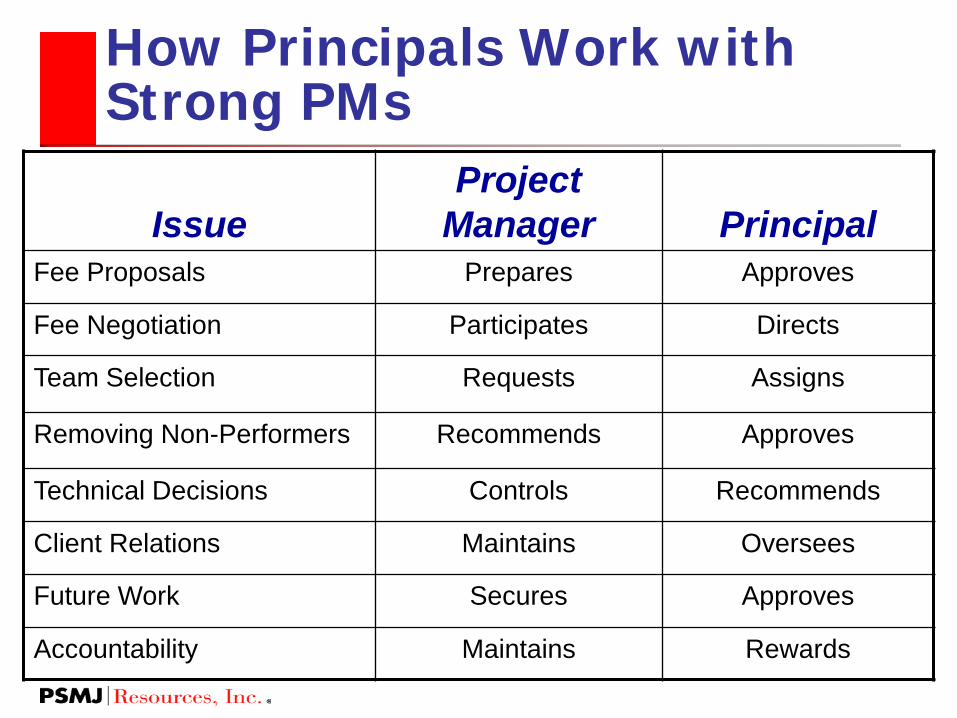
How Principals Work with Strong PMs
Issue Project
Manager Principal Fee Proposals Prepares Approves
Fee Negotiation Participates Directs
Team Selection Requests Assigns
Removing Non-Performers Recommends Approves
Technical Decisions Controls Recommends
Client Relations Maintains Oversees
Future Work Secures Approves
Accountability Maintains Rewards

Roles of the Project Manager Traditional Roles 1. Planning 2. Organizing 3. Directing 4. Controlling 5. Technical
Marketing Roles 1. Expand the Scope of Work 2. Get the Client Back 3. Actively Secure Referrals 4. Close the Deal 5. Sell All Your Firm’s Services 6. Passive Marketing/Client Touches 7. IFBP
Financial Roles 8. Earn the Profit 9. Bill the Client 10. Secure Payment

Project Manager Sins 4. Letting the job get into trouble
3. Not knowing it’s in trouble
2. Knowing it’s in trouble and not asking for help
1. Hiding the fact that it’s in trouble
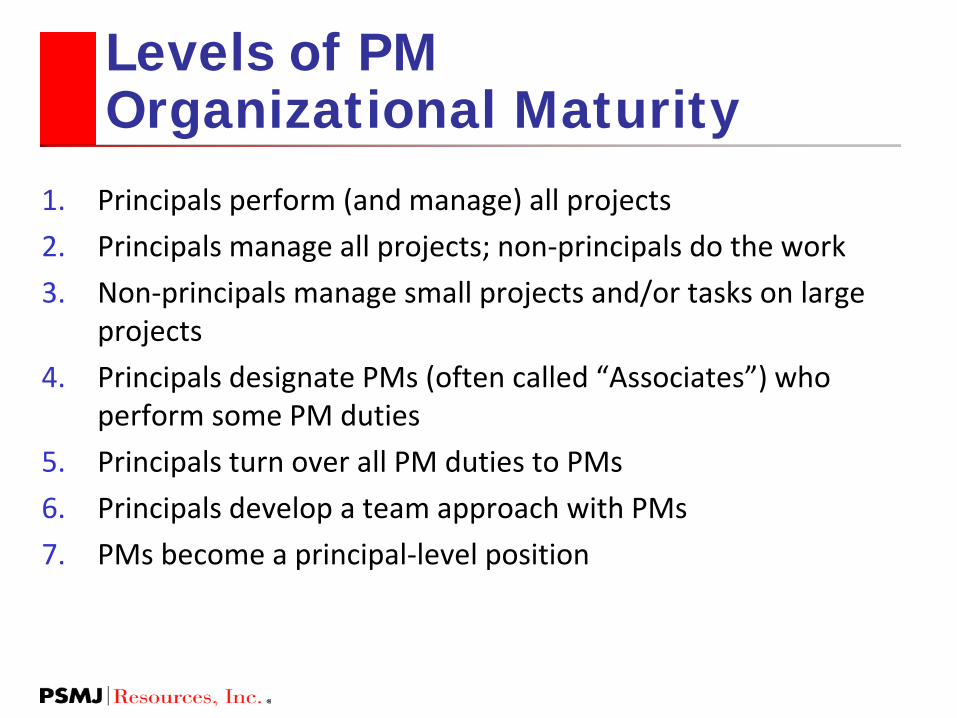
Levels of PM Organizational Maturity
1. Principals perform (and manage) all projects 2. Principals manage all projects; non-principals do the work 3. Non-principals manage small projects and/or tasks on large
projects 4. Principals designate PMs (often called “Associates”) who
perform some PM duties 5. Principals turn over all PM duties to PMs 6. Principals develop a team approach with PMs 7. PMs become a principal-level position

PSMJ’s Top 20 Excuses for Project Failure
1. The project team was full of incompetents.
2. I didn’t have enough time. 3. The client kept making changes. 4. The budget was unrealistic. 5. I couldn’t get enough help. 6. Working for that client is impossible! 7. I couldn’t get the information I needed
from accounting. 8. The schedule was unrealistic. 9. Everyone kept charging to the job. 10. _____ was taken off the job at the
worst possible time.
11. I wasn’t given enough authority. 12. The designers wouldn’t stop designing. 13. The contractor didn’t understand the
job. 14. This job was unique. 15. The building department is full of idiots. 16. Principals kept charging to the job. 17. The subs would not cooperate. 18 The word processing people kept getting
pulled off my job. 19. ________ quit and left me holding the
bag. 20. The CADD operators didn’t know what
they were doing.

Leadership vs. Management: What is the Difference?
Leadership is Transformational …creating new possibilities
Management is Transactional …day to day activities

Leaders vs. Managers 1. The Leader
Does the right things Creates a better system Motivates people Focuses on achieving the
vision Looks for long-term
effectiveness
1. The Manager Does things right Improves the system Directs peoples’ activities Focuses on the job at
hand Looks for short-term
achievements

Attributes of a Leader 1. Vision
2. Focus
3. Ethical
4. Flexibility
1. Optimism
2. Energy
3. Courage
4. Team builder

Mistaken Leadership Attributes
1. Loyalty 1. Hard worker
2. Popular with clients
3. Good designer

Ten Commandments of Leadership
1. Treat everyone with respect
2. Set an example for others to follow
3. Be an active coach 4. Insist on excellence and
accountability 5. Maintain high standards
of integrity
1. Build group pride 2. Show confidence in your
people 3. Maintain a sense of
urgency 4. Be available and visible 5. Continually develop your
own skills

Leadership Development Action Plan
1. Walk the Talk – visibly demonstrate the Ten Commandments of Leadership
2. Mentor, mentor, mentor – senior management needs personal responsibility to develop new leaders
3. Accountability – make the Ten Commandments of Leadership part of your performance appraisals
4. Culture – reward leadership first

Personality Traits
0 0
5 5
10 10
Assertive Responsive

Personality Traits
0
0 5
10
10
Assertive
Responsive

Driver (Control Taker) Pushy Severe Tough Minded Dominating Harsh Determined Requiring Thorough Decisive Efficient
Expressive (Emotional) Manipulative Excitable Undisciplined Reacting Promotional Personable Stimulating Enthusiastic Dramatic Gregarious
Personality Traits
Analytic (Data Collector) Critical Indecisive Stuffy Exacting Moralistic Industrious Persistent Serious Vigilant Orderly
Amiable (Friendly) Conforming Retiring Pliable Dependent Awkward Supportive Respectful Willing Dependable Agreeable
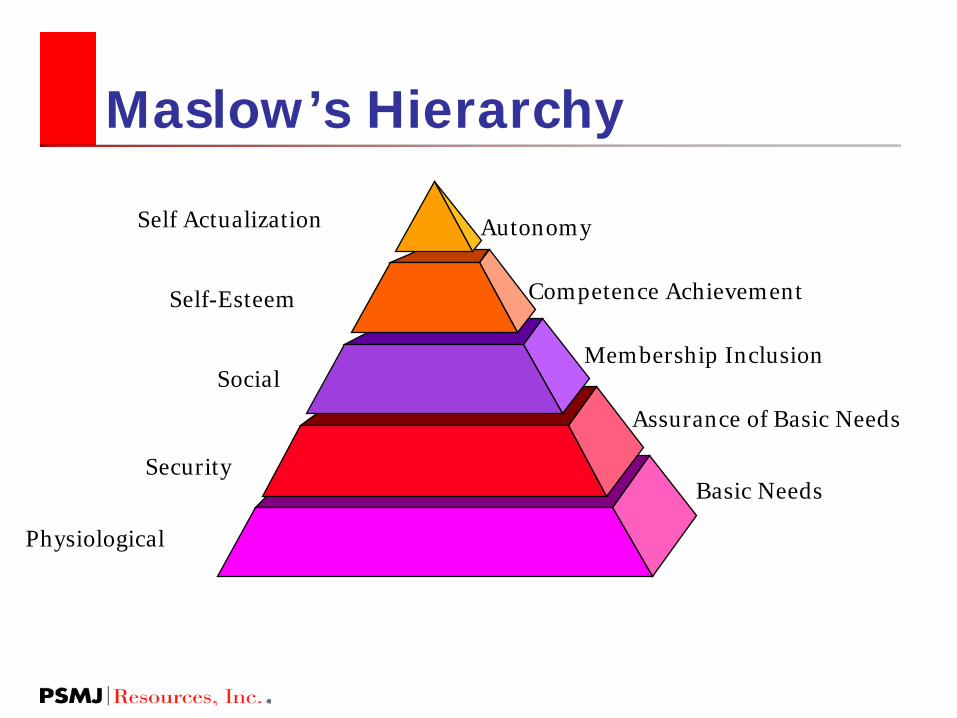
Maslow’s Hierarchy
Physiological
Security
Social
Self-Esteem
Self Actualization
Basic Needs
Assurance of Basic Needs
Membership Inclusion
Competence Achievement
Autonomy

Job vs. Career Personnel Motivational Factors
1. Challenge
2. Responsibility
3. Professional Advancement
4. Personal Development
Hygiene Factors
1. Money
2. Fringe Benefits
3. Office Space
4. Titles

Herzberg’s Motivation Factors (percent satisfiers-engineers)
-40 -30 -20 -10 0 10 20 30 40
Working Conditions
Relations w/Boss
Salary
Co. Policy
Advancement
Responsibility
Work Itself
Recognition
Achievement

Improving Employee Quality
Quality of Employees
Num
ber o
f Em
ploy
ees
Yellow Red, Green, Blue
Average Employee Quality

Where Have All the People Gone?
Bachelors Degrees Since 1986 (Source: Engineering Workforce Commission)
-25-20-15-10
-505
10152025
19861987
19881989
19901991
19921993
19941995
19961997
1998
Perc
ent C
hang
e Si
nce
1986
OverallEngineering

Working the Pipelines
LEADS PROJECTS
RESUMES EMPLOYEES

Who Do You Want to Hire? 1. Team Players
2. Technical and Business Savvy
3. Oral and Written Communications Skill
4. Experience vs “The Right Stuff”

Pruning the Bushes
1. Let everyone know your HR management philosophy.
2. View temporary slowdowns as opportunities.
3. Once you have decided to amputate your hand, don’t do it one finger at a time.
4. Treat departing employees with respect.

Costs & Benefits of Employee Turnover
Costs -- $10,000 - $20,000 per exempt employee
1. Training cost for replacement
2. Lost productivity (learning curve)
3. Lost capability
4. Impact on client relations
5. Disruption during transition to new employee
6. Impact on employee morale
Benefits -- Non-quantifiable, but significant
1. Elimination of marginal performers
2. Reduces “salary creep”
3. Increases advancement opportunities for younger staff
4. Infusion of new talents, approaches, ideas

Employee Turnover Rate vs. Profitability
0%1%2%3%4%5%6%7%8%9%
10%
PRO
FITA
BIL
ITY
3% 7% 14% 32% 45%EMPLOYEE TURNOVER RATE

Project Management Flow Diagram
Define ProjectScope andServices
DefineProjectScope
SetupProject
Schedule
SetupProjectBudget
IdentifyProjectTeam
MonitorScope
MonitorSchedule
MonitorBudget
Communicate Regular Meetings with Action Minutes Circulate Correspondence Telephone Conversation Records Talk to Team Regular Frequency Talk to Client with Regular Frequency
Action &Control
Scope ChangeReports
Progress Reports Schedule
Revisions Staffing Changes Change Adverse
Trends Monitor Quality
Plan Documentation to
Files
Agreement ForServices
Scope Scope Changes Responsibilities Schedule Terms of Payment
Prepare QualityPlan
ProjectCompletion
Analysis Follow up with
Client to EnsureSatisfaction
Review ProjectTeam MemberPerformance
Complete ActualSchedule toPlannedScheduleAnalysis
Complete ActualBudget toPlanned BudgetAnalysis

Planning the Project 1. When Should You Begin to Plan?
2. The Objectives of Planning
3. Goals vs. Tasks vs. Priorities
4. Elements of a Project Management Plan (PMP)
5. Crisis Prevention/Risk Management

Elements of a Project Mgmt Plan
1. Goals & Objectives 2. Scope 3. Schedule 4. Financial Plan 5. Team Organization, Resources, Responsibilities 6. Quality Control Process 7. Change Management Process 8. Communication Plan 9. Contingency/Risk Management Plan

The Assistant Project Manager
1. Official or Unofficial?
2. Performs specific PM tasks
3. Pinch hits during PM’s absence
4. Allows PM to handle more jobs
5. Accelerates development of new PMs
Build a relationship with a targeted client contact
Suggest a value added idea at a client meeting
Attend client meetings to observe dynamics
Prepare project close-out and lessons-learned
AssistantPM
Arch Civil Mech Elec
Client
ProjectManager
PIC

Why Are We So Bad at Teamwork?

Why Teams Fail 1. No Clear Vision
2. Poor Team Behavior
3. Focus on Personalities
4. Lack of Feedback
1. Lack of Team Purpose
2. Personal Agendas
3. Unwilling to Participate
4. Value Conflicts

Characteristics of Effective Teams
1. Collective AND Individual Accountability
2. “Atmosphere” is relaxed
3. Lots of discussion
4. Objective well understood
5. Members listen to each other
1. Most decisions by consensus
2. Constructive disagreements
3. Criticism is comfortable
4. Clear assignments made & accepted
5. Leadership shifts from time to time

The “Static” View of Delegation
05
101520253035404550
Your time to dothe task
Your time todelegate it
Delegatee's timeto do it

Delegation Aerobics
1 2 3 4 5 6 7 8 9 10Number of Iterations
Your time to delegate the task
Delegatee's time to do thetaskTime spent doing it yourself

Delegation Aerobics
1 2 3 4 5 6 7 8 9 10Number of Iterations
Your time to delegate the task
Delegatee's time to do thetaskTime spent doing it yourself

Ten Steps to Better Delegation 1. Select the right person 2. Provide all the available information 3. Ask what additional information is needed 4. Clearly define the product you expect 5. Agree on the proper approach 6. Agree on a completion date 7. Agree on a level of effort 8. Establish control mechanisms (MBWA & MBAQ) 9. Expect the product to be 30% different; 10%
wrong 10. Give credit; take blame

What is a Good Consultant When vendors, consultants, and contractors asked the President of Intel Corporation how they can get more work from the giant chip manufacturer, he told them:
“Go out and learn how to make chips. Then come back and help us do it better.”

WHY DO CUSTOMERS DEFECT?
INDIFFERENCE BY SUPPLIER
68%
SERVICE DISSATISFACTION
14%
OTHER4%
NEW BUSINESS RELATIONSHIP
5%
PRICE9%

Battling “Indifference” 1. Managing your Client
2. Superior Client Service
3. Keeping Relationships Fresh
4. Proactive Communication

Passive Marketing/Touching Clients
1. Forward an article about a client’s business
2. Forward info on new legislation affecting them
3. Send a book about strategies in their business
4. All phone calls equal one touch
1. Send clippings on other projects or industry trends
2. Send a handy tool or checklist that makes their job easier
3. Thank you notes
4. Lunches & Breakfasts
5. Company Newsletters

The _______ Rule Annual Revenue Generation
Repeat clients = ____%
New clients = ____%
Marketing Budget Consumption
Repeat clients = ____% New clients = ____%

Critical Success Factors in Managing Your Client
Leadership
1. Know your client
2. Understand your client’s business
3. Be an equal partner
4. Foster trust
5. Demonstrate credibility
6. Anticipate – Don’t React
Management
1. Maintain focus
2. Be responsive
3. Meet commitments
4. Communicate effectively
5. Be prepared
6. Be persistent when you need input
No Surprises!!!!!!
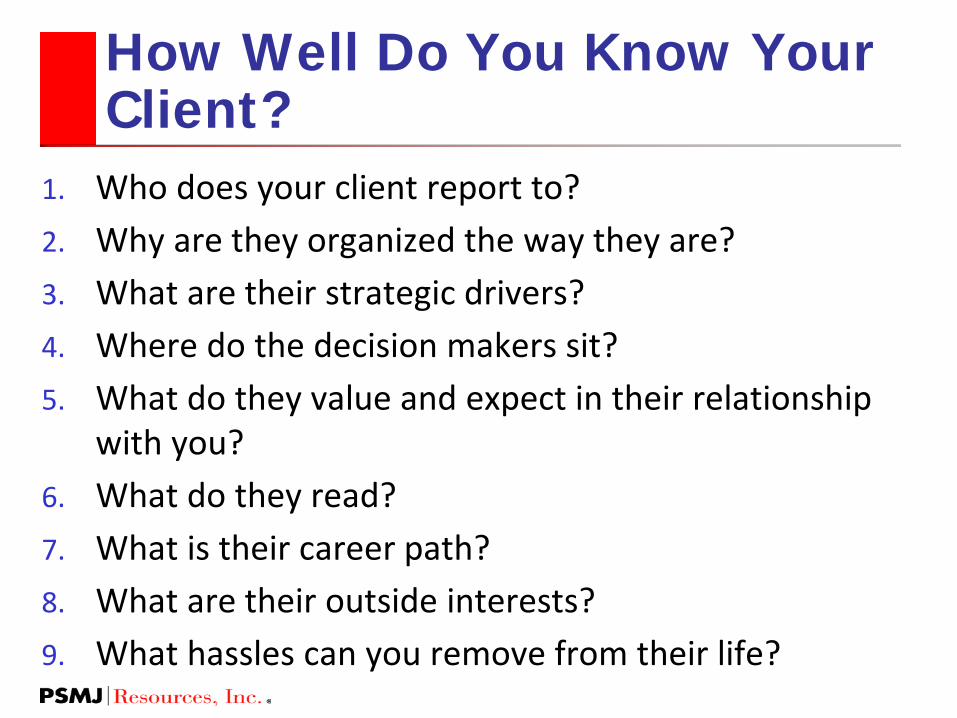
How Well Do You Know Your Client?
1. Who does your client report to? 2. Why are they organized the way they are? 3. What are their strategic drivers? 4. Where do the decision makers sit? 5. What do they value and expect in their relationship
with you? 6. What do they read? 7. What is their career path? 8. What are their outside interests? 9. What hassles can you remove from their life?

How Satisfied Are Your Clients?
1. Solicit feedback (1 page surveys)
2. Send clients a piece of paper marked “ How Can We Do Better?” (Include the pen and postage paid envelope)
3. Ask clients to keep a sheet entitled “Things Consultants Do That Bug Me”
4. Collect, Summarize, Share, Do It Again!!!!!
Keeping Clients Happy = Keeping Clients

The 5 Be’s to Superior Client Service
1. Be Accessible: easy to be contacted
2. Be Responsive: adapt to client needs
3. Be a Closer: do what you say you will do
4. Be Quick to Correct: bad news doesn’t get better with age
5. Be Passionate: it’s contagious

Presenting Bad News – Spin Control
1. Get bad news out as early as possible
2. Make sure clients hear it from you first
3. Take responsibility immediately
4. Present alternatives
5. “Your first loss is your last loss”

Seven Steps to Managing a Crisis
1. Don’t react immediately - THINK
2. Define the problem (not just the symptoms)
3. Identify all the alternatives
4. Don’t assess blame
5. Select the alternative(s) you believe will work
6. Take positive, authoritative action
7. When the dust settles, assess the results

Managing Change 1. Define the change management process as part of the
PMP 2. Always embrace client change with great enthusiasm 3. DO NOT avoid the discussion on impacts to scope,
schedule or budget 4. Present the consequences of the change
Let the client decide on implementation 5. Define Freeze-Milestones and Client-Decision Matrix

Going to the Client for More Money
1. Plan early.
2. Establish the change order procedure up front.
3. Get immediate concurrence from the client of changes.
4. Keep good documentation.
5. Limit small changes (aka, scope creep).
6. Never agree to do extra work without authorization.
7. When in doubt, ask for the money!

Building a Strong Project Management Structure
2. Install a foundation based on earned value tracking
3. Train your PMs
4. Conduct regular project reviews
1. Diagnose the problems (PM audit)

What is “Net Revenue Deficit”?
Uncollectible A/R
Unbillable WIP
Over budget
Negotiations
Proposal cut
2
2.2
2.4
2.6
2.8
3
3.2
3.4
Dire
ct L
abor
Mul
tiplie
r Net Revenue Deficit
Target
Achieved
54

What Causes “Net Revenue Deficits”?
1. Fee reductions 2. Jobs in budget trouble 3. Jobs with potential
quality/liability problems 4. Charges to jobs w/o contracts 5. Delays in getting charges keyed
into accounting 6. Delays in getting charges billed 7. Late payment 8. Jobs with unusually high risks
NRD = Σ (Project Write-downs – Project Write-ups) Annual Net Revenue
55

How Can You Generate a Net Revenue Surplus?
2
2.5
3
3.5
4
Target Multiplier Viewed as a Ceiling Target Multiplier Viewed as a Floor
D.L
. Mul
tiplie
r Target Multiplier
Achieved Multiplier
Achieved Multiplier
Proposal Cut
Negotiation Cut
Over Budget
A/R Write-
off
L.S. Jobs Under Budget
Incentive Fees
56

Method #1: Upward Budgeting
Billing Rates
Initial Goal WBS (Task Outline)
Staff Hours x
Hourly Rate =
Direct Labor x
Overhead Rate =
Total Cost +
Profit +
Expenses (ODCs) + Contingency =
Proposed Fee
57

Method #2: Downward Budgeting
Billing Rates
Staff Hours =
Hourly Rate ÷
Direct Labor
Overhead Rate
Total Cost =
Profit - Expenses (ODCs) - Contingency - Achievable Fee
=
÷
WBS (Task Outline)
Initial Scope 58

Initial Scope
Task List
Staff Hours
Hourly Rate
Direct Labor
Overhead
Total Cost
Profit
ProposedContract Fee
Initial Scope
Task List
Staff Hours
Hourly Rate
Direct Labor
Overhead
Total Cost
Profit
AchievableContract Fee
Budget Method #2a: Real World Budgeting
59

A Little Quiz
Your Project
Present Status
What’s the % Complete?
$100,000 Budget
10-Month Schedule
$40,000 Spent
6 Months Spent
30%
40%
50%
60%
70%
60

How Does This Project Look?
$- $20,000 $40,000 $60,000 $80,000
$100,000 $120,000 $140,000 $160,000 $180,000 $200,000
1-Ja
n
1-Fe
b
1-M
ar
1-Ap
r
1-M
ay
1-Ju
n
1-Ju
l
1-Au
g
1-Se
p
1-O
ct
1-N
ov
1-De
c
1-Ja
n
Planned ExpendituresActual Expenditures
Fee = $200,000 Forecast Cost = $173,790 Planned Profit = $26,210
61

What Happened on the Way to the Bank?
$- $20,000 $40,000 $60,000 $80,000
$100,000 $120,000 $140,000 $160,000 $180,000 $200,000 $220,000
1-Ja
n
1-Fe
b
1-M
ar
1-Ap
r
1-M
ay
1-Ju
n
1-Ju
l
1-Au
g
1-Se
p
1-O
ct
1-N
ov
1-De
c
1-Ja
n
1-Fe
b
1-M
ar
1-Ap
r
Planned ExpendituresActual Expenditures
Fee = $200,000 Final Cost = $214,873 Project Loss = $14,873
62

You Can Avoid This Problem By Using the EAC Method
1. Take out separate
accounting codes for each
task/activity
2. To assess
status, generate a forecast to
complete (FTC) for each
task/activity
3. Get actual
expenditures from
Accounting for each
task/activity
4. Add Steps 2
and 3 to determine the
Estimate at Completion
(EAC)
63

Problems With the EAC Method 1. You need lots of job cost
account numbers 2. Team members don’t
charge their time to correct account numbers
3. PM ends up being a “timesheet cop”
4. Team has to estimate forecast to complete each month
64

1. Prepare an expenditure forecast Convert expenditure forecast
to a progress forecast Change the baseline only if
the contract is amended
2. Estimate progress for each task 3. Compute overall progress
4. Actual expenditures from accounting
Schedule (Step 3 vs. Step 1) Budget (Step 3 vs. Step 4)
PSMJ’s Simplified 4-Step EVA Method
65

Cost/Schedule Breakdown A. Develop BackgroundB. Conduct Case Study 1. Select Case Study Study 2. Prepare Breifing Documents 3. Develop Data Mgmt Plan 4. Visit Case Study Sites 5. Analyze Waste SamplesC. Evaluate Costs for Case Studies 1. Develop Cost Models 2. Perform Preliminary Designs 3. Estimate CostsD. Evaluate Potential for TrtmtE. Assess Cost ImpactsF. Evaluate Cost Impact ModelsG. Project Reporting 1. Topical Reports a. Background Data b. Case Study Site Visits c. Waste Sampling 2. Draft Report 3. Final ReportH. Project Management
30,390 1/1/2000 1/6/2000-
5,870 3/1/2000 5/15/20006,120 1/15/2000 5/15/2000
20,150 1/1/2000 3/30/200054,200 4/1/2000 4/6/200046,600 6/1/2000 12/31/2000
- 16,310 1/1/2000 6/30/200028,110 6/1/2000 11/30/200024,320 7/1/2000 12/30/200012,820 1/1/2000 12/31/200017,260 11/1/2000 12/28/200019,290 11/1/2000 11/30/2000
- -
24,440 7/1/2000 8/30/200024,440 10/1/2000 11/30/200018,440 11/1/2000 12/15/200030,600 10/1/2000 11/30/200019,190 11/1/2000 12/30/200032,400 1/1/2000 12/31/2000
Tasks Budget Start Finish

Projected Expenditures and Planned Progress
0%10%20%30%40%50%60%70%80%90%100%
$- $17,379 $34,758 $52,137 $69,516 $86,895
$104,274 $121,653 $139,032 $156,411 $173,790
1-Ja
n
1-Fe
b
1-M
ar
1-Ap
r
1-M
ay
1-Ju
n
1-Ju
l
1-Au
g
1-Se
p
1-O
ct
1-N
ov
1-De
c
1-Ja
n
Projected ExpendituresPlanned Progress
Fee = $200,000 Forecast Cost = $173,790 Planned Profit = $26,210
67

Earned Value Calculation Current Date = July 1

What is the Project Schedule Status?
0%10%20%30%40%50%60%70%80%90%100%
$- $17,379 $34,758 $52,137 $69,516 $86,895
$104,274 $121,653 $139,032 $156,411 $173,790
1-Ja
n
1-Fe
b
1-M
ar
1-Ap
r
1-M
ay
1-Ju
n
1-Ju
l
1-Au
g
1-Se
p
1-O
ct
1-N
ov
1-De
c
1-Ja
n
Projected ExpendituresEarned Value
Fee = $200,000 Forecast Cost = $173,790 Planned Profit = $26,210
69

Are Your PMs Drowning in Data?
Division Time Analysis Percent Chargeable Detail Verification Invalid Transaction Report Division Aging Report Active Projects with Completion
Dates within 30 Days Unauthorized Expenditure Detail
Report Active Projects w/Unauthorized
Items Authorization Listing
Items Made Non-Billable during Period X
Revenue Write-offs during Period X Unbilled Receivable/ Undistributed
Revenue –Audit Unbilled Receivable/ Undistributed
Cost Aging Manager’s Project Status Operating Statement Budget & Expense Report Budget & Expense Exception Near-Term Financial Action
One Firm’s Accounting Reports to PMs
70

The 5 Numbers PMs Really Need
1. Labor Detail 2. Direct Cost Detail
3. Labor Costs 4. Direct Costs 5. Subcontractor Costs
Accounting Tells Us Project-To-Date Costs $44,000 as of June 30
Inception-to-Date Weekly
Other Numbers • WIP • A/R • Billing
71

It’s Not Too Late to Recover the Original Financial Forecast
0%10%20%30%40%50%60%70%80%90%100%
$- $17,379 $34,758 $52,137 $69,516 $86,895
$104,274 $121,653 $139,032 $156,411 $173,790
1-Ja
n
1-Fe
b
1-M
ar
1-Ap
r
1-M
ay
1-Ju
n
1-Ju
l
1-Au
g
1-Se
p
1-O
ct
1-N
ov
1-De
c
1-Ja
n
Planned Expenditures Actual Expenditures Earned Value
Fee = $200,000 Forecast Cost = $173,790 Planned Profit = $26,210
72

With Practice, You’ll Learn to Read the Clues
How Can Earned Value Go Down?

What Does a Principal Need to Know?
1. Is the job set up properly in the accounting system?
2. Has a PM Plan been prepared and distributed to the team?
3. Are there pending change orders that need to be formalized?
4. Has the job been billed recently?
5. Are payments current?
6. Is the job running over or under budget? If not, what corrective actions are being taken?
7. Is the project on schedule? If not, what corrective actions are being taken?
8. Are the firm’s QA requirements being followed?
9. Is the client happy?
Common Pitfalls in Implementing Project Reviews
1. Allowing PMs to select which projects are to be reviewed 2. Scheduling reviews “when time is available” 3. Doing the reviews for the benefit of corporate managers 4. Making reviews optional at the business unit level 5. Beating up PMs who present unfavorable project status 6. Not dealing with PMs who “don’t get it”

And How to Avoid Them 1. Require every PM to present one project per month 2. Don’t try to review every project every month 3. Dedicate 1 to 2 days every month for Project Reviews 4. Put dates for Project Reviews on your Fiscal Calendar, within 2 weeks
after the close of an accounting period 5. Publish list of projects, subject to review that month, 1 to 2 days
before the reviews 6. Follow up on PMs’ action items from the prior reviews 7. Tweak the process as you gain experience 8. Don’t forget, it is not an inquisition, it is a coaching opportunity 9. Accept that 20% of your PMs won’t “get it” – and deal with them
appropriately

One Firm’s Project Review Process
1. All PMs will submit Earned Value reports to their Office Managers each month.
PlanTrax® for fees > $100,000 PlanTrax® Lite for fees < $100,000 (or PlanTrax® if PM prefers)
2. Each Office Manager in conjunction with the Regional Manager will select a day each month to conduct project reviews. Time allocated will be 30 to 60 minutes per PM, at the discretion of the Office Manager. Office Managers will have a schedule in place on or before November 1.
3. Office Managers will advise Regional Managers, PICs, COO and CFO which projects are scheduled for reviews each period. Regional Managers, PICs, COO and CFO will attend at their discretion (either in person or via web).
4. Each PM must present at least one project each month. If the Office Manager is also the PM, the Assistant PM will present the project.
5. Project reviews will include both PowerPoint and Excel templates (plus other clarifying management information that the PM may want to include).
6. The COO will monitor the implementation of this process.
77

How Many Projects Can I Manage?
Assume PM = 10% of total project hours A. Time spent managing projects = _____ % B. Total hours you work per year = _____ hrs/yr
Average hours/week = _______ x 52 wks/yr = ______ Holiday, vacation, sick = _________ (nominally 280)
C. PM hours available = A x B = _____ hrs/yr D. Project hours managed/year = C / 0.1 = _____ hrs/yr E. Your firm’s average billing rate = $_____ /hour F. Net fees you can manage = D x E = $_____ /yr G. Net fees you actually manage = $_____ /yr H. PM overload = G – F = $_____ /yr Note: This calculation assumes all work is done by in-house staff.
For subcontracted work, multiply by 5.

How Do I Find Time To Do All This?
Urgent Important

Time Management Matrix Urgent Not Urgent
Impo
rtan
t N
ot Im
port
ant
I II
III IV
Manage Focus
Deception Waste
Source: Covey Leadership Center, Inc

Are You High Performance?
Urgent Not Urgent Im
port
ant
Not
Impo
rtan
t
I II
III IV
20-25% 25-30%
65-80% 15%
15% 50-60%
<1% 2-3%
High Performance Organizations Typical Organizations
Source: Covey Leadership Center, Inc

If You Want to Learn More…
PSMJ Resources 1. Financial Statistics Survey 2. Fees & Pricing Survey 3. Project Management
Bootcamp 4. Principals Bootcamp 5. CEO Forums on O/T and
M&A 6. PSMJ Monthly Newsletter
Other Resources 1. “Managing the Professional
Services Firm” by David Maister
2. “Good to Great” by Jim Collins
3. “Staying Small Successfully” by Frank Stasiowski

And In Conclusion… Please fill out the evaluation form: Call on us if we can help you
Brad Wilson Phone: (857) 255-3204 [email protected]
David Burstein Sue LeComte
Phone: (770) 723-9651 Phone: (857) 255-3205 [email protected] [email protected]
We hope to see you again soon!!!