Embed Size (px)
Citation preview

EU Monitor European integration
Publication of the German original:
December 17, 2014
With the independence referendum in Scotland and unofficial polls in Catalonia
and Veneto, separatist aspirations in Europe were recently given a boost. The
desire for greater autonomy in several regions of Europe is not about to ebb in
the coming years either.
In regions seeking greater self-determination or even full secession, not only
emotional and cultural aspects play a role but also concrete financial motives.
Even though autonomy movements are, by definition, regional phenomena,
there are interesting correlations on the economic side.
Nearly all the regions seeking greater autonomy are among the wealthiest in
their respective countries and far outstrip the national average in terms of per
capita income. This comes as no surprise, since secession from an existing
federation goes hand in hand with sizeable risks which economically weak
regions can scarcely afford to take.
Moreover, some of these regions are substantial net contributors in regional
redistribution systems. However, here too there are notable exceptions.
It is striking that there are very persistent regional income disparities within the
countries examined. Most of the regions that have a high per capita income in
relation to the rest of the country have ranked at the top or at least near the top
of the standings for decades. This aspect might have reduced acceptance of the
idea of horizontal redistribution between regions.
Authors
Frank Zipfel
+49 69 910-31890
Stefan Vetter
+49 69 910-21261
Daniel Pietzker
Editor
Barbara Böttcher
Deutsche Bank AG
Deutsche Bank Research
Frankfurt am Main
Germany
E-mail: [email protected]
Fax: +49 69 910-31877
www.dbresearch.com
DB Research Management
Ralf Hoffmann
February 6, 2015
Better off on their own? Economic aspects of regional autonomy and
independence movements in Europe
Basque County
Navarre
Catalonia
South Tyrol
Veneto
Brussels: 185% London: 172%
Scotland
Hamburg: 165%
60%
70%
80%
90%
100%
110%
120%
130%
140%
ES IT BE UK DE
% of national average, 2011; regions with autonomy movements in red; Belgium: Flemish provinces; Scotland: excluding oil revenues
Per capita income: Regions with autonomy movements versus other parts of country DX
Sources: Eurostat, Deutsche Bank Research

Better off on their own?
2 | February 6, 2015 EU Monitor
The new European regionalism
2014 will be remembered as a year of resurfacing regionalism movements in
Europe. Voting on the possibility of independence for their regions – with each
having a differing constitutional character – the people of Scotland, Catalonia
and Veneto have expressed their desire for a greater degree of regional self-
determination. In other regions, too, such as the Basque Country and Flanders,
a substantial part of the population advocates far-reaching autonomy or even
full secession from the current structure of government. What is behind this
desire for more independence, behind the conviction that a region is stronger on
its own than in an entity including the other regions of the country?
Many European regions have preserved a cultural identity of their own. The
sense of belonging that this has created extends, in fact, in some cases across
national borders (take, for example, the Basque Country, which today is split
between Spanish territory and French territory). Cultural differences that have
grown over time are also to be found in Scotland and Catalonia, for instance, yet
these alone are not sufficient to explain the emergence, or resurgence, of
independence movements. Finally, there are also regions which today, despite
centuries of sovereignty or unity with another nation, no longer show any
interest in changing the status quo. Nationalists occasionally assert that they
face discrimination in a centralised state, but their reasoning often seems very
hard to follow. At any rate, these regions are a part of pluralistic democracies,
and the right to enjoy fundamental freedoms is guaranteed, moreover, by the
EU and the European Court of Human Rights. The emotional dimension of this
aspiration for independence often has a very specifically regional background
and therefore does not play a central role in this report.
However, the economic dimension is likely to play a role of presumably equal
importance. While there are few reasons, from an objective point of view, why
Scotland or Catalonia should gain a substantial degree of prosperity via
independence, nationalist parties cite this very issue as being one of the most
important arguments. Secession from an existing state structure harbours huge
economic risks, though. However, these risks have decreased for smaller
countries; paradoxically, this is especially due to European integration. After all,
access to the single European market and the option of eurozone membership
reduce some of the fundamental disadvantages that would otherwise be faced
by countries such as Luxembourg, Malta, Cyprus and the Baltic states. Even
though a seceding region would probably have to officially apply for EU
membership, this very prospect no doubt makes it much easier for supporters of
independence to paint a positive picture of a future as a sovereign nation.
This report will focus on examining the extent to which economic determinants
could provide an explanation of why autonomy movements are emerging or
becoming reinforced. On the one hand this includes the question of whether the
citizens of a given region might have the impression that it is so strong
economically compared to the rest of the country that it could form a functioning
and internationally competitive state even if it were independent. On the other
hand, a role is also played by whether extensive interregional transfer systems
compel wealthier regions to share their prosperity with poorer regions. If the
subsidisation of other parts of the country reaches a high level or there is not a
very pronounced sense of solidarity with other regions, this can also serve as a
motivation for greater autonomy.
Contents
The new European regionalism 2
Overview: Regionalism and economic
vitality .......................................................... 4
Spain: Unequal rules aggravate problems .. 6
Scotland: Increasing autonomy ................. 11
Belgium: Increasing division ...................... 14
Italy: Large gulf between north and south . 16
Germany and France: Autonomy movements
have no major political significance ........... 18
The financial illusion of independence 19
Better off on their own?
3 | February 6, 2015 EU Monitor
Autonomy or independence? Regions have varying starting conditions, motives and objectives
Autonomy movements are, by definition, regional phenomena and thus
comparable to an only limited extent, especially since the regions discussed
here enjoy differing degrees of autonomy. While the demand for greater self-
determination is borne everywhere by a broad swath of the population, the basis
for seeking actual independence varies in breadth.
In Scotland some 44.7% of the vote in the September 18, 2014 referendum was
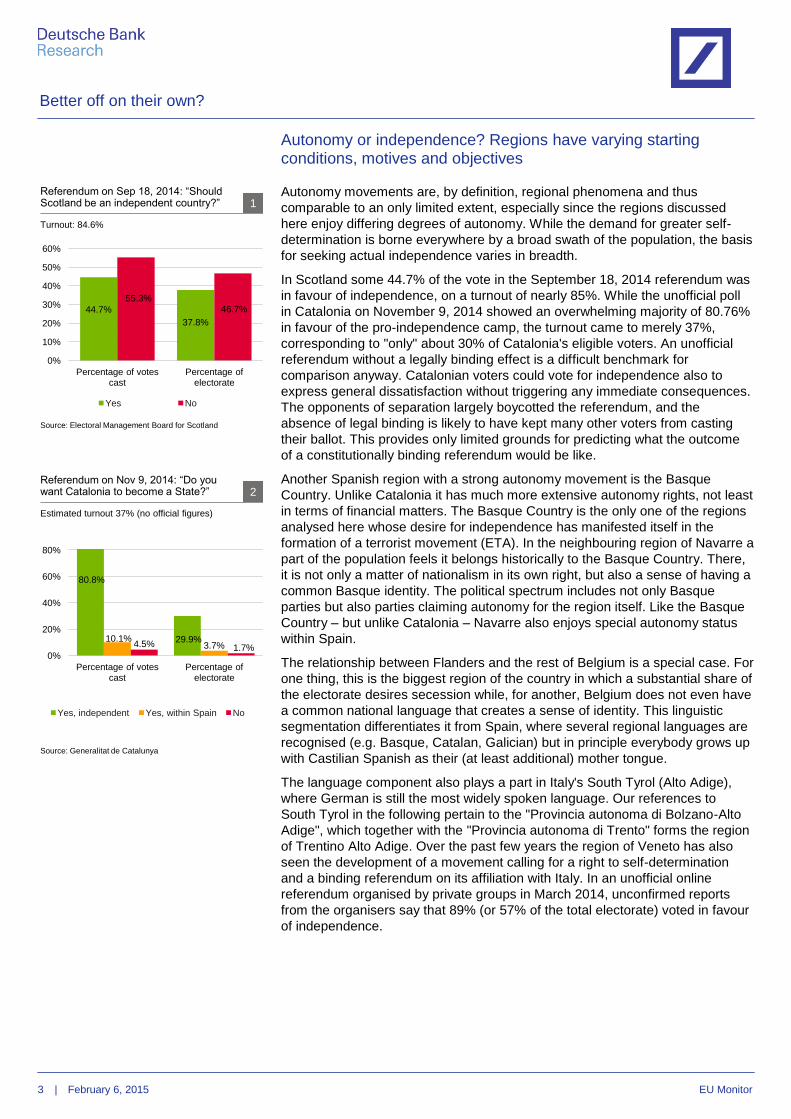
in favour of independence, on a turnout of nearly 85%. While the unofficial poll
in Catalonia on November 9, 2014 showed an overwhelming majority of 80.76%
in favour of the pro-independence camp, the turnout came to merely 37%,
corresponding to "only" about 30% of Catalonia's eligible voters. An unofficial
referendum without a legally binding effect is a difficult benchmark for
comparison anyway. Catalonian voters could vote for independence also to
express general dissatisfaction without triggering any immediate consequences.
The opponents of separation largely boycotted the referendum, and the
absence of legal binding is likely to have kept many other voters from casting
their ballot. This provides only limited grounds for predicting what the outcome
of a constitutionally binding referendum would be like.
Another Spanish region with a strong autonomy movement is the Basque
Country. Unlike Catalonia it has much more extensive autonomy rights, not least
in terms of financial matters. The Basque Country is the only one of the regions
analysed here whose desire for independence has manifested itself in the
formation of a terrorist movement (ETA). In the neighbouring region of Navarre a
part of the population feels it belongs historically to the Basque Country. There,
it is not only a matter of nationalism in its own right, but also a sense of having a
common Basque identity. The political spectrum includes not only Basque
parties but also parties claiming autonomy for the region itself. Like the Basque
Country – but unlike Catalonia – Navarre also enjoys special autonomy status
within Spain.
The relationship between Flanders and the rest of Belgium is a special case. For
one thing, this is the biggest region of the country in which a substantial share of
the electorate desires secession while, for another, Belgium does not even have
a common national language that creates a sense of identity. This linguistic
segmentation differentiates it from Spain, where several regional languages are
recognised (e.g. Basque, Catalan, Galician) but in principle everybody grows up
with Castilian Spanish as their (at least additional) mother tongue.
The language component also plays a part in Italy's South Tyrol (Alto Adige),
where German is still the most widely spoken language. Our references to
South Tyrol in the following pertain to the "Provincia autonoma di Bolzano-Alto
Adige", which together with the "Provincia autonoma di Trento" forms the region
of Trentino Alto Adige. Over the past few years the region of Veneto has also
seen the development of a movement calling for a right to self-determination
and a binding referendum on its affiliation with Italy. In an unofficial online
referendum organised by private groups in March 2014, unconfirmed reports
from the organisers say that 89% (or 57% of the total electorate) voted in favour
of independence.
44.7%
37.8%
55.3% 46.7%
0%
10%
20%
30%
40%
50%
60%
Percentage of votes cast
Percentage of electorate
Yes No
Referendum on Sep 18, 2014: “Should Scotland be an independent country?” 1
Turnout: 84.6%
Source: Electoral Management Board for Scotland
80.8%
29.9% 10.1% 3.7% 4.5% 1.7%
0%
20%
40%
60%
80%
Percentage of votes cast
Percentage of electorate
Yes, independent Yes, within Spain No
Referendum on Nov 9, 2014: “Do you want Catalonia to become a State?” 2
Source: Generalitat de Catalunya
Estimated turnout 37% (no official figures)

Better off on their own?
4 | February 6, 2015 EU Monitor
Overview: Regionalism and economic vitality
The regions seeking greater independence differ very considerably in terms of
geographical size and economic importance. Both very small as well as very
much bigger regions desire greater autonomy. Their weight within the given
country is correspondingly uneven. Flanders (58% of Belgium's GDP) and
Catalonia (19%) are regions, for instance, that are of huge economic relevance,
while South Tyrol (2.3%) and Navarre (1.7%) play a relatively minor role in their
respective countries.1
The most striking common characteristic of these regions is the usually high
level of prosperity compared to the rest of the country. Nearly all the regions
rank higher than the national average in terms of per capita income (see chart 3
and table 4).2 This is particularly noticeable in Spain and Italy, where the
Basque Country and South Tyrol, the most prosperous regions in their
respective countries (with GDP at over 130% of the average), already enjoy
special autonomy status. Belgium presents a comparable picture – if one
disregards the capital region of Brussels nearly all the Flemish provinces
outstrip the national mean. Per capita GDP is 37% higher in Flanders than in the
provinces of Wallonia.
The situation is similar in Scotland: while the income level is somewhat lower
than the British average, Scotland follows London and the neighbouring south
east as the third-richest of twelve regions. One further special feature also has
to be taken into account: the North Sea oilfields are currently not assigned to
any region of the UK in the official statistics. When the GDP generated by oil
deposits is allocated on the basis of geographic share, Scotland's per capita
income rises from EUR 26,200 to roughly EUR 32,000 and would thus equal
some 115% of the British average3. On the basis of records available since
2000, Scotland would thus be the second richest region of the UK by far after
London.
1 The following abbreviations are also used for the regions: Basque Country (BC), Catalonia (CT),
Navarre (NA), South Tyrol (ST), Veneto (VE), Flanders (FL) and Scotland (SC). 2 For Germany (DE) and the United Kingdom (UK) we look at the NUTS 1 level, and for the other
countries NUTS 2. 3 Shares are allocated according to a geographical division based on what is known as the "median
line". In this procedure, every point on the maritime boundary is equidistant from the shores of the
two countries. This system is also used to divide the coastal fishing areas in the UK, for instance.
This means that around 85-90% of the oil deposits are on Scottish territory (for more on this topic
see Kemp & Stephen, 2008). The method is used by the Scottish government, with the value
representing an upper limit.
Independence movements in Europe: An overview 4
Comparison of various regional indicators in relation to the rest of the country
Country Region Pop. (abs.) Pop. (%) GDP (abs.) GDP (%) GDP/
capita
GDP/
capita (%)
Unempl.
(pp)*
Basque Country 2.18 m 4.7% 64.9 bn 6.2% 30,500 134.4% -9.5
Navarre 0.68 m 1.4% 18.1 bn 1.7% 29,100 128.2% -8.2
Catalonia 7.49 m 16.1% 194.3 bn 18.6% 26,600 117.2% -3
South Tyrol 1.02 m 1.7% 35.8 bn 2.3% 34,385 132.3% -6.7
Veneto 4.85 m 8.2% 149.5 bn 9.5% 30,200 116.2% -4.6
BE Flanders 6.36 m 57.5% 212.4 bn 57.5% 33,600 100.0% -3.4
UK Scotland** 5.28 m 8.4% 137.9 bn 7.8% 26,200 92.9% -0.4
Source: Eurostat
** Excluding oil revenues
* Difference in unemployment rate to national average
ES
IT
BL
NA
KA
ST
VE
Brussels
London
SC
HH
60%
80%
100%
120%
140%
160%
180%
ES IT BE UK DE
Per capita income versus other regions in given country 3
% of national average, 2011
Regions marked in red; Belgium: Flemish provinces; Scotland: excluding oil Sources: Eurostat, Deutsche Bank Research
80%
90%
100%
110%
120%
130%
140%
1995 1999 2003 2007 2011
Basque Country Navarre
Catalonia Flanders
South Tyrol Veneto
Scotland* Scotland**
Growth of per capita income in relation to national average 5
% of national average
*Excl. oil revenues, **Incl. oil revenues
Source: OECD

Better off on their own?
5 | February 6, 2015 EU Monitor
The regional income disparities within a country are very persistent (see chart 5
as well). Since 1995 the ratios have shifted only slightly in many cases. The
Basque Country has gained most in relation to the national average and
boosted its per capita income from 118.9% to 133.7%. In the other regions the
ratio has remained relatively constant: Navarre and Flanders are up slightly
(with +2.6 percentage points and +1.9 pp, respectively), while South Tyrol (-2.7
pp), Scotland (-3.6 pp), Veneto (-4.4 pp) and Catalonia (-4.5 pp) have lost
ground.
Due to their higher prosperity levels these regions score much higher on many
economic and social indicators than the rest of their country. Whether
unemployment, poverty, education or research: in some cases there are
sizeable differences to the national average in these areas. For example, all the
regions score better on unemployment and poverty rates. Since the start of the
crisis the unemployment rate has not risen as much, as a rule, as in the other
regions. In the Basque Country the rate rose by 4.8 pp less than in Spain as a
whole from 2008 to 2013. Navarre (-3.7%), South Tyrol (-2.9%) and Veneto
(-1.4%) are also positive outliers in their countries. Catalonia (-0.6%) and
Flanders (-0.3%), as well as Scotland (+0.5%), performed in line with the
average (see chart 6).
Income inequality within these regions is much less pronounced than in the rest
of the respective country (see chart 7), which does not automatically have to be
the case despite usually higher per capita incomes. The Gini coefficient4 is
smaller in all the regions than in the country as a whole – both before as well as
after redistribution via taxes and transfers. The largest disparity is to be found in
Navarre, where the Gini coefficient is 0.07 lower (before taxes and transfers)
and 0.05 lower (after taxes and transfers) than the coefficient for Spain as a
whole. A similar picture emerges with regard to the income ratio between the
80% quantile and the 20% quantile. Only in Scotland is the gap between the fifth
of the population with the highest incomes and the fifth with the lowest incomes
minimally larger than the national average, while in the other regions the
difference between the population groups is smaller.
The regions analysed score above average not only within their countries but
also in a European comparison of per capita incomes (EU-27). South Tyrol was
the leader of the group in 2011 with GDP per capita of 137% of the EU mean,
followed by Flanders at 134%. At the lower end of the scale are Catalonia
(106%) and Scotland (excluding oil, 105%), which – just like the rest of the UK –
had suffered a severe slump due to the financial crisis. In 2006, Scotland still
boasted a reading of 132%.
The regions are not only affluent in relative terms though. Their absolute
economic output also makes them a force to be reckoned with even at the
European level (chart 8). A recurring theme used as an argument against the
separatist movements is that the resultant countries would be relatively
meaningless at the national level because of their small size, apart from other
problems. A glance at the EU shows, however, that many of the regions would
not be such lightweights at all in comparison with existing members. In fact, in
terms of GDP, Flanders and Catalonia even have bigger economies than
Portugal or Ireland. The medium-sized regions of Veneto and Scotland
outperform countries such as Romania and Hungary, and even the Basque
Country has a larger GDP than nine other EU members. In terms of population,
too – a factor of significance for voting procedures in EU bodies in particular – a
host of regions indeed boast critical mass.
4 The Gini coefficient is a measure of income inequality and has a value between 0 and 1. A
reading of 0 means that all incomes in the respective region are distributed evenly. If a region has
a lower Gini coefficient than the rest of the country the inequality of income distribution there is
not as pronounced.
-5 -4 -3 -2 -1 0 1
Basque C
ountry
Navarre
Cata
lonia
South
Tyro
l
Veneto
Fla
nders
Scotla
nd
ES IT BE UK
Unemployment rate: Region vs rest of country; 2008-2013 6
Difference to increase in national average (pp)
Sources: Eurostat, Deutsche Bank Research
-0.08
-0.06
-0.04
-0.02
0
Basque
Country
Navarre
Cata
lonia
South
Tyro
l
Veneto
Fla
nders
Scotla
nd
ES IT BE UK
Before taxes/transf. After taxes/transfers
Gini coefficient before and after taxes and transfers
Income inequality: Difference to national average in 2011 7
Source: OECD
0 50 100 150 200 250 300 350
Norway
Austria
Flanders
Catalonia
Portugal
Ireland
Belgium*
Veneto
Scotland**
Romania
Hungary
Basque Country
Luxembourg
Slovenia
South Tyrol
Latvia
Navarre
Estonia
Malta
Comparison of selected countries and regions 8
GDP, EUR bn, 2011
*Belgium excl. Flanders, ** Excl. oil
Source: Eurostat

Better off on their own?
6 | February 6, 2015 EU Monitor
Differences regarding scope of regional autonomy
A very mixed picture emerges as regards the extent of regional autonomy in the
countries analysed. While both Spain and Belgium have already devolved many
competences to the regional level, this is much less the case in Italy and the
United Kingdom. This can also be seen in the data on record: the share of
government spending authorised at the regional level is much higher in Spain
(40.5%) and Belgium (36.4%) than in Italy (29.5%) and the UK (26.1%). This
trend became manifest in the past: in Spain, the shift had resulted in 7 pp of
higher outlays at regional level since 1995, hitting 49.9% before the 2007 crisis
in fact. In Belgium the rate rose by 14 pp from 1985 to 1990, jumping in the
wake of the State Reform of 1988/89 in particular. However, little has changed
in Italy or the UK since the turn of the millennium. This also holds for Germany,
where the share of the regional level in total government spending has hovered
at close to 40% for a long time.
The situation is similarly mixed in respect of tax revenue distribution, too. In
Spain, some 33% of total tax revenues are generated at the regional level; in
this respect, the special status of the Basque Country and Navarre no doubt has
a noticeable impact. In the other countries the share is much smaller: Italy
comes second at 16%, Belgium follows at 10% and the UK at 5%. The share in
Belgium is expected to rise owing to the State Reform in 2014 (by comparison:
the reading in Germany is over 29%).
With regard to public expenditure on investment, it is striking that a particularly
large share is commissioned at regional level. The shares in Belgium (90.2%),
Italy (72.5%) and Spain (69.4%) considerably outstrip the average for the
European members of the OECD (59.5%). Only in the UK is there a slightly
lower share at 54.6%. Local and regional governments thus appear to be
particularly responsible for public investment in the countries analysed (by
comparison: the reading is about 76% in Germany).
To sum up: the regions discussed generally report above-average economic
output, but the importance of the regional level is not equally pronounced
everywhere. There are also major differences in respect of regional funding and
fiscal equalisation systems. So each case has to be assessed on its own merits.
Spain: Unequal rules aggravate problems
Many regions in Spain have a distinct cultural identity, but only in a few of them
did this feeling of regional unity develop into broad support for movements
claiming greater autonomy or independence. This is also reflected in the
importance of regional parties in the political system. The Basque Country,
Navarre and Catalonia have strong regional parties, but Asturias, Galicia and
the Canary Islands also have such parties that were able to attract more than
10% of the votes in the 2011 Spanish parliamentary elections in their specific
region. The share of these parties is usually even higher in regional elections.
However, in the latter regions not many voters support the demand to become
fully independent. A major factor to explain this is presumably that their GDP per
capita is below the national average, and it is hard to find convincing reasons
why they should be better off alone. In contrast, the Basque Country, Navarre
and Catalonia are among the economically strongest regions in Spain – only the
capital Madrid can compete in terms of per capita income and unemployment. In
2013 the per capita GDP of the Basque Country was almost twice that of the
poorest region, Extremadura, while its unemployment rate was only half as high
(see chart 12).
0%
10%
20%
30%
40%
50%
88 92 96 00 04 08 12
Belgium Italy
Spain United Kingdom
Public expenditure at the regional level 9
% of total public expenditure, 1988-2012
Source: OECD
0
20
40
60
80
100
BE DE IT ES GB
%, 2011
Public expenditure on investment at regional level 10
Average for OECD Europe in red
Source: OECD
0%
10%
20%
30%
40%
50%
60%
Sources: Junta Electoral Central, Deutsche Bank Research
% of votes in their home region; only regions with at least 10% are included
Share of regionalist parties in the 2011 general elections 11

Better off on their own?
7 | February 6, 2015 EU Monitor
While there are some similarities between the Basque Country and Catalonia in
their desire to gain greater (or full) autonomy, it is crucial for an understanding of
the Catalonian dilemma that the two regions are treated differently within
Spain's fiscal architecture. Like most other regions Catalonia has the status of
an Autonomous Community (Comunidad Autónoma), while the Basque Country
and Navarre have had the status of a so-called “Comunidad Foral” since 1979
and 1982, respectively. This special status not only grants a much higher
degree of fiscal autonomy, but also accords preferential treatment within the
horizontal equalisation scheme between regions.
The objective of the equalisation mechanism is to establish a comparable level
of public services across Spanish territory. As a result of marked income
differences but also due to geographical factors, this is much more difficult for
some regions than for others. Consider the two neighbouring regions of Madrid
and Castile La Mancha. Income per capita in Castile La Mancha is almost EUR
10,000 lower than in Madrid. At the same time, the population of Madrid is three
times larger (6.5 m vs 2.1 m) but the inhabitants of Castile La Mancha are
spread across an area ten times larger (roughly twice the size of the
Netherlands). Obviously, it is much more difficult and more expensive for such a
large and thinly populated region to maintain a comparable network of public
infrastructure, healthcare and educational institutions than for regions such as
Madrid, Catalonia or the Basque Country. However, the problematic design of
the regional equalisation scheme is a permanent cause of dispute.
The intricate mechanics of Spain's fiscal equalisation scheme
The fiscal competences and financing schemes of the Spanish regions have
been reformed several times, most recently in 2009. The fiscal equalisation
scheme, the so-called “common system” (Régimen Comun), redistributes
financial resources across regions. However, as the Basque Country and
Navarre have special autonomy status as a “Comunidad Foral” this scheme
does not apply to them. Funding for the fiscal equalisation scheme mainly
comes from shared taxes, for example from 50% of the income tax and 50% of
the VAT. Both components are strongly linked to GDP, which means that richer
regions pay more. In addition, the common system receives 58% of taxes on
alcoholic products, tobacco and fuels, and 100% of taxes on capital transfers,
inheritances and donations, or gambling, as well as some special low-volume
taxes.
The main instruments for redistribution are the Public Guarantee Fund (Fondo
de Garantía de Servicios Públicos Fundamentales) and the Global Sufficiency
Fund (Fondo de Suficiencia Global), whose purpose is to ensure that all regions
in the common system have the same per capita financing for public resources.
Two additional funds (Fondo de Competitividad, Fondo de Cooperación) provide
additional resources for structurally weak regions according to different criteria
(e.g. for those with GDP per capita of less than 90% of the average). With a
volume of EUR 69 bn (6.8% of Spanish GDP) in 2012, the Public Guarantee
Fund was by far the largest fund. The disbursement is based on a region’s
“adjusted population”, i.e. the actual population adjusted for certain factors
which justify additional financial resources to mitigate structural disadvantages
(box 14).5
Some complications arise when comparing net financial flows across regions.
One reason is that some regions can decide whether to assume certain
competences or leave the responsibility to the central state. For example,
Catalonia is the only region in the common system in charge of a police and
5 This compares with what is referred to as "Einwohnerveredelung", the population weighting
approach used in Germany for the Länder financial equalisation system.
Galicia Asturias
Spain
CA
NA
Madrid
BC 15
20
25
30
35
40
15,000 20,000 25,000 30,000
Catalonia, Basque Country and Navarre among the strongest regions 12
X-Axis: regional per capita GDP, 2013, EUR Y-Axis: unemployment rate, 2013, %
Source: Instituto Nacional de Estadistica
100%
110%
120%
130%
140%
1995 1998 2001 2004 2007 2010 2013
Basque Country Navarre
Catalonia Madrid
Regions with autonomy movements more affluent than the rest of Spain 13
100% = national average
Source: INE

Better off on their own?
8 | February 6, 2015 EU Monitor
penitentiary system, for which it receives financial compensation from the
central state. Another reason is that there are some differences in regional and
local taxes. Furthermore, due to their isolated location the Canary Islands have
a reduced local sales tax instead of the regular VAT, and also the two north
African enclaves Ceuta and Melilla benefit from some exceptions.
Chart 15 illustrates the result of this opaque combination of redistributive
elements.6 The regions in the common system, i.e. excluding Navarre and the
Basque Country, are ranked according to their gross fiscal capacity, which is the
per capita amount of taxes collected in that region. It also plots the per capita
resources after fiscal equalisation between regions. Both measures are
normalised such that a value of 100 corresponds to the national average. It is
evident that the fiscal equalisation scheme indeed achieves the objective of
reducing the disparities across regions (the standard deviation of per capita GDP
is 25%, but that of per capita financial resources after adjustment is only 12%).
A remarkable aspect is that the three richest regions in the common system –
Madrid, the Balearic Islands and Catalonia – are not on top any more after
horizontal redistribution. The change in the ranking is partly the consequence of
accounting for different financing needs, but it is an undesirable feature from the
perspective of incentive compatibility. The seemingly arbitrary distribution gives
rise to claims of richer areas that their contribution is disproportionately large.
Preserving the ranking is a key Catalan demand for fiscal reform. The reformed
regional statute of Catalonia (approved by the Catalan parliament in 2006 but
partly rejected by the Constitutional Court in 2010) stipulates: “The State shall
guarantee that application of the levelling mechanisms shall in no case alter the
position of Catalonia in the pre-levelling ranking of per capita earnings.”7
Regional asymmetries: Navarre and the Basque Country
Thanks to their special autonomy statute, the Basque Country and Navarre
have the power to collect most taxes themselves. They do not participate in the
fiscal equalisation scheme but instead transfer a certain share of their tax
revenues to the central state in order to contribute to the financing of functions
which are located at the national level. Both regions also have more discretion
in setting tax rates than the regions operating in the common system, which
further complicates a comparison across regions. Comparable data are only
6 For details on the calculations see FEDEA (2014). La financiación de las comunidades
autónomas de régimen común en 2012. 7 See Article 206(5). Ley Orgánica 6/2006, Reforma del Estatuto de Autonomía de Cataluña.
(Organic Law 6/2006 on the Reform of the Statute of Autonomy of Catalonia).
Calculation of the "adjusted population" 14
The “adjusted population” concept is based on
the logic that regions with a higher share of
children and pensioners or a low population
density have higher spending needs to
guarantee a comparable level of public
services.
The following weights and variables are used
for the calculation of the “adjusted population”:
VARIABLES WEIGHTING
Population 30.0%
Population younger than 16 20.5%
Population older than 65 8.5%
Economically dependent 38.0%
Population in seven age groups
Surface area of region 1.8%
Dispersion of population 0.6%
Insularity 0.6%
In order to illustrate the effects of the
calculation let us consider the example of
Catalonia.
In 2012, the share of Catalonia in the total
population of the regions in the common
system was 17.10%. The share of the
population below age 16 was only slightly
higher (17.71%), while the share of those older
than 65 was marginally lower (16.82%).
However, the surface area of Catalonia
corresponds to only 6.52% of the total, which
enters with a weight of 1.8%. The result is an
adjusted (i.e. weighted) population of 7.51 m.
Thus, Catalonia receives financial resources
as if it would have to provide public services for
a population of 7.51 m – or 99% of the actual
7.57 m inhabitants. Thus, the adjusted
population concept results in a marginal
disadvantage for Catalonia. For the other
regions, the adjustment factor usually ranges
between 0.95 and 1.05.
Source: Ministerio de Hacienda y Administraciones
Públicas
0%
30%
60%
90%
120%
150%
gross fiscal capacity per capita per capita financial resources after equalisation
Winners and losers of the regional fiscal equalisation scheme 15
100 = national average
Source: FEDEA (2014)
Better off on their own?
9 | February 6, 2015 EU Monitor
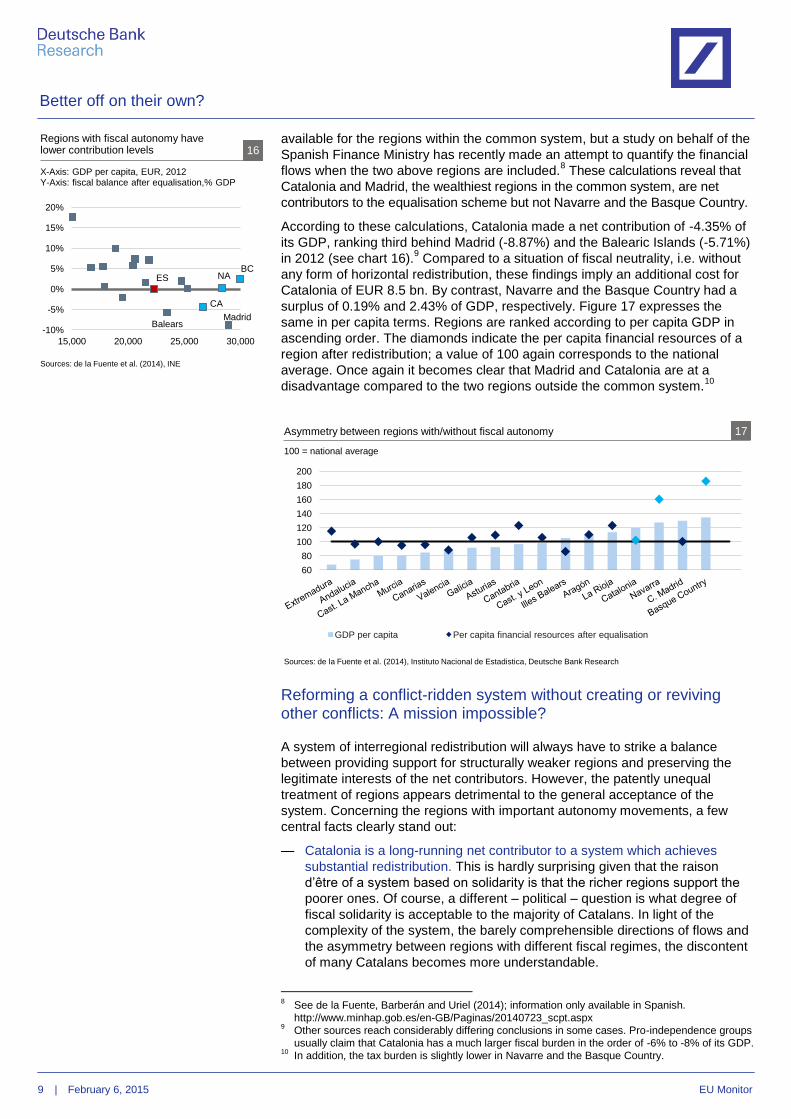
available for the regions within the common system, but a study on behalf of the
Spanish Finance Ministry has recently made an attempt to quantify the financial
flows when the two above regions are included.8 These calculations reveal that
Catalonia and Madrid, the wealthiest regions in the common system, are net
contributors to the equalisation scheme but not Navarre and the Basque Country.
According to these calculations, Catalonia made a net contribution of -4.35% of
its GDP, ranking third behind Madrid (-8.87%) and the Balearic Islands (-5.71%)
in 2012 (see chart 16).9 Compared to a situation of fiscal neutrality, i.e. without
any form of horizontal redistribution, these findings imply an additional cost for
Catalonia of EUR 8.5 bn. By contrast, Navarre and the Basque Country had a
surplus of 0.19% and 2.43% of GDP, respectively. Figure 17 expresses the
same in per capita terms. Regions are ranked according to per capita GDP in
ascending order. The diamonds indicate the per capita financial resources of a
region after redistribution; a value of 100 again corresponds to the national
average. Once again it becomes clear that Madrid and Catalonia are at a
disadvantage compared to the two regions outside the common system.10
Reforming a conflict-ridden system without creating or reviving other conflicts: A mission impossible?
A system of interregional redistribution will always have to strike a balance
between providing support for structurally weaker regions and preserving the
legitimate interests of the net contributors. However, the patently unequal
treatment of regions appears detrimental to the general acceptance of the
system. Concerning the regions with important autonomy movements, a few
central facts clearly stand out:
— Catalonia is a long-running net contributor to a system which achieves
substantial redistribution. This is hardly surprising given that the raison
d’être of a system based on solidarity is that the richer regions support the
poorer ones. Of course, a different – political – question is what degree of
fiscal solidarity is acceptable to the majority of Catalans. In light of the
complexity of the system, the barely comprehensible directions of flows and
the asymmetry between regions with different fiscal regimes, the discontent
of many Catalans becomes more understandable.
8 See de la Fuente, Barberán and Uriel (2014); information only available in Spanish.
http://www.minhap.gob.es/en-GB/Paginas/20140723_scpt.aspx 9 Other sources reach considerably differing conclusions in some cases. Pro-independence groups
usually claim that Catalonia has a much larger fiscal burden in the order of -6% to -8% of its GDP. 10
In addition, the tax burden is slightly lower in Navarre and the Basque Country.
ES
Balears
CA
NA
Madrid
BC
-10%
-5%
0%
5%
10%
15%
20%
15,000 20,000 25,000 30,000
Regions with fiscal autonomy have lower contribution levels 16
X-Axis: GDP per capita, EUR, 2012 Y-Axis: fiscal balance after equalisation,% GDP
Sources: de la Fuente et al. (2014), INE
60
80
100
120
140
160
180
200
GDP per capita Per capita financial resources after equalisation
Asymmetry between regions with/without fiscal autonomy 17
100 = national average
Sources: de la Fuente et al. (2014), Instituto Nacional de Estadistica, Deutsche Bank Research

Better off on their own?
10 | February 6, 2015 EU Monitor
— Even though the issue is central in the political debate, there does not
appear to be a specific anti-Catalan bias. At least concerning fiscal
redistribution, the often heard claim among Catalan nationalists that the
Spanish state systematically exploits Catalonia’s economic strength hardly
appears justified. After all, Madrid and the Balearic Islands contribute more
both in per capita terms and in terms of GDP.
— Special autonomy status generates significant financial advantages for the
Basque Country and Navarre. As both regions would be net contributors if
they were treated like the rest, this arrangement is clearly unfavourable for
all the other prosperous regions.
Despite the problematic aspects of the current regional equalisation scheme,
any attempt to achieve a substantial reform is bound to encounter strong
resistance. In principle, three approaches appear conceivable, but all of them
are problematic as well:
i. Other regions have repeatedly demanded a reduction of the advantages for
Navarre and the Basque Country stemming from their not being part of the
common system. However, both regions would fiercely resist any attempt to
alter the status quo to their disadvantage.
ii. A “small” solution, which would keep the ranking of the regions and only aim
at reducing the payments of the net contributors, would obviously be
opposed by the net recipients. However, as Catalonia is not the largest net
contributor in per capita terms, the scope for readjusting the system in
Catalonia’s favour is limited and the net effect would hardly be sufficient to
appease the pro-independence camp.
iii. Finally, Catalonia could be granted special status similar to that enjoyed by
the Basque Country and Navarre. While this would presumably be the
preferred solution of many Catalans it would inevitably trigger similar
demands from other wealthy regions (Madrid, La Rioja, the Balearic
Islands). However, such a solution would not only effectively eliminate the
regional equalisation mechanism but also undermine the Spanish national
state.
How the issue of regional finances and fiscal autonomy can be resolved in a
way that is satisfying for all groups involved will remain one of the key questions
for the territorial unity of Spain.
11
For more details on the establishment of the FLA see Vetter, Zipfel and Fritsche (2014). Small is
beautiful? Capital market funding for sub-sovereign authorities on the rise. Deutsche Bank
Research.
The indebtedness of Spanish regions during the crisis and the role of the Fondo de Liquidez Autonómico (FLA) 19
Since the peak of the financial and sovereign debt crisis, an additional – but often overlooked – dimension has been added to the fiscal links between
the highly indebted regions and the Spanish central state.
During 2010 and 2011 the risk premia of regional government bonds were rising even more steeply than for Spanish government bonds. Highly
indebted regions such as Catalonia almost completely lost access to capital market funding and needed to ask for emergency liquidity from the
Spanish government. In early 2012, Catalonia and eight other regions applied for government funding from the newly created Fondo de Liquidez
Autonomico (FLA). This new instrument centralised the raising of new capital for the regions and reduced their refinancing costs. Participation in the
FLA provides regions with long-term loans (10 years plus a 2-year grace period) at almost the same rate as the central government (10 basis points
above Treasury bonds). At the peak of the sovereign debt crisis, this was equivalent to an advantage of well over 100 basis points for all the
participating regions. In return, they had to accept strict fiscal conditionality and financial monitoring by the central government, which was a politically
contentious issue especially in Catalonia.11
The Spanish government has also imposed a ceiling on the costs of bond issuance by the regions. If an
Autonomous Community has to pay a premium which exceeds a certain threshold over Spanish government bonds of identical maturity, it can only
obtain financing via the FLA.
Catalonia is currently the largest borrower from the FLA (around 40% of the total volume) and received EUR 23.8 bn in various instalments during
2012, 2013 and 2014. Creating the FLA was not a cheap solution for the central government, though, since it resulted in risk being transferred from the
regions to the central authority and hence to higher risk premia for Spanish sovereign bonds. The fact that the central government increased its own
borrowing in order to lower the financing costs of Catalonia represents a direct fiscal transfer from the central government to Catalonia (and other
regions) due to the preferential borrowing rate of the FLA. In contrast, Navarre and the Basque Country did not need to apply for funding via the FLA.
Compared to Catalonia their debt level is much lower and they have a much better credit rating, not least due to the higher degree of fiscal autonomy.
0 5 10 15 20 25 30 35
Canary Islands
Madrid
Basque Country
Asturias
La Rioja
Castillia y León
Extremadura
Galicia
Cantabria
Aragón
Andalucia
Navarre
Murcia
Balearic Islands
Catalonia
Cast. La Mancha
Valencia
Regional debt in % of GDP 18
Q2 2014; FLA-regions in light blue
Sources: Banco de Espana, Deutsche Bank Research

Better off on their own?
11 | February 6, 2015 EU Monitor
Scotland: Increasing autonomy
Despite the existence of three levels of government, i.e. local authorities,
counties and the regions of England, Scotland, Wales and Northern Ireland, the
United Kingdom has historically always been a very centralised country. In
recent times, however, especially Scotland (and to a lesser degree Wales and
Northern Ireland) has gained considerable autonomy. Yet, surprisingly, this
does not apply to England, the largest region of the UK by far.12
The desire for
more autonomy and self-administration had already manifested itself very early
on in the founding of regional parties – in Wales, for instance, back in 1925 and
in Scotland in 1934. Until the end of the 1990s, though, non-regional parties
invariably dominated the elections in the different regions.
The strongest autonomy and/or independence movements are in Scotland – as
evidenced by the latest referendum. Driving this trend are not only emotional but
above all economic/financial factors, the latter in particular being the discovery
of North Sea oil in the late 1960s and its intensive exploitation after the 1973 oil
crisis. An initial referendum in 1979 on greater autonomy and establishment of a
local parliament produced no change. A Scottish parliament was not created
until 1999, only after a further referendum. Since then, its significance has
grown steadily. It has powers especially in the areas of education, agriculture,
health and justice. In Scotland's wake, Wales and Northern Ireland have also
been granted greater autonomy and self-administration. Comparable aspirations
to gain independence have scarcely been visible there to date. The relatively
poor economic performance is likely to have played a major role in this respect.
Scotland already largely autonomous with regard to expenditures
A look at the fiscal level finds that Scotland still only has very limited autonomy
on the revenue side. However, this is set to change in future (see below). On
the expenditure side, though, Scotland already enjoys far-reaching autonomy.
This enables differing emphasis on issues in various areas of its remit. For
example, in a host of areas – on the largest items of health and education in
particular – the Scottish government spends a per capita amount similar to the
national average.13
However, in some fields – such as business promotion,
agriculture and transport – it spends much more per capita than the national
average. Accordingly, though, it expends much less on science and technology,
for instance.14
All in all, it must be noted that in the area of public services Scotland reports
substantially higher spending than the rest of the United Kingdom. At last
reading (fiscal 2012/2013) total spending in Scotland came to around GBP 65
bn15
or roughly 9% of national expenditure of GBP 701.7 bn. This means that
total per capita spending in Scotland is also about 11% higher than at the
national level. The relatively higher expenditures in Scotland are not a short-
12
See Gwilym, Eurfyl ap (2014). United Kingdom, in: Lütgenau, Stefan (2014). Fiscal Federalism
and Fiscal Decentralization in Europe, pp. 61-73. 13
See Phillips, David and Tetlow, Gemma (2014). Taxation, government spending and the public
finances of Scotland: updating the medium-term outlook, IFS Briefing Note 148. June 2014, p. 10. 14
The reasons there are exceptions to the regional governments being able to decide freely on the
allocations available emerge partly from the fact that funds for investment cannot be converted
into current expenditure. However, conversion in the opposite direction is possible. See Gwilym,
Eurfyl ap (2014), p. 64. 15
Even though the Scottish government is responsible for a large portion of the expenditures there
are certain areas – such as defence and foreign relations – where related expenditure is the
responsibility of the central government (and is funded via the national budget). The Scottish
government therefore also factors in the expenditures at national level that benefit the inhabitants
of Scotland. All the data cited here are based on figures calculated by the Scottish government
under this definition. Expenditures calculated on this basis are published under the heading of
total managed expenditure (TME).
60%
70%
80%
90%
100%
110%
120%
1995 1998 2001 2004 2007 2010
Wales Northern Ireland
England Scotland
England** Scotland***
Regional income per capita in the UK 20
% of national average*
*Offshore income stripped out **Excl. London ***Incl. oil revenues Sources: Deutsche Bank Research, data from Eurostat, OECD
Science and technology
Public order and safety
International services
Defence
Employment policies
Education and training
Health
Environment protection
Personal social serv. and soc. protection
Public and common services
Recreation, culture and religion
Transport
Housing and community amenities
Agriculture, forestry and fisheries
Enterprise and economic development
Per capita expenditure in Scotland 21
Expenditures in Scotland in relation to UK average
Sources: Phillips, David and Tetlow, Gemma (2014),
Deutsche Bank Research

Better off on their own?
12 | February 6, 2015 EU Monitor
term phenomenon; the difference or gap of about 10% has existed since the
1980s at least.16
A well-developed system of fiscal equalisation as in Germany,
for instance, does not exist in the United Kingdom.17
Expenditures in Scotland
(as in Wales and Northern Ireland) have so far largely been funded via lump-
sum allocations from the (UK) national budget. Estimates show that the Scottish
government was responsible at the latest reading for around 70% of public
expenditure in that region (Wales 56%, Northern Ireland: 53%)18
; however, this
was generally not funded via local taxes, but via the allocations discussed.
The size of the allocations and thus the total expenditure level hinge on the
respective decisions taken in the framework of the (UK) national budget and of
the expenditures determined in England.19
The reason for this is that the annual
changes in the lump-sum allocations to the regions are largely based on a
mechanistic formula – the so-called “Barnett formula”. This formula, which came
into existence at the end of the 1970s, focuses on redirecting to the inhabitants
of Scotland (and also the other UK regions) the identical absolute per capita
changes (in GBP) of comparable services when there is a change in the
provision of services in England. It makes absolutely no attempt to determine
local needs, but instead considers to what extent tasks are decentralised, i.e.
delegated to the corresponding regional government.20
Since part of the task is
already funded by regional taxes, this is also taken into account when funds are
allocated.
The allocation formula has been heavily criticised for some time, both because
of Scotland's still relatively favourable position as well as the formula's
problematic reciprocal and/or incentive effects with taxes collected on a
decentralised basis. This reciprocal effect also influences the debate about
greater tax autonomy, because without a simultaneous change of the “Barnett
formula” an increase in tax autonomy can lead to greater regional disparity on
increases or cutbacks in lump-sum transfers and therefore on public
expenditures in relation to the different parts of the country.
Revenue autonomy being expanded
The decentralisation of expenditures and administration achieved since 1999 is
not (yet) mirrored on the revenue side. This is problematic from an economic
standpoint since it involves a violation of the principle of fiscal equivalence – i.e.
the linking of autonomous decisions via both expenditures and their funding –
and thus encourages the trend of steadily increasing expenditures. Until
recently, all taxes – except for those at the local authorities level – were
collected by the national tax authority. Moreover, the Scottish government –
alone among the regional governments – has had the right to raise the standard
rate of income tax by up to 3 pp. However, it has never made use of this right.21
Given that so far most taxes have been collected and administered at the
national level it is difficult to determine exact figures on the revenue volume
raised in the individual regions. This also applies to the tax revenues generated
on gas and oil production in particular. Relevant figures have become available
only recently from both the Scottish government and the national tax authority.
16
See Phillips, David and Tetlow, Gemma (2014), p. 6. 17
To a certain degree – this varies according to the region – the volume of local tax revenues (such
as the council tax) is collected and then distributed or redistributed between the local bodies of
government. See also IFS Green budget (2011), p. 13ff. 18
See Trench, Alan (2014), p. 321, in Lütgenau, Stefan (2014). Fiscal Federalism and Fiscal
Decentralization in Europe, pp. 321-341. 19
The following discussion applies in principle also to Wales and Northern Ireland. 20
For a more detailed discussion of the following two sections see Phillips, David (2014), p. 17ff,
Trench, Alan (2014), p. 322 and box 22. 21
See Gwilym, Eurfyl ap (2014), p. 65f and Stuart, A. et al., p. 332ff. Taxing an independent
Scotland, in: Oxford Review of Economic Policy, Volume 30, No. 2, pp. 325-345.
The "Barnett formula"* 22
Even before the formula was introduced at the
end of the 1970s Scotland in particular
reported higher allocations per capita, so the
expenditure level per capita was also higher
than in England. The formula was designed at
the time in such a way that on equal population
growth in Scotland and England this initial
difference would have been neutralised over
the course of time. Owing to the longlasting
relatively smaller growth of the Scottish
population, however, this effect has so far
failed to materialise.
The differing degree of decentralisation is
taken into account by various factors. To this
end, a value between 0% (not decentralised)
and 100% (fully decentralised) is set for all
ministerial sub-programmes. This is to take
into account that certain expenditures are only
incurred in England, for example. This is the
case if these expenditures are decentralised
and not funded from the national budget in all
regions. For instance, the national transport
ministry is the competent authority only in
England and Wales when investment in the
railway network is increased. Wales is thus
given the value of 0% in this category and
therefore does not obtain extra funding if there
are plans to increase this item in the (UK)
national budget. Scotland and Northern Ireland
receive the factor 100% and are therefore
accorded higher funding for investment to the
same extent as England and Wales. Therefore,
there are numerous different factors in a
national comparison.
*See Phillips, David (2014) for a detailed discussion.
Business as usual? The Barnett formula, business
rates and further tax devolution. IFS Briefing Note BN
155, chapter 2 in particular.

Better off on their own?
13 | February 6, 2015 EU Monitor
However, these generally differ from one another. This problem is all the more
acute when the issue is distributing the tax revenues generated on North Sea oil
and gas production.
Disregarding these “offshore” revenues, per capita tax receipts in Scotland, at
98.3%, are slightly below the national average.22
By contrast, including the
“offshore” revenues (defined according to Scotland's geographic share of the
North Sea), the latest reading puts the share at 108.5% (2008/2009: still
122.6%). The offshore revenues are very volatile, with their share most recently
having nearly halved within a year (fiscal 2011/12 to 2012/2013); the same
applies to the share in total Scottish taxes (from 21% to 12%). From a fiscal
standpoint Scotland's public finances thus depend heavily on oil and gas
production. Proponents of independence should keep that in mind, particularly
in light of the recent drop of the oil price. In fiscal 2012/13 the offshore receipts –
unlike in most of the preceding years – were unable to plug the gap between
expenditures and revenues excluding offshore.
Autonomy in the area of tax policy is to be significantly expanded in the coming
years (2015 and 2016)23
. In 2012 (as part of the Scotland Act 2012), the region
saw the establishment of a local tax authority (Revenue Scotland) and Scotland
was given the right to impose taxes on land and property transfers24
as well as
to introduce new taxes (with the authorisation of the UK Parliament in London).
As of 2016 the Scottish government will also be able to have a say on the use of
a share of the national income tax (SRIT). The related law defines who is a
Scottish income taxpayer: put simply, this depends on the taxpayer's place of
residence. Income tax will continue to be administered by the national tax
authority. However, the Scottish government may make autonomous decisions
on a Scottish income tax rate. This will be like a surcharge on the national
income tax. In turn, the national tax rate will be cut across the board by 10 pp.
So if the Scottish government sets a rate of this magnitude, the full tax burden
on the Scottish taxpayer will not change at all. If the rate is higher, the tax
burden for Scottish taxpayers will increase in relation to the national rate. If it is
lower than 10%, the Scottish taxpayer will have a smaller burden. So if, for
example, the Scottish rate of income tax (SRIT) is 9%, the tax load on Scottish
income taxpayers will be 19%, 39% or 44% (the current rates in the UK are
20/40/45%, depending on the level of taxable income). The Smith Commission
set up at the time of the Scottish referendum recently proposed, inter alia, even
further-reaching plans for more tax autonomy. The statutory requirements for
this have been mapped out just recently (see box 23).
If the additionally planned changes are adopted, the concessions made to
Scotland should – at least from a financial perspective – actually suffice to
address key demands being made by independence advocates.
22
For more on the numbers see David and Tetlow (2014). Particularly the per capita volume of
income tax falls short of the UK average in Scotland. 23
Ibid. From 2015 Scotland is also be allowed to issue its own bonds worth up to a maximum of
GBP 2.2 bn and thus borrow at its own discretion. 24
These will replace the UK Stamp Duty Land Tax (SDLT) and the UK Landfill Tax.
Plans for further tax autonomy 23
On the basis of the recently published Smith
Commission Report (Nov. 27, 2014), compiled
by a commission comprising representatives of
all of Scotland's political parties, further
taxation powers, inter alia, are to be devolved
to Scotland in response to the September
referendum.
Firstly, the report proposes to enable the
Scottish parliament to largely set income tax
rates and brackets itself (while all other
aspects of income tax remain in the hands of
the national parliament, including income tax
on savings interest and dividends, personal tax
allowance, deductions etc.). The lump-sum
allocations are to be reduced accordingly.
Secondly, in future the first 10 pp of VAT will
flow to the Scottish budget. Here, too,
allocations are to be cut back accordingly.
All the other taxes and duties, including social
security contributions, corporation tax, taxes on
oil and gas production and consumption taxes
in particular, remain unaffected by these
changes and will continue to be dealt with in
the national parliament.
With presentation of the working paper
Scotland in the UK: An enduring settlement
(Jan. 22, 2015), the legislation process for a
new Scotland Bill has been launched.
For a detailed discussion see: The Smith Commission
(2014). Report of the Smith Commission for further
devolution of powers to the Scottish Parliament.
27 November 2014.

Better off on their own?
14 | February 6, 2015 EU Monitor
Belgium: Increasing division
Belgium is a deeply divided country, both politically and socially. Following the
parliamentary elections in 2010 it took 541 days to form a government. The
underlying political conflict has been smouldering for much longer, though. In
the Flemish parts of the country a substantial swath of the population calls for
independence for Flanders. In Belgium's 2010 parliamentary elections some
44% of the votes in Flanders were cast for the independence parties N-VA
(31.7%) and Vlaams Belang (12.3%). By contrast, in the French-speaking parts
of the country a majority of the parties, such as the Socialists, who are the
strongest political force, call for a strong central state and no further division of
the country.
The country's empty public coffers – public debt came to 104.5% of GDP in
Belgium in 2013 – further exacerbated the conflict in the course of the financial
crisis. In the economically thriving northern part of the country (58% of economic
output) the view is widely held that ultimately the north always has to foot the bill
for the south. Besides Flanders in the northern half and Wallonia in the southern
half, Belgium also comprises the Brussels-Capital Region, which has a special
role. Even though the Brussels-Capital Region is completely surrounded by
Flanders, its population is largely francophone.25
The country is split noticeably along economic lines: per capita income in
Flanders (at EUR 33,600) is more than one-third higher than in Wallonia (EUR
24,600). Brussels (EUR 62,000), as a city region in its own right and seat of the
European institutions, has a special position in this context. The unemployment
rate in Flanders is also much lower than in Wallonia (5.0% to 11.3%), as is the
poverty rate (9.8% to 19.2%). There are even marked differences in life
expectancy (81.4 years to 78.9).
Today's diverging economic conditions between north and south only developed
in the course of the past 60 years. In 1955, Wallonia was still the more affluent
part of Belgium. Rich in iron and coal, this area prospered economically
following World War II. The 1960s saw the start of the downturn there, with
Flanders subsequently assuming the leading economic role from the 1970s. In a
comparison with other European countries (EU-15) it is striking that the gap that
was opened up between the two regions is mostly due to the poor performance
in Wallonia and not so much to the economic success in Flanders. Since 2000
the gap between the two regions has not grown any larger.
On a societal level, the situation in Belgium has eased of late. Following the
formation of a government in 2011 the constituent parties concluded
negotiations agreeing the so-called “sixth State Reform”26
. Its main focus is on
the continuation of decentralisation efforts that got underway with an initial
reform in 1970. The new arrangement came as a direct result of the political
conflicts and accommodated the Flemish desire for greater self-determination.
Thanks to the far-reaching concessions of the central government the
independence debate temporarily lost some of its momentum. In the
parliamentary elections of 2014 the share of the vote for the N-VA and Vlaams
Belang in the Flemish regions also decreased by around 6 pp, to 38.3%.
25
In 57% of the households in Brussels French is the only language used for everyday interaction,
while 9% speak French and Dutch and 11% speak French and a different language. By contrast,
Dutch is the sole language spoken in only 7% of Brussels households, and neither of the two
languages is used in the other 16%. 26
"State Reform" has taken place in different stages, beginning in 1970. The initial reform was
followed by programmes in 1980, 1988/89, 1993, 2001 and 2014.
Brussels 19%
Flanders 58%
Wallonia 23%
% , 2011
Belgian GDP: Regional shares 24
Source: Eurostat
0 20,000 40,000 60,000
Brussels
Antwerp
Vlaams-Brabant
Brabant Wallon
West-Vlaanderen
Oost-Vlaanderen
Limburg
Liège
Namur
Luxembourg
Hainaut
GDP per capita
GDP per capita in the provinces of Belgium 25
Red: Flemish provinces
Soruce: Eurostat
50
60
70
80
90
100
110
1955 1985 2005
Wallonia Flanders
Wallonia and Flanders switch roles 26
GDP per capita, % of EU-15 average
Source: Leibfritz (2009)

Better off on their own?
15 | February 6, 2015 EU Monitor
Decentralisation continuing apace
Efforts to decentralise state structures have been underway for a long time. The
biggest changes came with the State Reform at the end of the 1980s. At that
time, the ratio of public expenditure at the regional level increased from 13.0%
to 28.1%. Since then, the percentage has climbed almost continuously, driven
partly by further reforms in 1993 and 2001, and reached 36.4% in 2012. The
ratio is expected to increase further in future. The recently adopted “sixth State
Reform” additionally reinforces the tax-collecting competences of the regions
and guarantees the municipalities27
higher transfers from the central
government, expanding the responsibilities of the regions at the same time. The
amended version of the “Loi spéciale de financement” only took effect in
summer 2014 and therefore its impact will not materialise until sometime in
future. All in all, it will transfer further budget funds equalling 4.7% of Belgian
GDP from the central government to the regions.
The bulk of tax revenue to date has been generated at the central level,
although a substantial portion has automatically flowed to the regions. In 2013
these funds added up to 64.6% of regional receipts, mainly from shares in
income tax and value added tax. The latest reform changes the existing
mechanism with regard to income tax: from 2015 the regional governments will
receive about 25% of the income tax volume collected. This will be implemented
by a type of surcharge, i.e. the regions will have a limited right to set tax rates,
tariff/tax classes and deductions themselves. As a result, the share of receipts
from local taxes in the regions will rise to 73.3%. Value added tax will continue
to be collected entirely by the central government and about 50% of receipts will
be handed on to the regions according to a given formula.28
As regards lower-
volume taxes, the regions often already have a far-reaching level of autonomy.
Regional transfers: Flanders pays, but how much?
An equalisation mechanism has been in place between the regions since 1988.
The equalisation payments are transacted by the central government. At
present, transfers flow to both Wallonia (approx. 0.2% of GDP) and Brussels
(approx. 0.1% of GDP), but not Flanders. In fact, ever since the system was
introduced no funds have been transferred to Flanders, whereas Wallonia has
been receiving annual transfers since 1988 and Brussels since 1997. This
system, too, was tweaked in the framework of the latest State Reform, which will
lead de facto to a slight decrease in the transfers to Wallonia in the medium
term. The decisive factor for the calculation is income tax per capita and the
extent to which it deviates from the national average. If a region falls short of this
average, it receives transfers.
The volume of the total interregional transfers cannot be measured directly.
Since, unlike in Germany, for instance, payments between the regions are not
reported, their volume can only be estimated using workaround methods. The
estimates are often already slightly outdated, since important indicators on tax
and social security transfers are only published with a time lag. A study
conducted by the KU Leuven (Buyst et al., 2012) puts the transfers from
Flanders in 2009 at 1.78% of national GDP, of which 0.08% went to Brussels
and 1.7% to Wallonia. In methodological terms, the difference is taken between
the income generated in the regions as a result of taxes and social security
deductions and the allocations that return via transfers from the central
27
Apart from the regional governments there are also linguistic communities which shoulder certain
tasks of state – such as education in particular – and receive funds from the central government
for doing so. To simplify matters, we shall not differentiate explicitly in the following between the
two and shall group them under the term "regions". 28
Besides the tax revenues generated in a region, a role is also played by population distribution.
0%
5%
10%
15%
20%
25%
30%
35%
40%
85 87 89 91 93 95 97 99 01 03 05 07 09 11
%, 1985-2012
Belgium: Public expenditure at regional level 27
Shaded area: State Reform
Source: OECD
0%
10%
20%
30%
40%
50%
60%
70%
80%
90%
100%
Flanders Wallonia Brussels
Before After
Revenues from regionally imposed taxes before/after State Reform 2014 28
% of total revenues
Source: NBB
-5%
-4%
-3%
-2%
-1%
0%
1%
2%
3%
4%
5%
2007 2008 2009
Flanders Brussels Wallonia
Net interregional transfers 29
% of Belgian GDP
Source: Buyst et al. (2012)

Better off on their own?
16 | February 6, 2015 EU Monitor
government and the social insurance plans. The authors refer to the years 2008
and 2009 as exceptions since at the time funds were retained at the central
level to finance efforts to manage the crisis. In future, the transfers are to run
again in the dimensions seen in 2007 when Flanders transferred 4.79% of GDP
to Brussels (0.23%) and Wallonia (4.55%).
According to a different study conducted by the National Bank of Belgium (Dury
et al., 2008), however, Flanders' payments in 2005 were only equivalent to 1.9%
of national GDP. Hence, the exact volume of interregional transfers is difficult to
pinpoint. The fact that Wallonia benefits from the Belgian system more than
Flanders at least in financial terms is obvious, though, considering the economic
differences.
Even though the latest State Reform pledges greater autonomy to the regions,
at least the direction of the transfer flows is surely not about to change in the
foreseeable future. Whether the temporary easing of the conflict as a
consequence of the ongoing decentralisation of government will continue in
future remains to be seen. It is also doubtful whether Flanders will be able to
maintain the scale of its large economic lead over Wallonia in the first place.
Forecasters expect the population to age more quickly in the Flemish region,
meaning that in future lower tax receipts there may possibly be set against
higher pensions and social security claims, so the payment streams could
decrease in this way.
Italy: Large gulf between north and south
Like in Spain, there are asymmetries also in Italy in terms of the constitutional
position of its regions. Italy is composed of 20 regions in total, five of which
(Valle d'Aosta, Friuli-Venezia Giulia, Sardinia, Sicily and Trentino Alto Adige
[=South Tyrol]) have special autonomy status. This means that, unlike in Spain,
there are regions at both the upper end and the lower end of regional income
distribution that enjoy this special status. The regions in question have
additional powers and greater financial autonomy in respect of healthcare and
education as well as public infrastructure. Trentino Alto Adige is a special case
again in this context, as the regional level of government there has mainly a
coordinating role. With the special status for Trentino Alto Adige the core
competences were essentially handed to the next-lower level, i.e. to the
autonomous provinces of Bolzano-Alto Adige and Trentino. By contrast, Veneto
only has the status of a “normal” region, such as Lombardy or Emilia-Romagna,
which are also among the regions with the highest per capita income.
Since 1995, South Tyrol, Veneto and Lombardy have lost a bit of ground in
income terms on a national comparison. This is to be explained in particular by
catch-up effects among the economically weaker southern regions during this
period. Recently, however, the gaps between South Tyrol and Lombardy vis-à-
vis the rest of the country have widened again (see chart 30).
Regional outlays are mainly funded via pro rata and locally imposed tax
receipts. Among the regions with regular status these accounted for about 77%
of total revenues in 2008, and among those with autonomy status about 82%.
Nearly 50% of this total is attributable to the share in the value added tax.
However, this share is not proportional to the regional receipts and has a
horizontal redistribution component, equating it in principle with a transfer.29
29
See E. Longobardi (2011). From transfers to tax "co-occupation": the Italian reform of
intergovernmental finance. Working paper, p. 9.
110%
115%
120%
125%
130%
135%
1995 1998 2001 2004 2007 2010
South Tyrol Veneto Lombardy
GDP per capita in South Tyrol, Veneto and Lombardy 30
% of national average
Source: Istat
0%
20%
40%
60%
80%
Taxes Transfers (central gov’t
and EU)
Other revenues
Regular status Autonomy status
Revenues in regions with regular status and autonomy status 31
2008, % of total regional revenues
Source: Longobardi (2011)

Better off on their own?
17 | February 6, 2015 EU Monitor
Generally, the regions have little freedom to impose their own taxes, even
though their tax autonomy was slightly expanded in the wake of the
constitutional reform of 2001. On the apportionment side, they also have little
latitude since they have to expend the lion's share on funding the health system,
which is a regional-level duty.
Given the differences firmly established for decades between the economically
strong northern part of the country and the weak southern part, the issue of
regional redistribution has long been a matter of heated controversy. In some
areas of the northern region parties aiming for autonomy have at times been the
strongest political groups. The Northern League, which called for the secession
of the northern half to form the “Republic of Padania” in the 1990s, is currently in
power in the regional governments of Lombardy and Veneto. There,
dissatisfaction with Rome and the impression that they have to subsidise the
rest of the country are very widespread. In each and every one of the seven
parliamentary elections held in Italy since 1992 this has been manifested in an
average share of over 18% of the vote for the Northern League.30
In Friuli-
Venezia Giulia and in Piedmont the Northern League has likewise averaged
over 10% of the ballot. The League does not have a strong base in South Tyrol
because the electorate there usually cast over half their votes for the region's
own political parties.
Transfers from northern Italy to the “mezzogiorno”
It is undisputed that northern Italy carries the main burden of regional
equalisation. This is the conclusion reached despite methodological differences
in diverse politically independent studies that have sought over the past few
years to calculate the net flows in Italy's financial equalisation scheme. Chart 33
illustrates the regional per capita payments, with a positive value signifying a net
payer position. In all these analyses, Lombardy, Veneto and Emilia-Romagna
rank in first, second or third place. All the regions south of Rome are net
recipients.
Given the absence of comparable datasets, differing base years and the fact
that different methods were used to calculate the net fiscal transfers, the
concrete per capita payments vary appreciably in some cases, although the
ranking is usually very similar. The most recent study and at the same time the
most convincing one in methodology terms was conducted by Ambrosanio et al.
(2010).31
This holds especially since the per capita transfers (in light blue) are
indeed calculated as a zero-sum game between the regions, i.e. produce a per
capita transfer of 0 on average.32
The scale of the resultant redistribution is
huge. It suggests that (on average) taxpayers in Lombardy see about 30% of
their taxes go to the poorer regions via transfers. Conversely, the residents of
Calabria receive 55% more than they pay in taxes themselves.
It is striking that among the first five regions there are none with autonomy
status. The first of these is South Tyrol in sixth place which, according to
calculations by Ambrosanio et al., is a borderline net payer.33
As in the case of
30
In the last two elections, however, the Northern League had a rather poor showing. In the
European elections in 2014 it obtained merely 6.16% (combined with the South Tyrol party called
"Die Freiheitlichen"), and at the last Italian parliamentary election in February 2013 only 4.09%. 31
Ambrosanio, M., Bordignon, M., and Cerniglia, F.M. (2010). Constitutional reforms, fiscal
decentralization and regional fiscal flows in Italy. In N. Bosch, M. Espasa and A. Solé Ollé (eds.).
The Political Economy of Inter-Regional Fiscal Flows, pp. 75-107. Cheltenham, Edward Elgar. 32
Given differing calculation methods the other studies show a positive overall balance, which might
partly result from factoring in EU transfers. 33
The fact that most of the studies rank Trentino Alto Adige and the Valle d'Aosta among the largest
net recipients is due to the complex calculation method and the relatively small population. The
difference can be largely explained by Ambrosanio et al. having used what is known as the
"benefit approach". This means that expenditure categories showing public goods that benefit all
0 5 10 15 20
Lombardy
Veneto
Friuli-Venezia Giulia
Piedmont
Liguria
Trentino Alto Adige
ITALY
Emilia-Romagna
Tuscany
Marches
Umbria
Northern League performance in elections to Italian parliament, 1992-2013 32
%, average for all elections
Sources: Italian Ministry of Interior, Deutsche Bank Research
-4000 -2000 0 2000 4000 6000
Lombardy
Veneto
Emilia-Romagna
Lazio
Piedmont
Trentino Alto Adige
Friuli-V. G.
Tuscany
Marches
Valle d’Aosta
Liguria
Abruzzo
Umbria
Apulia
Campania
Basilicata
Sardinia
Molise
Sicily
Calabria
Ambrosanio et al. 2005
Arachi et al. 1996-2002
Brosio, Revelli 1997
Fondazione Agnelli 1995
EUR per capita; positive balance = net payer; data based on year(s) indicated below
Lombardy and Veneto highest net payer regions in Italy 33
Sources: Ambrosanio et al. (2010), Arachi et al. (2006), Revelli (2003), Fondazione Agnelli (1998)

Better off on their own?
18 | February 6, 2015 EU Monitor
Spain, special autonomy status appears to generate fiscal advantages also in
the Italian system. The widespread desire for greater autonomy in affluent
regions, such as Lombardy and Veneto, therefore seems understandable.
Germany and France: Autonomy movements have no major political significance
In connection with European autonomy movements it is of no small interest to
see where such movements fail to attract a major following, as in France and
Germany for instance. This is noteworthy because the two largest EU member
countries may be seen as opposite poles in terms of decentralisation and
federalism – with France and its centuries-long tradition of strong centralisation
set against historically fragmented federal Germany. Indeed, France has both
"Basque" and "Catalonian" areas on its border to Spain, although there the
desire to secede from France does not enjoy broad-based support. The more or
less Bilingual Alsace does not have any strong autonomy movement either. One
of the main exceptions is Corsica. There has been a string of separatist attacks
there over the past few decades. In the meantime, though, the largest separatist
organisation has declared its intention to abandon its armed struggle for
independence. The Brittany region has also been home to autonomy efforts – albeit
with varying intensity – for centuries. However, separatist parties and movements
do not play any significant role there at present. In Germany's case, Bavarians are
probably the population group with the greatest awareness of their regional
heritage, yet this has not led to a significant independence movement. No doubt a
major reason for this is that the Länder have extensive competences in key policy
areas and play an important part in national legislation via the Bundesrat, the
second chamber of parliament.
Germany and France are at opposite ends of the spectrum also with regard to
income disparity. Chart 35 illustrates the percentage difference between the 20%
quantile and the 80% quantile of regional per capita GDP.34
It indicates the
amount by which GDP per capita in a region that just barely qualifies for
inclusion in the best 20% outstrips GDP in a region that falls by a whisker into
the lowest 20%. This measure of disparity thus eliminates distortions caused by
outliers such as Paris, Brussels or metropolitan London with their far above
average incomes. Going by this metric, France is the country with the most
egalitarian society. This naturally provides less fertile ground for horizontal
distribution conflicts than in other countries, which probably reduces the
economic motivation for independence.
Excluding metropolitan London, regional income distribution would be relatively
egalitarian in the United Kingdom, too. In Spain and Belgium, the income
disparities are considerably bigger, but by no means do they play in the same
league as Italy. Germany is a special case on account of the country's
reunification, because if the east German states were excluded the regional
income disparities would actually not be excessively pronounced by European
standards.
In Germany there is a large degree of financial integration between the
Federation, the Länder (the individual federal states) and the municipalities. This
is the result of the division of responsibilities prescribed by the Basic Law, the
Italians are not charged to the geographical area where they are incurred, but instead are
allocated to all the regions on a proportional basis. This applies to, say, public administration,
which is primarily linked with the capital city of Rome, but also to national defence, which causes
disproportionately high spending in border regions and given the small population in South Tyrol
and the Valle d'Aosta appears there as a high net transfer in the so-called "cost approach". 34
To obtain a comparable number of regions for analysis, we look at the NUTS 1 level for Germany
and the United Kingdom, and the NUTS 2 level for Spain, France, Italy and Belgium.
Bavaria and the Federal Republic of
Germany 34
Bavaria is Germany's largest Land (federal
state) in terms of area and the second largest
after North Rhine-Westphalia in terms of
population with roughly 12.6 m inhabitants. It
has the highest per capita GDP of all the
territorial states at 114% of the average.
Bavaria generates nearly 18% of German
GDP. In a comparison of the regions discussed
in this report (and disregarding the city regions
of London and Brussels) there are only two
subregions (Antwerp in Flanders [BE] and
South Tyrol [IT]) with a higher GDP per capita.
In absolute figures, Bavaria is a key player also
in a European comparison. By population, it
would rank at No. 10 among all the EU states
and thus ahead of countries such as Belgium,
Czech Republic and Portugal. This applies to
GDP in absolute figures, too: Bavaria would
rank 7th in the EU, after the Netherlands.
Bavaria's comparatively dynamic economic
growth especially since the end of the 1970s
has fed through positively also from a fiscal
standpoint. While Bavaria, among others, had
always been a recipient Land in Germany's
financial equalisation system until 1988, it has
been a donor ever since 1993. Since 1995,
Bavaria has paid about EUR 2.4 bn annually
on average (equalling roughly 0.6% of
Bavarian GDP on average) or around EUR 200
per capita into the actual Länder financial
equalisation programme in the narrow sense.
The Bavaria Party, which advocates an
independence referendum, has not been
represented in the state parliament since the
1970s. However, in Bavaria's first postwar
elections (back in 1949 and 1954), the party
gained no less than 17.9% and 13.2% of the
vote respectively.
30%
15%
22%
41%
48%
61%
70%
0%
10%
20%
30%
40%
50%
60%
70%
FR GB ES BE DE IT
Germany excl. east German Länder
Relationship between 20% and 80% of regional per capita GDP 35
Differences in %, 2011
Sources: Eurostat, Deutsche Bank Research

Better off on their own?
19 | February 6, 2015 EU Monitor
sharing of tax revenues, their redistribution between the different levels of
government and the co-financing of many tasks. On balance, about 70% of total
tax receipts are split up and redistributed between the different levels of
government in a four-stage process. The basis of allocation, in principle, is the
ratio of actual revenues35
to a notional income. The system harbours substantial
incentive problems owing to the high absorption rates for recipient countries;
these undermine their own efforts to bolster their economic strength and/or
revenue-generating capacity.36
Unlike in Spain though – as long as certain
direct transfers from the Federation to several Länder are stripped out of the
equation – the financial equalisation system does not alter the pecking order of
the Länder by fiscal capacity.
A reform of financial relations in the German federal system and thus also of the
redistribution mechanisms – which is also a statutory obligation that must be
fulfilled by 2020 at the latest owing to the expiry of current arrangements –
requires overcoming the Gordian knot as well. As there are significant
differences in economic strength, every change will produce winners and losers.
Chart 36 shows that especially the east German Länder continue to exhibit a
significantly lower revenue-generating capacity than the west German Länder.
The city-states assume a special role. The extent of losses and gains depends
on the degree of redistribution, which ultimately has to be determined politically.
Despite this extensive redistribution system, though, there are no aspirations to
achieve autonomy or even independence.
The financial illusion of independence
The desire for special rights, far-reaching autonomy or even independence is
supported to a relatively large extent by a belief in the economic strength of the
given region. The financial implications resulting from de facto independence go
beyond the savings achieved by exiting the regional financial equalisation
scheme of the respective country. Despite the fact that advocates of
independence like to gloss over the potential risks, even in the event of
immediate membership of the single European market and the eurozone there
would be a number of potential financial disadvantages:
— Higher costs of borrowing: The disadvantage of small countries may be
illustrated by comparing Germany and Austria. Even though Austria has a
higher per capita GDP, lower sovereign debt and a nearly identical
unemployment rate, the risk premium on Austrian bonds is higher. Due to
the much lower issuance volume Austrian bonds are perceived to be less
liquid, so investors demand a liquidity premium. If Scotland had attained
independence it would also obtain a good rating, but nonetheless it would
have to pay a premium on British bonds.37
For Catalonia, which according to
the several rating agencies currently does not even rate as “investment
grade”, it would be a much more expensive undertaking. While the Basque
Country and also Navarra currently has a better rating than Spain with some
agencies, in fact, in the event of independence the implicit central
government guarantee would disappear, possibly also weighing negatively
on the rating. Conversely, though, a loss of economically strong regions
would also jeopardise the Spanish rating and entail higher funding costs.
35
The definition of actual revenues in this context, i.e. of fiscal capacity, is itself subject to huge
discretionary latitude, however, so a purely objective determination of the degree of redistribution
is extremely difficult. 36
See also: Bundesbank (2014). The reform of financial relations in the German federal system in:
Monthly Report. September 2014, pp. 33-52. 37
If Scotland were independent it could reckon with an A rating, i.e. down several notches on the
UK's Aa1 rating. See Moody’s (2014). Rating Scenarios for an Independent Scottish Sovereign.
50 75 100 125 150
Hamburg
Bavaria
Hesse
Baden-Wuerttemberg
North Rhine-Westphalia
Rhineland-Palatinate
Lower Saxony
Schleswig-Holstein
Bremen
Berlin
Saarland
Brandenburg
Saxony-Anhalt
Saxony
Thuringia
Mecklenburg-Western Pomerania
Before financial equalisation*
After financial equalisation**
* VAT shares fully distributed by population
** After preliminary (horizontal) VAT equalisation, Länder financial equalisation and general supplementary federal grants
Strongly diverging fiscal capacity in Germany 36
% of per capita average, values for unweighted population, incl. municipal taxes
Sources: Bundesbank, Deutsche Bank Research

Better off on their own?
20 | February 6, 2015 EU Monitor
— Financial burden from assumption/distribution of legacy debt. Both Spanish
regions would have to assume a considerable share of Spain's sovereign
debt. Scotland would also have to shoulder a share of national debt.
Whether this would be calculated on the basis of relative GDP figures,
population or past financing balances, would ultimately be decided by a
political negotiation process. Depending on the division, though, this would
result in substantial fiscal burdens for the then independent regions.
— Disruptive trade effects: The rest of Spain is by far the largest trading partner
for the Basque Country and Catalonia; the same applies to the United
Kingdom in the case of Scotland as well as to Italy with Veneto. This shows
that despite the single European market national borders often continue to
play a significant role. Even though trade between Spain and Catalonia
would of course not stop altogether, it seems exceedingly unlikely that the
intensive trade relations would survive a (possibly discordant) separation
without sustaining any damage whatsoever. The fact that about three times
as many Catalonian goods are “exported” to other regions of Spain as to the
geographically comparable and much larger France impressively shows that
borders (whether political, linguistic, cultural …) still play an important part in
a united Europe.
It has to be affordable!
At this point it is not our objective to do the sums for every region on how much
it could gain, or perhaps lose, in the event of separation. However, it is important
to understand that such an emotionally charged issue may occasionally cloud
the view of the economic realities. Setting up an independent administration,
international representative offices, a military defence organisation etc. naturally
comes at a price. Objectively speaking, there are not many channels via which
independence can actually generate financial advantages. One of the few, and
perhaps the most obvious, is the disappearance of financial transfers to other
parts of the country. Thus, only in a prosperous region (relative to the rest of the
country) is it possible to maintain the fiction that going it alone would be the
better option. In other words: one has to be able to afford it.
Frank Zipfel (+49 69 910-31890, [email protected])
Stefan Vetter (+49 69 910-21261, [email protected])
Daniel Pietzker
© Copyright 2015. Deutsche Bank AG, Deutsche Bank Research, 60262 Frankfurt am Main, Germany. All rights reserved. When quoting please cite
“Deutsche Bank Research”.
The above information does not constitute the provision of investment, legal or tax advice. Any views expressed reflect the current views of the author,
which do not necessarily correspond to the opinions of Deutsche Bank AG or its affiliates. Opinions expressed may change without notice. Opinions
expressed may differ from views set out in other documents, including research, published by Deutsche Bank. The above information is provided for
informational purposes only and without any obligation, whether contractual or otherwise. No warranty or representation is made as to the correctness,
completeness and accuracy of the information given or the assessments made.
In Germany this information is approved and/or communicated by Deutsche Bank AG Frankfurt, licensed to carry on banking business and to provide
financial services under the supervision of the European Central Bank (ECB) and the German Federal Financial Supervisory Authority (BaFin). In the
United Kingdom this information is approved and/or communicated by Deutsche Bank AG, London Branch, a member of the London Stock Exchange,
authorized by UK’s Prudential Regulation Authority (PRA) and subject to limited regulation by the UK’s Financial Conduct Authority (FCA) (under
number 150018) and by the PRA. This information is distributed in Hong Kong by Deutsche Bank AG, Hong Kong Branch, in Korea by Deutsche
Securities Korea Co. and in Singapore by Deutsche Bank AG, Singapore Branch. In Japan this information is approved and/or distributed by Deutsche
Securities Limited, Tokyo Branch. In Australia, retail clients should obtain a copy of a Product Disclosure Statement (PDS) relating to any financial
product referred to in this report and consider the PDS before making any decision about whether to acquire the product.
Printed by: HST Offsetdruck Schadt & Tetzlaff GbR, Dieburg
Print: ISSN 1612-0272 / Internet/E-mail: ISSN 1612-0280