Embed Size (px)
Citation preview

Best Practices Improvements: Nitrogen Pretreatment Performance of Land Based Wastewater Treatment Systems
June 2016
Minnesota Pollution Control Agency 520 Lafayette Road North | Saint Paul, MN 55155-4194 |
651-296-6300 | 800-657-3864 | Or use your preferred relay service. | [email protected]
This report is available in alternative formats upon request, and online at www.pca.state.mn.us.
Document number: wq-wwprm8-02
Authors Minnesota Pollution Control Agency Corey Mathisen Bill Priebe Natural Systems Utilities Shane Symmank Steve Kokesh Jascha Pettit
The MPCA is reducing printing and mailing costs by using the Internet to distribute reports and information to wider audience. Visit our website for more information.
MPCA reports are printed on 100% post-consumer recycled content paper manufactured without chlorine or chlorine derivatives.
Contents Executive summary ............................................................................................................................3
Introduction and scope of work ..........................................................................................................4
Cambridge-Isanti Middle School .........................................................................................................4
Diamond Lake Woods ........................................................................................................................7
Farms of Lake Elmo ............................................................................................................................9
Preserve at Birch Lake ...................................................................................................................... 12
River Park ........................................................................................................................................ 15
Riverwood Hills ................................................................................................................................ 18
Sanctuary ........................................................................................................................................ 21
Trophy Lake Estates ......................................................................................................................... 23
West Lake George .............................................................................................................................................. 26
Whispering Ridge East ...................................................................................................................... 28
Appendix A-Table 1 .......................................................................................................................... 34
Appendix B-Table 2 .......................................................................................................................... 35
AppendixC-Aerobic Treatment Unit .................................................................................................. 36
Appendix D-Constructed Wetland .................................................................................................... 40
Appendix E-Geo-textile Filter Module ............................................................................................... 44
Appendix F-Recirculating Gravel Filters ............................................................................................. 49
Appendix G-Sequencing Batch Reactor ............................................................................................. 54
Tables Table 1. The analytical parameters and methods used by Pace Analytical Service, Inc. to determine the sampling parameter results for all samples collected for the LBWPS project. ..................................... 34
Table 2. Summary of analytical results and operational improvements. Compliance is based on a 10-mg/L effluent total nitrogen limit for all sites except Whispering Ridge East which has a 12-mg/L effluent total nitrogen limit. * Operational improvements in italics were identified and completed after the second round of sampling was complete. ........................................................................... 35
Figures Figure 1. Flow Schematic: Cambridge-Isanti Middle School WWTP ......................................................5
Figure 2. Effluent Nitrogen series: Cambridge-Isanti Middle School WWTP ..........................................6
Figure 3. Flow Schematic: Diamond Lake Woods WWTP, .....................................................................7
Figure 4. Effluent Nitrogen series: Diamond Lake Woods WWTP. ........................................................9
Figure 5. Flow Schematic: Farms of Lake Elmo WWTP ....................................................................... 10

Figure 6. Effluent Nitrogen series: Farms of Lake Elmo WWTP. .......................................................... 12
Figure 7. Flow Schematic: Preserve at Birch Lake WWTP ................................................................... 13
Figure 8. Effluent Nitrogen series: Preserve at Birch Lake WWTP. ..................................................... 15
Figure 9. Flow Schematic: River Park WWTP ..................................................................................... 16
Figure 10. Effluent Nitrogen series: River Park WWTP. ...................................................................... 18
Figure 11. Flow Schematic: Riverwood Hills WWTP ........................................................................... 19
Figure 12. Effluent Nitrogen series: Riverwood Hills WWTP. .............................................................. 20
Figure 13. Flow Schematic: Sanctuary WWTP .................................................................................... 21
Figure 14. Effluent Nitrogen series: Sanctuary WWTP ........................................................................ 23
Figure 15. Flow Schematic: Trophy Lake Estates WWTP ..................................................................... 24
Figure 16. Effluent Nitrogen series: Trophy Lake Estates WWTP. ....................................................... 25
Figure 17. Flow Schematic: West Lake George WWTP ....................................................................... 26
Figure 18. Effluent Nitrogen series: West Lake George WWTP. .......................................................... 28
Figure 19. Flow Schematic: Whispering Ridge East WWTP ................................................................. 29
Figure 20. Effluent Nitrogen series: Whispering Ridge East WWTP. .................................................... 31

Best Practice Improvements: Nitrogen Pretreatment Performance of Minnesota Pollution Control Agency Land Based Wastewater Treatment Systems • June 2016
3
Executive summary Land based wastewater treatment systems can offer an efficient and cost effective wastewater treatment solution for communities and institutions that do not have access to a centralized wastewater treatment facility. Effluent from land based treatment systems is discharged directly into the ground rather than being sent to surface water, which minimizes negative impacts on freshwater ecosystems and also provides the benefit of recharge to local groundwater aquifers. The effluent discharged from these facilities must be monitored closely particularly in regards to effluent total nitrogen, to protect the quality of groundwater in areas where it’s used as a source of drinking water. Unfortunately, many land based systems in Minnesota are currently having difficulties meeting effluent (i.e., end of pipe) total nitrogen permit discharge limits. With this in mind Natural Systems Utilities, (NSU) in conjunction with the Minnesota Pollution Control Agency,(MPCA) completed an evaluation of ten land based wastewater treatment systems with nitrogen pretreatment devices and effluent total nitrogen limits. The goals were to evaluate facility design, current operations and management practices, and explore ways to increase nitrogen removal efficiencies by implementing operational adjustments to the existing pretreatment and denitrification modules.
The study was completed by first identifying suitable land based wastewater pretreatment systems based on criteria including current operations and flow status, technology type, and proximity to the Twin Cities Metro (TCM) area. Next, background data (e.g., facility design, existing performance data, etc.) was evaluated for each facility, and preliminary field and laboratory samples were collected to determine baseline treatment levels. Operational adjustments were then executed at each facility, and a second round of sampling was completed to determine the effectiveness of the adjustments. Data from both rounds of sampling was then compiled and used to determine which operational adjustments resulted in successfully lowering effluent total nitrogen concentrations (Appendix B-Table 2). The operational adjustments increased nitrogen removal efficiencies at six of the ten facilities, bringing two of the eight previously non-compliant facilities into compliance. This study produced a decrease in total nitrogen loading among all facilities of 1,544-lbs/yr, and additional monitoring over a longer period of time would likely yield further decreases in nitrogen loading to local groundwater aquifers.
The results of this study illustrate a variety of operation and maintenance (O&M) issues that can lead to permit non-compliance, as well as some improvements that can be employed to mitigate compliance issues. Optimizing O&M is best accomplished with sufficient knowledge and resources. Land based wastewater treatment systems permit compliance is directly related to an experienced operator who understands the fundamentals of facility design and construction, follows best management practices (BMPs) for all O&M tasks, can identify how operational adjustments will impact treatment, and has an adequate budget to properly manage the system. Investing in education specific to land based wastewater pretreatment systems can be a valuable part of the development of knowledgeable operators who can quickly identify and resolve compliance issues. In terms of resource needs, it is recommended that operators complete at least one visit per week (two to four hours) to their treatment facility for O&M work. Optimizing O&M can also extend the overall life of a facility, but most importantly will help keep land based wastewater pretreatment systems in compliance through financially and environmentally responsible management practices.

Best Practice Improvements: Nitrogen Pretreatment Performance of Minnesota Pollution Control Agency Land Based Wastewater Treatment Systems • June 2016
4
Introduction and scope of work Land based wastewater pretreatment systems can offer an efficient and cost effective wastewater treatment solution for communities and institutions that do not have access to a centralized wastewater treatment facility. Effluent from land based systems is discharged directly into the ground rather than being sent to surface water, which minimizes negative impacts on freshwater ecosystems and also recharges local groundwater aquifers. The effluent discharged from these facilities must be monitored closely, particularly in regards to effluent total nitrogen, to protect the quality of groundwater in areas where it’s used as a source of drinking water. The best way to ensure high quality effluent with a low total nitrogen concentration is to employ effective operations and management practices at all land based wastewater pretreatment systems.
Unfortunately, many land based systems in Minnesota are currently having difficulties meeting discharge permit effluent total nitrogen monitoring limits. With this in mind NSU, in conjunction with the MPCA, completed an evaluation of 10 land based wastewater treatment systems with nitrogen pretreatment devices and effluent total nitrogen limits. The goals were to investigate facility design, current operations and management practices, and explore ways to increase nitrogen removal efficiencies by implementing operational adjustments to the pretreatment and denitrification modules.
The study was completed by first identifying suitable land based wastewater pretreatment systems based on criteria including current operations and flow status, technology type, and proximity to the TCM area. Next, background data (e.g., facility design, existing performance data, etc.) was evaluated for each facility, and preliminary field and laboratory samples were collected to determine baseline treatment levels. Operational adjustments were then executed at each facility, and a second round of sampling was completed to determine the effectiveness of the adjustments. Data from both rounds of sampling was then compiled and used to determine which operational adjustments resulted in successfully lowering effluent total nitrogen concentrations.
The desired outcome of this study is to establish BMP’s and design modifications applicable to land based wastewater treatment systems for both MPCA and local government unit permitted facilities, with the ultimate goal being an opportunity to reduce nitrogen loading to local aquifers and protect one of Minnesota’s most valuable natural resources.
Cambridge-Isanti Middle School
Facility description The Cambridge-Isanti Middle School Wastewater Treatment Facility (WWTF) (MN0067741) is located at the NE ¼ of the SE ¼ of Section 9, Township 35 North, Range 23 West, Cambridge, Isanti County, Minnesota. This is a Class C facility built to treat domestic wastewater from a middle school that services a maximum of 900 students and 60 staff. The facility is designed for a total wet weather flow of 10,176 gallons per day (gpd), a five-day carbonaceous biochemical oxygen demand (CBOD5) strength of 290 milligrams per liter (mg/L), a total suspended solids (TSS) loading of 290-mg/L, a total nitrogen (TN) loading of 75-mg/L, a total ammonia loading of 18-mg/L, and a total phosphorus loading of 29-mg/L.
This facility consists of a gravity sewer collection from the school which flows to one 12,000 gallon (gal) and two 10,000-gal septic tanks operating in series. The last septic tank has two chambers, the last of which has two effluent filters. Effluent from the final septic tank flows to a 10,000-gal dosing tank with two pumps that dose to a 12,870 square foot (ft2) horizontal subsurface flow constructed wetland (CW). The treated wetland effluent drains into a two compartment 20,000-gal denitrification tank. The first

Best Practice Improvements: Nitrogen Pretreatment Performance of Minnesota Pollution Control Agency Land Based Wastewater Treatment Systems • June 2016
5
compartment is 18,000-gal and has a recirculation pump to dose water back into the treatment wetland. The second compartment is 2,000-gal and is packed with plastic media and fed with a liquid carbon source to facilitate the growth of denitrifying bacteria. Effluent from the denitrification moving-bed biofilm reactor (MBBR) drains into a 10,000-gal drainfield dosing tank with six effluent pumps that dose to three 5,680-ft2 pressure distributed infiltration beds. This facility has a heated building that houses the control panels and chemical tank
Sampling methods and operational adjustments Two rounds of sampling were completed in early 2015. Data from the first round of sampling was used to determine baseline results, and data from the second round of sampling was used to determine the effectiveness of operational changes made at the facility. Each round consisted of four sampling events. The four first round samples were collected on January 6th, January 14th, January 20th, and January 28th. The four second round samples were collected on April 20th, April 23rd, May 6th, and May 12th. Grab samples were collected from influent, intermediate, and effluent stations (Fig. 1) using a 500-mL plastic bottle attached to the end of an extendable pole. Immediately after sampling a multiparameter probe was used to measure pH (SU) and temperature (°C) in all samples, and a field test kit was used to measure dissolved oxygen (DO; mg/L) in the intermediate and effluent samples. After field tests were complete all samples were put on ice and shipped to Pace Analytical Services, Inc. (PASI). for analysis. The parameters analyzed for and methods used can be found in Appendix A.
After the first round of sampling, the Cambridge-Isanti Middle School Wastewater Treatment Facility (WWTF) was identified to be nitrifying adequately in the CW, but was not denitrifying adequately in the denitrification MBBR. Two potential operational improvements were identified, and adjustments were made accordingly. First, the chemical feed tubing was not staying primed through the peristaltic pump, and was likely not delivering the intended amount of liquid carbon source to the denitrification MBBR. New chemical tube fittings were purchased and installed, and the chemical feed rate was set at approximately 1-gal/day to match flows. Second, the chemical feed tube was dripping the liquid carbon source into the first 18,000-gal compartment of the tank rather than into the 2,000-gal media chamber near the outflow of the tank, which was likely causing the carbon to dissipate before it reached the media. To mitigate the dissipation, the feed tubing was run to the inlet of the media compartment to dose the liquid carbon source directly into the media. The status of the operational adjustments was monitored during site visits between the first and second rounds of sampling by measuring ammonia and nitrate with field test kits at the intermediate and effluent sampling stations.
Figure 1. Flow Schematic: Cambridge-Isanti Middle School WWTP

Best Practice Improvements: Nitrogen Pretreatment Performance of Minnesota Pollution Control Agency Land Based Wastewater Treatment Systems • June 2016
6
Evaluation and conclusions The operational adjustments resulted in an overall decrease in mean (± SD) effluent TN concentration from the first round to the second round (Fig. 2), with the TN removal efficiency between sampling rounds increasing from 63 ± 8% to 80 ± 8%. However the mean effluent TN concentration did not drop below the 10-mg/L monitoring limit in the second round of sampling, with two identifiable reasons as to why. First, nitrification rates in the CW decreased from the first to the second round, with the effluent total Kjeldahl nitrogen (TKN) concentration increasing from 7.8 ± 4.1-mg/L to 12.8 ± 1.9-mg/L. If the wetland treatment cell can’t nitrify to TKN concentrations below 10-mg/L, then the facility will not be able to maintain an effluent TN concentration below the monitoring limit regardless of how efficiently the denitrification component is operating. Second, denitrification rates increased significantly between rounds, lowering effluent NO3- + NO2- concentrations from 42.0 ± 5.5-mg/L to 12.2 ± 9.7-mg/L. However, even though there was a significant decrease in effluent NO3- + NO2- concentration, the denitrification potential will still have to be improved to meet an effluent TN monitoring limit of 10-mg/L.
The operational adjustments completed at this site resulted in an overall improvement in nitrogen removal efficiencies, and should require only occasional minor changes (e.g., chemical feed rate, recirculation rate, etc.) to drop the effluent TN concentration below the monitoring limit. This facility has also had historically higher effluent TN concentrations during winter months, assumedly due to cold temperatures affecting microbial activity in the treatment wetland cell. To mitigate this drop in microbial activity a mixture of nitrifying bacteria cultures is added to several water level monitoring ports in the second half of the treatment wetland cell prior to and throughout winter. This has been done with mixed results, but is a relatively low-cost option with no negative risk. The Cambridge-Isanti Middle School WWTF should be able to meet the effluent TN limit with continued monitoring and operational adjustments, and should not need any significant additions to the infrastructure in order to satisfy nitrogen removal requirements.
Figure 2. Effluent Nitrogen series: Cambridge-Isanti Middle School WWTP
Best Practice Improvements: Nitrogen Pretreatment Performance of Minnesota Pollution Control Agency Land Based Wastewater Treatment Systems • June 2016
7
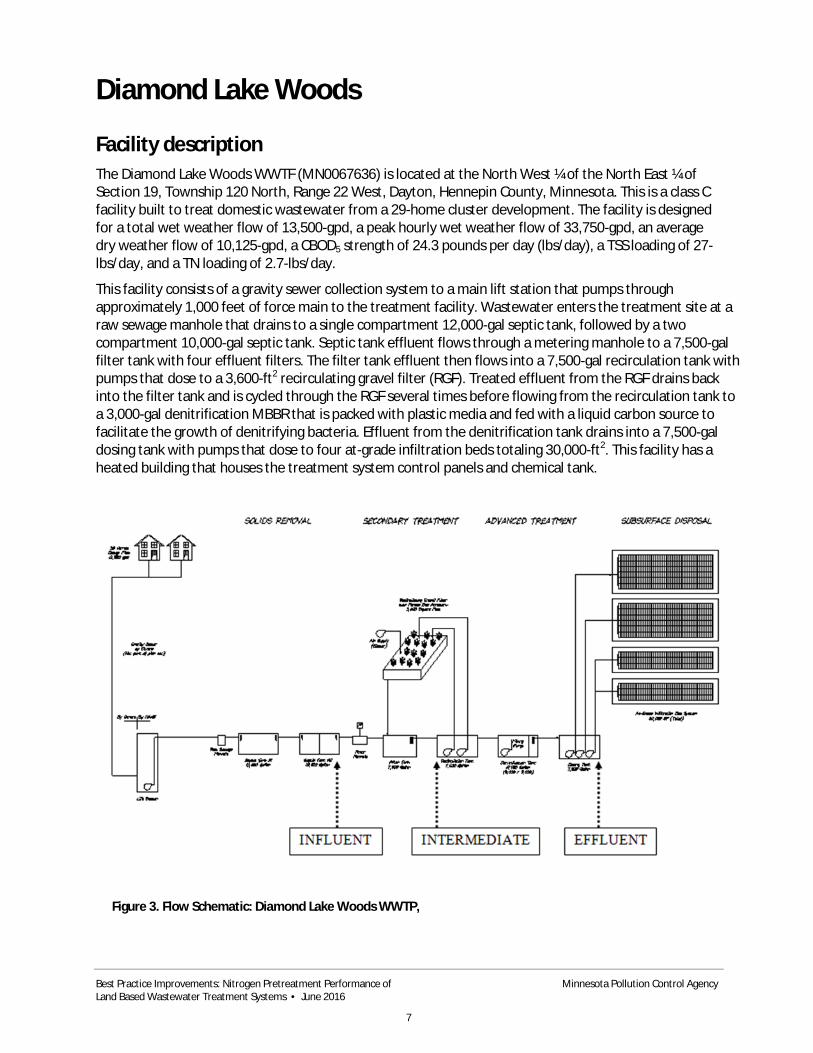
Diamond Lake Woods
Facility description The Diamond Lake Woods WWTF (MN0067636) is located at the North West ¼ of the North East ¼ of Section 19, Township 120 North, Range 22 West, Dayton, Hennepin County, Minnesota. This is a class C facility built to treat domestic wastewater from a 29-home cluster development. The facility is designed for a total wet weather flow of 13,500-gpd, a peak hourly wet weather flow of 33,750-gpd, an average dry weather flow of 10,125-gpd, a CBOD5 strength of 24.3 pounds per day (lbs/day), a TSS loading of 27-lbs/day, and a TN loading of 2.7-lbs/day.
This facility consists of a gravity sewer collection system to a main lift station that pumps through approximately 1,000 feet of force main to the treatment facility. Wastewater enters the treatment site at a raw sewage manhole that drains to a single compartment 12,000-gal septic tank, followed by a two compartment 10,000-gal septic tank. Septic tank effluent flows through a metering manhole to a 7,500-gal filter tank with four effluent filters. The filter tank effluent then flows into a 7,500-gal recirculation tank with pumps that dose to a 3,600-ft2 recirculating gravel filter (RGF). Treated effluent from the RGF drains back into the filter tank and is cycled through the RGF several times before flowing from the recirculation tank to a 3,000-gal denitrification MBBR that is packed with plastic media and fed with a liquid carbon source to facilitate the growth of denitrifying bacteria. Effluent from the denitrification tank drains into a 7,500-gal dosing tank with pumps that dose to four at-grade infiltration beds totaling 30,000-ft2. This facility has a heated building that houses the treatment system control panels and chemical tank.
Figure 3. Flow Schematic: Diamond Lake Woods WWTP,

Best Practice Improvements: Nitrogen Pretreatment Performance of Minnesota Pollution Control Agency Land Based Wastewater Treatment Systems • June 2016
8
Sampling methods and operational adjustments Two rounds of sampling were completed in early 2015. Data from the first round of sampling was used to determine baseline results, and data from the second round of sampling was used to determine the effectiveness of operational changes made at the facility. Each round consisted of four sampling events. The four first round samples were collected on January 6th, January 12th, January 19th, and January 26th. The four second round samples were collected on March 18th, March 23rd, March 25th, and April 16th. Grab samples were collected from influent, intermediate, and effluent stations (Fig. 3) using a 500-mL plastic bottle attached to the end of an extendable pole. Immediately after sampling a multiparameter probe was used to measure pH (SU) and temperature (°C) in all samples, and a field test kit was used to measure DO (mg/L) in the intermediate and effluent samples. After field tests were complete all samples were put on ice and shipped to PASI for analysis. The parameters analyzed for and methods used can be found in Appendix A.
After the first round of sampling, the Diamond Lake Woods WWTF was identified to be nitrifying and denitrifying adequately in the RGF and denitrification MBBR, respectively. Even though the TN concentration in the effluent was below the 10-mg/L monitoring limit, it was noted that the majority of the nitrogen in the effluent was in the form of TKN. In an attempt to increase nitrification rates in the RGF, the wetland dosing timer settings were increased from 2-minutes (min) on, 4-min off to 3-min on, 4-min off. This increased the total dosing time by up to 137-min/day. The status of the operational adjustment was monitored during site visits between the first and second rounds of sampling by measuring ammonia and nitrate with field test kits at the intermediate and effluent sampling stations.
Evaluation and conclusions The operational adjustments did not result in a significant change in mean (± SD) effluent TN concentration from the first round to the second round (Fig. 4), with the TN removal efficiency between sampling rounds decreasing slightly from 85 ± 2% to 84 ± 6%. This small decrease can likely be attributed to cold temperatures affecting microbial activity in the RGF. The mean effluent TN concentration was below the 10-mg/L monitoring limit for both sampling rounds indicating high levels of treatment that should continue with only periodic adjustments to recirculation and carbon feed rates. The Diamond Lake Woods WWTF is currently meeting and should be able to maintain compliance with continued monitoring and operational adjustments, and should not need any significant additions to the infrastructure in order to satisfy nitrogen removal requirements.

Best Practice Improvements: Nitrogen Pretreatment Performance of Minnesota Pollution Control Agency Land Based Wastewater Treatment Systems • June 2016
9
Farms of Lake Elmo
Facility description The Farms of Lake Elmo WWTF (MN0067954) is located at the SE ¼ of the SW ¼ of Section 15, Township 29 North, Range 21 West, Lake Elmo, Washington County, Minnesota. This is a Class C facility built to treat domestic wastewater from a 33-home cluster development. The facility is designed for an average wet weather flow of 10,050-gpd and a CBOD5 strength of 220-mg/L.
This facility consists of grinder stations at each home that pump through a pressurized force main to the treatment site. Wastewater enters the treatment site at a 12,000-gal two compartment septic tank with an effluent screen. Septic tank effluent flows into a 9,000 gal aerobic treatment unit (ATU) for secondary biological treatment, and then flows to another 9,000-gal ATU for nitrification. The treated effluent flows into a 3,000-gal denitrification MBBR that has fixed plastic media and is fed with a liquid carbon source to facilitate the growth of denitrifying bacteria, and then flows into a 3,000-gal ATU for polishing before draining into a 5,000-gal dosing tank. The treated effluent is dosed to a six zone drip irrigation field, each zone consisting of 2,520-ft2 of dispersal area. There is a heated building to house the treatment system control panels, chemical tank, pumps, and drip-irrigation filter/valve platform.
Figure 4. Effluent Nitrogen series: Diamond Lake Woods WWTP.

Best Practice Improvements: Nitrogen Pretreatment Performance of Minnesota Pollution Control Agency Land Based Wastewater Treatment Systems • June 2016
10
Sampling methods and operational adjustments Two rounds of sampling were completed in early 2015. Data from the first round of sampling was used to determine baseline results, and data from the second round of sampling was used to determine the effectiveness of operational changes made at the facility. Each round consisted of four sampling events. The four first round samples were collected on January 5th, January 12th, January 19th, and January 26th. The four second round samples were collected on March 17th, March 24th, April 1st, and April 7th. Grab samples were collected from influent, intermediate, and effluent stations (Fig. 5) using a 500-mL plastic bottle attached to the end of an extendable pole. Immediately after sampling a multiparameter probe was used to measure pH (SU) and temperature (°C) in all samples, and a field test kit was used to measure DO (mg/L) in the intermediate and effluent samples. After field tests were complete all samples were put on ice and shipped to PACSI for analysis. The parameters analyzed for and methods used can be found in Appendix A.
After the first round of sampling, the Farms of Lake Elmo WWFT was identified as not nitrifying adequately in the ATUs, and as a result was not creating any nitrate to properly assess the performance
Figure 5. Flow Schematic: Farms of Lake Elmo WWTP

Best Practice Improvements: Nitrogen Pretreatment Performance of Minnesota Pollution Control Agency Land Based Wastewater Treatment Systems • June 2016
11
of the denitrification MBBR. This facility experienced a power outage that shut treatment down for approximately two days in late December, 2014, just prior to the first round of sampling. It was determined that rather than completing specific operational adjustments, this site would be left to operate as is both as a control, but also to see if allowing the system more time to self-remediate during the winter months would be a viable option under similar circumstances. The facility status was monitored during site visits between the first and second rounds of sampling by measuring ammonia and nitrate with field test kits at the intermediate and effluent sampling stations.
Evaluation and conclusions There were no significant operational adjustments made at this facility, instead opting to see if treatment would improve over time after the facility shut down due to a power failure. The mean effluent TN (± SD) did not change significantly from the first round to the second round (Fig. 6), with the TN removal efficiency between sampling rounds decreasing from 28 ± 29% to 12 ± 4%. The mean effluent NO3- + NO2- concentration was less than 1-mg/L in both sampling rounds, indicating that there was almost no nitrification occurring in the ATUs. Treatment of organics and solids appeared to be adequate, with mean CBOD5 and TSS reduction rates, pooled from all eight samples, of 79 ± 25% and TSS 74 ± 21%, respectively. However, nitrogen conversion and removal did not appear to be occurring at this facility with effluent TN concentrations greater than 45-mg/L for all sampling events.
Shortly after the second round of sampling had finished, substantial troubleshooting was completed at the facility and several significant issues were found. First, the pipe draining the first ATU into the second ATU had separated from the media housing, allowing septic tank effluent to bypass secondary treatment in the first ATU. This resulted in essentially no treatment for nitrogen because the second ATU was breaking down organic matter in the septic tank effluent instead of nitrifying as is designed. Second, rubber fittings in both ATU blower housings were found to be split and not delivering the intended amount of air to the ATUs. Lastly, a significant amount of sludge was measured in both ATU treatment tanks and was likely overloading the ATUs with solids. All of these issues were corrected and weekly monitoring at this site is ongoing to assess improvements in treatment. The effluent TN concentrations at the Farms of Lake Elmo WWTF were significantly above the monitoring limit for the duration of this study as a result of several operational and infrastructure issues. If overall treatment and nitrogen removal efficiencies do not improve after resolving the issues listed above, additional infrastructure may need to be installed at the facility to satisfy nitrogen removal requirements.

Best Practice Improvements: Nitrogen Pretreatment Performance of Minnesota Pollution Control Agency Land Based Wastewater Treatment Systems • June 2016
12
Figure 6. Effluent Nitrogen series: Farms of Lake Elmo WWTP.
Preserve at Birch Lake
Facility description The Preserve at Birch Lake WWTF (MN0066362) is located at the SW ¼ of the SW ¼ of Section 30, Township 33 North, Range 20 West, Scandia, Chisago County, Minnesota. This is a Class C facility built to treat domestic wastewater from a 102-home cluster development. The facility is designed for a total wet weather flow of 34,425-gpd, a CBOD5 strength of 79.4-lbs/day, a TSS loading of 88.2-lbs/day, and a TN loading of 8.8-lbs/day. This facility consists of grinder stations at each home that pump through a pressurized force main to the treatment site. Wastewater enters the treatment site at a raw sewage manhole that drains into a 38,000-gal septic tank followed by a15,000-gal septic tank. Septic tank effluent flows through a metering manhole into a 15,000-gal filter tank with six effluent filters. The filter tank effluent then flows into a 20,000-gal recirculation tank with four pumps that dose to two 4,500-ft2 recirculating gravel filter (RGF) beds. Treated effluent from the RGF drains back into the filter tank and is cycled through the RGF several times before flowing from the recirculation tank to a 20,000-gal denitrification MBBR that is packed with plastic media and fed with a liquid carbon source to facilitate the growth of denitrifying bacteria. Effluent from the denitrification MBBR drains into a 38,000-gal dosing tank with pumps that dose to six at-grade infiltration beds totaling 75,915-ft2. This facility has a heated building that houses the treatment system control panels and chemical tank.

Best Practice Improvements: Nitrogen Pretreatment Performance of Minnesota Pollution Control Agency Land Based Wastewater Treatment Systems • June 2016
13
Sampling methods and operational adjustments Two rounds of sampling were completed in early 2015. Data from the first round of sampling was used to determine baseline results, and data from the second round of sampling was used to determine the effectiveness of operational changes made at the facility. Each round consisted of four sampling events. The four first round samples were collected on January 6th, January 13th, January 20th, and January 27th. The four second round samples were collected on March 17th, March 23rd, April 1st, and April 7th. Grab samples were collected from influent, intermediate, and effluent stations (Fig. 7) using a 500-mL plastic bottle attached to the end of an extendable pole. Immediately after sampling a multiparameter probe was used to measure pH (SU) and temperature (°C) in all samples, and a field test kit was used to measure DO (mg/L) in the intermediate and effluent samples. After field tests were complete all samples were put on ice and shipped to PASI. for analysis. The parameters analyzed for and methods used can be found in Appendix A.
After the first round of sampling, the Preserve at Birch Lake WWTF was identified as not nitrifying adequately in the RGF, and as a result was not creating any nitrate to properly assess the performance of the denitrification MBBR. Three potential operational improvements were identified, and adjustments were made accordingly. First, it was feasible that the recirculation tank may not have been turning over completely and/or short circuiting may have been happening during peak flow periods that was allowing influent to flow across the surface layer of the tank rather than mixing into the water column, effectively bypassing treatment in the RGF. One of the recirculation pumps was disconnected from its discharge pipe and run continuously which allowed the tank to mix and prevent short circuiting.
Second, 1-gal of a mixture of nitrifying bacteria cultures was added to the recirculation tank in an attempt to seed the RGFs with nitrifying bacteria. Third, in an attempt to increase nitrification rates in the RGF cells, the wetland dosing timer settings were increased from 7-min on, 5-min off to 4-min on, 1-min off. This increased the total dosing time by up to 312-min/day. The status of the operational adjustments was monitored during site visits between the first and second rounds of sampling by measuring ammonia and nitrate with field test kits at the intermediate and effluent sampling stations.
Figure 7. Flow Schematic: Preserve at Birch Lake WWTP

Best Practice Improvements: Nitrogen Pretreatment Performance of Minnesota Pollution Control Agency Land Based Wastewater Treatment Systems • June 2016
14
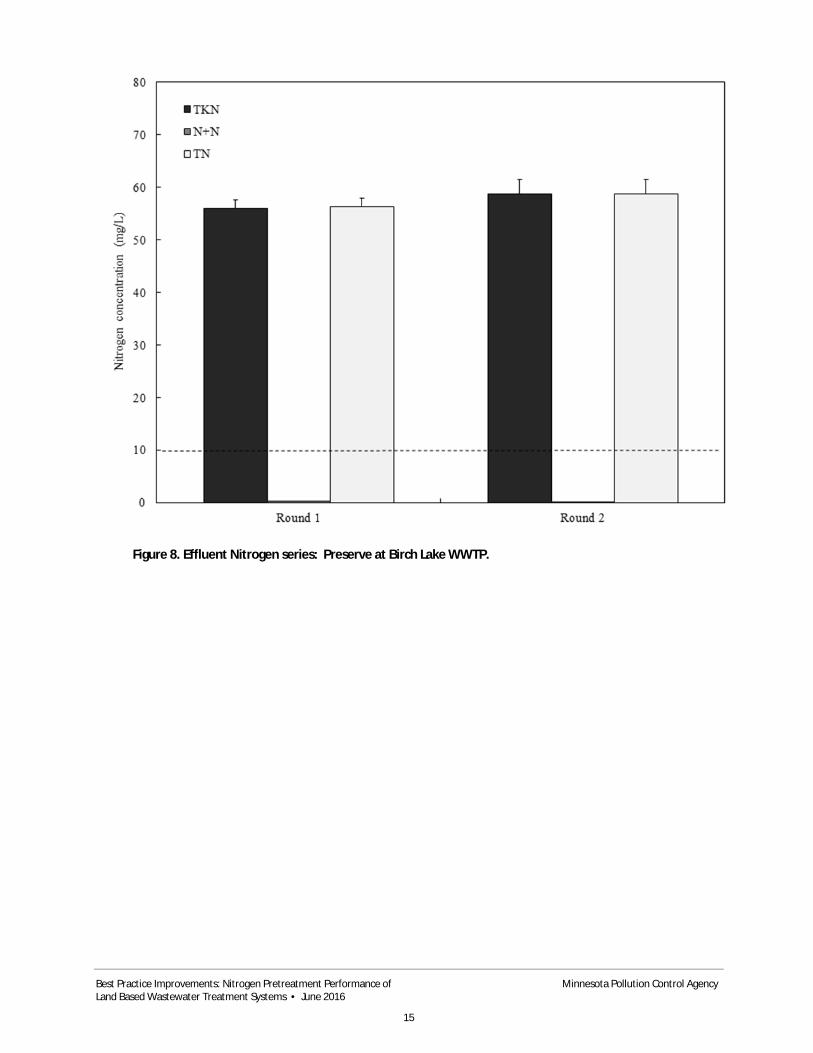
Evaluation and conclusions The operational adjustments did not result in a significant change in mean (± SD) effluent TN concentration from the first round to the second round (Fig. 8), with a TN removal efficiency between sampling rounds of 1 ± 10% to 3 ± 5%, respectively. The effluent TN concentrations were greater than 45-mg/L for all sampling events, and effluent NO3- + NO2- concentrations were less than 1-mg/L for all sampling events. These results indicate that there was virtually no nitrogen treatment occurring in the RGFs. Further, mean CBOD5 and TSS reduction rates pooled from all eight samples of 63 ± 10% and 37 ± 23%, respectively, indicate poor overall treatment in all facets of the facility.
Substantial troubleshooting was completed at the facility shortly after the second round of sampling had finished, and a significant infrastructure issue was identified. All four original recirculation pumps at the facility were undersized compared to the design specifications, and were dosing septic effluent to the RGF at less than half of the intended rate. The undersized pumps were also delivering septic effluent to the RGF dosing laterals at a lower pressure than designed which decreased scouring in the laterals, and may have resulted in several plugged orifices that were not distributing septic effluent to the RGF for treatment. This facility operated without issue for several years, during which time less than half the lots in the development were built out and the wastewater treatment facility was receiving relatively low flows. However, the development is now at roughly 80% build out and is delivering more wastewater to the facility than can be effectively treated with the current recirculation pumps. The majority of the septic tank effluent is flowing from the filter tank to the recirculation tank and onto the denitrification MBBR without being dosed to the RGF for treatment.
The effluent TN concentrations were significantly above the monitoring limit for the duration of this study as a result of the undersized recirculation pumps causing a bypass of the secondary treatment component. Three of the four RGF pumps have been replaced at the Preserve at Birch Lake WWTF and overall treatment has improved. However, all RGF dosing laterals may need to be jetted and the fourth undersized pump may need to be replaced to achieve effluent total nitrogen limits. This facility should not need any infrastructure upgrades once these operational adjustments and repairs are complete.
Best Practice Improvements: Nitrogen Pretreatment Performance of Minnesota Pollution Control Agency Land Based Wastewater Treatment Systems • June 2016
15
Figure 8. Effluent Nitrogen series: Preserve at Birch Lake WWTP.

Best Practice Improvements: Nitrogen Pretreatment Performance of Minnesota Pollution Control Agency Land Based Wastewater Treatment Systems • June 2016
16
River Park
Facility description The River Park WWTF (MN0067920) is located at Section 17, Township 108 North, Range 14 West, Oronoco, Olmstead County, Minnesota. This is a Class C facility built to treat domestic wastewater from an 87-home cluster development. The facility is designed for an average wet weather flow of 31,250-gpd, an average flow of 29,145-gpd, a CBOD5 strength of 250-mg/L, and a TSS loading of 200-mg/L.
This facility consists of a gravity sewer collection system that flows to a three compartment 33,854-gal septic tank, which drains into a 21,916-gal lift tank with pumps that deliver wastewater to the treatment site. Once at the treatment site the wastewater is split to flow through one of three 9,335-gal tanks in parallel, each with an ATU for secondary biological treatment. The treated effluent then flows into one of two 8,737-gal tanks in parallel, each with an ATU for nitrification. The treated effluent flows from the ATUs into a 9,335-gal denitrification MBBR that has fixed plastic media and is fed with a liquid carbon source to facilitate the growth of denitrifying bacteria, and then flows into a 5,563-gal tank with an ATU for polishing before draining into a 9,335-gal dosing tank. The treated effluent is dosed to four zones of chambered trenches with a total dispersal area of 39,063-ft2.
Figure 9. Flow Schematic: River Park WWTP

Best Practice Improvements: Nitrogen Pretreatment Performance of Minnesota Pollution Control Agency Land Based Wastewater Treatment Systems • June 2016
17
Sampling methods and operational adjustments Two rounds of sampling were completed in early 2015. Data from the first round of sampling was used to determine baseline results, and data from the second round of sampling was used to determine the effectiveness of operational changes made at the facility. Each round consisted of four sampling events. The four first round samples were collected on January 5th, January 12th, January 19th, and January 26th. The four second round samples were collected on March 16th, March 24th, April 6th, and April 8th. Grab samples were collected from influent, intermediate, and effluent stations (Fig. 9) using a 500-mL plastic bottle attached to the end of an extendable pole. Immediately after sampling a multiparameter probe was used to measure pH (SU) and temperature (°C) in all samples, and a field test kit was used to measure DO (mg/L) in the intermediate and effluent samples. After field tests were complete all samples were put on ice and shipped to PASI. for analysis. The parameters analyzed for and methods used can be found in Appendix A.
After the first round of sampling, the River Park WWTF was identified to be nitrifying adequately in the ATUs, but was not denitrifying adequately in the denitrification tank. The one issue identified at this facility was that the liquid carbon source feed rate into the denitrification MBBR was too low relative to the flow coming into the facility. The chemical feed rate was increased from approximately 0.25-gpd to approximately 0.5-gpd in an attempt to increase denitrification prior to the effluent tank. The status of the operational adjustment was monitored during site visits between the first and second rounds of sampling by measuring ammonia and nitrate with field test kits at the intermediate and effluent sampling stations.
Evaluation and conclusions The operational adjustments resulted in an overall decrease in mean (± SD) effluent TN concentration from the first round to the second round (Fig. 10), with the TN removal efficiency between sampling rounds increasing from 62 ± 18% to 73 ± 18%. The TN concentration in the final two samples of the second round on April 6th and April 8th were under the 10-mg/L monitoring limit with values of 7.8-mg/L and 5.4-mg/L, respectively. However the mean effluent TN concentration was not below the 10-mg/L monitoring limit after pooling all second round samples, with a mean of 14.0 ± 8.9-mg/L. Increasing the liquid carbon source feed rate proved to be a successful operational adjustment as effluent NO3- + NO2- concentrations dropped from 17.6 ± 0.7-mg/L for the first round of sampling, to 0.1 ± 0.0-mg/L for the second round of sampling.
This facility experienced a power failure the weekend before the start of the second round of sampling which forced the operator to manually pump wastewater from the lift station to the treatment site, and likely caused a slug of inadequately treated wastewater to pass through the tanks. This could explain why the first two sampling events of the second round indicated relatively poor treatment in regards to both organic strength and nitrogen removal efficiencies when compared to the last two sampling events. However, the facility did exhibit the ability to improve treatment levels relatively quickly following a facility shutdown. This facility is also currently only using two of the first three ATUs and one of the second two ATUs due to actual flows being lower than design flows, but may need to initiate operations of the last two ATU modules if future treatment levels do not maintain compliance. The River Park WWTF should be able to meet the effluent TN limit with continued monitoring and operational adjustments, and should not need any significant additions to the infrastructure in order to satisfy nitrogen removal requirements.

Best Practice Improvements: Nitrogen Pretreatment Performance of Minnesota Pollution Control Agency Land Based Wastewater Treatment Systems • June 2016
18
Riverwood Hills
Facility description The Riverwood Hills WWTF (MN0067245) is located at the NW ¼ of the NE ¼ Section 19, Township 108 North, Range 14 West, Oronoco, Olmstead County, Minnesota. This is a Class C facility built to treat domestic wastewater from a 63-home cluster development. The facility is designed for an average wet weather flow of 23,081-gpd, an average flow of 21,105-gpd, a CBOD5 strength of 250-mg/L, and a TSS loading of 200-mg/L.
This facility consists of a gravity sewer collection system that flows to four 5,000-gal septic tanks in series. The septic tank effluent flows to an 18,000-gal lift tank with pumps that deliver the septic tank effluent to one of two 9,000-gal tanks in parallel, each with an ATU for secondary biological treatment. The ATU effluent then flows into one of two 9,000-gal tanks in parallel, each with an ATU for nitrification. The treated effluent flows into a 9,000-gal denitrification MBBR that has fixed plastic media and is fed with a liquid carbon source to facilitate the growth of denitrifying bacteria, and then flows into a 3,000-gal tank with an ATU for polishing before draining into a 5,000-gal dosing tank. The treated effluent is dosed to a six zone soil treatment area, each zone consisting of approximately 2,137 lineal feet of chambered trenches.
Figure 10. Effluent Nitrogen series: River Park WWTP.

Best Practice Improvements: Nitrogen Pretreatment Performance of Minnesota Pollution Control Agency Land Based Wastewater Treatment Systems • June 2016
19
Sampling methods and operational adjustments Two rounds of sampling were completed in early 2015. Data from the first round of sampling was used to determine baseline results, and data from the second round of sampling was used to determine the effectiveness of operational changes made at the facility. Each round consisted of four sampling events. The four first round samples were collected on January 5th, January 12th, January 19th, and January 26th. The four second round samples were collected on March 16th, March 24th, April 6th, and April 8th. Grab samples were collected from influent, intermediate, and effluent stations (Fig. 11) using a 500-mL plastic bottle attached to the end of an extendable pole. Immediately after sampling a multiparameter probe was used to measure pH (SU) and temperature (°C) in all samples, and a field test kit was used to measure DO (mg/L) in the intermediate and effluent samples. After field tests were complete all samples were put on ice and shipped to PASI for analysis. The parameters analyzed for and methods used can be found in Appendix A.
After the first round of sampling, the Riverwood Hills WWTF was identified as not nitrifying adequately in the ATUs, and as a result was not creating any nitrate to properly assess the performance of the denitrification MBBR. Three potential operational improvements were identified, and adjustments were made accordingly. First, the second ATU blower was not operational when sampling started in early January, but was replaced in late January by the contract operator of the facility. Second, 1-gal of a mixture of nitrifying bacteria cultures was added to the second ATU in an attempt to seed the system with nitrifying bacteria. Third, a temporary recirculation loop was installed using a sump pump and garden hose to pump treated effluent from just after the second ATU back to the first septic tank in an attempt to increase passive denitrification. The status of the operational adjustments was monitored during site visits between the first and second rounds of sampling by measuring ammonia and nitrate with field test kits at the intermediate and effluent sampling stations.
Evaluation and conclusions The operational adjustments resulted in an overall decrease in mean (± SD) effluent TN concentration from the first round to the second round (Fig. 12), with the TN removal efficiency between sampling rounds increasing from 4 ± 28% to 51 ± 4%. However, the mean effluent TN concentration did not drop below the 10-mg/L monitoring limit in the second round of sampling, of which the majority of the TN was in the form of TKN. The TKN conversion efficiencies did increase from the first round to the second round with values of 6 ± 28% and 51 ± 4%, respectively, however not enough TKN was being converted
Figure 11. Flow Schematic: Riverwood Hills WWTP

Best Practice Improvements: Nitrogen Pretreatment Performance of Minnesota Pollution Control Agency Land Based Wastewater Treatment Systems • June 2016
20
to NO3- + NO2- to allow the system to denitrify to under the compliance limit. Effluent NO3- + NO2- concentrations were low for all sampling events with a mean of 0.8 ± 1.7-mg/L pooled for all eight sampling events, so it’s reasonable to assume the denitrification MBBR was either not receiving high concentrations of nitrates, or was efficiently removing the nitrates it was receiving.
The second ATU blower was not operating at this facility when the first round of sampling started in early January, and thus was not providing nitrification for the effluent from the first ATU. The blower was replaced in late January, which is likely why the second round of sampling had lower effluent TN results. However, this facility is currently only using one of the first two ATUs in parallel and one of the second two ATUs in parallel due to actual versus design flows. At this time it does not appear that the infrastructure currently in use will be able to remove nitrogen efficiently enough to maintain compliance, and consideration should be given to initiating operations of the other two ATUs. The installation of a permanent recirculation loop at this facility would also provide a means to denitrify passively, but the necessity of the loop can’t be determined until the facility is operating at full capacity. The Riverwood Hills WWTF should be able to meet the effluent TN limit once all ATUs are in use, and should not need any significant additions to the infrastructure in order to satisfy nitrogen removal requirements.
Figure 12. Effluent Nitrogen series: Riverwood Hills WWTP.
Best Practice Improvements: Nitrogen Pretreatment Performance of Minnesota Pollution Control Agency Land Based Wastewater Treatment Systems • June 2016
21
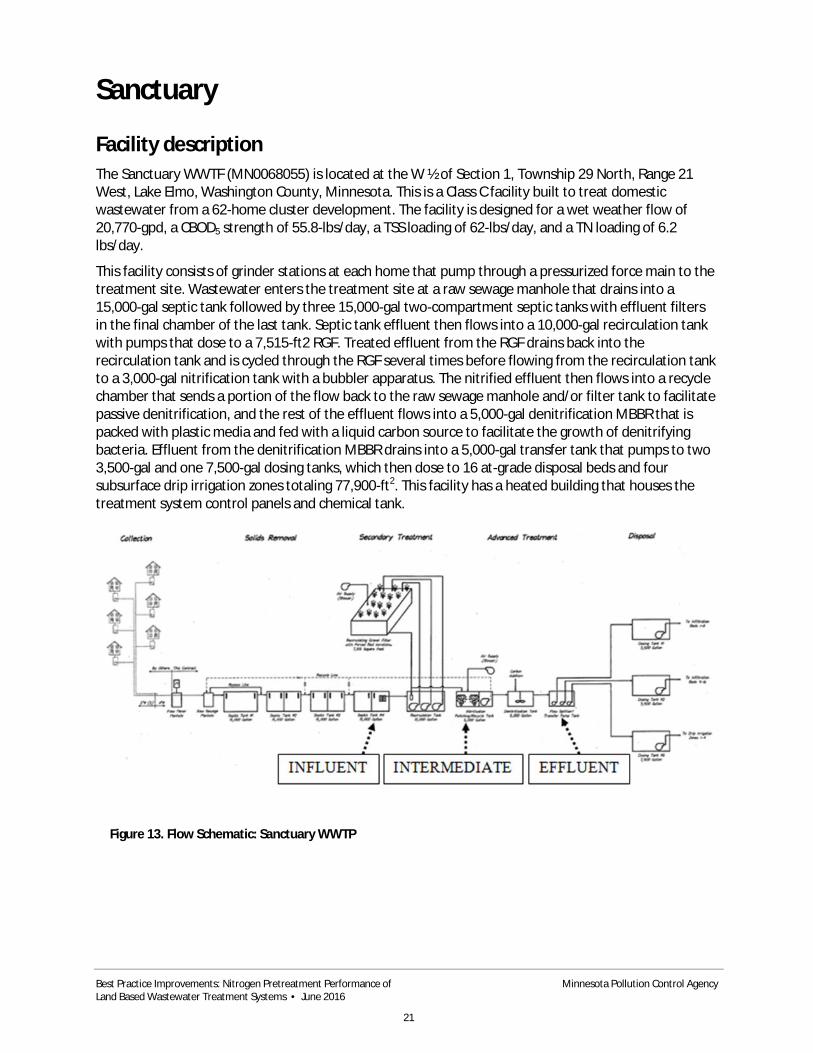
Sanctuary
Facility description The Sanctuary WWTF (MN0068055) is located at the W ½ of Section 1, Township 29 North, Range 21 West, Lake Elmo, Washington County, Minnesota. This is a Class C facility built to treat domestic wastewater from a 62-home cluster development. The facility is designed for a wet weather flow of 20,770-gpd, a CBOD5 strength of 55.8-lbs/day, a TSS loading of 62-lbs/day, and a TN loading of 6.2 lbs/day.
This facility consists of grinder stations at each home that pump through a pressurized force main to the treatment site. Wastewater enters the treatment site at a raw sewage manhole that drains into a 15,000-gal septic tank followed by three 15,000-gal two-compartment septic tanks with effluent filters in the final chamber of the last tank. Septic tank effluent then flows into a 10,000-gal recirculation tank with pumps that dose to a 7,515-ft2 RGF. Treated effluent from the RGF drains back into the recirculation tank and is cycled through the RGF several times before flowing from the recirculation tank to a 3,000-gal nitrification tank with a bubbler apparatus. The nitrified effluent then flows into a recycle chamber that sends a portion of the flow back to the raw sewage manhole and/or filter tank to facilitate passive denitrification, and the rest of the effluent flows into a 5,000-gal denitrification MBBR that is packed with plastic media and fed with a liquid carbon source to facilitate the growth of denitrifying bacteria. Effluent from the denitrification MBBR drains into a 5,000-gal transfer tank that pumps to two 3,500-gal and one 7,500-gal dosing tanks, which then dose to 16 at-grade disposal beds and four subsurface drip irrigation zones totaling 77,900-ft2. This facility has a heated building that houses the treatment system control panels and chemical tank.
Figure 13. Flow Schematic: Sanctuary WWTP

Best Practice Improvements: Nitrogen Pretreatment Performance of Minnesota Pollution Control Agency Land Based Wastewater Treatment Systems • June 2016
22
Sampling methods and operational adjustments Two rounds of sampling were completed in early 2015. Data from the first round of sampling was used to determine baseline results, and data from the second round of sampling was used to determine the effectiveness of operational changes made at the facility. Each round consisted of four sampling events. The four first round samples were collected on January 5th, January 12th, January 19th, and January 26th. The four second round samples were collected on March 17th, March 23rd, April 1st, and April 7th. Grab samples were collected from influent, intermediate, and effluent stations (Fig. 13) using a 500-mL plastic bottle attached to the end of an extendable pole. Immediately after sampling a multiparameter probe was used to measure pH (SU) and temperature (°C) in all samples, and a field test kit was used to measure DO (mg/L) in the intermediate and effluent samples. After field tests were complete all samples were put on ice and shipped to PASI. for analysis. The parameters analyzed for and methods used can be found in Appendix A.
After the first round of sampling, the Sanctuary WWTF was identified as nitrifying adequately in the RGF and nitrification tank, however the effluent quality was poor with high concentrations of TKN. An infrastructure issue was discovered that was causing septic tank effluent to siphon backwards through the recycle pump line from the filter tank to the denitrification tank, essentially bypassing treatment in the RGF and nitrification tank. The valve to this line was closed so that the recycle pump was only sending treated effluent back to the raw sewage manhole and not the filter tank. The liquid carbon source feed was also resumed to maintain an environment in the denitrification tank that would continue to be favorable for denitrifying bacteria. The status of the operational adjustments was monitored during site visits between the first and second rounds of sampling by measuring ammonia and nitrate with field test kits at the intermediate and effluent sampling stations.
Evaluation and conclusions The operational adjustments resulted in an overall decrease in mean (± SD) effluent TN concentration from the first round to the second round (Fig. 14), with the TN removal efficiency between sampling rounds increasing from 3 ± 3% to 29 ± 23%. However, the mean effluent TN concentration did not drop below the 10-mg/L monitoring limit in the second round of sampling. The elimination of the recycle pump bypass did decrease effluent TKN concentrations from 42.1 ± 2.4-mg/L to 8.1 ± 0.9-mg/L, and increase effluent NO3- + NO2- concentrations from 0.2 ± 0.1- mg/L to 10.7 ± 1.2-mg/L. Overall treatment also improved with CBOD5 removal efficiency increasing from 42 ± 13% to 95 ± 2%, and TSS removal efficiency increasing from -3 ± 22% to 77 ± 21%.
The recycle pump, which now only pumps to the raw sewage manhole, run time was increased from 48-min/day to 192-min/day shortly after the second round of sampling had finished in an attempt to increase passive denitrification in the septic tanks. All routine compliance samples collected after this operational adjustment was made have had an effluent TN of under 10-mg/L. The liquid carbon source feed rate has also been dialed back to compensate for the lower concentrations of nitrates entering the denitrification tank so as to not increase the CBOD5 strength in the effluent. The Sanctuary WWTF is currently meeting the effluent TN limit, and with continued monitoring and operational adjustments should not need any significant additions to the infrastructure in order to satisfy nitrogen removal requirements.

Best Practice Improvements: Nitrogen Pretreatment Performance of Minnesota Pollution Control Agency Land Based Wastewater Treatment Systems • June 2016
23
Trophy Lake Estates
Facility description The Trophy Lakes Estates WWTF (MN0067474) is located at the NW ¼ of the NW ¼ of Section 2, Township 34 North, Range 20 West, Center City, and Chisago County, Minnesota. This is a Class C facility built to treat domestic wastewater from a 37-home cluster development. The facility is designed for a wet weather flow of 16,700-gpd, a CBOD5 strength of 30.0-lbs/day, a TSS loading of 33.4-lbs/day, and a TN loading of 3.3-lbs/day.
This facility consists of grinder stations at each home that pump through a pressurized force main to the treatment site. Wastewater enters the treatment site at a raw sewage manhole that drains into a 15,000-gal septic tank followed by a 12,000-gal septic tank. Septic tank effluent flows through a metering manhole into an 8,000-gal filter tank with eight effluent filters. The filter tank effluent then flows into a 10,000-gal recirculation tank with pumps that dose to a 5,500-ft2 RGF. Treated effluent from the RGF drains back into the filter tank and is cycled through the RGF several times before flowing from the recirculation tank to a 10,000-gal denitrification MBBR that is packed with plastic media and fed with a liquid carbon source to facilitate the growth of denitrifying bacteria. Effluent from the denitrification MBBR drains into one of two 10,000-gal dosing tank with pumps that dose to six subsurface drip irrigation zones totaling 80,000-ft2. This facility has a heated building that houses the treatment system control panels and chemical tank.
Figure 14. Effluent Nitrogen series: Sanctuary WWTP
Best Practice Improvements: Nitrogen Pretreatment Performance of Minnesota Pollution Control Agency Land Based Wastewater Treatment Systems • June 2016
24
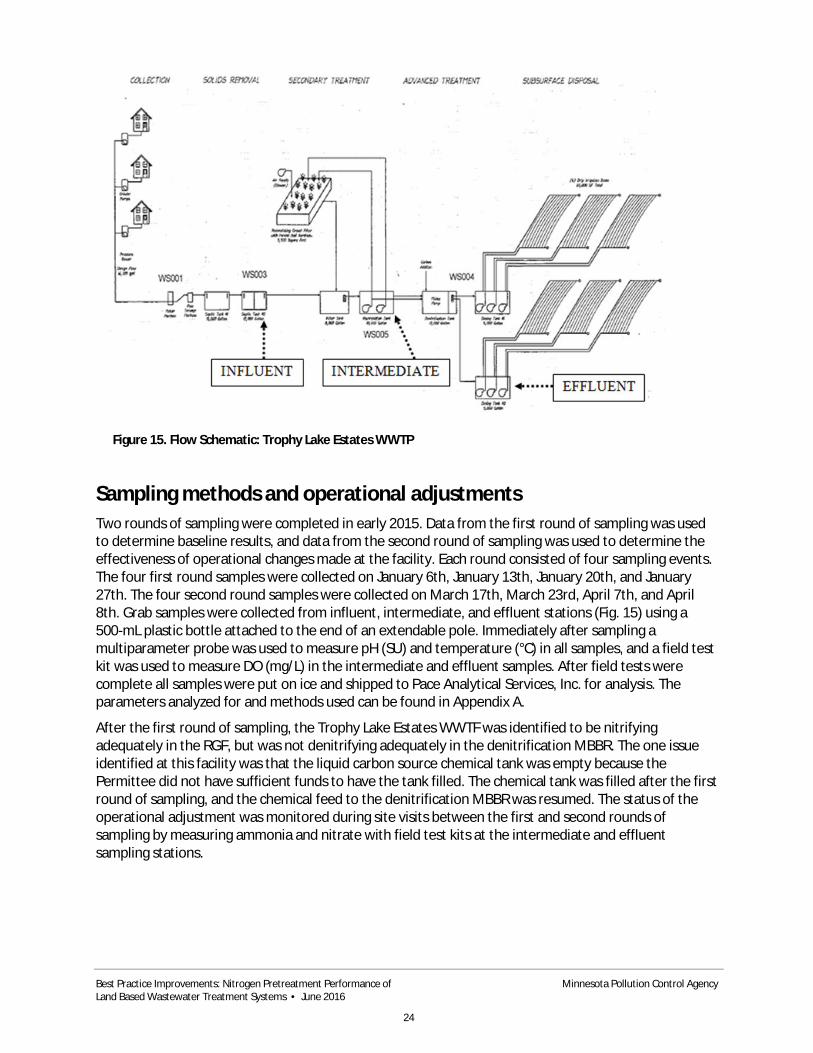
Sampling methods and operational adjustments Two rounds of sampling were completed in early 2015. Data from the first round of sampling was used to determine baseline results, and data from the second round of sampling was used to determine the effectiveness of operational changes made at the facility. Each round consisted of four sampling events. The four first round samples were collected on January 6th, January 13th, January 20th, and January 27th. The four second round samples were collected on March 17th, March 23rd, April 7th, and April 8th. Grab samples were collected from influent, intermediate, and effluent stations (Fig. 15) using a 500-mL plastic bottle attached to the end of an extendable pole. Immediately after sampling a multiparameter probe was used to measure pH (SU) and temperature (°C) in all samples, and a field test kit was used to measure DO (mg/L) in the intermediate and effluent samples. After field tests were complete all samples were put on ice and shipped to Pace Analytical Services, Inc. for analysis. The parameters analyzed for and methods used can be found in Appendix A.
After the first round of sampling, the Trophy Lake Estates WWTF was identified to be nitrifying adequately in the RGF, but was not denitrifying adequately in the denitrification MBBR. The one issue identified at this facility was that the liquid carbon source chemical tank was empty because the Permittee did not have sufficient funds to have the tank filled. The chemical tank was filled after the first round of sampling, and the chemical feed to the denitrification MBBR was resumed. The status of the operational adjustment was monitored during site visits between the first and second rounds of sampling by measuring ammonia and nitrate with field test kits at the intermediate and effluent sampling stations.
Figure 15. Flow Schematic: Trophy Lake Estates WWTP

Best Practice Improvements: Nitrogen Pretreatment Performance of Minnesota Pollution Control Agency Land Based Wastewater Treatment Systems • June 2016
25
Evaluation and conclusions The operational adjustments resulted in an overall decrease in mean (± SD) effluent TN concentration from the first round to the second round (Fig. 16), with the TN removal efficiency between sampling rounds increasing from 42 ± 4% to 85 ± 13%. The mean effluent TN for the second round of sampling was 7.5 ± 5.2-mg/L, which is below the compliance limit of 10-mg/L. Effluent TKN concentrations did not significantly change between sampling rounds, and remained low for all sampling events with a pooled mean value of 1.7 ± 1.2-mg/L. However, effluent NO3- + NO2- concentrations decreased significantly from 27.3 ± .4-mg/L in the first round samples to 5.3 ± 6.3-mg/L in the second round samples. This decrease in NO3- + NO2- concentration indicates improved nitrogen removal efficiency in the denitrification MBBR.
The operational adjustments completed at this site resulted in an overall improvement in nitrogen removal efficiencies, and should require only occasional minor changes (e.g., chemical feed rate, recirculation rate, etc.) to keep the effluent TN concentrations below the monitoring limit. The primary issue at this facility that led to non-compliance was the absence of a liquid carbon source for the denitrification MBBR. This is important from a Service Provider’s perspective because without continual investment from the Permittee in maintaining adequate supplies for the operational needs of the facility, such as the liquid carbon source, it can be very difficult to stay in compliance. The Trophy Lake Estates WWTF should be able to meet the effluent TN limit with continued monitoring and operational adjustments, and should not need any significant additions to the infrastructure in order to satisfy nitrogen removal requirements.
Figure 16. Effluent Nitrogen series: Trophy Lake Estates WWTP.

Best Practice Improvements: Nitrogen Pretreatment Performance of Minnesota Pollution Control Agency Land Based Wastewater Treatment Systems • June 2016
26
West Lake George
Facility description The West Lake George WWTF (MN0054461) is located at the NE ¼ of the NE ¼ of Section 17, Township 33 North, Range 24 West, Oak Grove, Anoka County, Minnesota. This is a Class C facility built to treat domestic wastewater from two separate collection systems serving areas on the west and northeast sides of Lake George. The facility is designed for an average wet weather flow of 25,000-gpd and a CBOD5 of 180-mg/L. This facility consists of septic tank effluent pump (STEP) systems at each home that deliver septic tank effluent through a pressurized force main to one of two surge tanks, each followed by a lift station that pumps the effluent to the treatment site. The treatment site has a sequencing batch reactor (SBR) capable of running two separate batches in parallel simultaneously, followed by a five zone high capacity drainfield for disposal.
Sampling methods and operational adjustments Two rounds of sampling were completed in early 2015. Data from the first round of sampling was used to determine baseline results, and data from the second round of sampling was used to determine the effectiveness of operational changes made at the facility. Each round consisted of four sampling events. The four first round samples were collected on January 7th, January 14th, January 21st, and January 28th. The four second round samples were collected on April 22nd, April 23rd, April 28th, and April 30th. Grab samples were collected from influent, intermediate, and effluent stations (Fig. 17) using a 500-mL plastic bottle attached to the end of an extendable pole. Immediately after sampling a multiparameter probe was used to measure pH (SU) and temperature (°C) in all samples, an in-tank multiparameter probe was used to measure DO (mg/L) in the intermediate samples, and a field test kit was used to measure DO in the
Figure 17. Flow Schematic: West Lake George WWTP

Best Practice Improvements: Nitrogen Pretreatment Performance of Minnesota Pollution Control Agency Land Based Wastewater Treatment Systems • June 2016
27
effluent samples. After field tests were complete all samples were put on ice and shipped to PASI for analysis. The parameters analyzed for and methods used can be found in Appendix A.
After the first round of sampling the West Lake George WWTF was identified to be nitrifying and denitrifying relatively well in the SBR, but was not meeting compliance with the TN monitoring limit. The operator at this facility was routinely adding approximately 16-cups of dog food as a supplemental carbon source to each of the two SBR treatment tanks two to three times per week throughout the winter months in an attempt to increase the CBOD5 strength and thus increase denitrification rates. Since the organic content of dog food is not uniform and is difficult to meter accurately, the second round of sampling was done using a liquid carbon source rather than dog food. Treated effluent was sampled on April 22nd and April 28th, followed by the addition of 1-cup of liquid carbon source to the treatment tanks. Follow up sampling was then completed on April 23rd and April 30th, respectively, to determine if the liquid carbon source addition increased denitrification rates. Given that the operational adjustments were carried out during the second sampling period, no site visits were completed between sampling rounds to check on the facility status.
Evaluation and conclusions The operational adjustments did not result in a significant change in mean (± SD) effluent TN concentration from the first round to the second round (Fig. 18), with the TN concentration between sampling rounds decreasing slightly from 12.7 ± 2.9-mg/L to 8.4 ± 1.9mg/L. The addition of a liquid carbon source instead of dog food as a supplemental carbon source during the second round of sampling did result in a small decrease in effluent TN concentration from the first (8.2-mg/L) and third (11.1-mg/L) samples to the second (6.8-mg/L) and fourth (7.5-mg/L) samples, respectively. These results indicate that using a liquid carbon source instead of dog food could provide the ability to better meter the amount of carbon added to the treatment tanks during winter operations. The effluent TN concentrations at this facility are rarely higher than the compliance limit of 10-mg/L, so being able to increase nitrogen removal efficiencies even small amounts with the use of a liquid carbon source could result in the difference between compliance and non-compliance. The West Lake George WWTF should not need any significant additions to the infrastructure in order to satisfy nitrogen removal requirements.

Best Practice Improvements: Nitrogen Pretreatment Performance of Minnesota Pollution Control Agency Land Based Wastewater Treatment Systems • June 2016
28
Whispering Ridge East
Facility description The Whispering Ridge East WWTF (MN0067075) is located at the SE ¼ of the SW ¼ of Section 19, Township 34 North, Range 26 West, Zimmerman, Sherburne County, Minnesota. This is a Class C facility that was built to treat domestic wastewater from a 44-home cluster development. The facility is designed for an average flow of 19,800-gpd, a CBOD5 strength of 220-mg/L, and a TSS loading of 245-mg/L.
This facility consists of grinder stations at each home that pump through a pressurized force main to the treatment site. Wastewater enters the treatment site at the first of three 17,000-gal septic tanks operating in series, followed by a 17,100-gal recirculation tank that pumps the septic tank effluent to four geo-textile filter modules. The treated effluent drains from the filter modules into a splitter basin that returns a portion of the water back to the second septic tank for passive denitrification, and sends the rest of the flow to a 17,100-gal dosing tank for disposal to a pressurized dispersal bed totaling 17,050-ft2.
Figure 18. Effluent Nitrogen series: West Lake George WWTP.

Best Practice Improvements: Nitrogen Pretreatment Performance of Minnesota Pollution Control Agency Land Based Wastewater Treatment Systems • June 2016
29
Sampling methods and operational adjustments Two rounds of sampling were completed in early 2015. Data from the first round of sampling was used to determine baseline results, and data from the second round of sampling was used to determine the effectiveness of operational changes made at the facility. Each round consisted of four sampling events. The four first round samples were collected on January 6th, January 14th, January 20th, and January 28th. The four second round samples were collected on March 19th, March 24th, March 26th, and April 7th. Grab samples were collected from influent, intermediate, and effluent stations (Fig. 19) using a 500-mL plastic bottle attached to the end of an extendable pole. Immediately after sampling a multiparameter probe was used to measure pH (SU) and temperature (°C) in all samples, and a field test kit was used to measure DO (mg/L) in the intermediate and effluent samples. After field tests were complete all samples were put on ice and shipped to PASI for analysis. The parameters analyzed for and methods used can be found in Appendix A.
After the first round of sampling, the Whispering Ridge East WWTF was identified to be nitrifying and denitrifying adequately in the geo-textile filter modules and septic tanks, respectively. Although the TN concentration in the effluent was below the 12-mg/L monitoring limit, it was noted that the majority of the nitrogen in the effluent was in the form of nitrate/nitrite. In an attempt to increase passive denitrification rates in the septic tanks, a temporary recirculation loop was installed in the splitter basin to pump approximately 3000-gal/day through a ¾-inch hose back to the influent baffle of the first septic
Figure 19. Flow Schematic: Whispering Ridge East WWTP

Best Practice Improvements: Nitrogen Pretreatment Performance of Minnesota Pollution Control Agency Land Based Wastewater Treatment Systems • June 2016
30
tank. The status of the operational adjustment was monitored during site visits between the first and second rounds of sampling by measuring ammonia and nitrate with field test kits at the intermediate and effluent sampling stations.
Evaluation and conclusions The operational adjustments did not result in a significant change in mean (± SD) effluent TN concentration from the first round to the second round (Fig. 20), with the TN removal efficiency between sampling rounds decreasing slightly from 87 ± 2% to 79 ± 7%. This small decrease can likely be attributed to cold temperatures affecting microbial activity in the geo-textile filter modules. Effluent TKN concentrations increased slightly from 0.7 ± 0.1-mg/L in the first round of samples to 2.8 ± 0.4-mg/L in the second round of samples. Effluent NO3- + NO2- concentrations also increased slightly from 7.9 ± 0.9-mg/L in the first round of samples to 9.1 ± 0.4-mg/L in the second round of samples. The temporary recirculation loop back to the first septic tank did not seem to increase passive denitrification rates. This was likely due to only roughly 5-10% of the return flow going to the first septic tank with the majority still going to the second septic tank. A permanent recirculation loop that diverts all return flow to the first septic tank would likely lead to increased rates of passive denitrification. The mean effluent TN concentration was below the 12-mg/L monitoring limit for both sampling rounds, and this high level of treatment should be able to be maintained with periodic adjustments to recirculation rates. However, because the development served by this facility is only approximately half built out, future increases in flow may require the installation of a recirculation loop extension to the first septic tank, or possibly a stand-alone denitrification MBBR with liquid carbon source addition. The Whispering Ridge East Facility is currently meeting the effluent TN limit, and with continued monitoring and operational adjustments should not need any significant additions to the infrastructure at this time in order to satisfy nitrogen removal requirements.

Best Practice Improvements: Nitrogen Pretreatment Performance of Minnesota Pollution Control Agency Land Based Wastewater Treatment Systems • June 2016
31
Figure 20. Effluent Nitrogen series: Whispering Ridge East WWTP.

Best Practice Improvements: Nitrogen Pretreatment Performance of Minnesota Pollution Control Agency Land Based Wastewater Treatment Systems • June 2016
32
Conclusions and Recommendations Effective operations and management practices for land based wastewater pretreatment systems are essential for maintaining high-quality effluent, particularly for facilities with effluent total nitrogen limits. Nitrogen removal from wastewater prior to discharge is critical for the protection of drinking water sources, and is the basis for sampling requirements and permit discharge limits imposed at these facilities by regulatory agencies. This study has shown, both through quantifiable results and qualitative observations, that maintaining compliance with permit limits can be very dependent on the level of operations and maintenance practices occurring at a given facility. A summary table of the results of this study can be found in Appendix B.
For facilities to meet and maintain permit compliance, the Permittee must identify and hire an experienced operator who is both responsible and knowledgeable. Operators must have a thorough understanding of the facility design and construction, pay close attention to operations and maintenance guidelines, and be able to identify how operational adjustments will impact treatment. If the operator is deficient in any of these areas, it may be difficult and potentially not possible for the facility to maintain a sufficient compliance record.
Perhaps the most important concept for a competent operator to grasp is the treatment process design purpose of each facility module, and the accompanying design parameters for loading and management. Operators who have a thorough understanding of the design for each module at the facility they operate will be better able to successfully troubleshoot when compliance issues arise. The source of a specific compliance violation, especially with respect to effluent total nitrogen, can originate or be identified in different facility modules including: collection (e.g., poor organics and solids retention in the septic tanks at the Farms of Lake Elmo Facility), pretreatment (e.g., insufficient nitrification in the pretreatment module at the Riverwood Hills Facility), denitrification (e.g., insufficient denitrification in the denitrification module at the Cambridge, River Park, and Trophy Lakes Estates Facilities), and disposal (e.g., pretreatment module bypass at the Sanctuary Facility). Understanding how each module was designed, the respective parameters for loading and treatment, and the purpose of the module in the treatment train, is critical for successful operations and troubleshooting. Template bM practices/nitrogen mitigation plans can be found in appendices C-G for several different treatment technologies.
Another important factor related to facility design that operators should consider when troubleshooting compliance issues is ensuring that all facility components have been installed and constructed per the original plan. For example, undersized recirculation pumps installed at the Preserve at Birch Lake Facility were failing to deliver the intended amount of septic effluent to the recirculating gravel filter beds during each dosing cycle, which was limiting the nitrification capabilities of this specific pretreatment module. This issue was not identified early in operations because flow to the facility was far below design due to low build out in the development. However as flow to the facility increased, the overall treatment decreased and eventually took the facility out of compliance. Checking the pump sizing would not likely be considered a routine maintenance or troubleshooting item, so to identify and address this type of issue requires the operator to have a thorough comprehension of the facility design and construction.
Along with understanding the facility design, operators must also employ BMP’s when completing O&M tasks at a facility. All O&M tasks and practices should be determined according to: the design engineer and pretreatment system manufacturer specifications, the terms and conditions specified in the MPCA’s State disposal System (SDS) Permit, and the operator’s past operations experience with similar systems. Operators should also be open to occasionally consulting and making use of manufacturer tech support and collaboration with other operators. Collaboration was vital to troubleshooting several of the

Best Practice Improvements: Nitrogen Pretreatment Performance of Minnesota Pollution Control Agency Land Based Wastewater Treatment Systems • June 2016
33
treatment issues that arose in this study. Two examples are the introduction of a liquid carbon source with more quantifiable properties for use in the West Lake George sequencing batch reactor to replace the solid carbon source being used previously and discussion between operators of the Farms of Lake Elmo, River Park, and Riverwood Hills Facilities to determine what the optimal water level was in the aerobic treatment units to achieve the best effluent results. An operator’s reliance on BMP’s when completing routine O&M tasks is crucial for keeping facilities in compliance.
There are several other factors that can contribute to a facility meeting and maintaining compliance. An operational understanding of the impact of minor adjustments such as recirculation ratios (e.g., adjusted to keep the Diamond Lake Woods Facility at or near compliance) and liquid carbon source chemical pump feed rates (e.g., adjusted to bring the River Park Facility into compliance) can be key to keeping facilities operating as efficiently as possible. Facility operators should also be aware of how cold weather operations may affect the microbial activity in the treatment modules, and take the necessary preventative steps to minimize heat loss throughout the system (e.g., utilizing only the needed per design area for treatment in a recirculating gravel filter as was observed at the Preserve at Birch Lake and Trophy Lakes Estates Facilities). In some instances a facility may not be able to meet permit compliance due to a more stringent effluent limit or an engineering flaw, and may need an infrastructure upgrade (e.g., temporary recirculation loops were installed at the Riverwood Hills and Whispering Ridge East Facilities). Infrastructure upgrades can be very costly for the Permittee, so having an experienced and knowledgeable operator will ensure that all other options have been exhausted before investing in expensive additions to the facility.
Although most land based wastewater pretreatment systems have fewer components and may seem relatively uncomplicated compared to larger mechanical and municipal facilities, they still require substantial attention to detail from the operator to stay in compliance with effluent total nitrogen limits. To manage these types of facilities properly it’s recommended that operators complete at least one visit per week, of which two to four hours should be dedicated to the pretreatment and denitrification modules. More frequent visits may be necessary if compliance concerns arise, and additional hours should be allocated for O&M activities dedicated to the collection and disposal modules, commute time to the facility, administrative tasks, etc. Weekly measurements with field test kits to monitor intermediate and effluent DO, ammonia, and nitrate concentrations are also a recommended practice to proactively control effluent nitrogen concentrations. Relying solely on results from required compliance sampling could delay the detection of potential problems in the treatment modules, and likely result in more compliance violations.
The results of this study illustrate a variety of operational issues that can lead to non-compliance, as well as some of the operational improvements that can be employed to mitigate compliance issues. For this reason maintaining an experienced operator who understands the fundamentals of facility design and construction, follows BMP’s for all O&M tasks, and can identify how operational adjustments will impact treatment, is a worthwhile and necessary investment for a Permittee to make. Investing in education specific to land based wastewater pretreatment systems by Permittees and regulatory agencies is also recommended to develop knowledgeable operators who can quickly identify and resolve compliance issues. Optimizing operations and maintenance can also extend the overall life of a facility, but most importantly will keep land based wastewater pretreatment systems in compliance through financially and environmentally responsible management practices.

Best Practice Improvements: Nitrogen Pretreatment Performance of Minnesota Pollution Control Agency Land Based Wastewater Treatment Systems • June 2016
34
Appendix A-Table 1 The parameters analyzed for and methods used by Pace Analytical Service, Inc. to determine the sampling parameter results for all samples collected for the LBWPS project.
Analytical parameter Method
Carbonaceous BOD, 5 day SM 5210B
Total Suspended Solids USGS I-3765
Total Nitrogen Calculation TKN+NO3-+NO2- Calculation
Chloride (A EPA 300.0
Nitrogen, Ammonia EPA 350.1
Nitrogen, Kjeldahl, Total EPA 351.2
Nitrogen, NO2- plus NO3- EPA 353.2
Volatile Organic Carbon (B) EPA 8260
A Analysis completed on effluent samples only B Analysis completed on the first influent sample collected during Round 1 only
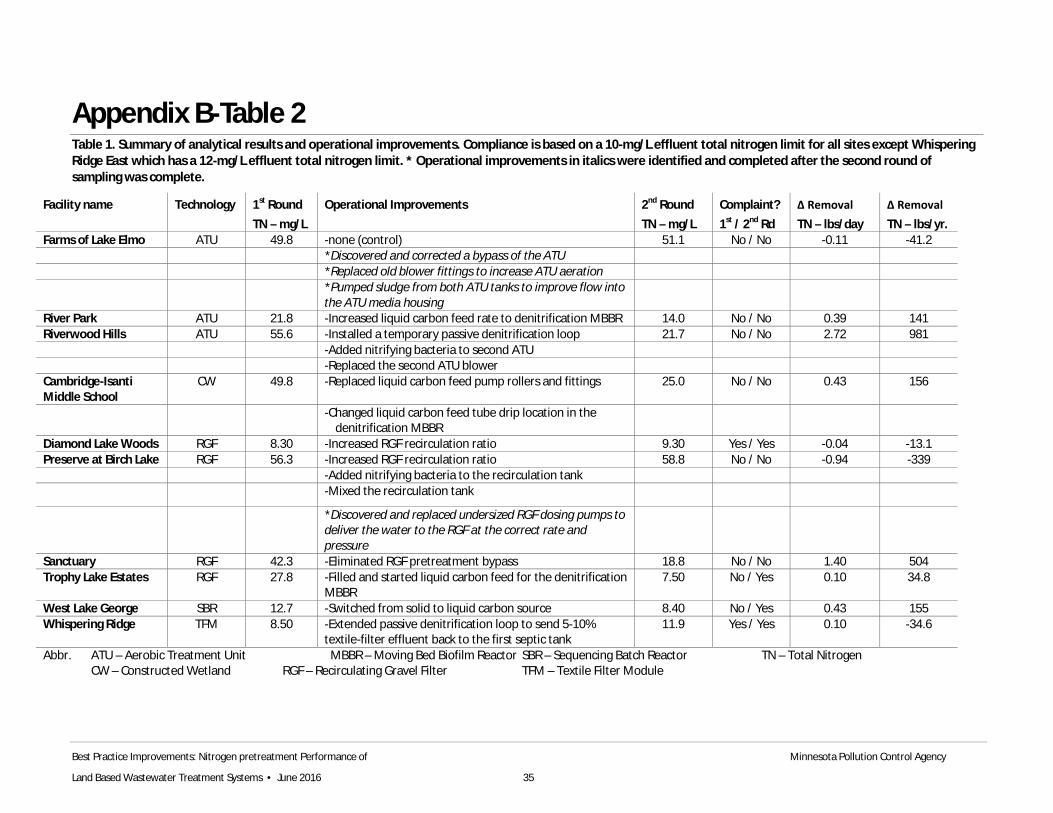
Best Practice Improvements: Nitrogen pretreatment Performance of Minnesota Pollution Control Agency
Land Based Wastewater Treatment Systems • June 2016 35
Appendix B-Table 2 Table 1. Summary of analytical results and operational improvements. Compliance is based on a 10-mg/L effluent total nitrogen limit for all sites except Whispering Ridge East which has a 12-mg/L effluent total nitrogen limit. * Operational improvements in italics were identified and completed after the second round of sampling was complete.
Facility name Technology 1st Round TN – mg/L
Operational Improvements 2nd Round TN – mg/L
Complaint? 1st / 2nd Rd
∆ Removal TN – lbs/day
∆ Removal TN – lbs/yr.
Farms of Lake Elmo ATU 49.8 -none (control) 51.1 No / No -0.11 -41.2 *Discovered and corrected a bypass of the ATU *Replaced old blower fittings to increase ATU aeration *Pumped sludge from both ATU tanks to improve flow into
the ATU media housing
River Park ATU 21.8 -Increased liquid carbon feed rate to denitrification MBBR 14.0 No / No 0.39 141 Riverwood Hills ATU 55.6 -Installed a temporary passive denitrification loop 21.7 No / No 2.72 981 -Added nitrifying bacteria to second ATU -Replaced the second ATU blower Cambridge-Isanti Middle School
CW 49.8 -Replaced liquid carbon feed pump rollers and fittings 25.0 No / No 0.43 156
-Changed liquid carbon feed tube drip location in the denitrification MBBR
Diamond Lake Woods RGF 8.30 -Increased RGF recirculation ratio 9.30 Yes / Yes -0.04 -13.1 Preserve at Birch Lake RGF 56.3 -Increased RGF recirculation ratio 58.8 No / No -0.94 -339 -Added nitrifying bacteria to the recirculation tank -Mixed the recirculation tank
*Discovered and replaced undersized RGF dosing pumps to deliver the water to the RGF at the correct rate and pressure
Sanctuary RGF 42.3 -Eliminated RGF pretreatment bypass 18.8 No / No 1.40 504 Trophy Lake Estates RGF 27.8 -Filled and started liquid carbon feed for the denitrification
MBBR 7.50 No / Yes 0.10 34.8
West Lake George SBR 12.7 -Switched from solid to liquid carbon source 8.40 No / Yes 0.43 155 Whispering Ridge TFM 8.50 -Extended passive denitrification loop to send 5-10%
textile-filter effluent back to the first septic tank 11.9 Yes / Yes 0.10 -34.6
Abbr. ATU – Aerobic Treatment Unit MBBR – Moving Bed Biofilm Reactor SBR – Sequencing Batch Reactor TN – Total Nitrogen CW – Constructed Wetland RGF – Recirculating Gravel Filter TFM – Textile Filter Module

Best Practice Improvements: Nitrogen pretreatment Performance of Minnesota Pollution Control Agency
Land Based Wastewater Treatment Systems • June 2016
36
Appendix C-Aerobic Treatment Unit Note to User: This plan is intended for use as a guide to aid operators during normal facility operation, and may not provide all operational checks and/or adjustments necessary to successfully prevent or troubleshoot a problem at a facility. Operators should refer to technology specific manufacture specification sheets and manuals if more in-depth troubleshooting is required. Operators are required to manage wastewater treatment facilities under the terms and conditions specified in the MPCA’s SDS Permit.
SDS Permit: (insert facility SDS Permit Number here)
Facility description: (insert facility description from SDS Permit here)
This Best Management Practices / Nitrogen Mitigation Plan (BMP’s / NMP) are organized into six sections that include collection, septic tank(s), aerobic treatment unit (ATU), and denitrification, disposal, and infrastructure upgrades. The intention of this document is to provide a framework that Operators can use to maximize the treatment performance and nitrogen removal efficiency at an large subsurface treatment system (LSTS) facility using an ATU for pretreatment of domestic wastewater.
1.0 Collection 1.1 (insert collection system infrastructure and maintenance details here)
2.0 Septic tank(s)
2.1 Influent quality – Influent should be sampled as specified in the SDS Permit, and values compared to design specifications. If the influent quality is deemed to be unacceptable, an investigation into an influent pollution source may be required and non-traditional analytical methods may need to be employed to determine the cause (e.g., VOC analysis for methamphetamine production).
Parameter Design value CBOD5 _____ TSS _____ Total Nitrogen _____
Parameter Value Acceptable pH _____ SU Yes _____ No _____ Temperature _____ °C Yes _____ No _____ CBOD5 _____ mg/L Yes _____ No _____ TSS _____ mg/L Yes _____ No _____ Chloride or SpC _____ mg/L or µS/cm Yes _____ No _____ Total Nitrogen _____ mg/L Yes _____ No _____
2.2 Septic tank(s) – The condition of each septic tank baffle should be inspected bi-annually. Damage to the inlet/outlet baffles may prevent the retention of solids in the septic tanks. Sludge and scum levels should also be measured monthly (or per the SDS Permit requirements). The sludge level should be lower than 12” from the bottom of the baffle, and the scum level should higher than 3” from the bottom of the baffle. The septic tanks will require pumping by a certified maintainer if either the sludge or scum levels do not meet this requirement.
Baffle condition All ok _____ Damage found _____ Tank # _____ Influent / Effluent
Septic tank #1 Sludge _____ Scum _____ Pumping required (Y/N) _____ Septic tank #2 Sludge _____ Scum _____ Pumping required (Y/N) _____

Best Practice Improvements: Nitrogen pretreatment Performance of Minnesota Pollution Control Agency
Land Based Wastewater Treatment Systems • June 2016
37
Septic tank #3 Sludge _____ Scum _____ Pumping required (Y/N) _____ Septic tank #4 Sludge _____ Scum _____ Pumping required (Y/N) _____
2.3 Effluent filters – Septic tank effluent filters should be inspected monthly and cleaned as needed to prevent solids from passing into the recirculation tank.
Effluent filter condition Clean _____ Dirty _____ Require immediate cleaning _____
2.4 Treatment system bypass – Some facilities have a connection that allows septic tank effluent to bypass the treatment component (via gravity or pump siphon). A bypass should only be used in emergency situations, and must be checked monthly to ensure no septic effluent is bypassing the treatment component.
Bypass N/A _____ Closed_____ Leaking _____ Open _____
3.0 Aerobic Treatment Unit
3.1 Module tank – The condition of each ATU module tank baffle should be inspected bi-annually. Damage to the inlet/outlet baffles may allow solids to pass into or out of the ATU module tanks. Sludge and scum levels should also be measured monthly (or per the SDS Permit requirements). The sludge level should be lower than 12” from the ATU module intake to prevent solids from passing into the media chamber, and there should not be an observable scum layer. The ATU module tanks will require pumping by a certified maintainer if either the sludge or scum levels do not meet this requirement.
Baffle Condition All Ok _____ Damage Found _____ Tank # _____ Influent / Effluent
ATU module tank #1 Sludge _____ Scum _____ Pumping required (Y/N) _____ ATU module tank #2 Sludge _____ Scum _____ Pumping required (Y/N) _____ ATU module tank #3 Sludge _____ Scum _____ Pumping required (Y/N) _____ ATU module tank #4 Sludge _____ Scum _____ Pumping required (Y/N) _____
3.2 Media chamber – Significant mixing should be observed at all times in the ATU media chamber. The only observable solids should be in the form of attached growth and/or sloughed flocculent biofilm. The media will need to be cleaned or replaced if solids are floating in the chamber or plugging the media.
Mixing in media chamber Yes _____ No _____ (Immediate troubleshooting is required) Media condition Clean _____ Dirty _____Media replacement needed _____
3.3 Aeration system – The air pressure and flow rate should be checked monthly and compared to equipment manufacture specifications. All pipes and fittings in the aeration system should be checked monthly for leaks. All filter, louver, and venting components should be checked monthly for cleanliness. Any drop in pressure or flow rate should be investigated and resolved immediately.
Aeration system Value Design value Pressure _____ psi _____ psi Flow Rate _____ SCFM _____ SCFM
Pipes / Fittings Sealed _____ Leaking _____ Filters / Louvers Clean _____ Dirty _____ Venting Clear _____ Plugged _____
3.4 Nitrogen management – The TKN concentration in the ATU effluent should be less than 10-mg/L. The DO in the ATU effluent should be greater than 2.0-mg/L, which indicates that
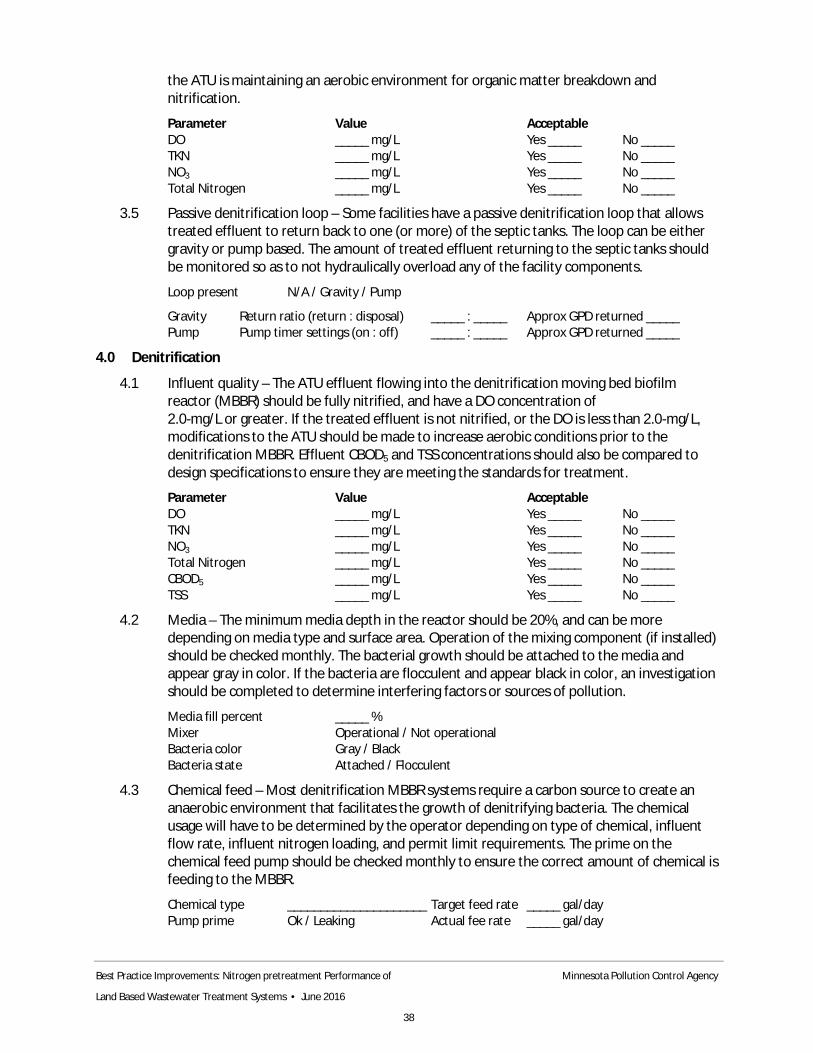
Best Practice Improvements: Nitrogen pretreatment Performance of Minnesota Pollution Control Agency
Land Based Wastewater Treatment Systems • June 2016
38
the ATU is maintaining an aerobic environment for organic matter breakdown and nitrification.
Parameter Value Acceptable DO _____ mg/L Yes _____ No _____
TKN _____ mg/L Yes _____ No _____ NO3 _____ mg/L Yes _____ No _____ Total Nitrogen _____ mg/L Yes _____ No _____
3.5 Passive denitrification loop – Some facilities have a passive denitrification loop that allows treated effluent to return back to one (or more) of the septic tanks. The loop can be either gravity or pump based. The amount of treated effluent returning to the septic tanks should be monitored so as to not hydraulically overload any of the facility components.
Loop present N/A / Gravity / Pump
Gravity Return ratio (return : disposal) _____ : _____ Approx GPD returned _____ Pump Pump timer settings (on : off) _____ : _____ Approx GPD returned _____
4.0 Denitrification
4.1 Influent quality – The ATU effluent flowing into the denitrification moving bed biofilm reactor (MBBR) should be fully nitrified, and have a DO concentration of 2.0-mg/L or greater. If the treated effluent is not nitrified, or the DO is less than 2.0-mg/L, modifications to the ATU should be made to increase aerobic conditions prior to the denitrification MBBR. Effluent CBOD5 and TSS concentrations should also be compared to design specifications to ensure they are meeting the standards for treatment.
Parameter Value Acceptable DO _____ mg/L Yes _____ No _____ TKN _____ mg/L Yes _____ No _____ NO3 _____ mg/L Yes _____ No _____ Total Nitrogen _____ mg/L Yes _____ No _____ CBOD5 _____ mg/L Yes _____ No _____ TSS _____ mg/L Yes _____ No _____
4.2 Media – The minimum media depth in the reactor should be 20%, and can be more depending on media type and surface area. Operation of the mixing component (if installed) should be checked monthly. The bacterial growth should be attached to the media and appear gray in color. If the bacteria are flocculent and appear black in color, an investigation should be completed to determine interfering factors or sources of pollution.
Media fill percent _____ % Mixer Operational / Not operational Bacteria color Gray / Black Bacteria state Attached / Flocculent
4.3 Chemical feed – Most denitrification MBBR systems require a carbon source to create an anaerobic environment that facilitates the growth of denitrifying bacteria. The chemical usage will have to be determined by the operator depending on type of chemical, influent flow rate, influent nitrogen loading, and permit limit requirements. The prime on the chemical feed pump should be checked monthly to ensure the correct amount of chemical is feeding to the MBBR.
Chemical type _____________________ Target feed rate _____ gal/day Pump prime Ok / Leaking Actual fee rate _____ gal/day

Best Practice Improvements: Nitrogen pretreatment Performance of Minnesota Pollution Control Agency
Land Based Wastewater Treatment Systems • June 2016
39
4.4 Effluent quality – The denitrification MBBR effluent (can be sampled from the dosing tank) should have a greater than 90% reduction in nitrate concentration, and a drop in DO concentration to less than 2.0-mg/L, when compared to the denitrification MBBR influent. Effluent CBOD5 and TSS concentrations should also be compared to design specifications to ensure they are meeting the standards for treatment.
Parameter Value Acceptable DO _____ mg/L Yes _____ No _____ TKN _____ mg/L Yes _____ No _____ NO3 _____ mg/L Yes _____ No _____ Total Nitrogen _____ mg/L Yes _____ No _____ CBOD5 _____ mg/L Yes _____ No _____ TSS _____ mg/L Yes _____ No _____
5.0 Disposal 5.1 Dosing tank - The dosing tank houses one or more pumps, each of which is set to deliver
treated water to the drainfield at a specific rate. Bi-monthly amp draws should be completed for each pump to ensure all pumps are operational. Drawdowns should also be completed for each pump bi-annually to check flow rates. If amp draws or drawdown rates are 10% above or below the design criteria the pump should be pulled and inspected.
Amp draw Design Flow rate Design Pump 1 _____ amps _____ amps _____ gal/min _____ gal/min Pump 2 _____ amps _____ amps _____ gal/min _____ gal/min Pump 3 _____ amps _____ amps _____ gal/min _____ gal/min Pump 4 _____ amps _____ amps _____ gal/min _____ gal/min
5.2 (insert disposal system infrastructure and maintenance details here) 6.0 Infrastructure upgrades
6.1 Partial or full ATU replacement – Partial or full replacement of the ATU may be needed in the event that the ATU can no longer provide adequate treatment. Partial replacements may be phased in over time to offset lump sum costs.
ATU replacement recommended: No / Partial / Full
6.2 Additional treatment modules – Additional treatment modules of the same or different technology can be added to the treatment train in the event that the ATU can no longer provide adequate treatment. Additional treatment modules may be phased in over time to offset lump sum costs.
Additional treatment modules recommended: No / Yes
6.3 Passive denitrification loop – If the facility is not meeting total nitrogen limits at the monitoring wells or end-of-pipe sampling station, the installation of a passive denitrification loop back to septic tanks may be required. This infrastructure upgrade is typically more cost effective than installing a standalone denitrification MBBR. The septic tanks provide an anaerobic environment and substrata that supports the growth of attached-film denitrifying bacteria.
Passive denitrification loop recommended: No / Yes / Already installed
6.4 Denitrification MBBR – If the facility is not meeting total nitrogen limits at the monitoring wells or end-of-pipe sampling station, the installation of a standalone denitrification MBBR may be required. Carbon source chemical addition is typically required with denitrification systems to create an anaerobic environment that supports the growth of attached-film denitrifying bacteria.
Denitrification MBBR recommended: No / Yes / Already installed

Best Practice Improvements: Nitrogen pretreatment Performance of Minnesota Pollution Control Agency
Land Based Wastewater Treatment Systems • June 2016
40
Appendix D-Constructed Wetland Note to User: This plan is intended for use as a guide to aid operators during normal facility operation, and may not provide all operational checks and/or adjustments necessary to successfully prevent or troubleshoot a problem at a facility. Operators should refer to technology specific manufacture specification sheets and manuals if more in-depth troubleshooting is required. Operators are required to manage wastewater treatment facilities under the terms and conditions specified in the MPCA’s SDS Permit.
SDS Permit: (insert facility SDS Permit Number here)
Facility description: (insert facility description from SDS Permit here)
This BMP’s / NMP is organized into six sections that include collection, septic tank(s), CW, denitrification, disposal, and infrastructure upgrades. The intention of this document is to provide a framework that operators can use to maximize the treatment performance and nitrogen removal efficiency at an LSTS facility using a CW for pretreatment of domestic wastewater.
1.0 Collection
1.1 (insert collection system infrastructure and maintenance details here)
2.0 Septic tank(s)
2.1 Influent quality – Influent should be sampled as specified in the SDS Permit, and values compared to design specifications. If the influent quality is deemed to be unacceptable, an investigation into an influent pollution source may be required and non-traditional analytical methods may need to be employed to determine the cause (e.g., VOC analysis for methamphetamine production).
Parameter Design value CBOD5 _____ TSS _____ Total Nitrogen _____
Parameter Value Acceptable pH _____ SU Yes _____ No _____ Temperature _____ °C Yes _____ No _____ CBOD5 _____ mg/L Yes _____ No _____ TSS _____ mg/L Yes _____ No _____ Chloride or SpC _____ mg/L or µS/cm Yes _____ No _____ Total Nitrogen _____ mg/L Yes _____ No _____
2.2 Septic tank(s) – The condition of each septic tank baffle should be inspected bi-annually. Damage to the inlet/outlet baffles may prevent the retention of solids in the septic tanks. Sludge and scum levels should also be measured monthly (or per the SDS Permit requirements). The sludge level should be lower than 12” from the bottom of the baffle, and the scum level should higher than 3” from the bottom of the baffle. The septic tanks will require pumping by a certified maintainer if either the sludge or scum levels do not meet this requirement.
Baffle condition All ok _____ Damage found _____ Tank # _____ Influent / Effluent
Septic tank #1 Sludge _____ Scum _____ Pumping required (Y/N) _____ Septic tank #2 Sludge _____ Scum _____ Pumping required (Y/N) _____
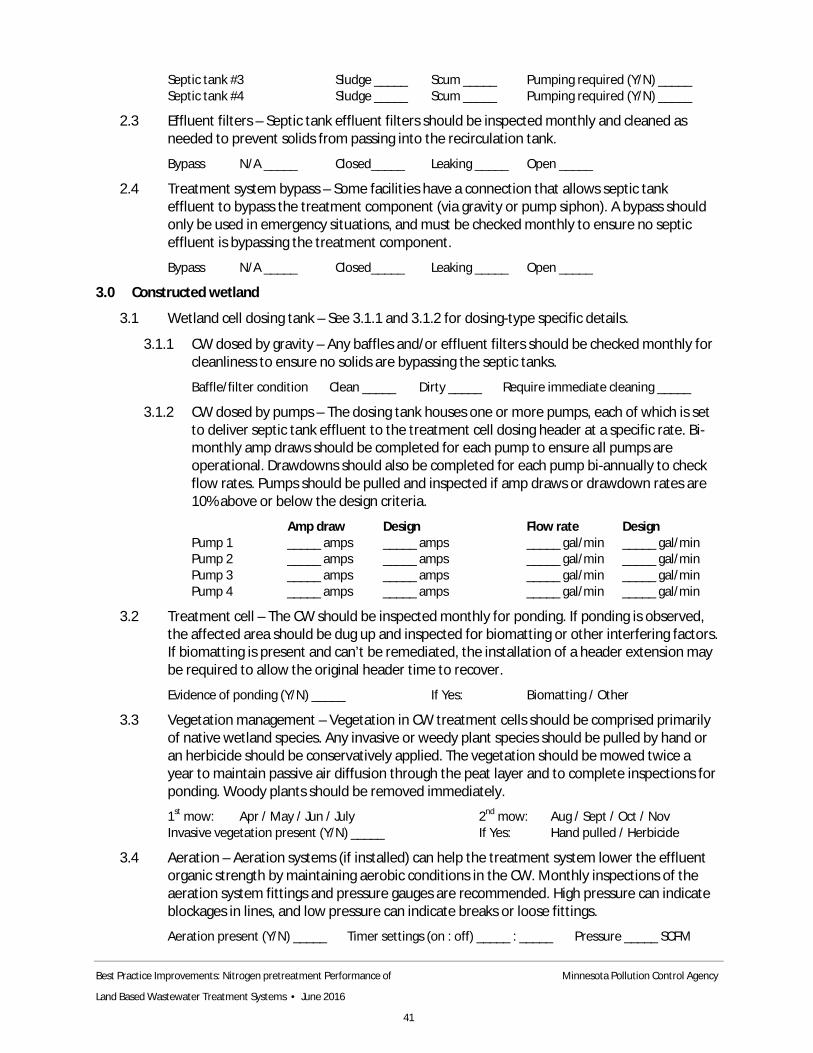
Best Practice Improvements: Nitrogen pretreatment Performance of Minnesota Pollution Control Agency
Land Based Wastewater Treatment Systems • June 2016
41
Septic tank #3 Sludge _____ Scum _____ Pumping required (Y/N) _____ Septic tank #4 Sludge _____ Scum _____ Pumping required (Y/N) _____
2.3 Effluent filters – Septic tank effluent filters should be inspected monthly and cleaned as needed to prevent solids from passing into the recirculation tank.
Bypass N/A _____ Closed_____ Leaking _____ Open _____
2.4 Treatment system bypass – Some facilities have a connection that allows septic tank effluent to bypass the treatment component (via gravity or pump siphon). A bypass should only be used in emergency situations, and must be checked monthly to ensure no septic effluent is bypassing the treatment component.
Bypass N/A _____ Closed_____ Leaking _____ Open _____
3.0 Constructed wetland
3.1 Wetland cell dosing tank – See 3.1.1 and 3.1.2 for dosing-type specific details.
3.1.1 CW dosed by gravity – Any baffles and/or effluent filters should be checked monthly for cleanliness to ensure no solids are bypassing the septic tanks.
Baffle/filter condition Clean _____ Dirty _____ Require immediate cleaning _____
3.1.2 CW dosed by pumps – The dosing tank houses one or more pumps, each of which is set to deliver septic tank effluent to the treatment cell dosing header at a specific rate. Bi-monthly amp draws should be completed for each pump to ensure all pumps are operational. Drawdowns should also be completed for each pump bi-annually to check flow rates. Pumps should be pulled and inspected if amp draws or drawdown rates are 10% above or below the design criteria.
Amp draw Design Flow rate Design Pump 1 _____ amps _____ amps _____ gal/min _____ gal/min Pump 2 _____ amps _____ amps _____ gal/min _____ gal/min Pump 3 _____ amps _____ amps _____ gal/min _____ gal/min Pump 4 _____ amps _____ amps _____ gal/min _____ gal/min
3.2 Treatment cell – The CW should be inspected monthly for ponding. If ponding is observed, the affected area should be dug up and inspected for biomatting or other interfering factors. If biomatting is present and can’t be remediated, the installation of a header extension may be required to allow the original header time to recover.
Evidence of ponding (Y/N) _____ If Yes: Biomatting / Other
3.3 Vegetation management – Vegetation in CW treatment cells should be comprised primarily of native wetland species. Any invasive or weedy plant species should be pulled by hand or an herbicide should be conservatively applied. The vegetation should be mowed twice a year to maintain passive air diffusion through the peat layer and to complete inspections for ponding. Woody plants should be removed immediately.
1st mow: Apr / May / Jun / July 2nd mow: Aug / Sept / Oct / Nov Invasive vegetation present (Y/N) _____ If Yes: Hand pulled / Herbicide
3.4 Aeration – Aeration systems (if installed) can help the treatment system lower the effluent organic strength by maintaining aerobic conditions in the CW. Monthly inspections of the aeration system fittings and pressure gauges are recommended. High pressure can indicate blockages in lines, and low pressure can indicate breaks or loose fittings.
Aeration present (Y/N) _____ Timer settings (on : off) _____ : _____ Pressure _____ SCFM

Best Practice Improvements: Nitrogen pretreatment Performance of Minnesota Pollution Control Agency
Land Based Wastewater Treatment Systems • June 2016
42
3.5 Nitrogen management – The TKN concentration in the CW effluent should be less than 10-mg/L. The DO in the CW effluent should be greater than 2.0-mg/L, which indicates that the CW is maintaining an aerobic environment for organic matter breakdown and nitrification.
Parameter Value Acceptable DO _____ mg/L Yes _____ No _____
TKN _____ mg/L Yes _____ No _____ NO3 _____ mg/L Yes _____ No _____ Total Nitrogen _____ mg/L Yes _____ No _____
3.6 Passive denitrification loop – Some facilities have a passive denitrification loop that allows treated effluent to return back to one (or more) of the septic tanks. The loop can be either gravity or pump based. The amount of treated effluent returning to the septic tanks should be monitored so as to not hydraulically overload any of the facility components.
Loop Present N/A / Gravity / Pump Gravity Return ratio (return : disposal) _____ : _____ Approx GPD returned _____ Pump Pump timer settings (on : off) _____ : _____ Approx GPD returned _____
4.0 Denitrification
4.1 Influent quality – The CW effluent flowing into the denitrification moving bed biofilm reactor (MBBR) should be fully nitrified, and have a DO concentration of 2.0-mg/L or greater. If the treated effluent is not nitrified, or the DO is less than 2.0-mg/L, modifications to the CW should be made to increase aerobic conditions prior to the denitrification MBBR. Effluent CBOD5 and TSS concentrations should also be compared to design specifications to ensure they are meeting the standards for treatment.
Parameter Value Acceptable DO _____ mg/L Yes _____ No _____ TKN _____ mg/L Yes _____ No _____ NO3 _____ mg/L Yes _____ No _____ Total Nitrogen _____ mg/L Yes _____ No _____ CBOD5 _____ mg/L Yes _____ No _____ TSS _____ mg/L Yes _____ No _____
4.2 Media – The minimum media depth in the reactor should be 20%, and can be more depending on media type and surface area. Operation of the mixing component (if installed) should be checked monthly. The bacterial growth should be attached to the media and appear gray in color. If the bacteria are flocculent and appear black in color, an investigation should be completed to determine interfering factors or sources of pollution.
Media fill percent _____ % Mixer Operational / Not operational Bacteria color Gray / Black Bacteria state Attached / Flocculent
4.3 Chemical feed – Most denitrification MBBR systems require a carbon source to create an anaerobic environment that facilitates the growth of denitrifying bacteria. The chemical usage will have to be determined by the operator depending on type of chemical, influent flow rate, influent nitrogen loading, and permit limit requirements. The prime on the chemical feed pump should be checked monthly to ensure the correct amount of chemical is feeding to the MBBR.
Chemical type _____________________ Target feed rate _____ gal/day Pump prime Ok / Leaking Actual fee rate _____ gal/day

Best Practice Improvements: Nitrogen pretreatment Performance of Minnesota Pollution Control Agency
Land Based Wastewater Treatment Systems • June 2016
43
4.4 Effluent quality – The denitrification MBBR effluent (can be sampled from the dosing tank) should have a greater than 90% reduction in nitrate concentration, and a drop in DO concentration to less than 2.0-mg/L, when compared to the denitrification MBBR influent. Effluent CBOD5 and TSS concentrations should also be compared to design specifications to ensure they are meeting the standards for treatment.
Parameter Value Acceptable DO _____ mg/L Yes _____ No _____ TKN _____ mg/L Yes _____ No _____ NO3 _____ mg/L Yes _____ No _____ Total Nitrogen _____ mg/L Yes _____ No _____ CBOD5 _____ mg/L Yes _____ No _____ TSS _____ mg/L Yes _____ No _____
5.0 Disposal 5.1 Dosing tank - The dosing tank houses one or more pumps, each of which is set to deliver
treated water to the drainfield at a specific rate. Bi-monthly amp draws should be completed for each pump to ensure all pumps are operational. Drawdowns should also be completed for each pump bi-annually to check flow rates. If amp draws or drawdown rates are 10% above or below the design criteria the pump should be pulled and inspected.
Amp draw Design Flow rate Design Pump 1 _____ amps _____ amps _____ gal/min _____ gal/min Pump 2 _____ amps _____ amps _____ gal/min _____ gal/min Pump 3 _____ amps _____ amps _____ gal/min _____ gal/min Pump 4 _____ amps _____ amps _____ gal/min _____ gal/min
5.2 (insert disposal system infrastructure and maintenance details here) 6.0 Infrastructure upgrades
6.1 Partial or full CW replacement – Partial or full replacement of the CW may be needed in the event that the CW can no longer provide adequate treatment. Partial replacements may be phased in over time to offset lump sum costs. CW Replacement recommended: No / Partial / Full
6.2 Additional treatment modules – Additional treatment modules of the same or different technology can be added to the treatment train in the event that the CW can no longer provide adequate treatment. Additional treatment modules may be phased in over time to offset lump sum costs. Additional treatment modules recommended: No / Yes
6.3 Passive denitrification loop – If the facility is not meeting total nitrogen limits at the monitoring wells or end-of-pipe sampling station, the installation of a passive denitrification loop back to septic tanks may be required. This infrastructure upgrade is typically more cost effective than installing a standalone denitrification MBBR. The septic tanks provide an anaerobic environment and substrata that supports the growth of attached-film denitrifying bacteria.
Passive denitrification loop recommended: No / Yes / Already installed
6.4 Denitrification MBBR – If the facility is not meeting total nitrogen limits at the monitoring wells or end-of-pipe sampling station, the installation of a standalone denitrification MBBR may be required. Carbon source chemical addition is typically required with denitrification systems to create an anaerobic environment that supports the growth of attached-film denitrifying bacteria.
Denitrification MBBR recommended: No / Yes / Already installed

Best Practice Improvements: Nitrogen pretreatment Performance of Minnesota Pollution Control Agency
Land Based Wastewater Treatment Systems • June 2016
44
Appendix E-Geo-textile Filter Module Note to User: This plan is intended for use as a guide to aid operators during normal facility operation, and may not provide all operational checks and/or adjustments necessary to successfully prevent or troubleshoot a problem at a facility. Operators should refer to technology specific manufacture specification sheets and manuals if more in-depth troubleshooting is required. Operators are required to manage wastewater treatment facilities under the terms and conditions specified in the MPCA’s SDS Permit.
SDS Permit: (insert facility SDS permit Number here)
Facility description: (insert facility description from SDS Permit here)
This BMP’s / NMP is organized into six sections that include collection, septic tank(s), TFM, denitrification, disposal, and infrastructure upgrades. The intention of this document is to provide a framework that operators can use to maximize the treatment performance and nitrogen removal efficiency at an LSTS facility using a TFM for pretreatment of domestic wastewater.
1.0 Collection
1.1 (insert collection system infrastructure and maintenance details here)
2.0 Septic tank(s)
2.1 Influent quality – Influent should be sampled as specified in the SDS Permit, and values compared to design specifications. If the influent quality is deemed to be unacceptable, an investigation into an influent pollution source may be required and non-traditional analytical methods may need to be employed to determine the cause (e.g., VOC analysis for methamphetamine production).
Parameter Design value CBOD5 _____ TSS _____ Total Nitrogen _____
Parameter Value Acceptable pH _____ SU Yes _____ No _____ Temperature _____ °C Yes _____ No _____ CBOD5 _____ mg/L Yes _____ No _____ TSS _____ mg/L Yes _____ No _____ Chloride or SpC _____ mg/L or µS/cm Yes _____ No _____ Total Nitrogen _____ mg/L Yes _____ No _____
2.2 Septic tank(s) – The condition of each septic tank baffle should be inspected bi-annually. Damage to the inlet/outlet baffles may prevent the retention of solids in the septic tanks. Sludge and scum levels should also be measured monthly (or per the SDS Permit requirements). The sludge level should be lower than 12” from the bottom of the baffle, and the scum level should higher than 3” from the bottom of the baffle. The septic tanks will require pumping by a certified maintainer if either the sludge or scum levels do not meet this requirement.
Baffle condition All ok _____ Damage found _____ Tank # _____ Influent / Effluent
Septic tank #1 Sludge _____ Scum _____ Pumping required (Y/N) _____
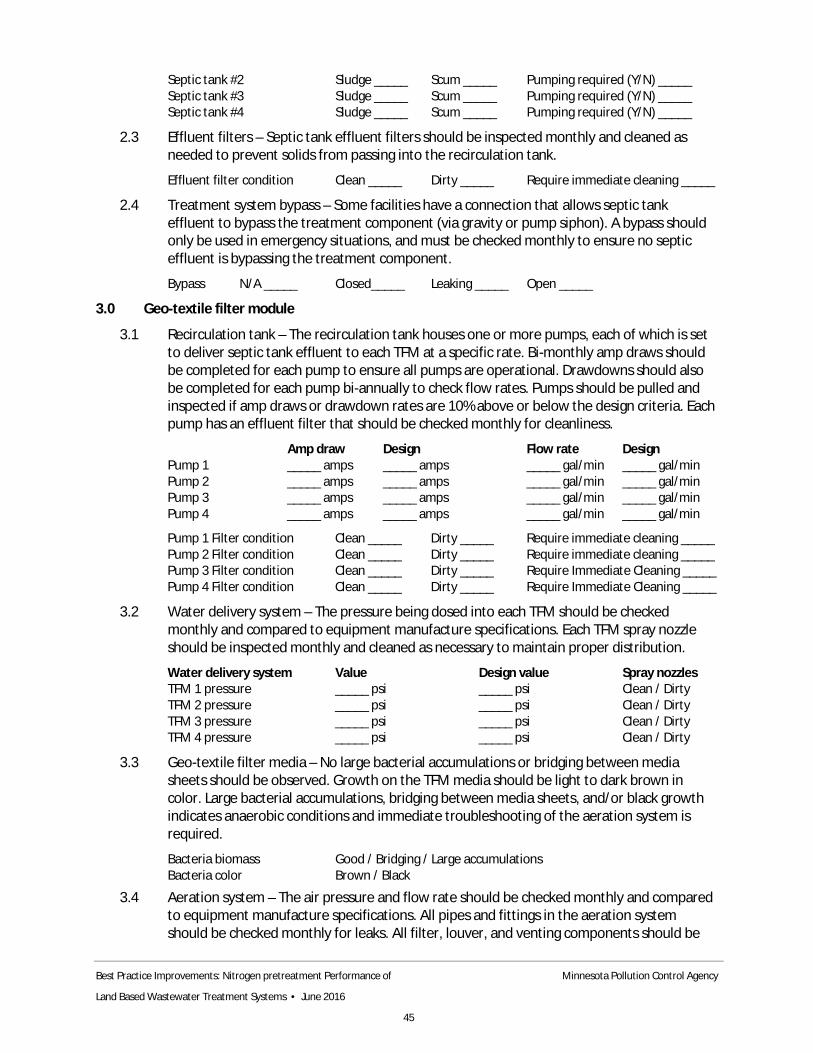
Best Practice Improvements: Nitrogen pretreatment Performance of Minnesota Pollution Control Agency
Land Based Wastewater Treatment Systems • June 2016
45
Septic tank #2 Sludge _____ Scum _____ Pumping required (Y/N) _____ Septic tank #3 Sludge _____ Scum _____ Pumping required (Y/N) _____ Septic tank #4 Sludge _____ Scum _____ Pumping required (Y/N) _____
2.3 Effluent filters – Septic tank effluent filters should be inspected monthly and cleaned as needed to prevent solids from passing into the recirculation tank.
Effluent filter condition Clean _____ Dirty _____ Require immediate cleaning _____
2.4 Treatment system bypass – Some facilities have a connection that allows septic tank effluent to bypass the treatment component (via gravity or pump siphon). A bypass should only be used in emergency situations, and must be checked monthly to ensure no septic effluent is bypassing the treatment component.
Bypass N/A _____ Closed_____ Leaking _____ Open _____
3.0 Geo-textile filter module
3.1 Recirculation tank – The recirculation tank houses one or more pumps, each of which is set to deliver septic tank effluent to each TFM at a specific rate. Bi-monthly amp draws should be completed for each pump to ensure all pumps are operational. Drawdowns should also be completed for each pump bi-annually to check flow rates. Pumps should be pulled and inspected if amp draws or drawdown rates are 10% above or below the design criteria. Each pump has an effluent filter that should be checked monthly for cleanliness.
Amp draw Design Flow rate Design Pump 1 _____ amps _____ amps _____ gal/min _____ gal/min Pump 2 _____ amps _____ amps _____ gal/min _____ gal/min Pump 3 _____ amps _____ amps _____ gal/min _____ gal/min Pump 4 _____ amps _____ amps _____ gal/min _____ gal/min
Pump 1 Filter condition Clean _____ Dirty _____ Require immediate cleaning _____ Pump 2 Filter condition Clean _____ Dirty _____ Require immediate cleaning _____ Pump 3 Filter condition Clean _____ Dirty _____ Require Immediate Cleaning _____ Pump 4 Filter condition Clean _____ Dirty _____ Require Immediate Cleaning _____
3.2 Water delivery system – The pressure being dosed into each TFM should be checked monthly and compared to equipment manufacture specifications. Each TFM spray nozzle should be inspected monthly and cleaned as necessary to maintain proper distribution.
Water delivery system Value Design value Spray nozzles TFM 1 pressure _____ psi _____ psi Clean / Dirty TFM 2 pressure _____ psi _____ psi Clean / Dirty TFM 3 pressure _____ psi _____ psi Clean / Dirty TFM 4 pressure _____ psi _____ psi Clean / Dirty
3.3 Geo-textile filter media – No large bacterial accumulations or bridging between media sheets should be observed. Growth on the TFM media should be light to dark brown in color. Large bacterial accumulations, bridging between media sheets, and/or black growth indicates anaerobic conditions and immediate troubleshooting of the aeration system is required.
Bacteria biomass Good / Bridging / Large accumulations Bacteria color Brown / Black
3.4 Aeration system – The air pressure and flow rate should be checked monthly and compared to equipment manufacture specifications. All pipes and fittings in the aeration system should be checked monthly for leaks. All filter, louver, and venting components should be

Best Practice Improvements: Nitrogen pretreatment Performance of Minnesota Pollution Control Agency
Land Based Wastewater Treatment Systems • June 2016
46
checked monthly for cleanliness. Any drop in pressure or flow rate should be investigated and resolved immediately. Aeration system Value Design value Pressure _____ psi _____ psi Flow rate _____ SCFM _____ SCFM
Pipes / Fittings Sealed _____ Leaking _____ Filters / Louvers Clean _____ Dirty _____ Venting Clear _____ Plugged _____
3.5 Nitrogen management – The TKN concentration in the TFM effluent should be less than 10-mg/L. The recirculation pump off times should be decreased if the TKN concentration is greater than 10-mg/L. The return flow component should also be inspected quarterly to verify the correct rate of flow to the recirculation and dosing tanks. The DO in the TFM effluent should also be greater than 2.0-mg/L, which indicates that the TFM is maintaining an aerobic environment for organic matter breakdown and nitrification.
Parameter Value Acceptable DO _____ mg/L Yes _____ No _____
TKN _____ mg/L Yes _____ No _____ NO3 _____ mg/L Yes _____ No _____ Total Nitrogen _____ mg/L Yes _____ No _____
3.6 Passive denitrification loop – Some facilities have a passive denitrification loop that allows treated effluent to return back to one (or more) of the septic tanks. The loop can be either gravity or pump based. The amount of treated effluent returning to the septic tanks should be monitored so as to not hydraulically overload any of the facility components.
Loop present N/A / Gravity / Pump Gravity Return ratio (return : disposal) _____ : _____ Approx GPD returned _____ Pump Pump timer settings (on : off) _____ : _____ Approx GPD returned _____
4.0 Denitrification
4.1 Influent quality – The TFM effluent flowing into the denitrification moving bed biofilm reactor (MBBR) should be fully nitrified, and have a DO concentration of 2.0-mg/L or greater. If the treated effluent is not nitrified, or the DO is less than 2.0-mg/L, modifications to the TFM should be made to increase aerobic conditions prior to the denitrification MBBR. Effluent CBOD5 and TSS concentrations should also be compared to design specifications to ensure they are meeting the standards for treatment.
Parameter Value Acceptable DO _____ mg/L Yes _____ No _____ TKN _____ mg/L Yes _____ No _____ NO3 _____ mg/L Yes _____ No _____ Total Nitrogen _____ mg/L Yes _____ No _____ CBOD5 _____ mg/L Yes _____ No _____ TSS _____ mg/L Yes _____ No _____
4.2 Media – The minimum media depth in the reactor should be 20%, and can be more depending on media type and surface area. Operation of the mixing component (if installed) should be checked monthly. The bacterial growth should be attached to the media and appear gray in color. If the bacteria are flocculent and appear black in color, an investigation should be completed to determine interfering factors or sources of pollution.
Media fill percent _____ %

Best Practice Improvements: Nitrogen pretreatment Performance of Minnesota Pollution Control Agency
Land Based Wastewater Treatment Systems • June 2016
47
Mixer Operational / Not operational Bacteria color Gray / Black Bacteria state Attached / Flocculent
4.3 Chemical feed – Most denitrification MBBR systems require a carbon source to create an anaerobic environment that facilitates the growth of denitrifying bacteria. The chemical usage will have to be determined by the operator depending on type of chemical, influent flow rate, influent nitrogen loading, and permit limit requirements. The prime on the chemical feed pump should be checked monthly to ensure the correct amount of chemical is feeding to the MBBR.
Chemical Type _____________________ Target Feed Rate _____ gal/day Pump Prime Ok / Leaking Actual Fee Rate _____ gal/day
4.4 Effluent quality – The denitrification MBBR effluent (can be sampled from the dosing tank) should have a greater than 90% reduction in nitrate concentration, and a drop in DO concentration to less than 2.0-mg/L, when compared to the denitrification MBBR influent. Effluent CBOD5 and TSS concentrations should also be compared to design specifications to ensure they are meeting the standards for treatment.
Parameter Value Acceptable DO _____ mg/L Yes _____ No _____ TKN _____ mg/L Yes _____ No _____ NO3 _____ mg/L Yes _____ No _____ Total Nitrogen _____ mg/L Yes _____ No _____ CBOD5 _____ mg/L Yes _____ No _____ TSS _____ mg/L Yes _____ No _____
5.0 Disposal
5.1 Dosing tank - The dosing tank houses one or more pumps, each of which is set to deliver treated water to the drainfield at a specific rate. Bi-monthly amp draws should be completed for each pump to ensure all pumps are operational. Drawdowns should also be completed for each pump bi-annually to check flow rates. If amp draws or drawdown rates are 10% above or below the design criteria the pump should be pulled and inspected.
Amp Draw Design Flow rate Design Pump 1 _____ amps _____ amps _____ gal/min _____ gal/min Pump 2 _____ amps _____ amps _____ gal/min _____ gal/min Pump 3 _____ amps _____ amps _____ gal/min _____ gal/min Pump 4 _____ amps _____ amps _____ gal/min _____ gal/min
5.2 (insert disposal system infrastructure and maintenance details here)
6.0 Infrastructure upgrades
6.1 Partial or full TFM replacement – Partial or full replacement of the TFM may be needed in the event that the TFM can no longer provide adequate treatment. Partial replacements may be phased in over time to offset lump sum costs.
TFM replacement recommended: No / Partial / Full
6.2 Additional treatment modules – Additional treatment modules of the same or different technology can be added to the treatment train in the event that the TFM can no longer provide adequate treatment. Additional treatment modules may be phased in over time to offset lump sum costs.
Additional treatment modules recommended: No / Yes

Best Practice Improvements: Nitrogen pretreatment Performance of Minnesota Pollution Control Agency
Land Based Wastewater Treatment Systems • June 2016
48
6.3 Passive denitrification loop – If the facility is not meeting total nitrogen limits at the monitoring wells or end-of-pipe sampling station, the installation of a passive denitrification loop back to septic tanks may be required. This infrastructure upgrade is typically more cost effective than installing a standalone denitrification MBBR. The septic tanks provide an anaerobic environment and substrata that supports the growth of attached-film denitrifying bacteria.
Passive denitrification loop recommended: No / Yes / Already installed
6.4 Denitrification MBBR – If the facility is not meeting total nitrogen limits at the monitoring wells or end-of-pipe sampling station, the installation of a standalone denitrification MBBR may be required. Carbon source chemical addition is typically required with denitrification systems to create an anaerobic environment that supports the growth of attached-film denitrifying bacteria.
Denitrification MBBR recommended: No / Yes / Already installed
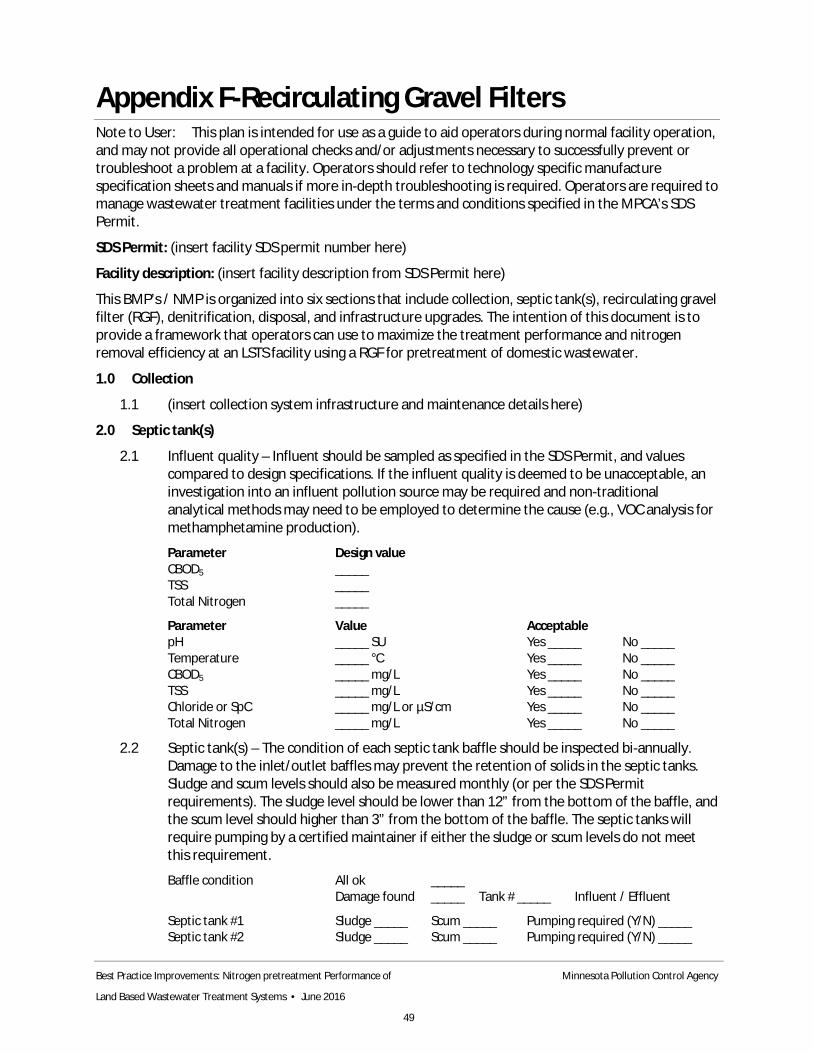
Best Practice Improvements: Nitrogen pretreatment Performance of Minnesota Pollution Control Agency
Land Based Wastewater Treatment Systems • June 2016
49
Appendix F-Recirculating Gravel Filters Note to User: This plan is intended for use as a guide to aid operators during normal facility operation, and may not provide all operational checks and/or adjustments necessary to successfully prevent or troubleshoot a problem at a facility. Operators should refer to technology specific manufacture specification sheets and manuals if more in-depth troubleshooting is required. Operators are required to manage wastewater treatment facilities under the terms and conditions specified in the MPCA’s SDS Permit.
SDS Permit: (insert facility SDS permit number here)
Facility description: (insert facility description from SDS Permit here)
This BMP’s / NMP is organized into six sections that include collection, septic tank(s), recirculating gravel filter (RGF), denitrification, disposal, and infrastructure upgrades. The intention of this document is to provide a framework that operators can use to maximize the treatment performance and nitrogen removal efficiency at an LSTS facility using a RGF for pretreatment of domestic wastewater.
1.0 Collection
1.1 (insert collection system infrastructure and maintenance details here)
2.0 Septic tank(s)
2.1 Influent quality – Influent should be sampled as specified in the SDS Permit, and values compared to design specifications. If the influent quality is deemed to be unacceptable, an investigation into an influent pollution source may be required and non-traditional analytical methods may need to be employed to determine the cause (e.g., VOC analysis for methamphetamine production).
Parameter Design value CBOD5 _____ TSS _____ Total Nitrogen _____
Parameter Value Acceptable pH _____ SU Yes _____ No _____ Temperature _____ °C Yes _____ No _____ CBOD5 _____ mg/L Yes _____ No _____ TSS _____ mg/L Yes _____ No _____ Chloride or SpC _____ mg/L or µS/cm Yes _____ No _____ Total Nitrogen _____ mg/L Yes _____ No _____
2.2 Septic tank(s) – The condition of each septic tank baffle should be inspected bi-annually. Damage to the inlet/outlet baffles may prevent the retention of solids in the septic tanks. Sludge and scum levels should also be measured monthly (or per the SDS Permit requirements). The sludge level should be lower than 12” from the bottom of the baffle, and the scum level should higher than 3” from the bottom of the baffle. The septic tanks will require pumping by a certified maintainer if either the sludge or scum levels do not meet this requirement.
Baffle condition All ok _____ Damage found _____ Tank # _____ Influent / Effluent
Septic tank #1 Sludge _____ Scum _____ Pumping required (Y/N) _____ Septic tank #2 Sludge _____ Scum _____ Pumping required (Y/N) _____

Best Practice Improvements: Nitrogen pretreatment Performance of Minnesota Pollution Control Agency
Land Based Wastewater Treatment Systems • June 2016
50
Septic tank #3 Sludge _____ Scum _____ Pumping required (Y/N) _____ Septic tank #4 Sludge _____ Scum _____ Pumping required (Y/N) _____
2.3 Effluent filters – Septic tank effluent filters should be inspected monthly and cleaned as needed to prevent solids from passing into the recirculation tank.
Effluent filter condition Clean _____ Dirty _____ Require immediate cleaning _____
2.4 Treatment system bypass – Some facilities have a connection that allows septic tank effluent to bypass the treatment component (via gravity or pump siphon). A bypass should only be used in emergency situations, and must be checked monthly to ensure no septic effluent is bypassing the treatment component.
Bypass N/A _____ Closed_____ Leaking _____ Open _____
3.0 Recirculating gravel filter
3.1 Recirculation tank – The recirculation tank houses one or more pumps, each of which is set to deliver septic tank effluent to the treatment cell dosing laterals at a specific rate. Bi-monthly amp draws should be completed for each pump to ensure all pumps are operational. Drawdowns should also be completed for each pump bi-annually to check flow rates. Pumps should be pulled and inspected if amp draws or drawdown rates are 10% above or below the design criteria.
Amp draw Design Flow rate Design Pump 1 _____ amps _____ amps _____ gal/min _____ gal/min Pump 2 _____ amps _____ amps _____ gal/min _____ gal/min Pump 3 _____ amps _____ amps _____ gal/min _____ gal/min Pump 4 _____ amps _____ amps _____ gal/min _____ gal/min
3.2 Treatment cell – The RGF should be inspected monthly for ponding. If ponding is observed, the affected area should be dug up and inspected for biomatting, broken laterals, etc. The treatment cell dosing laterals should be flushed quarterly.
Evidence of ponding (Y/N) _____ If yes: Biomatting / Broken lateral / Other
3.3 Vegetation management – See 3.3.1 and 3.3.2 for technology specific details. Woody plants should be removed immediately regardless of technology.
3.3.1 RGF with peat cover – Vegetation species management in RGF treatment systems with peat cover is less critical than in horizontal subsurface flow wetland treatment systems because treatment occurs in the rock layer below the peat. The vegetation should be mowed twice a year to maintain passive air diffusion through the peat layer and to inspection for ponding, broken laterals, etc.
1st mow: Apr / May / Jun / July 2nd mow: Aug / Sept / Oct / Nov
3.3.2 RGF without peat cover – Vegetation should not be allowed to grow in open recirculating gravel filters to maintain passive air diffusion through the media. If vegetation is present it should be pulled by hand, or an herbicide should be conservatively applied.
Vegetation present (Y/N) _____ If Yes: Hand pulled / Herbicide
3.4 Aeration – Aeration systems can help the treatment system lower the effluent organic strength by maintaining aerobic conditions in the RGF. Monthly inspections of the aeration system fittings and pressure gauges are recommended. High pressure can indicate blockages in lines, and low pressure can indicate breaks or loose fittings.
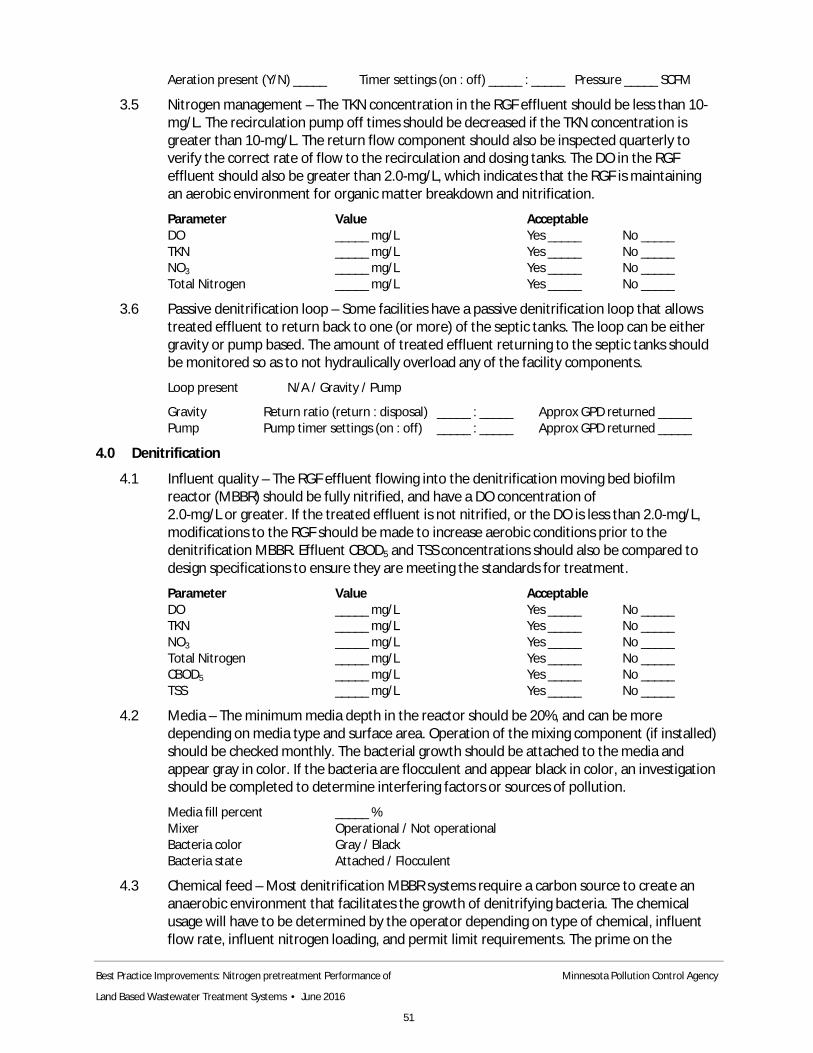
Best Practice Improvements: Nitrogen pretreatment Performance of Minnesota Pollution Control Agency
Land Based Wastewater Treatment Systems • June 2016
51
Aeration present (Y/N) _____ Timer settings (on : off) _____ : _____ Pressure _____ SCFM
3.5 Nitrogen management – The TKN concentration in the RGF effluent should be less than 10-mg/L. The recirculation pump off times should be decreased if the TKN concentration is greater than 10-mg/L. The return flow component should also be inspected quarterly to verify the correct rate of flow to the recirculation and dosing tanks. The DO in the RGF effluent should also be greater than 2.0-mg/L, which indicates that the RGF is maintaining an aerobic environment for organic matter breakdown and nitrification.
Parameter Value Acceptable DO _____ mg/L Yes _____ No _____
TKN _____ mg/L Yes _____ No _____ NO3 _____ mg/L Yes _____ No _____ Total Nitrogen _____ mg/L Yes _____ No _____
3.6 Passive denitrification loop – Some facilities have a passive denitrification loop that allows treated effluent to return back to one (or more) of the septic tanks. The loop can be either gravity or pump based. The amount of treated effluent returning to the septic tanks should be monitored so as to not hydraulically overload any of the facility components.
Loop present N/A / Gravity / Pump Gravity Return ratio (return : disposal) _____ : _____ Approx GPD returned _____ Pump Pump timer settings (on : off) _____ : _____ Approx GPD returned _____
4.0 Denitrification
4.1 Influent quality – The RGF effluent flowing into the denitrification moving bed biofilm reactor (MBBR) should be fully nitrified, and have a DO concentration of 2.0-mg/L or greater. If the treated effluent is not nitrified, or the DO is less than 2.0-mg/L, modifications to the RGF should be made to increase aerobic conditions prior to the denitrification MBBR. Effluent CBOD5 and TSS concentrations should also be compared to design specifications to ensure they are meeting the standards for treatment.
Parameter Value Acceptable DO _____ mg/L Yes _____ No _____ TKN _____ mg/L Yes _____ No _____ NO3 _____ mg/L Yes _____ No _____ Total Nitrogen _____ mg/L Yes _____ No _____ CBOD5 _____ mg/L Yes _____ No _____ TSS _____ mg/L Yes _____ No _____
4.2 Media – The minimum media depth in the reactor should be 20%, and can be more depending on media type and surface area. Operation of the mixing component (if installed) should be checked monthly. The bacterial growth should be attached to the media and appear gray in color. If the bacteria are flocculent and appear black in color, an investigation should be completed to determine interfering factors or sources of pollution.
Media fill percent _____ % Mixer Operational / Not operational Bacteria color Gray / Black Bacteria state Attached / Flocculent
4.3 Chemical feed – Most denitrification MBBR systems require a carbon source to create an anaerobic environment that facilitates the growth of denitrifying bacteria. The chemical usage will have to be determined by the operator depending on type of chemical, influent flow rate, influent nitrogen loading, and permit limit requirements. The prime on the
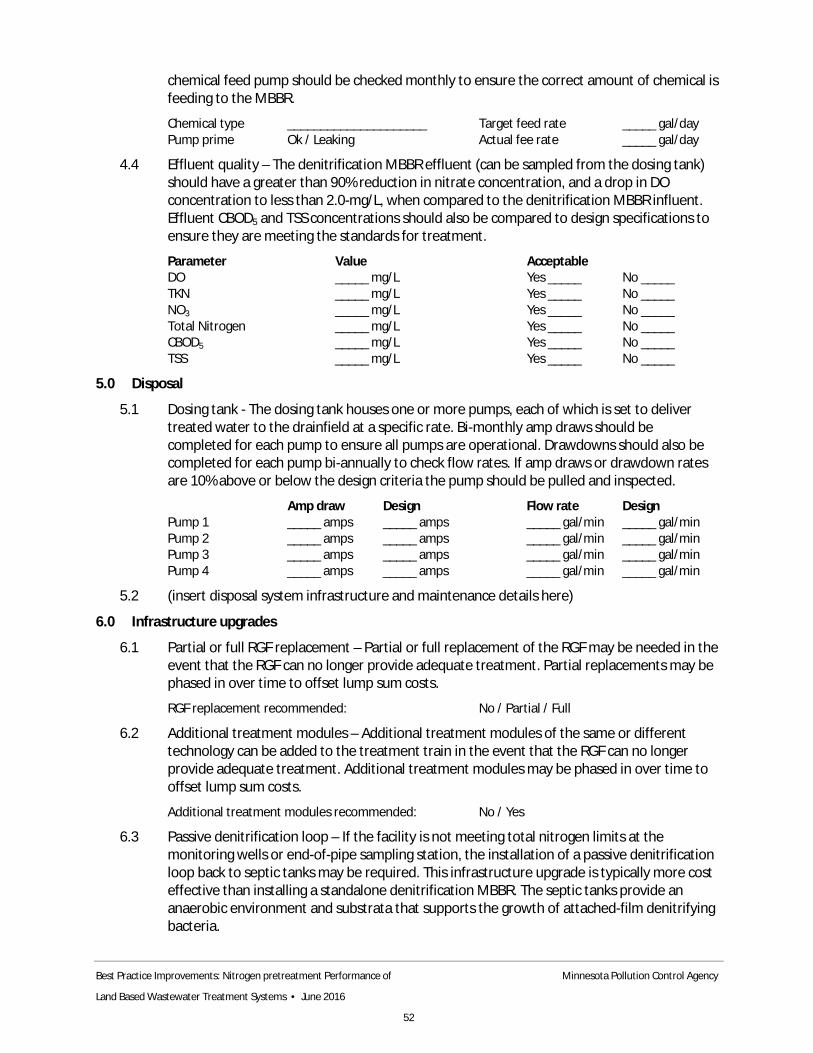
Best Practice Improvements: Nitrogen pretreatment Performance of Minnesota Pollution Control Agency
Land Based Wastewater Treatment Systems • June 2016
52
chemical feed pump should be checked monthly to ensure the correct amount of chemical is feeding to the MBBR.
Chemical type _____________________ Target feed rate _____ gal/day Pump prime Ok / Leaking Actual fee rate _____ gal/day
4.4 Effluent quality – The denitrification MBBR effluent (can be sampled from the dosing tank) should have a greater than 90% reduction in nitrate concentration, and a drop in DO concentration to less than 2.0-mg/L, when compared to the denitrification MBBR influent. Effluent CBOD5 and TSS concentrations should also be compared to design specifications to ensure they are meeting the standards for treatment.
Parameter Value Acceptable DO _____ mg/L Yes _____ No _____ TKN _____ mg/L Yes _____ No _____ NO3 _____ mg/L Yes _____ No _____ Total Nitrogen _____ mg/L Yes _____ No _____ CBOD5 _____ mg/L Yes _____ No _____ TSS _____ mg/L Yes _____ No _____
5.0 Disposal
5.1 Dosing tank - The dosing tank houses one or more pumps, each of which is set to deliver treated water to the drainfield at a specific rate. Bi-monthly amp draws should be completed for each pump to ensure all pumps are operational. Drawdowns should also be completed for each pump bi-annually to check flow rates. If amp draws or drawdown rates are 10% above or below the design criteria the pump should be pulled and inspected.
Amp draw Design Flow rate Design Pump 1 _____ amps _____ amps _____ gal/min _____ gal/min Pump 2 _____ amps _____ amps _____ gal/min _____ gal/min Pump 3 _____ amps _____ amps _____ gal/min _____ gal/min Pump 4 _____ amps _____ amps _____ gal/min _____ gal/min
5.2 (insert disposal system infrastructure and maintenance details here)
6.0 Infrastructure upgrades
6.1 Partial or full RGF replacement – Partial or full replacement of the RGF may be needed in the event that the RGF can no longer provide adequate treatment. Partial replacements may be phased in over time to offset lump sum costs.
RGF replacement recommended: No / Partial / Full
6.2 Additional treatment modules – Additional treatment modules of the same or different technology can be added to the treatment train in the event that the RGF can no longer provide adequate treatment. Additional treatment modules may be phased in over time to offset lump sum costs.
Additional treatment modules recommended: No / Yes
6.3 Passive denitrification loop – If the facility is not meeting total nitrogen limits at the monitoring wells or end-of-pipe sampling station, the installation of a passive denitrification loop back to septic tanks may be required. This infrastructure upgrade is typically more cost effective than installing a standalone denitrification MBBR. The septic tanks provide an anaerobic environment and substrata that supports the growth of attached-film denitrifying bacteria.

Best Practice Improvements: Nitrogen pretreatment Performance of Minnesota Pollution Control Agency
Land Based Wastewater Treatment Systems • June 2016
53
Passive denitrification loop recommended: No / Yes / Already installed
6.4 Denitrification MBBR – If the facility is not meeting total nitrogen limits at the monitoring wells or end-of-pipe sampling station, the installation of a standalone denitrification MBBR may be required. Carbon source chemical addition is typically required with denitrification systems to create an anaerobic environment that supports the growth of attached-film denitrifying bacteria.
Denitrification MBBR recommended: No / Yes / Already installed
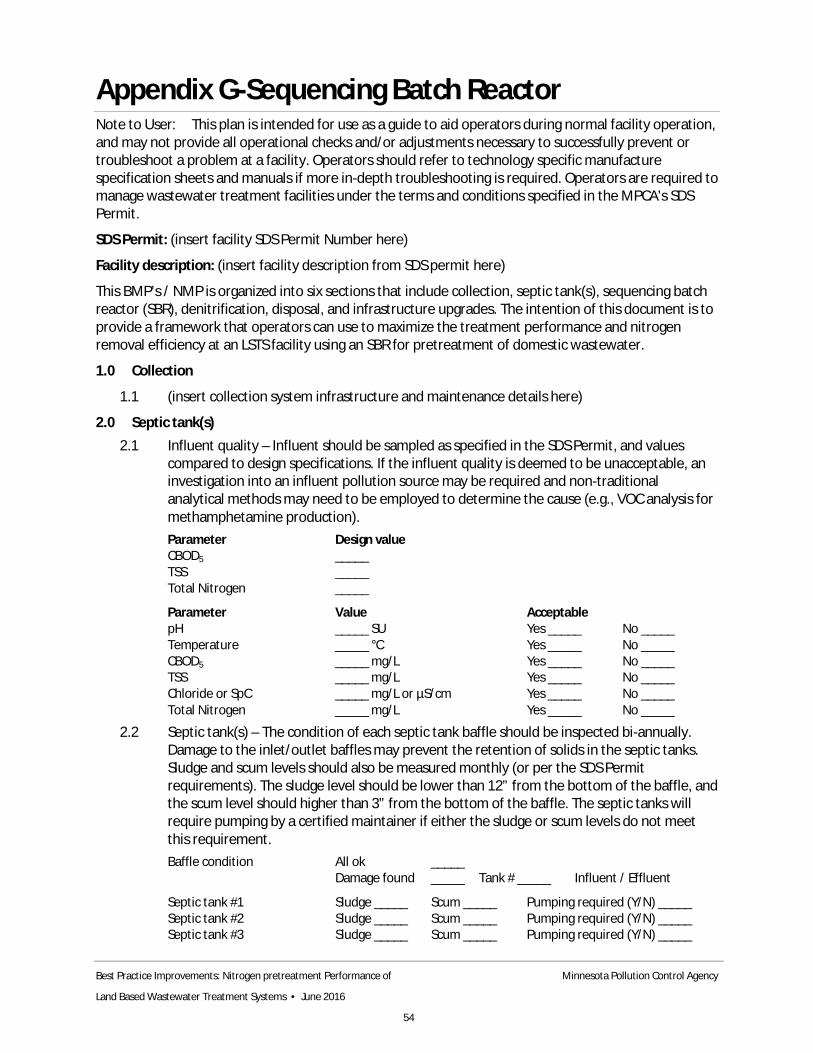
Best Practice Improvements: Nitrogen pretreatment Performance of Minnesota Pollution Control Agency
Land Based Wastewater Treatment Systems • June 2016
54
Appendix G-Sequencing Batch Reactor Note to User: This plan is intended for use as a guide to aid operators during normal facility operation, and may not provide all operational checks and/or adjustments necessary to successfully prevent or troubleshoot a problem at a facility. Operators should refer to technology specific manufacture specification sheets and manuals if more in-depth troubleshooting is required. Operators are required to manage wastewater treatment facilities under the terms and conditions specified in the MPCA’s SDS Permit.
SDS Permit: (insert facility SDS Permit Number here)
Facility description: (insert facility description from SDS permit here)
This BMP’s / NMP is organized into six sections that include collection, septic tank(s), sequencing batch reactor (SBR), denitrification, disposal, and infrastructure upgrades. The intention of this document is to provide a framework that operators can use to maximize the treatment performance and nitrogen removal efficiency at an LSTS facility using an SBR for pretreatment of domestic wastewater.
1.0 Collection
1.1 (insert collection system infrastructure and maintenance details here)
2.0 Septic tank(s) 2.1 Influent quality – Influent should be sampled as specified in the SDS Permit, and values
compared to design specifications. If the influent quality is deemed to be unacceptable, an investigation into an influent pollution source may be required and non-traditional analytical methods may need to be employed to determine the cause (e.g., VOC analysis for methamphetamine production). Parameter Design value CBOD5 _____ TSS _____ Total Nitrogen _____
Parameter Value Acceptable pH _____ SU Yes _____ No _____ Temperature _____ °C Yes _____ No _____ CBOD5 _____ mg/L Yes _____ No _____ TSS _____ mg/L Yes _____ No _____ Chloride or SpC _____ mg/L or µS/cm Yes _____ No _____ Total Nitrogen _____ mg/L Yes _____ No _____
2.2 Septic tank(s) – The condition of each septic tank baffle should be inspected bi-annually. Damage to the inlet/outlet baffles may prevent the retention of solids in the septic tanks. Sludge and scum levels should also be measured monthly (or per the SDS Permit requirements). The sludge level should be lower than 12” from the bottom of the baffle, and the scum level should higher than 3” from the bottom of the baffle. The septic tanks will require pumping by a certified maintainer if either the sludge or scum levels do not meet this requirement. Baffle condition All ok _____
Damage found _____ Tank # _____ Influent / Effluent
Septic tank #1 Sludge _____ Scum _____ Pumping required (Y/N) _____ Septic tank #2 Sludge _____ Scum _____ Pumping required (Y/N) _____ Septic tank #3 Sludge _____ Scum _____ Pumping required (Y/N) _____

Best Practice Improvements: Nitrogen pretreatment Performance of Minnesota Pollution Control Agency
Land Based Wastewater Treatment Systems • June 2016
55
Septic tank #4 Sludge _____ Scum _____ Pumping required (Y/N) _____
2.3 Effluent filters – Septic tank effluent filters should be inspected monthly and cleaned as needed to prevent solids from passing into the recirculation tank.
2.4 Treatment system bypass – Some facilities have a connection that allows septic tank effluent to bypass the treatment component (via gravity or pump siphon). A bypass should only be used in emergency situations, and must be checked monthly to ensure no septic effluent is bypassing the treatment component.
3.0 Sequencing batch reactor 3.1 Influent filters and equalization – SBR influent should be screened via bar screen, septic tank
effluent filters, baffles, etc., to ensure that solids are removed before they can interfere with the settling process. Sludge and scum levels in the SBR equalization tank(s) should be monitored monthly and pumped when necessary by a certified maintainer per manufacture specifications. Screening components All ok _____
Damage found _____ Tank # _____ Influent / Effluent
SBR equalization tank #1 Sludge _____ Scum _____ Pumping required (Y/N) _____ SBR equalization tank #2 Sludge _____ Scum _____ Pumping required (Y/N) _____ SBR equalization tank #3 Sludge _____ Scum _____ Pumping required (Y/N) _____ SBR equalization tank #4 Sludge _____ Scum _____ Pumping required (Y/N) _____
3.2 Mixing system – The air and/or water pressure and flow rate should be checked monthly and compared to equipment manufacture specifications. All pipes and fittings in the mixing system should be checked monthly for leaks. All filter, louver, and venting components should be checked monthly for cleanliness. Any drop in pressure or flow rate should be investigated and resolved immediately.
Aeration system Value Design value Pressure _____ psi _____ psi Flow Rate _____ SCFM _____ SCFM
Pipes / Fittings Sealed _____ Leaking _____ Filters / Louvers Clean _____ Dirty _____ Venting Clear _____ Plugged _____
3.3 Activated sludge settling – A settlability test should be completed and the results should be compared to manufacture specifications. Adjustments to mixing and/or settling time should be made if the results do not match the recommended settling rate.
Time _____ min Volume _____ mL Settled _____ % Floating _____ %
3.4 Nitrogen management – The TN concentration in the SBR effluent should be less than 10-mg/L. If the TN concentration is higher than 10-mg/L and mostly in the form of TKN, then the mixing/aeration time should be increased. If the TN concentration is higher than 10-mg/L and mostly in the form of NO3, then either the settling time should be increased, or an artificial carbon source should be added to the influent to increase the organic strength of the incoming wastewater.
Parameter Value Acceptable TKN _____ mg/L Yes _____ No _____
NO3 _____ mg/L Yes _____ No _____ Total Nitrogen _____ mg/L Yes _____ No _____
Chemical addition needed Y / N

Best Practice Improvements: Nitrogen pretreatment Performance of Minnesota Pollution Control Agency
Land Based Wastewater Treatment Systems • June 2016
56
If yes Chemical type _____________________ Target feed rate _____ gal/day
3.5 Passive denitrification loop – Some facilities have a passive denitrification loop that allows treated effluent to return back to one (or more) of the septic tanks. The loop can be either gravity or pump based. The amount of treated effluent returning to the septic tanks should be monitored so as to not hydraulically overload any of the facility components.
Loop present N/A / Gravity / Pump Gravity Return ratio (return : disposal) _____ : _____ Approx GPD returned _____ Pump Pump timer settings (on : off) _____ : _____ Approx GPD returned _____
4.0 Denitrification (if applicable)
4.1 Influent quality – The SBR effluent flowing into the denitrification moving bed biofilm reactor (MBBR) should be fully nitrified, and have a DO concentration of 2.0-mg/L or greater. If the treated effluent is not nitrified, or the DO is less than 2.0-mg/L, modifications to the SBR should be made to increase aerobic conditions prior to the denitrification MBBR. Effluent CBOD5 and TSS concentrations should also be compared to design specifications to ensure they are meeting the standards for treatment.
Parameter Value Acceptable DO _____ mg/L Yes _____ No _____ TKN _____ mg/L Yes _____ No _____ NO3 _____ mg/L Yes _____ No _____ Total Nitrogen _____ mg/L Yes _____ No _____ CBOD5 _____ mg/L Yes _____ No _____ TSS _____ mg/L Yes _____ No _____
4.2 Media – The minimum media depth in the reactor should be 20%, and can be more depending on media type and surface area. Operation of the mixing component (if installed) should be checked monthly. The bacterial growth should be attached to the media and appear gray in color. If the bacteria are flocculent and appear black in color, an investigation should be completed to determine interfering factors or sources of pollution.
Media fill percent _____ % Mixer Operational / Not operational Bacteria color Gray / Black Bacteria state Attached / Flocculent
4.3 Chemical feed – Most denitrification MBBR systems require a carbon source to create an anaerobic environment that facilitates the growth of denitrifying bacteria. The chemical usage will have to be determined by the operator depending on type of chemical, influent flow rate, influent nitrogen loading, and permit limit requirements. The prime on the chemical feed pump should be checked monthly to ensure the correct amount of chemical is feeding to the MBBR.
Chemical type _____________________ Target feed rate _____ gal/day Pump prime Ok / Leaking Actual fee rate _____ gal/day
4.4 Effluent quality – The denitrification MBBR effluent (can be sampled from the dosing tank) should have a greater than 90% reduction in nitrate concentration, and a drop in DO concentration to less than 2.0-mg/L, when compared to the denitrification MBBR influent. Effluent CBOD5 and TSS concentrations should also be compared to design specifications to ensure they are meeting the standards for treatment.
Parameter Value Acceptable

Best Practice Improvements: Nitrogen pretreatment Performance of Minnesota Pollution Control Agency
Land Based Wastewater Treatment Systems • June 2016
57
DO _____ mg/L Yes _____ No _____ TKN _____ mg/L Yes _____ No _____ NO3 _____ mg/L Yes _____ No _____ Total Nitrogen _____ mg/L Yes _____ No _____ CBOD5 _____ mg/L Yes _____ No _____ TSS _____ mg/L Yes _____ No _____
5.0 Disposal
5.1 Dosing tank - The dosing tank houses one or more pumps, each of which is set to deliver treated water to the drainfield at a specific rate. Bi-monthly amp draws should be completed for each pump to ensure all pumps are operational. Drawdowns should also be completed for each pump bi-annually to check flow rates. If amp draws or drawdown rates are 10% above or below the design criteria the pump should be pulled and inspected.
Amp draw Design Flow rate Design Pump 1 _____ amps _____ amps _____ gal/min _____ gal/min Pump 2 _____ amps _____ amps _____ gal/min _____ gal/min Pump 3 _____ amps _____ amps _____ gal/min _____ gal/min Pump 4 _____ amps _____ amps _____ gal/min _____ gal/min
5.2 (insert disposal system infrastructure and maintenance details here)
6.0 Infrastructure upgrades
6.1 Partial or full SBR replacement – Partial or full replacement of the SBR may be needed in the event that the SBR can no longer provide adequate treatment. Partial replacements may be phased in over time to offset lump sum costs.
SBR replacement recommended: No / Partial / Full
6.2 Additional treatment modules – Additional treatment modules of the same or different technology can be added to the treatment train in the event that the SBR can no longer provide adequate treatment. Additional treatment modules may be phased in over time to offset lump sum costs.
Additional treatment modules recommended: No / Yes
6.3 Passive denitrification loop – If the facility is not meeting total nitrogen limits at the monitoring wells or end-of-pipe sampling station, the installation of a passive denitrification loop back to septic tanks may be required. This infrastructure upgrade is typically more cost effective than installing a standalone denitrification MBBR. The septic tanks provide an anaerobic environment and substrata that supports the growth of attached-film denitrifying bacteria.
Passive denitrification loop recommended: No / Yes / Already installed
6.4 Denitrification MBBR – If the facility is not meeting total nitrogen limits at the monitoring wells or end-of-pipe sampling station, the installation of a standalone denitrification MBBR may be required. Carbon source chemical addition is typically required with denitrification systems to create an anaerobic environment that supports the growth of attached-film denitrifying bacteria.
Denitrification MBBR recommended: No / Yes / Already installed