Embed Size (px)
Citation preview
BERTH PRODUCTIVITY
The Trends, Outlook and Market Forces Impacting Ship Turnaround Times
JOC Port Productivity
Brought to you by JOC, powered by PIERS
JOC Group Inc.
JULY 2014
WHITEPAPER, JULY 2014
BERTH PRODUCTIVITY: The Trends, Outlook and Market Forces Impacting Ship Turnaround Times
+1.800.952.3839 | www.joc.com | www.piers.com
© Copyright JOC Group Inc. 2014ii
Introduction . . . . . . . . . . . . . . . . . . . . . . . . . . . . . . . . 1
Berth Productivity . . . . . . . . . . . . . . . . . . . . . . . . . . . . 3The Trends, Outlook and Market Forces Impacting Ship Turnaround Times
Asia’s Troubled Outlook . . . . . . . . . . . . . . . . . . . . . . . . . 9Why a Steady Dose of Mega-ships Limits the Potential for Berth Productivity Gains
Racing the Clock in Europe . . . . . . . . . . . . . . . . . . . . . . . 11Big Projects Pave the Way for the World’s Biggest Ships
Behind the Port Productivity Numbers . . . . . . . . . . . . . . . . .14
About the JOC Port Productivity Rankings . . . . . . . . . . . . . . .16
The Rankings . . . . . . . . . . . . . . . . . . . . . . . . . . . . . . .17
Validation Methodology . . . . . . . . . . . . . . . . . . . . . . . . .23
Rankings Methodology . . . . . . . . . . . . . . . . . . . . . . . . .23
About the Report . . . . . . . . . . . . . . . . . . . . . . . . . . . . .24
About JOC Group Inc. . . . . . . . . . . . . . . . . . . . . . . . . . .24
TABLES
Rankings the Ports . . . . . . . . . . . . . . . . . . . . . . . . . . . .17
Top Ports: Worldwide . . . . . . . . . . . . . . . . . . . . . .17
Top Ports: Americas . . . . . . . . . . . . . . . . . . . . . . .18
Top Ports: Asia . . . . . . . . . . . . . . . . . . . . . . . . . .18
Top Ports: Europe, Middle East, Africa . . . . . . . . . . . . .18
Rankings the Terminals . . . . . . . . . . . . . . . . . . . . . . . . . .19
Top Terminals: Worldwide . . . . . . . . . . . . . . . . . . . .19
Top Terminals: Americas . . . . . . . . . . . . . . . . . . . .19
Top Terminals: Asia . . . . . . . . . . . . . . . . . . . . . . .20
Top Terminals: Europe, Middle East, Africa . . . . . . . . . .20
Port Productivity by Ship Size . . . . . . . . . . . . . . . . . . . . . .21
Top Ports Globally, VESSELS LESS THAN 8,000 TEUS . . . . . . . .21
Top Terminals Globally, 8,000-TEU VESSELS AND LARGER . . . . .21
Top Terminals Globally, VESSELS LESS THAN 8,000 TEUS . . . . . .22
Top Ports Globally, VESSELS 8,000+ TEUS . . . . . . . . . . . . .22
TABLE OF CONTENTS
WHITEPAPER, JULY 2014
BERTH PRODUCTIVITY: The Trends, Outlook and Market Forces Impacting Ship Turnaround Times
+1.800.952.3839 | www.joc.com | www.piers.com
© Copyright JOC Group Inc. 20141
By Peter TirschwellExecutive VicePresident/ChiefContent Officer,The JOC Group Inc.
Introduction
ENHANCING BERTH PRODUCTIVITY
If there’s an issue in the container shipping world that’s hotter than port productivity, I’m not aware of it. As mega-container ships replace smaller vessels in major east-west and north-south trades, terminals are struggling to turn the ships around and move containers through their facilities in a timely manner.This is, and isn’t, a new problem. Ports have long struggled to adjust to the ever-larger ships that container lines have deployed over the years. It’s a lot easier for a carrier CEO to sign an order for a new ship than for a port to deepen its draft so that ships can enter or leave fully loaded. One takes 10 minutes, the other 10 years.
But the dynamic has changed. Ships are growing at an accelerating, some would say alarming, rate as carriers become fixated on reducing operating costs as the key to profitability. That’s ratcheting up pressure on terminals to perform, because carriers can’t realize the potential cost savings of their mega-ships if they’re always playing catch-up to stay on schedule because of port delays, which raise fuel costs. The consequences of being late are growing because, as mega-ships take up more time at port, berth windows are harder to find, particularly if the ship arrives late, putting the already tardy vessel even further off its schedule.
Indeed, there is evidence that on turnaround times and throughput time for containers, the bigger ships are exacting a toll. In an analysis of ship calls at major North Europe ports between April 15 and May 15, logistics software firm CargoSmart found that more than half of arrivals of ships of 10,000 TEUs or more were delayed longer than 12 hours, and nearly a quarter were delayed more than 24 hours.
But a larger set of ship calls at those ports, most of which involved smaller ships, experienced shorter delays, pointing clearly to higher delays associated with larger ships. In our many discussions with shippers, my JOC colleagues and I have never heard more complaints about the time it’s taking for containers to move through terminals.
That’s why the productivity rankings of ports and terminals we release today are relevant. Productivity at the berth, which is what the JOC Port Productivity data measures, is the metric most closely tied to ship turnaround times. It shows which ports and terminals are the best at working ships and getting them back to sea quickly.
This dataset, based on information provided by most of the major container lines, is the first to compare ports and terminals globally based on a measurement other than volume. The database isn’t complete in the sense that not all carriers are participating — there are hundreds of small carriers from which we don’t
1
WHITEPAPER, JULY 2014
BERTH PRODUCTIVITY: The Trends, Outlook and Market Forces Impacting Ship Turnaround Times
+1.800.952.3839 | www.joc.com | www.piers.com
© Copyright JOC Group Inc. 20142
receive data — but carriers representing more than 75 percent of global capacity, according to Alphaliner rankings, have provided details of their ship calls to populate the database.
And the database is growing. The number of port calls reflected in the database increased to almost 150,000 in 2013 from 87,000 in 2012, reflecting some additional, larger carriers joining the project.
Although we’ll introduce additional data elements later, the measurement we’re starting with — gross berth productivity between a ship’s arrival and departure from berth, with no adjustments for labor or equipment down time regardless of the reason — is among the broadest definitions of productivity. It’s a metric that reflects carrier priorities specifically around getting ships in and out of port quickly.Terminals look at many other metrics, but we haven’t collected them, indeed no one has, essentially because terminals have historically been reluctant to share operating data for benchmarking purposes, and have done so only in limited scenarios such as one-time academic studies.
Carriers, however, are motivated to have productivity quantified, increasingly so as ships get larger. Going to them instead of the terminals provided the opening needed to develop this new dataset. The rankings published in this week’s JOC have other limitations, suggesting that productivity performance is entirely the responsibility of the terminal to improve, considering it’s the vendor and the carrier is the customer.
As any carrier will tell you, improving productivity is a shared goal between the carrier and the terminal. Carriers that experience poor productivity look inward to improve their own operations in addition to seeking improvements from the terminal.
Higher productivity is something the entire industry should be striving for. It doesn’t just mean faster turnaround times for ships. It also means cargo moving quicker through ports, which benefits shippers’ supply chains and improves the overall flow of trade.
This whitepaper is based on JOC Group Inc. Port Productivity Data.
For more information on purchasing the underlying data or to learn more about our new Port Productivity Subscription Report which provides in-depth industry market analysis, visit www.joc.com/port_productivity
WHITEPAPER, JULY 2014
BERTH PRODUCTIVITY: The Trends, Outlook and Market Forces Impacting Ship Turnaround Times
+1.800.952.3839 | www.joc.com | www.piers.com
© Copyright JOC Group Inc. 20143
“I’m not seeing anything the terminals are doing that is new or exciting.”
Berth Productivity
THE TRENDS, OUTLOOK AND MARKET FORCES IMPACTING SHIP TURNAROUND TIMES
Port Productivity Data from JOC Group Inc. for 2013 demonstrate that terminal operators around the world are taking quite seriously the challenge they face to service vessels in port as quickly and efficiently as possible in this era of mega-ships.
Productivity at many ports and terminals increased in 2013. In fact, some terminals that were unranked in 2012 made the Top 10 last year. Large vessels capable of carrying 8,000 to 18,000 20-foot container units now are operating in all of the major trade lanes. Terminal operators must work these costly vessels quickly and efficiently or risk losing business.
2013 Port Productivity Data from JOC Group Inc. gives the container shipping industry the first year-over-year comparison of container moves per-vessel, per-hour for the world’s top ports and marine terminals. Because carriers provide the information based on the thousands of port calls their vessels made in Asia, Europe, the Middle East and the Americas, the data is considered accurate and unbiased.
Experts in marine terminal operations say improvements in port productivity this past year derive primarily from terminal operating fundamentals such as paying greater attention to operational details, and devoting more assets to work the mega-ships. “I’m not seeing anything the terminals are doing that is new or exciting,” said Tom Ward, senior maritime planner at New York-based global infrastructure consultant Parsons Brinkerhoff. For example, the crane duty cycle, or average container moves per crane per hour, generally hasn’t improved, he said.
WHITEPAPER, JULY 2014
BERTH PRODUCTIVITY: The Trends, Outlook and Market Forces Impacting Ship Turnaround Times
+1.800.952.3839 | www.joc.com | www.piers.com
© Copyright JOC Group Inc. 20144
Vessel productivity at U.S. and European ports continues to lag productivity at ports in Asia.
Mark Sisson, leader of the marine analysis group at Oakland, Calif.-based engineering firm AECOM, said there have been no significant advances in crane technology or terminal operating systems. “There were no game changers,” he said.
Rather, terminal operators are getting the big ships in and out more quickly by employing more cranes over more shifts, said Ed DeNike, chief operating officer at Seattle-based terminal operator SSA Marine. If individual crane lifts per hour remain about the same, “the only thing you can do is add more cranes,” he said.
In Los Angeles-Long Beach, for example, terminals used to deploy four cranes per ship when the vessels were smaller. With 8,000-TEU ships now the norm, terminals regularly are deploying six cranes per vessel. As vessel sizes increase to 14,000 TEUs, the use of seven or eight cranes can be expected.
Large vessels calling at Los Angeles-Long Beach regularly discharge and load 5,000 containers per call, with the biggest ships generating almost 10,000 moves per vessel call. Working vessels one eight-hour shift per day would require that ship to stay in port for five days, so terminals now work two eight-hour shifts each day in order to turn the vessels in 2½ days.
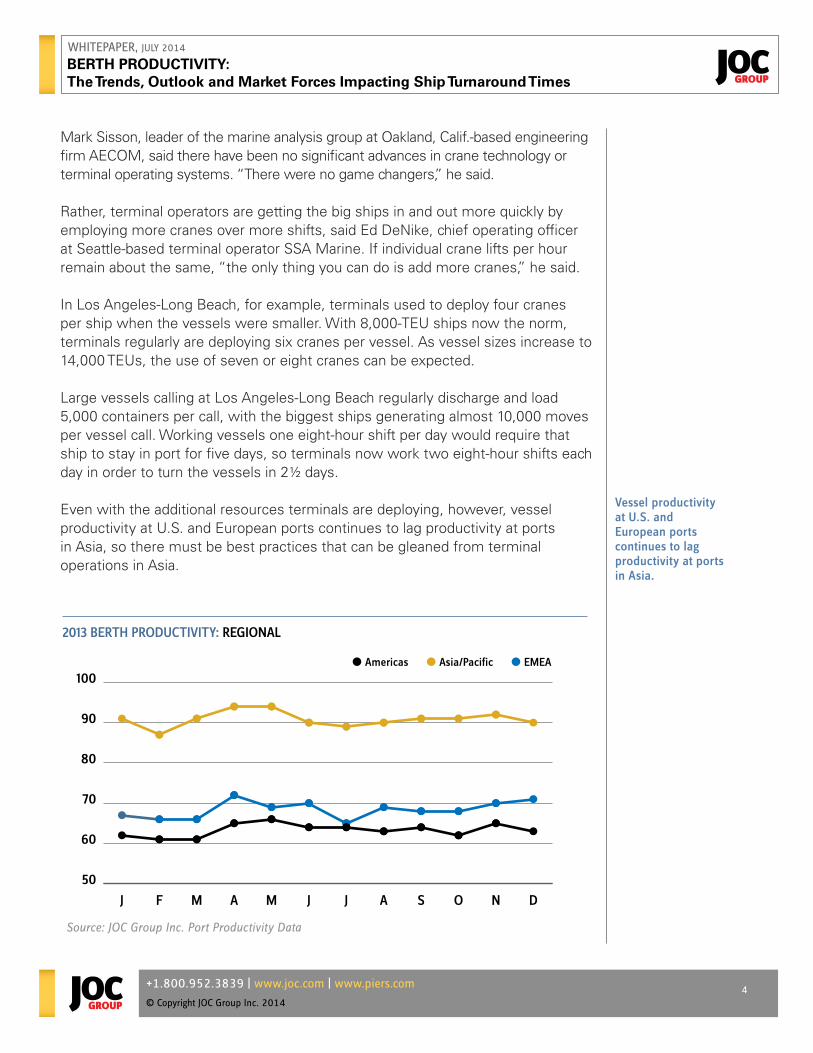
Even with the additional resources terminals are deploying, however, vessel productivity at U.S. and European ports continues to lag productivity at ports in Asia, so there must be best practices that can be gleaned from terminal operations in Asia.
2013 BERTH PRODUCTIVITY: REGIONAL
Source: JOC Group Inc. Port Productivity Data
50
60
70
80
90
100
DNOSAJJMAMFJ
● Americas ● Asia/Pacific ● EMEA
WHITEPAPER, JULY 2014
BERTH PRODUCTIVITY: The Trends, Outlook and Market Forces Impacting Ship Turnaround Times
+1.800.952.3839 | www.joc.com | www.piers.com
© Copyright JOC Group Inc. 20145
A number of factors affect productivity numbers from port to port and country to country.
APM Terminals in Yokohama, for example, averaged an amazing 163 vessel moves per hour, the best performance in the world. By comparison, APM Terminals Port Elizabeth in New Jersey averaged 104 vessel lifts per hour to lead all other U.S. terminals. APM Terminals Rotterdam averaged 99 moves per vessel per hour to rank fourth in the Europe-Middle East region.
Jeff De Best, chief operating officer at APM Terminals in The Hague, said a number of factors affect productivity numbers from port to port and country to country, including the average size of the vessels deployed, whether the port is a gateway port or a transshipment port and the allocation of assets and labor, given the cost of each.
APM Yokohama stands out as the best of the best because that terminal has developed a synchronization between the vessel and the container yard that eliminates virtually all wasted time between the quay crane operations and yard equipment operations. The terminal also is able to maintain its precision day after day.
APM developed a continuous-improvement program that draws from its Yokohama experience, and since last year has been implementing those practices at its terminals worldwide, De Best said.
The collaboration effort extends beyond the terminal itself to include vessel operators. The shipping line, in advance of the vessel arrival, sends a detailed cargo-stowage plan that APM uses to pre-plan how it will work the vessel. By the time the ship docks, the equipment and manpower are in place to work the vessel without interruptions.
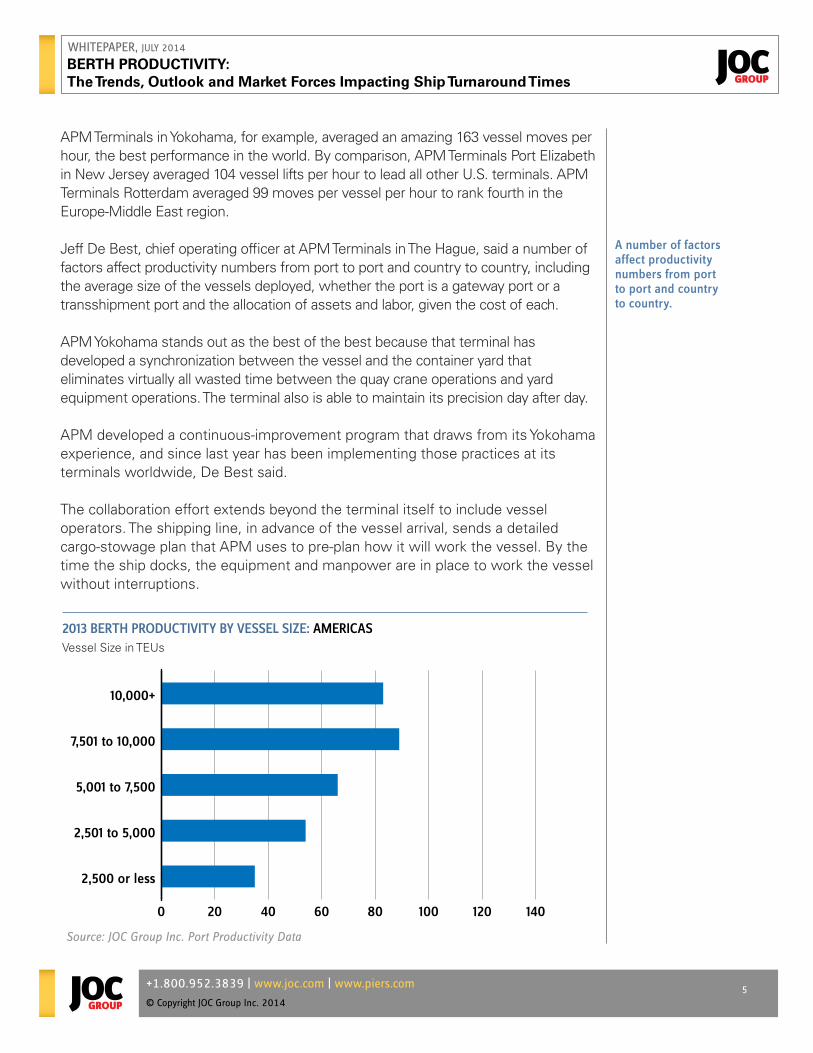
2013 BERTH PRODUCTIVITY BY VESSEL SIZE: AMERICASVessel Size in TEUs
Source: JOC Group Inc. Port Productivity Data
0 20 40 60 80 100 120 140
2,500 or less
2,501 to 5,000
5,001 to 7,500
7,501 to 10,000
10,000+
WHITEPAPER, JULY 2014
BERTH PRODUCTIVITY: The Trends, Outlook and Market Forces Impacting Ship Turnaround Times
+1.800.952.3839 | www.joc.com | www.piers.com
© Copyright JOC Group Inc. 20146
The pre-filing of cargo-stowage plans is having a positive effect on port operations, especially at gateways where ships call first on the inbound leg, DeNike said. Coordination between SSA and carrier stowage offices, for example, results in the vessels being loaded in such a way that when they reach Los Angeles-Long Beach, the inbound containers can be discharged from the vessels in the most efficient sequence, he said.
But, although vessel-at-berth productivity is an important indicator of terminal efficiency, it’s hardly the only criterion in this era of big ships. Terminal operators must devote sufficient cargo-handling equipment to each vessel call so yard congestion doesn’t become a chokepoint.
Maintaining fluid gate operations also is crucial because of the crush of truck traffic generated by big ships. Beneficial cargo owners shipping through New York-New Jersey, Virginia and Long Beach in the U.S. and Vancouver, British Columbia, all have experienced delays in getting their goods out of terminal gates this year, whether it be related to harsh winter weather, driver and equipment shortages, or labor disruption. In some cases, it’s now taking several more days for cargo to clear the gates than in the past, roiling shipper supply chains.
West Coast ports have been dealing with 8,000-TEU ships for five years, and have suffered through the growing pains associated with mega-ships. It’s now the East Coast’s turn to respond to the need for deeper harbors and the rebuilding of vessel berths to accommodate super-post-Panamax cranes, as well as the stress that cargo surges place on yard and gate operations.
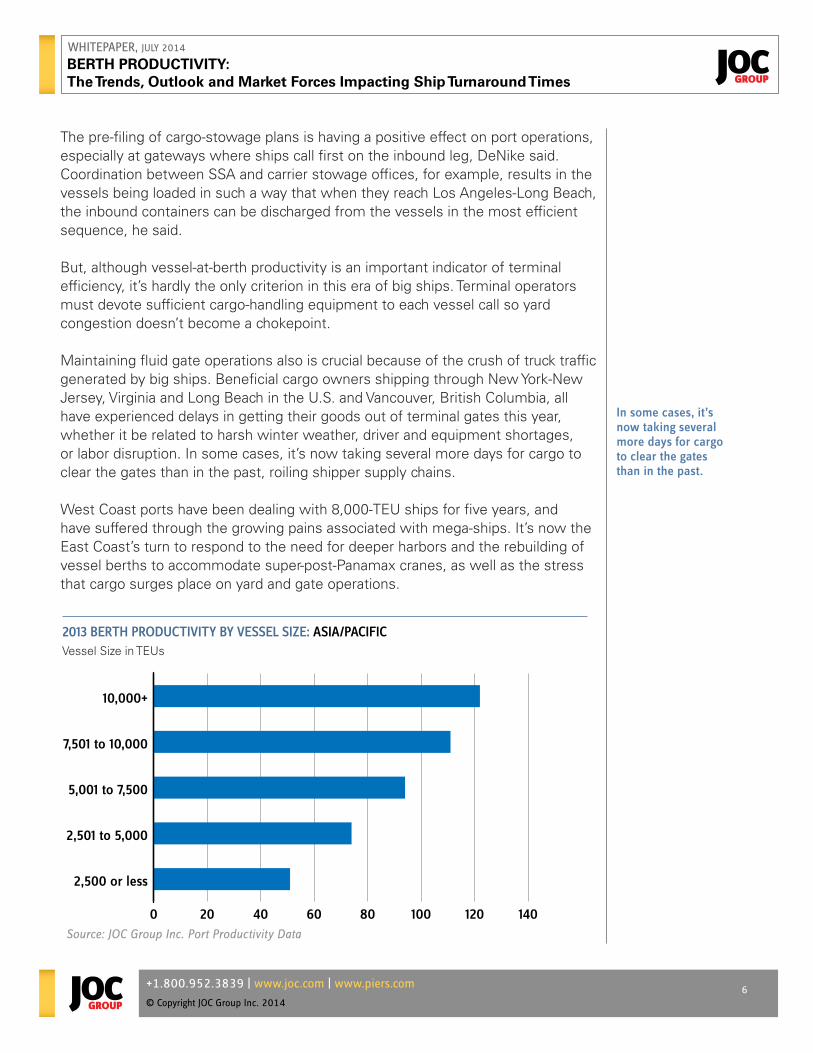
2013 BERTH PRODUCTIVITY BY VESSEL SIZE: ASIA/PACIFIC Vessel Size in TEUs
In some cases, it’s now taking several more days for cargo to clear the gates than in the past.
Source: JOC Group Inc. Port Productivity Data
0 20 40 60 80 100 120 140
2,500 or less
2,501 to 5,000
5,001 to 7,500
7,501 to 10,000
10,000+
WHITEPAPER, JULY 2014
BERTH PRODUCTIVITY: The Trends, Outlook and Market Forces Impacting Ship Turnaround Times
+1.800.952.3839 | www.joc.com | www.piers.com
© Copyright JOC Group Inc. 20147
“The weak link is landside.”
The Drewry Insight newsletter produced by London-based research firm Drewry in early June noted that bigger container ships operated by bigger carrier alliances are producing much greater peaks in container terminal activity. “This peaking demands larger, more capable terminals than ever before,” it said.
This sends a message to East Coast ports that are now being served by 8,000- to 9,000-TEU vessels that transit the Suez Canal on all-water services from Asia. Big ships require taller cranes with longer reaches, and the vessels create a surge in cargo volume in a short window of time that stresses the yard, gate and inland infrastructure.
In the South Atlantic, ports such as Savannah and Charleston must invest heavily in berth and crane infrastructure, as well as a robust network of road and rail connectors and inland port facilities to handle these cargo surges, said Jim Newsome, president and CEO of the South Carolina Ports Authority.
Terminals such as Garden City in Savannah and Wando in Charleston have sufficient capacity to handle growing container volumes, but the pressure is now on the gates and infrastructure connectors so the surges don’t overwhelm those facilities, he said.
Ward said all major U.S. gateways face this challenge from the big ships and big alliances. “The surge of inventory and its impact on landside will be the story,” he said. “The weak link is landside.”
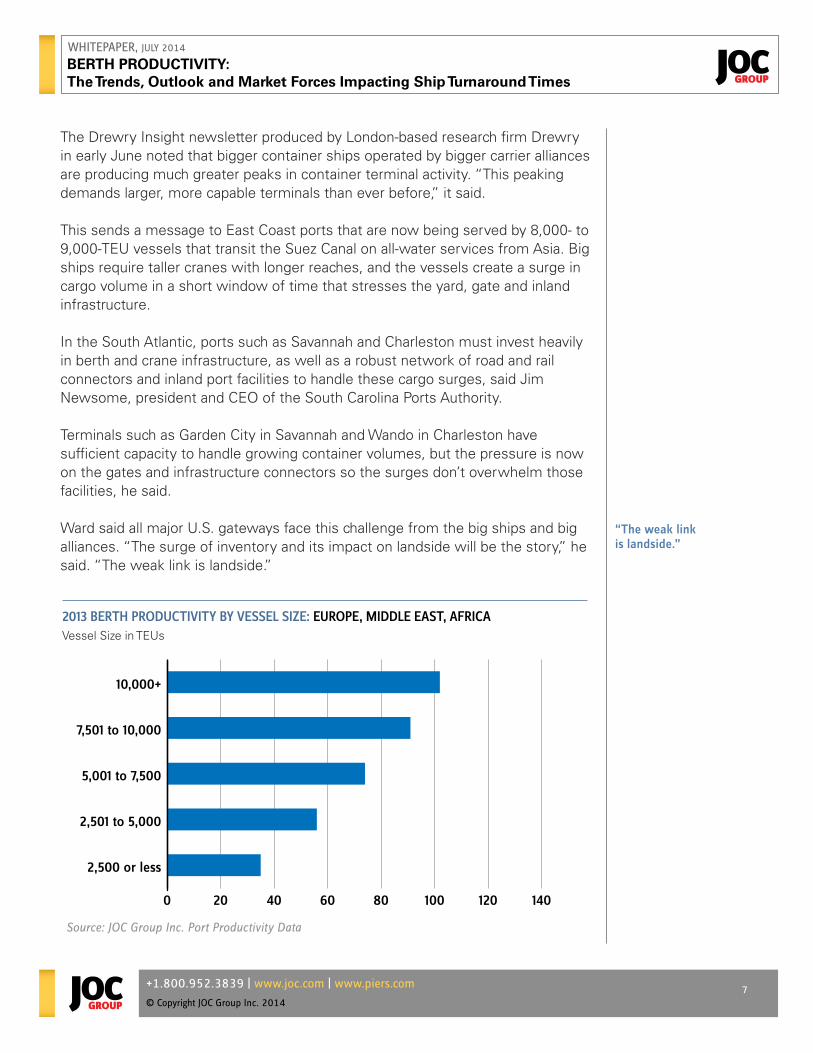
2013 BERTH PRODUCTIVITY BY VESSEL SIZE: EUROPE, MIDDLE EAST, AFRICA Vessel Size in TEUs
Source: JOC Group Inc. Port Productivity Data
0 20 40 60 80 100 120 140
2,500 or less
2,501 to 5,000
5,001 to 7,500
7,501 to 10,000
10,000+
WHITEPAPER, JULY 2014
BERTH PRODUCTIVITY: The Trends, Outlook and Market Forces Impacting Ship Turnaround Times
+1.800.952.3839 | www.joc.com | www.piers.com
© Copyright JOC Group Inc. 20148
The South Atlantic ports have been able to ward off gate congestion and intermodal rail backups, but they must be flexible as the cargo surges become greater, Newsome said. Charleston, for example, is looking at extending its gate hours to increase terminal capacity with a minimal upfront investment. Charleston also is continuing to develop the Greer inland port in South Carolina, which opened last November.
The bottom line for all U.S. ports, whether it be for the purchase of super-post-Panamax cranes, rebuilding of berth understructure or expansion of gates and inland transportation connectors is that they must be prepared to spend money — lots of it. “Our rates have to go up if we are to achieve an acceptable public sector cost of capital,” Newsome said.
Port charges in the South Atlantic are 60 percent of what ports in the North Atlantic charge, even though the South Atlantic ports consistently maintain lift rates of 40 containers per-crane, per-hour, he said.
Ports that seek additional capital can investigate opportunities offered by pension funds that are comfortable with a longer-cycle return on investment than are some of the other investment options in the market, Newsome said.
As vessel sizes and container volumes increase, and ports make the investments necessary to accommodate bigger ships, increases in vessel productivity should follow, De Best said. Bigger ships should produce higher productivity. Once the large cranes are positioned over the large vessels, cranes can lift much greater volumes of containers without having to be moved until the ship leaves port.
For this scenario to play out, however, terminal operators must work closely with vessel operators to pre-file cargo-stowage plans for their ships. Terminals must have sufficient yard equipment available and located strategically. The terminals also must work closely with cargo interests, customs brokers, trucking companies and railroads so the gate and inland transportation networks remain fluid.
If these supply chain components are functioning seamlessly, De Best said, the terminal operators can then “let the systems do what they were designed to do.”
“Our rates have to go up if we are to achieve an acceptable public sector cost of capital.”
“Let the systems do what they were designed to do.”
WHITEPAPER, JULY 2014
BERTH PRODUCTIVITY: The Trends, Outlook and Market Forces Impacting Ship Turnaround Times
+1.800.952.3839 | www.joc.com | www.piers.com
© Copyright JOC Group Inc. 20149
“Productivity will not increase, and even maintaining the level is a challenge.”
Asia’s Troubled Outlook
WHY A STEADY DOSE OF MEGA-SHIPS LIMITS THE POTENTIAL FOR BERTH PRODUCTIVITY GAINS
Berth productivity per ship call at Asia’s efficient container terminals consistently outranks their U.S. and European counterparts, but a looming challenge is how to avoid lost time at berths as ships take up more space and remain in port longer.
Before mega-ships capable of carrying 8,000 to 18,000 20-foot-equivalent units began to inundate Asian ports, many berths could accommodate three ships of 330 yards each. Today, two 9,500-TEU vessels take up 800 yards of space, reducing the number of ships able to call and potentially leading to congestion.
“Productivity will not increase, and even maintaining the level is a challenge. Longer vessels of 440 yards (such as Maersk Line’s Triple E class) will lead to more berth wastage,” said Subhangshu Dutt, executive director, Krishnapatnam port in Southeast India.
Hong Kong’s Kwai Chung container terminals are feeling an especially dramatic impact. Although 60 percent of Kwai Chung’s berths can handle 13,000-TEU vessels and larger, those bigger ships are pressuring operations. Kwai Chung opened in 1972, and shorter berth lengths mean only 15 of the 24 berths can accommodate ships carrying more than 12,000 TEUs.
Jessie Chung, chairman of the Hong Kong Container Terminal Operators Association, said this could be addressed by investing in upgraded infrastructure and equipment to enable more berths to handle the vessels.
Bob Greulich, a Hong Kong-based consultant for the Port of Charleston, questions whether serving the larger vessels justified losing the berth space. “Instead of being able to handle three smaller vessels, a port will only be able to take two, and just because a ship is bigger does not mean there will be more cargo to load or offload,” he said. “Productivity at the terminal may be great when a ship is alongside, but if it can’t get to the berth because there is no space, that is a problem for shipping lines. There is only a finite amount of quayside, and bigger ships take up more of it, which can hurt productivity.”
JOC Port Productivity data reveals that Asian container terminals are far more productive than their counterparts in the U.S. and Europe, which industry observers attribute to ports and gates being open 24 hours a day, the high level of automation and large transshipment volumes in the region. This drives up
WHITEPAPER, JULY 2014
BERTH PRODUCTIVITY: The Trends, Outlook and Market Forces Impacting Ship Turnaround Times
+1.800.952.3839 | www.joc.com | www.piers.com
© Copyright JOC Group Inc. 201410
productivity per vessel call and ensures eight of the world’s 10 most productive ports can be found in Asia.
To handle 18,000-TEU vessels efficiently, high port productivity and reliability are essential to enable carriers to operate within their schedules, said Glen Hilton, CEO of the Port of Tanjung Pelepas, Malaysia.
Asia’s ports had little choice but to invest in infrastructure as they prepared for progressively increasing vessel sizes and to compete for a place on port rotations of ship alliances. But it’s not all about pouring concrete and shoring up sea walls. Having the right container-handling equipment is also critical.
Maersk Line’s Triple Es require cranes that can reach across 23 containers. The 15,500-TEU Emma Maersk has 22 rows of boxes, and CMA CGM’s 16,000-TEU Marco Polo has 21 rows. “Space at the terminal is getting tighter and more expensive, and volume from the vessel is getting higher,” said Tuomas Saastamoinen, sales and marketing director for port cranes at Konecranes.
“Konecranes trims the dimensions of the equipment as tightly as possible,” he said. “We also need to ensure that the height of the equipment, mainly with the quay cranes, doesn’t jeopardize the productivity.”
But whereas there is room for improvement in berth productivity in the U.S. and Europe, Asia appears to be at its limit. “It appears that productivity levels have plateaued, and unless there is a totally new innovative concept with regard to yard design, management and flows, there may not be any significant improvement,” Dutt said.
Chung foresees more rationalization of shipping routes and increasing alliances among shipping lines, with mega-vessels calling only at certain ports. “We believe not all the ports will be able to keep up with the rapidly changing requirements,” she said.
And Charles de Trenck, senior project analyst at Hong Kong-based infrastructure development firm HKND Group, believes Asia productivity will flat-line “as a result of the ubiquitous slowing China trade impact.”
Whatever happens with container trade in Asia, the trend toward bigger ships is here to stay, and ports must work out the most efficient ways to handle them. With high operating costs and consistently weak freight rates, ocean carriers are vigorously pursuing cost savings, and the search for lower unit costs is pushing out the container line orderbook.
More than 53 percent of the 3.8 million-TEU vessel capacity on order is for 10,000-TEU ships or larger, keeping the pressure on ports to lift productivity and vessel turnaround times.
“It appears that productivity levels have plateaued.”
Asia’s ports had little choice but to invest in infrastructure.
WHITEPAPER, JULY 2014
BERTH PRODUCTIVITY: The Trends, Outlook and Market Forces Impacting Ship Turnaround Times
+1.800.952.3839 | www.joc.com | www.piers.com
© Copyright JOC Group Inc. 201411
Racing the Clock in Europe
BIG PROJECTS PAVE THE WAY FOR THE WORLD’S BIGGEST SHIPS
Europe’s top container ports are grappling with an unprecedented coincidence of challenges that threatens to snap vulnerable sections of the continent’s overstretched supply chain.
Just as terminals across the dominant Le Havre-Hamburg port range were nailing down strategies to cope with a surge in surplus capacity following the opening of two massive facilities in Rotterdam this year, a slew of fresh challenges arose.
Topping the list is the rapidly increasing number of mega-ships and the success of Mediterranean ports in siphoning off transshipment traffic in the key Asia-Europe trades from northern Europe. Denmark’s Port of Rotterdam and Germany’s Bremerhaven and Wilhelmshaven were pushed to the front line after Maersk Line said it plans to sail its Triple E vessels, the largest afloat at 18,000 TEUs, at full capacity by the end of the year. The world’s largest vessels currently are limited to carrying 16,000 20-foot-equivalent units to the three European ports on Maersk’s Asia service because only two ports on the other end of the trade — Yantian, China, and Tanjung Pelepas, Malaysia — can handle them fully loaded.
This is all occurring at a time of snail’s pace growth in volume across most of the major northern container ports as Europe crawls out of its deepest and longest recession in 70 years. For now, all eyes are on Rotterdam, the fourth-ranked Europe-Middle East-African port for overall berth productivity last year with 86 container moves per-vessel, per-hour. Europe’s largest container port, Rotterdam is preparing to add 5.1 million TEUs to annual capacity, with APM Terminals, the port arm of Maersk Group, due to open a 2.7 million-TEU facility on the Maasvlakte 2 container complex in November, followed shortly by the 2.4 million-TEU Rotterdam World Gateway. The latter is a joint venture among Dubai-based DP World and four carriers: MOL, Hyundai Merchant Marine, APL and CMA CGM.
The new terminals boast cutting-edge technology, including remote controlled ship-to-shore cranes and automated guided vehicles to achieve the higher level of productivity needed to handle the big ships.
But the new terminals will be operating in an environment that would have been unthinkable when they were commissioned in the double-digit-growth era before the 2008 global financial crisis. Rotterdam’s container traffic contracted 2.1 percent in 2013 to 11.6 million TEUs and only managed a miserly 0.3 percent rebound in the first quarter of this year.
For now, all eyes are on Rotterdam.
WHITEPAPER, JULY 2014
BERTH PRODUCTIVITY: The Trends, Outlook and Market Forces Impacting Ship Turnaround Times
+1.800.952.3839 | www.joc.com | www.piers.com
© Copyright JOC Group Inc. 201412
“We are facing a period of slow growth, (and) some terminals will lose out as a result,” Maersk Group CEO Nils Andersen told Dutch financial daily Financiele Dagblad this month. “Naturally, it’s awful if you have made large investments and have enough capacity and then you are overtaken by other terminals. But that’s the reality. We overestimated the future growth in Europe.”
The growing fleet of mega-ships is intensifying pressure on Europe’s top ports, underscored by the 11,600 TEUs generated on a recent visit by a Cosco vessel at the Eurogate terminal in Hamburg. A more typical call involves upward of 5,000 TEUs, according to Drewry Maritime Research. “This peaking demands larger, more capable terminals than before, even if the annual throughput is no greater,” the London-based analyst said in a recent newsletter. (Eurogate’s Hamburg terminal ranked sixth in the Europe-Middle East-Africa region in 2013 berth productivity, with 93 container moves per-hour, per-vessel.)
The average size of ships in the Asia-North Europe trade in April had grown to just short of 11,000 TEUs over the past two years, while the number of weekly services declined from 30 to 22 and the number of port calls from 104 to 87.
Quayside productivity isn’t the only issue facing Europe’s ports. The Achilles’ heel is weak intermodal transport links, according to Drewry. Port rationalization by the P3 carriers and the introduction of larger vessels “means that much bigger chunks of Asian cargo will have to be discharged from every vessel, and then just as importantly, processed through each gateway to its hinterland before the next arrives, possibly a few days later,” Drewry says. European terminal operators “have yet to show their hinterland cargo can be delivered efficiently under the conditions envisaged.”
Although industry talk is dominated by the arrival of fully loaded Triple Es and the opening of the Maasvlakte 2 terminals, an equally important game-changer is about to emerge: A German federal court is set to rule in July on whether Hamburg can proceed with a long-stalled project to widen and deepen sections of the Elbe River, the port’s 50-mile link to the open sea.
Approval is critical for Hamburg to handle the larger, wider mega-ships flooding the Asia-Europe trade, its major market. The port — the seventh-most productive port in the EMEA region with 81 container moves per-hour, per-vessel — can accommodate vessels up to 16,000 TEUs, but they can’t sail fully loaded down the Elbe, and ships with a combined width of 90 meters can’t pass each along half of the river.
These restrictions haven’t stopped Europe’s second-largest container port from outpacing its closest rivals. It boosted first quarter traffic 8 percent to 2.4 million TEUs, lifting its northwest European market share by 1.4 percentage points to 26.8 percent.
“We are facing a period of slow growth, (and) some terminals will lose out as a result.”
The Achilles’ heel is weak intermodal transport links.

WHITEPAPER, JULY 2014
BERTH PRODUCTIVITY: The Trends, Outlook and Market Forces Impacting Ship Turnaround Times
+1.800.952.3839 | www.joc.com | www.piers.com
© Copyright JOC Group Inc. 201413
But warnings from some carriers that they might transfer calls to other ports because of limited accessibility underscores the importance of a positive ruling.
While Europe’s top ports focus on consolidating their market shares, they are constantly looking over their shoulders at cargo-hungry newcomers offering carriers attractive deals to fill their underutilized terminals. Wilhelmshaven’s 2.7 million-TEU-a-year Jade Weser terminal, which opened in September 2012, handled slightly more than 76,000 TEUs in 2013. DP World’s London Gateway, the U.K.’s 7-month-old container port, is operating at a fraction of its initial 1.5 million-TEU annual capacity as its nearby rival, Felixstowe, the U.K.’s top container hub, hangs on to its customers in a flat market.
Europe’s southern ports, meanwhile, are rapidly increasing their container volumes at a much faster pace than their northern peers, as their reputation for low productivity and labor strife gradually fades. Piraeus’s traffic soared almost 16 percent in 2013 to 3.2 million TEUs, as China’s Cosco Pacific bids to transform its terminals at Greece’s largest port into the Mediterranean’s biggest transshipment hub. Italy’s Gioia Tauro, whose future was in doubt after Maersk pulled out, was up 13.4 percent at just over 3 million TEUs, and Malta’s Marsaxlokk grew 8.3 percent to 2.8 million TEUs.
The Middle East market is growing rapidly, too, driven by surging Asian and African transshipment traffic, but most of the big gains are accruing to a few terminals, notably DP World’s flagship Jebel Ali complex in Dubai, which is soaring up the global port rankings.
Africa also is a key emerging growth market attracting significant investments in new terminals by global port companies seeking to take advantage of accelerating economic growth across the continent. Some ports are breaking big as transshipment hubs in the east-west trades, including Tangier, which poses a major threat to the Port of Algeciras, Spain. Eurogate, the operator of the Jade Weser terminal, saw traffic at its twin facilities in the Moroccan port leap nearly 85 percent in 2013 to top 1 million TEUs for the first time.
The main event of the year, however, is sure to be the opening of the Maasvlakte 2 terminals. But Maersk’s Andersen strikes a cautious note. “Rotterdam is doing very well. It has invested heavily,” he said. “But it’s very important that not only the seaside of the port is efficient, but also the land side. We therefore need big motorways, more rail capacity and expansion on the inland waterways to make the port successful.”
Europe’s southern ports are rapidly increasing their container volumes at a much faster pace than their northern peers.
WHITEPAPER, JULY 2014
BERTH PRODUCTIVITY: The Trends, Outlook and Market Forces Impacting Ship Turnaround Times
+1.800.952.3839 | www.joc.com | www.piers.com
© Copyright JOC Group Inc. 201414
Behind the Port Productivity NumbersMany of the world’s ports and terminals improved their berth productivity last year — some registered impressive gains — as they responded to the challenges of handling ever-larger container ships.
The second JOC Port Productivity project, which measures the number of container moves per-vessel, per-hour at the world’s ports and marine terminals in 2013, also shows that Asian terminals are far ahead of their counterparts in the U.S. and Europe. This is true even for global operators with terminals on all three continents.
The JOC Port Productivity project shows that those ports and terminals that handle mostly large container ships capable of carrying 8,000 20-foot-equivalent container units or more have higher vessel productivity than facilities where most of the ships calling are less than 8,000-TEU capacity.
As with the first JOC Port Productivity project a year ago that recorded vessel productivity for 2012, all of the data was provided by shipping lines from their vessel calls at hundreds of terminals and ports in Asia, Europe, the Middle East and the Americas.
The first impression from this year’s numbers is that strong performing terminals in 2012 got even better in 2013. The range of container moves per-vessel, per-hour in 2012 for the Top 10 global ports was 97 to 150. In 2013, the range for the Top 10 was 119 to 163.
North American terminals in the Americas also demonstrated significant improvement. In 2012, the range of productivity for the Top 10 terminals was 63 to 91 container moves per-vessel, per-hour. For 2013, the range was 79-104, with APM Terminals in Port Elizabeth, New Jersey, becoming the first terminal in the Americas to crack 100.
Mark Sisson, who leads the marine analysis group at Oakland, California-based engineering firm AECOM, warns that while these numbers show that terminal and ports are stepping up to handle big ships, no single development occurred in the container-handling industry over the past year to drive the improvement.
Basic measures such as adding more cranes and working more shifts helped to lift the numbers. Data collection, Sisson suspects, also has improved. Anytime a project is launched, there is a learning curve, and data collection should improve in the early years, he said.
Asian terminals are far ahead of their counterparts in the U.S. and Europe.
Basic measures such as adding more cranes and working more shifts helped to lift the numbers.
WHITEPAPER, JULY 2014
BERTH PRODUCTIVITY: The Trends, Outlook and Market Forces Impacting Ship Turnaround Times
+1.800.952.3839 | www.joc.com | www.piers.com
© Copyright JOC Group Inc. 201415
The top marine terminals showed noticeably better productivity numbers than seaports did. That’s because the top terminals handled the largest vessels, and generally the bigger the vessel the less wasted time there is in repositioning cranes. Any crane downtime while the clock is ticking — during the nonexistent third shift at U.S. ports, for example — reduces productivity.
Across an entire port, however, there is usually a mix of large and small container ships. Vessels operating in the east-west trades typically are larger than those in the north-south trades.
For example, APM Terminals’ Yokohama, Japan, and Tianjin Xingang Sinor Terminal in China were the two most productive terminals in the world in 2013, with berth productivity of 163. The Port of Yokohama, however, was the sixth-ranked port in the world, with 108 container moves per-vessel, per-hour, and the Port of Tianjin was first with a vessel productivity number of 130.
A mix of large and small vessels also can affect the rankings of ports that have high crane productivity. Savannah and Charleston, for example, report container lifts per-crane, per-hour of approximately 40. However, Savannah, with a berth productivity of 72, is ranked eighth in the Americas, and Charleston, with vessel productivity of 71, was ranked ninth.
Long Beach, where crane productivity is about 30 lifts per hour, ranked second in the Americas and first in the U.S. in vessel productivity with 88 container moves per-vessel, per-hour. The South Atlantic ports work their vessels, most of which are less than 8,000-TEU capacity, with two or three cranes, while Long Beach, where many vessels are 8,000 to 10,000-TEU capacity, often work each vessel with five or six cranes.
Although some individual terminals in Europe have high vessel productivity, the top U.S. ports rank right up there with the best European ports when vessel productivity across the entire port is measured.
Vessel productivity at Long Beach in 2013 was 88, Los Angeles was 87 and New York-New Jersey was 78. Bremerhaven was the top European port at 86, Rotterdam was 86 and Southampton and Hamburg were at 81.
Vessels operating inthe east-west tradestypically are largerthan those in thenorth-south trades.
WHITEPAPER, JULY 2014
BERTH PRODUCTIVITY: The Trends, Outlook and Market Forces Impacting Ship Turnaround Times
+1.800.952.3839 | www.joc.com | www.piers.com
© Copyright JOC Group Inc. 201416
About the JOC Port Productivity RankingsThe rankings included in this report are based on seven elements provided by ocean carriers representing more than 75 percent of global capacity. Those data points are: vessel name, terminal name, port city, port country, berth arrival, berth departure and number of moves (including lift-ons, lift-offs and re-stows).
Berth arrival and departure refer to “lines down” and “lines up” — that is, the actual arrival and departure of the ship at berth. The calculation of moves per hour between these two times is referred to as unadjusted gross berth productivity.
It’s the same calculation for all 483 ports and 771 terminals JOC Group Inc. evaluates, allowing for basic apples-to-apples comparison globally. The data enters a data warehouse in standardized format so that it’s accessible for reports, rankings, analysis and other uses.
Interaction with global carriers resulted in data whose definitions are consistent across all carriers. Rankings were determined by analyzing more than 150,000 port calls in 2013.
Productivity is defined as the average of the gross moves per hour for each call recorded last year. Gross moves per hour for a single vessel call is defined as the total container moves (onload, offload and repositioning) divided by the number of hours for which the vessel is at berth.
This whitepaper is based on JOC Group Inc. Port Productivity Data.
For more information on purchasing the underlying data or to learn more about our new Port Productivity Subscription Report which provides in-depth industry market analysis, visit www.joc.com/port_productivity

WHITEPAPER, JULY 2014
BERTH PRODUCTIVITY: The Trends, Outlook and Market Forces Impacting Ship Turnaround Times
+1.800.952.3839 | www.joc.com | www.piers.com
© Copyright JOC Group Inc. 201417
Top global ports, based on average 2013 container moves per-ship, per-hour on all vessel sizes.
TOP PORTS: WORLDWIDE PORT COUNTRY 2013 BERTH PRODUCTIVITY 2012 BERTH PRODUCTIVITY
Tianjin China 130 89
Qingdao China 126 98
Ningbo China 120 89
Jebel Ali United Arab Emirates 119 79
Khor al Fakkan United Arab Emirates 119 79
Yokohama Japan 108 82
Yantian China 106 79
Xiamen China 106 80
Busan South Korea 105 84
Nansha China 104 73
Shanghai China 104 71
Dalian China 104 85
Mawan China 95 72
Taipei Taiwan 93 NA
Salalah Oman 91 70
Kaohsiung Taiwan 91 76
Balboa Panama 91 46
Nhava Sheva (Jawaharlal Nehru) India 91 78
Chiwan China 88 NA
Long Beach U.S. 88 80
Ranking the Ports
Source: JOC Group Inc. Port Productivity Data
WHITEPAPER, JULY 2014
BERTH PRODUCTIVITY: The Trends, Outlook and Market Forces Impacting Ship Turnaround Times
+1.800.952.3839 | www.joc.com | www.piers.com
© Copyright JOC Group Inc. 201418
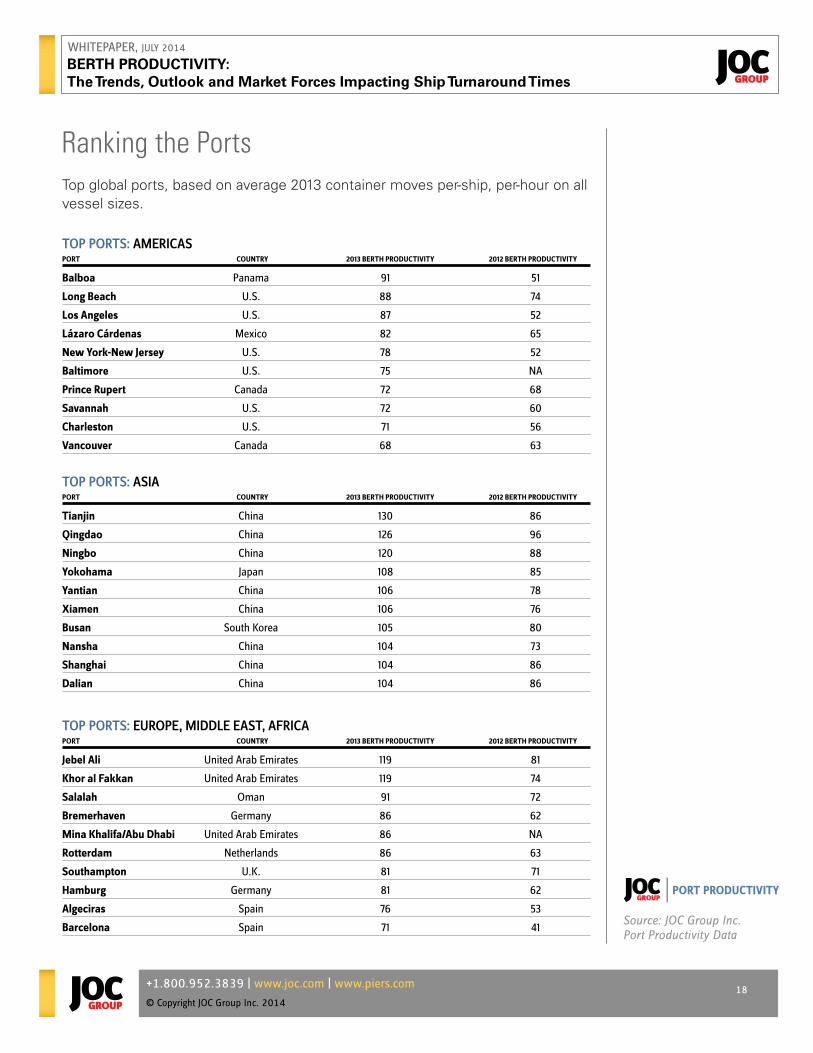
Top global ports, based on average 2013 container moves per-ship, per-hour on all vessel sizes.
TOP PORTS: AMERICAS PORT COUNTRY 2013 BERTH PRODUCTIVITY 2012 BERTH PRODUCTIVITY
Balboa Panama 91 51
Long Beach U.S. 88 74
Los Angeles U.S. 87 52
Lázaro Cárdenas Mexico 82 65
New York-New Jersey U.S. 78 52
Baltimore U.S. 75 NA
Prince Rupert Canada 72 68
Savannah U.S. 72 60
Charleston U.S. 71 56
Vancouver Canada 68 63
TOP PORTS: ASIA PORT COUNTRY 2013 BERTH PRODUCTIVITY 2012 BERTH PRODUCTIVITY
Tianjin China 130 86
Qingdao China 126 96
Ningbo China 120 88
Yokohama Japan 108 85
Yantian China 106 78
Xiamen China 106 76
Busan South Korea 105 80
Nansha China 104 73
Shanghai China 104 86
Dalian China 104 86
TOP PORTS: EUROPE, MIDDLE EAST, AFRICA PORT COUNTRY 2013 BERTH PRODUCTIVITY 2012 BERTH PRODUCTIVITY
Jebel Ali United Arab Emirates 119 81
Khor al Fakkan United Arab Emirates 119 74
Salalah Oman 91 72
Bremerhaven Germany 86 62
Mina Khalifa/Abu Dhabi United Arab Emirates 86 NA
Rotterdam Netherlands 86 63
Southampton U.K. 81 71
Hamburg Germany 81 62
Algeciras Spain 76 53
Barcelona Spain 71 41
Ranking the Ports
Source: JOC Group Inc. Port Productivity Data
WHITEPAPER, JULY 2014
BERTH PRODUCTIVITY: The Trends, Outlook and Market Forces Impacting Ship Turnaround Times
+1.800.952.3839 | www.joc.com | www.piers.com
© Copyright JOC Group Inc. 201419
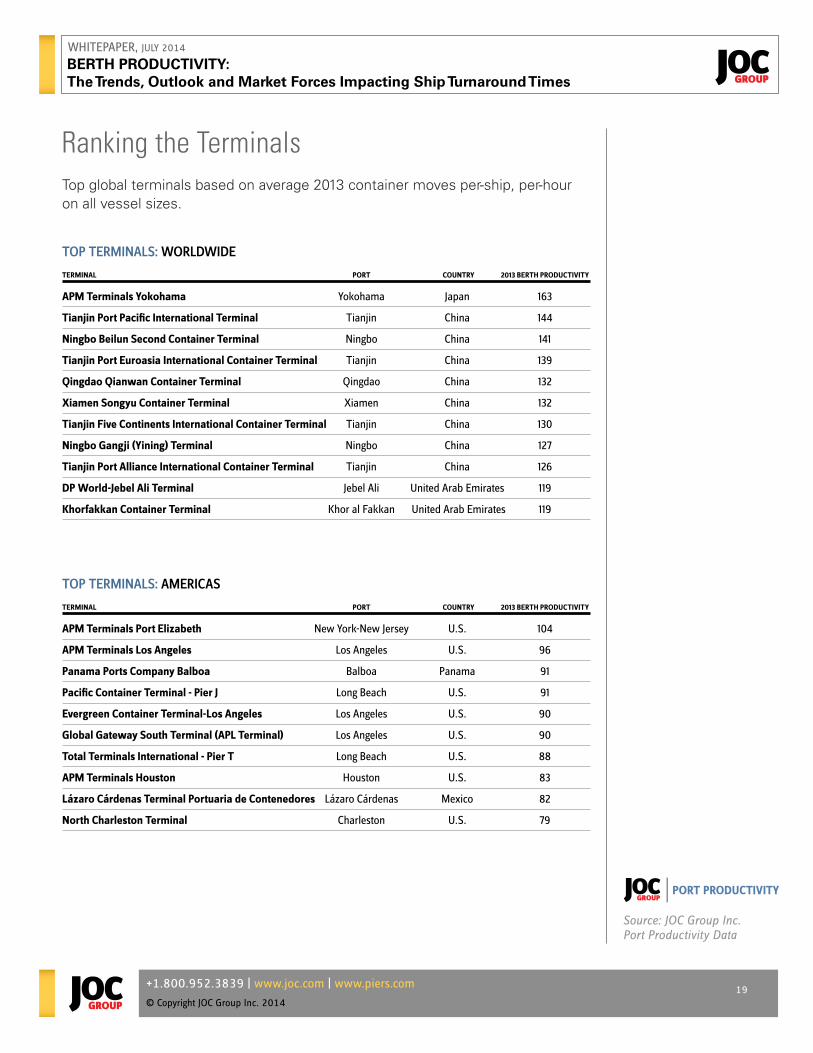
Top global terminals based on average 2013 container moves per-ship, per-hour on all vessel sizes.
TOP TERMINALS: WORLDWIDE TERMINAL PORT COUNTRY 2013 BERTH PRODUCTIVITY
APM Terminals Yokohama Yokohama Japan 163
Tianjin Port Pacific International Terminal Tianjin China 144
Ningbo Beilun Second Container Terminal Ningbo China 141
Tianjin Port Euroasia International Container Terminal Tianjin China 139
Qingdao Qianwan Container Terminal Qingdao China 132
Xiamen Songyu Container Terminal Xiamen China 132
Tianjin Five Continents International Container Terminal Tianjin China 130
Ningbo Gangji (Yining) Terminal Ningbo China 127
Tianjin Port Alliance International Container Terminal Tianjin China 126
DP World-Jebel Ali Terminal Jebel Ali United Arab Emirates 119
Khorfakkan Container Terminal Khor al Fakkan United Arab Emirates 119
TOP TERMINALS: AMERICAS TERMINAL PORT COUNTRY 2013 BERTH PRODUCTIVITY
APM Terminals Port Elizabeth New York-New Jersey U.S. 104
APM Terminals Los Angeles Los Angeles U.S. 96
Panama Ports Company Balboa Balboa Panama 91
Pacific Container Terminal - Pier J Long Beach U.S. 91
Evergreen Container Terminal-Los Angeles Los Angeles U.S. 90
Global Gateway South Terminal (APL Terminal) Los Angeles U.S. 90
Total Terminals International - Pier T Long Beach U.S. 88
APM Terminals Houston Houston U.S. 83
Lázaro Cárdenas Terminal Portuaria de Contenedores Lázaro Cárdenas Mexico 82
North Charleston Terminal Charleston U.S. 79
Ranking the Terminals
Source: JOC Group Inc. Port Productivity Data
WHITEPAPER, JULY 2014
BERTH PRODUCTIVITY: The Trends, Outlook and Market Forces Impacting Ship Turnaround Times
+1.800.952.3839 | www.joc.com | www.piers.com
© Copyright JOC Group Inc. 201420
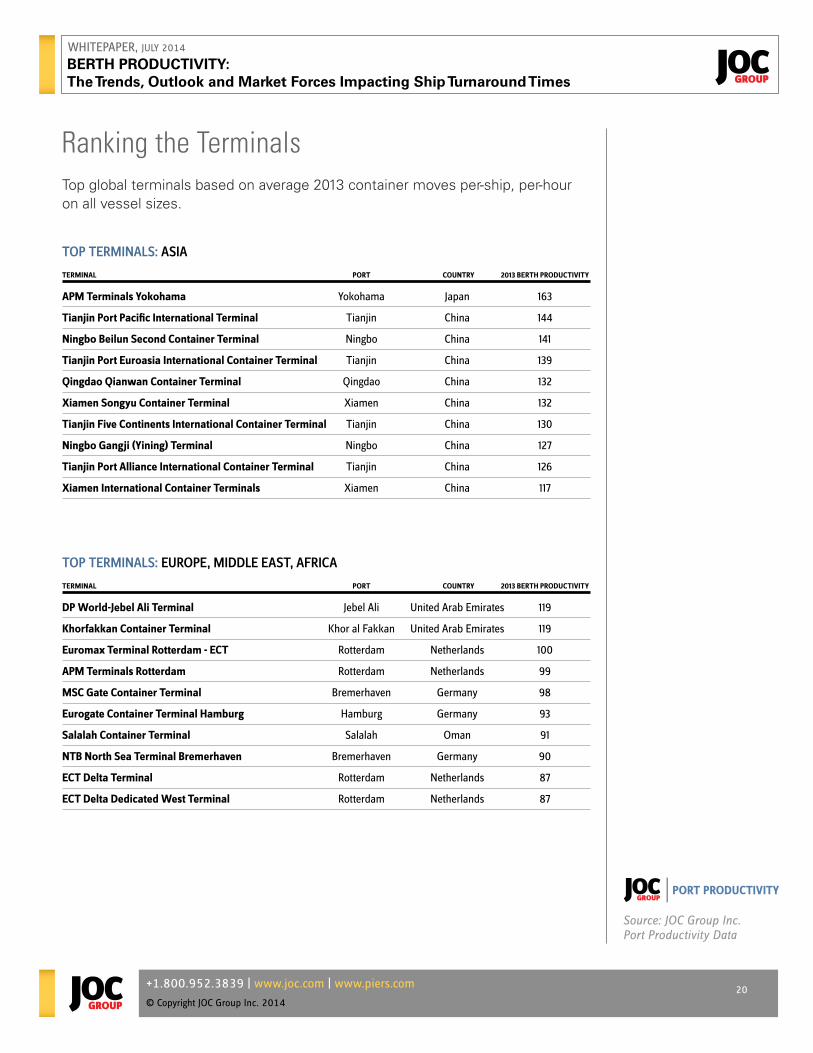
Top global terminals based on average 2013 container moves per-ship, per-hour on all vessel sizes.
TOP TERMINALS: ASIA TERMINAL PORT COUNTRY 2013 BERTH PRODUCTIVITY
APM Terminals Yokohama Yokohama Japan 163
Tianjin Port Pacific International Terminal Tianjin China 144
Ningbo Beilun Second Container Terminal Ningbo China 141
Tianjin Port Euroasia International Container Terminal Tianjin China 139
Qingdao Qianwan Container Terminal Qingdao China 132
Xiamen Songyu Container Terminal Xiamen China 132
Tianjin Five Continents International Container Terminal Tianjin China 130
Ningbo Gangji (Yining) Terminal Ningbo China 127
Tianjin Port Alliance International Container Terminal Tianjin China 126
Xiamen International Container Terminals Xiamen China 117
TOP TERMINALS: EUROPE, MIDDLE EAST, AFRICA TERMINAL PORT COUNTRY 2013 BERTH PRODUCTIVITY
DP World-Jebel Ali Terminal Jebel Ali United Arab Emirates 119
Khorfakkan Container Terminal Khor al Fakkan United Arab Emirates 119
Euromax Terminal Rotterdam - ECT Rotterdam Netherlands 100
APM Terminals Rotterdam Rotterdam Netherlands 99
MSC Gate Container Terminal Bremerhaven Germany 98
Eurogate Container Terminal Hamburg Hamburg Germany 93
Salalah Container Terminal Salalah Oman 91
NTB North Sea Terminal Bremerhaven Bremerhaven Germany 90
ECT Delta Terminal Rotterdam Netherlands 87
ECT Delta Dedicated West Terminal Rotterdam Netherlands 87
Ranking the Terminals
Source: JOC Group Inc. Port Productivity Data
WHITEPAPER, JULY 2014
BERTH PRODUCTIVITY: The Trends, Outlook and Market Forces Impacting Ship Turnaround Times
+1.800.952.3839 | www.joc.com | www.piers.com
© Copyright JOC Group Inc. 201421
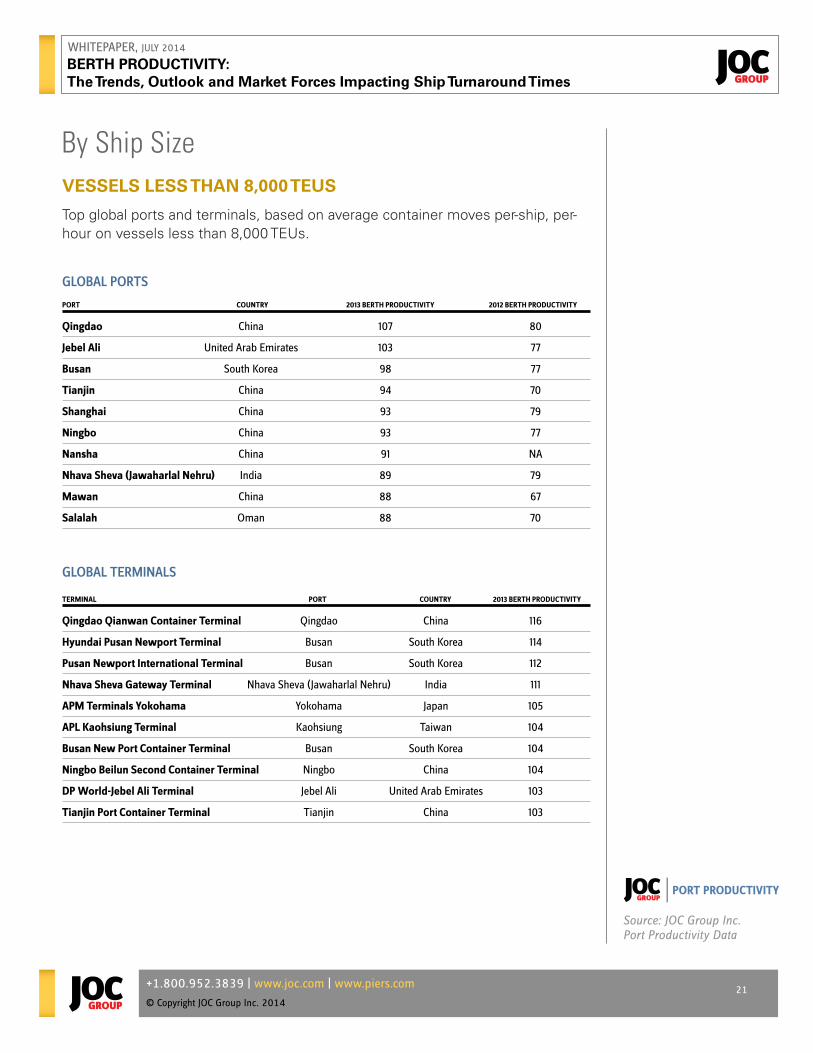
VESSELS LESS THAN 8,000 TEUS
Top global ports and terminals, based on average container moves per-ship, per-hour on vessels less than 8,000 TEUs.
GLOBAL PORTS PORT COUNTRY 2013 BERTH PRODUCTIVITY 2012 BERTH PRODUCTIVITY
Qingdao China 107 80
Jebel Ali United Arab Emirates 103 77
Busan South Korea 98 77
Tianjin China 94 70
Shanghai China 93 79
Ningbo China 93 77
Nansha China 91 NA
Nhava Sheva (Jawaharlal Nehru) India 89 79
Mawan China 88 67
Salalah Oman 88 70
GLOBAL TERMINALS TERMINAL PORT COUNTRY 2013 BERTH PRODUCTIVITY
Qingdao Qianwan Container Terminal Qingdao China 116
Hyundai Pusan Newport Terminal Busan South Korea 114
Pusan Newport International Terminal Busan South Korea 112
Nhava Sheva Gateway Terminal Nhava Sheva (Jawaharlal Nehru) India 111
APM Terminals Yokohama Yokohama Japan 105
APL Kaohsiung Terminal Kaohsiung Taiwan 104
Busan New Port Container Terminal Busan South Korea 104
Ningbo Beilun Second Container Terminal Ningbo China 104
DP World-Jebel Ali Terminal Jebel Ali United Arab Emirates 103
Tianjin Port Container Terminal Tianjin China 103
By Ship Size
Source: JOC Group Inc. Port Productivity Data
WHITEPAPER, JULY 2014
BERTH PRODUCTIVITY: The Trends, Outlook and Market Forces Impacting Ship Turnaround Times
+1.800.952.3839 | www.joc.com | www.piers.com
© Copyright JOC Group Inc. 201422
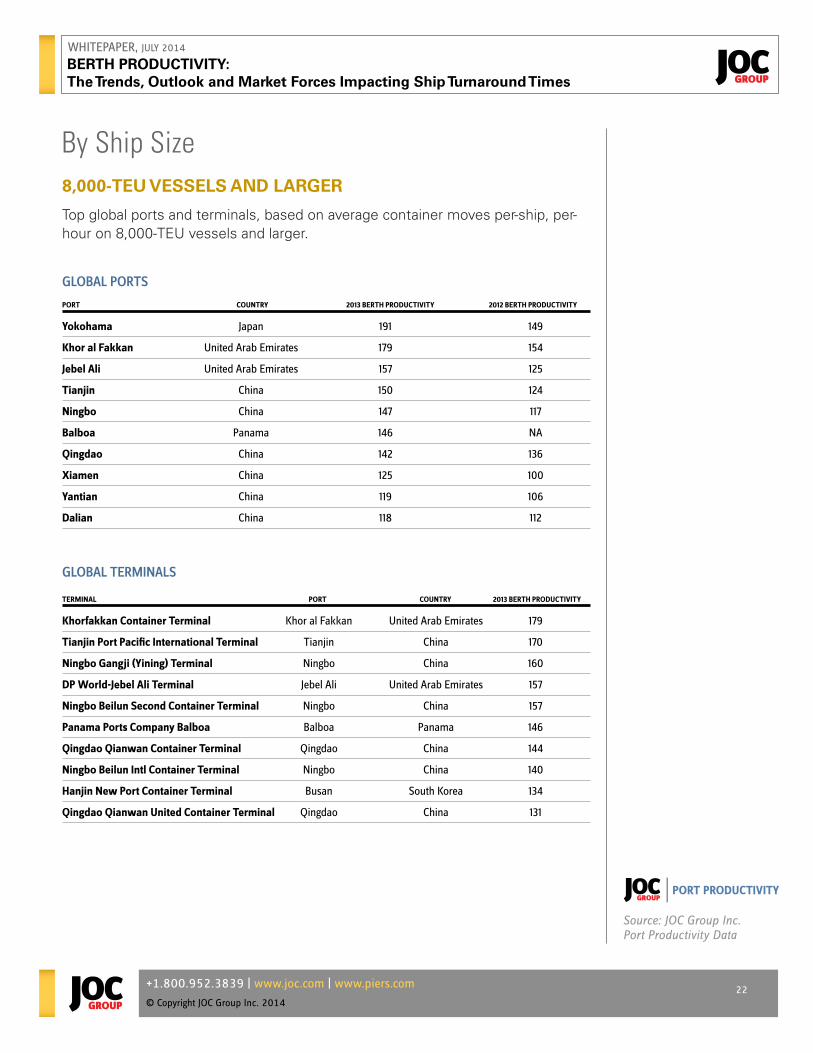
8,000-TEU VESSELS AND LARGER
Top global ports and terminals, based on average container moves per-ship, per-hour on 8,000-TEU vessels and larger.
GLOBAL PORTS PORT COUNTRY 2013 BERTH PRODUCTIVITY 2012 BERTH PRODUCTIVITY
Yokohama Japan 191 149
Khor al Fakkan United Arab Emirates 179 154
Jebel Ali United Arab Emirates 157 125
Tianjin China 150 124
Ningbo China 147 117
Balboa Panama 146 NA
Qingdao China 142 136
Xiamen China 125 100
Yantian China 119 106
Dalian China 118 112
GLOBAL TERMINALS TERMINAL PORT COUNTRY 2013 BERTH PRODUCTIVITY
Khorfakkan Container Terminal Khor al Fakkan United Arab Emirates 179
Tianjin Port Pacific International Terminal Tianjin China 170
Ningbo Gangji (Yining) Terminal Ningbo China 160
DP World-Jebel Ali Terminal Jebel Ali United Arab Emirates 157
Ningbo Beilun Second Container Terminal Ningbo China 157
Panama Ports Company Balboa Balboa Panama 146
Qingdao Qianwan Container Terminal Qingdao China 144
Ningbo Beilun Intl Container Terminal Ningbo China 140
Hanjin New Port Container Terminal Busan South Korea 134
Qingdao Qianwan United Container Terminal Qingdao China 131
By Ship Size
Source: JOC Group Inc. Port Productivity Data

WHITEPAPER, JULY 2014
BERTH PRODUCTIVITY: The Trends, Outlook and Market Forces Impacting Ship Turnaround Times
+1.800.952.3839 | www.joc.com | www.piers.com
© Copyright JOC Group Inc. 201423
Validation Methodology The net result of this Validation Methodology resulted in a data set of 150,000 cleansed and standardized call records for 483 ports and 771 terminals.
• Duplicate records were excluded
• Ports (port city) names validated against 2013 UN/LOCODE and standardized via proprietary methodology
• Vessel names and Ship Size Capacity by TEUs validated against Lloyd’s Registery
• Ports, Terminals, and Vessels that could not be validated via the aforementioned approach were excluded
• Call records of Vessels whose Lloyd’s Register listed capacity is less than 100 TEUs were excluded
• Call records whose berth time is less than 5 hours or more than 168 hours (7 days) were excluded
• Call records whose calculated Berth Productivity is greater than 300 moves per hour were excluded
In order to ensure an appropriate sample size of call records, a port or terminal must have at least 100 call records during the year 2013 to be considered in the rankings.
Rankings MethodologyIn order to ensure an appropriate sample size of call records, a port or terminal must have at least 100 call records during the year 2013 to be considered in the rankings.
226 ports with a combined 139,588 call records met the aforementioned sample size requirements to be considered in the following rankings:
• 2013 Top 20 Ports - Americas
• 2013 Top 20 Ports - Asia
• 2013 Top 20 Ports - Europe, Middle East, Africa
• 2013 Top 20 Global Ports
This whitepaper is based on JOC Group Inc. Port Productivity Data.
For more information on purchasing the underlying data or to learn more about our new Port Productivity Subscription Report which provides in-depth industry market analysis, visit www.joc.com/port_productivity
WHITEPAPER, JULY 2014
BERTH PRODUCTIVITY: The Trends, Outlook and Market Forces Impacting Ship Turnaround Times
+1.800.952.3839 | www.joc.com | www.piers.com
© Copyright JOC Group Inc. 201424
337 terminals with a combined 131,500 call records met the aforementioned sample size requirements to be considered in the following rankings:
• 2013 Top 20 Terminals - Americas
• 2013 Top 20 Terminals - Asia
• 2013 Top 20 Terminals - Europe, Middle East, Africa
• 2013 Top 20 Global Terminals
49 ports with a combined 21,156 call records met the aforementioned sample size requirements to be considered in the following ranking:
• 2013 Top 10 Global Ports for 8,000+ TEU Vessels
221 ports with a combined 115,586 call records met the aforementioned sample size requirements to be considered in the following ranking:
• 2013 Top 10 Global Ports for Sub-8,000 TEU Vessels
66 terminals with a combined 18,284 call records met the aforementioned sample size requirements to be considered in the following ranking:
• 2013 Top 10 Global Terminals for 8,000+ TEU Vessels
316 terminals with a combined 107,342 call records met the aforementioned sample size requirements to be considered in the following ranking:
• 2013 Top 10 Global Terminals for Sub-8,000 TEU Vessels
About the ReportThis whitepaper is based on JOC Group Inc Port Productivity Data. For more information on purchasing the underlying data or to learn more about our new Port Productivity Subscription Report which provides in-depth industry market analysis, visit www.joc.com/port_productivity
About JOC GROUP INC.JOC Group Inc. is the authoritative provider of business intelligence, data and events covering the global container shipping and logistics market. Through its PIERS and JOC products - online, print and events - JOC Group Inc. provides the access, intelligence, insight and support which enable our customers to establish and maintain critical customer connections and make informed decisions to compete effectively in the global marketplace. JOC.com is the leading information portal providing a mix of editorially created content and pertinent visualized data combining over 200 different data sets. JOC Group’s leading industry events include TPM (held annually in Long Beach, CA), TPM Asia and JOC Inland Distribution. Through PIERS, the world’s most comprehensive database of U.S. waterborne trade, international businesses from transportation, chemical, energy and finance sectors analyze unique intelligence to inform critical business decisions.
For more information visit joc.com/group


