Embed Size (px)
Citation preview
PESISIRSELATAN KERINCI
MERAN GIN
SARO LAN GUN BATANGHARI
MU AROJAMB ISUNGAI
PEN UH
OGANKOMERING
ULU
MU ARAENIM
LAHAT
MUSIRAWAS
MU SIBANYUASIN
BANYUASIN
OGANKOMERING
ULU SELATAN
EMPATLAWANG
KOTA P RABU MU LIH
KOTAPAGARALAM
KOTALUB UKLINGGA U
BENGKULUSELATAN
REJANGLEB ONG
BENGKULUUTARA
KAUR
SELUMA
MU KOMUKO
LEB ONG
KEPAHIANG
BENGKULUTEN GAH
BENGKULU
KOTALAMP UNG
BARAT
Belirang-Beriti
Besar
Bukit Daun
Dempo
Hutapanjang
Kaba
Kunyit
BukitLumut Balai
Patah
Pendan
Ranau
Sumbing
Bengkulu
Sarolangun
Bengkulu
KotaManna
ArgaMakmur
Curup
Bintuhan
Kepahiang
Muara Aman
Mukomuko
Tais
Lubuklinggau
PagarAlam
Lahat
Muara Enim
Sekayu
Muara Beliti Baru
Rupit
Baturaja
TebingTinggi
Muaradua
Talang Ubi
Liwa
Krui
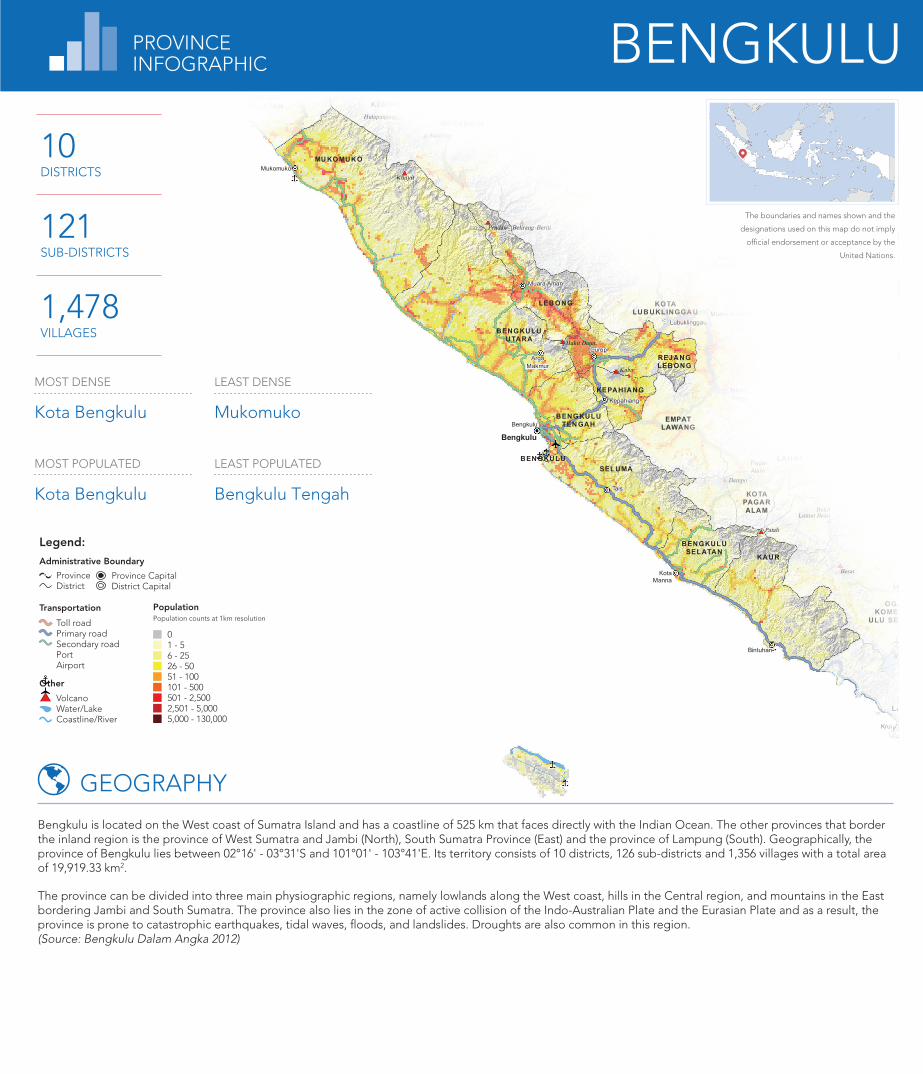
10DISTRICTS
121SUB-DISTRICTS
1,478VILLAGES
LEAST POPULATED
Bengkulu Tengah
MOST DENSE
Kota Bengkulu
MOST POPULATED
Kota Bengkulu
LEAST DENSE
Mukomuko
01 - 56 - 2526 - 5051 - 100101 - 500501 - 2,5002,501 - 5,0005,000 - 130,000
PopulationPopulation counts at 1km resolution
Transportation
Toll roadPrimary roadSecondary roadPortAirport
Province CapitalDistrict Capital
Other
VolcanoWater/LakeCoastline/River
Administrative Boundary
Legend:
ProvinceDistrict
Bengkulu is located on the West coast of Sumatra Island and has a coastline of 525 km that faces directly with the Indian Ocean. The other provinces that border the inland region is the province of West Sumatra and Jambi (North), South Sumatra Province (East) and the province of Lampung (South). Geographically, the province of Bengkulu lies between 02°16' - 03°31'S and 101°01' - 103°41'E. Its territory consists of 10 districts, 126 sub-districts and 1,356 villages with a total area of 19,919.33 km2.
The province can be divided into three main physiographic regions, namely lowlands along the West coast, hills in the Central region, and mountains in the East bordering Jambi and South Sumatra. The province also lies in the zone of active collision of the Indo-Australian Plate and the Eurasian Plate and as a result, the province is prone to catastrophic earthquakes, tidal waves, floods, and landslides. Droughts are also common in this region.(Source: Bengkulu Dalam Angka 2012)
GEOGRAPHY
The boundaries and names shown and the
designations used on this map do not imply
official endorsement or acceptance by the
United Nations.
PROVINCEINFOGRAPHIC BENGKULU

POPULATION
24
DISABLE
0-4
5-9
10-14
15-19
20-24
25-29
30-34
35-39
40-44
45-49
50-54
55-59
60-64
65-69
70-74
75+
0 20 40 60 80 100020406080100 (in thousand)
30.95%Urban Population
69.05%Rural Population
2015
1,874,944
2020
2,019,848
2025
2,150,505
POPULATION PROJECTION
Total Fertility Rate
Infant Mortality Rate (Male + Female)
Dependency Ratio (%)
EO (Male + Female)
47.90
2.34
68.70
30.60
44.90
2.14
69.70
26.90
46.20
2.24
69.40
28.20
TOTAL HOUSEHOLD
432,900
TOTAL POPULATION
1,715,518
MALE
877,15951.13% from Total Population
Sex Ratio
104.63
FEMALE
838,35948.87% from Total Population
From Total Population
0.26%Visual
0.16%Walking
0.16%Hearing
0.13%Memory impairment
0.04%Not able to taking care
of themselves
WATER & SANITATION
Private Public OthersShared
SANITATION TYPES65.14% 1.79%
1.99%
31.08%
53.30% 46.70%
22.63% 12.26%
9.11%
5.09%
2.55%
0.54%39.42%
4.26%
2.91%
1.12%
0.04%
0.07%
WATER SOURCES
Drilled well/pump
Refilled waterUnprotected well
River
Rain
Unprotected spring
Packaged water
Subscribed waterProtected spring
Protected well
Retailed water
Others
Clean Drinking Water Sources Not Clean Drinking Water Sources
Percentage of households based on the usage of water resources
HEALTHHEALTH FACILITIES
MEDICAL STAFF
388 73 1,4931,869
DENTIST MIDWIFEDOCTOR OTHERS
PUSKESMAS PUSTUHOSPITAL POSYANDU OTHERS
180 41616 2,005 520
NATURAL DISASTER (2008-2012)
2008 2009 2010 2011 2012
573331624
1LANDSLIDE
1WHIRLWIND
8DROUGHT
2EARTHQUAKE
4FLOOD & LANDSLIDE
15FLOOD
FOOD SECURITY IN 2009
Priority 1 DistrictsPriority 2 DistrictsPriority 3 Districts
Priority 4 DistrictsPriority 5 DistrictsPriority 6 DistrictsNo Data/Urban Area
The prevalence of food security is based on the WFP Food Security and Vulnerability Atlas. Vulnerability to food insecurity was determined based on nine indicators which are related to food availability, food access, food utilization and nutrition. The map was produced by combining the indicators into a composite food security index. Areas in red shades are less food secure compared to areas in green shades. The map highlights the prevalence of food insecurity at the district level and it should be noted that not all household living in dark red (priority 1) districts are food insecure, and conversely that not all household living in green (priority 6) districts are food secure.
VULNERABILITYTO FOOD INSECURITY
LIVELIHOOD
Highest contributor for GDP:
1. Agriculture, Veterinary, Forestry, and Fishery (48.53%)2. Mining (25.91%)3. Finance, Leasing and Services company (7.11%)
ServicesFinance, Leasing and Services companyOthers
Transportation and CommunicationTrading, Hotel, dan Restaurant
Processing IndustryElectricity, Gas and Clean waterConstruction
MiningAgriculture, Veterinary, Forestry, and Fishery
3.71%92.38%
2.45%
Note: The livelihood under 1% are not displayed on the chart.
EDUCATIONAL ATTAINMENT LITERACY RATE
State-owned public schoolsInclude private schoolsMadrasah
Senior
17.81%
Vocational
1.79%Not graduatedfrom Elementary
21.84%
Elementary
28.14%Junior
17.63%
Diploma
1.78%
Undergraduate
3.45%
Postgraduate
0.24%Never attendingschool
7.32%
KIND
ERGA
RTEN
ELEM
ENTA
RY
JUNI
OR
SENI
OR (I
NCL.
SMK)
MAD
RASA
H
SCHOOL FACILITIES
0
300
600
900
1200
1500
92.20% From Total Population
EDUCATION
Source: SUSENAS year 2011, BPS
Source: Census year 2010, BPS
Source: Census year 2010, BPS
Source: PDRB 2012, based on dated price
Source: Census year 2010, BPS
DATA SOURCES
PROVINCE BPBD CONTACT DETAILS: Jl. Pangeran Natadirja KM. 7
Bengkulu.
Phone. (0736) 349674,
Fax. (0736) 349674
Landscan Global Population Databaseshttp://web.ornl.gov/sci/ landscan/
Road Networkhttp://maps.navigasi.net
Administrative Boundaryhttp://bps.go.id
Food Security and Airporthttp://www.wfp.org/countries/ indonesia
Admin Capitalhttp://geospasial.bnpb.go.id
SRTM Relief Backgroundhttp://www2.jpl.nasa.gov/srtm/
Port, Volcano, Coastline and Riverhttp://geospasial.bnpb.go.id
Population, Water & Sanitation, Education, Health, Vulnerable Groups, Livelihood, Natural Disasterhttp://dibi.bnpb.go.id/
This products is prepared by: