Embed Size (px)
Citation preview

ABSTRACT
Bending Fatigue Performance of Carburized Gear Steels
Ray Sieber Rockwell International
This paper presents the results of a designed experiment and confirmational testing of the bending fatigue properties of boostdiffuse gas carburized gear steels for use in heavy duty truck gearing applications. Testing was conducted on simulated gear tooth samples in unidirectional four point bending under constant amplitude load control to crack initiation. The experiment was an L32 fractional factorial with eight levels of alloy grade, four levels of shot peening, and two levels each of grinding, case depth, surface carbon, ammonia additions, and tempering temperature. The SAE 4320 and boron containing alloy grades significantly outperformed the 8600 series steels. Surface conditions highly influenced the fatigue lives with low retained austenite, low surface carbor! contents, and shallow intergranular oxidation depths resulting in superior performance. The beneficial effects of grinding and shot peening the tooth root following carburizing are discussed.
INTRODUCTION
The purpose of this report is to document the results of investigations into the effects of multiple material and process variables on the bending fatigue life of carburized gear steels. The gear steels evaluated in this study included many of the common SAE steels used in gearing: 8615; PS-15, an 8620 substitute; 8622; PS-16, an 8622 substitute; 8627; PS-18, an 8627 substitute; 4320; 94817; and PS-19, a 94817 substitute. Steel manufacturing variables included ingot cast steel, continuous cast steel, forging effects, and sample location. Heat treat variables included carburizing carbon potential, carburizing case depth, ammonia additions to the carburizing furnace, and tempering temperature. Post heat treat variables included shotpeening and grinding of the tooth root. All tests were run on a sample bar designed to simulate a single tooth from a forged, truck hypoid ring gear. The bar design will be discussed later. This study combined three project phases: preliminary testing to develop sample preparation expertise, a fractional factorial designed experiment, and confirmational testing to validate the designed experiment results.
EXPERIMENT DESIGN
The experiment was designed as a Taguchi L32 orthogonal array fractional factorial experiment. The experiment was saturated with main effect factors, providing negligible interaction observations. The purpose of the experiment was to provide a screening design of experiment, DOE, with less saturated DOE'S to be persued in the near future to capture interactions. The main effect factors were 8 levels of alloy carburizing steel grades, 4 levels of shot peening, and 2 levels each of ammonia, grinding, total case depth, surface carbon content, and tempering temperature as shown in Table 1. One stress level, 1255 MPa, resulted in approximately equal numbers of low and high life results and was selected for all samples. The eight alloy steel grades covered a wide range of prdiiction available SAE gear steels including: 8615, PS-15, 8627, PS-18, 4320 at the low end of the hardenability band, 4320 at the high end of the hardenability band, 94817, and PS-19.
The four levels of shot peening used, shown below, represent current gear peening practice. A compressed air type peening machine was used with the blast nozzle directed at the tooth root. One quarter of the samples, level 1, were tested in the unpeened condition while three quarters of the samples were peened under various conditions. Level 2 samples were peened with soft, 40 to 50 HRC, S-230 shot with a relatively high intensity of 0.47 mm Almen A arc height. Level 3 samples were peened with hard shot, 55 to 60 HRC, to a high intensity of 0.58 mm Amen A. Level 4 samples were peened to the same conditions as the Level 3 samples and followed up with a second pass of smaller diameter shot hard shot at a lower intensity to smooth the surface finish, as shown in Table A below.
Table A: Shot Peening Conditions
Shot Peen Shot Size Hardness Peen lntensi Workpiece Peen Level Diameter (mm) (HRC) (mm Almen 8 Coverage (%)
1 No Peening 2 0.47 300 3 0.58 300
4 Double Peen S230 058 5560 0.58 S110 [0:28) 55-60 0.30

Metallurgical grade ammonia additions at 7% concentration were made to half of the samples during the 843" C diffusion portion of the heat treat furnace carburizing cycle. This is a practice occasionally used to boost the surface hardness by forming iron nitrides through carbonitriding and by reducing the formation of bainite or pearlite at the surface grain boundaries caused by alloy loss as a result of intergranular oxidation, IGO, during carburizing.
Half of the samples were finish ground after carburizing in the tooth root prior to shot peening using a contoured wheel and flood cooling to simulate CBN, cubic boron nitride, grinding practice. Stock removal was 0.15 mm.
Two levels of total case depth, 1.8 mm and 2.5 mm were used to be typical of gearing case depths. Two levels of case carbon content, 0.70% and 1.00% carbon measured by spark emission spectrometer, were targeted during carburizing. A finished case carbon content of 0.70% is slightly below the eutectoid and primarily results in a Lathe type martensitic microstructure whereas 1.00% carbon is well above the eutectoid and results in primarily 100% Plate type martensite.
The last main effect factor was tempering temperature. Two levels of temperature, 93 " C and 204" C, were used to temper the samples following carburizing. At 93 " C, the temperature is marginal for the precipitation of transition carbides whereas 204" C results in significant carbide precipitation (1). All were tempered for 2 hours.
SAMPLE DESIGN AND PREPARATION
The bending fatigue properties were evaluated using unidirectional four point bending on simulated hypoid ring gear samples. The sample bars, shown in Figure I , represent the idealized equivalent of a single tooth fatigue test sample cut from a finished ring gear, as shown in Figure 2. The notch dimensions and location are intended to approximate the stress concentration in the radius where the tooth dedendum blends into the tooth root. A typical stress concentration was calculated from a hypoid ring gear with a fillet radius at the base of the gear tooth of 2.8 mm, a pressure angle of 2 0 • ‹ , and a working height of 11.2 mm which generates a stress concentration factor, Kt, of 1.632. The sample bars have been designed to provide a Kt = 1.628. The thickness and mass of the sample were chosen to approximate a truck hypoid ring gear, generating core hardnesses and case-to-core ratios indicative of heavy duty gears.
The samples were rough cut and Blanchard ground on all four surfaces with the sides finish ground to a 19.1 0 rnrn width. The samples were then 100% copper plated to 0.03 to 0.05 mm thickness. The final machining operation was to grind the top and bottom surfaces to remove the copper and finlsh to a height of 27.9 mm and contour grind the 7.6 mm radius notch to a finished depth of 6.4 mm. The surface finish in the direction of the notch was less than 0.9 micrometers on all as-ground samples measured. The copper plating on the side surfaces provides an effective stop-off to carburizing in order to:
simulate a tooth cut from a finished ring gear, prevent through-carburizing of the sample corners to prevent alloy carbide formation and retained austenite in the corners, minimize premature crack initiation on the corners of the samples, and get uniform carbon penetration along the full length of the notch.
HEAT TREATMENT
All samples were boost-diffuse carburized. As the DOE required multiple combinations of carburized case depth, carbon potential, and ammonia level, the samples were split into 8 separate furnace loads in an in-out batch gas carburizing furnace. The samples were racked vertically in the baskets with a separate wire mesh screen near the top of the bars for additional support to minimize distortion. At least a 1 inch bar-to-bar spacing was maintained for uniform gas circulation and quenching. The samples were carburized at 927• ‹C at a carbon potential of 1.2% carbon, controlled with a calibrated oxygen sensor. Where ammonia additions were required, they were made during the 1550" F diffusion cycle at a 7% concentration. None of the samples were grit blasted or shot cleaned following heat treatment to prevent additional compressive residual stresses from being induced into the samples. The DOE samples received two additional post-carburizing treatments.
The preliminary and confirmation test samples were carburized to two target case depth ranges, 1.5 mm and 2.3 mm total case depth. The 1.5 mm depth samples were all carburized in a pusher furnace on a 30 minute push cycle. The bars were racked and spaced identical to the previous samples. This boostdiffuse furnace cycle provided a 2 hour 871 " C preheat, 6 hours carburizing at 927 " C and 1.2% carbon potential, and 2 hours diffusion at 843" C and 0.86% carbon potential. The oil quench temperature was 52 to 66" C with both agitators at high speed. The samples were tempered for 2 hours at 177" C. The 2.3 mm depth samples were carburized in the same furnace and at the same carbon potentials but on a longer, 60 minute, push cycle.
FATIGUE TECHNIQUE
All samples were tested to crack initiation and full fracture on closed loop electrohydraulic fatigue testers under load controlled, constant amplitude, unidirectional four point bending with the load application points PI and P2 and reaction points R1 and R2, as shown in Figure 1. All samples were tested at 10 Hertz with a sinusoidal load wave. This frequency held the maximum temperature rise in the samples due to straining to less than or equal to 4 " C. Crack initiation was detected by monitoring deflection changes beyond the initial sample deflection. Visual checks and magnetic particle inspection were used to confirm the presence of a crack whenever the deflection limit was tripped. The maximum compressive load was calculated based on the stress required, lndivldual sample dimensions, and the stress concentration factor. In all cases the minimum compressive load was 45 kilograms or approximately 10 MPa to insure retention of the sample in the four point bending test fixture during minimum loading. The stress

ratio, R, was 0.01 for all samples. The preliminary and confirmational samples were tested at two target stress levels, 951 MPa and 1255 MPa maximum bending stress in the root of the notch with the stress concentration factor included. The designed experiment samples were tested only at 1255 MPa in order to minimize the number of runout samples as well as minimize the number of samples with low lives to failure. All samples were tested to failure or 1 to 2 million cycles. Each runout sample from the designed experiment was repeated to verify the runout data point. Following the detection of crack initiation, the number of cycles was recorded and the
- sample was restarted under load control at the same load level used to initiate the crack. The number of cycles to full fracture was recorded. The load cell shunt calibration was checked and recorded before each sample to verify cell calibration. Sample condition and test observations were recorded for each bar.
PRELIMINARY TESTING RESULTS
The purpose of these preliminary test sequences was to develop the expertise necessary to properly select the location and position of the sample bars. This testing investigated four aspects of sample preparation: differences between bar stock and forged stock generated samples, the effects of sampling from various locations within the bar stock, the effects of sampling from various bar stock sizes, and the difference between ingot cast and continuous cast steels. The sampling locations and preliminary, confirmation, and designed experiment samples are shown in Table 2.
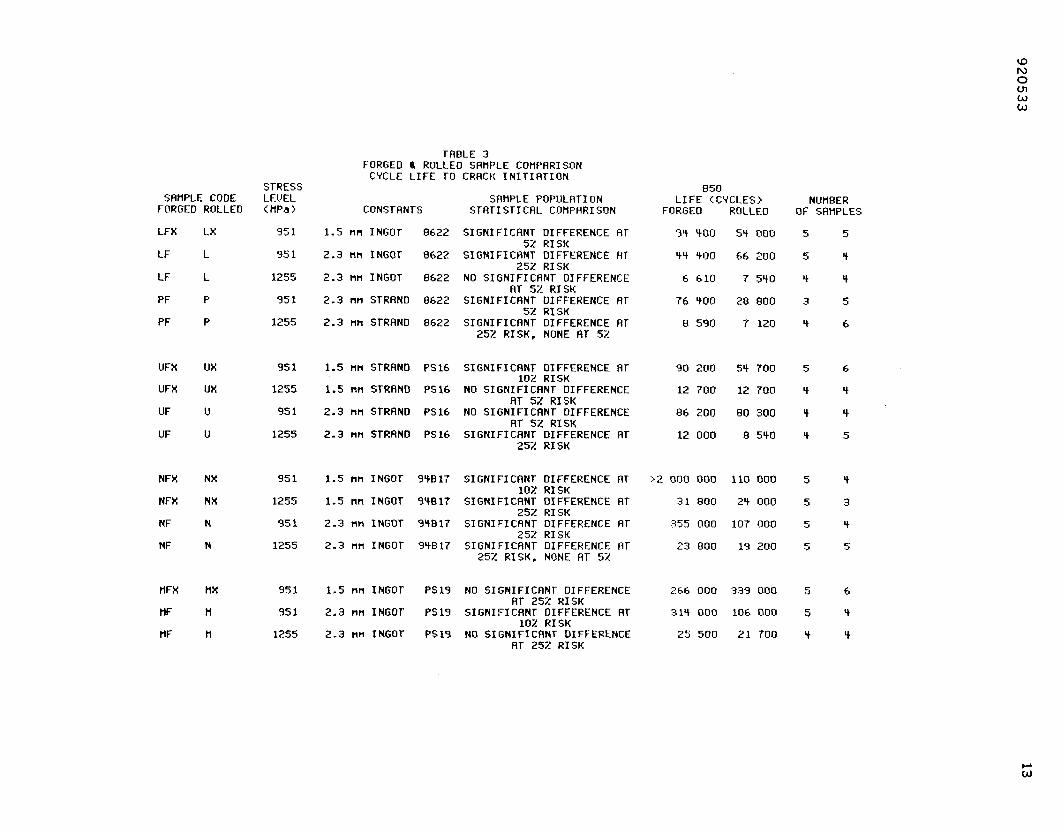
Generating samples from bar stock is more economical and expedient than using gear forgings but the possibility that samples cut from bar stock could have different properties than those cut from forged gear blanks had to be investigated. In all cases the samples from bar stock were cut longitudinal to the rolling direction of the bar. The samples were cut with the notch toward the outside of the bar stock and transverse to the rolling direction. Samples cut from unmachined ring gear forgings were positioned with the root of the notch at approximately the same depth as a production cut gear tooth root. As shown in Table 3, the fatigue results of bar stock generated samples were compared to samples cut from forged ring gear blanks using the same heat of steel for four steel grades; SAE 8622, PS-16, 94817, and PS- 19. The sample populations were compared to determine what statistical differences were present using a Nonparametric statistical approach. This statistical program was developed by Rockwell Automotive Operations staff statisticians in recognition of the non- normality of fatigue test data. This program does not assign a distribution, unlike the Weibull technique, and is ideal for small sample sizes, on the order of one to six samples of each material and process variation. Only data that demonstrated a significant difference at 5 or 10% risk, equivalent to 90 and 95% confidence, was considered for detailed analysis. The results, shown in Table 3, show no major trend for forged samples to have significantly different crack initiation bending fatigue lives than bar stock samples at a 5 or 10% risk level based on 32 groups of samples or a total of 145 samples. This greatly simplified all future sample preparation provided the gear design being modeled has cut teeth. Gears with forged-in teeth, in which the forging flow lines are not
3 disrupted by machining, could demonstrate better lives than cut gears.
Next, samples were prepared from one ingot cast heat of SAE 8622 and one continuous or strand cast heat of SAE 8622 to evaluate the influence of steel manufacturing technique on bending fatigue life, especially considering the trend for ingot cast steel mills to be replaced by continuous casting mills in increasing numbers in world steel production. The continuous cast steel billet used in this study received a 4.9:1 rolling reduction. As shown in Table 4, there was no consistent significant difference with respect to crack initiation bending fatigue life between ingot and continuous cast steel at reductions greater than or equal to 4.9:1 based on 10 groups of samples or 45 total samples (2).
Next, samples cut from the half radius and from the O.D. of 140 mm and 152 mm continuous cast bar stock were compared to determine if depth is critical, particularly in continuous cast steel where centerline porosity from the casting operation may adversely affect the fatigue life on samples cut from deeper sections of the bar stock. Samples cut from the one-half radius were positioned with the root of the notch at the half radius. As shown in Table 5 for SAE 8622 and PS-16, the results were mixed but in general there was no discernible trend based on 12 groups of samples or 58 total samples.
Lastly, samples from the O.D. of a 59 mm diameter round and the O.D. of a 140 mm diameter round of SAE PS-19 from the same heat were compared. In general there was no significant statistical difference based on 8 groups of samples or 36 total samples, as shown in Table 6.
In general, the preliminary testing showed that future sample preparation could be greatly simplified permitting samples to be taken from any location in ingot cast or strand cast bar, except the very center where centerline shrink and inclusion levels could be excessive. These conclusions were incorporated into the designed experiment sample preparation.
DESIGNED EXPERIMENT RESULTS AND DISCUSSION
The analysis of variance for the DOE found the main effect factors to influence the bending fatigue lives in the following order, from most important to least important: shot peening level, SAE alloy grade, grinding, carbon content in the carburized case, tempering temperature, ammonia additions, and finally, total case depth. The sample test results are compiled in Table 7.
The effect of shot peening on the overall 650 life of the samples is shown in Table B below. Level 4 increased the effective life to crack

Table 8: Shot Peening Llfe Effects surface finish for level 4 is the result of the second pass using small diameter shot.
850 Cycles to Failure Factor
Level 1 No peening 12303 1 . 0 ~ 2 Soft shot 4 074 0 . 3 ~ 3 Hard shot 16 982 1 . 4 ~ 4 Double peen hard shot 107 152 8 . 7 ~
initiation by a factor of nearly 9 compared to samples without peening (3)(4). Shotpeen levels 2 and 3 were more representative of typical shot peening practice where only one size shot is used. As shown, level 3 provided only a 38% increase in life while level 2 resulted in a decrease in fatigue life. A decrease is surprising but may be partially explained later.
Peening was found to have three distinct effects on the samples; increased compressive stress, decreased retained austenite contents, and increased surface roughness. As expected, peening significantly increased the compressive residual stress, as measured on the surface by Fastress x-ray diffraction. Level 4 induced 3 times the
Table C: Residual Stress Levels
Average Residual Stress (MPa)
Level 1 -249 2 -459 3 -555 4 -840
residual stress compared to samples without peening (5). As shown in Table D below, the soft shot used in the level 2 samples
Table D: Effect of Peening on Retained Austenite Level
Average Retained Austenite by X-Ray Surface, Post-Peen % Decrease
Level 1 2 3 4
provided no effective reduction in the retained austenite level, with the level 3 and level 4 hard shot providing 50% reductions. The effect of shot peening on the surface finish is shown in Table E below. The decrease in
Table E: Effect of Peening on Surface Finish
Level 1 2 3 4
Average Surface Finish (micrometers)
The decrease in fatigue life observed for level 2 is believed to be the result of the shot increasing the surface finish but failing to reduce the retained austenite levels while only providing a moderate increase in residual stress and a much shallower stress pattern. Level 4, demonstrating the highest fatigue life, provided maximum residual stress, a maximum reduction in retained austenite, and improved surface finish. It is interesting to note in Table 7 that long bending fatigue lives can be achieved without the expense of shot peening, provided the right combination of conditions are maintained. Of the ten samples generating fatigue lives greater than 580 kilocycles at 1255 MPa, six samples were not peened.
The second most important factor was the SAE alloy grade. As shown in Table F below, the two SAE 4320 alloys were the top
Table F: Alloy Grade Ranking
850 Cycles Alloy to Failure Factor
Level 5 1 2 4 8 6 7 3
4320 low 4320 high
PS-18 PS-19 9481 7 PS-15 861 5 8627
performers of the eight steel grades tested. The second top performer was the SAE 8627 substitute, PS-18. This is a surprising result considering the poor performance of 8627, the high nickel version of PS-18. The next group of performers were the boron steels, 9481 7 and PS-19. As shown, 94817 and PS-19, the low nickel substitute for 94817, were equivalent performers. The worst performers were the 8600 series steels which included PS-15,8615, and 8627.
The third most important factor was grinding, with 0.15 mm removal out of the notch root resulting in a 6 fold increase in the average bending fatigue life compared to no grinding, as shown in Table G below. Though the ground surface finishes were the same as the carburized finishes, the influence of grinding appears to be the removal of the oxide films and the intergranular oxidation associated with the carburizing furnace atmospheres, factors that will be further discussed later (6).
Table G: Effect of Grinding on Life
850 Cycles to Failure Factor
Level 1 Grind 0.15 mm 44 157 6 . 4 ~ 2 No grind' 6 918 1 .Ox

The fourth most important factor was the surface carbon level generated by the carbon potential of the carburizing furnace. As shown in Table H below the bending fatigue life increased five fold when the case carbon
Table H: Effect of Surface Carbon on Life
850 Cycles to Failure Factor
Level 1 Low carbon 0.70% 38 905 5 . 0 ~ - 2 high carbon 1.00% 7 762 1 .Ox
level was held to the low range, which varied from 0.60 to 0.92% carbon. This is believed to be due to the formation of larger amounts of plate martensite at the higher carbon contents. Considerable work has shown that microcracks are associated with plate martensite formations and contribute to premature crack initiation (7). All of the runout samples had surface carbon contents between 0.60 and 0.85% carbon.
The last three factors, ammonia additions, tempering temperature, and case depth provided weaker conclusions of a statistically lower significance, however the results were still interesting and somewhat logical. In general, no ammonia was preferable to 7% ammonia with the life of the no ammonia samples approximately 3 times that of the ammonia treated samples. This is a logical conclusion considering that carbonitrided parts are typically more brittle and lower toughness than carburized parts. The effect of nitrogen on lowering the martensite start, Ms, is shown by the 50% increase in retained austenite in the ammonia treated samples. The 204 " C temper for two hours was preferable to 93 " C, as shown in Table I below. This is iogicai in that the
Table I: Effect of Variables on Life
B50 Cycles % Retained to Failure Factor Austenite
Level 1 7% ammonia 10902 1 . 0 ~ 21.9 2 0% ammonia 27 742 2 . 5 ~ 14.4
1 93•‹C temper 10 871 1 .Ox 2 204" C temper 27 821 2 . 6 ~
1 Low case depth 1.8 mm 23 988 1 . 9 ~
2 High case depth 2.3 mm 12 589 1 . 0 ~
transition epsilon carbides precipitated at 204" C increase the toughness and reduce the adversely high residual stresses from quenching. In the weakest conclusion, total case depths in the range of 1.8 mm were found to be preferable to 2.5 mm. Though deeper case depths result in lower compressive stresses, confirmation testing over a larger group of samples is required to verify such a weak conclusion.
5
CONFIRMATION TESTING
Confirmation testing with larger sample sizes is necessary to validate the results of any designed experiment. Of the seven main effect factors, three factors, alloy steel grade, case carbon content, and total case depth were selected in six different alloy grades for confirmation. The alloy grades, shown in Table 2, were SAE 8622, PS-16, 8627, 94B17, PS-19, and a midrange hardenability SAE 4320. SAE 4320 was not retested in detail because of it's overwhelming influence in the designed experiment and the selection of alloys was narrowed in hardenability range to further challenge the designed experiment results. Multiple heats of SAE 8622, 8627, and 9481 7 were included. The heats were the same as those tested in the preliminary tests. PS-16 and SAE 8622 were substituted for the PS-15 used in the designed experiment because samples were available from the preliminary tests. Shot peening and grinding effects have not been confirmed at this time.
Total case depth, the weakest main effect factor in the designed experiment, was further tested because of it's expensive influence on carburizing furnace time. Two total case depths, 1.5 mm and 2.3 mm, were examined in detail. Controlling the total or effective case depths when multiple steel grades are run in the same furnace batch can be accomplished only by aiming for the median case depth and accepting the variations that occur. Among the eight heats of steel carburized, the resulting case depths were extremely close to the target values. The median case depth for the 1.5 mm case was equal to 1.60 mm with one standard deviation equal to 0.1 1 mm. The median case depth for the 2.3 mm case was equal to 2.29 mm with one standard deviation equal to 0.22 mm. The sample data provided extensive comparisons between the low and high case depths and, as shown in Table 8, total case depth variations from 1.4 mm to 2.6 inch depth had no effect on the bending fatigue lives, based on 48 groups of samples, 216 total samples. This confirms the designed experiment results.
The next main effect factor to be confirmed was the effect of alloy grade, found to be a strong factor in the designed experiment. The first interesting feature to be noted in Table 9 is that the low nickel substitutes performed comparable to the equivalent nickel grades. There was no significant difference at 10% risk between SAE 8622 and PS-16, the low nickel substitute for 8622, based on 16 groups of samples, 72 total samples. The current cost savings in substituting PS-16 for 8622 is approximately 8%. Similarly there was no significant difference between 94817 and PS-19, a low nickel substitute for 9481 7, based on 14 groups of samples, 65 total samples. This confirms the results of the designed experiment on the two boron steel grades. The current cost savings in substituting PS-19 for 94817 is approximately 6%.
As in the designed experiment, the boron containing steels, SAE 94817 and PS-19 were the top performing steels of the five steel grades tested, as shown in Table J below. PS-19 and SAE 94817 were 4.1 and 3.3 times better than SAE 8622 at the designed experiment stress level of 1255 MPa and 5.8 and 4.6 times better at the lower stress level of 951 MPa (8).

6 Table J: Alloy Grade Ranking
B50 Cycles to Failure Number of Alloy 1255 MPa Factor 951 MPa Samples
Currently PS-19 is 5% lower in cost than 8627 and 3% higher than PS-16. SAE 8627 continued to perform erratically and may be due to bainitic transformations (9). Though the performance is improved over that in the designed experiment, the performance at 951 MPa is quite poor. The improved performance of all five steels compared to the designed experiment is due to the lack of ammonia additions and more moderate tempering temperatures and case carbon levels. The tempering temperature was 177 " C and the average carbon content was 0.86%.
The last result of the designed experiment to be confirmed was case carbon content, a moderately strong effect. SAE 4320 samples carburized to a target carbon level of 0.7%, compared to samples carburized to a target level of 1.0% carbon were found to have an average life 5.3, 8.7, and 18.5 times greater than the life of the high carbon samples at 1034 MPa, 1200 MPa, and 1324 MPa stress levels, respectively. Compared
Table K: Effect of Surface Carbon on Life
850 Cycles to Failure Number of 1034 MPa 1200 MPa 1324 MPa Samples
Low Carbon 0.70% 330 000 63 700 62 400 21 High Carbon 1.00% 62 900 7 300 3 400 12
to the 5 fold increase found for all steel grades in the designed experiment, this indicates that SAE 4320 may be more sensitive to carbon content, particularly at higher stress levels.
MULTIPLE REGRESSION ANALYSIS
In addition to the main effect factors controlled in the designed experiment, many other uncontrolled factors were collected on the DOE samples. They included; surface hardness, core hardness, core and case hardenability per SAE J406, core chemical analysis, effective case depth, depth of intergranular oxides at the surface grain boundaries, prior austenitic grain size, visual retained austenite levels below the surface of the notch, and the internal sulfide and oxide contents measured per SAE J422. Several other factors including notch surface finish, notch transverse residual stress measured by the Fastress technique, and notch surface retained austenite measured by X-ray diffraction have been previously discussed. These factors were correlated to the log 10 bending fatigue cycle lives to determine if and to what extent they may have influenced the lives observed. Because of their high degree of interaction, these variables were entered into a stepwise
multiple regression statistical routine that regresses the data against the logarithmic cycle lives and builds a model from the statistically significant data while rejecting the insignificant data. The alloy grades were entered as numbers one through eight corresponding to the levels shown in Table 1.
Five of the variables were found to have F ratios that were significant and together they explained 70% of the variations in cycle lives observed. They included IGO depth, grain size, SAE alloy grade, retained austenite level, and case hardenability. All of the other
Table L: Regression Analysis
Sum of Model Variables Coefficient Squares DF F Ratio p value
Constant 14.925 Retained Austenite -0.0459 3.802 1 7.23* 0.01 16 Surface Finish 0.0197 .487 1 .93 0.3537 SAE Alloy Grade -0.2037 5.357 1 1 O.l8* 0.0033 IGO Depth -0.0013 8.371 1 15.91* 0.0004 Grain Size Number -0.7688 13.1 36 1 24.97* 0.0000 Case Hardenability -0.3989 5.003 1 9.51 * 0.0044
Fo.95(1,6) = 5.99; *Any F ratio >5.99 is significant at the 95% confidence level
variables were found to be less significant in comparison. Bending fatigue life was found to increase as retained austenite decreased, IGO depth decreased, the grain size increased, and case hardenability decreased.
With the results of this regression it is possible to better understand the designed experiment results. Despite shot peening's beneficial effects on residual stress, the main factor appears to be shot peening's ability to reduce the retained austenite levels. In mechanically subjecting the gear surface to plastic, permanent deformation in order to generate residual stresses, peening converts the thermally and mechanically unstable microstructural constituent, austenite, retained from the high temperature portions of the carburizing operation, into stable martensite. Generating approximately a 4% volume expansion during the conversion, the martensite further strains the atomic lattice, generating additional compressive stresses. Retained austenite, on the other hand, is very weak and rapidly initiates microcracks during bending fatigue operation. Though, over time in field service, thermal excursions and mechanical working will convert some retained austenite to martensite, this requires considerable time and puts the gear at risk for premature failure. During all of these tests the levels of retained austenite did not change as a result of the testing, demonstrating the relative mechanical stability of austenite. The proper level of retained austenite in carburized microstructures continues to be controversial with zero retained austenite required in aircraft gearing where dimensional stability and long life are paramount, to 50% in roller bearings where retained austenite improves the contact fatigue life (10)(11)(12). This study suggests that retained austenite should be maintained as low as possible and should not exceed 22% for improved

bending fatigue for gearing applications where considerable sliding occurs, as in hypoid gearing. The lower B50 cycle lives to crack initiation in the DOE compared to the preliminary and confirmation tests appear to be the result of the use of higher levels of retained austenite, as well as higher case carbon contents, the use of ammonia, and lower tempering temperatures discussed earlier.
The regression suggests that gear steels should be selected for optimum bending fatigue performance with lower core hardenabilities and carburized at lower
- carbon potentials, i.e. less than 0.85% carbon to reduce the case hardenabilities. The three fold improvement in low hardenability SAE 4320 compared to high hardenability 4320 shows the potential effect of hardenability. Lower carbon potentials also result in lower retained austenite levels.
The regression also indicates that intergranular oxidation should be minimized. This can be accomplished by grinding the tooth root following carburizing. Grinding also removes retained austenite and exposes lower carbon content or lower case hardenability subsurface layers, explaining why grinding was within the top three important factors in the DOE. Grinding, except to correct rough surface finishes, may not be neccesary to improve gear life provided reasonable retained austenite and carbon potentials are maintained. IGO depth can also be minimized by the use of vacuum carburizing instead of gas carburizing and selecting alloys with elemental analyses that minimize the use of high oxidizing potential elements. Alloying elements such as nickel and molybdenum should be used preferential to manganese and chromium. Aluminum, silicon, and phosphorus contents should be minimized. Boron has a high oxidation potential but is used in extremely small quantities, on the order of 0.0005%.
Conventional wisdom indicates that bending fatigue life should increase as the grain size number increases or grain diameter decreases within any one steel alloy because finer grain results in more notch toughness, higher tensile and yield strength, lower internal stress after hardening, less retained austenite, and lower hardenability (1 3). This study indicates that coarser grain size is better in carburizing steels in the range of 9 to 11 grain size, but further work is required over a broader range of grain sizes to confirm the effect of grain size.
As expected, the factors that related only to subsurface conditions, such as core hardness, subsurface retained austenite content, inclusion counts, etc., had no influence on the bending fatigue lives. Subsurface retained austenite measured visually on a metallograph was found to be an extremely poor indicator of the amount of surface retained austenite measured by X-ray diffraction and thus correlated poorly to the bending fatigue lives. Though sulfide inclusion levels varied from 1 to 5 per SAE J422, the decision to orientate the samples longitudinal to the rolling direction does minimize the effect of sulfide and oxide inclusions. Surface inclusions parallel to the tooth root can be expected to adversely affect bending fatigue life and
should be considered whenever sample preparation is planned. Inclusions in ring or pinion gear forgings can be expected to lie in many orientations. Similarly, no one chemical element including nickel correlated to the bending fatigue lives, though it is possible that there is a synergistic effect of several elements.
CONCLUSIONS
1. The longest bending fatigue life to crack initiation was observed in SAE 4320 steel, followed by PS- 18 and the boron steels, 94B17 and PS-19. The worst performers were the 8600 series and 8600 series substitute steels including 861 5, PS-15, 8622, and PS-16, with all providing nearly equivalent performance. SAE 8627 provided erratic results, performing poorly in the designed experiment at 1255 MPa and poorly at 951 MPa in the confirmational testing. SAE 4320 demonstrated an average 5 fold improvement over the boron steels at 1255 MPa bending stress based on the DOE results, but the cost premium is 35%. SAE 94Bl7 and PS-19 demonstrated an average 3 fold improvement over the 8600 series at 1255 MPa and an average 5 fold improvement at 951 MPa based on the confirmation test results. PS-19 is 5% lower in cost than 8627 and 3% higher than the least expensive 8600 grade substitutes.
2. Surface conditions highly influence the bending fatigue life. Long bending fatigue lives can be achieved in all steels including the 8600 series, without shot peening, provided surface retained austenite was maintained to as low a level as possible, surface carbon content was held below 0.85% carbon, surface finish was held to below 0.8 micrometers, and intergranular oxidation was minimized. Grinding the tooth root had a significant influence on bending fatigue life, increasing the life by a factor of 6 compared to no grinding. It can improve the surface finish, remove intergranular oxidation, retained austenite, and high surface carbon layers, but equivalent results could also be achieved by following the recommendations above. Alloys that minimize the use of high oxidizing potential elements such as manganese, chromium, aluminum, silicon, and phosphorus, in favor of elements such as nickel and molybdenum may offer higher bending fatigue lives. Factors that relate only to subsurface conditions such as core hardness and subsurface retained austenite had no significant influence on bending fatigue life.
3. Total carburized case depths varying from 1.4 mm to 2.6 mm had no effect on the bending fatigue performance at 951 and 1255 MPa.
4. Typical gear shot peening practice using large diameter, hard shot provided a 38% increase in fatigue life at 1255 MPa. Double shot peening with hard shot resulted in major improvements. in bending fatigue life, on the order of 9 fold increases, but the cost for double peening is

quite high compared to typical practice. Double peening requires total coverage with large diameter, hard shot followed by small diameter shot to improve the surface finish. Two set-ups are required. Shot peening's primary influence in improving the bending fatigue life was in reducing the retained austenite levels, with compressive residual stress improvements as a secondary effect. Shot peening was not mandatory for long bending fatigue life but improved the probability of long life. Typical gear shot peening practice using soft shot provided no overall improvement except when the retained austenite content was low.
The low nickel substitutes for SAE 94817 and SAE 8622 steel were found to be equivalent in performance to their high nickel versions.
Ammonia additions during the diffuse portion of the carburizing cycle and low tempering temperatures, i.e. 93 " C, adversely affected the bending fatigue life.
Ingot cast steel and continuous cast steel within the same alloy grade were found to have equivalent crack initiation bending fatigue lives at 951 MPa and 1255 MPa stress using strand rolling reduction ratios greater than or equal to 4.9: 1.
This testing reports on only bending fatigue, one of several types of gear distress that can be encountered in service. Overload that results in case crushing and impact loading were not simulated by this testing. At lower loads, contact or pitfing iaiigue becomes a significant factor, though the life to failure is extended by the lower loads. Abrasive wear, due to contamination of the oil by dirt or wear particles, and adhesive wear or scoring due to the use of incorrect hypoid lubes, water contaminated lubes, or low lube levels are encountered less often but are still significant factors. The incidence of adhesive wear has been greatly reduced by the widespread adoption of GL-5 rated gear lubes. Recommendations as a result of this testing focus only on improving the bending fatigue performance and may have beneficial or adverse effects under contact, impact, or case crushing service conditions.
ACKNOWLEDGEMENT
The author is indebted to J. Lewsley and J. Hoenle for performing most of the experiments, V. Bawie for the DOE layout and analysis, and the metallurgical laboratory staff for their critical inputs.
REFERENCES
2. D.J. Lingenfelser, "Application of Basic Material Tests for Evaluating New Engineering Materials', SAE Earthmoving Industry Conference, Peoria, Illinois, April 7-9, 1987, No. 870801.
3. D. McCormick, "Shot Peen Gears for Longer Life", Design Engineering, July, 1981, p. 49-54.
4. G. Parrish, 'The Influence of Microstructure on the Properties of Case-carburised Components", Heat Treatment of Metals, 1977.4, p. 107-1 16.
5. Y. Miwa, M. Suzawa, Y. Arirni, Y. Kojima, and K. Nishimura, "Carbonitriding and Hard Shot Peening for High-Strength Gears", SAE lnternational Congress and Exposition, Detroit, Michigan, February 29-March 4, 1988, No. 880666.
6. S. Oda, T. Koide, M. Matsui, and Y. Yamamoto, 'The Effect of Intergranular Oxidation on the Bending Fatigue Strength of Case-Hardened Gears", JSME lnternational Journal, Series Ill, Vol. 32, No. 3, 1989.
7. G. Krauss, 'The Microstructure and Fracture of a Carburized Steel", Metallurgical Transactions A, Volume 9A, November, 1978, p. 1527- 1535.
8. D.H. Breen, "An Assessment of the Claim for Carburized Boron Steel for Gears and the Utility of the Brugger Impact Test", ASME Gear Research Institute Final Report, Project A1002, February, 1988.
9. C. Van Thyne and G. Krauss, "A Comparison of Single Tooth Bending Fatigue in Boron and Alloy Carburizing Steels", in Carburizina: Processina and Performance, ASM International, international Conference proceedings, Lakewood, Colorado, July 12-14, 1989.
10. J.L. Pacheco and G. Krauss, "Microstructure and High Bending Fatigue Strength in Carburbed Steels", in Carburizina: Processina and Performance, ASM International, lnternational Conference proceedings, Lakewood, Colorado, July 12-14, 1989.
11. R.F. Kern, "Selecting Steels for Carburized Gears", Metal Progress, July, 1972, p. 53-64.
12. J.R. Eagan and C.H. Shelton, "Recent Test Data on Selection of Alloy Steels for Gears and Bearings", SAE Automotive Engineering Congress, Detroit, Michigan, January 10-14, 1972, No. 720301.
13. G.L. Kehl, The Princioles of Metalloara~hic Laboratorv Practice, 3rd Ed., McGraw-Hill, New York. 1949.
1. R.E. Cohen, P.J. Haagensen, D.K. Matlock, and G. Krauss, "Assessment of Bending Fatigue Limits for Carburized Steel", SAE lnternational Congress and Exposition, Detroit, Michigan, February 25-March 1, 1991, No. 910140.

TABLE 1 DESIGNED EXPERIMENT
FACTORS, LEVEL D E F I N I T I O N , LAYOUT
FACTORS LEVEL 1 LEVEL 2 LEVEL 3 LEVEL 4 LEVEL 5
S A E ALLOY GRADE ALLOY CODE
4 3 2 0 HIGH PS-18 B G
8 6 2 7 PS-19 4 3 2 0 LOW I L C
LEVEL 6 LEVEL 7 LEVEL 8 -
SAE ALLOY GRADE ALLOY CODE
AMMONIA F I N A L GRINDING SHOT P E E N I N G
7% 0 . 1 5 mm
NO P E E N
1 . 8 mm 0 . 7 0 %
9 3 • ‹ C
0 % NO G R I N D
ONCE S O F T
2 . 5 mm 1 . 0 0 % 2 0 4 • ‹ C
ONCE HARD
TWICE HARD
TOTAL CASE DEPTH SURFACE CARBON TEMPERING TEMPERATURE
ALLOY GRADE LEVEL
CASE DEPTH LEVEL
SURFACE CARBON
LEVEL
TEMPER TEMP LEVEL
T R I A L NUMBER
AMMONIA LEVEL
GRIND LEVEL
P E E N LEVEL

FIGURE 1
FOUR POINT BENDING FATIGUE
TEST BAR
L = 6 f - 0 3 0 INCH H = 1 . 1 0 0 f - 0 0 1 INCH D = 0.850 f . 0 0 1 INCH W = 0 .750 f , 0 0 1 INCH R = 0.300 2 . 0 0 1 INCH
ALL SIDES SQUARE WITHIN 0 . 0 0 0 5 INCH

F I G U R E 2 I D E A L I Z E D LOCATION
O F S I N G L E TOOTH BENDING F A T 1 GUE SAMPLE

STEEL DRTR RND SRHPLE LOCUTIONS -
SRHPLE LOCRTI ON SRHPLES -STEEL PRACTICE- BRR THROUGH- PER
RLLOY STEEL HERT INGOT CONTINUOUS STOCK ONE HRLF RING GERR OUT CROSS SRE GRADE CODES SOURCE NUHBER CAST CRST S I Z E RROI US 0 . D . FORGING SECT1 ON SECT1 ON
PRELI H I NRRY I CONFI RHRTI ON SRHPLES SOURCE 1 SOURCE 1 SOURCE 2 SOlJRCE 2 SOURCE 2
SOURCE 3 SOURCE 3 SOlJRCE 3
SOURCE 4 SOURCE 5
SOURCE 6 SOURCE 6 SOURCE 6
SOURCE 4 SOURCE 4 SOURCE 4
SOURCE 12
SOlJRCE 7 SOURCE 7 SOURCE 7 SOURCE 8 SOURCE 9 SOURCE 1 0 SOURCE 11 SOURCE 4
X 140 nn RCS X FORGING
X 1YO nn RCS X 140 nn RCS X FORGING
1 0 WFORGI NG
1 0 8
5 1 F ORFI NG 8 6 2 2 P 1 8 6 2 2 PF, PFX
PS- 16 IJ , UX PS- 16 IJ 1, IJ 1% PS- 16 IJF , UFX
X 152 nn RCS X 152 nn RCS X FORGING
5 9 nn RND 1 0 2 nn RCS
94B 1 7 N, NX 94B 1 7 NF, NFX 9 4 8 1 7 S, SX
I 4 0 nn RCS FORGING 5 9 nn RND
PS- 1 9 R,RX PS- 1 9 H, HX PS- 1 9 HF, HFX
5 9 nn RND I 4 0 nn RCS
FORGING
4 3 2 0 H I D HRRD F 2 X 1 4 0 nn RCS
DESI GNEO X X X X X x X X
EXPERIHENT SRHPLES 1 6 5 nn RCS 1 4 0 nn RCS
8 9 nn RND 8 9 nn RND 9 2 nn RND
152 nn RCS 6 7 nn RND 7 3 nn RND
8 6 1 5 J PS- 15 K
8 6 2 7 I PS- 1 8 G
4 3 2 0 LOU HRRD C 4 3 2 0 HIGH HRRD B
9 4 0 1 7 F PS- 1 9 L
2. O.D. SRHPLES CUT U I T H NOTCH TO THE 0.0. 3. ONE HRLF RADIUS SRHPLES CUT U I T H THE NOTCH ROOT RT ONE MRLF RRDIUS DEPTH 4. RING GERR FORGING SRHPLES CUT U I T H NOTCH RT RPPROX THE SRHE DEPTH RND ORIENTRTION RS GERR TOOTH ROOT 5. NONE OF THE SRHPLES MERE GRIT BLASTED FOLLOUING CRRBURIZING 6. RLL SRHPLES CODED U I T H X SUFFIX HERE CRRBURIZED TO 1.5 nn TOTRL CASE DEPTH; RLL OTHERS 2.3 nn ON
PRELIHINRRY RND CONFIRHRTION SRHPLES CHEHICRL RNRLYSES <PERCENT > L.LX.LF,LFX P,Pl,PF,PFX iJ.UX.IIl.U1X.UF.UFX
STRESS SRnPLE CODE LEVEL
FORGED ROLLED CHPa?
LFX LX 9 5 1
L F L 9 5 1
L F L 1255
PF P 9 5 1
PF P 1255
UFX UX 9 5 1
UFX UX 1255
UF U 9 5 1
UF U 1255
NFX NX 9 5 1
NFX NX 1255
NF N 9 5 1
NF N 1255
TABLE 3 FORGED ROLLED SRHPLE COHPRRISON
CYCLE L I F E TO CRACK I N I T I A T I O N
SAMPLE POPULRTI ON CONSTRNTS STRTI ST1 CRL COHPRRI SON
1.5 nn INGOT 8 6 2 2 SIGNIFICRNT OIFFERENCE R r -
5% RISK 2.3 nn INGOT 8 6 2 2 SIGNIFICRNT DIFFERENCE AT
25% RISK 2.3 nn INGOT 8 6 2 2 NO SIGNIFICRNT DIFFERENCE
AT 5% RISK 2.3 nn STRRND 8 6 2 2 SIGNIFICRNT DIFFERENCE RT
5% RISK 2.3 nn STRRNO 8 6 2 2 SIGNIFICRNT OIFFERENCE RT
25% RISK, NONE RT 5%
1.5 nn STRRNO P S I 6 SIGNIFICRNT DIFFERENCE RT 10% RISK
1.5 nn STRAND P S I 6 NO SIGNIFICRNT DIFFERENCE RT 5% RISK
2.3 nn STRRND P S I 6 NO SIGNIFICRNT DIFFERENCE RT 5% RISK
2.3 nn STRRND P S I 6 SIGNIFICRNT DIFFERENCE RT 25% RISK
1.5 nn INGOT 94817 SIGNIFICRNT OIFFERENCE R r > 10% RISK
1.5 nn INGOT 9 4 8 1 7 SIGNIFICANT DIFFERENCE RT 25% RISK
2.3 nn INGOT 94817 SIGNIFICRNT DIFFERENCE AT 25% RISK
2.3 nn INGOT 9 4 0 1 7 SIGNIFICRNT DIFFERENCE RT 25% RISK, NONE RT 5%
1.5 nn INGOT P S I 9 NO S I t N I F I C R N r DIFFERENCE RT 25% RISK
2.3 nn INGOT P S I 9 SIGNIFICRNT OIFFERENCE RT 10% RISK
2.3 nn INGOT P S I 9 NO SIGNIFICANT OIFFERENCE AT 25% RISK
0 5 0 L I F E CCYCLES> NlJHBER
FORGED ROLLED OF SRHPLES
~2 0 0 0 oon 110 ooo s Y
3 1 8 0 0 2 4 0 0 0 5 3
3 5 5 000 1 0 7 0 0 0 5 4
23 8 0 0 1 9 2 0 0 5 5

K 0 G O 0 "1 LO 0 0 m G t - Ct 0 0
W c . i d - r n j \ D d U d O LO C? N
m d 0 Li v O O * 0 m 0 C ) L I ) o
W o m - L n LL K H K C' - In 14 J (r 0 9 - P - N 0 t-
Ln
-- 0 U Lnv 0 0 0 0 0 0 m u n z G E g 2 Z LL a
H K j C n m j m m J j m *
I- C w a u L'
Z W W W U U K Z Z W W W L L K L Y L L W W H L L X L Y D LL m LL U)
C W a u
L W W 0 IY Z W W LL K L L Y W nLO L L X O H L U ) K H H I- CI)KZA'
u Ln C ,\' U N Z L i ) n a N k C U H U H 2 LL (3 H H z LO a H 0 LO z
C C C C a a a u
rl
K K K r r K
m L O J h W W U K IS to C W X LO J v
K n W C 0 0 O O U ) U 9 - U
*LY
X X K K K K

TABLE 7
INDIVIDUAL SAMPLE DATA DESIGNED EXPERIMENT
TRIAL #
10 30 7 12 24 24 32 22 15 4 2 27 19 5 5 25 17 17 13 18 31 8 16 28 23 3
11 14 26 20 20 21
9 6 1 1
29
UNIQUE BAR #
IlORI F30RI G7A I1 2RI K240 K24A F32RI K22A L15 B4A B20 5270 C19RI G5RI G5A J25A C17RI C17A L13A C180 F310 G80 L16RI J28RI K23RI B3RI Ill0 L14A J26A C20A C20B K21A I90 G6A BlRI BlA
F290
ALLOY LEVEL
8627 94B17 PS-18 8627
PS-15 PS-15 94B17 PS- 15 PS- 19
4320 HIGH 4320 HIGH
8615 4320 LOW PS-18 PS-18 8615
4320 LOW 4320 LOW PS-19
4320 LOW 94B17 PS-18 PS-19 8615
PS-15 4320 HIGH
8627 PS-19 8615
4320 LOW 4320 LOW PS-15 8627
PS-18 4320 HIGH 4320 HIGH 94B17
MAX CONTROL LOAD (kN)
54.4 54.6 54.6 54.3 54.9 54.9 54.3 55.0 55.3 55.0 55.2 54.9 54.4 54.3 54.3 55.0 54.2 54.2 55.0 55.1 55.1 55.1 54.3 54.2 54.6 54.2 55.3 54.5 54.3 55.0 55.0 54.6 55.0 55.0 54.4 54.2 55.1
CYCLES TO CRACK INITIATION
41 472 27 607 36 083 60 838
NO FAILURE NO FAILURE
14 134 1 116 8 942 95 650
550 20 337 35 335
NO FAILURE NO FAILURE
575 NO FAILURE NO FAILURE
1 615 2 993 13 888 139 455 87 763 18 130 47 243 57 813
847 28 614 14 979
NO FAILURE NO FAILURE
154 970 80
580 356 NO FAILURE
6 125

TRBLE 8 1.5 nn AND 2.3 nn TOTRL CRSE DEPTH COHPRRISON
STRESS SRHPLE CODE LEUEL
1.5 nn 2.3 nn CHPa?
LX L 9 5 1
LX L 1255
LFX L F 9 5 1
PFX PF 9 5 1
PFX PF 1255
UX U 9 5 1
UX U 1255
U 1X u 1 9 5 1
U 1% U 1 1 2 5 5
UFX UF 9 5 1
UFX UF 1255
NX N 9 5 1
NX N 1255
NFX NF 9 5 1
NFX NF 1255
SX S 9 5 1
S X S 1 2 5 5
CYCLE L I F E TO CRRCK I N I T I A T I O N
SRHPLE POPULRTION CONSTRNTS STRTI ST1 CRL COHPRRI SON
INGOT 1 4 0 nn OD 9 6 2 2 NO SIGNIFICRNT DIFFERENCE AT <5% R ISK
INGOT 1 4 0 nn OD 8 6 2 2 SIGNIFICRNT DIFFERENCE AT 25% R I S K
INGOT FORGING 8 6 2 2 S I GNI F I CRNT DIFFERENCE AT 5% R I S K
STRAND FORGING 9 6 2 2 NO S I GNI F I CRNT DIFFERENCE RT <5% RISK
STRRND FORGING 962% S I G N I F I CRNT 0 1 FFERENCE RT 10% RISK
8 5 0 L I F E CCYCLES? NUHBER
1.5 nn 2.3 nn OF SRHPLES
3 9 4 0 0 4 4 'to0 5 5
STRAND 1 5 2 nn OD P S l 6 NO SIGNIFICRNT DIFFERENCE 5Y 7 0 0 8 0 3 0 0 6 Y RT 5 % RISK
STRAND 1 5 2 nn OD P S l G SIGNIFICRNT DIFFERENCE RT 12 700 9 5YO Y 5 25% RISK
STRRND 1 5 2 nn 1/2R P S l 6 NO SIGNIFICANT DIFFERENCE 5 9 0 0 0 4 8 4 0 0 5 4 -
RT 5% RISK STRRND 1 5 2 nn 1/2R P S I 6 NO SIGNIFICANT DIFFERENCE 4 3 8 0 8 0 9 0 4 6
RT 10% RISK STRRND FORGING PS 16 S IGNIF ICANr DIFFERENCE RT 9 0 2 0 0 8 2 6 0 0 5 Y
25% R ISK STRAND FORGING PS 16 NO S I GNI F I CRNT DIFFERENCE 12 7 0 0 1 2 0 0 0 4 4
RT <5% R ISK
INGOT 5 9 nn 9 6 2 7 SIGNIFICRNT DIFFERENCE RT 13 6 0 0 1 0 0 0 0 't 4 25% R ISK
INGOT 1 0 2 nn OD 8 6 2 9 NO SIGNIFICRNT DIFFERENCE 1 5 8 0 0 16 7 0 0 5 5 RT 10% RISK
INGOT 1Y0 nn OD 9 4 0 1 7 NO SIGNIFICANT DIFFERENCE 1 1 0 0 0 0 107 0 0 0 4 4 RT 45% RISK
INGOT 1 4 0 nn OD 9 4 0 1 7 NO SIGNIFICRNT DIFFERENCE 2Y 000 19 2 0 0 3 5 RT 45% RISK
INGOT FORGING 9 Y B l 7 S I F N I F I C R N r DIFFERENCE RT > 2 0 0 0 000 355 000 5 C
25% RISK. NONE RT 5% I NGOT FORGING 9 4 8 17 NO S I G N I F I CRNT DIFFERENCE 3 1 8 0 0 2 3 8 0 0 5 5
RT 5% RISK INGOT 5 9 nn 9 W 1 7 NO SIGNIFICRNT DIFFERENCE >l 6 2 4 6 0 5 >2 0 0 0 0 0 0 5 5
RT 10% R ISK INGOT 5 9 nn 9 Y B l T NO SIGNIFICRNT DIFFERENCE 3 0 4 0 0 'to 0 0 0 4 5
RT 5 % RISK
I NGOT 5 9 nn P S I 9 NO SIGNIFICANT DIFFERENCE >2 0 0 0 0 0 0 >1 7 7 5 156 Y 4 RT 6% RISK
INGOT 5 9 nn P S I 9 SIGNIFICRNT DIFFERENCE RT 4 1 5 0 0 2 6 5 0 0 5 4 10% RISK
INGOT 1 4 0 nn OD P S I 9 NO SIGNIFICANT DIFFERENCE 3 3 9 0 0 0 1 0 6 0 0 0 6 Y RT 5% RISK
INGOT 1Y0 nn OD P S I 9 SIGNIFICANT DIFFERENCE RT 5 4 3 0 0 2 1 TOO 5 Y 5% R ISK
INGOT FORGING P S I 9 NO SIGNIFICRNT DIFFERENCE 2 6 6 0 0 0 31% 0 0 0 5 5 RT 10% RISK

W W W L\ LJ u Z Z Z W W W K C L U W W W L L L L L L LL L L Y L L X U Y H V ) U V ) n m n 8 + n u C E C ~ C ~ z Z N z I\' a ,yaoaa
n n n n n n n z z z z z z z u a a u a a a C C C C C C C
0 0 0 0 0 0 0 c y ( Y K u u K u C C C C C C C
( 3 w w 0 ( 3 ( 3 ( 3 U J V ) V ) V ) V ) V ) V )
Z Z Z Z Z Z Z H U H H U U H
X X ' + c ' L L L L L L L
X X X
2 3 2 3 2 3 3 L L L L L L s J = s s s r r
N N N N N N N N C J C J N N N N
N M N P J N N N
G ' u J u J U l u J \ D \ D N N N N C U N N
a , w w m w m w \ D a u 7 \ D \ D \ D \ D w a , m m w m m

PRGE 2
SRHPLE STEEL CODE GRADE
L X 0 6 2 2
L X 0 6 2 2
L 8 6 2 2
L 8 6 2 2
LFX 0 6 2 2
L F 0 6 2 2
L F 8 6 2 2
SRHPLE STEEL CODE GRRDE
NX 9'tB 1 7
NX 9 9 0 1 7
N 9 W 1 7
N 9 ' t B l i
NFX 9 9 0 1 7
NF 9 ' tB17
N F 9 9 0 1 7
RX P S I 9 SX 9'tB 1 7
RX P S I 9 SX 7'tB 1 7
R P S I 9 S 9'tB 1 7
R P S I 9 S 9YB17
HFX P S I 9 NFX 9 4 8 1 7
HF P S I 9 NF 9'tB 1 7
HF P S I 9 NF 998 1 7
STRESS LEVEL <HPa>
TRBLE 9 CCONTINUED? SRE STEEL GRRDE COHPRRISON
CYCLE L I F E TO CRRCK I N I T I R T I O N 8 5 0
SRHPLE POPULRTION L I F E CCYCLES) NUHBER CONSTANTS S r R T I S T I CAL COHPRRISON GRRDE 1 GRRDE 2 OF SRHPLES
INGOT 1.5 nn 1 9 0 nn OD SIGNIFICRNT DIFFERENCE RT 5't 0 0 0 1 1 0 0 0 0 5 't 5 % R I S K
INGOT 1.5 nn I S 0 nn OD SIGNIFICANT DIFFERENCE RT 5 9 7 0 2% 0 0 0 3 3 5 % R I S K
INGOT 2.3 nn l ' t 0 nn OD NO SIGNIF ICANT DIFFERENCE 6 6 2 0 0 1 0 7 0 0 0 't 't RT <5% R I S K
INGOT 2.3 nn 1 9 0 n n 00 SIGNIFICHNT DIFFERENCE RT 7 S't0 1 9 2 0 0 't 5 5 % R I S K
INGOT 1.5 nn FORGING S I GNI FICRNT D I FFERENCE RT 9% 9 0 0 > 2 0 0 0 0 0 0 5 5 5% R I S K
INGOT 2.3 nn FORGING SIGNIF ICRNT DIFFEREMCE RT 't't ' to0 3 5 5 0 0 0 5 5 5% R I S K
INGOT 2.3 nn FORGING S I GNI FICRNT DIFFERENCE RT 6 6 1 0 2 3 8 0 0 4 5 5 % R I S K
INGOT 1.5 nn 5 9 nn SIGNIFICRNT DIFFERENCE RT 5 0 5 0 0 >2 0 0 0 0 0 0 't 4 10% R I S K
INGOT 1.5 nn 5 9 nn SIGN1 FICRNT DIFFERENCE AT 1 3 6 0 0 ' t l 5 0 0 't C
5 % R I S K INGOT 2.3 nn 5 9 nn S I GNI FICRNT D I FFERENCE RT 1 0 0 0 0 2 6 5 0 0 't 4
5 % R I S K INGOT 1.5 nn 102-1YO nn OD SIGNIFICHNT DIFFERENCE RT 1 5 0 0 0 5't 3 0 0 5 5
5 % R I S K INGOT 2.3 nn 102-190 nn 0 0 SIGNIF ICANT DIFFERENCE RT 1 6 7 0 0 2 1 7 0 0 5 't
2 5 % R I S K
INGOT 1.5 nn 5 9 nn SIGNIFICRNT DIFFERENCE RT 5 0 5 0 0 21 6 2 % 6 0 5 4 5 10% R I S K
INGOT 1.5 nn 5 9 nn S I GNIFICRNT DIFFERENCE RT 1 3 6 0 0 3 0 'to0 't 't 5% R I S K
1 1 4 ~ 0 ~ 2.3 nn 5 9 nn SIGNIFICHNT DIFFERENCE RT 10 000 ~ t 0 0 0 0 4 C1
5 % R I S K
INGOT 1.5 nn 5 9 nn NO SIGNIFICRNT DIFFERENCE 2 2 0 0 0 0 0 0 >l 62't 6 0 5 't 5 A T 5 % R I S K
INGOT 1.5 nn 5 9 nn S I GI41 F I CHNT DIFFERENCE RT ' t l 5 0 0 3 0 ' to0 5 't 10% RISK
INGOT 2.3 nn 5 9 nn NO SIGNIFICRNT DIFFERENCE >1 7 7 5 1 5 6 > 2 0 0 0 0 0 0 't 5 RT 5% R I S K
INGOT 2.3 nn 5 9 nn NO S I GNI F I CRNT DIFFERENCE 2 6 5 0 0 'to 0 0 0 't 5 RT <5% R I S K
INGOT 1.5 nn FORGING SIGNIF ICRNT DIFFERENCE AT 2 6 6 0 0 0 2 2 0 0 0 0 0 0 5 5 10% R I S K
INGOT 2.3 nn FORGING NO SIGN1 F I CRNT DIFFERENCE 31't 0 0 0 3 5 5 0 0 0 5 5 RT 10% R I S K
INGOT 2.3 nn FORGING NO S I GNIFICRNT D I FFERENCE 2 5 5 0 0 2 3 8 0 0 't 5 AT 1 0 2 R I S K Ul
rU 0 Ln W W