Embed Size (px)
Citation preview

HAL Id: hal-01182107https://hal.archives-ouvertes.fr/hal-01182107
Submitted on 7 Nov 2017
HAL is a multi-disciplinary open accessarchive for the deposit and dissemination of sci-entific research documents, whether they are pub-lished or not. The documents may come fromteaching and research institutions in France orabroad, or from public or private research centers.
L’archive ouverte pluridisciplinaire HAL, estdestinée au dépôt et à la diffusion de documentsscientifiques de niveau recherche, publiés ou non,émanant des établissements d’enseignement et derecherche français ou étrangers, des laboratoirespublics ou privés.
Benchmarking of wildland fire color segmentationalgorithms
T Toulouse, Lucile Rossi, M Akhloufi, T Celik, Xavier Maldague
To cite this version:T Toulouse, Lucile Rossi, M Akhloufi, T Celik, Xavier Maldague. Benchmarking of wildland fire colorsegmentation algorithms. IET Image Processing, Institution of Engineering and Technology, 2015, 9(12), pp.1064-1072. �10.1049/iet-ipr.2014.0935�. �hal-01182107�

Benchmarking of wildland fire color segmentation algorithms
T. Toulousea,b, L. Rossia, M. Akhloufib,c, T. Celikd, X. Maldagueb
aUMR CNRS 6134 SPE, University of Corsica, 20250 Corte, France
bElectrical and Computer Engineering, Laval University, Quebec, QC, G1V0A6 Canada
cDepartment of Electronics Engineering, Universidad Tecnica Federico Santa Maria,
Valparaso, Chile
dSchool of Computer Science, University of the Witwatersrand,
Johannesburg, South Africa
{lrossi, toulouse}@univ-corse.fr
This paper is a postprint of a paper submitted to and accepted for publication in IET
Image Processing (doi: 10.1049/iet-ipr.2014.0935) and is subject to Institution of Engineering
and Technology Copyright. The copy of record is available at IET Digital Library.
Abstract
Recently, computer vision-based methods have started to replace conventional sensor
based fire detection technologies. In general, visible band image sequences are used to
automatically detect suspicious fire events in indoor or outdoor environments. There are
several methods which aim to achieve automatic fire detection on visible band images,
however, it is difficult to identify which method is the best performing as there is no fire
image dataset which can be used to test the different methods. This paper presents a
benchmarking of state of the art wildland fire color segmentation algorithms using a new
1

fire dataset introduced for the first time in this paper. The dataset contains images of
wildland fire in different contexts (fuel, background, luminosity, smoke). All images of the
dataset are characterized according to the principal color of the fire, the luminosity and
the presence of smoke in the fire area. With this characterization, it has been possible to
determine on which kind of images each algorithm is efficient. Also a new probabilistic
fire segmentation algorithm is introduced and compared to the other techniques. Bench-
marking is performed in order to assess performances of twelve algorithms that can be
used for the segmentation of wildland fire images.
1 Introduction
In Europe, up to 10,000 km2 of vegetation are burned by fire each year. In North America and
Russia it is up to 100,000 km2 [1]. More recently new events provide examples of disasters
caused by fires: in June 2013 in Arizona (United States of America), 19 firefighters were
killed and 100 houses were burned by a wildfire. In August 2013, a forest fire in the state of
California caused significant damage to more than 111 structures and has burned 1,042 km2
of land. The cost of fire fighting was estimated to $ 127.35 million [1].
Forest fires are a major risk in many countries around the world. They cause environmen-
tal damage, deforestation, desertification, air pollution, (CO2 emissions into the atmosphere
which represent 20% of total emissions, recirculation of heavy metals and radionuclides), eco-
nomic losses (destruction of housing and production facilities including forest fighter material
losses) and loss of lives.
The fight against this major risk is more effective when it is possible to detect its early
departure and to anticipate the fire behavior over time and especially its position and its
intensity. In order to develop fire behavior models and to improve them, it is necessary to
have experimental data that characterize the fire propagation [2, 3, 4]. Information like the
position, rate of spread, height, inclination, surface and volume are important characteristics
2

[5]. In recent years, we assist to an increasing interest to develop remote techniques based on
computer vision to detect and characterize wildland fires.
The first and most important step for computer vision processing is the image segmen-
tation process because it determines the accuracy of the following steps. The wildland fires
segmentation is non trivial, for example we can see the following problems: the background is
different for each fire and can be complex, the luminosity can change during a fire propagation,
the color of the fire varies from yellow to red and smoke with different degree of transparency
can be present.
In the area of fire detection, different algorithms were proposed in order to detect fire in
images or video sequences [6]; the result of these detections are a decision about the presence
of the fire in the image. These algorithms are not suitable for a precise segmentation of the
fire. In a metrology purpose, it is important to find the most effective and robust wildland
fire segmentation algorithm. Fire segmentation algorithms use color criteria in different color
spaces: RGB [7, 8, 9, 10, 11], Y CbCr [12, 13], Y UV [14], L∗a∗b∗ [15], HSI [16], HSV
[17] or combination of different color spaces [18, 19]. In the case of fire detection in video
sequences, some methods use background extraction [12], flicker analysis [8], or shape analysis
[17]. In this paper, we emphasize on color segmentation methods often used as a first step
in the fire segmentation process. In this work, eleven state of the art color segmentation
methods [7, 9, 10, 11, 12, 13, 15, 16, 18, 19, 20] used to extract wildfire regions has been
selected. Also, a new color segmentation algorithm is proposed and compared with the above
algorithms. Past works were proposed in order to evaluate the performance of some algorithms
[11, 13, 21, 22]. These works were conducted using different datasets, and did not take into
account fire characterization as proposed in our work. In this paper, the performances of the
selected segmentation algorithms on a characterized dataset containing one hundred wildland
fire images are presented. Main contributions of this paper are: a new wildland fire dataset
3

with various contexts and its fire segmentation ground truth, a categorization of this dataset
using different characteristics (smoke, color, etc.), a new probabilistic approach for wildland
fire segmentation using color vision, a benchmarking of the state of the art fire segmentation
methods present in the literature, and a benchmarking website for testing new developed fire
segmentation algorithms.
The paper is organized as follow: Section 2 presents the color segmentation algorithms,
section 3 describes the four criteria for benchmarking, section 4 presents the image dataset and
the image characterization methods, section 5 presents the evaluation results and comparison
of the wildland fire segmentation methods, finally, section 6 gives the conclusions.
2 Fire segmentation methods
In this section, twelve methods of fire color segmentation in the visible spectrum are intro-
duced. In order to automatically detect fire in visible band images, different color spaces have
been used as can be seen in Table 1. In this section, the methods are presented according to
the working color space of the segmentation. In the following, I represents an input image,
I (x) is the image pixel localized at spatial location (x) and Ic (x) represents the pixel of
channel c of the corresponding color space.
Table 1: Color spaces of the 12 compared segmentationsRGB Y CbCr HSI Y UV L∗a∗b∗
Phillips et al. 2002 [7]√
Chen et al. 2004 [18]√ √
Horng et al. 2005 [16]√
Celik et al. 2007 [9]√
Celik and Demirel 2009 [12]√
Ko et al. 2009 [10]√
Rossi and Akhloufi 2010 [19]√ √
Chitade and Katiyar 2010 [20]√
Celik 2010 [15]√
Collumeau et al. 2011 [11]√
Rudz et al. 2013 [13]√ √
The proposed bayesian fire detection√
4

2.1 RGB color space segmentation
Phillips et al. [7] use a training dataset composed of manually labeled data. A look up table
is created from a 3D Gaussian smoothing histogram (256× 256× 256) of the training images.
The Gaussian smoothing histogram is computed for the RGB color space as follows: for each
fire pixel of the image, a 3D Gaussian distribution with a standard deviation σ = 2 is added
to the color histogram centered in the pixel (R,G,B) value and for each background pixel a
3D Gaussian distribution with σ = 1 is subtracted from the color histogram. The Gaussian
smoothing histogram is computed for each image of the training dataset, and the look up table
is created from these histograms. Then a threshold is chosen to classify a pixel into fire pixel
or non-fire pixel according to the value of the look up table on the coordinate corresponding
to the (R,G,B) pixel value.
Celik et al. [9] use 150 fire images collected from Internet to generate a set of rules in RGB
color space. A pixel (x) is considered as a fire pixel if the following conditions are satisfied:
IR (x) > RMean;
IR (x) > IG (x) > IB (x) ;
0.25 ≤ IG (x)
IR (x) + 1≤ 0.65;
0.05 ≤ IB (x)
IR (x) + 1≤ 0.45;
0.20 ≤ IB (x)
IG (x) + 1≤ 0.60,
(1)
where RMean is the mean of the red channel values of all the image pixels: RMean =
1
N
∑x∈I IR(x), with N the number of pixels in the image.
Ko et al. [10] propose the use of a Gaussian probability distribution of each channel in
RGB color space:
5

pc (Ic (x)) =1√
2πσ2cexp
(−(Ic (x)− µc)2
2σ2c
)(2)
where µc and σc are respectively the mean and the standard deviation of channel c ∈
{R,G,B} of fire pixels. In [10], these parameters are computed using 100 images of dynamic
fires captured from 10 video sequences. Using Eq. (2), the total probability that a pixel (x)
is a fire pixel is computed as the product of the probability pc of each RGB channel:
pf (x) =∏
c∈{R,G,B}
pc (Ic (x)) (3)
Using the above equation, a pixel (x) is classified as fire if pf (x) ≥ τ , where τ is a threshold
value. In [10], there is no information about how the value of τ is selected. The value used in
this paper and its computation is specified in section 5
A method using Support Vector Machines (SVM) classifier on the RGB color space has
been developed by Collumeau et al. [11]. The authors use a set of 12000 training pixels,
labeled as fire or non-fire. Scattered false positives are removed with a morphological opening
operator, applied to the SVM outputs. Then, in order to remove bright false positive pixels,
the intensity of segmented regions is analyzed. The mean of the intensity is computed for
these regions. In the regions where the mean of intensity is upper than a threshold τ , pixels
greater than the same threshold τ are removed from the segmentation. A threshold of 80% is
used by the authors.
2.2 Y CbCr color space segmentation
A set of rules in the Y CbCr color space is defined for a method proposed by Celik and Demirel
[12] in order to use the consistency in chromaticity representation. A pixel (x) must satisfy
6
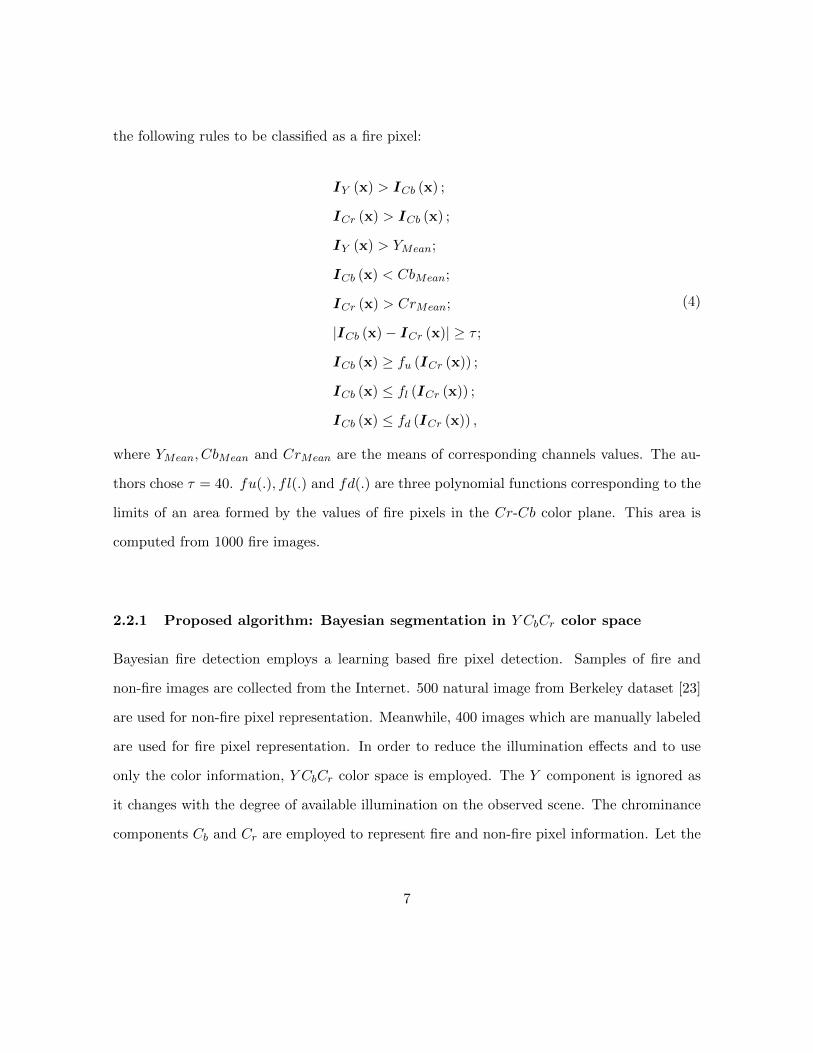
the following rules to be classified as a fire pixel:
IY (x) > ICb (x) ;
ICr (x) > ICb (x) ;
IY (x) > YMean;
ICb (x) < CbMean;
ICr (x) > CrMean;
|ICb (x)− ICr (x)| ≥ τ ;
ICb (x) ≥ fu (ICr (x)) ;
ICb (x) ≤ fl (ICr (x)) ;
ICb (x) ≤ fd (ICr (x)) ,
(4)
where YMean, CbMean and CrMean are the means of corresponding channels values. The au-
thors chose τ = 40. fu(.), f l(.) and fd(.) are three polynomial functions corresponding to the
limits of an area formed by the values of fire pixels in the Cr-Cb color plane. This area is
computed from 1000 fire images.
2.2.1 Proposed algorithm: Bayesian segmentation in Y CbCr color space
Bayesian fire detection employs a learning based fire pixel detection. Samples of fire and
non-fire images are collected from the Internet. 500 natural image from Berkeley dataset [23]
are used for non-fire pixel representation. Meanwhile, 400 images which are manually labeled
are used for fire pixel representation. In order to reduce the illumination effects and to use
only the color information, Y CbCr color space is employed. The Y component is ignored as
it changes with the degree of available illumination on the observed scene. The chrominance
components Cb and Cr are employed to represent fire and non-fire pixel information. Let the
7

measurement vector be M (x) = (Cb (x) , Cr (x)) for a pixel (x), Bayes’ theorem is used to
compute the conditional probabilities:
P (fire|M (x)) =P (M (x) |fire)P (fire)
P (M (x))(5)
and
P (non-fire|M (x)) =P (M (x) |nonfire)P (non-fire)
P (M (x))(6)
Using the conditional probabilities, a pixel x is classified as fire if the following condition is
satisfied
P (fire|M (x)) > P (non-fire|M (x)) (7)
which implies that
P (M (x) |fire)P (fire)
P (M (x))>P (M (x) |nonfire)P (non-fire)
P (M (x))(8)
and
P (M (x) |fire)P (fire) > P (M (x) |nonfire)P (non-fire) (9)
It is difficult to estimate P (fire) and P (non-fire), however, the ratio of them τ = P (fire)/P (non-fire)
is used as a design parameter, i.e.,
P (M (x) |fire)
P (M (x) |nonfire)>P (non-fire)
P (fire)= τ (10)
where τ = 1, which states that P (fire) = P (non-fire), is used. The conditional probabilities
P (M (x) |fire) and P (M (x) |non-fire) are estimated from 2D histograms of Cb and Cr color
channels. The fire and non-fire images of the training dataset are used to create 2D histograms
of Cb and Cr color channels to create a representation for fire and non-fire pixels.
8
The proposed Bayesian segmentation is a generic representation. It allows different repre-
sentations for the conditional probabilities, e.g, the measurement vector can be created from
features such as texture, gradient information and combinations of color spaces and multi-
variate Gaussian distribution, and can be used as generative model for conditional probability
representation of fire and non-fire pixels. The system’s performance can be improved by chang-
ing value of the parameter τ which is a ration of a priori probabilities for fire and non-fire
classes. This value can be adapted according to the environment conditions.
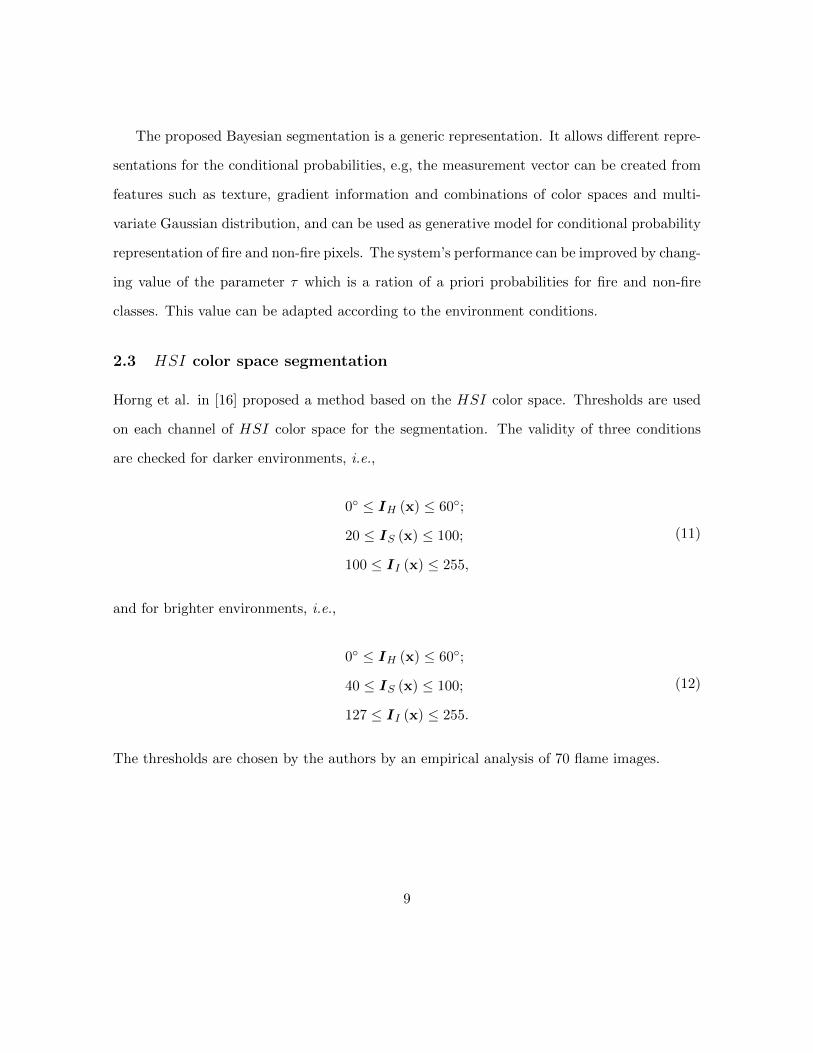
2.3 HSI color space segmentation
Horng et al. in [16] proposed a method based on the HSI color space. Thresholds are used
on each channel of HSI color space for the segmentation. The validity of three conditions
are checked for darker environments, i.e.,
0◦ ≤ IH (x) ≤ 60◦;
20 ≤ IS (x) ≤ 100;
100 ≤ II (x) ≤ 255,
(11)
and for brighter environments, i.e.,
0◦ ≤ IH (x) ≤ 60◦;
40 ≤ IS (x) ≤ 100;
127 ≤ II (x) ≤ 255.
(12)
The thresholds are chosen by the authors by an empirical analysis of 70 flame images.
9

2.4 L∗a∗b∗ color space segmentation
Chitade and Katiyar [20] have proposed a color segmentation for satellite image segmentation.
Rudz et al. [13] proposed to use this method for fire detection applications. A K-means clus-
tering is applied on the a∗ and b∗ channels with k clusters. The clusters are sorted according
to the mean of the a∗ and b∗ channels value of their centroid. For the fire segmentation a
number of 4 clusters is chosen and only the pixels of the cluster with the highest mean are
labeled as fire.
Celik [15] proposed a set of rules on the CIE L∗a∗b∗ color space to segment a fire. The
following rules must be satisfied to label the pixel (x) as a fire pixel.
IL∗ (x) ≥ L∗Mean;
Ia∗ (x) ≥ a∗Mean;
Ib∗ (x) ≥ b∗Mean;
Ib∗ (x) ≥ Ia∗ (x) ;
P (IL∗ (x) , Ia∗ (x) , Ib∗ (x)) ≥ τ.
(13)
where L∗Mean , a∗Mean and b∗Mean are the mean values of L∗, a∗ and b∗ color channels,
respectively, and P (IL∗ (x), Ia∗ (x), Ib∗ (x) ) is a joint probability that (IL∗ (x), Ia∗ (x),
Ib∗ (x)) is a fire pixel, and τ is a threshold. To compute the joint probability, the author
studied the correlation between L∗, a∗, and b∗ values of fire pixels using the histogram of fire
pixels. 500 manually labeled fire pixels are used to compute histograms of the 3 color planes
(L∗-a∗), (L∗-b∗) and (a∗-b∗) where channels L∗, a∗, and b∗ are quantized into 24 levels. From
each histogram it is deduced the probability of a color to be a fire color according to this value
in the two corresponding channels. τ is a threshold fixed to 0.005 using receiver operating
characteristic (ROC) analysis on the dataset.
10

2.5 Hybrid color space segmentation
Chen et al. [18] have developed a fast segmentation procedure that was used for fire detection
[24]. The method is based on R, G, B color channels and saturation (S) values. Three
conditions are checked to classify a pixel (x) as a fire pixel:
IR (x) ≥ IG (x) > IB (x) ;
IR (x) > RT ;
IS (x) ≥ (255− IR (x)) STRT.
(14)
where RT is a threshold on the R channel which must be between 115 to 135 and ST is a
threshold on the saturation which must be between 55 to 65.
Rossi and Akhloufi [19] use the channel V of Y UV system for segmenting the fire. They
used the K-means algorithm on the channel V to extract the regions corresponding to fire.
Here the number of classes k is 2 in order to differentiate fire regions from the background.
Considering the fact that the fire occupies the main extracted area from the channel V, the
authors propose a learning of RGB values of the image area to establish a reference model for
pixels classification. They propose the use of a 3D Gaussian model. Thus, the segmentation
condition is:
√(IR (x)−Rmean)2 + (IG (x)−Gmean)2 + (IB (x)−Bmean)2 ≤ tσ (15)
With t a constant, Rmean, Gmean, Bmean means of extracted area’s channels and σ = max(σR, σG, σB)
with σc the standard deviation of channel c of extracted area.
Cb channel of Y CbCr color space was chosen by Rudz et al. [13] in order to apply a
11

K-means clustering on the image. After this clustering, an improvement is made on the RGB
color space according to the size of the cluster to eliminate false pixels. For a large size of a
cluster, the following set of rules are used to detect the fire pixels, i.e.,
||histrefR − histR|| < τR;
||histrefG − histG|| < τG;
||histrefB − histB|| < τB.
(16)
where histrefc , histc and τc are respectively the reference histogram, the histogram of the
candidate pixels and the threshold in color channel c. Then, for a small size of a cluster, the
following rule set is used to detect the fire pixels:
||µrefR − µR|| < ρR σrefR ;
||µrefG − µG|| < ρG σrefG ;
||µrefB − µB|| < ρB σrefB .
(17)
where µrefc and σrefc are, respectively, the reference mean and the reference standard deviation
of fire pixels in the color channel c, µc is the mean of candidate fire pixels in the color channel
c, and ρc is a coefficient in the color channel c. In [13], histrefc , µrefc and σrefc are computed on
the third of the images of the dataset, randomly selected. The thresholds τR, τG, τB, ρR, ρG
and ρB are optimized to have the best segmentations on the same part of the dataset according
to the F-score (see section 3) using a direct pattern search method [25].
3 Evaluation criteria
In the field of image segmentation, there is few works on performance evaluation [26]. In order
to compare the performances of the segmentation methods, we can use standard metrics that
12

compare the segmented image to a manually segmented image (the ground truth). In this
study, 4 metrics are used to compare the color segmentation methods described in section
2. All these metrics are normalized so that the values are between 0 and 1 with the score 1
representing a perfect segmentation.
3.1 Matthews Correlation Coefficient (MCC)
Proposed by Matthews in [27] for a biochemical evaluation application, this metric is also used
for image segmentation evaluation, and more specifically for fire segmentation evaluation [11].
The Matthew correlation coefficient (MCC) is the geometric mean of the regression coefficient
and its dual. It is defined as follow:
MCC =(TP ∗ TN)− (FP ∗ FN)√
(TN + FN)(TN + FP )(TP + FN)(TP + FP )(18)
where TP, TN,FP and FN are respectively the number of true positives (true in the
segmentation and the ground truth), true negatives (false in the segmentation and the ground
truth), false positives (true in the segmentation and false in the ground truth) and false
negatives (false in the segmentation and true in the ground truth).
3.2 F1-Score (F1)
This metric (also named F-score) is mostly used in information retrieval [28] but has also
applications in image segmentation evaluation [11]. It involves two measures called precision
(Pr) and recall (Re) defined as follow:
Pr =TP
TP + FP,Re =
TP
TP + FN(19)
The F1-Score (F1) is the harmonic mean of precision and recall:
13

F1 = 2 ∗ Pr ∗RePr +Re
(20)
3.3 Hafiane quality index (HAF )
This criterion has been developed for fire segmentation evaluation [29]. It takes into ac-
count the position, shape and size of the segmented regions together with the under or over
segmentation. First a matching index is defined as follow:
M =1
Card(IS)
NRs∑j=1
Card(RGTi∗ ∩RS
j )× Card(RSj )
Card(RGTi∗ ∪RS
j )(21)
where NRS is the number of connected regions in the segmentation result IS . RSj is one of
these regions and RGTi∗ is the region in the reference image IGT that has the most important
overlapping surface with the RSj region. Then, in order to take into account the under or over
segmentation, another index is defined:
η =
NRGT /NRS if NRS ≥ NRGT
log(1 +NRS/NRGT ) otherwise(22)
The Hafiane (HAF ) quality index is given by the following equation:
HAF =M +m× η
1 +m(23)
where m is a weighting factor set to 0.5.
4 Image dataset
In order to benchmark algorithms and/or to test new ones, it is important to work with
databases that have a large number of characterized data. Publicly available databases are
14
particularly useful to research communities. For example the Bilkent University fire clip
dataset [30] provides fire and smoke video clips. Dyntex [31] is another one which provides
a diverse collection of high-quality texture videos. For each sequence, an XML-description
characterizing both its content, as well as the context in which it was recorded is available.
Wildland fire segmentation research is still young and so far no database suitable for this
research is available. In this paper, an image dataset of characterized outdoor vegetation
fire images is presented. For now, it is not downloadable for author right reason but a
website that allows to test algorithms on it is available. Octave/Matlab code are accepted
as input and produces benchmarking scores on the dataset. The website can be reached at
http://firetest.cs.wits.ac.za/benchmark/.
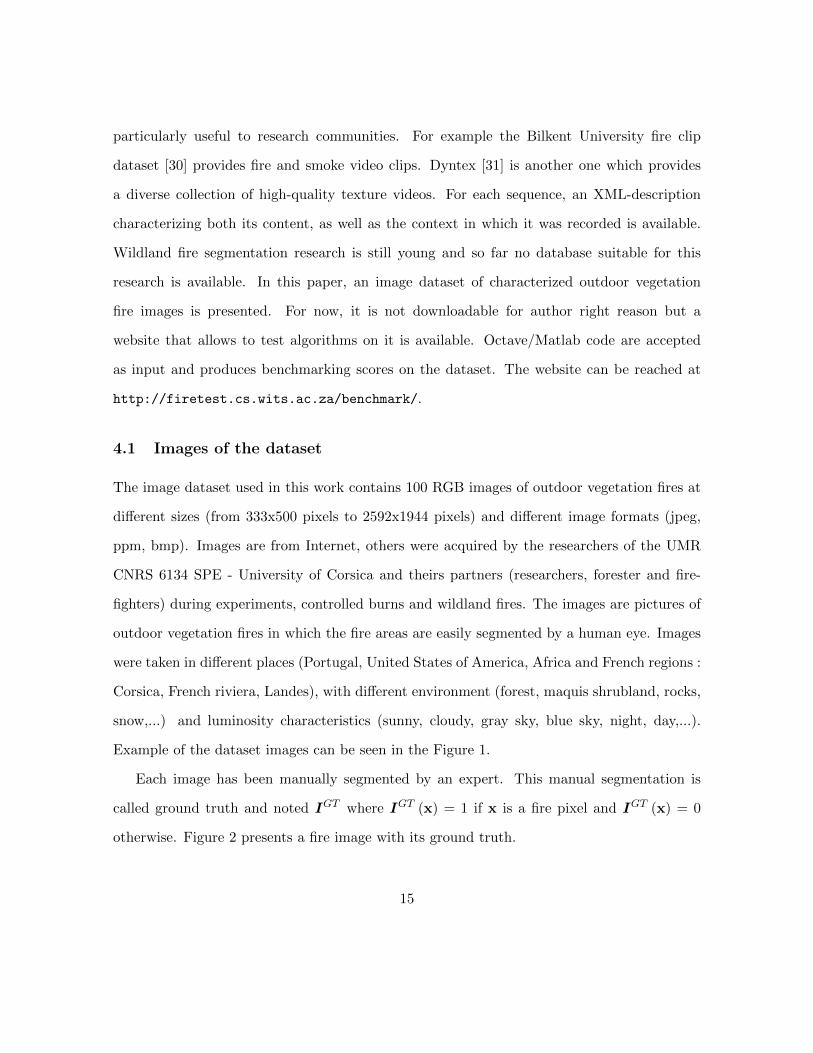
4.1 Images of the dataset
The image dataset used in this work contains 100 RGB images of outdoor vegetation fires at
different sizes (from 333x500 pixels to 2592x1944 pixels) and different image formats (jpeg,
ppm, bmp). Images are from Internet, others were acquired by the researchers of the UMR
CNRS 6134 SPE - University of Corsica and theirs partners (researchers, forester and fire-
fighters) during experiments, controlled burns and wildland fires. The images are pictures of
outdoor vegetation fires in which the fire areas are easily segmented by a human eye. Images
were taken in different places (Portugal, United States of America, Africa and French regions :
Corsica, French riviera, Landes), with different environment (forest, maquis shrubland, rocks,
snow,...) and luminosity characteristics (sunny, cloudy, gray sky, blue sky, night, day,...).
Example of the dataset images can be seen in the Figure 1.
Each image has been manually segmented by an expert. This manual segmentation is
called ground truth and noted IGT where IGT (x) = 1 if x is a fire pixel and IGT (x) = 0
otherwise. Figure 2 presents a fire image with its ground truth.
15

Figure 1: Example of the dataset images. Fires are in different locations, with different fuelsand different luminosity conditions.
(a) (b)
Figure 2: Original image (a) and its ground truth (b)
4.2 Image characterization
In each image of the dataset, the fire areas are used to characterize:
• the percentage of fire pixels present in the image;
• the dominant color of the fire;
• the presence of smoke;
16

• the light intensity of the environment.
Using these criteria, the images are then automatically classified. An example of this catego-
rization is shown in figure 3.
Figure 3: Fire ID
4.2.1 Color
In Zhao et al. [32], the authors propose to label fire pixels in three types of colors: red, orange
and white-yellow. In our work, pixels are labeled to one of these colors using the HSL color
space. The S channel gives information about color saturation of the pixel. If the saturation
is low, the pixel have no color (gray), so the first condition to verify for all the fire pixels is:
IS (x) ≥ 50 (24)
If equation (24) is not satisfied, the pixel x is labeled as “other color”. Else, if one of the two
following conditions are satisfied, the pixel is labeled as white-yellow:
IV (x) ≥ 200 (25)
17
42◦ < IH (x) ≤ 64◦ (26)
Where equation (25) corresponds to white colors and equation (26) corresponds to yellow
colors. Fire pixels are labeled as orange if equation (25) is false and if the following condition
is satisfied:
14◦ < IH (x) ≤ 42◦ (27)
And fire pixels are labeled red if equation (25) is false and if:
−57◦ < IH (x) ≤ 14◦ (28)
If none of these conditions are satisfied the pixel is labeled as “other color”. The thresholds
used in these conditions are defined empirically from our experiments and from the hue values
of the shade of colors [33].
For example, the fire in Figure 4 (a) is divided in 3 different colors in Figure 4 (b), (c) and
(d). To classify the color of the fire in each image, the predominant color is found with the
color ratio of fire pixels. As a majority of pixels are orange for the fire presented in Figure 4,
the fire is classified as orange.
4.2.2 Smoke
Smoke is the principal problem in color segmentation of fires. If dense smoke masks part of
the fire, it is impossible without other information to segment the hidden part. The image
dataset does not contain dense smoke images but images with thin smoke that are interesting
for wildland fire segmentation are present. To determine if there is slight smoke in front of the
fire, a learning has been done on fire pixels with and without smoke. Pixels of the images are
classified as “smoke” or “smokeless” using Support Vector Machines. If there is more than
1/2 of fire pixels which are classified as “smoke” then the image is classified as “with smoke”
18

(a) (b)
(c) (d)
Figure 4: Decomposition of color in a fire image: (a) fire image, (b) red pixels, (c) orangepixels, and (d) white-yellow pixels. This fire is composed of 31% of red pixels, 39% of orangepixels and 25% of withe-yellow pixels.
(see Figure 5).
(a) (b)
Figure 5: Examples of characterizations. (a) “smokeless” fire and (b) fire with smoke
19

4.2.3 Brightness of the environment
The scene can be characterized by the brightness of the environment. To estimate it, an
average of the channel I of HSI is computed using the background of the image. The considered
background is the complementary of the fire in the image (i.e. x ∈ I / GT (x) = 0). The
image is classified according to the value of this mean. Two thresholds are chosen empirically
from our experiments in order to classify the background brightness: τh = 45 and τ l = 20.
The environment is classified as “high intensity”, if the mean of the intensity of the background
is upper than τh. It is classified as “medium intensity”, if the mean of intensity is between
τh and τ l. It is classified as “low intensity” if the intensity is lower than τ l. (see Figure 6).
(a) (b) (c)
Figure 6: Environment classified with low intensity (a), medium intensity (b) high intensity(c)
These categorizations will help to have a more precise evaluation of the efficiency of the
color segmentation algorithms.
The images of the dataset proposed in this article were classified using the above criteria.Table
2 presents the results of this classification.
Table 2: Number of images of the dataset per category
Fire color SmokeEnvironmentintensity
Total
Red Orange White With Without Low medium High23 75 2 58 42 48 56 30 100
20

5 Benchmarking
The 12 fire color segmentation algorithms have been tested on the wildland fire image dataset.
For more consistency in the segmentation, the same post processing is applied on each method.
The post processing keeps the largest regions and fills these regions in order to remove false
positive pixels of the segmentation. The post processing improves segmentation results with-
out penalize the benchmarking process.
Some of the presented methods need to compute a threshold. Rudz et al. [13] propose
to compute these thresholds from a third of the images of the dataset taken randomly. The
value of the threshold that maximizes the F-score for these images is estimated with a direct
pattern search algorithm [25]. In this study, 33 images were chosen randomly from the dataset
keeping the same ratio for each category. This part of the dataset will be named the training
dataset.
The direct pattern search on the training dataset has been used to find thresholds for the
following methods: Phillips et al., Chen et al. Ko, Celik L∗a∗b∗ and Rudz et al.. For the
dataset proposed we obtain τ = −1.78×10⁻³ for Phillips method. For the color segmentation
method of Chen et al. [18] an analysis of the best value for RT and ST thresholds has been
done. The result of the direct pattern search gives RT = 115 and ST = 55 as the best
thresholds. A change of these values on the intervals proposed in [18] doesn’t impact much
the segmentation. Indeed the standard deviation of the false positive rate is 2 × 10⁻⁴ on
average and 2×10⁻³ for the standard deviation of true positive rate for the 231 combinations
of RT and ST . Thresholds of 1.46×10⁻⁵ for Ko’s method [10] and 0.02453 for Celik’s method
[15] have been found. For the color segmentation of Rudz [13], histrefR , histrefG and histrefB
were normalized in [0, 1]. The following thresholds were found: τR = 3.04, τG = 8.99, τB =
9, ρR = 0.75, ρG = 7 and ρB = 3. Values of τC are much smaller than the one proposed in the
reference article because of the histogram normalization.
21

The training dataset has been used for all the methods that need a set of training images
(i.e. Phillips et al., Ko et al., Celik (L∗a∗b∗), Collumeau et al. and Rudz et al.). The color
distribution of fire pixels on the 3 different color planes for Celik L∗a∗b∗, computed on the
training dataset, is shown in Figure 7.
(a) (b) (c)
Figure 7: Color distribution of fire pixels on (L∗, a∗) color plane (a), (L∗, b∗) color plane (b)and (a∗, b∗) color plane (c)
The fire areas segmented on four images of our dataset by the 12 methods presented in
this article are shown in Figure 8. It can be seen that depending of the color of the fire, the
fuel, the presence of smoke, the environement, the performance of the methods varies. The
twelve color segmentation methods were evaluated on the 100 images of the dataset using the
four evaluation scores presented in section 3. Table 3 presents the results according to the fire
color, the presence of smoke, and the environment. The two tables are organized as follow:
the first ten lines correspond to characteristics presented in section 4.2. “Red”, “Orange” and
“White” are the dominant color of the fire, “Smoke” indicates if smoke represents more than
10 % of the fire pixels. Three levels are used to characterize the intensity: low, medium and
high. The last line corresponds to the average of scores for the 100 images of the dataset. For
each line, best scores of the twelve methods are underlined. For the dataset presented in this
work, the methods of Phillips et al. and Collumeau et al. give the bests results. For these
methods, the categories that obtain highest scores correspond to the categories with more
22

images in the training dataset (“orange”, “medium intensity”). This is explained by the high
importance of the learning step in both methods. Indeed as the training dataset contains
few images with withe-yellow pixels, the images of fire with a majority of white-yellow pixel
obtain lower scores than for orange fire. The methods of Rossi and Akhloufi, Chitade and
Katiyar and the Bayesian color segmentation give good results and can be used for techniques
without prior learning. Results show that Rossi and Akhloufi segmentation is more robust to
smoke than the others methods. The method of Chen gives the best results for white-yellow
fires but has lower score for orange or red fires. The environment characterization shows that
this method works better with dark environments. So the Chen segmentation should be used
on night fire images. It can be noted that methods on the YCbCr color space are also more
efficient on night fire as their scores are better for dark environment and for white-yellow fires.
23

Table 3: Scores of fire segmentation methodsPhillips et al. [7] Chen et al. [18] Horng et al. [16]
MCC F1 HAF MCC F1 HAF MCC F1 HAF
Red 0.78 0.79 0.69 0.57 0.57 0.50 0.33 0.32 0.37Orange 0.82 0.83 0.76 0.59 0.61 0.58 0.11 0.15 0.21White 0.60 0.59 0.62 0.75 0.75 0.73 0.67 0.64 0.52Smoke 0.81 0.82 0.74 0.56 0.58 0.55 0.19 0.22 0.28Smokeless 0.81 0.81 0.79 0.73 0.73 0.68 0.07 0.06 0.10Very low I 0.75 0.76 0.74 0.75 0.75 0.73 0.09 0.04 0.07Medium I 0.82 0.82 0.74 0.60 0.61 0.57 0.14 0.17 0.26High I 0.82 0.83 0.75 0.49 0.52 0.49 0.26 0.32 0.33Average 0.81 0.82 0.75 0.59 0.60 0.57 0.17 0.20 0.25
Celik et al. [9] Celik and Demirel [12] Ko et al. [10]
MCC F1 HAF MCC F1 HAF MCC F1 HAF
Red 0.29 0.24 0.21 0.56 0.54 0.42 0.55 0.53 0.42Orange 0.47 0.44 0.33 0.62 0.64 0.56 0.46 0.44 0.36White 0.30 0.27 0.28 0.63 0.66 0.53 0.25 0.29 0.34Smoke 0.44 0.39 0.30 0.59 0.60 0.51 0.48 0.46 0.36Smokeless 0.39 0.35 0.26 0.73 0.74 0.64 0.47 0.47 0.41Very low I 0.31 0.28 0.23 0.62 0.63 0.54 0.46 0.42 0.38Medium I 0.45 0.42 0.32 0.64 0.66 0.57 0.51 0.48 0.33High I 0.45 0.39 0.29 0.53 0.54 0.45 0.51 0.48 0.33Average 0.43 0.39 0.30 0.61 0.62 0.53 0.48 0.46 0.37
Rossi and Akhloufi [19] Chitade and Katiyar [20] Celik [15]
MCC F1 HAF MCC F1 HAF MCC F1 HAF
Red 0.76 0.76 0.71 0.71 0.70 0.60 0.25 0.19 0.11Orange 0.75 0.76 0.70 0.73 0.74 0.66 0.43 0.41 0.29White 0.57 0.56 0.60 0.59 0.58 0.61 0.11 0.10 0.12Smoke 0.75 0.76 0.70 0.72 0.72 0.63 0.37 0.33 0.25Smokeless 0.75 0.77 0.73 0.76 0.78 0.73 0.48 0.45 0.24Very low I 0.69 0.73 0.71 0.73 0.75 0.73 0.39 0.36 0.20Medium I 0.76 0.76 0.71 0.73 0.73 0.65 0.38 0.35 0.26High I 0.76 0.77 0.69 0.70 0.70 0.60 0.39 0.34 0.25Average 0.75 0.76 0.70 0.72 0.73 0.64 0.38 0.35 0.25
Collumeau et al. [11] Rudz et al. [13] Bayesian segmentation
MCC F1 HAF MCC F1 HAF MCC F1 HAF
Red 0.74 0.73 0.66 0.53 0.49 0.43 0.66 0.64 0.53Orange 0.79 0.80 0.75 0.59 0.58 0.53 0.69 0.71 0.64White 0.72 0.72 0.71 0.64 0.67 0.56 0.69 0.69 0.69Smoke 0.77 0.77 0.72 0.55 0.54 0.49 0.64 0.65 0.58Smokeless 0.85 0.85 0.81 0.72 0.70 0.64 0.74 0.75 0.56Low I 0.73 0.74 0.70 0.59 0.59 0.53 0.73 0.74 0.70Medium I 0.79 0.79 0.74 0.60 0.58 0.54 0.70 0.71 0.63High I 0.78 0.79 0.73 0.53 0.51 0.45 0.63 0.64 0.54Average 0.78 0.78 0.73 0.58 0.56 0.51 0.69 0.69 0.61
24

Original image Phillips 2002 [7]Chen
2004 [18]
Horng
2005 [16]
Celik
2007 [9]
Celik
2009 [12]
Ko
2009 [10]
Original imageRossi
2010 [19]
Chitade
2010 [20]
Celik
2010 [15]
Collumeau
2011 [11]
Rudz
2013 [13]
Bayesian
2014
Figure 8: Result of the different methods of fire segmentation on 3 images of the dataset. Segmented images havebeen multiplied by the RGB images for a better visibility
25

6 Conclusion
In this work, eleven state of the art algorithms for wildland fire color segmentation were devel-
oped and their performances analyzed. Also a new algorithm based on Bayesian conditional
probability classification was proposed. Additionally, a new dataset was developed and a new
categorization approach was used in order to classify the available images in different mean-
ingful categories. A benchmarking of the twelve algorithms has been made on this dataset
using different standard metrics. The obtained results show that the proposed color segmenta-
tion techniques performance is dependent on the image category (lighting, predominant color,
smoke,...). The Collumeau et al. segmentation is best suited for day fires without smoke.
The Rossi and Akhloufi segmentation is robust to smoke, the method of Chitade and Katiyar
is robust to environment intensity changes and the Bayesian segmentation is robust to fire
color changes. The method of Chen et al. gives best results for white fire images. Since color
segmentation is often the first step in a fire segmentation process, this work helps to define
the choice of the best algorithm in an operational scenario. Finally, the developed dataset
and a benchmarking website were also developed in order to help the research community to
compare the performance of their new developed algorithms with the ones presented in this
paper in a categorized database. We are currently working on an online database containing a
large number of characterized visible and near infrared vegetation fire images and sequences.
References
[1] ’European forest fire information system’, http://forest.jrc.ec.europa.eu/effis/.
accessed April 2015.
[2] Grishin, A.M. and Albini, F.A.: ’Mathematical modeling of forest fires and new methods
of fighting them’ (Publishing house of the Tomsk state university, 1997)
26

[3] Balbi, J.H., Rossi, J.L., Marcelli, T., Chatelon, F.J.: ’Physical modeling of surface fire
under nonparallel wind and slope conditions’, Combustion Science and Technology, 2010,
182, (7), pp 922–939
[4] Santoni, P.A., Simeoni, A., Rossi, J.L., et al.: ’Instrumentation of wildland fire: charac-
terisation of a fire spreading through a Mediterranean shrub’, Fire Safety Journal, 2006,
41, (3), pp 171–184
[5] Rothermel, R.C. and Anderson, H.E.: ’Fire spread characteristics determined in the
laboratory’ (Intermountain Forest and Range Experiment Station, Forest Servcie, US
Department of Agriculture, 1966)
[6] Cetin, A.E., Dimitropoulos, K., Gouverneur, B., et al.: ’Video fire detection-review’,
Digital Signal Processing, 2013, 23, (6), pp 1827-1843
[7] Phillips III, W., Shah, M., da Vitoria Lobo, N.: ’Flame recognition in video’, Pattern
Recognition Letters, 2002, 23, (1), pp 319-327
[8] Toreyin, B.U., Dedeoglu, Y., Gudukbay, U., Cetin, A.E.: ’Computer vision based method
for real-time fire and flame detection’, Pattern Recognition Letters, 2006, 27, (1), pp 49-
58
[9] Celik, T., Demirel, H., Ozkaramanli, H., Uyguroglu, M.: ’Fire detection using statistical
color model in video sequences’, Journal of Visual Communication and Image Represen-
tation, 2007, 18, (2), pp 176-185, DOI: 10.1016/j.jvcir.2006.12.003
[10] Ko, B.C., Cheong, K.H., Nam, J.Y.: ’Fire detection based on vision sensor and support
vector machines’, Fire Safety Journal, 2009, 44, (3), pp 322-329
27

[11] Collumeau, J.F., Laurent, H., Hafiane, A., Chetehouna, K.: ’Fire scene segmentations
for forest fire characterization: A comparative study’, Proc. 18th IEEE International
Conference on Image Processing (ICIP), Sept. 2011 , pp. 2973-2976
[12] Celik, T., Demirel, H.: ’Fire detection in video sequences using a generic color model’,
Fire Safety Journal, 2009, 44, (2), pp 147-158
[13] Rudz, S., Chetehouna, K., Hafiane, A., Laurent, H., Sero-Guillaume, O.: ’Investigation
of a novel image segmentation method dedicated to forest fire applications’, Measurement
Science and Technology, 2013, 24, (7), pp 075403
[14] Marbach, G., Loepfe, M., Brupbacher, T.: ’An image processing technique for fire detec-
tion in video images’, Fire safety journal, 2006, 41, (4), pp 285–289
[15] Celik, T.: ’Fast and efficient method for fire detection using image processing’, ETRI
journal, 2010, 32, (6)
[16] Horng, W.B., Peng, J.W., Chen, C.Y.: ’A new image-based realtime flame detection
method using color analysis’, Proc. IEEE Networking, Sensing and Control, 2005, pp.
100-105
[17] Liu, C.B., Ahuja, N.: ’Vision based fire detection’, Proc. of the 17th International Con-
ference on Pattern Recognition (ICPR), 2004, 4, pp. 134-137
[18] Chen, T.H.,Wu, P.H., Chiou, Y.C.: ’An early fire-detection method based on image
processing’, Proc. International Conference on Image Processing, (ICIP), 2004, vol. 3,
pp. 1707-1710
[19] Rossi, L., Akhloufi, M., Tison Y.: ’Dynamic fire 3D modeling using a realtime stereovision
system’, Journal of Communication and Computer, 2010, 6, (10), pp. 54
28

[20] Chitade, A.Z. and Katiyar, S.K.: ’Colour based image segmentation using k-means clus-
tering’, International Journal of Engineering Science and Technology, 2010, 2, (10), pp.
5319–5325
[21] Rudz, S., Chetehouna, K., Hafiane, A., Sero-Guillaume, O., Laurent, H.: ’On the evalua-
tion of segmentation methods for wildland fire’, Proc. Advanced Concepts for Intelligent
Vision Systems, Bordeaux, France, Sept. 2009, pp.12-23
[22] Santana, P., Gomes, P., Barata, J.: ’A vision-based system for early fire detection’, Proc.
IEEE International Conference on Systems, Man, and Cybernetics (SMC), oct. 2012, pp.
739 –744
[23] Martin, D., Fowlkes, C., Tal, D., Malik, J.: ’A database of human segmented natural
images and its application to evaluating segmentation algorithms and measuring ecologi-
cal statistics’, Proc. Eighth IEEE International Conference on Computer Vision (ICCV),
2001, 2, pp.416–423
[24] Habiboglu, Y.H., Gunay, O., Cetin, A.E.: ’Covariance matrix-based fire and flame de-
tection method in video’, Machine Vision and Applications, 2011, 23, (6), pp. 1103-1113
[25] Hooke, R., Jeeves, T.A.: ’direct searchsolution of numerical and statistical problems’,
Journal of the ACM, 1961, 8, (2), pp. 212-229
[26] Jiang, X.: ’Performance evaluation of image segmentation algorithms’, Handbook of
Pattern Recognition and Computer Vision, 2005, 3, pp. 525–542
[27] Matthews, B.W.: ’Comparison of the predicted and observed secondary structure of T4
phage lysozyme’, Biochimica et Biophysica Acta (BBA)-Protein Structure, 1975, 405,
(2), pp. 442–451
29

[28] Van Rijsbergen, C.J.: ’Information Retrieval’, (Butterworth-Heinemann, London, 2nd
edn. 1979)
[29] Hafiane, A., Chabrier, S., Rosenberger, C., Laurent, H.: ’A new supervised evaluation cri-
terion for region based segmentation methods’, Proc. Advanced Concepts for Intelligent
Vision Systems, Delft, Netherlands, August 2007, pp. 439–448
[30] ’The Bilkent VisiFire web-page and dataset’, http://signal.ee.bilkent.edu.tr/
VisiFire, accessed April 2015
[31] Peteri, R., Fazekas, S., Huiskes, M.J.: ’DynTex : a Comprehensive Database of Dynamic
Textures’,Pattern Recognition Letters, 2010, 31, (12), pp. 1627-1632
[32] Zhao, J., Zhang, Z., Han, S., Qu, C., Yuan, Z., Zhang, D.: ’SVM based forest fire
detection using static and dynamic features’, Computer Science and Information Systems,
2011, 8, (3), pp. 821–841
[33] ’Work with color’, http://www.workwithcolor.com/color-names-01.htm, accessed
April 2015
30