Embed Size (px)
Citation preview

Behavioral/Systems/Cognitive
Relationships between the Firing of Identified StriatalInterneurons and Spontaneous and Driven CorticalActivities In Vivo
Andrew Sharott, Natalie M. Doig, Nicolas Mallet, and Peter J. MagillMedical Research Council Anatomical Neuropharmacology Unit and Department of Pharmacology, University of Oxford, Oxford OX1 3TH, UnitedKingdom
The striatum is comprised of medium-sized spiny projection neurons (MSNs) and several types of interneuron, and receives massiveglutamatergic input from the cerebral cortex. Understanding of striatal function requires definition of the electrophysiological propertiesof neurochemically identified interneurons sampled in the same context of ongoing cortical activity in vivo. To address this, we recordedthe firing of cholinergic interneurons (expressing choline acetyltransferase; ChAT) and GABAergic interneurons expressing parvalbu-min (PV) or nitric oxide synthase (NOS), as well as MSNs, in anesthetized rats during cortically defined brain states. Depending on thecortical state, these interneurons were partly distinguished from each other, and MSNs, on the basis of firing rate and/or pattern. Duringslow-wave activity (SWA), ChAT� interneurons, and some PV� and NOS� interneurons, were tonically active; NOS� interneuronsfired prominent bursts but, contrary to investigations in vitro, these were not typical low-threshold spike bursts. Identified MSNs, andother PV� and NOS� interneurons, were phasically active. Contrasting with ChAT� interneurons, whose firing showed poor brain statedependency, PV� and NOS� interneurons displayed robust firing increases and decreases, respectively, upon spontaneous or driventransitions from SWA to cortical activation. The firing of most neurons was phase locked to cortical slow oscillations, but only PV� andChAT� interneurons also fired in time with cortical spindle and gamma oscillations. Complementing this diverse temporal coupling,each interneuron type exhibited distinct responses to cortical stimulation. Thus, these striatal interneuron types have distinct temporalsignatures in vivo, including relationships to spontaneous and driven cortical activities, which likely underpin their specialized contri-butions to striatal microcircuit function.
IntroductionThe striatum, the primary input site of the basal ganglia, is com-prised of medium-sized spiny projection neurons (MSNs) andseveral types of aspiny interneuron. Despite their relatively smallnumbers, interneurons likely play critical roles in striatal infor-mation processing and thence, basal ganglia-mediated behaviors(Tepper and Bolam, 2004). Major types of striatal interneuroninclude cholinergic interneurons and GABAergic interneuronsthat express either parvalbumin (PV) or nitric oxide synthase(NOS) (Kubota et al., 1993). Because the cerebral cortex providesthe principal excitatory inputs to striatum, defining how the fir-ing of these interneurons is related to ongoing cortical activity isof central importance for understanding their functions.
Cholinergic interneurons can autonomously fire at slow rates,with regular, irregular, and/or busting patterns (Goldberg andReynolds, 2011). In behaving primates, striatal units with similarfiring properties, so-called “tonically active neurons” (TANs), arethought to be cholinergic interneurons (Kimura et al., 1984).Small samples of rodent cholinergic interneurons support thisassumption (Wilson et al., 1990; Inokawa et al., 2010; Schulz etal., 2011a). Although the pause responses of TANs can signal thebehavioral significance of external stimuli (Morris et al., 2004),the propensity of cholinergic interneurons to fire tonically orengage in other firing patterns in intervening periods is unclear.Moreover, limited in vivo recordings of identified striatal cellsmeans that other (noncholinergic) interneurons might also firetonically.
GABAergic PV-expressing (PV�) interneurons, often con-sidered synonymous with “fast-spiking interneurons” (FSI), tar-get the perisomatic regions of MSNs and powerfully curtail theirfiring (Kita et al., 1990; Kawaguchi, 1993; Koos and Tepper,1999). They are positioned to rapidly integrate synchronized cor-tical inputs and provide feedforward inhibition of MSNs (Ra-manathan et al., 2002; Mallet et al., 2005). Accordingly, firing ofstriatal FSI is preferentially coupled to ongoing cortical spindleand gamma oscillations in vivo (Berke, 2011; Sharott et al., 2009).The full gamut of activity relationships of identified PV� in-terneurons with cortex remains unresolved.
Received May 15, 2012; revised July 16, 2012; accepted Aug. 2, 2012.Author contributions: A.S., N.M., and P.J.M. designed research; A.S. and N.M.D. performed research; A.S. ana-
lyzed data; A.S. and P.J.M. wrote the paper.This work was supported by the Medical Research Council UK (Award U138197109), Parkinson’s UK (Grant
number G-0806) and a Marie Curie European Re-integration Grant (SNAP-PD) awarded by the European Union. Weare grateful to Drs. P.D. Dodson, K.C. Nakamura, T.C. Bienvenu, and J.P. Bolam for valuable scientific discussions. Wealso thank B. Micklem, E. Norman, C. Johnson, and G. Hazell for expert technical assistance.
Correspondence should be addressed to either Dr. Andrew Sharott or Dr. Peter J. Magill, Medical Research CouncilAnatomical Neuropharmacology Unit, University of Oxford, Oxford OX1 3TH, UK. E-mail: [email protected] or [email protected].
DOI:10.1523/JNEUROSCI.2440-12.2012Copyright © 2012 the authors 0270-6474/12/3213221-16$15.00/0
The Journal of Neuroscience, September 19, 2012 • 32(38):13221–13236 • 13221

The characteristic intrinsic properties of identified NOS� in-terneurons include their ability to fire low-threshold spike (LTS)bursts (Kawaguchi, 1993). Many NOS� interneurons also dis-play autonomous firing (Ibanez-Sandoval et al., 2011; Beatty etal., 2012). Because identified NOS� interneurons have not beenrecorded in vivo, it is unclear whether they fire LTS bursts (Sha-rott et al., 2009), or are tonically active, in intact striatal networks.Nitric oxide modulates the responsiveness of MSNs to corticalinput and can mediate synaptic plasticity (Sammut et al., 2010),but how the firing of NOS� interneurons is related to thatof other striatal neurons, to cortical activity or behavior, isunknown.
To advance understanding of striatal interneuron function, itis imperative to define the electrophysiological properties of neu-rochemically identified cells in the same context in vivo. We thusrecorded the activities of identified cholinergic interneurons andGABAergic interneurons expressing PV or NOS, as well as MSNsfor comparison, in anesthetized rats during cortically-definedbrain states. We define and contrast their spontaneous firing ratesand patterns, including temporal coupling to cortical oscilla-tions, and characterize their distinct responses to somatosensorystimuli and driven cortical outputs.
Materials and MethodsExperimental procedures were performed on adult male SpragueDawley rats (Charles River), and were conducted in accordance withthe Animals (Scientific Procedures) Act, 1986 (United Kingdom), andwith Society for Neuroscience Policies on the Use of Animals in Neu-roscience Research.
In vivo electrophysiological recording and juxtacellular labeling of singleneurons. Recording and labeling experiments were performed in 78 anes-thetized rats (280 –340 g). Briefly, anesthesia was induced with 4% v/visoflurane in O2, and maintained with urethane (1.3 g/kg, i.p.; ethyl car-bamate; Sigma), and supplemental doses of ketamine (30 mg/kg, i.p.;Ketaset) and xylazine (3 mg/kg, i.p.; Rompun; Bayer), as described pre-viously (Stern et al., 1997; Magill et al., 2006). Wound margins wereinfiltrated with local anesthetic (0.5% w/v bupivacaine; Astra). Animalswere then placed in a stereotaxic frame (Kopf). Body temperature wasmaintained at 37 � 0.5°C by a homeothermic heating device (HarvardApparatus). An electrocorticogram (ECoG), electrocardiographic activ-ity, and respiration rate were monitored constantly to ensure the ani-mals’ well being. The epidural ECoG was recorded above the frontal(somatic sensory-motor) cortex (4.2 mm anterior and 2.0 mm lateral ofbregma) (Paxinos and Watson, 1986), and was referenced against theipsilateral cerebellar hemisphere (Mallet et al., 2008). Raw ECoG wasbandpass filtered (0.3–1500 Hz, �3 dB limits) and amplified (2000�;DPA-2FS filter/amplifier; npi electronic) before acquisition. Extracellu-lar recordings of the action potentials (“spikes”) of individual neurons(i.e., single-unit activities) in the dorsal striatum were made using glasselectrodes (10 –30 M� in situ; tip diameter �1.2 �m) containing 0.5 M
NaCl solution and neurobiotin (1.5% w/v; Vector Laboratories). Elec-trodes were lowered into the brain under stereotaxic guidance and usinga computer-controlled stepper motor (IVM-1000; Scientifica) that al-lowed the electrode depth to be determined with a resolution of 0.1 �m.Electrode signals were amplified (10�) through the bridge circuitry of anAxoprobe-1A amplifier (Molecular Devices), AC-coupled, amplified an-other 100�, and bandpass filtered at 300 –5000 Hz (DPA-2FS filter/amplifier). The ECoG and single-unit activity were each sampled at 16.6kHz using a Power1401 Analog-Digital converter and a PC runningSpike2 acquisition and analysis software (Version 7.2; Cambridge Elec-tronic Design). Striatal neurons were recorded during two distinct, spon-taneous brain states, as defined by the ECoG: (1) slow-wave activity(SWA), which is similar to activity observed during natural nonrapid eyemovement sleep and drowsiness; and (2) “cortical activation,” whichcontains patterns of activity that are more analogous to those observedduring the alert, behaving state (Steriade, 2000). Cortical SWA is thusdominated by slow oscillations (�1 Hz), which in this ECoG configura-
tion are composed of alternating surface-positive “active components”and surface-negative “inactive components” (Mallet et al., 2008), butalso contains spindle oscillations (7–12 Hz) and gamma oscillations(27– 45 Hz). Transition from SWA to the activated brain state is exem-plified by obliteration of cortical slow and spindle oscillations (Steriade,2000). Notably, the neuronal activity patterns present under this anes-thetic regimen may only be qualitatively similar to those present in theunanesthetized brain. Nevertheless, the urethane-anesthetized animalserves as a useful model for assessing the impact of extremes of brain stateon functional connectivity within and between the cortex and basal gan-glia (Steriade, 2000; Magill et al., 2004a; Sharott et al., 2005). In additionto recording striatal activity during spontaneously occurring brain states,we studied the firing of striatal neurons during cortical activation thatwas elicited by pinching the hindpaw for 15 s, as described previously(Magill et al., 2006). Occasionally, these somatosensory stimuli weredelivered during a state of spontaneous cortical activation. The animalsdid not exhibit either a marked change in the electrocardiogram or res-piration rate, and did not exhibit a hindpaw withdrawal reflex, in re-sponse to the pinch. Moreover, withdrawal reflexes were not presentduring episodes of spontaneous and/or prolonged cortical activation,thus indicating anesthesia was adequate throughout the recordings.
Following electrophysiological recordings, single neurons were juxta-cellularly labeled with neurobiotin (Magill et al., 2000). Briefly, positivecurrent pulses (2–10 nA, 200 ms, 50% duty cycle) were applied until thesingle-unit activity became robustly entrained by the current injections.A total of 130 striatal neurons were recorded and juxtacellularly labeledin this study. After the recording and labeling sessions, the animals weregiven a lethal dose of ketamine (150 mg/kg) and were perfused transcar-dially with 100 ml of 0.05 M PBS, pH 7.4, followed by 300 ml of 0.1% w/vglutaraldehyde and 4% w/v paraformaldehyde (PFA) in 0.1 M phosphatebuffer, pH 7.4 (PB), and then by 200 ml of 4% w/v PFA in PB. Brains werethen left in the latter fixative solution at 4°C until sectioning 24 –72 hlater.
Electrical stimulation of the motor cortex. Parallel, bipolar stimulatingelectrodes (constructed from nylon-coated stainless steel wires; Califor-nia Fine Wire), with tip diameters of �100 �m, a tip separation of �150�m, and an impedance of �10 k�, were implanted into the ipsilateralmotor cortex (Magill et al., 2004b). The coordinates of the cortical stim-ulation sites (2.5– 4.0 mm anterior and 2.5–3.0 mm lateral of bregma, atdepths of 2.0 –2.2 mm below the dura) correspond to layers 5/6 of theprimary/secondary motor cortices (Paxinos and Watson, 1986). The re-sponses of striatal neurons to highly synchronized cortical outputs werethen tested by focal electrical stimulation of motor cortex (Kolomiets etal., 2003; Magill et al., 2004b). Electrical stimuli, which consisted of singlesquare-wave current pulses of 0.3 ms duration and variable amplitude(typically 600 –900 �A), were delivered at a frequency of 0.5 Hz using aconstant-current isolator (A360D; World Precision Instruments) thatwas gated by digital outputs from the Power1401 converter.
Tissue processing for identification of recorded and labeled neurons. Para-sagittal sections (50 �m) were cut from each brain using a vibratingmicrotome (VT1000S; Leica Microsystems), collected in series andwashed in PBS. Free-floating sections were then incubated overnight atroom temperature in Triton PBS (PBS containing 0.3% v/v Triton X-100[Sigma]) containing Cy3-conjugated streptavidin (1:1000 dilution; LifeTechnologies). Sections containing neurobiotin-labeled neuronal so-mata (those marked with Cy3) were then isolated for molecular charac-terization by indirect immunofluorescence. Neurons with densely spinyhigher-order dendrites were classified as projection neurons (MSNs) andwere thus not tested for interneuron markers. Aspiny neurons weretested for expression of immunoreactivity for PV, choline acetyltrans-ferase (ChAT), NOS, or calretinin (CR), with the initial choice of molec-ular marker guided by characteristic somatodendritic structure. Thesemolecular markers clearly distinguish these four types of interneuronbecause they are seldom coexpressed in the same cell (Kubota et al., 1993;Tepper et al., 2010). If a neuron tested negative for the initial molecularmarker, it was additionally tested for expression of one or more of theother markers until positive immunoreactivity was confirmed. Tenneurobiotin-labeled neurons that were either aspiny or were not wellenough labeled with neurobiotin to rule out spines on their dendrites also
13222 • J. Neurosci., September 19, 2012 • 32(38):13221–13236 Sharott et al. • Striatal Interneuron Activity In Vivo

tested negative for PV, ChAT, NOS, and CR, and thus, were not consid-ered further. Most of the interneurons that tested positive for expressionof NOS were also tested for expression of neuropeptide Y (NPY). Indirectimmunofluorescence protocols were as standard (Mallet et al., 2012).Briefly, after 1–2 h of incubation in Triton PBS containing 10% v/vnormal donkey serum (NDS; Jackson ImmunoResearch Laboratories),sections containing neurobiotin-labeled neuronal somata were incu-bated overnight at room temperature in Triton PBS containing 1% v/vNDS and one or more of the following primary antibodies: guinea piganti-PV (1:1000; Synaptic Systems, 195004), rabbit anti-PV (1:1000;Swant, PV28), goat anti-ChAT (1:500; Millipore Bioscience ResearchReagents, AB144P), mouse anti-NOS (1:500; Sigma, N2280), rabbit anti-NPY (1:5000; Immunostar, 812001), and rabbit anti-CR (1:1000; Synap-tic Systems, 214102). After exposure to primary antibodies, sections werewashed in PBS and incubated for 4 – 8 h at room temperature in TritonPBS containing fluorophore-conjugated secondary antibodies (all raisedin donkey): Alexa Fluor 488 (1:500/1000; Life Technologies), DyLight488 (1:500/1000), Cy5 (1:500), or DyLight 649 (1:500) (all Jackson Im-munoResearch). All secondary antibodies were highly cross-adsorbed bythe manufacturers to reduce cross-species reactivity. After washing inPBS, sections were mounted on glass slides in Vectashield (Vector Lab-oratories), coverslipped, and viewed on a laser-scanning confocal micro-scope (Zeiss LSM 710). Appropriate sets of laser beams and emissionwindows were used for Alexa Fluor 488 and DyLight 488 (excitation 488nm, emission 492–544 nm), Cy3 (excitation 543 nm, emission552– 639 nm), and Cy5 and DyLight649 (excitation 633 nm, emission639 –757 nm). For neurochemical characterization, single-plane confo-cal images were acquired using a 1 �m optical section and a 40� objec-tive lens. Images of each of the fluorescence channels were takensequentially and separately to minimize possible cross talk or “bleedthrough” of signal across channels. Absence of bleed through was assuredfor each fluorescence reaction. A neuron was classified as not expressingthe tested molecular marker only when positive immunoreactivity couldbe observed in other cells on the same focal plane as the tested neuron.Occasionally, multiple-plane images were taken, and z-stack montagescreated, to better highlight the somatodendritic structure of labeled neu-rons. Digital images were cropped to regions of interest, with brightnessand contrast adjusted when necessary, using Photoshop software (Cre-ative Suite 3; Adobe Systems).
Data selection and analysis of firing of identified striatal neurons.Artifact-free data were visually inspected and epochs of robust sponta-neous SWA or spontaneous cortical activation were identified in ECoGsaccording to the previously described characteristics of these brain states(Steriade, 2000; Magill et al., 2004a). Recording epochs for a given neu-ron were only included in group analyses when they had a minimumduration of 70 s for SWA and 60 s for cortical activation; the majority ofepochs analyzed were between 100 and 500 s (SWA: 376.4 � 33.6 s;Activation: 257.2 � 36.7 s [mean durations � SEMs]). Putative single-unit activity was isolated with standard “spike-sorting” procedures (Mal-let et al., 2008), including template matching, principal componentanalysis, and supervised clustering (Spike2). Isolation of a single unit wasverified by the presence of a distinct refractory period in the interspikeinterval (ISI) histogram. For further analysis, single-unit activity wasconverted so that each spike was represented by a single digital event(Spike2).
All data analyses were performed using MATLAB (MathWorks) andassociated toolboxes. Mean firing rate (spikes/s) was calculated from thetotal number of spikes per data epoch. The coefficient of variation of theISI (CV), a value used widely as an indicator of regularity in point pro-cesses, was calculated (the lower the CV value, the more regular the unitactivity). In addition, we calculated the mean CV2, another (related)measure of regularity that has been shown to be less sensitive to altera-tions in firing rate (Holt et al., 1996; Schulz et al., 2011a). Statisticalcomparisons of spontaneous firing properties were performed using anonparametric Kruskal–Wallis ANOVA on ranks, followed by Dunn’stest for post hoc definition of significant pairwise differences, or by usingMann–Whitney U Tests, as appropriate. The minimum significance levelfor these statistical tests was taken to be p � 0.05. All box plots in figuresshow the medians, the interquartile ranges (box), and extremes of the
range (whiskers, within 99% of the distribution). Low-threshold Ca 2�
spike bursts were identified according to quantitative criteria previouslyapplied to extracellular unit recordings of thalamic projection neurons(Lacey et al., 2007). These strict criteria were at least two action potentialswith an ISI of �5 ms but with a preceding silent period of �100 ms (Luet al., 1992; Lacey et al., 2007). A maximum ISI of 10 ms was used todefine the end of an LTS burst (Fanselow et al., 2001; Lacey et al., 2007).The characteristic temporal profiles of such LTS bursts include a progres-sive increase in ISIs (as the burst evolves), and the duration of the first ISIin a given burst is predictive of the total number of action potentials to besubsequently fired (Domich et al., 1986; Jeanmonod et al., 1996; Lacey etal., 2007).
Cholinergic interneurons have been reported to fire in three firingmodes in vitro; “regular,” “irregular,” and “bursting” (Bennett and Wil-son, 1999). To quantitatively distinguish between similarly diverse firingpatterns in vivo, we used three measures of bursting/regularity: the pro-portion (%) of all spikes contained within bursts, the relative magnitudeof the initial peak of the autocorrelogram, and the CV. Bursts of spikeswere examined using criteria that best isolated the temporally clusteredfiring of these neurons under these in vivo conditions. These were at leasttwo spikes with an ISI of �200 ms, with a preceding silent period of �400ms, a period of quiescence of �300 ms following the burst, and a maxi-mum burst length of 700 ms. These criteria were based on the ISI histo-grams of identified cholinergic interneurons (Fig. 1) and visualidentification of bursts. The initial peak of the autocorrelogram has pre-viously been used to characterize bursting/regularity in other types oftonically active neurons with similarly low firing rates (Paladini andTepper, 1999). Autocorrelograms of single-unit activity were calculatedusing 5 ms bins. For each individual neuron, the statistical significance ofautocorrelogram features (i.e., peaks) were assessed by constructing 100surrogate spike trains with identical mean rates, but each with a Poissondistribution of ISIs capped at 9 and 1000 ms (the limits of ISI distribu-tions across all the cholinergic interneurons; data not shown). The meanautocorrelogram of these surrogates was used to calculate a normalizedindex of the initial peak (mean of bins with a lag of 0.025–150 ms) of theautocorrelogram for each interneuron (with more positive index valuesreflecting larger autocorrelogram peaks). These autocorrelogram indiceswere analyzed together with percentage spikes in bursts and CVs usingK-means supervised clustering to assign a specific firing mode (regular,irregular, or bursting) to each cholinergic interneuron recorded in vivo.
Responses to somatosensory stimuli. To test for a relationship betweenthe striatal and cortical activities accompanying somatosensory stimula-tion, we recorded the firing of identified neurons before, during, andafter hindpaw pinches. For analysis purposes, pinches were dichoto-mously categorized, according to the ECoG-defined brain state beforeand after the stimulus, as being either “driven activation” (the stimulusevoked a state transition from SWA to activation) or “activated pinch”(stimulus was delivered during a spontaneous activated state). Note thatboth types of recordings during pinches are distinct from the “spontane-ous cortical activation” detailed in our results. Firing rate was calculatedin 3 s bins, with a 2 s overlap, from 15 s before the pinch onset, 15 s duringthe pinch, and 15 s after the pinch offset. Neurons were only included inthese analyses when three or more pinches of the same category wererecorded (the responses were averaged). These average responses of eachneuron were normalized to its baseline firing, that is, firing in the binscomprising the 15 s immediately before the pinch. Firing rate, CV, andCV2 were calculated for the 15 s before and during each pinch responseand were compared using Wilcoxon sign-rank tests across all pinches foreach neuron/condition.
Phase analysis. To investigate how the activity of individual striatalneurons varied in time with respect to ongoing cortical network activity,we analyzed the instantaneous phase relationships between striatal spiketimes and cortical oscillations in specific frequency bands. ECoG signalscontaining robust SWA were first filtered, using a neutral-phase band-pass filter (Butterworth filter, three poles), at three frequency ranges toisolate slow (0.4 –1.6 Hz), spindle (7–12 Hz), or “low gamma” (27– 45Hz) oscillations. Only gamma oscillations were isolated in ECoGs re-corded during cortical activation. These frequency ranges were chosenaccording to previous studies of cortico-basal ganglia circuits using this
Sharott et al. • Striatal Interneuron Activity In Vivo J. Neurosci., September 19, 2012 • 32(38):13221–13236 • 13223

animal model (Magill et al., 2004a; Mallet et al., 2008). Subsequently, theinstantaneous phase and power of the ECoG in these frequency bandswere separately calculated from the analytic signal obtained via the Hil-bert transform (Lachaux et al., 1999). In this formalism, peaks in theECoG oscillations correspond to a phase of 0° and troughs to a phase of180°. Linear phase histograms, circular phase plots, and circular statisti-cal measures were calculated using the instantaneous phase values foreach spike. For phase analyses in the spindle and gamma ranges, a spikephase value was only included when the spike occurred during a periodthat exceeded a threshold of �0.5 SD of the mean instantaneous power inthat range, a criterion which appeared to best capture the periods ofincreased oscillation in these highly dynamic ECoG recordings. Descrip-tive and inferential circular statistics were then calculated using the Circ-
Stat toolbox (Berens, 2009) for MATLAB. For the calculation of vectorlengths and statistical comparisons, we included only those neurons thatfired �40 spikes during the entire analyzed epoch (for analysis of slowoscillations) or during just “suprathreshold periods” (for spindle/gammaoscillations). These neurons were then tested for significantly phase-locked firing (defined as having p � 0.05 in Rayleigh’s uniformity test).The null hypothesis for Rayleigh’s test was that the spike data were dis-tributed in a uniform manner. For each of the neurons that fulfilled thesecriteria, the mean phase angle was calculated. Differences in the meanphase angles of groups of neurons were tested for using the Watson–Williams F test ( p � 0.05 for significance). The mean resultant vectorlength (referred to hereafter as simply vector length) of the phase distri-bution, bound between zero and one (the closer to one, the more con-
Figure 1. Spontaneous activity of identified striatal cholinergic interneurons. Ai–Ci, Juxtacellularly labeled cholinergic interneurons, identified by their colocalization of fluorescent labeling forneurobiotin (NB) and choline acetyltransferase (ChAT), had characteristically large somata and thick, aspiny dendrites. Aii–Cii, Spontaneous action potential discharges (unit activity) of the sameindividual ChAT� interneurons during robust cortical SWA, as recorded in the frontal ECoG. Neurons in Aii, Bii, and Cii are typical examples of single units that exhibited regular, irregular, or burstingfiring modes, respectively. Note that each interneuron had a weak tendency to fire more often during the surface-positive active components of the cortical slow oscillation (�1 Hz). Bursts fired byChAT� interneurons had highly variable ISI distributions and typically consisted of 3–5 spikes of steadily decreasing amplitude (Cii, inset). Aiii–Ciii, Firing of the same interneurons duringspontaneous cortical activation. In each case, the ChAT� interneuron firing mode was maintained across both brain states. D, The populations of ChAT� interneurons recorded during SWA and/orcortical activation could be separated into three clusters (cyan, regular neurons; orange, irregular neurons; magenta, bursting neurons) on the basis of three parameters related to firing pattern:autocorrelogram peak index, the percentage of spikes in bursts, and the CV of the ISI. Filled and open circles show neurons recorded during SWA and activation, respectively (larger circles denote theindividual neurons/recordings shown in A–C). Note that each cluster contains recordings made during both SWA and activated states. E, Normalized ISI histograms (means � SEMs) of allinterneurons in the three clusters in D (matched for color). Scale bars: Ai–Ci, 20 �m. Vertical scale bars: Aii–Cii and Aiii–Ciii, 1 mV; horizontal scale bars: Aii–Cii and Aiii–Ciii, 1 s. Horizontal scalebars: Cii inset, and Ciii inset, 200 ms. AU arbitrary units.
13224 • J. Neurosci., September 19, 2012 • 32(38):13221–13236 Sharott et al. • Striatal Interneuron Activity In Vivo

centrated the angles), was used to quantify the level of phase lockingaround the mean angle for individual neurons (computed using the an-gles of each spike) and for populations of neurons (computed using themean angle for each neuron). The population vector lengths and meanangles for each cell type are shown in the smaller circular plots in Figures8 and 9. Differences between the vector lengths of two neuron popula-tions were tested for using the Mann–Whitney U test, whereas vectorcomparisons between three or more groups were made using Kruskal–Wallis ANOVAs with post hoc Dunn’s tests. Where data are displayed incircular plots (Figs. 8 and 9), lines radiating from the center are thevectors of the preferred phases of firing. The small open circles on theperimeter of each circular plot represent the preferred firing phase ofeach neuron (Fig. 8C). The power spectra of the ECoG signals werecalculated using the MATLAB toolbox Neurospec (www.neurospec.org).The power of the ECoG in the slow, spindle and gamma frequency bandswas compared in data epochs used for analyses of phase-locked striatalneuron firing to test whether they were significantly different betweengroups.
The Rayleigh statistic tests against the null hypothesis that the phasesample was taken from a uniform circular distribution, which would beexpected to be the case when testing the filtered product of a sinusoidalECoG oscillation against an independent spike train with random(Poisson-like) statistics. However, in common with previous work (Sal-eem et al., 2010), we observed that, on average, the active and inactivecomponents of the ECoG slow oscillation were of different durations(data not shown), indicating that the cortical slow oscillation is nonsi-nusoidal. Carrying this cortical timing bias over many cycles could leadto a significant result in Rayleigh’s test for even a truly random spiketrain, simply because more spikes would occur during the longer com-ponent than the shorter component of the slow oscillation. This bias canthus confound the phase analysis of neurons that fire relatively consis-tently during both components of the cortical slow oscillation (e.g., somecholinergic interneurons; Fig. 1). To control for this possible bias in eachrecording of a unit–ECoG pair, 1000 phase histograms were calculatedusing surrogate spike trains with mean rates identical to that of the “real”neuron, but with spikes placed at random. The mean phase histogram ofthese surrogates revealed any deviation from the uniform distribution(i.e., a spurious peak) that arose from ECoG components of unequaldurations. We then calculated how many spike counts in each bin wouldneed to be randomly redistributed across the histogram to create a uni-form phase distribution for the surrogates. To remove the systematicbias, this redistribution process was then applied to the real phase valuesby randomly reassigning a phase value for each spike count in each binabove the uniform distribution to another bin. This process was repeated1000 times to give average circular means and vector lengths for acorrected spike train that was free from the bias arising from thenonsinusoidal ECoG reference signal. Neurons were considered toexhibit significantly phase-locked firing if �95% of Rayleigh’s tests(of these 1000 redistributed values) were still significant (effectivelygiving p � 0.05%).
Responses to electrical stimulation of cortex. Peristimulus time histo-grams (PSTHs) were constructed from 50 to 200 consecutive stimulationtrials with 1 ms bins, and were normalized to give firing probability.Neurons were considered to respond significantly at “short latency” or“long latency” if the first spike following the stimulus was fired in aresponse window of 1.5–15 ms or 20 –50 ms, respectively, in �35% ofstimulation trials. The first spike in each stimulus trial, rather than thepeak of the response in the PSTH, was therefore used to measure theresponse latency. For those neurons responding at short latencies,the mean latencies of the first spikes in this time window were comparedusing a Kruskal–Wallis ANOVA with post hoc Dunn’s tests.
ResultsSpontaneous firing of identified striatal interneurons duringSWA and cortical activation statesWe recorded and juxtacellularly labeled a total of 130 neurons indorsal striatum, 74 of which were subsequently identified by theirimmunofluorescence signals as ChAT�, PV�, or NOS� in-
terneurons. Forty-six neurobiotin-labeled neurons were classi-fied as MSNs on the basis of their densely spiny dendrites. Weaimed to characterize the firing of these striatal interneurons andprojection neurons in relation to distinct brain states and thecortical network oscillations that define them. Our analyses fo-cused on striatal neuron firing during two well defined brainstates that are evident in urethane-anesthetized rats; SWA andcortical activation (Steriade, 2000; Magill et al., 2006).
Cholinergic interneurons (n 38 ChAT� neurons) hadcharacteristically large somata (�20 �m across longest axis),from which emanated thick, aspiny dendrites that branched ex-tensively in distal portions (Fig. 1Ai–Ci). During cortical SWA,ChAT� interneurons fired at relatively slow rates (4.2 � 0.2spikes/s) and displayed one of three distinct firing patterns ormodes: regular, irregular, or bursting (Fig. 1), which are reminis-cent of those described for cholinergic interneurons in vitro (Ben-nett and Wilson, 1999). Most ChAT� interneurons tended to firein a single mode, and notably, individual neurons could maintaintheir preferred firing pattern across SWA and cortical activation(Fig 1A–C). To quantitatively classify the ChAT� interneuronfiring pattern in each of our recordings, we examined a normal-ized index of the initial peak of the autocorrelogram, the percent-age of spikes in bursts and the CV of the ISI (see Materials andMethods). Using these parameters for each ChAT� interneuronrecorded during SWA and/or cortical activation, we could sepa-rate the population into three clear groups (Fig. 1D). The averageISI histograms for regular, irregular, and bursting neuron groupsdisplayed unimodal, mixed, and bimodal distributions, respec-tively (Fig. 1E), supporting the validity of this classificationscheme. The most common mode of firing was regular (52%),followed by irregular (39%), and then bursting (9%). Each clus-ter contained neurons recorded in SWA and/or activation (Fig.1D), confirming that these firing patterns were not selective forone or the other brain state. There were no significant differencesin the mean firing rates of the different ChAT� interneurongroups as defined by firing mode. Regular, irregular, and burstingneurons had weak tendencies to fire more during the active com-ponents (i.e., around the peaks) of the cortical slow (�1 Hz)oscillation. However, the average power of slow oscillations(0.4 –1.6 Hz) in the ECoGs recorded with ChAT� interneuronsduring SWA was not significantly correlated with any of the pa-rameters we used to define firing mode (Pearson’s correlationcoefficient, p � 0.05), suggesting the tendency to fire with a reg-ular, irregular, or bursting pattern is not dependent on SWA.
PV-expressing GABAergic interneurons (n 24 PV� neu-rons) had medium-sized somata (10 –25 �m in diameter) andvaricose aspiny dendrites that extensively ramified close (�300�m) to the cell body (Fig. 2Ai–Ci). Of all the types of striatalneuron recorded in this study, PV� interneurons had the mostvariable activity during SWA, ranging from neurons that firedonly a single spike once every 30 – 60 s to those that firedhigh-frequency bursts of spikes on almost every active com-ponent of the cortical slow oscillation (Fig. 2 Aii–Cii). Therewas no clear correlation between the power of cortical slowoscillations (0.4 –1.6 Hz) and the different firing rates/pat-terns of PV� interneurons during SWA (Pearson’s correla-tion coefficient, p � 0.05). In the spontaneously activatedbrain state, nearly all PV� interneurons fired more frequentlyand displayed more regular firing as compared with that dur-ing SWA, although temporal dynamics again varied consider-ably across interneurons (Fig. 2 Aiii–Ciii).
NOS-expressing GABAergic interneurons (n 12 NOS�neurons) had medium-sized somata (15–25 �m) and long
Sharott et al. • Striatal Interneuron Activity In Vivo J. Neurosci., September 19, 2012 • 32(38):13221–13236 • 13225

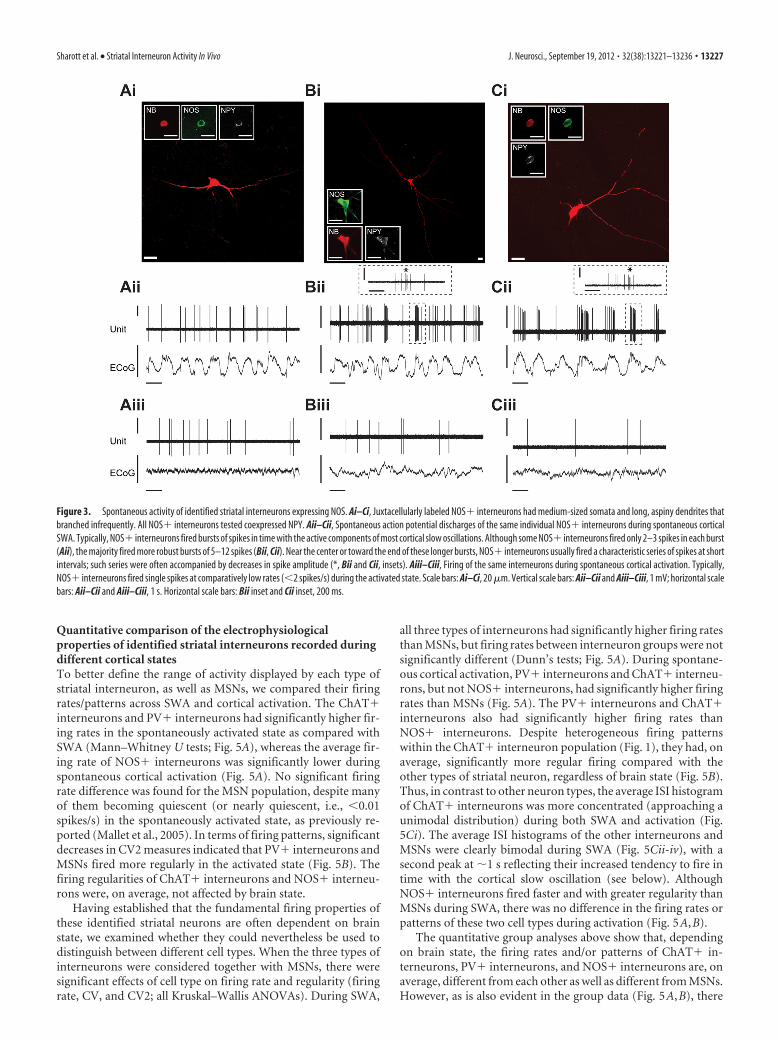
aspiny dendrites that often extended for hundreds of microm-eters without branching (Fig. 3Ai–Ci). All NOS� interneu-rons tested (n 10 of 12) also expressed NPY (Fig. 3Ai–Ci).During SWA, NOS� interneurons typically fired bursts ofspikes in time with the active component of the cortical slowoscillation (Fig. 3Aii–Cii). For most neurons (n 8 of 12),these bursts were particularly robust, and contained many(5–12) spikes; these long bursts characteristically contained adistinct series of 3–5 spikes with short ISIs and progressivelydecreasing amplitudes (Fig. 3Bii–Cii insets). In a minority ofneurons (n 4), bursts consisted of only two or three spikes(Fig. 3Aii). During spontaneous cortical activation, NOS�interneurons fired single spikes at much lower rates than thoseobserved during SWA (Fig. 3Aiii–Ciii).
A population of striatal units fires low-threshold Ca 2�
spike burstsMost NOS� interneurons in rat striatum also express NPY,somatostatin, and NADPH diaphorase (Kawaguchi, 1993;Figueredo-Cardenas et al., 1996). When intracellularly recordedin vitro, one of the distinguishing electrophysiological features ofthese striatal interneurons is their ability to fire LTS bursts(Kawaguchi, 1993). In thalamic neurons, LTS bursts can be ex-tracellularly identified by their characteristic temporal profileand several strict criteria (Domich et al., 1986; Lu et al., 1992;Jeanmonod et al., 1996; Lacey et al., 2007). In agreement with
previous extracellular recordings of rat striatal neurons duringhalothane anesthesia (Sharott et al., 2009), we recorded severalstriatal units (n 13) that fired numerous high-frequency burstdischarges, containing up to six spikes, that satisfied classical cri-teria for LTS bursts (Fig. 4A). During SWA and cortical activa-tion, 75.3 � 5.9% and 28.6 � 6.7% of all their spikes occurredwithin such bursts, respectively. There was a characteristic ISIincrease during the LTS bursts (Fig. 4B), and the first ISI in anLTS burst was predictive of the total number of spikes fired(Fig. 4C). We were not able to successfully label and identifythese “LTS units”, but their activity was clearly different fromthat of identified NOS� interneurons. For example, the aver-age ISI histogram of LTS units, but not NOS� interneurons,showed a prominent peak �4 ms, which reflects the high-frequency nature of the LTS bursts (Fig. 4 D, E). In line withthis distinction, the vast majorities of our identified NOS�,ChAT�, or PV� interneurons did not fire any LTS bursts (theexception was two PV� neurons, which each fired �1% of alltheir spikes in such bursts). Although we cannot rule out thepossibility that subthreshold LTS events of some kind underliea number of the action potentials fired by NOS� interneuronsin vivo, these data show that such LTS events, if they occur, donot result in spike patterns that fit classical criteria for LTSbursts. The firing patterns of these LTS units may, therefore,represent another cell type in striatum.
Figure 2. Spontaneous activity of identified striatal PV-expressing interneurons. Ai–Ci, Juxtacellularly labeled PV� interneurons had medium-sized somata and varicose aspiny dendrites thatextensively branched proximal to somata. Aii–Cii, Spontaneous action potential discharges of the same individual PV� interneurons during robust cortical SWA. Identified PV� interneurons firedsingle spikes or bursts of spikes in time with the active components of the cortical slow oscillation but varied markedly in their firing rates and fidelity of coupling, ranging from those that fired ona few slow oscillation cycles (Aii) to those that fired on most (Bii) or all (Cii) cycles. Bursts typically consisted of 5–15 spikes (Cii–iii, insets). Aiii–Ciii, Firing of the same interneurons duringspontaneous cortical activation. Typically, PV� interneurons fired faster and more regularly during cortical activation (Aiii, Biii), or at least maintained their relatively high firing rates (Ciii), ascompared with their firing during SWA. Scale bars: Ai–Ci, 20 �m. Vertical scale bars: Aii–Cii and Aiii–Ciii, 1 mV; horizontal scale bars: Aii–Cii and Aiii–Ciii, 1 s. Horizontal scale bars: Cii inset andCiii inset, 200 ms.
13226 • J. Neurosci., September 19, 2012 • 32(38):13221–13236 Sharott et al. • Striatal Interneuron Activity In Vivo
Quantitative comparison of the electrophysiologicalproperties of identified striatal interneurons recorded duringdifferent cortical statesTo better define the range of activity displayed by each type ofstriatal interneuron, as well as MSNs, we compared their firingrates/patterns across SWA and cortical activation. The ChAT�interneurons and PV� interneurons had significantly higher fir-ing rates in the spontaneously activated state as compared withSWA (Mann–Whitney U tests; Fig. 5A), whereas the average fir-ing rate of NOS� interneurons was significantly lower duringspontaneous cortical activation (Fig. 5A). No significant firingrate difference was found for the MSN population, despite manyof them becoming quiescent (or nearly quiescent, i.e., �0.01spikes/s) in the spontaneously activated state, as previously re-ported (Mallet et al., 2005). In terms of firing patterns, significantdecreases in CV2 measures indicated that PV� interneurons andMSNs fired more regularly in the activated state (Fig. 5B). Thefiring regularities of ChAT� interneurons and NOS� interneu-rons were, on average, not affected by brain state.
Having established that the fundamental firing properties ofthese identified striatal neurons are often dependent on brainstate, we examined whether they could nevertheless be used todistinguish between different cell types. When the three types ofinterneurons were considered together with MSNs, there weresignificant effects of cell type on firing rate and regularity (firingrate, CV, and CV2; all Kruskal–Wallis ANOVAs). During SWA,
all three types of interneurons had significantly higher firing ratesthan MSNs, but firing rates between interneuron groups were notsignificantly different (Dunn’s tests; Fig. 5A). During spontane-ous cortical activation, PV� interneurons and ChAT� interneu-rons, but not NOS� interneurons, had significantly higher firingrates than MSNs (Fig. 5A). The PV� interneurons and ChAT�interneurons also had significantly higher firing rates thanNOS� interneurons. Despite heterogeneous firing patternswithin the ChAT� interneuron population (Fig. 1), they had, onaverage, significantly more regular firing compared with theother types of striatal neuron, regardless of brain state (Fig. 5B).Thus, in contrast to other neuron types, the average ISI histogramof ChAT� interneurons was more concentrated (approaching aunimodal distribution) during both SWA and activation (Fig.5Ci). The average ISI histograms of the other interneurons andMSNs were clearly bimodal during SWA (Fig. 5Cii-iv), with asecond peak at �1 s reflecting their increased tendency to fire intime with the cortical slow oscillation (see below). AlthoughNOS� interneurons fired faster and with greater regularity thanMSNs during SWA, there was no difference in the firing rates orpatterns of these two cell types during activation (Fig. 5A,B).
The quantitative group analyses above show that, dependingon brain state, the firing rates and/or patterns of ChAT� in-terneurons, PV� interneurons, and NOS� interneurons are, onaverage, different from each other as well as different from MSNs.However, as is also evident in the group data (Fig. 5A,B), there
Figure 3. Spontaneous activity of identified striatal interneurons expressing NOS. Ai–Ci, Juxtacellularly labeled NOS� interneurons had medium-sized somata and long, aspiny dendrites thatbranched infrequently. All NOS� interneurons tested coexpressed NPY. Aii–Cii, Spontaneous action potential discharges of the same individual NOS� interneurons during spontaneous corticalSWA. Typically, NOS� interneurons fired bursts of spikes in time with the active components of most cortical slow oscillations. Although some NOS� interneurons fired only 2–3 spikes in each burst(Aii), the majority fired more robust bursts of 5–12 spikes (Bii, Cii). Near the center or toward the end of these longer bursts, NOS� interneurons usually fired a characteristic series of spikes at shortintervals; such series were often accompanied by decreases in spike amplitude (*, Bii and Cii, insets). Aiii–Ciii, Firing of the same interneurons during spontaneous cortical activation. Typically,NOS� interneurons fired single spikes at comparatively low rates (�2 spikes/s) during the activated state. Scale bars: Ai–Ci, 20 �m. Vertical scale bars: Aii–Cii and Aiii–Ciii, 1 mV; horizontal scalebars: Aii–Cii and Aiii–Ciii, 1 s. Horizontal scale bars: Bii inset and Cii inset, 200 ms.
Sharott et al. • Striatal Interneuron Activity In Vivo J. Neurosci., September 19, 2012 • 32(38):13221–13236 • 13227

are substantial overlaps in the firing properties of each cell type,thus confounding ready classification of cell type on the basis ofrate/pattern alone. With this in mind, we tested additional elec-trophysiological parameters that might be useful in further teas-ing apart their activity signatures. Many studies have used thewaveforms of extracellularly recorded action potentials to assignputative cell-type identities to striatal units (Berke et al., 2004;Mallet et al., 2005; Sharott et al., 2009). It was readily apparent inour extracellular recordings that PV� interneurons fired spikesthat were shorter in duration (�1 ms) than those fired by theother neuron types (typically �1.5 ms) (Fig. 5Di). Scatter plots of
the durations of the first (peak) and second (trough) deflectionsof the average spikes of all identified neurons reflected this obser-vation; only the PV� interneurons formed a separate cluster,although this was occasionally infiltrated by other neuron types(Fig. 5Dii). Plots of the slopes of these deflections (Fig. 5Di) pro-duced a slightly better separation between PV� interneurons,ChAT� interneurons, and MSNs (Fig. 5Diii), but did not im-prove on the degree of separation achieved for nonidentified neu-rons recorded using metal electrodes (Berke et al., 2004; Sharottet al., 2009). We attempted to correct each spike waveform pa-rameter using the function of the best-fit linear relationship withamplitude. Linear correlations between peak/trough durationand amplitude were weak and therefore produced little improve-ment in separation of clusters. The spike slope parameters, how-ever, showed strong linear correlations with amplitude and, aftercorrection, led to a considerable improvement in cluster separa-tion between PV� interneurons, ChAT� interneurons, andMSNs (Fig. 5Div). In addition, using the corrected slopes meantthat NOS� interneurons were confined to the ChAT� interneu-ron cluster (cf. Fig. 5Diii,Div).
In summary, these striatal interneurons and MSNs displayedbrain state-dependent differences in their firing rates and regu-larities, and some key differences in their action potential wave-forms. However, our data suggest that, at least for extracellularrecordings using this and similar configurations, these electro-physiological parameters cannot be used in isolation to unequiv-ocally distinguish these interneurons from each other, or fromMSNs, in a given brain state. Thus, neurochemical identificationand/or a combination of these and other electrophysiological pa-rameters are necessary for classifying individual striatal neuronswith confidence.
Striatal interneurons show cell type-specific responses tosomatosensory stimulationHaving established that the firing rates and/or patterns of theseinterneurons differ according to the cortical states that spontane-ously arise under this anesthetic regimen, we hypothesized thatthey would also fire differently during sensory input-drivenchanges in cortical activity. To test this, we examined the re-sponses of each type of interneuron to somatosensory stimula-tion, delivered to the contralateral hindpaw as a standardizedsustained (15 s) pinch. Each cortical response to this stimulus wascategorized according to its ECoG effect; pinches that led to atransition from SWA to cortical activation were considered toconstitute driven activation, whereas those pinches that were de-livered during the activated state itself, and thus, did not causethis ECoG transition, were categorized as activated pinch.
Figure 6 shows the responses of four different ChAT� in-terneurons to driven activation. During the initial SWA (justbefore the pinch delivery), the firing rate/pattern of each is mark-edly different, thus reflecting the diverse spontaneous firing ofcholinergic interneurons (Fig. 1). In the case of the first interneu-ron, whose firing was relatively well locked to the cortical slowoscillation (Fig. 6A), the pinch stimulus resulted in a change offiring pattern to a more regular, single-spike firing. In the otherthree cases, there were negligible changes in firing rate and pat-tern during stimulus delivery (Fig. 6B–D). Thus, despite smallincreases and decreases being exhibited by individual interneu-rons (Fig. 6E,F), there was, on average, no significant change infiring rate during the pinch (n 41 pinches tested across 12neurons; Wilcoxon sign-rank test). Similarly, there was nochange in firing pattern, as measured by CV or CV2 (Fig. 6G).However, there was a significant decrease in unit-ECoG coher-
Figure 4. Striatal units displaying classical extracellular characteristics of low-thresholdspike bursts have different firing properties to identified NOS� interneurons. A, Recording of asingle unit in striatum (an unlabeled neuron) that, during cortical SWA, fired bursts of 2– 6action potentials that fit classical extracellular criteria of LTS bursts. Thus, after a period ofquiescence lasting �100 ms, such LTS units often fired high-frequency spike bursts (threetypical bursts, 1–3, are outlined by dashed boxes) with an initial intraburst spike interval of �5ms. Horizontal scale bars for expanded LTS bursts 1–3 (top traces) are 10 ms. B, Mean ISI as afunction of the number of spikes in an LTS burst (all LTS bursts of 2– 6 spikes from all LTS unitsrecorded in SWA and/or cortical activation are plotted). Note the progressive increases in ISIdurations as the bursts evolve. C, The duration of the first ISI in a given LTS burst was highlypredictive of the total number of spikes to be subsequently fired. The negative correlation waswell fit by an exponential decay function (black line). Numbers indicate number of bursts ana-lyzed. D, Normalized ISI histograms of LTS units (dark gray) and identified NOS� interneurons(light gray) recorded during SWA. E, Normalized ISI histograms of LTS units and NOS� in-terneurons recorded during spontaneous cortical activation (Act.). Note that, regardless of brainstate, LTS units and NOS� interneurons exhibited different histogram profiles, as particularlyevident at short ISIs (�10 ms). Vertical scale bars, A, 1 mV; horizontal scale bar, A, 1 s. Data inB are means, data in C are means � 2 SEMs, and data in D–E are means � SEMs.
13228 • J. Neurosci., September 19, 2012 • 32(38):13221–13236 Sharott et al. • Striatal Interneuron Activity In Vivo

ence at cortical slow oscillation frequencies (0.4 –1.6 Hz) duringthe pinch (Fig. 6H), in line with the diminished slow oscillationsthat help define the activated state, but the magnitude of thiscoherence change showed no significant correlation with anymeasure of firing rate or pattern. The few ChAT� interneuronswe recorded during activated pinches (n 3 interneurons) againshowed only minor changes in firing rate or pattern (data notshown).
In contrast to cholinergic interneurons, most PV� interneu-rons and NOS� interneurons displayed striking responses tothese somatosensory stimuli (Fig. 7). Individual PV� interneu-rons could respond with a sustained increase in firing rate duringboth driven activations and activated pinches (Fig. 7A). Althoughhighly variable in relative magnitude, such increases were exhib-ited by most PV� interneurons for both types of stimuli (Fig.7B,C) and, on average, firing rates significantly increased during
driven activation (Fig. 7D; n 19 pinches tested across five neu-rons) and activated pinches (Fig. 7E; n 22 pinches tested acrossseven neurons). In addition, there was an increase in PV� in-terneuron firing regularity during the stimulus, evident as a sig-nificant decrease in mean CV2 for both categories of pinches(from 1.22 to 0.86 during driven pinches, and from 0.93 to 0.79during activated pinches). Compared with PV� interneurons,the NOS� interneurons had the opposite firing rate response tosomatosensory stimulation (Fig. 7F–J). Figure 7F shows the re-sponses of two NOS� interneurons (recorded in the same ani-mal) to driven activation and activated pinch, respectively. Inboth cases, there was a reduction in firing for the duration of thestimulus. For driven activation, this response was highly consis-tent across NOS� interneurons, the decrease in firing rate beingmore prominent in the first 5 s after pinch onset (Fig. 7G), and,on average, this decrease was significant across pinches (Fig. 7I;
Figure 5. Quantitative comparisons of firing rates and patterns of identified striatal interneurons and projection neurons according to brain state. A, Firing rates of striatal interneurons (ChAT�,red; PV�, green; or NOS�, purple) and projection neurons (MSNs, blue) during SWA and spontaneous cortical activation (Act.). Black bars and asterisks underneath box plots indicate significantdifferences within a cell type ( p � 0.05, Mann–Whitney U tests), whereas bars and asterisks above box plots indicate significant differences across cell types ( p � 0.05 for both Kruskal–WallisANOVAs and post hoc Dunn’s tests). The number of neurons included in each group is shown in parenthesis and is the same for A and B. B, Firing regularities of striatal interneurons and MSNs duringthe two spontaneous brain states. Regularity was quantified by CV2 measures, with a lower CV2 reflecting more regular firing. C, Normalized ISI histograms (means � SEMs) for each cell type duringSWA (darker colors) and activation (lighter colors). D, Analyses of action potential shape. Di, Mean action potential waveforms for each cell type (means � SEMs), indicating parameters used forsubsequent plots. Dii, Scatter plot of average durations of action potential peaks (d1) and troughs (d2) for every identified neuron (color coded as in Di). The characteristically brief spikes fired byPV� interneurons (green) are partially separated, but the spikes of the other three cell types are interspersed. Diii, Scatter plot of average slopes of first two deflections of action potentials (s1 ands2 in Di). ChAT� interneurons, PV� interneurons, and MSNs are somewhat segregated from each other. Div, Scatter plot of the slopes s1 and s2 corrected for spike amplitude. ChAT� interneurons,PV� interneurons, and MSNs are almost segregated from each other, but NOS� interneurons are mostly contained within the ChAT� interneuron cluster. Box plots in this and all subsequentfigures show the medians, the interquartile ranges (box), and extremes of the range (whiskers, within 99% of the distribution).
Sharott et al. • Striatal Interneuron Activity In Vivo J. Neurosci., September 19, 2012 • 32(38):13221–13236 • 13229

n 28 pinches tested across six neurons). Of the three NOS�interneurons we recorded during activated pinches, two showeddecreasing firing rates and one showed an increase in firing rate atthe start of the pinch, leading to no significant difference onaverage (Fig. 7J; n 11 pinches tested across three neurons).
In summary, striatal interneurons demonstrated notable celltype-specific differences in their firing during sensory input-driven changes in cortical activity. On average, ChAT� interneu-rons did not respond to somatosensory stimulation with asignificant change in firing rate or pattern. In contrast, PV�interneurons increased their firing rate and regularity, whereasNOS� interneurons decreased their firing rate.
Phase-locking of striatal neuron activity to corticalnetwork oscillationsGiven that the firing rates/patterns of some types of striatal in-terneuron are highly dependent on brain state, and that brain
states here are defined by cortical oscillations, we next investi-gated the fine temporal dynamics of these activity relationships.The ECoG displays several distinct oscillations that are synchro-nized across many brain areas, including the basal ganglia. Forexample, during SWA, slow oscillations (�1 Hz) and spindleoscillations (7–12 Hz) are prominent activities across severalbasal ganglia nuclei, including striatum (Berke et al., 2004; Magillet al., 2004a). Gamma-frequency oscillations (typically �30 Hz)also occur during SWA and have been used to study corticalmicrocircuits (Hasenstaub et al., 2005). They become particu-larly prominent during cortical activation (Magill et al., 2004a).We thus focused our analyses on the relationships between thefiring of our four populations of identified striatal neurons andcortical network oscillations in these three frequency bands.
Regardless of cell type, the firing of �85% of striatal neuronsin each population was significantly locked to the cortical slowoscillation (Rayleigh’s uniformity tests; Fig. 8A), and, on average,phase-locked neurons fired on the ascending portion (near thepeak) of the oscillation (Fig. 8B). After accounting for the non-sinusoidal nature of cortical slow oscillations (see Materials andMethods), the mean phase angle of firing of ChAT� interneu-rons was significantly different (earlier in the cycle) comparedwith the other three neuron types, which fired at comparativelysimilar phases to each other (Watson–Williams F tests; Fig. 8C).Population vector lengths were relatively large, and similar acrossall four neuron types (Fig. 8C, center), suggesting the mean angleof firing was highly consistent within each population. In terms ofthe relative strengths of phase-locked firing, however, there was asignificant effect of cell type on vector length (Kruskal–WallisANOVA), with ChAT� interneurons exhibiting significantlyshorter vector lengths and thus, weaker locking to the slow oscil-lation, as compared with PV� interneurons and MSNs (Dunn’stest; Fig. 8D). In addition, PV� interneurons also had signifi-cantly greater vector lengths and thus, tighter locking, thanNOS� interneurons (Fig. 8D).
In contrast to slow oscillations, different types of striatal neu-rons showed clear differences in their respective propensities tofire in a phase-locked manner to spindle oscillations (Fig. 8E).For example, whereas most PV� interneurons fired phase-locked to spindle oscillations, the NOS� interneurons did soonly rarely (too few to quantitatively analyze). On average, bothPV� interneurons and MSNs tended to fire close to the trough ofthe spindle oscillation (Fig. 8F). In contrast, ChAT� interneu-rons fired further along the ascending portion, and their meanphase angle was significantly different from those of PV� in-terneurons and MSNs (Fig. 8G). Moreover, the phase-locking ofChAT� interneurons was comparatively weaker. Indeed, therewas an effect of cell type on vector length, with ChAT� interneu-rons having significantly smaller vectors than PV� interneuronsand MSNs (Fig. 8H). Cholinergic interneurons, therefore, notonly tended to fire at a different phase, but also in a weakermanner, compared with PV� interneurons and MSNs for bothcortical slow and spindle oscillations.
During both SWA and cortical activation, only PV� in-terneurons and ChAT� interneurons showed a clear tendency tofire phase-locked to gamma oscillations at 27– 45 Hz (Fig. 9).Notably, none of the NOS� interneurons and only a few MSNswere significantly locked to gamma oscillations and thus, werenot considered further. During SWA, over half of PV� interneu-rons and nearly one-third of ChAT� neurons were significantlylocked to gamma oscillations (Fig. 9A). These neuron typestended to fire most around either side of the gamma oscillationtroughs (Fig. 9B). There was a significant difference between the
Figure 6. Cholinergic interneurons respond weakly to cortical activation driven by somato-sensory stimulation. A–D, Recordings of four different ChAT� interneurons (top traces, unitactivities) before, during, and after a 15 s pinch delivered to the hindpaw (gray bars). As shownby the ECoGs (bottom traces), the somatosensory stimulus led in each case to a brain statetransition from SWA to cortical activation. Each interneuron exhibited a different firing modeduring SWA: regular, but weakly timed with the cortical slow oscillation (A); regular, but nottimed with slow oscillations (B); irregular (C); and bursting (D). Only the interneuron in Asubstantially changed its firing (pattern) in response to the pinch; the other three interneuronsexhibited negligible changes in firing rate/pattern. E, Mean responses of all ChAT� interneu-rons tested (thin gray lines) and their grand average response (thick black line), normalized tobaseline firing rate (15 s immediately before the pinch). Pinch delivery is indicated by gray bar.F, G, Mean firing rate (F ) and mean CV2 (G) of each interneuron before and during each pinch(denoted Pre. and Pin., respectively). H, Coherence between ECoG slow oscillations (0.4 –1.6Hz) and the firing of each interneuron before and during the pinch (*p � 0.05, Wilcoxon test).Note that, despite the reduced coherence that reflects the diminished slow oscillations duringactivation (H ), ChAT� interneurons did not on average significantly change either their firingrate or regularity during somatosensory stimulation (E–G). Vertical scale bars: A–D, 1 mV;horizontal scale bars: A–D, 1 s. Larger filled circles in F–H show the population means from allpinches (�2 SEMs).
13230 • J. Neurosci., September 19, 2012 • 32(38):13221–13236 Sharott et al. • Striatal Interneuron Activity In Vivo

mean angle of each population (Fig. 9C), with PV� interneuronsfiring on average before the ChAT� interneurons. Moreover, asshown in plots of vector lengths (Fig. 9D), the phase-locked firingof PV� interneurons was significantly stronger than that ofChAT� interneurons. During cortical activation, the firing ofapproximately one-third of both PV� and ChAT� interneuronswas significantly phase-locked to gamma oscillations (Fig. 9E). Incontrast to our results relating to gamma oscillations in SWA,both types of interneuron fired on or just after the trough ofgamma oscillations in the activated brain state, with no signifi-cant difference between their mean angles or vector lengths (Fig.9F–H). The mean angle of PV� interneuron phase-locking togamma oscillations was significantly different between SWA andactivated states.
In all frequency bands analyzed here (slow oscillations, spin-dles, gamma), there was no effect of the cell type on the power ofthe cortical oscillations, suggesting that the distinct phase-locked
firing of different neuron types did notarise because of any systematic bias inECoGs. In summary, striatal neuronsshowed substantial variation in theirpropensity to fire action potentials phase-locked to ongoing cortical network os-cillations, as well as differences in thestrength and angle of this locking. Regard-less of the cortical oscillation examined,PV� interneurons were the most likely tophase lock their activity, and they gener-ally exhibited the strongest degree of tem-poral coupling. At the other end of thespectrum, NOS� interneurons exhibitedthe poorest incidence of phase-locking.Notably, �30% of ChAT� interneuronswere phase locked to cortical spindle andgamma oscillations, despite relativelyweak coupling at the level of individualneurons. Thus, identified striatal neuronsexhibit cell type-selective differences inthe prevalence, strength, and phase oftheir temporally coupled activities withcortex.
Striatal interneurons and projectionneurons respond selectively to electricalstimulation of the motor cortexThe distinct relationships between the fir-ing of identified striatal neurons andspontaneous/driven cortical activities, aswell as their disparate temporal couplingto ongoing cortical oscillations, might beaccompanied by differences in the waythese neurons respond to highly synchro-nized cortical outputs. To investigate thispossibility, we studied the responses ofMSNs and the three types of interneuronto brief, single-pulse electrical stimulationof the ipsilateral motor cortex (Fig. 10).We initially focused our analyses on re-sponses (excitations) with short latenciesof 1.5–15 ms, which are thought to be theresult of the synchronous engagement ofstriatal neurons by monosynaptic corticalinputs (Mallet et al., 2005). More than half
of MSNs and PV� interneurons, but only a minority of cholin-ergic interneurons and NOS� interneurons, responded signifi-cantly in this short-latency window (Fig. 10A,B). We also testedfor cell type-specific differences in the timing of the first evokedspike and the number of spikes evoked at short latency in eachstimulus trial (Fig. 10C,D). Because only two NOS� interneu-rons responded at short latency, they could not be included in thestatistical analyses. However, their response parameters are stillplotted for comparison (Fig. 10C,D). There was a significanteffect of cell type on the latency of the first evoked spike(Kruskal–Wallis ANOVA), with PV� interneurons respondingat significantly shorter latencies than both ChAT� interneuronsand MSNs, which were themselves comparatively similar(Dunn’s test, Fig. 10C), in line with the hypothesized role of PV�interneurons in providing feedforward inhibition of MSNs (Kitaet al., 1990; Mallet et al., 2005). Also as previously reported (Mal-let et al., 2005), PV� interneurons could respond to individual
Figure 7. PV� interneurons and NOS� interneurons respond in opposite ways to somatosensory stimulation. A, Responses ofthe same PV� interneuron to a 15 s hindpaw pinch (red bar) that led to a brain state transition (driven activation in Ai) and anotherpinch that was delivered during spontaneous cortical activation (activated pinch in Aii), as defined by the ECoGs (lower traces).Both stimuli were associated with a sustained increase in interneuron firing rate. B, C, Mean normalized responses of all PV�interneurons tested (thin lines) and their grand average responses (thick lines) to driven activation (B) and activated pinch (C). D,E, Mean firing rate of each PV� interneuron before (Pre) and during (Pin.) every test of driven activation (D) and activated pinch(E). Population means (�2 SEMs) are shown by larger filled circles. Note that, on average, PV� interneurons significantlyincreased their firing during somatosensory stimulation (*p � 0.05, Wilcoxon test). F, Responses of two different NOS� interneu-rons, recorded in the same animal, to driven activation (Fi) and activated pinch (Fii). In both cases, the pinch delivery (red bars) wasassociated with a sustained decrease in firing rate. G, H, Normalized mean responses of all NOS� interneurons tested (thin lines)and their grand average responses (thick lines) to driven activation (G) and activated pinch (H ). I, J, Mean firing rate of each NOS�interneuron before and during every test of driven activation (I ) and activated pinch (J ). Note that, on average, NOS� interneu-rons significantly decreased their firing during driven activation (*p � 0.05, Wilcoxon test). Vertical scale bars: A and D, 1 mV;horizontal scale bars: A and D, 1 s.
Sharott et al. • Striatal Interneuron Activity In Vivo J. Neurosci., September 19, 2012 • 32(38):13221–13236 • 13231

cortical stimuli with either a single spikeor a burst of 2– 4 spikes, whereas the otherthree neuron types predominantly re-sponded with only single spikes. Therewas a significant effect of cell type on thenumber of spikes fired per stimulus, withthe mean number of spikes per trial beingsignificantly higher for PV� interneuronsthan ChAT� interneurons and MSNs(Fig. 10D). It is noteworthy that the twoNOS� interneurons that responded atshort latencies fired single spikes at timesthat better matched those of PV� in-terneurons than those of either ChAT�interneurons or MSNs, and therefore,may also potentially mediate a feedfor-ward modulation of MSN activity (Fig.10C–E). In addition to the two NOS� in-terneurons that responded at short laten-cies, three other NOS� interneurons firedinstead at a longer latency of between 20and 50 ms (Fig. 10Eiii,F). Equivalentanalysis of this time window (first spikesat 20 –50 ms in �35% of stimulation tri-als) revealed that no other type of striatalneuron responded to cortical stimulationat these long latencies (Fig. 10G). SomeNOS� interneurons may therefore re-ceive an unusual polysynaptic input fol-lowing cortical stimulation.
In summary, the responses of ChAT�interneurons, PV� interneurons, and NOS�interneurons to highly synchronized corticaloutputs are not equivalent, suggesting impor-tant differences in the ways each cell type isinfluencedbycorticostriatalafferentsaswellasthe subsequent impact of these interneuronson MSNs.
DiscussionDetailed understanding of striatal interneu-ron function requires the electrophysiolog-ical properties of neurochemically identifiedcells to be defined in the context of intactafferent network activity. Here, we reportthe first detailed in vivo characterization ofthe spontaneous and driven firing ofChAT�, PV�, and NOS� interneurons,defined according to ongoing cortical net-work oscillations and recorded/analyzedwithin a single framework. In demonstrat-ing the specific and shared activity featuresof each interneuron type, we provide freshinsights into their respective contributionsto striatal circuit operations.
Because our experimental strategy re-quired anesthesia (for physical stability)we could not directly investigate neuronalcorrelates of behavior. The recording ofindividual neurochemically identified stria-tal neurons has not yet been achievedduring behavior, although this may even-tually be possible in alert, head-restrained
Figure 8. Striatal cell type-selective phase locking of firing to ongoing cortical network oscillations during SWA. A–D, Phase-lockedfiring of striatal neurons to cortical slow oscillations (0.4 –1.6 Hz). A, Proportions of neurons of each type that were significantly phaselocked. The number of neurons tested in each group is shown in parenthesis. B, Linear phase histograms of significantly locked striatalinterneurons and MSNs (data are means). For clarity, two cortical slow oscillation cycles are shown. All types of neurons tended to fire alongthe ascending portion of the oscillation. C, Circular plots for each neuron of each type showing the mean angle of phase locking. Vectors ofpreferred firing (i.e., mean phase of all the spikes) of individual neurons are shown as lines radiating from the center. Greater vector lengthsindicate lower variance in the distribution around the mean phase angle for each neuron. Each circle on the plot perimeter represents thepreferred phase angle of an individual neuron. The smaller center plot shows the vector length and mean angle for each population, withthestatisticalcomparisonofthelatter(*p�0.05,Watson–WilliamsF tests).ThemeanangleofphaselockingofChAT� interneuronswassignificantly different from those of the other three neuron types. D, Vector lengths for each neuron type. The vector length here measures,on a cell-by-cell basis, the consistency of locking around the mean angle, with 0 being random and 1 being zero variance. ChAT�interneurons and NOS� interneurons had significantly shorter vectors and thus, were weaker locked to slow oscillations, than PV�interneurons. ChAT� interneurons were also weaker locked than MSNs (*p �0.05 for both Kruskal–Wallis ANOVAs and post hoc Dunn’stests). E–H, As in A–D, but phase-locked firing to cortical spindle oscillations (7–12 Hz). Note that the proportions of locked neurons duringspindles, as well as the preferred phases and variance of their firing, differed as compared with those during slow oscillations. However,ChAT� interneurons were still weaker locked than PV� interneurons and MSNs. NOS� interneurons were not included in statisticalanalyses in G and H because of the small sample of significantly locked interneurons (n 2), but are shown for comparison.
13232 • J. Neurosci., September 19, 2012 • 32(38):13221–13236 Sharott et al. • Striatal Interneuron Activity In Vivo

animals (Isomura et al., 2009). Although intracellular recordingscan provide valuable information on the intrinsic properties andsynaptic inputs of identified interneurons, such studies have col-lectively accumulated small fractions of the samples reportedhere (Wilson et al., 1990; Reynolds and Wickens, 2004; Schulz etal., 2011a,b). Despite the caveats of our strategy, it enabled robustsampling that in turn allowed us to define a wide range of activ-ities according to cell type and brain state, to infer intrinsic prop-erties and inputs, and to re-assess the presumed identities ofneurons recorded in awake animals.
Studies of the firing of putatively identified neurons in behav-ing animals have been critical for elucidating function in striatalmicrocircuits. In primates, TANs are generally assumed to becholinergic interneurons (Goldberg and Reynolds, 2011),whereas phasically active neurons (PANs) are assumed to bemostly MSNs (Kimura et al., 1996; Joshua et al., 2008; Deffains etal., 2010). Our recordings shed new light on this classificationscheme. During cortical SWA, ChAT� interneurons and somePV� and NOS� interneurons displayed tonic activity (definedas near-continuous firing), with similar firing rates. IdentifiedMSNs, and other PV� and NOS� interneurons, were phasi-cally active (firing infrequently). During cortical activation, abrain state that better recapitulates neuronal activity duringwakefulness, PV� interneurons fired tonically at equivalent(albeit more variable) rates to cholinergic interneurons, butwith lower regularity. Recorded with glass electrodes, ourChAT� interneurons did not have the especially broad actionpotentials of TANs recorded in primates (Goldberg and Reyn-olds, 2011), but our PV� interneuron recordings indicate that
their characteristically brief spikes should help distinguishthem from cholinergic and other interneurons. While bothChAT� and PV� interneurons fired significantly faster thanMSNs during cortical activation, the firing rates/patterns ofNOS� interneurons were indistinguishable from them. Interms of TAN and PAN categories, NOS� interneurons aretherefore more likely to belong to PANs during alert behavior,despite evidence that many can fire autonomously in a tonicmanner in vitro (Partridge et al., 2009; Ibanez-Sandoval et al.,2011; Beatty et al., 2012), and it may therefore be challengingto distinguish them from MSNs in awake animals.
We provide a first working definition of some fundamentalfiring properties of identified NOS� interneurons in vivo. Basedon their somatodendritic structure, and coexpression of NPY,these NOS� interneurons are likely the persistent or plateau LTScells described in vitro (Kawaguchi, 1993; Centonze et al., 2002;Partridge et al., 2009; Gittis et al., 2010). A population of uniden-tified striatal neurons in halothane-anesthetized rodents exhibitthe classical (thalamic) extracellular signatures of LTS bursts(Sharott et al., 2009), and we now extend this finding to anotheranesthetic regimen. Importantly though, none of our identifiedNOS� interneurons fired such LTS bursts, suggesting theseevents are not useful for definitively classifying these cells in vivo.In line with this, recordings of NOS�/NPY� neurons in vitroshow that the regular and irregular modes of their autonomousfiring are not related to LTS bursts (Beatty et al., 2012). The “LTSunits we recorded might instead correspond to a rare type oftyrosine hydroxylase-expressing interneuron described in vitro(Ibanez-Sandoval et al., 2010).
Figure 9. PV� interneurons and ChAT� interneurons can phase lock their firing to cortical gamma oscillations. A–D, Phase-locked firing of striatal neurons to cortical gamma oscillations(27– 45 Hz) during SWA. A, Proportions of neurons of each type that were significantly phase locked. The number of neurons analyzed tested in each group is shown in parentheses. Only ChAT�interneurons and PV� interneurons phase locked their firing at the population level well above chance (5%). B, Mean phase histograms of significantly locked ChAT� interneurons and PV�interneurons (two gamma cycles shown for clarity). These neuron types tended to fire most around either side of the gamma oscillation troughs. C, Circular plots of the preferred firing ofChAT� interneurons and PV� interneurons (following the same labeling and conventions of plots in Fig. 8). The mean angle of phase locking of ChAT� interneurons was significantly differentfrom that of PV� interneurons (smaller plot, left). D, Vector lengths for each neuron type. ChAT� interneurons had significantly shorter vectors and thus, were weaker locked to gamma oscillations,than PV� interneurons (*p � 0.05, Mann–Whitney U test). E–H, As in A–D, but phase-locked firing to gamma oscillations (27– 45 Hz) present during spontaneous cortical activation. Again,ChAT� interneurons and PV� interneurons most often phase locked their firing to cortical gamma oscillations. However, in contrast to gamma during SWA, they phase-locked their firing to thesame mean angle and with the same strength.
Sharott et al. • Striatal Interneuron Activity In Vivo J. Neurosci., September 19, 2012 • 32(38):13221–13236 • 13233

Although LTS bursts are not signature activities of NOS�interneurons in vivo, this cell type can be distinguished by itscharacteristic dependence on brain state. Indeed, NOS� in-terneurons were remarkable because they significantly decreasedtheir firing with spontaneous or somatosensory input-driventransitions from SWA to cortical activation. In contrast, PV�interneurons robustly increased their firing, and ChAT� in-terneurons barely changed their activity. Given that NOS� in-terneurons can fire in the absence of inputs, their decreasedactivity is likely underpinned by reduced synaptic excitationand/or increased inhibition during activated brain states. Re-duced corticostriatal input is unlikely (Mallet et al., 2005), andour recordings show that MSNs do not increase their firing rates.It is thus tempting to speculate that it is the highly active PV�interneurons that mediate the low firing rates of NOS� interneu-rons, especially because PV� neurons are known to innervateNOS� interneurons (Morello et al., 1997). Cholinergic interneu-rons are likely not responsible because they did not consistentlychange firing rate/pattern in relation to brain state or in responseto somatosensory stimuli. Moreover, the three firing modes ofcholinergic interneurons we show here are close approximationsof the autonomous regular, irregular, and burst firing seen invitro (Bennett and Wilson, 1999), suggesting that, in the absenceof salient external stimuli, their spontaneous firing in vivo islargely governed by intrinsic membrane properties. These threetypes of interneuron can therefore be broadly distinguished bytheir sensitivities to spontaneous and driven changes in brainstate.
The role of synchronized network oscillations in basal gangliafunctional organization has assumed increasing prominence,partly because they are pathologically altered in Parkinsonism(Costa et al., 2006; Eusebio et al., 2009), but also because of theirtask-related modulation in healthy animals (DeCoteau et al.,2007; Leventhal et al., 2012). Basal ganglia network oscillationsare likely to be highly dependent on synchronized cortical andthalamic inputs for which the striatum is a key entry point intothe basal ganglia. With this in mind, we quantified the manner inwhich these identified striatal interneurons fired action poten-tials in time with ongoing cortical oscillations, and found celltype-selective differences in the prevalence, strength, and phaseof their temporally coupled activities. Regardless of the corticaloscillation examined, PV� interneurons were most likely tophase lock their activity, and they generally exhibited the stron-gest degree of temporal coupling. In line with this, PV� in-terneurons had the most robust responses to cortical stimulation.Many studies have already pointed to a prominent role for theseinterneurons in striatal oscillations. Indeed, striatal FSIs locktheir firing to spindles and gamma oscillations (Berke et al., 2004;Berke, 2009; Sharott et al., 2009; van der Meer and Redish, 2009)and FSI pairs can rhythmically synchronize their firing at thesefrequencies (Sharott et al., 2009). Moreover, intracellular record-ings have demonstrated gamma oscillations in the membranepotentials of these interneurons, which are likely to result fromconvergent synaptic inputs and intrinsic resonance (Schulz et al.,2011b; Sciamanna et al., 2011). Approximately one-third ofChAT� interneurons fired phase-locked to cortical spindle andgamma oscillations. Given their powerful intrinsic firing mecha-
Figure 10. Responses of striatal neurons to electrical stimulation of the motor cortex. A,PSTHs (1 ms bins) of the average responses of the different types of striatal neuron (Ai, MSN; Aii,ChAT�; Aiii, PV�; Aiv, NOS�) to cortical stimulation (single pulses delivered at 0 ms). Insetsshow the responses of individual neurons (thin lines) during the first 20 ms after stimulation,with gray boxes marking the time window (1.5–15 ms lag) used for analyses of whether thefirst spike was evoked at short latencies. B, Proportions of each type of neuron that displayed asignificant short-latency response. Numbers of neurons tested for responses are shown in pa-rentheses. C, Latencies of the first evoked spikes of all significantly responding neurons (*p �0.05 for both Kruskal–Wallis ANOVAs and post hoc Dunn’s tests). Numbers of responsive neu-rons are shown in parentheses. On average, PV� interneurons fired at a significantly shorterlatency than ChAT� interneurons and MSNs. NOS� interneurons were not included in thisstatistical analysis because of the small sample of significantly responding interneurons (n 2), but are shown for comparison. D, Mean number of spikes fired per stimulus trial for neuronsresponding at short latency. Only PV� interneurons consistently fired more than one spike inresponse to cortical stimulation. E, Unit-activity recordings (single representative sweeps ofstimulation artifacts and evoked responses, with dashed line indicating stimulation onset) oftwo NOS� interneurons that fired at short latencies (�5 ms; Ei, ii) and another NOS� in-terneuron that instead fired at a predefined long latency (20 –50 ms; Eiii). F, PSTHs (1 ms bins)of the average responses of the three NOS� interneurons that fired at long latencies (20 –50ms). Inset shows the responses of these individual neurons (thin lines) during the first 50 ms
4
afterstimulation,withthelightgrayanddarkgrayboxesmarkingthetimewindowsusedtodefineresponsesat short latencies and long latencies, respectively. G, Proportions of each type of neuron that displayed asignificant long-latencyresponse.OnlyNOS� interneuronsrespondedat longlatencies.
13234 • J. Neurosci., September 19, 2012 • 32(38):13221–13236 Sharott et al. • Striatal Interneuron Activity In Vivo

nisms, this is perhaps surprising but, nevertheless, suggests theirfiring can be subtly influenced by the rhythmic activities of affer-ent networks. Anatomical evidence suggests that such entrain-ment is more likely to be mediated by thalamic than corticalafferents (Lapper and Bolam, 1992). Indeed, the differences intheir preferred angles of phase locking as compared with those ofthe more “cortically dominated” PV� interneurons could betaken as supportive physiological evidence. However, the short-latency responses of some ChAT� interneurons to cortical stim-ulation indicates that there are stronger functional connectionsbetween cortex and cholinergic interneurons than those sug-gested by anatomical data (Reynolds and Wickens, 2004; Ding etal., 2010). Notably, NOS� interneurons exhibited relatively poorphase locking to cortical oscillations. Thus, although cortex in-nervates NOS� interneurons (Vuillet et al., 1989; Sammut et al.,2007), the impact of such inputs on their firing might be relativelysmall (Gittis et al., 2010). Given the weak GABAergic connectionsof NOS� interneurons with MSNs, it has been proposed thatthey predominantly modulate MSN activity by nitric oxideand/or neuropeptide release (Gittis et al., 2010; Ibanez-Sandovalet al., 2011), rather than providing the fast, feedforward inhibi-tion commonly ascribed to PV� interneurons. Moreover, theresponses of some NOS� interneurons to cortical activation thatwe observed may actually mediate feedforward excitation (On-dracek et al., 2008). The different relationships of these twoGABAergic interneuron types to cortical state changes, oscilla-tions, and inputs provides further evidence that they play diverse,possibly opposing, roles in orchestrating information flow in stri-atal microcircuits.
Despite many recordings of striatal neurons in different ex-perimental preparations, the precise computation performed bystriatal circuits remains unclear (Nambu, 2008). Functionally di-verse inputs to different striatal territories suggest that this com-putation is unlikely linked to a specific behavior, but rather, to aspecific operation performed by fundamental circuit compo-nents that exist in all striatal areas. The temporal activity signa-tures of different interneuron types, the diverse nature of theirresponses to afferent inputs, and their participation in networkactivities that we elucidate here are all likely important for suchcomputation, and can aid the definition of their respective, spe-cialized contributions to circuit function.
ReferencesBeatty JA, Sullivan MA, Morikawa H, Wilson CJ (2012) Complex autono-
mous firing patterns of striatal low-threshold spike interneurons. J Neu-rophysiol 108:771–781.
Bennett BD, Wilson CJ (1999) Spontaneous activity of neostriatal cholin-ergic interneurons in vitro. J Neurosci 19:5586 –5596.
Berens P (2009) CircStat: A MATLAB Toolbox for Circular Statistics. J Sta-tistical Software 31:1–21.
Berke JD (2011) Functional properties of striatal fast-spiking interneurons.Front Syst Neurosci 5:45.
Berke JD (2009) Fast oscillations in cortical-striatal networks switch fre-quency following rewarding events and stimulant drugs. Eur J Neurosci30:848 – 859.
Berke JD, Okatan M, Skurski J, Eichenbaum HB (2004) Oscillatory entrain-ment of striatal neurons in freely moving rats. Neuron 43:883– 896.
Centonze D, Bracci E, Pisani A, Gubellini P, Bernardi G, Calabresi P (2002)Activation of dopamine D1-like receptors excites LTS interneurons of thestriatum. Eur J Neurosci 15:2049 –2052.
Costa RM, Lin SC, Sotnikova TD, Cyr M, Gainetdinov RR, Caron MG, Ni-colelis MA (2006) Rapid alterations in corticostriatal ensemble coordi-nation during acute dopamine-dependent motor dysfunction. Neuron52:359 –369.
DeCoteau WE, Thorn C, Gibson DJ, Courtemanche R, Mitra P, Kubota Y,Graybiel AM (2007) Learning-related coordination of striatal and hip-
pocampal theta rhythms during acquisition of a procedural maze task.Proc Natl Acad Sci U S A 104:5644 –5649.
Deffains M, Legallet E, Apicella P (2010) Modulation of neuronal activity inthe monkey putamen associated with changes in the habitual order ofsequential movements. J Neurophysiol 104:1355–1369.
Ding JB, Guzman JN, Peterson JD, Goldberg JA, Surmeier DJ (2010) Tha-lamic gating of corticostriatal signaling by cholinergic interneurons. Neu-ron 67:294 –307.
Domich L, Oakson G, Steriade M (1986) Thalamic burst patterns in thenaturally sleeping cat: a comparison between cortically projecting andreticularis neurones. J Physiol 379:429 – 449.
Eusebio A, Pogosyan A, Wang S, Averbeck B, Gaynor LD, Cantiniaux S,Witjas T, Limousin P, Azulay JP, Brown P (2009) Resonance insubthalamo-cortical circuits in Parkinson’s disease. Brain 132:2139 –2150.
Fanselow EE, Sameshima K, Baccala LA, Nicolelis MA (2001) Thalamicbursting in rats during different awake behavioral states. Proc Natl AcadSci U S A 98:15330 –15335.
Figueredo-Cardenas G, Morello M, Sancesario G, Bernardi G, Reiner A(1996) Colocalization of somatostatin, neuropeptide Y, neuronal nitricoxide synthase and NADPH-diaphorase in striatal interneurons in rats.Brain Res 735:317–324.
Gittis AH, Nelson AB, Thwin MT, Palop JJ, Kreitzer AC (2010) Distinctroles of GABAergic interneurons in the regulation of striatal output path-ways. J Neurosci 30:2223–2234.
Goldberg JA, Reynolds JN (2011) Spontaneous firing and evoked pauses inthe tonically active cholinergic interneurons of the striatum. Neurosci-ence 198:27– 43.
Hasenstaub A, Shu Y, Haider B, Kraushaar U, Duque A, McCormick DA(2005) Inhibitory postsynaptic potentials carry synchronized frequencyinformation in active cortical networks. Neuron 47:423– 435.
Holt GR, Softky WR, Koch C, Douglas RJ (1996) Comparison of dischargevariability in vitro and in vivo in cat visual cortex neurons. J Neurophysiol75:1806 –1814.
Ibanez-Sandoval O, Tecuapetla F, Unal B, Shah F, Koos T, Tepper JM (2010)Electrophysiological and morphological characteristics and synaptic con-nectivity of tyrosine hydroxylase-expressing neurons in adult mousestriatum. J Neurosci 30:6999 –7016.
Ibanez-Sandoval O, Tecuapetla F, Unal B, Shah F, Koos T, Tepper JM (2011)A novel functionally distinct subtype of striatal neuropeptide Y interneu-ron. J Neurosci 31:16757–16769.
Inokawa H, Yamada H, Matsumoto N, Muranishi M, Kimura M (2010)Juxtacellular labeling of tonically active neurons and phasically activeneurons in the rat striatum. Neuroscience 168:395– 404.
Isomura Y, Harukuni R, Takekawa T, Aizawa H, Fukai T (2009) Microcir-cuitry coordination of cortical motor information in self-initiation ofvoluntary movements. Nat Neurosci 12:1586 –1593.
Jeanmonod D, Magnin M, Morel A (1996) Low-threshold calcium spikebursts in the human thalamus. Common physiopathology for sensory,motor and limbic positive symptoms. Brain 119:363–375.
Joshua M, Adler A, Mitelman R, Vaadia E, Bergman H (2008) Midbraindopaminergic neurons and striatal cholinergic interneurons encode thedifference between reward and aversive events at different epochs of prob-abilistic classical conditioning trials. J Neurosci 28:11673–11684.
Kawaguchi Y (1993) Physiological, morphological, and histochemical char-acterization of three classes of interneurons in rat neostriatum. J Neurosci13:4908 – 4923.
Kimura M, Rajkowski J, Evarts E (1984) Tonically discharging putamenneurons exhibit set-dependent responses. Proc Natl Acad Sci U S A81:4998 –5001.
Kimura M, Kato M, Shimazaki H, Watanabe K, Matsumoto N (1996) Neu-ral information transferred from the putamen to the globus pallidus dur-ing learned movement in the monkey. J Neurophysiol 76:3771–3786.
Kita H, Kosaka T, Heizmann CW (1990) Parvalbumin-immunoreactiveneurons in the rat neostriatum: a light and electron microscopic study.Brain Res 536:1–15.
Kolomiets BP, Deniau JM, Glowinski J, Thierry AM (2003) Basal gangliaand processing of cortical information: functional interactions betweentrans-striatal and trans-subthalamic circuits in the substantia nigra parsreticulata. Neuroscience 117:931–938.
Koos T, Tepper JM (1999) Inhibitory control of neostriatal projection neu-rons by GABAergic interneurons. Nat Neurosci 2:467– 472.
Sharott et al. • Striatal Interneuron Activity In Vivo J. Neurosci., September 19, 2012 • 32(38):13221–13236 • 13235

Kubota Y, Mikawa S, Kawaguchi Y (1993) Neostriatal GABAergic interneu-rones contain NOS, calretinin or parvalbumin. Neuroreport 5:205–208.
Lacey CJ, Bolam JP, Magill PJ (2007) Novel and distinct operational princi-ples of intralaminar thalamic neurons and their striatal projections.J Neurosci 27:4374 – 4384.
Lachaux JP, Rodriguez E, Martinerie J, Varela FJ (1999) Measuring phasesynchrony in brain signals. Hum Brain Mapp 8:194 –208.
Lapper SR, Bolam JP (1992) Input from the frontal cortex and the parafas-cicular nucleus to cholinergic interneurons in the dorsal striatum of therat. Neuroscience 51:533–545.
Leventhal DK, Gage GJ, Schmidt R, Pettibone JR, Case AC, Berke JD (2012)Basal ganglia beta oscillations accompany cue utilization. Neuron73:523–536.
Lu SM, Guido W, Sherman SM (1992) Effects of membrane voltage onreceptive field properties of lateral geniculate neurons in the cat: contri-butions of the low-threshold Ca2� conductance. J Neurophysiol68:2185–2198.
Magill PJ, Bolam JP, Bevan MD (2000) Relationship of activity in the sub-thalamic nucleus-globus pallidus network to cortical electroencephalo-gram. J Neurosci 20:820 – 833.
Magill PJ, Sharott A, Bolam JP, Brown P (2004a) Brain state-dependency ofcoherent oscillatory activity in the cerebral cortex and basal ganglia of therat. J Neurophysiol 92:2122–2136.
Magill PJ, Sharott A, Bevan MD, Brown P, Bolam JP (2004b) Synchronousunit activity and local field potentials evoked in the subthalamic nucleusby cortical stimulation. J Neurophysiol 92:700 –714.
Magill PJ, Pogosyan A, Sharott A, Csicsvari J, Bolam JP, Brown P (2006)Changes in functional connectivity within the rat striatopallidal axis dur-ing global brain activation in vivo. J Neurosci 26:6318 – 6329.
Mallet N, Le Moine C, Charpier S, Gonon F (2005) Feedforward inhibitionof projection neurons by fast-spiking GABA interneurons in the rat stria-tum in vivo. J Neurosci 25:3857–3869.
Mallet N, Pogosyan A, Marton LF, Bolam JP, Brown P, Magill PJ (2008)Parkinsonian beta oscillations in the external globus pallidus and theirrelationship with subthalamic nucleus activity. J Neurosci 28:14245–14258.
Mallet N, Micklem BR, Henny P, Brown MT, Williams C, Bolam JP, Naka-mura KC, Magill PJ (2012) Dichotomous organization of the externalglobus pallidus. Neuron 74:1075–1086.
Morello M, Reiner A, Sancesario G, Karle EJ, Bernardi G (1997) Ultrastruc-tural study of nitric oxide synthase-containing striatal neurons and theirrelationship with parvalbumin-containing neurons in rats. Brain Res776:30 –39.
Morris G, Arkadir D, Nevet A, Vaadia E, Bergman H (2004) Coincident butdistinct messages of midbrain dopamine and striatal tonically active neu-rons. Neuron 43:133–143.
Nambu A (2008) Seven problems on the basal ganglia. Curr Opin Neurobiol18:595– 604.
Ondracek JM, Dec A, Hoque KE, Lim SA, Rasouli G, Indorkar RP, LinardakisJ, Klika B, Mukherji SJ, Burnazi M, Threlfell S, Sammut S, West AR(2008) Feed-forward excitation of striatal neuron activity by frontal cor-tical activation of nitric oxide signaling in vivo. Eur J Neurosci27:1739 –1754.
Paladini CA, Tepper JM (1999) GABA(A) and GABA(B) antagonists differ-entially affect the firing pattern of substantia nigra dopaminergic neuronsin vivo. Synapse 32:165–176.
Partridge JG, Janssen MJ, Chou DY, Abe K, Zukowska Z, Vicini S (2009)Excitatory and inhibitory synapses in neuropeptide Y-expressing striatalinterneurons. J Neurophysiol 102:3038 –3045.
Paxinos G, Watson C (1986) The rat brain in stereotaxic coordinates, Ed 2.Sydney: Academic Press.
Ramanathan S, Hanley JJ, Deniau JM, Bolam JP (2002) Synaptic conver-gence of motor and somatosensory cortical afferents onto GABAergicInterneurons in the rat striatum. J Neurosci 22:8158 – 8169.
Reynolds JN, Wickens JR (2004) The corticostriatal input to giant aspinyinterneurons in the rat: a candidate pathway for synchronising the re-sponse to reward-related cues. Brain Res 1011:115–128.
Saleem AB, Chadderton P, Apergis-Schoute J, Harris KD, Schultz SR (2010)Methods for predicting cortical UP and DOWN states from the phase ofdeep layer local field potentials. J Comput Neurosci 29:49 – 62.
Sammut S, Park DJ, West AR (2007) Frontal cortical afferents facilitate stri-atal nitric oxide transmission in vivo via a NMDA receptor and neuronalNOS-dependent mechanism. J Neurochem 103:1145–1156.
Sammut S, Threlfell S, West AR (2010) Nitric oxide-soluble guanylyl cyclasesignaling regulates corticostriatal transmission and short-term synapticplasticity of striatal projection neurons recorded in vivo. Neuropharma-cology 58:624 – 631.
Schulz JM, Oswald MJ, Reynolds JN (2011a) Visual-induced excitationleads to firing pauses in striatal cholinergic interneurons. J Neurosci31:11133–11143.
Schulz JM, Pitcher TL, Savanthrapadian S, Wickens JR, Oswald MJ, ReynoldsJN (2011b) Enhanced high-frequency membrane potential fluctuationscontrol spike output in striatal fast-spiking interneurones in vivo.J Physiol 589:4365– 4381.
Sciamanna G, Tassone A, Martella G, Mandolesi G, Puglisi F, Cuomo D,Madeo G, Ponterio G, Standaert DG, Bonsi P, Pisani A (2011) Develop-mental profile of the aberrant dopamine D2 receptor response in striatalcholinergic interneurons in DYT1 dystonia. PLoS One 6:e24261.
Sharott A, Magill PJ, Bolam JP, Brown P (2005) Directional analysis of co-herent oscillatory field potentials in the cerebral cortex and basal gangliaof the rat. J Physiol 562:951–963.
Sharott A, Moll CK, Engler G, Denker M, Grun S, Engel AK (2009) Differentsubtypes of striatal neurons are selectively modulated by cortical oscilla-tions. J Neurosci 29:4571– 4585.
Steriade M (2000) Corticothalamic resonance, states of vigilance and men-tation. Neuroscience 101:243–276.
Stern EA, Kincaid AE, Wilson CJ (1997) Spontaneous subthreshold mem-brane potential fluctuations and action potential variability of rat corti-costriatal and striatal neurons in vivo. J Neurophysiol 77:1697–1715.
Tepper JM, Bolam JP (2004) Functional diversity and specificity of neostria-tal interneurons. Curr Opin Neurobiol 14:685– 692.
Tepper JM, Tecuapetla F, Koos T, Ibanez-Sandoval O (2010) Heterogeneityand diversity of striatal GABAergic interneurons. Front Neuroanat 4:150.
van der Meer MA, Redish AD (2009) Low and high gamma oscillations inrat ventral striatum have distinct relationships to behavior, reward, andspiking activity on a learned spatial decision task. Front Integr Neurosci3:9.
Vuillet J, Kerkerian L, Salin P, Nieoullon A (1989) Ultrastructural featuresof NPY-containing neurons in the rat striatum. 477:241–251.
Wilson CJ, Chang HT, Kitai ST (1990) Firing patterns and synaptic poten-tials of identified giant aspiny interneurons in the rat neostriatum. J Neu-rosci 10:508 –519.
13236 • J. Neurosci., September 19, 2012 • 32(38):13221–13236 Sharott et al. • Striatal Interneuron Activity In Vivo