Embed Size (px)
Citation preview

Vol. 57: 267-277, 1989 MARINE ECOLOGY PROGRESS SERIES Mar. Ecol. Prog. Ser.
Published November 10
Behavioral responses of larvae of the crab Neopanope sayi to hydrostatic pressure
R. B. Forward, Jr, C. A. Wellins, C. U. Buswell
Duke University Marine Laboratory, Beaufort. North Carolina 28516 USA and
Zoology Department, Duke University, Durham, North Carolina 27706, USA
ABSTFWCT Responses of Stages I and IV zoeae of the crab Neopanope sayi (Smith) to changes in hydrostatic pressure were s tuded using a closed circuit video system to describe the behavior underlying depth regulation. This species occurs as an adult in estuaries but larvae develop in lower estuarine and coastal areas. Larval responses changed little throughout zoeal development. Step increases in pressure evoked an ascent response (thresholds = 3 to 8 mbar) through negative geotaxis and an increase in swimming speed (high barokinesis). Larvae descended, probably by passive sinking, upon step decreases in pressure (threshold = 8mbar) An ascent upon a pressure decrease was not observed. During high barokinesis larvae responded to the absolute amount of pressure change, not to the rate of change. Slmilar directional responses occurred at different rates of change in pressure. Larvae can ascend and descend fast enough under some conditions to induce rates of pressure change that evoke correcuve behavioral responses for depth regulation. These results support Sulkins's (1984) negative feedback model. The depth regulatory window, however, was symmetrical and approximately equal at both zoeal stages upon adaptation to different light levels. Thus the light-dependent negative feedback model of depth regulation is not supported, whlch indicates the depth regulatory demands in upper estuarine and coastal areas are different.
INTRODUCTION
Crustacean larvae respond behaviorally to changes in hydrostatic pressure. Frequently responsiveness var- ies with age, as early larval stages display pronounced responses while later stages show a decline or loss of responsiveness (Ennis 1973, Sulkin 1973, Bentley &
Sulkin 1977, Bigford 1977, Wheeler & Epifanio 1978, Schembri 1982). In general, a pressure increase induces negative geotaxis, positive phototaxis and an increase in swimming speed (high barohnesis), all of which lead to an ascent in the water column (reviewed by Sulkin 1984). In contrast, a descent occurs upon a pressure decrease due to passive sinking (e.g. Ennis 1973, Jacoby 1982, Schembri 1982).
These responses form the basis of Sulkin's (1984) negative feedback model of depth regulation. In this model, the increase in pressure upon a descent evokes a corrective ascent response due to negative geotaxis and an increase in swimming speed. Alternatively, the decrease in pressure during an ascent induces a correc- tive descent response by passive sinlung (Sullun 1984).
Recently Forward & Wellins (1989) tested Sulkin's
Inter-Research/Printed in F R Germany
(1984) negative feedback model in larvae of the xanthid crab Rhithr-opanopeus\ harrisji. This model seems correct as larvae of this species displayed the typical directional responses to pressure changes. Their ascent and descent speeds were fast enough to produce rates of change in pressure that evoke the appropriate corrective responses. The depth regulatory window was estimated by determining the absolute distance moved before the larvae showed corrective vertical responses.
At threshold rates of pressure change, the dimen- sions and symmetry of the depth regulatory window were controlled by the level of light adaptation (For- ward 1989). In darkness and at light intensities one log unit above the lower threshold for phototaxis, the dis- tance larvae descended before responding to a pressure increase was much shorter than the distance they ascended and responded to a pressure decrease. At high light levels the situation reversed, as the ascent distance was much shorter than the descent distance. Thus an ascent in the water column is predicted upon adaptation to low light intensities and descent at high light levels. The effects of light adaptation on the

268 Mar Ecol. Prog. Ser
dimensions of the depth regulatory window provide an additional component to Sulkin's (1984) model that negates the requirement for depth regulation at an absolute depth. The composite model is termed the light-dependent negative feedback model of depth regulation (Forward 1989).
Rhithropanopeus harrisii larvae are retained in the head waters of estuaries (Cronin 1982). Since their depth regulatory responses may be typical of larvae retained in shallow estuaries, the present study was undertaken as a comparison to consider responses of larvae from another xanthid crab that undergoes larval development in coastal areas. Adult Neopanope sayi occur in estuaries but their larvae are planktonic, are transported seaward and undergo zoeal development in lower estuarine and coastal areas (Sandifer 1975, Dittel & Epifanio 1982, Salmon et al. 1986). This study considers (1) the ontogeny of responses by N. sayi larvae to hydrostatic pressure, (2) whether vertical speeds of movement were fast enough to evoke respon- ses to pressure change and (3) the dimensions of the depth regulatory window when adapted to different light intensities.
MATERIALS AND METHODS
Ovigerous Neopanope sayi (Smith) were collected near the entrance to the Newport River estuary (North Carolina, USA) from July to September, 1987 and 1988. Experiments were conducted with Stages 1 and IV (last) zoeae, which were reared in a controlled environ- mental chamber (Sherer; Model CEL4-4) on a 14 : 10 h LD cycle at about 25°C in 33ppt seawater, which was passed through a 5 pm filter. Throughout development, larvae were transferred daily to clean seawater and fed newly hatched Artemia sp. nauplii. These 2 stages were used to test for changes in responsiveness throughout zoeal development. All experiments were performed in the 6 h interval in the middle of the light phase to avoid complications due to possible biological rhythms in behavior. Larvae were light-adapted to room fluorescent light (intensity = about 1 W m-2) prior to all experiments.
Equipment. The equipment for measuring responses to step changes in hydrostatic pressure was patterned after that used by Enright (1962) and was described in detail in Forward & Wellins (1989). Larvae were tested in a water-fdled lucite experimental chamber (inside dimensions 3.1 X 3.1 X 9.3cm) connected by Tygon tubing (inside diameter = 5 mm) to a 50ml syringe. There was no air in the system, as the chamber, tubing and syringe were filled with water. Step changes in pressure were accomplished by adding or removing calibrated weights from the syringe piston with the
units of pressure being milibars (mbar). The system was calibrated by measuring the exact pressure changes with a pressure transducer (Omega model Px931-025CU) connected to the syringe system. The rate of pressure change was not nleasured for step changes and was assumed to be nearly instantaneous.
For different rates of change in pressure, a Tygon tube (inside diameter - 9.5 mm) containing 33 ppt sea- water was connected to the outlet port of the experi- mental chamber. There was no air in the test chamber or Tygon tube except at the top of the tube. The tube was connected to a motor by a nylon cord and pressure changed by raising or lowering the distal end of the tube on a vertical track. The rate of pressure change was controlled by a variable speed motor (Dayton, Model 27802) connected to a series of pulleys by differ- ent reduction gears. Rates were calculated using the pressure transducer to determine the time for pressure changes of 10 and 20mbar. The response time of the pressure transducer was about 3ms while the digital readout updated its reading at 0.5 S intervals. A 10 mbar change a t the fastest test rates of change took ca 7s. Calculated rates were constant with different amounts of absolute pressure change. All test pressures were the change in pressure from the initial pressure in the test chambers.
Larval responses were observed and recorded with a closed circuit television system. For viewing, speci- mens were illuminated with far-red light (maximum transmission 775 nm), to which larvae are unresponsive (Forward & Cronin 1979). When larvae were illumi- nated with only far-red light, they were considered to be in total darkness.
To measure responses upon simultaneous stimula- tion with light and pressure, the test chamber was positioned in an apparatus designed to produce an angular light distribution similar to that occurring in shallow water during the day with the sun in the zenith (see Forward et al. 1984 for a detailed description). The stimulus Light was produced by a 300 W incandescent lamp filtered through an IR-absorbing filter, to remove heat, and a Corning #494 filter. The output from the latter filter matches the visual pigment absorption spectrum of crabs in the family Xanthidae (Cronin & Forward 1988). Broadband pass filter~ng was used because of the need for high light intensities in the experiments. h g h t intensity was controlled by fixed neutral density filters and measured with a radiometer (EG&G, Model 550).
General experimental procedures and data analysis. The general experimental procedure was to stimulate a group of larvae (approximate number of Stage I zoeae = 100; StageIV zoeae = 50) with a series of pressure changes and record their behavioral responses on videotape beginning about 10 s before stimulation and

Forward et al.: Crab larval respo~lses to pressure 269
lasting until about 10 S after stimulus termination. Indi- vidual larvae were tested only once at each test stimulus at each zoeal stage. Direction of movement under different conditions was measured at 10° inter- vals (e.g. 20" & 5"). A descent response was defined as downward movement within 45" of each side of the vertical while an ascent response was .upward move- ment within 45" of the vertical. Larvae generally ascend upon a pressure increase and descend upon a pressure decrease. The reported percent response would increase if the acceptance angle ( + 45") for a response was wider.
For analysis of directional movement of each repli- cate, the movement directions of 25 haphazardly selected larvae were measured. Larvae remained in view for all measurements and direction was recorded over about a 0.5 s interval. Since this time interval was short, larvae did not reverse direction during measure- ments. If 25 specimens were not recorded, then all available individuals were analyzed. Control move- ments were measured for each replicate in the 5 to l 0 S
interval before the beginning of stimulation with a series of pressure changes. Each experiment was repli- cated 5 times with each replicate using larvae from a different female. A percent response was calculated for each replicate. Overall means and standard errors of the responses under different stimulus conditions were calculated from arcsine transformed data. Backtrans- formed values are plotted in the figures. Statistical tests used only arcsine transformed data. Response thresholds were established using a Student's t-test to determine the lowest stimulus level that induced a mean response that was significantly (p < 0.05) greater than the control level. It was assumed that at these thresholds there was a real biological difference in responses between larvae in the experimental and con- trol conditions. If the control response was compared to multiple responses over time, then the Dunnett's t-test for multiple comparisons with a control was used to test for differences (Dunnett 1964).
Larval speed of movement was also determined from the videotapes by measuring the distance moved in a specific time interval. The measurement time interval was l s for Stage1 zoeae and 0.5s for Stage IV zoeae because Stage IV zoeae swim faster than Stage I zoeae. Knowing the relationship of real distance to distance on the video screen permitted calculation of the actual speed. Upon stimulation with pressure, larvae responded by moving up or down. In this situation only speeds of lanrae showing an ascent or descent response were measured. Since these larvae are moving approx- imately in the plane of the video monitor, these meas- urements are assumed to indicate true speeds. No adjustment was made to include only the upward or downward component of velocity because this adjust-
ment alters the actual speed of movement. For each stimulus condition, swimming speeds of 15 or all responding larvae from each replicate were measured and a mean calculated. An overall mvdn and standard deviation were determined from all replicate means. Changes in swimming speed with stimulus intensity were statistically tested with a l-way ANOVA.
Experimental design. There were 3 general series of experiments. First, geotactic responses and swimming speeds of Stages I and IV zoeae were measured in darkness upon exposure to sudden step changes in pressure. The procedure for pressure increases was to place light-adapted larvae in darkness for 75 s and then increase the pressure by adding weights to the syringe plunger. The pressure increase was maintained for 30 S, after which the pressure was returned to its origi- nal level for 75 S. The pressure was then increased to the next higher level again for 30s. Eight pressure increases ranging from 1 to 75 mbar were presented in ascending order. Each larval group received all pressures. Presentation of pressure stimuli from the smallest to the largest change was preferred to random stimulus presentation because i t minimized the effects of sensory adaptation upon responsiveness.
For pressure decreases, larvae were placed in dark- ness and subjected to an increase in pressure of 48mbar over the pressure exerted by the water in the syringe experimental chamber system for 5 min. This time was used because after 5min larvae assumed an unstimulated directional swimming pattern (control), which was not statistically different from that before the 48mbar was added. The pressure was then decreased by removing a weight from the syringe. After 30s of stimulation, the weight was replaced and 75s later a larger weight was removed. Pressure decreases ranging from 1 to 40 mbar were tested on each larval group and presented in ascending order. The 75 s interval between stimuli was used for pressure increases and decreases because larvae subjectively return to their unstimulated swimming patterns in this time interval and because preliminary tests indicated the interstimulus interval was long enough to prevent habituation to repetitive stimulation.
For data analysis of responses to step changes (increase and decrease) in pressure, larval orientation was measured 5 S after the beginning of stimulation. A previous study (Forward & Wellins 1989) with a related larval species found that maximal response occurred approximately 5 s after the beginning of stimulation.
The second experimental series tested responsive- ness to different rates of pressure change in darkness. For pressure increases, larvae were placed in darkness for 75 S at ca 15 mbar pressure. The pressure was then increased at a specific rate to ca 50mbar and then returned to the original pressure. After 2min the

Mar. Ecol. Prog. Ser. 57: 267-277, 1989
pressure was increased again at a faster rate. The 2 mm interval between stimuli provided sufficient time for larvae to return to control swimming levels. Pressure changes were presented in order from the slowest to the fastest rates.
Larvae were tested for responses to pressure decreases using a similar procedure. They were ini- tially placed at about 50mbar for 5 min, and then the pressure was decreased to about 15mbar at a specific rate. The pressure was returned to 50mbar and 2 min later larvae were restimulated at a faster rate of change. The stimulus sequence was from the slowest to the fastest rates.
A possible problem with the experimental system is that vibrations from the motor pulley assembly, rather than changes In pressure, may evoke the observed behavioral responses. The motor-pulley assembly and test chamber were on separate tables to reduce motor vibrations from reaching the test chamber. Thus vibra- tions were mainly transmitted by the nylon cord to the Tygon tube and then to the test chamber. Two controls were run to test for the effect of vibrations. First, the nylon cord was tied to the motor-gear assembly rather than the take-up spool. The experimental procedure was followed except that when the motor was started, the cord did not raise or lower the tube, but vibrations were transmitted to the tube. The motor was run at the fastest setting (equivalent rate of pressure change = 1.6 mbar S-') because greatest vibrations occurred at this speed.
In the second control, the water-filled Tygon tube was sealed with a cork and laid horizontally on the table. The nylon cord connected the tube to the take-up spool. The experimental procedure was followed except the tube was pulled horizontally. In this way, vibrations were transmitted between the motor and Tygon tube but the pressure did not change. The motor was again run at the fastest setting.
The third experimental series was designed to deter- mine (1) whether the threshold rates of pressure change needed to evoke behavioral responses changed upon light adaptation and (2) the dimensions of the depth regulatory window upon adaptation to different light levels. The general experimental procedure was to light-adapt a group of larvae for 0.5 h to the highest light adaptation level (1.5 X 1 0 - ~ Wm-'1. The pressure was maintained at 45 mbar. At the end of this time the pressure was changed at a particular rate, then returned to 45 mbar and after 2 min larvae were stimu- lated with a different rate of change. Both pressure increases and decreases began at the same starting pressure of 45mbar and rates of change proceeded from the slowest to the fastest rates of change.
After runs were completed at the upper light adapta- tion level of 1.5 X 1 0 - ~ W m-', larvae were adapted for
0.5 h to 1.5 X 1 0 - ~ W m P 2 and stimulated with pressure changes. Finally, the light adaptation level was decreased to 1 5 X I O - ~ W m-' for 0.5 h and pressure similarly changed. In this way larval responses to pressure were tested upon slow adaptation to light levels from that nearest the original room level to lower levels. The 3 light adaptation light levels ranged from the highest possible with available equipment to a level that was about 1 log unit above the lower photo- tactic threshold for larval crustaceans (Forward 1988).
At the highest light adaptation level, the thresholds for responses to rates of increase and decrease in pressure were determined for comparison with thresholds measured in darkness. Once these thresholds were established, larvae were stimulated at the threshold rates when adapted to the other 2 light levels. In this way responses to the minimal rates of pressure increase and decrease were compared for calculating the depth regulatory window.
RESULTS
Responses to step changes in pressure in darkness
Larvae ascended upon a sudden increase in pressure (Fig. 1). Since larvae were tested in darkness and move upward upon a pressure increase, the response is a
l io io jo do so $o m m
Pressure sncreose (mbcr)
Fig. 1 Neopanope sap . Percentage of (A) Stage I and (B) Stage IV zoeae ascending upon step increases in pressure. Responses were measured 5 s after the beginning of stirnula- tion. Sample size was 5 and true means and standard errors are plotted. Control (C) indicates the percent ascending when larvae are unstimulated and is plotted at zero pressure. 'Srnal- lest pressure increase to induce an ascent response that is significantly (p < 0.05; Student's t-test) greater than the con-
trol level
Forward et al.: Crab larval responses to pressure 23 1
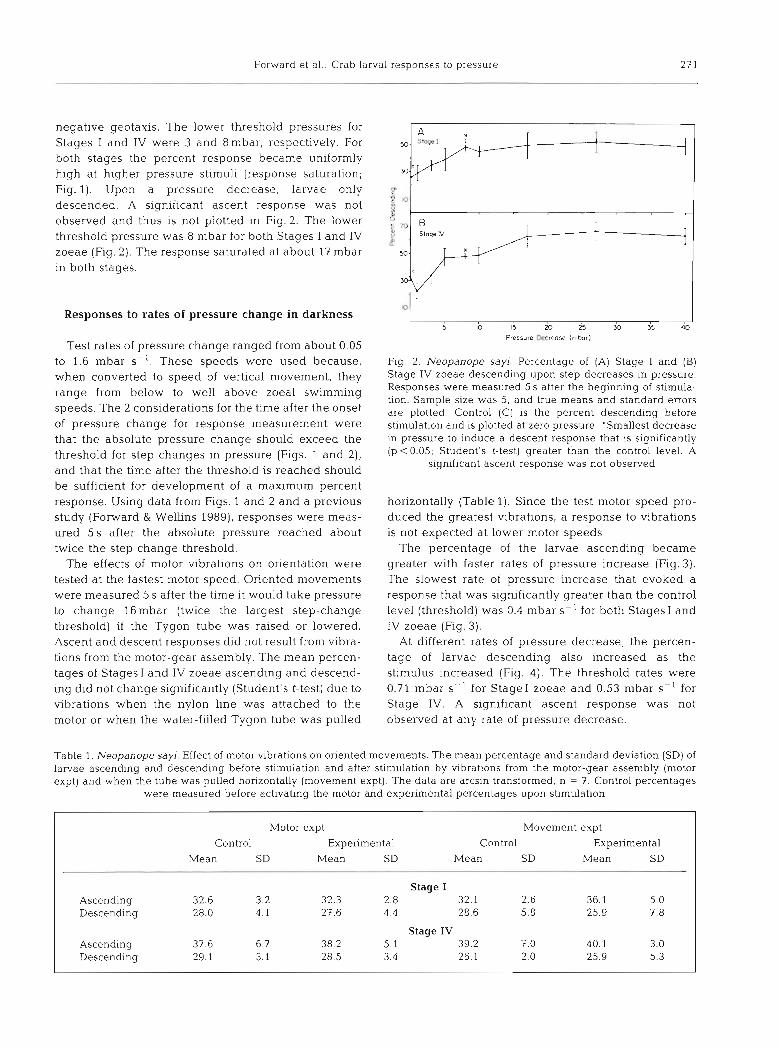
negative geotaxis. The lower threshold pressures for Stages I and IV were 3 and 8n1bar, respectively. For both stages the percent response became uniformly high at higher pressure stimuli (response saturation; Fig. l). Upon a pressure decrease, larvae only p 1
threshold pressure was 8 mbar for both Stages I and IV -1 - :I l0 descended. A significant ascent response was not observed and thus is not plotted in Fig. 2. The lower $ ,
zoeae (Fig. 2). The response saturated at about 17 mbar in both stages.
B T
Responses to rates of pressure change in darkness
Test rates of pressure change ranged from about 0.05 to 1.6 mbar S-'. These speeds were used because, when converted to speed of vertical movement, they range from below to well above zoeal swimming speeds. The 2 considerations for the time after the onset of pressure change for response measurement were that the absolute pressure change should exceed the threshold for step changes in pressure (Figs. 1 and 2) , and that the time after the threshold is reached should be sufficient for development of a maximum percent response. Using data from Figs. 1 and 2 and a previous study (Forward & Wellins 1989), responses were meas- ured 5 s after the absolute pressure reached about twice the step change threshold.
The effects of motor vibrations on orientation were tested at the fastest motor speed. Oriented movements were measured 5 s after the time it would take pressure to change 16mbar (twice the largest step-change threshold) if the Tygon tube was raised or lowered. Ascent and descent responses did not result from vibra- tions from the motor-gear assembly. The mean percen- tages of Stages I and IV zoeae ascending and descend- ing did not change significantly (Student's t-test) due to vibrations when the nylon line was attached to the motor or when the water-fllled Tygon tube was pulled
20 25 30 35 40
Pressure I lecreose (rnborl
Fig. 2. Neopanope sayi. Percentage of (A) Stage I and (B) Stage IV zoeae descending upon step decreases in pressure. Responses were measured 5 S after the beginning of stimula- tion. Sample size was 5, and true means and standard errors are plotted Control (C) is the percent descending before stimulation and is plotted at zero pressure. 'Smallest decrease in pressure to induce a descent response that is significantly (p < 0.05; Student's t-test) greater than the control level. A
significant ascent response was not observed
horizontally (Table 1). Since the test motor speed pro- duced the greatest vibrations, a response to vibrations is not expected a t lower motor speeds.
The percentage of the larvae ascending became greater with faster rates of pressure increase (Fig. 3). The slowest rate of pressure increase that evoked a response that was significantly greater than the control level (threshold) was 0.4 mbar S-' for both Stages I and IV zoeae (Fig. 3).
At different rates of pressure decrease, the percen- tage of larvae descending also increased as the stimulus increased (Fig. 4 ) . The threshold rates were 0.71 mbar S- ' for Stage1 zoeae and 0.53 mbar S-' for Stage IV. A significant ascent response was not observed at any rate of pressure decrease.
Table 1. Neopanope sayi. Effect of motor vibrations on oriented movements. The mean percentage and standard deviation (SD) of larvae ascending and descending before stin~ulation and after stimulation by vibrat~ons from the motor-gear assembly (motor expt) and when the tube was pulled horizontally (movement expt). The data are arcsln transformed, n = 7. Control percentages
were measured before activating the motor and experimental percentages upon stimulation
Motor expt Movement expt Control Experimental Control Experimental
Mean SD Mean SD Mean SD Mean SD
Stage I Ascending 32.6 3.2 32.3 2.8 32.1 2.6 36.1 5.0 1 Descenhng 28.0 4.1 27.6 4.4 28.6 5.8 25.9 7.8
Stage IV Ascending 37.6 6.7 38.2 5.1 39.2 7 0 40.1 3.0 1 Descending 29.1 3.1 28.5 3.4 26.1 2.0 25.9 5.3

272 Mar. Ecol. Prog Ser 57: 267-277, 1989
Fig. 3. Neopanope sayi. Percentage of (A) Stage I and (B) Stage IV zoeae ascending at different rates of pressure increase in darkness. Sample sue was 5, and true means and standard errors are plotted. Control (C) indicates percentage of larvae ascending prior to stimulation and is plotted at rate zero. 'Slowest rate of pressure increase (threshold) that evokes a response that is significantly (p (0.05: Student's
t-test) greater than the control level
Fig. 4. Neopanope sayi. Percentage of (A] Stage I and (B) Stage IV zoeae descending at different rates of pressure decrease in darkness. Sample slze was 5, and true means and standard errors are plotted. Control (C) indicates percentage of larvae ascending prior to stimulation and is plotted at rate zero. 'Slowest rate of prt!ssure decrease (threshold) that evokes a response that is signlflcantly (p < 0.05; Student's
I-test) greater than the control level
Threshold rates of pressure change upon light adaptation
Initial experiments determined whether the threshold rates of pressure change varied with the level
of light adaptation. Responses in darkness (Figs. 3 and 4 ) were compared to responses upon adaptation to the highest light level (1.5 X Wm-2) because any change in threshold should be apparent at the extreme lighting conditions. The thresholds were identical in light (Fig. 5) and darkness (Figs. 3 and 4 ; pressure
rw,.
ul K).
0 = c E . S t W W
: rw, 0 a"
l _ , . . . . , . I . . , , . . . , l 0.2 0.4 0 6 08 0 2 0.4 0.6 0.8
Rote of Pressure Increase Irntar S-' ) Rote of Pressure D w e Q s e lmbar s- l )
Fig. 5. Neopanope sayi. Percentage of (A, B) Stage I and (C, D) Stage IV zoeae ascending (solid line) upon stimulation at different rates of pressure increase (A, C) and descending (solid line) upon a pressure decrease (B, D). Larvae were light- adapted at 1.5 X 10-' ~ m - ~ Control percent responses (dashed lines) were measured before pressure stimulation. Sample size cvas 5. 'Lowest rate of change to evoke a response that was significantly greater (p <0.05; Student's
t-test) than the control level
increase, Stages I and IV = 0.4 mbar S-'; pressure decrease, Stage IV = 0.53 mbar S-') except for respon- ses of Stage I zoeae to a pressure decrease (darkness =
0.7 l mbar S-'; light = 0.4 mbars-l).
Depth regulatory window at different light adaptation levels
The dimensions of the depth regulatory window are the distances that larvae move up or down before corrective descent or ascent responses occur to the change in hydrostatic pressure. These distances were de term~ned by measuring the change in responsive- ness over time at threshold rates of pressure change. Threshold rates were used because they are the minimum level of detection by the larval sensory sys- tem. Using the time until the first significant response and the rate of pressure change, the absolute amount of pressure and depth change can be calculated, since 1 mbar is equivalent to 10 mm of water.
A question in these calculations is whether to use the pressure decrease threshold rate for Stage I zoeae as

Forward et a].: Crab larval responses to pressure 273
determined in darkness (Fig. 4) or in light (Fig. 5). If the absolute amounts of pressure decrease before a response are compared at the threshold rates in light and dark, the values are almost identical. In light, Stage1 zoeae responded after 7 s (Fig 6) which pro-
2 6 10 '
Time (sl
Fig. 6. Neopanope sayi. Percentage of Stage I zoeae descend- ing over time upon stimulation with a rate of pressure decrease at 0.4 mbar s ' Larvae were light-adapted at 1.5 x 10"' w m 2 . Control (C) percent responses were measured before stimulation and are plotted at time 0. Sample size was 5 and true means and standard errors are plotted, "First mean response that was significantly [p ~ 0 . 0 5 ; Dunnett's t-test)
different from the control level
I
2 6 10 2 6 10 Time (s)
Fig. 7. Neopanope sayi. Percentage of Stages I and IV zoeae descending over time after the beginning of a 0.71 mbar s-I and 0.5 m b a r s rate of pressure decrease, respectively. Lar- vae were either dark-adapted or light-adapted to the stated light intensity levels. Sample size was 5 and true means and standard errors are plotted. Control (C) is percent descending before stimulation and is plotted at time zero. "First mean response that is significantly (p < 0.05; Dunnett's t-test) differ-
ent from the control
2 6 10 2 6 10 T ime (s)
Fig. 8. Neopanope sayi. Percentage of Stages1 and IV zoeae ascending over time after thr beginning of a 0.4 mbar s rate of pressure increase. Larvae were either dark-adapted or light-adapted at the stated light intensity levels. Sample size is 5 and true means and standard errors are plotted. Control (C) is the percent ascending before stimulation and is plotted at time zero. "First mean response that is significantly (p < 0.05;
Dunnett's t-test) different from the control
duced an absolute pressure decrease of 2.8 mbar Lar- vae responded in darkness after 4 s (Fig. ?A) which gave a 2.84 mbar absolute change in pressure. Since the absolute pressure change before a response appears to be independent of rate of pressure change, it was decided to use the threshold rate for darkness (0.71 mbar s-I).
Using times until significant responses to a pressure decrease (Fig. 7) and increase (Fig. 8) were evident, it was possible to calculate the absolute amounts of pressure change and vertical distance that a larva would move before a corrective depth regulatory response (Table 2). The distances were about the same at the different light levels, at the different zoeal stages and upon increases and decreases in pressure. In addi- tion, the total width of the window also remains rela- tively constant (Table 2). Thus the depth regulator window is approximately symmetrical for both zoeal stages,
Swimming speeds
Swimming speeds were measured in darkness for larvae showing the ascent response upon a step increase in pressure and the descent response upon a

274 Mar Ecol. Prog Ser 57: 267-277, 1989
Table 2. Areopanope say]. Vertical d~stance that a larva would move before a depth regulatory ascent or descent response upon a pressure increase or decrease, respectively. Larl-ae were adapted to different light levels. Distances were calculated by multiplying the time until a response (F~qs 7 and 8) by the rate of pressure change. Thc resulting mbar values were converted to
distance by the relat~onship that 1 mbar = 10 mm of water
Light adaptation Stage I distances (mm) Stage IV distances (mm) intensity (W m-') Pressure Pressure Total Pressure Pressure Total
increase decrease width increase decrease width
Darkness 1.5 X 10-= 1.5 X 10⁻⁴ 1.5 X 10⁻²
step decrease In pressure. Upon a pressure increase there was a significant increase in swimming speed as the stimulus became larger for both Stages I and IV zoeae (Table 3 ) . Even though these results indicate larvae had a graded increase in swimming speed as
Table 3. Neopanope sayi. Rates of movement of Stages I and IV zoeae during ascent and descent responses in darkness upon step increases (+) and decreases ( - ) In pressure, respec- tively. The sample size was 5 for each pressure. Means and standard deviations (SD) are shown. Since the F,,,, test indi- cated variances were homogenous, a l-way ANOVA deter- mined whether there was a significant (p <0.05) treatment effect on swimming speed. Since the ANOVA was significant for ascent speeds, a Scheffe's analysis determined significant differences among treatments. Means for each stage followed
by the same letter are not sign~licantly different (p <0.05)
Pressure Stage I Stage IV change Mean SD Mean SD (mbar)
Ascent speeds (mm S-')
appear to increase. The analysis method does not per- mit differentiation between these 2 alternatives. Nevertheless, swimming speed does increase upon a pressure increase, and thus larvae have a high barokinetic response.
In contrast, mean swimmi.ng speed did not change significantly during the descent response upon expo- sure to different amounts of pressure decrease (Table3). The absence of a speed change is charac- teristic of larvae that are sinking during the descent response (Forward & Wellins 1989).
When stimulated with different rates of pressure change, swimming speeds were measured during the ascent and descent responses at rates that evoked significant responses (Figs. 3 and 4) and at times when the absolute amounts of pressure change were approxi- mately equal to 15 mbar. This absolute pressure was used because it is about twice the threshold values upon step changes in pressure (Figs. 1 and 2). Thus the rates differed only by the speed at which the pressure changed to this level. If swimming speeds changed
pressure increased, it is possible that the result is due to the analysis method, since only larvae showing the ascent response by swimming in an upward (k 45") direction were measured. As the magnitude of the pressure increase became greater, the percentage of ind1vidu.als ascending i.ncreased (Flg 1) . If larvae sim- ply increase their speed by a fixed amount upon any suprathreshold pressure in( rease, then a greater number of responding larvae will be measured at increasing pressures and mean swimming speed will
+ 10 3.13' 0.73 4.33= 0.40 + 25 3.97C" 0 57 6 . 0 8 ~ ' 1.13 + 50 4.81" 0.75 7.85"" 1.48 + 75 6.53" 0.73 8.88" 0.76
Descent speeds (mm S-')
- 10 3.44 0.92 5.16 2.32 - l? 3.17 0.79 5.39 0.91 - 27 3.39 0.55 5,71 0.66 - 40 3.67 1.0 5.97 0.63
pressure change and not the rate of change. Similarly there was no significant change in swimming speeds at the d1fferen.t rates of pressure decrease (Table 4), which again suggests larvae were descending by sinking.
significantly with rate, then the rate of pressure change, not the absolute amount of pressure change, induced the barokinetic response.
Swimming speeds did not change significantly at different rates of pressure increase for both Stages I and IV zoeae (Table 4). This result indicates that the high barokinesis observed upon step increases in pressure (Table 3) was a response to the absolute amount of
DISCUSSION
The present study determined the behavioral respon- ses to changes in hydrostatic pressure by Neopanope sayi larvae, a species which undergoes larval develop- ment in lower estuarine and coastal areas (Sandifer

Forward et a1 Crdb l a ~ -val responses to prcssure 275
Table 4. Neopanope sayi. Swimming speeds of different stage zoeae during the ascent and descent response In darkness upon different rates of pressure increase (+) and decrease ( - ) , respectively. The san~p le size wds 5 for each pressure. Means and standdrd deviations (SD) 'Ire shown. Statistical analys~s indicates for each condition there was no statistical change In
speed with rate of pressure change
Rate of Stage I Stage IV pressure SD Mean S D changr
(mbar S - ' )
Ascent speeds (mm S-')
+ 0.40 2.30 0.58 3.45 0.88 + 0.74 2.44 0.59 3.51 0.57 + 1.19 2.93 0.61 4.07 0.80 + 1.58 2.44 1.02 3.77 0.78
Descent speeds (mm S-')
- 0.53 4.53 0.56 - 0.71 2.76 0.33 4.99 0.83 - 1.11 2.66 0.30 5.07 0.64 - 1.47 2.75 0.53 5.18 0.46
1975, Dittel & Epifanio 1982, Salmon et al. 1986). A comparison to responses by Rhithropanopeus harrisii larvae, which develop in upper estuarine areas (Cronin 1982), may indicate differences in depth regulation of larvae that are retained, and those that are exported from estuaries.
Upon step increases in pressure in darkness, Neopanope sayi larvae showed negative geotaxis and high barokinesis, whereas they descended probably by passive sinking upon a sudden pressure decrease. These respqnses are typical of other species of crab l a ~ v a e (Sulkin 1984). Rhithropanopeus harrisii larvae displayed the same response to a pressure increase but, in contrast, they ascended upon very rapid rates of decrease in pressure (Forward & Wellins 1989). The latter response is unusual and was hypothesized to function for avoidance of the feeding and respiratory currents of benthic animals. If this hypothesis is correct then the threat of benth1.c animals may be less in areas inhabited by N. sayi larvae. The threshold values for a pressure increase (Stage1 = 3 mbar; StageIV = 8 mbar) and decrease (Stages I and IV = 8 mbar) do not change dramatically with development of N. sayi. These values are similar to thresholds for other inver- tebrates (Morgan 1984) and, more specifically, are almost identical to those of R. harrisii larvae (Forward & Wellins 1989).
Neopanope sayi larvae showed the same directional responses upon continuous changes in pressure. In darkness, the measured threshold rates for a pressure increase (Stages I and IV = 0.4 mbar S-') and decrease (Stage I = 0.7 mbar S-' ; Stage IV = 0.53 mbar S-')
remained relatively constant throughout zoeal de-
velopment. The only change in these thresholds with light adaptation was that upon a pressure decrease the threshold lowered to 0.4 mbar S - ' for StageI zoeae. These thresholds are also very similar to those meas- ured for larvae of the crab Rhithropanopeus harrisii (Forward & Wellins 1988).
The validity of the measured threshold rates requires some discussion. As pressure changes in the experi- mental chamber, larvae experience different rates of change depending upon their direction of movement. For example, upon a pressure increase larvae will experience the maximum rate of change if they are moving directly down at the time of stimulation. The total rate is the sum of the pressure increase due to downward movement plus the test rate of increase. Larvae swimming horizontally expenence the test rate of increase. If a larva is ascending, then the apparent rate of pressure increase is the test rate minus the rate of pressure decrease due to upward swimming. The reverse situations occur upon a pressure decrease.
It is possible to calculate the maximum and minimum rates of pressure change that a larva would experience at threshold rates of change (Table 5) by using the average mean ascent speeds, average mean sinking rates and threshold rates of pressure increase and decrease (Table 6). The wide difference in the max- imum and minimum values (Table 5) indicate the range of values experienced by the larvae depends upon their direction of movement.
Thus, what are the true thresholds within the calcu- lated range (Table 5)? At threshold there 1s a minimal increase (significant) in the percent response. This
Table 5 Neopanope sayi. Minimum and maximum rates of pressure change experienced by a larva at threshold rates of change. Minimum rates of pressure increase (inin.) were cal- culated by subtracting the average mean ascent speeds from the threshold rate of pressure increase. Calculation of the maximum rates of pressure increase (max ) added the average descent speed to the threshold rate of pressure increase. Rdle thresholds and data for calculating the average mean descent and ascent speeds are shown in Table 6. Similar calculations were used for pressure decrease. A negative sign indicates larvae are ascending faster than the threshold rate of pressure increase and would expenence a pressure decrease. AV. = average of the minimum and maximum values Meas. =
threshold values in Table 6

276 Mar. Ecol. Prog. Ser.
Table 6. Neopanope sayi. comparison of rate threshold for pressure change (from Figs. 3, 4 , 5) with the range of mean ascent and descent speeds (from Tables 3 and 4) . Threshold rates were the same in darkness of light except for Stage I zocae during a pressure decrease. Rates of pressure chanqe were converted to distances in the water column by the
relationship 1 mbar S ' -= 10 mm S - '
Pressure increase (mm S- ' )
Zoeal Measured Calculated Descent stage rate maximum speeds
threshold threshold
Pressure decrease (mm S - ' )
Zoeal Measured Calculated Ascent stage rate maximum speeds
threshold threshold -
I - darkness 7.1 11.52 2.30-6.53 I - light 4 0 8.42 2.30-6 53
5 3 11 47 3.45-8 88
response is probably evoked in larvae experiencing higher rates of pressure change within the possible range. A conservative view is that responding larvae are moving horizontally and in the direction to rein- force the pressure change. Thus the tr-ue threshold probably exists in a range from that measured (Table 5) to the maximum calculated values.
The measured and maximum possible threshold rates were converted to rates of vertical movement and compared to larval ascent and descent speeds (Table 6). Descent speeds of StageIV zoeae exceeded the measured threshold rate of pressure increase, whereas the maximum mean descent speed (3.67 mms-l ) recorded in this study for StageI zoeae was within I standard deviation of the measured threshold (Table 6). Since these descent speeds were probably meas- ured during passive sinking, active downward swim- ming would exceed the measured thresholds. All des- cent speeds were well below the calculated maxlmum threshold rates, which indicates active downward swimming is also necessary to achieve these rates of pressure increase.
Ascent speeds of Stage IV zoeae exceeded the meas- ured threshold rate of pressure decrease. The upper mean ascent speed (6.53 mms-l) of StageI zoeae exceeded the threshold in light and was wi th~n one standard deviation of the threshold in darkness (Table 6). Since ascent speeds were below the calculated maximum threshold rate, the true threshold must be below this maximum rate if larvae are to induce a response to a pressure decrease by upward swimming. Thus larvae can move fast enough to evoke responses
to changes in hydrostatic pressure. This conclusion indicates Sulkin's (1984) negative feedback model of depth regulation is probably valid for Neopanope sayi larvae.
The measurements of swimming speed during the ascent response at different rates of pressure increase (Table 4) tested whether high barokinesis was a response to the rate of pressure change or the absolute amount of pressure change. Speed of movement increased with larger step increases in pressure (Table 3) but remained constant for different rates of pressure change, if speed was measured after a specified abso- lute amount of pressure change (Table 4 ) . Thus high barokinesis of Neopanope sayi larvae was a response to the absolute amount of pressure change, not the rate of change. In contrast, high barokinesis in Rhifhro- panopeus harrisii larvae is evoked by the rate of pressure change (Forward & Wellins 1989). The func- tional significance of thls difference is unknown at present.
The present study tested the light-dependent nega- tive feedback model of depth regulation (Forward 1989). This model is supported if the symmetry of the depth regulatory window varies with llght adaptation. The previous uncertainty over the true threshold rates does not affect measurements of the depth regulatory window because the absolute pressure change before a response is independent of the rate of pressure change. For Neopanope sayi the ascent and descent limits of the window and total width remain approximately equal for each zoeal stage at different light levels (Table 2). When compared between zoeal stages, the limits were also equal. Since corrective depth regulat- ory responses occurred after approximately equal amounts of pressure increase and decrease, larvae would remain at a constant depth and not have a tendency to rise or descend. This symmetrical depth regulatory window does not support the model.
Crab lalvae frequently undergo vertical migration in relation to tidal and LD cycles (e.g. Cronin 1982). These migrations occur by behavioral responses to light and through endogenous rhythms in actlvity (Forward 1988) and would override active depth regulation. Thus active depth regulation by means of responses to pressure would function at times when larvae are not actively vertically migrating.
Even though Neopanope sayi and Rhithropanopeus harrisii are taxonomically closely related species (Wil- liams 1984), their larval distributions are very different, as N. say1 larvae are exported from estuaries while R. harrisii larvae are retained in estuaries. The major differences in responses to pressure between species are (1) N. sayi has a symmetrical depth regulatory window, while ~t is asymmetrical and varies w ~ t h light adaptation for R. harrisii, and ( 2 ) R. harrisii show a

Forward et al.: Crab larval responses to pressure 277
presumptive predator avoidance response upon a rapid pressure decrease which is absent in N. sayi. Estuaries along the southeastern US coast are usually shallow as compared to coastal areas. Light is transmitted poorly in estuaries (Forward et al. 1988) and light intensities d.uring the day near the bottom are frequently below the photoresponse threshold of crab larvae (Forward et al. 1984). Coastal areas are usually deeper, have better light transmission and have light levels above the photoresponse threshold of crab larvae during the day (Forward et al. 1988).
Since the water column is narrow in shallow estuaries, larvae have a greater chance of encountering the bottom and associated benthic predators in dim light conditions than larvae in deeper coastal areas. Rhithropanopeus harrisii has developed 2 responses to avoid the bottom, as an ascent results from the asym- metrical depth regulatory window in low light condi- tions and from the presumptive predator avoidance response. The threat of benthic predators in coastal areas is probably less because larvae can disperse throughout a deeper water column. In addition, larvae frequently occur near the surface in coastal areas. Dit- tel & Epifanio (1982) found Neopanope sayi larvae prin~arily in surface samples. However, Sandifer (1972) found equal numbers of early stage zoeae in surface and bottom samples and more late stage zoeae in bottom samples. Thus N. say1 consistently occur near the surface where the presumptive predator avoidance response is of little functional value but depth mainte- nance is necessary.
Acknowledgements. This material is based on research sup- ported by the National Science Foundation under Grant No. OCE-8603945. We thank Mr Erik Herzog for his technical assistance, and Dr T Shirley for critically reading the manu- script.
LITERATURE CITED
Bentley, E., Sulkin, S. D. (1977). The ontogeny of barolunesis during the zoeal development of the Xanthid crab Rl~ithropanopeus harrisii (Gould). Mar. Behav Phy- siol. 4: 275-282
Bigford, T E. (1977). Effects of oil on behavioral responses to light, pressure, and gravity in larvae of the rock crab Cancer irroratus. Mar. Biol. 43: 137-148
Cronin, T W. (1982). Estuarine retention of larvae of the crab Rhithropanopeus harrisii. Estuar. cstl Shelf Sci. 15: 207-220
Cronin, T. W , Forward, R. B., Jr (1988) The visual pigments of crabs I. Spectral charactenstics. J , comp. Physiol. 162: 4 6 3 4 7 8
This article was submitted to the editor
Dittel, A. L . , Epifanio, C. E. (1982). Seasonal abundance and vertical distribution of crab larvae in Delaware Bay. Estuaries 5 : 197-202
Dunnett. C. W (1964). New tables for multiple comparisons with a control. Bio~netrics 20: 2 8 2 4 9 1
Ennis, G. P. (1973). Behavioral responses to changes in hy- drostatic pressure and light during larval development of the lobster Ho~narus gamnlarus. J. Flsh Res. Bd Can. 30: 1349-1360
Enright, J. T (1962) Responses of an amphipod to pressure changes. Comp. Biochem. Physiol. 7. 131-145
Forward, R. B., Jr (1988). Diel vertical migration: zooplankton photobiology and behavior Oceanogr mar. Biol. A. Rev. 26: 361-393
Forward, R. B., Jr (1989). Depth regulation of larval marine decapod crustaceans: test of an hypothesis. Mar. Biol. (in press)
Forward, R. B., Jr, Cronin, T W. (1979). Spectral sensitivity of larvae from intertidal crustaceans. J. comp. Physiol. 133: 311-315
Forward, R. B., Jr , Cronin, T. W., Douglass, J . K. (1988). The visual pigments of crabs. 11. Environmental adaptations. J. comp. Physiol. A 162: 479-490
Forward, R . B., J r , Cronin, T. W., Stearns, D. E. (1984). Control of die1 vertical migration: photoresponses of a larval crus- tacean. Limnol. Oceanogr. 29: 146-154
Forward, R. B., Jr , Wellins, C. A. (1989). Behavioral responses of a larval crustacean to hydrostatic pressure: Rhithro- panopeus harrisii (Brachyura: Xanthidae). Mar Biol. 101: 159-172
Jacoby, C. A . (1982). Behavioral responses of the larvae of Cancer magister Dana (1852) to light, pressure, and grav- ity. Mar. Behav. Physlol. 8: 267-283
Morgan, E. (1984). The pressure-responses of marine inverte- brate: a psychophysical perspective. Zool. J . Linn. Soc. 80: 209-230
Salmon, M . , Seiple, W H , Morgan, S. G (1986). Hatching rhythms of fiddler crabs and associated species at Beaufort, North Carolina. J . Crust. Biol. 6. 24-36
Sandifer. P. A. (1972). Morphology and ecology of Chesapeake Bay decapod crustacean larvae. Ph. D. thesis. University of Virginia
Sandifer, P. A. (1975). The role of pelagic larvae in recruitment to populations of adult decapod crustaceans in the York h v e r estuary and adjacent lower Chesapeake Bay, Vir- ginia. Estuar. cstl mar. Sci. 3: 264-279
Schembri. P. J . (1982). Loconlotion, feeding, grooming and the behavioural responses to gravity, light, hydrostatic pressure in the Stage I zoea larvae of Ebalia tuberosa (Crustacea: Decapoda: Leucosiidae). Mar. Biol. 72: 125-134
Sulkln, S. D. (1973). Depth regulation of crab larvae in the absence of light. J . exp. mar. Biol. Ecol. 13: 73-82
Sulkin, S. D. (1984). Behavioral basis of depth regulation in the larvae of brachyuran crabs. Mar. Ecol. h o g . Ser. 15: 181-205
Wheeler, D. E., Epifanio, C. E. (1978). Behavioral response to hydrostatic pressure in larvae of two species of xanthid crabs. Mar. Biol. 46: 167-134
Williams, A. B. (1984). Shrimps, lobsters, and crabs of the Atlantic coast of the Eastern United States, Maine to Florida. Smithsonian Institution Press, Washington, D.C.
Manuscript first received: February 15, 1989 Revised version accepted: July 21, 1989