Embed Size (px)
Citation preview

BEHAVIORAL AND BRAIN FUNCTIONAL CORRELATES OF THE PROCEDURALIZATION OF EVALUATION
By
HONG LI
A DISSERTATION PRESENTED TO THE GRADUATE SCHOOL OF THE UNIVERSITY OF FLORIDA IN PARTIAL FULFILLMENT
OF THE REQUIREMENTS FOR THE DEGREE OF DOCTOR OF PHILOSOPHY
UNIVERSITY OF FLORIDA
2008
1

© 2008 Hong Li
2

To my parents Yingchao Li and Jian Yang, without whose sacrifices and unconditional love none of this would be possible
3
ACKNOWLEDGMENTS
My deepest gratitude is to Dr. Dolores Albarracín, who not only served as my supervisor
but also encouraged and guided me throughout my academic program. I thank her for holding me
to a high research standard and helping me to focus on my ideas and overcome setbacks, thus
teaching me how to achieve and become an objective scientist. The invaluable graduate school
experience has been the one I will cherish forever. I express sincere appreciation to Dr. Yijun Liu
for his guidance and insight throughout the research. I also thank Dr. Catherine Cottrell for
consenting to join my committee at the final stages of my project; her suggestions were helpful
and appreciated. The insightful comments and constructive criticisms from Drs. Ira Fischler and
Dean Sabatinelli on various stages of the current research are gratefully acknowledged.
In addition to my committee members, a great many people have been especially helpful in
my research. Without their help, none of this would be possible. I am thankful to Dr. Rick Brown
for his invaluable work on the early stage of this research project. I also thank the lab members
in the Attitudes and Persuasion Lab at the Psychology Department at the University of Florida
for discussions of the ideas reported in this dissertation. I am also grateful to the members in the
fMRI Lab at the McKnight Brain Institute with whom I have actively interacted during the
course of this research. Particularly, I would like to thank Dr. Paul Wright for his encouragement
and numerous advices on how to understand and use neuroimaging data. I thank Dr. Guojun He,
Dr. Zhenyu Zhou, Nelson Klahr, Tianyu Tang for their technical support with this research.
I express thanks and appreciation to my husband Xiaoguang Zhen for his unconditional
love, patience, and support during my graduate school years. I thank my parents, Yingchao Li
and Jian Yang, for their faith in me and giving me freedom to explore my dream to be a
psychologist.
4
TABLE OF CONTENTS page
ACKNOWLEDGMENTS ...............................................................................................................4
LIST OF TABLES ...........................................................................................................................7
LIST OF FIGURES .........................................................................................................................8
ABSTRACT .....................................................................................................................................9
CHAPTER
1 INTRODUCTION ..................................................................................................................11
Proceduralization of Evaluation .............................................................................................12 Possible Brain Functional Correlates of Proceduralized Evaluations ....................................16
Brain Functional Correlates of Proceduralization ...........................................................16 Brain Functional Correlates of Evaluation ......................................................................22
Hypothetical Brain Functional Changes in Evaluation Proceduralization .............................25 The Present Research ..............................................................................................................28
2 EXPERIMENT 1 ....................................................................................................................31
Method ....................................................................................................................................31 Overview .........................................................................................................................31 Participants and Design ...................................................................................................31 Procedures .......................................................................................................................32 Materials and Measures ...................................................................................................32
Results .....................................................................................................................................34 Response Time ................................................................................................................34 Responses to Tasks ..........................................................................................................36 Spontaneous Thought Listing ..........................................................................................36
Discussion ...............................................................................................................................37
3 EXPERIMENT 2 ....................................................................................................................45
Method ....................................................................................................................................45 Overview .........................................................................................................................45 Participants ......................................................................................................................46 Procedures .......................................................................................................................46 Functional Imaging Data Acquisition .............................................................................47Materials and Measures ...................................................................................................48
Results .....................................................................................................................................52Behavioral Findings ................................................................................................................52
Response Time ................................................................................................................52 Responses to Tasks ..........................................................................................................54
5

6
Functional Imaging Data Analyses .........................................................................................56 Tests of Evaluation Proceduralization .............................................................................57 Findings in Regions Associated with Learning ...............................................................58 Findings in Regions Associated with Evaluation ............................................................69 Findings in Visual Areas .................................................................................................74 Findings in Motor Areas ..................................................................................................76 Correlations between Behavioral Performance and Brain Activities in Regions Associated with Learning and Evaluation ......................................................................78
Discussion ...............................................................................................................................81
4 GENERAL DISCUSSION ...................................................................................................107
Summary of Findings ...........................................................................................................107 Contributions ........................................................................................................................108
APPENDIX
A INSTRUCTIONS AND CUES FOR EVALUATIVE AND NON-EVLALUTIVE TASKS (EXPERIMENT 2) ..................................................................................................112
B CORRELATION COEFFICIENTS OF ROI ACTIVITY CHANGES AND BEHAVIORAL PERFORMANCE CHANGE FROM THE PRE- TO THE POST- TRAINING RUN (EXPERIMENT 2) ..................................................................................113
LIST OF REFERENCES .............................................................................................................116
BIOGRAPHICAL SKETCH .......................................................................................................124
LIST OF TABLES Table page 2-1 IAPS picture codes for training tasks (Experiment 1) .......................................................39
2-2 IAPS picture codes for the thought listing task (Experiment 1) ........................................41
2-3 Mean response times for evaluative and non-evaluative tasks to new and repeated stimuli (Experiment 1) .......................................................................................................42
2-4 Ratings of pleasant and unpleasant images in each practice block (Experiment 1) ..........43
3-1 IAPS picture codes, valence and arousal ratings for images presented in the pre-training run (Experiment 2) ...............................................................................................86
3-2 IAPS picture codes, description, valence, and arousal ratings of images presented in the training run (Experiment 2) ..........................................................................................88
3-3 IAPS picture codes, description, valence, and arousal ratings of images presented in the post-training run (Experiment 2) ..................................................................................92
3-4 Ratings of pleasant and unpleasant images in the pre-training and the post-training run (Experiment 2) .............................................................................................................94
3-5 Distribution of responses for evaluative and non-evaluative tasks in pre-training and post-training runs (Experiment 2) ......................................................................................95
3-6 List of references of regions-of interest selected in the fMRI study of evaluation proceduralization (Experiment 2) ......................................................................................96
3-7 Means of BOLD signals in ROIs previously linked to procedural learning for evaluative and non-evaluative tasks in the pre-training and post-training runs (Experiment 2) ...................................................................................................................97
3-8 Means of BOLD signals in ROIs previously linked to declarative learning for evaluative and non-evaluative tasks in the pre-training and post-training runs (Experiment 2) ...................................................................................................................98
3-9 Means of BOLD signals in ROIs previously linked to evaluative processing for evaluative and non-evaluative tasks in the pre-training and post-training runs (Experiment 2) ...................................................................................................................99
3-10 Means of BOLD signals in ROIs previously linked to motor function and visual processing for evaluative and non-evaluative tasks in the pre-training and post-training runs (Experiment 2) ............................................................................................100
3-11 Correlation coefficients of BOLD signal changes (pre- vs. post- training run) during evaluative tasks in regional clusters (Experiment 2) .......................................................101
7
LIST OF FIGURES
Figure page 1-1 Brain regions associated with evaluation proceduralization and predicted effects. ..........30
2-1 Effects of task and practice block on response time (Experiment 1) .................................44
3-1 Sample IAPS pictures used in Experiment 2. ..................................................................102
3-2 Practice-related activation changes for evaluative tasks (Experiment 2). .......................103
3-3 Maps for brain activity changes for evaluative tasks in learning-related regions (Experiment 2). ................................................................................................................104
3-4 Maps for brain activity changes for evaluative tasks in evaluation-related regions (Experiment 2). ................................................................................................................105
3-5 Maps for brain activity changes for evaluative tasks in regions related to visual and motor processing (Experiment 2) .....................................................................................106
8

9
Abstract of Dissertation Presented to the Graduate School of the University of Florida in Partial Fulfillment of the Requirements for the Degree of Doctor of Philosophy
BEHAVIORAL AND BRAIN FUNCTIONAL CORRELATES OF THE
PROCEDURALIZATION OF EVALUATION
By
Hong Li
December 2008 Chair: Dolores Albarracin Cochair: Catherine Cottrell Major: Psychology
Our study concerned the effects of practice with evaluative judgments at both the
behavioral and the brain functional levels. We hypothesized that evaluative practice increases the
likelihood and efficiency of evaluative judgments. As predicted, Experiment 1 showed that
participants who practiced evaluating visual stimuli became faster with time and were more
likely to make evaluative judgments spontaneously at a later time. To explore the brain
functional correlates of evaluation proceduralization, in Experiment 2 we used functional
magnetic resonance imaging (fMRI) to compare the activity before and after participants
practiced performing evaluative judgments of pictures. We found that practice in evaluation had
effects on brain activation in various regions. Specifically, when evaluative judgments were
proceduralized, brain activation increased at regions associated with automatic evaluative
processing, including the amygdala, the insula, and the orbito-frontal cortex, and regions
associated with controlled evaluative processing (e.g., the temporal pole, the anterior cingulate
cortex, the frontal operculum), as well as late visual regions (e.g., the posterior fusiform, the
superior occipital lobe, and the parietal occipital lobe). Moreover, evaluation proceduralization
was reflected by increased activity in areas associated with procedural learning (e.g., the striatal
regions, the lateral cerebellum, the precuneus, and the inferior frontal cortices), and decreased
activity in areas associated with declarative learning (e.g., the medial temporal lobe, the
ventromedial prefrontal cortex, the dorsolateral prefrontal cortex).
10
CHAPTER 1 INTRODUCTION
Evaluation, which is believed to be a fundamental dimension of meaning in all languages
(Osgood, Suci, & Tannenbaum, 1957), entails momentary responses of favor or disfavor
engendered by an object (Breckler & Wiggins, 1989; Schimmack & Crites, 2005). The ability to
evaluate one’s environment is learned at an early age, and children’s abilities to distinguish good
from bad are critical in personality development (Rhine, Hill, & Wandruff, 1967). Moreover,
explicitly evaluating external stimuli is an important component of learning from experience and
adapting to a changing environment (Greenberg & Safran, 1987). For example, when a new set
of behaviors results in unsatisfactory outcomes, people often evaluate and adjust their behavior
in an explicit way.
Extensive research has shown that evaluations are retrieved and made automatically in the
presence of objects. Murphy and Zajonc (1993) supported the affective primacy hypothesis
(Zajonc, 1980), which indicates that affective reactions can be elicited with minimal stimulus
input and virtually no cognitive processing. Less extremely, Bargh and colleagues (1992)
suggested a cognitive mediation framework, and demonstrated that most evaluations are stored
in memory and become active automatically with the mere presence of the object. That is,
evaluation can proceed without the intervention of conscious acts of will or guidance of the
process (Bargh & Ferguson, 2000). Although this important past research suggests that
evaluations are retrieved and made automatically, there is surprisingly little evidence on how
evaluations become more efficient and faster. Our purpose was to advance our understanding of
this problem.
11
Proceduralization of Evaluation
Proceduralization is the acquisition of generalized implicit knowledge about a skill that
permits executing the skill without requiring representation of declarative information (i.e.,
description of relevant facts, methods, and procedures) in working memory (Anderson, 1982;
Neves & Anderson, 1981). Proceduralization has been confirmed for a variety of non-social
skills. For example, one of the most common paradigms used to study motor-skill learning is the
serial response time task (Robertson, 2007), during which participants are trained to select
appropriate responses whenever a visual cue appears. With practice, perceptual-motor skills can
become proceduralized, indicated by a gradual reduction in the amount of time required to
execute a task. Judgments of whether words contain a certain target sound can also be
proceduralized with practice (Smith, 1989). Moreover, practicing judgments using formal logic
rules speeds up this type of decision-making process (Carlson, Sullivan, & Schneider, 1989).
Overall, this evidence suggests that various motor and cognitive skills can proceduralize.
Judgment proceduralization has also been confirmed for various social domains. For
instance, Smith, Branscombe, and Bormann (1988) indicated that trait inferences can be
strengthened by practice, and that the effects of practice need not be content-specific. Smith and
colleagues (1992) further demonstrated that repeatedly determining whether a behavior implies a
trait speeds up this judgment in a later time, even when there is no conscious awareness of
practice. Smith, Fazio and Cejka (1996) extended this work to the area of social categorization,
supporting the idea that judgments of a person become more accessible after practice in
determining whether a person belongs to a certain social category. Also related to the speeding
up effects of social judgment practice, Bassili (1993) found that practice with judgments of
whether a behavior implies a trait also rendered more spontaneous trait inferences later, in the
absence of an explicit request.
12
Despite the value of previous work on effects of practice on judgments, no prior research
has directly investigated whether evaluative judgments can be proceduralized during
learning/practice. Before discussing the possibilities of evaluation proceduralization, we describe
how procedural knowledge is produced, and how it influences our learning process.
Based on Fitts’ (1964) three-stage model of learning (i.e., cognitive, associative and
autonomous learning), Anderson (1982) proposed that skill acquisition comprises declarative,
knowledge compilation, and procedural stages. In addition, the defining features of
proceduralization through practice are increased efficiency (i.e., speeding up of the performance)
and removal of deliberative efforts at executing responses.
Specifically, as procedures are initially learned and enacted in a deliberative fashion
(Kolers & Roediger, 1984; Wyer & Srull, 1989), they are often inferred from declarative
knowledge with frequent errors and verbal mediation (Anderson, 1982). For example, when one
learns a certain task for the first time (e.g., riding a bicycle), one must mentally rehearse the
order of the movements to perform the task. Over time, however, reliance on declarative
knowledge decreases and reliance on procedural knowledge increases, allowing the procedural
knowledge to be applied to identical as well as different targets (Anderson, 1982; Smith, 1989,
1994; Smith & Lerner, 1986). That is, during the associative stage, the single steps involved in a
task are converted into a collection of inter-related procedures, and this collection of knowledge
can be activated to guide behavior automatically whenever necessary conditions are met.
Proceduralization, the process of establishing direct condition-action associations, is used to
explain performance improvements (e.g., speedup in execution) during practice of a procedural
skill1.
1 These features therefore distinguish proceduralization from habituation, which is an extremely simple form of non-associative learning. Habituation is often characterized by a progressive diminution of behavioral or attentional
13
Thus, although initially an evaluative procedure may be cognitively demanding, practice
reduces the load of working memory by integrating declarative descriptions of the procedure,
thus making the execution of the procedure effortless. Learning to evaluate stimuli (e.g., good vs.
bad) may be similar to the acquisition of other skills. Extant evidence supporting the notion of
evaluation proceduralization comes largely from work on automatic evaluations. For example,
using evaluative priming paradigms, Fazio and colleagues (1986) demonstrated that the
automatic activation of evaluations is obtained primarily for attitude objects toward which people
have highly accessible attitudes. Similarly, Devine (1989) has shown that the activation of
automatic evaluations (e.g., prejudice) occurs despite a person’s willingness to control or ignore
them. In addition, a study by Castelli and colleagues (2004) supported that, once a person is
categorized as a member of a given group, evaluations of the category are activated
automatically. Thus, the greater the practice with certain evaluations, the more automatic or
spontaneous these evaluations become.
Briefly, past research has established that a specific positive or negative evaluation is often
automatic. However, the empirical question addressed in this research is whether the process of
evaluation proceduralizes with practice. Specifically, although the activation of evaluative or
affective responses to external stimuli may be automatic, making explicit evaluations (e.g.,
ratings on Likert scales) is a voluntary act. For example, the activation of negative evaluative
responses when seeing a snake may be automatic, but quantifying the extent to which this is
unpleasant may be deliberate. In addition, previous research indicated that there are individual
differences in chronic evaluative tendencies (Jarvis & Petty, 1996). For example, people who are
responses with repetition of the same stimulus. For instance, after a period of exposure to continuously presented stimuli (e.g., strong odors, bright light, and noise), our sensory systems (e.g., the nose, the eyes, and the ears) stop responding.
14

high in need to evaluate tend to make extreme fast evaluations, whereas people who are low in
need to evaluate often make moderate or slow evaluations. Therefore, making evaluative
judgments is more automatic for some people, but more deliberate for others.
A range of research has supported the idea that explicit evaluative judgments are not as
efficient as the evaluations measured with implicit measures, such as the implicit association test
(IAT; Greenwald, McGhee, & Schwartz, 1998). Hence, studies of explicit evaluative judgments
may offer ideal opportunities to observe evaluation proceduralization. People who practice
applying an evaluative rating scale may speed up their judgments as time goes by. In fact,
practice may speed up evaluative judgments to both repeated and novel stimuli. That is, response
times to repeated targets may decrease faster than those to novel targets, because earlier
judgments of a target increase the accessibility of the earlier evaluation when a judgment is
conducted again (Smith, 1989). In addition, evaluation proceduralization may influence the way
in which people judge new targets by, for example, increasing the chances of making other
explicit evaluative judgments (Fergusson, Bargh, & Nayak, 2005; see also, Bassili, 1993). For
instance, applying a scale to evaluate images may lead to more evaluations of new images if one
is later asked to write comments about images without any further instruction.
Another important question underlying this research concerns which aspects of explicit
evaluative judgments change during proceduralization. In particular, we want to investigate what
specific processes contribute to the behavioral outcome (i.e., faster response time and better
performance) usually present in proceduralization studies. The evaluative-skill learning itself
requires several stages of cognitive and evaluative operations, such as interpreting the situation
depicted in stimuli, evaluating visceral responses triggered by the target stimuli, comparing the
experience of the presented stimulus with other stimuli, recalling appropriate anchors from the
15
scale, and behaviorally assigning a value to the stimuli. Thus, practicing evaluative judgments
may proceduralize the skills involved in expressing judgments and the evaluations themselves.
These aspects among other processes were addressed by investigating changes in brain activity
during evaluation proceduralization.
Possible Brain Functional Correlates of Proceduralized Evaluations
To detect which aspects of evaluation proceduralize with practice, we examined the effects
of evaluation practice on brain regions associated with (a) procedural learning, (b) declarative
learning, (c) automatic evaluation, and controlled evaluation, and (d) early and late visual
processing, and primary motor processing..
Brain Functional Correlates of Proceduralization
We predicted that practice with explicit evaluations could trigger changes in several
separate sets of regions. Specifically, before practice, evaluative skills are in the form of
declarative learning. Therefore, we should observe activation in brain regions associated with
declarative learning at the early stage of practice. In contrast, when evaluative skills are
transformed to procedural knowledge, activations in regions associated declarative learning
should decrease while activations in regions associated with procedural learning should increase.
1. Brain regions associated with procedural learning. Based on prior research, several
regions are involved in the process of procedural learning. First, basal ganglia are the largest
subcortical structures in the human forebrain, and the system influences multiple aspects of
motor, affective, and cognitive behavior (Graybiel, 2000). The basal ganglia system operates in
close relation with the cerebella cortex, and is part of the extensive basal ganglia-thalamocortical
circuits modulating the activity of the frontal cortex. According to previous research, the basal
ganglia function as a system that helps the cortex to group learning into habits and routines in a
way that facilitates accessing stored information (Graybiel, 2005). Important for our analysis, the
16
basal ganglia are involved in the regulation of non-motor as well as motor sequence learning
(Vakil et al., 2000).
The basal ganglia consist of a set of interconnected subcortical nuclei. The major input
nucleus is the striatum, which consists of the caudate nucleus, the putamen, and the nucleus
accumbens. The striatum is located close to the output station of the basal ganglia - the globus
pallidus, which projects to most cortical areas of the frontal lobe (Alexander et al., 1990). During
learning, the striatum interacts with the sensorimotor and frontal cortices by recognizing known
behavioral contexts and modulating cortical activity to produce a response (Seger, 2006).
Importantly, the striatum plays an essential role in non-declarative/procedural cognitive-skill
learning (Poldrack et al., 1999; Seger & Cincotta, 2006) and implicit sequence learning
(Peigneux et al., 2000). For example, the caudate nucleus has been shown to be more active
during the procedural learning phase of a probabilistic classification task than during a
perceptual-motor control task (Poldrack et al., 1999). Moreover, using a complex serial reaction
time task, Peigneux et al. (2000) found that the striatum plays a critical role in implicit sequence
learning. Specifically, the striatum (e.g., the caudate nucleus, the putamen) was significantly
more active when stimuli were predictable and thus facilitated faster responses than when they
were not. In addition, Destrebecquz and colleagues (2005) investigated the cerebral correlates of
explicit and implicit knowledge in a serial reaction time task. They showed that activity in the
striatum is associated with the implicit component of performing a learned task, whereas activity
in the anterior cingulate and medial prefrontal cortex are associated with the explicit component.
Other research suggests that different parts of the striatum have different functions. For
example, during motor sequence learning, the putamen is involved in the execution of well-
learned movements by projecting to premotor and supplementary motor areas of the cortex. In
17

contrast, the caudate nucleus is one of the main loci for the reward-processing aspect of
behavioral learning (Doya, 2000; Haruno et al., 2004; Packard & Knowlton, 2002) and is
involved while an individual is receiving feedback. Furthermore, Lehericy and colleagues (2005)
suggested that distinct basal ganglia regions are involved in early and advanced stages of motor
sequence learning. Specifically, during motor sequence learning, the rostordorsal areas of the
putamen decrease in activity with practice, whereas the activity of the caudoventral areas of the
putamen increases. Furthermore, the nucleus accumbens plays a role in regulating emotions
(Phan et al., 2004), and in processing rewards (Schoenbaum & Setlow, 2003) and personal
relevance information (Lieberman et al., 2004; Phan et al., 2004). For instance, Lieberman and
colleagues (2004) found that the nucleus accumbens participates in intuition-based self-
knowledge judgments. That is, consistent with an implicit learning interpretation, the nucleus
accumbens was more active when people judged themselves on traits related to behaviors
practiced frequently than when they judged themselves on traits related to behaviors they
practiced infrequently (Lieberman et al., 2004). Similarly, other research found that activity in
the nucleus accumbens increased with both increased emotional intensity and increased self-
relatedness of the stimulus targets (Phan et al., 2004). Hence, the nucleus accumbens apparently
participates in both intrinsic evaluative processing and self-relatedness processing. In sum, we
expected to find increased involvement of the striatal system in evaluations when they are
proceduralized with practice.
In addition to the basal ganglia, the cerebellum is also involved in a wide range of motor
and cognitive tasks, including motor skill learning, mental imagery, sensory processing,
planning, attention, and language (Doya, 2000; Doyon et al., 2003; Hikosaka, 2002; Torriero et
al., 2004; Willingham et al., 2002). Despite these functional similarities, empirical evidence
18
(Doya, 1999, 2000; Exner, Koschack, & Irle, 2002) suggested that the basal ganglia are
associated with reward-based and reinforcement learning, whereas the cerebellum is associated
with error-based and supervised learning. Specifically, the cerebellum plays a role in learning
specific task associations and in monitoring the internal models of the body and the environment.
In contrast, the basal ganglia are more responsible for evaluating the general requirements of a
task and selecting appropriate responses by predicting reward and feedback. Furthermore, prior
research suggested that the cerebellum interacts with the basal ganglia. The output stage of
cerebellar processing (i.e., the dentate nucleus) has a direct influence over the input stage of the
basal ganglia processing (i.e., the striatum) (Hoshi et al., 2005). Thus, the cerebellum may
contribute to procedural learning (Torriero et al., 2004) by adaptively adjusting the basal ganglia
activity on the basis of internal information and error signals (Doya, 2000).
Areas within the parietal lobe have also been proposed to play these active roles. Extensive
neuroimaging and neuropsychology evidence suggests that the posterior parietal lobe plays a
vital role in working memory retrieval (Berryhill & Olson, 2008). There are two separate regions
within the posterior parietal lobe, namely the superior parietal lobe (BA 7 and precuneus) and the
inferior parietal lobe (BA 39 and 40). Although various studies have been conducted to
distinguish the functions of these two regions in learning and memory, the findings are not
congruent. According to some studies, the inferior parietal cortex is more active during implicit-
skill learning (Mallol et al., 2007; Willingham et al., 2002), whereas the superior parietal lobe is
more active during declarative-skill learning (Willingham et al., 2002). However, other studies
have suggested that the superior parietal lobe is more involved in procedural learning, whereas
the inferior parietal lobe is more active in declarative learning. For example, Nadel and
colleagues (2007) detected increased activity at the superior parietal lobe (BA7 and precuneus)
19
with repeated memory retrievals. In addition, Poldrack and his colleagues (1999) found that,
although the bilateral inferior parietal lobe (BA 40) was more active during procedural learning
(vs. control tasks), its activation increased when the task relied on declarative memory. Another
piece of evidence suggests that the inferior parietal lobe may be sensitive to the level of task
difficulty, being more active for difficult (vs. easy) tasks (Klingberg et al., 1997). Therefore, the
activation at the inferior parietal lobe might decrease when task difficulty decreases with
practice. Nonetheless, the current study would provide further evidence of the specific roles of
the superior and inferior parietal lobe in different learning stages.
Besides the above regions that were proposed to be related to learning, we were also
interested in the effects of evaluative proceduralization at the inferior part of the frontal lobe.
Previous research suggests that the inferior frontal gyri are commonly recruited across various
tasks, including learning (Seger & Cincotta, 2006; Willingham et al., 2002). For instance, the
inferior frontal gyrus exhibited greater activity during implicit (vs. random) learning condition in
the serial response time task (Willingham et al., 2002) and during rule learning compared to the
rule application process (Seger & Cincotta, 2006). Similarly, the inferior frontal cortex was
involved in the rehearsal stage but not the storage stage of the phonological learning task (Baldo
& Dronkers, 2006). Therefore, the inferior frontal cortex is related to procedural learning. Thus,
we expected an increase in the activation of the inferior frontal region when evaluations
proceduralize.
2. Brain regions associated with declarative learning. In contrast to the striatum, the
cerebellum, the parietal lobe, and the inferior frontal lobe, the medial temporal lobe system,
which is composed of the hippocampus and the parahippocampal region, is believed to be the
center of declarative learning (Gabrieli et al., 1997; Poldrack et al., 1999; Squire et al., 2004).
20

For example, in an explicit rule-learning task, the striatum is recruited while the medial temporal
lobe is suppressed (Seger & Cincotta, 2006). Similarly, Poldrack and his colleagues (2001) found
that, when the task is proceduralized, the striatum shows increased activation whereas the medial
temporal lobe shows decreased activation. Conversely, when the task in declarative, the striatum
is less active whereas the medial temporal lobe is more active. Thus, similar patterns may be
observed when practice renders individuals more efficient at evaluating stimuli. That is, as the
process of making evaluative judgments of new stimuli is being proceduralized (i.e., faster
evaluations), the activation in the hippocampus and related medial temporal regions decrease.
Hence, in the current study, a decrease in the activation of the medial temporal lobe is expected
when evaluations proceduralize.
Moreover, skill development is typically conceptualized as a decrease in need for explicit
control over performance as time goes by. In neuroimaging studies, the prefrontal cortex has
been regarded as the center of high-level information processing because of its relation to
working memory, action planning, action inhibition, and decision making. For example, the
dorsolateral prefrontal cortex (dlPFC) is active during a wide range of cognitive tasks, such as a
number of problem-solving, probabilistic-learning, and reasoning tasks, as well as working-
memory tasks (Poldrack et al., 1999). For instance, the activation of dlPFC decreases in people
who learn skills faster (Willingham et al., 2002). Along with the hippocampus and the posterior
parietal cortex, the dlPFC also appears to be involved in controlled/demanding (vs.
intuitive/automatic) trait judgments (Lieberman et al., 2004). Similarly, dlPFC activation seems
to be directly associated with task difficulty, as judged by its higher activation during complex
tasks than during simple tasks (Klingberg et al., 1997). In addition to the dlPFC region, the
ventromedial prefrontal cortex (vmPFC) is involved in higher level decision making (Bechara et
21
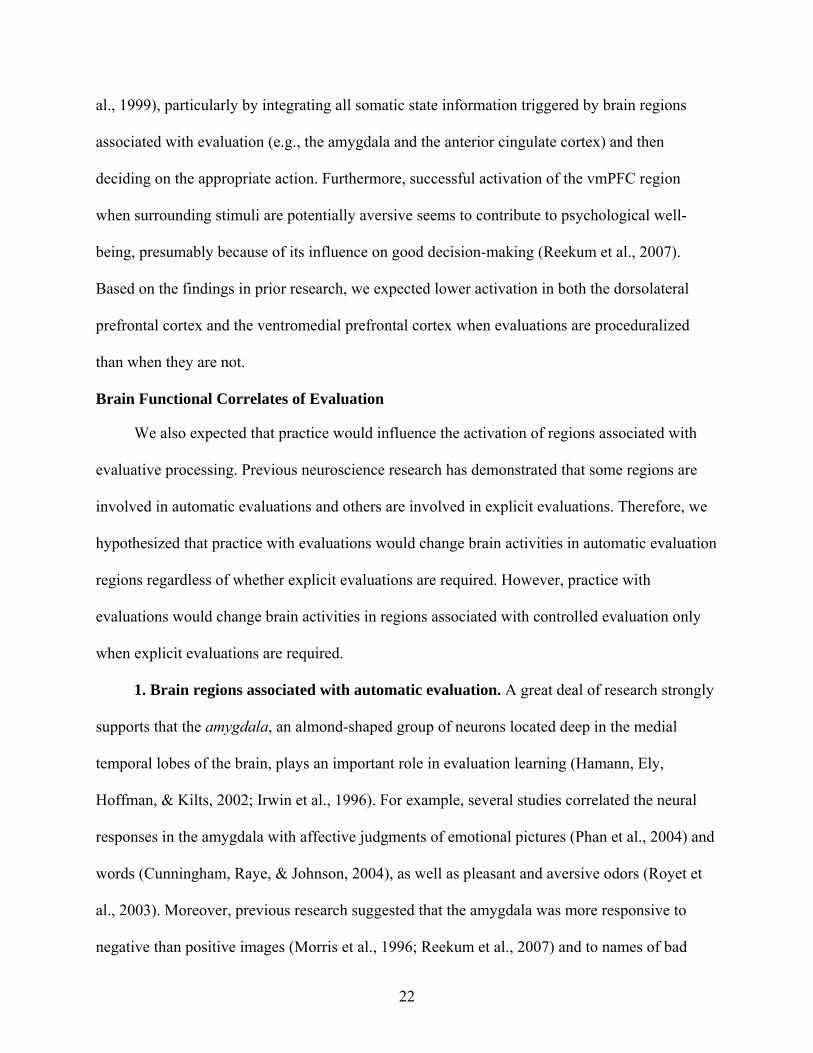
al., 1999), particularly by integrating all somatic state information triggered by brain regions
associated with evaluation (e.g., the amygdala and the anterior cingulate cortex) and then
deciding on the appropriate action. Furthermore, successful activation of the vmPFC region
when surrounding stimuli are potentially aversive seems to contribute to psychological well-
being, presumably because of its influence on good decision-making (Reekum et al., 2007).
Based on the findings in prior research, we expected lower activation in both the dorsolateral
prefrontal cortex and the ventromedial prefrontal cortex when evaluations are proceduralized
than when they are not.
Brain Functional Correlates of Evaluation
We also expected that practice would influence the activation of regions associated with
evaluative processing. Previous neuroscience research has demonstrated that some regions are
involved in automatic evaluations and others are involved in explicit evaluations. Therefore, we
hypothesized that practice with evaluations would change brain activities in automatic evaluation
regions regardless of whether explicit evaluations are required. However, practice with
evaluations would change brain activities in regions associated with controlled evaluation only
when explicit evaluations are required.
1. Brain regions associated with automatic evaluation. A great deal of research strongly
supports that the amygdala, an almond-shaped group of neurons located deep in the medial
temporal lobes of the brain, plays an important role in evaluation learning (Hamann, Ely,
Hoffman, & Kilts, 2002; Irwin et al., 1996). For example, several studies correlated the neural
responses in the amygdala with affective judgments of emotional pictures (Phan et al., 2004) and
words (Cunningham, Raye, & Johnson, 2004), as well as pleasant and aversive odors (Royet et
al., 2003). Moreover, previous research suggested that the amygdala was more responsive to
negative than positive images (Morris et al., 1996; Reekum et al., 2007) and to names of bad
22

people than to names of good people (Cunningham et al., 2003). Furthermore, the amygdala
plays a critical role in advanced decision making by generating emotional states and attaching
affective attributes to stimuli (Bechara et al., 1999). Evidence from both lesion (Adolphs, Tranel,
& Damasio, 1998) and functional neuroimaging studies (Winston, Strange, O’Doherty, & Dolan,
2002) suggests that the amygdala plays a critical role in automatic processes of evaluation. For
example, explicit requests of evaluations are not necessary to produce amygdala activation
(Cunningham et al., 2003; Lane et al., 1997; Wright et al., 2008). Moreover, the left and right
amygdala have dissociable functions in different stages of memory for emotional material
(Sergerie, Lepage, & Armony, 2006). Specifically, the right amygdala is involved in the
formation of emotional memories, whereas the left amygdala is involved in the retrieval of those
memories.
Making emotional evaluations also modulates brain responses to affective stimuli in other
areas, such as the insula. Functional imaging experiments have revealed that the insula plays an
important role in the experience of pain and basic emotions such as anger, fear, disgust,
happiness, and sadness. The insula has extensive connections with the amygdala, and these
connections enable these two structures to operate as a functional unit in emotion induction
(Taylor et al., 2003). For example, previous research demonstrated that evaluating responses to
pleasant or aversive odors elicited activation in the amygdala, the anterior cingulate cortex, and
orbito-frontal cortex, as well as the insula (Royet et al., 2003). More specifically, like the
amygdala, the insula is involved in automatic evaluation, as it responds to the valence (i.e.,
pleasantness vs. unpleasantness) of target stimuli regardless of intention (Cunningham et al.,
2004).
23
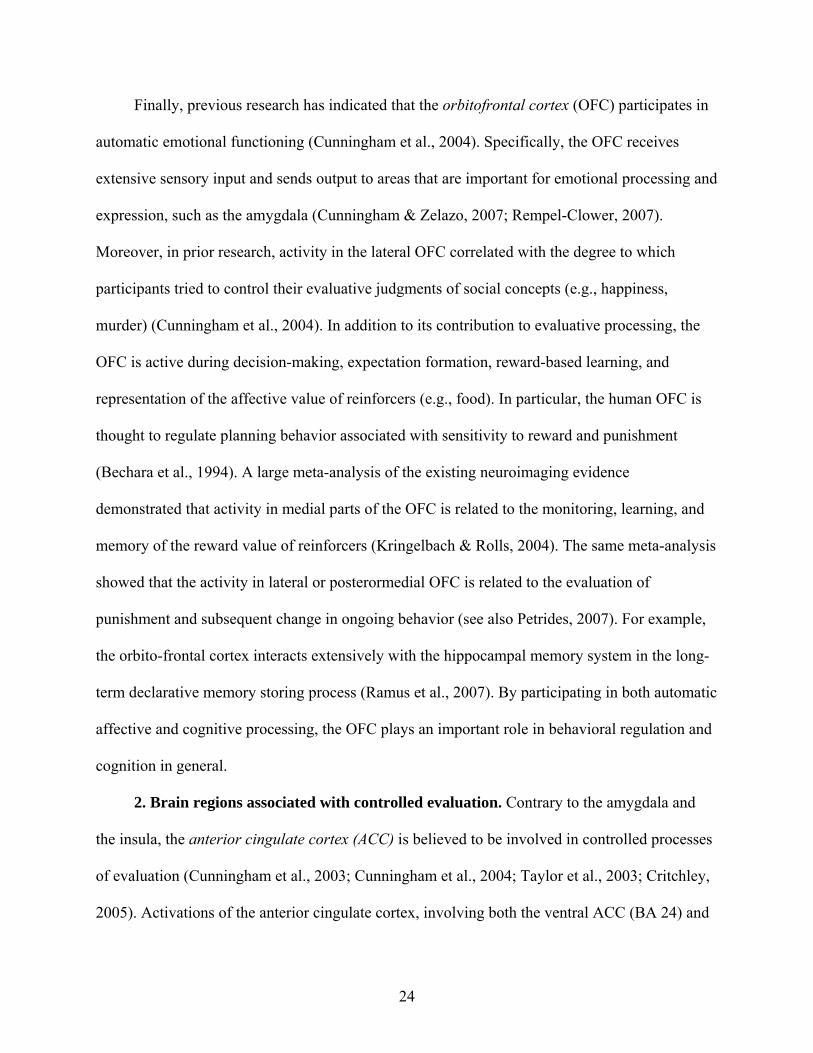
Finally, previous research has indicated that the orbitofrontal cortex (OFC) participates in
automatic emotional functioning (Cunningham et al., 2004). Specifically, the OFC receives
extensive sensory input and sends output to areas that are important for emotional processing and
expression, such as the amygdala (Cunningham & Zelazo, 2007; Rempel-Clower, 2007).
Moreover, in prior research, activity in the lateral OFC correlated with the degree to which
participants tried to control their evaluative judgments of social concepts (e.g., happiness,
murder) (Cunningham et al., 2004). In addition to its contribution to evaluative processing, the
OFC is active during decision-making, expectation formation, reward-based learning, and
representation of the affective value of reinforcers (e.g., food). In particular, the human OFC is
thought to regulate planning behavior associated with sensitivity to reward and punishment
(Bechara et al., 1994). A large meta-analysis of the existing neuroimaging evidence
demonstrated that activity in medial parts of the OFC is related to the monitoring, learning, and
memory of the reward value of reinforcers (Kringelbach & Rolls, 2004). The same meta-analysis
showed that the activity in lateral or posterormedial OFC is related to the evaluation of
punishment and subsequent change in ongoing behavior (see also Petrides, 2007). For example,
the orbito-frontal cortex interacts extensively with the hippocampal memory system in the long-
term declarative memory storing process (Ramus et al., 2007). By participating in both automatic
affective and cognitive processing, the OFC plays an important role in behavioral regulation and
cognition in general.
2. Brain regions associated with controlled evaluation. Contrary to the amygdala and
the insula, the anterior cingulate cortex (ACC) is believed to be involved in controlled processes
of evaluation (Cunningham et al., 2003; Cunningham et al., 2004; Taylor et al., 2003; Critchley,
2005). Activations of the anterior cingulate cortex, involving both the ventral ACC (BA 24) and
24
the dorsal ACC (BA 32), have been observed in functional neuroimaging studies that span a
wide range of cognitive contexts including selective attention and memory (Cabeza & Nyberg,
1997). Prior research implicates ACC in supporting conscious experience including emotional
feeling states (Egan et al., 2003; Hariri et al., 2003; Lane, Chua, & Dolan, 1999; Papez, 1937).
Reportedly, for example, the anterior cingulate cortex engages in conscious evaluation and
appraisal, together with the prefrontal cortex, by regulating amygdala activity (Hariri et al.,
2003). Specifically, the anterior cingulate cortex was more active during cognitive evaluation
(e.g., evaluating whether content of a target picture is natural or artificial) than during perceptual
processing (e.g., matching identical targets) of the same target. Moreover, Lane and his
colleagues (1997) examined neural activity associated with selective attention to subjective
emotional responses in a study in which participants viewed emotional pictures. They found that
when evaluative (vs. non-evaluative) judgments of visual stimuli were requested, activation
increased in the ACC (as well as the temporal pole, the frontal operculum). In other words, the
ACC is involved in controlled evaluation as its activation is higher when there is conscious
awareness of evaluative tasks (see also Cunningham et al., 2003). Therefore, we expected to find
similar patterns of change in the ACC, the temporal pole, and the frontal operculum when
evaluations proceduralize.
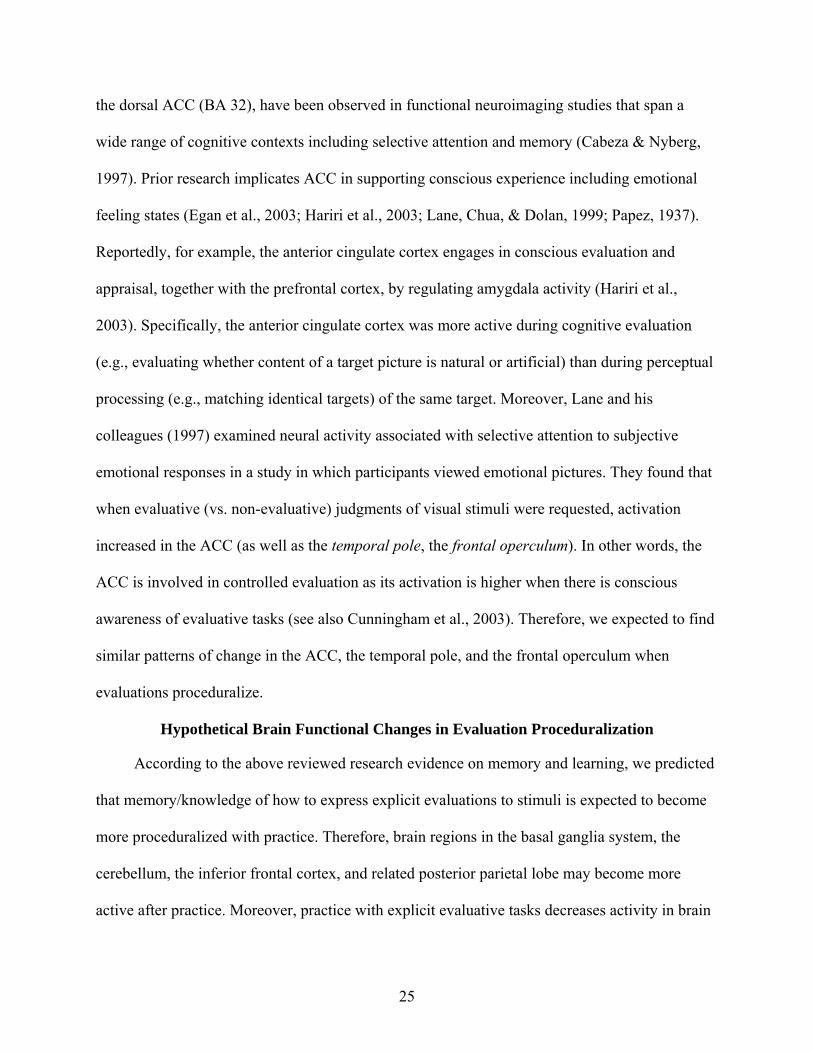
Hypothetical Brain Functional Changes in Evaluation Proceduralization
According to the above reviewed research evidence on memory and learning, we predicted
that memory/knowledge of how to express explicit evaluations to stimuli is expected to become
more proceduralized with practice. Therefore, brain regions in the basal ganglia system, the
cerebellum, the inferior frontal cortex, and related posterior parietal lobe may become more
active after practice. Moreover, practice with explicit evaluative tasks decreases activity in brain
25

regions associated with declarative learning, including the medial temporal lobe, and prefrontal
cortices (Figure 1-1A).
Evaluative skill learning should also alter the level of control and monitoring exhibited in
various frontal cortices (Figure 1-1A). For instance, regions involved in controlled processing of
motor and cognitive skills (e.g., the dorsolateral and the ventromedial prefrontal cortices) may be
less active for evaluative judgment tasks when evaluation is proceduralized. However, activation
in the inferior frontal gyri during evaluative judgments should increase due to its association with
implicit skill learning.
Although even a simple cognitive task performed on emotionally salient stimuli can affect
neural activation in emotion-associated brain regions, a more important question is whether and
how training in evaluation changes neural responses in evaluation-related regions. On the one
hand, repeated exposure to identical stimuli decreases neural responses in corresponding brain
regions (Buchel, Coull, & Friston, 1999). This repetition suppression is thought to reflect a
progressive optimization of neuronal responses elicited by the stimuli when behavioral learning
performance, as well as the effective connectivity between corresponding areas, increase.
However, in past research on repetition suppression, the task stimuli used for participants
practice were identical. Therefore, it is unclear whether brain activity may also decrease when
the stimuli content changes during learning. On the other hand, practicing a certain task can
magnify the specific brain correlates of this task (Grossman, Blake, & Kim, 2004). For example,
signals in the critical regions involved in a motion detection task have been shown to be more
active after extensive practice, and the magnitude of the increase was positively correlated with
the degree of improvement in behavioral performance. Consistently, the left amygdala has been
shown to be more active when making self-descriptiveness judgments of frequent vs. infrequent
26

behaviors (Lieberman et al., 2004). Hence, in the current study, the activation of evaluation-
related brain regions (e.g., the amygdala, the anterior cingulate cortex, the insula, the temporal
pole, the frontal operculum, and the orbito-frontal cortex; Figure 1-1B) could either decrease or
increase when evaluative judgments are proceduralized. In addition, we hypothesized that the
pattern of activity change in regions associated with automatic evaluations and regions
associated with controlled evaluations would be different. Specifically, evaluation
proceduralization should have effects on automatic evaluation regions regardless of task
requirement, whereas on controlled evaluation regions only during evaluations. Moreover, with
evaluation practice, the magnitude of change in activities in evaluative regions should be
positively associated with the improvement in response times to evaluative judgments.
Because evaluative judgments also require visual and motor systems, we are also interested
in whether practice with evaluations influences brain activity in visual and motor regions (Figure
1-1C). Several studies have suggested that practice with certain tasks does not influence the
activation at early visual regions (e.g., a word classification task, Maccotta & Buckner, 2004; a
picture priming task, Eddy et al., 2007) or primary motor regions (Maccotta & Buckner, 2004).
In contrast, late visual regions are sensitive to practice with responses to visual targets (Eddy et
al., 2007; Maccotta & Buckner, 2004). Therefore, in the current study, we predicted that practice
with evaluative judgments may not influence the activation in the early visual area (i.e., the
calcarine) and the primary motor area (e.g., BA 4). In contrast, practice with evaluative
judgments of visual stimuli should increase the activation of later visual areas such as the
posterior fusiform and regions in the occipital lobe (e.g., the superior occipital gyrus, and the
parietal occipital gyrus) (Grossman, Blake, & Kim, 2004).
27

The Present Research
Two studies were conducted to investigate the influence and brain functional correlates of
practice with evaluative judgments. In Experiment 1, we examined whether practice in
evaluating pictures on a scale increases the speed of evaluative judgments and the likelihood of
making evaluative judgments of other visual stimuli. First, participants completed a practice task
that entailed making either evaluative or non-evaluative responses to a set of pictures. After a
series of filler tasks, participants were instructed to list their spontaneous thoughts about a new
set of pictures. Hypothetically, evaluative-skill learning should speed up evaluative judgments to
visual images. In addition, practice in evaluative judgments should increase the likelihood of
making spontaneous evaluative judgments at a later time.
To test the brain functional correlates of practice in evaluative judgments, participants in
Experiment 2 completed procedures similar to those used in Experiment 1 while in an MRI
scanner. Specifically, participants’ brain activity was recorded both before and after they
practiced making evaluative judgments (vs. non-evaluative judgments) to non-repeated visual
images. Thus, by collecting brain images both before and after the practice, changes in brain
activities may reveal the neural consequences of evaluation proceduralization.
During evaluative skill learning, we expected increased activation in the striatum (e.g., the
caudate nucleus, the putamen, and the nucleus accumbens), the cerebellum, the inferior frontal
gyri and the occipital cortex, but decreased activation in the medial temporal lobe, and certain
prefrontal cortices (i.e., the ventromedial prefrontal cortex and the dorsolateral prefrontal cortex).
In addition, if activation of the inferior parietal lobe increases with evaluation proceduralization,
that of the superior parietal lobe should decrease, and vice versa. Furthermore, the activation in
evaluation-related regions (e.g., the amygdala, the ACC, the insula, the temporal pole, the frontal
operculum, and the OFC) may change (increase or decrease) due to practice in evaluation. In
28

29
addition, activation change in regions related to automatic evaluation should occur regardless of
whether explicit evaluations are required. In contrast, activation change in regions related to
controlled evaluation should present only when explicit evaluations are requested. The
hypothesized evaluation proceduralization-induced changes in each brain region would be tested
in clusters of interrelated regions. Moreover, correlational analyses would be conducted to
examine the relations between regional changes in each cluster and behavioral performance.

30
Figure 1-1. Brain regions associated with evaluation proceduralization and predicted effects. Arrows indicate predicted directions of
BOLD signal changes in each group of regions when evaluation proceduralization occurs. Up arrows indicate increases, down arrows indicate decreases, and right arrows indicate no change in BOLD signals of the group of regions on the right.

CHAPTER 2 EXPERIMENT 1
Method
Overview
During Experiment 1, participants were seated at individual stations in front of a video
monitor with stimulus presentation and instructions being controlled by a computer. They were
told that they were participating in a study to explore the automaticity of social information
processing, and that the procedure would involve a series of short computerized tasks. Based on
random assignment, participants completed either evaluative or non-evaluative judgments of the
same set of images selected from the International Affective Picture System (IAPS; NIMH
Center for the Study of Emotion and Attention, Lang et al., 2001), presented in 4 blocks of trials.
Specifically, participants in the evaluative-practice condition evaluated the pleasantness of the
content of stimulus images using a scale provided for that purpose, whereas participants in the
non-evaluative-practice condition estimated the frequency with which images with content
similar to the target image appear on television, using a scale provided for that purpose. Next,
participants completed a series of filler tasks designed to reduce potential demand characteristics
and to allow 30 minutes to elapse. Then, all participants completed a thought listing task in
which they were asked to list their initial reactions to each of four new stimulus images.
Participants and Design
A total of 48 undergraduate students (24 females, 24 males) at the University of Florida
participated in this study in exchange for partial fulfillment of requirements for course credit.
The experimental design was a 2 (task: evaluative- vs. non-evaluative practice) X 4 (block: first,
second, third, or fourth) repeated-measures factorial, with task being a between-subjects factor.
31
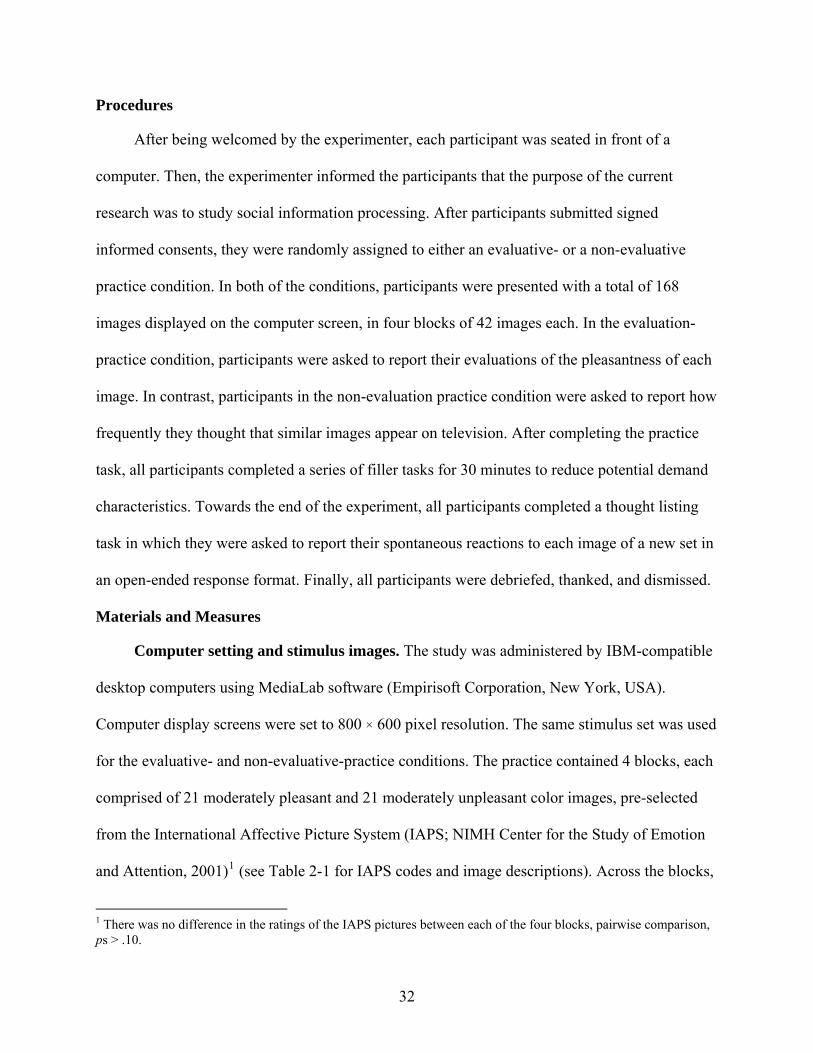
Procedures
After being welcomed by the experimenter, each participant was seated in front of a
computer. Then, the experimenter informed the participants that the purpose of the current
research was to study social information processing. After participants submitted signed
informed consents, they were randomly assigned to either an evaluative- or a non-evaluative
practice condition. In both of the conditions, participants were presented with a total of 168
images displayed on the computer screen, in four blocks of 42 images each. In the evaluation-
practice condition, participants were asked to report their evaluations of the pleasantness of each
image. In contrast, participants in the non-evaluation practice condition were asked to report how
frequently they thought that similar images appear on television. After completing the practice
task, all participants completed a series of filler tasks for 30 minutes to reduce potential demand
characteristics. Towards the end of the experiment, all participants completed a thought listing
task in which they were asked to report their spontaneous reactions to each image of a new set in
an open-ended response format. Finally, all participants were debriefed, thanked, and dismissed.
Materials and Measures
Computer setting and stimulus images. The study was administered by IBM-compatible
desktop computers using MediaLab software (Empirisoft Corporation, New York, USA).
Computer display screens were set to 800 × 600 pixel resolution. The same stimulus set was used
for the evaluative- and non-evaluative-practice conditions. The practice contained 4 blocks, each
comprised of 21 moderately pleasant and 21 moderately unpleasant color images, pre-selected
from the International Affective Picture System (IAPS; NIMH Center for the Study of Emotion
and Attention, 2001)1 (see Table 2-1 for IAPS codes and image descriptions). Across the blocks,
1 There was no difference in the ratings of the IAPS pictures between each of the four blocks, pairwise comparison, ps > .10.
32
4 (2 positively- and 2 negatively-valenced) images were repeated to differentiate the
proceduralization of evaluation on familiar and novel targets. Finally, the stimulus set used to
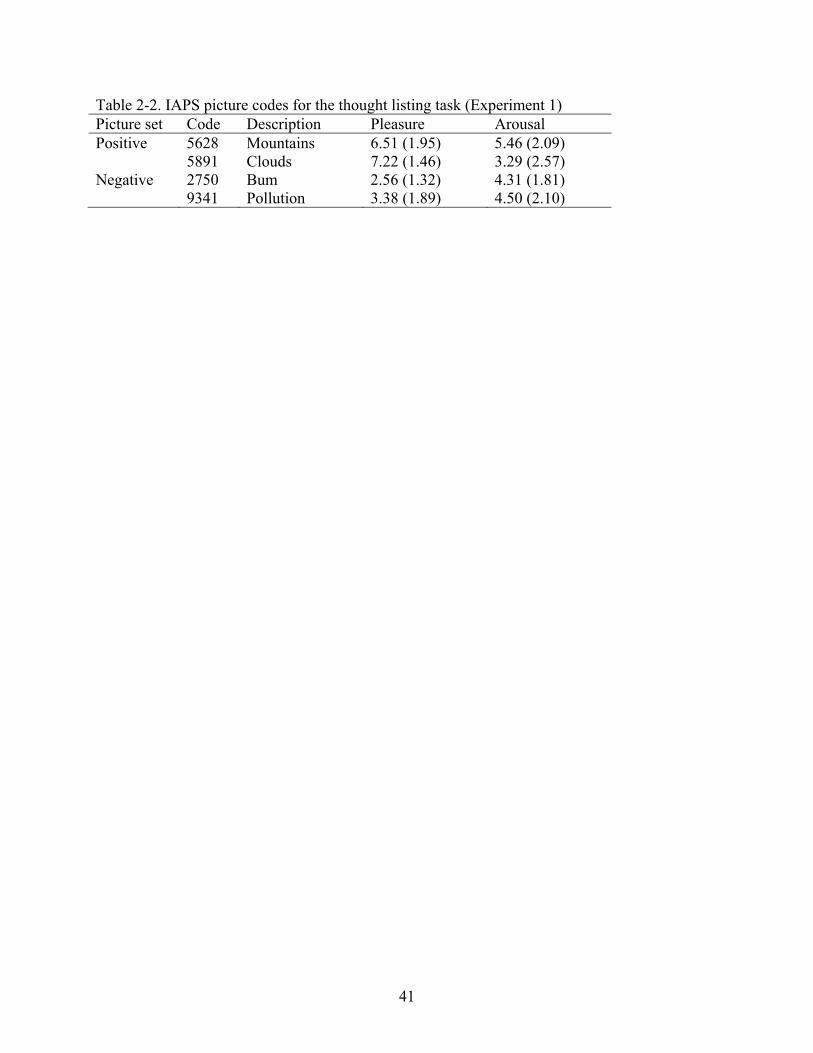
measure spontaneous thoughts after the practice consisted of 2 moderately pleasant and 2
moderately unpleasant color images, also pre-selected from the IAPS (see Table 2-2 for IAPS
codes). All images were resized to 410 × 307 pixels and digitized in 24-Bit RGB color.
Evaluation practice. Participants randomly assigned to the evaluative-judgment-practice
condition were instructed as follows:
This task involves evaluating the content of images. Please rate how pleasant (i.e., positive, good, pleasing, etc.) you find the content of each image using the scale provided. We are interested in both your evaluation and the speed with which you make it. Therefore, try to respond as quickly and as accurately as you can.
The task consisted of four blocks of 42 trials. Each trial presented the question, “How pleasant
do you find the content of this image?” which was centered at the top of the display screen with
an image presented in the center of the display screen and a 7-point scale, ranging from 1
(extremely unpleasant) to 7 (extremely pleasant), presented vertically on the left side of the
screen. Participants responded by clicking the left-mouse button on the appropriate point on the
scale. Stimulus images were presented in a random order during each block of 42 trials.
Non-evaluation practice. Participants randomly assigned to the non-evaluative practice
condition were instructed as follows:
This task involves estimating the frequency with which images of similar content appear on television. Please estimate the frequency using the scale provided. We are interested in both your estimate and the speed with which you make it. Therefore, try to respond as quickly and as accurately as you can.
The task involved four blocks of 42 trials. Each trial presented the instruction, “Please estimate
the frequency with which images of similar content appear on television,” which was centered at
the top of the display screen with an image presented in the center of the display screen and a 7-
point scale, ranging from weekly to by the minute, presented vertically on the left side of the
33
screen. As in the evaluation practice condition, participants responded by clicking the left-mouse
button on the appropriate point on the scale.
Thought listing task. After the practice in evaluative or non-evaluative judgments, all
participants were presented with a set of four new images. During the thought listing task,
participants were asked to list their spontaneous thoughts of the content of each stimulus image.
These stimulus images were presented in a random order. To quantify the extent to which
participants exhibited evaluative and frequency-related judgments, each comment participants
listed was coded as either evaluative or frequency-related by two independent coders, r = 0.81, p
< .001. Specifically, comments such as “it is disgusting that people would live in such an
environment” were coded as evaluative, whereas comments such as “it is common to see this on
TV” were coded as frequency-related, and comments such as “it is a dog” were coded as neither
evaluative nor frequency-related.
Results
Response Time
Because participants could spend as much time as they needed to respond to each stimulus,
to correct for anticipatory responses and momentary inattention, the response time data from
each participant were examined to eliminate outliers in the distribution of response times.
Specifically, response times below 300 ms and above 3,000 ms were excluded. Thus, 1288
response times were regarded as missing data (16% of all responses). Then, the means and
standard deviations of each participant’s response times were calculated. Then, for each
participant, the response times beyond the range of [M − 2.5SD, M + 2.5SD] were also excluded
(for similar data cleaning process, see Greenwald et al., 1998). Overall, 10 response times were
regarded as outliers (0.15% of all valid responses).
34

If the judgment practice was successful, participants should have made quicker evaluative
or non-evaluative judgments as the task progressed. Mean response times for each participant
were computed for the four task blocks and entered into a 2 (practice: evaluation vs. frequency)
× 4 (Task block: first, second, third, and fourth) repeated-measures ANOVA, with practice being
a between-subjects factor. The mean response times corresponding to this analysis appear in
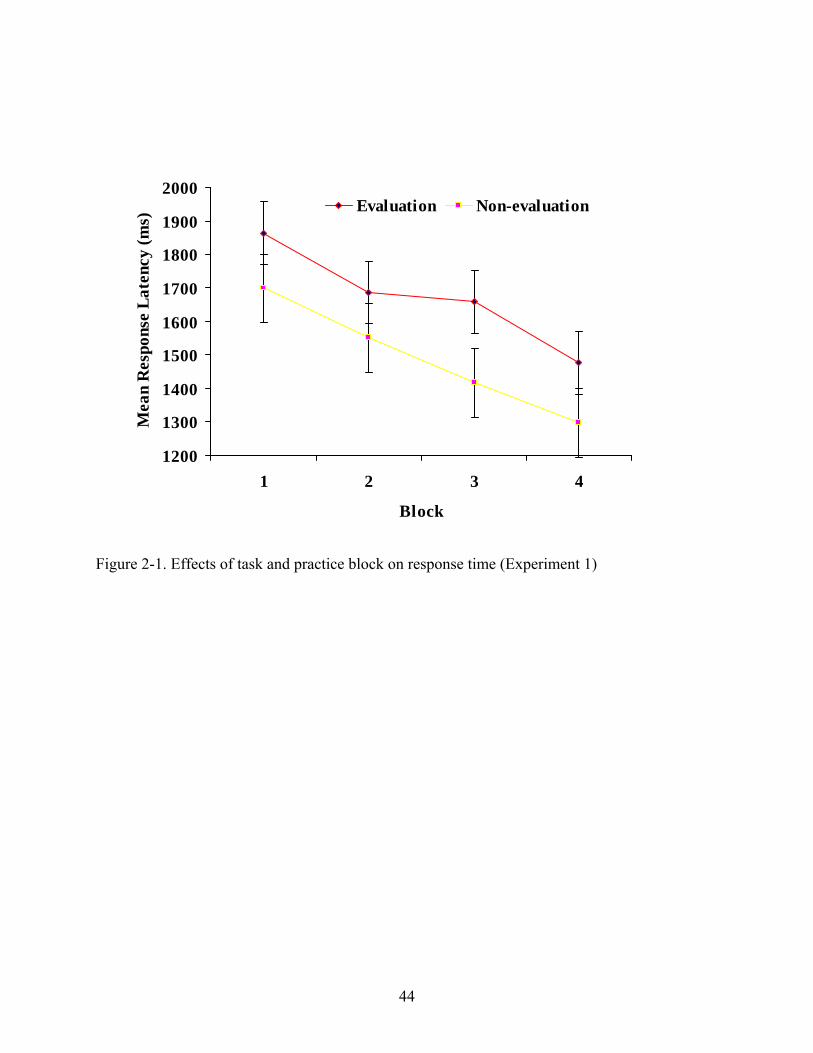
Figure 2-1. As expected, a significant main effect of block revealed that, with practice,
participants became quicker at making judgments, F (3, 138) = 68.50, p < .001. No other main
effect or interaction was detected. Moreover, there was a linear trend in the decrease of response
time over the four blocks, F (1, 46) = 148.70, p < .001. From the above results, we can infer that
both evaluative and non-evaluative judgments of images proceduralized through practice.
Moreover, the pattern of practice effects on repeated vs. new judgment targets was
examined by a 4 (Task block: first, second, third, and fourth) × 2 (Target: repeated vs. new) two-
way repeated-measures ANOVA. Means of response times corresponding to this analysis appear
in Table 2-3. As expected, participants made quicker ratings of images that they had rated
previously (M = 1412.90 ms) compared to new ones (M = 1609.88 ms) across blocks, F (1, 47) =
55.34, p < .001. Further analysis revealed that in Block 1, there was no difference between
response times to the images repeated in the following blocks compared to images used only
once (M = 1810.22 ms vs. 1786.92 ms, ns). However, the response times participants spent to
rate previously-seen images decreased more with practice than the response times to new images
across the practice blocks (block 2, 3, and 4), F (3, 141) = 17.56, p < .001. More importantly, as
predicted, the response times to new images in the evaluative-practice condition also decreased
significantly across the practice blocks, F (3, 75) = 31.09, p < .001, as well as those in the non-
evaluative-practice condition, F (3, 63) = 21.81, p < .001. These findings suggest that response
35
times of both previously seen and new images were influenced by the practice manipulation. No
effects of practice condition (evaluative vs. non-evaluative tasks) were found on response times
or ratings to pictures.
Responses to Tasks
To examine the effects of practice on participants’ responses, a 4 (block: one, two, three,
vs. four) X 2 (valence: pleasant vs. unpleasant images) repeated measures ANOVA was
performed on task ratings2 in both evaluative and non-evaluative judgments practice conditions.
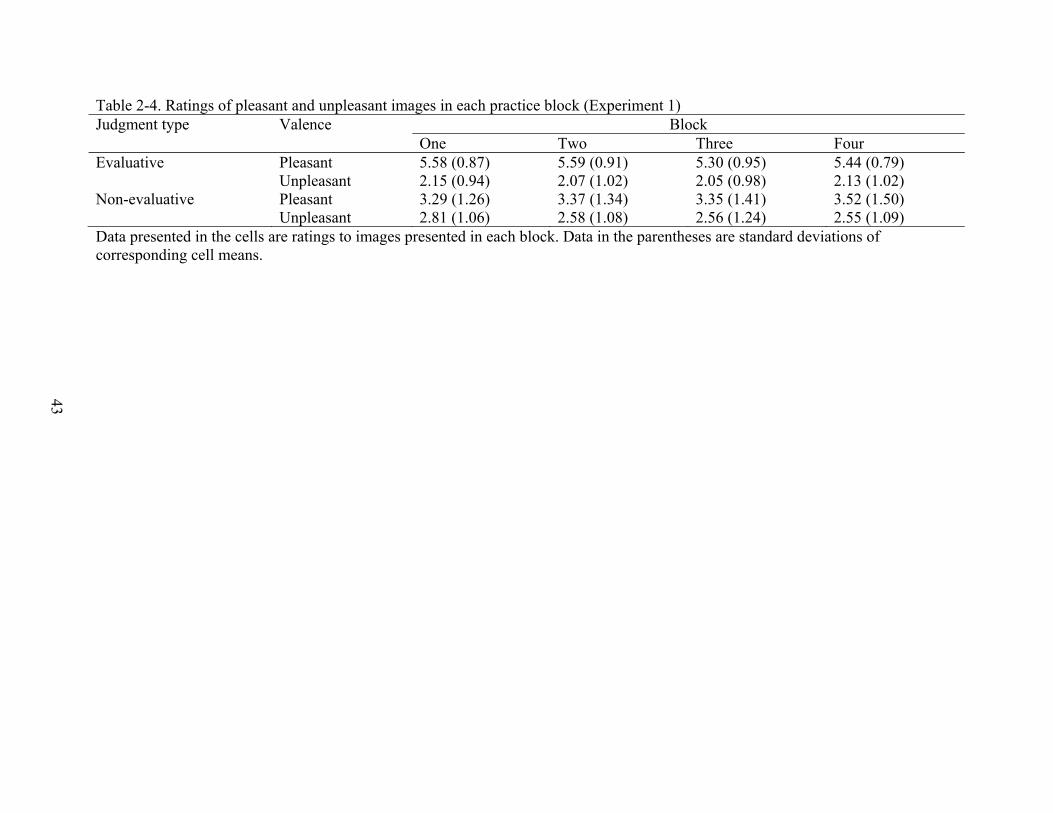
Mean pleasantness and frequency ratings in each block appear in Table 2-4. During evaluation
practice conditions, pictures selected as pleasant did receive higher pleasantness (M = 5.48)
ratings than pictures selected as unpleasant (M = 2.10), F (1, 25) = 100.11, p < .001. Moreover,
there was a significant main effect of block on pleasantness ratings, F (3, 75) = 3.52, p < .05.
That is, the pleasantness ratings decreased over the blocks. In contrast, there was no between-
block difference in frequency ratings, F < 1. In addition, pleasant images (M = 3.38) were rated
as more frequently seen than unpleasant images (M = 2.63), F (1, 21) = 6.15, p < .05. There was
no interaction between block and valence in either the evaluative or the non-evaluative practice
condition.
Spontaneous Thought Listing
To confirm that the evaluation practice task promotes greater spontaneous evaluative
responding, the proportion of evaluative (frequency-related) judgments from each participant in
the spontaneous thought listing task was computed as the percentage of number of evaluative
(frequency-related) comments in the total number of comments of the corresponding participant.
Then, we analyzed the proportion of coded evaluative thoughts during the thought listing task as
2 Only responses with valid response times were remained in the analysis.
36
a function of the type of practice participants previously had. Specifically, a one-way ANOVA
with judgment condition (evaluative vs. non-evaluative judgments) as the between-subjects
factor was conducted on the coded responses. Results indicated that participants who completed
the evaluative practice generated a greater proportion of evaluative comments (M = 0.51) than
participants who completed the non-evaluative practice (M = 0.42), F (1, 46) = 3.90, p = .05.
However, participants who completed the practice condition of frequency-related judgments (vs.
evaluative judgments) did not generate a greater proportion of frequency-related thoughts
towards new images, M = 0.004 vs. 0.003, F < 1. Thus, the evaluative practice appeared to elicit
more spontaneous evaluations in response to new images, whereas practice in making non-
evaluative judgments (e.g., frequency) did not increase the likelihood of making similar
judgments. No effects of valence of images were found, F < 1.
Discussion
The present findings suggest that, although evaluative responses are often automatic, there
is still room for evaluative judgments to get faster. Specifically, in the current study, participants’
evaluative judgments of visual images became quicker with practice, and this effect was not
content specific. Moreover, comparable to Bassili’s (1993) findings that practice with general
trait judgment increases the likelihood of subsequent spontaneous trait inferences, we found that
practicing evaluative judgments (vs. frequency-related judgments) makes people more likely to
make spontaneous evaluations at a later time. However, the proceduralization effects on
frequency-related judgments did not carry over to spontaneous responses to further targets. That
is, although frequency-related judgments also speeded up with practice, practice did not make
people more likely to make such responses spontaneously. This discrepancy in spontaneous
responses might indicate that evaluations are more automatic than frequency-related judgments
in the first place. Therefore, practice with frequency-related judgments did not lead to
37

spontaneously thinking about something as specific as whether a picture is likely to appear on
television. . More research should be conducted to further examine the differences between
evaluative and other responses to novel targets.
Based on the findings in Experiment 1 that evaluative judgments speeded up over practice
(see also Smith, 1989), Experiment 2 was conducted to further explore what aspects of
evaluation were proceduralized during practice. Specifically, in Experiment 2, we used an fMRI
approach to investigate the brain activity underlying evaluation proceduralization.
38
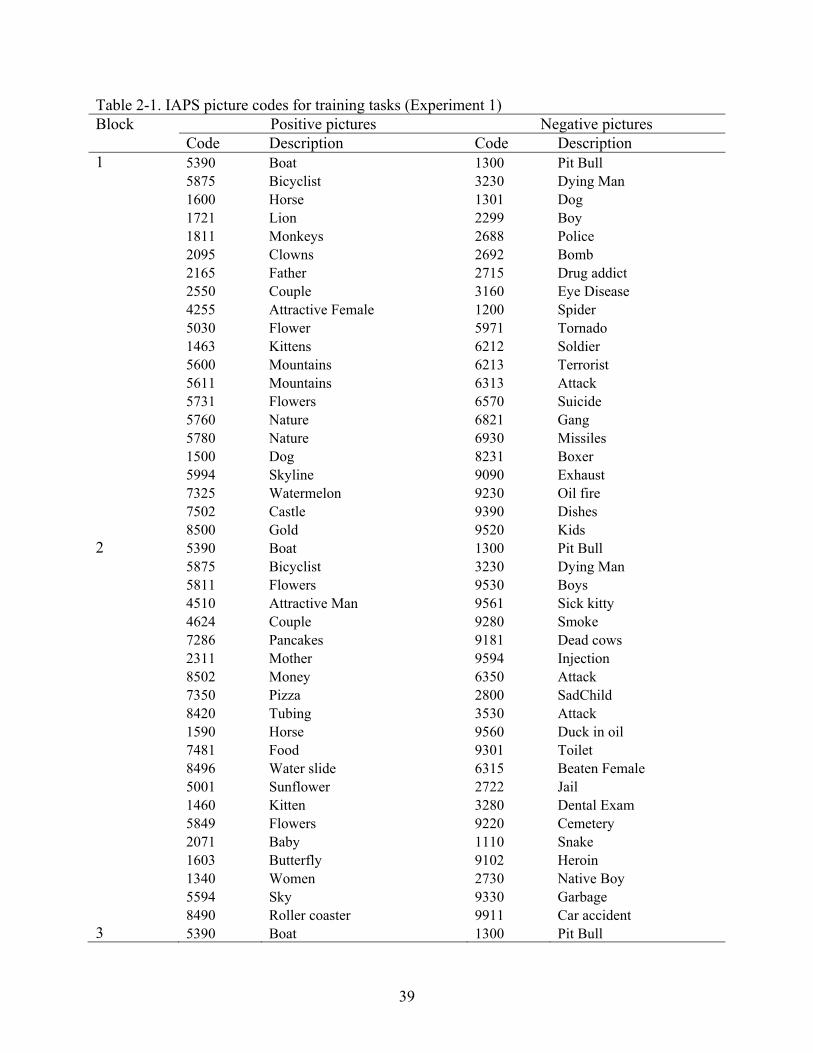
Table 2-1. IAPS picture codes for training tasks (Experiment 1) Block Positive pictures Negative pictures Code Description Code Description 1 5390 Boat 1300 Pit Bull 5875 Bicyclist 3230 Dying Man 1600 Horse 1301 Dog 1721 Lion 2299 Boy 1811 Monkeys 2688 Police 2095 Clowns 2692 Bomb 2165 Father 2715 Drug addict 2550 Couple 3160 Eye Disease 4255 Attractive Female 1200 Spider 5030 Flower 5971 Tornado 1463 Kittens 6212 Soldier 5600 Mountains 6213 Terrorist 5611 Mountains 6313 Attack 5731 Flowers 6570 Suicide 5760 Nature 6821 Gang 5780 Nature 6930 Missiles 1500 Dog 8231 Boxer 5994 Skyline 9090 Exhaust 7325 Watermelon 9230 Oil fire 7502 Castle 9390 Dishes 8500 Gold 9520 Kids 2 5390 Boat 1300 Pit Bull 5875 Bicyclist 3230 Dying Man 5811 Flowers 9530 Boys 4510 Attractive Man 9561 Sick kitty 4624 Couple 9280 Smoke 7286 Pancakes 9181 Dead cows 2311 Mother 9594 Injection 8502 Money 6350 Attack 7350 Pizza 2800 SadChild 8420 Tubing 3530 Attack 1590 Horse 9560 Duck in oil 7481 Food 9301 Toilet 8496 Water slide 6315 Beaten Female 5001 Sunflower 2722 Jail 1460 Kitten 3280 Dental Exam 5849 Flowers 9220 Cemetery 2071 Baby 1110 Snake 1603 Butterfly 9102 Heroin 1340 Women 2730 Native Boy 5594 Sky 9330 Garbage 8490 Roller coaster 9911 Car accident 3 5390 Boat 1300 Pit Bull
39

Table 2-1. Continued Block Positive pictures Negative pictures Code Description Code Description 3 5875 Bicyclist 3230 Dying Man 2510 ElderlyWoman 9452 Gun 1942 Turtles 6230 Aimed Gun 1750 Bunnies 1932 Shark 7291 Chicken 3500 Attack 2209 Bride 2683 War 7340 Ice cream 2205 Hospital 4538 EroticMale 9584 Dental Exam 7470 Pancakes 9800 Skinhead 7270 IceCream 9042 Stick thru lip 2660 Baby 5970 Tornado 2655 Child 1201 Spider 7400 Candy 2751 Drunk driving 1731 Lion 2691 Riot 2092 Clowns 9342 Pollution 5990 Sky 1019 Snake 7289 Food 7359 PieW/bug 5626 HangGlider 2720 Urinating 8497 CarnivalRide 2710 Drug addict 1920 Porpoise 9417 Ticket 4 5390 Boat 1300 Pit Bull 5875 Bicyclist 3230 Dying Man 5779 Courtyard 9620 Shipwreck 8501 Money 9910 Auto accident 4610 Romance 2981 DeerHead 1640 Coyote 6020 Electric chair 2346 Kids 1280 Rat 4150 AttractiveFem 1310 Leopard 2310 Mother 9440 Skulls 1710 Puppies 2900 Crying boy 2391 Boy 9810 KKK rally 2030 Woman 9080 Wires 2345 Children 1112 Snake 1610 Rabbit 6415 DeadTiger 7330 Ice cream 8485 Fire 1602 Butterfly 9401 Knives 2650 Boy 9920 Auto accident 1440 Seal 9830 Cigarettes 2501 Couple 6830 Guns 4250 AttractiveFem 2702 BingeEating 7460 French fries 6300 Knife
40
41
Table 2-2. IAPS picture codes for the thought listing task (Experiment 1) Picture set Code Description Pleasure Arousal Positive 5628 Mountains 6.51 (1.95) 5.46 (2.09) 5891 Clouds 7.22 (1.46) 3.29 (2.57) Negative 2750 Bum 2.56 (1.32) 4.31 (1.81) 9341 Pollution 3.38 (1.89) 4.50 (2.10)
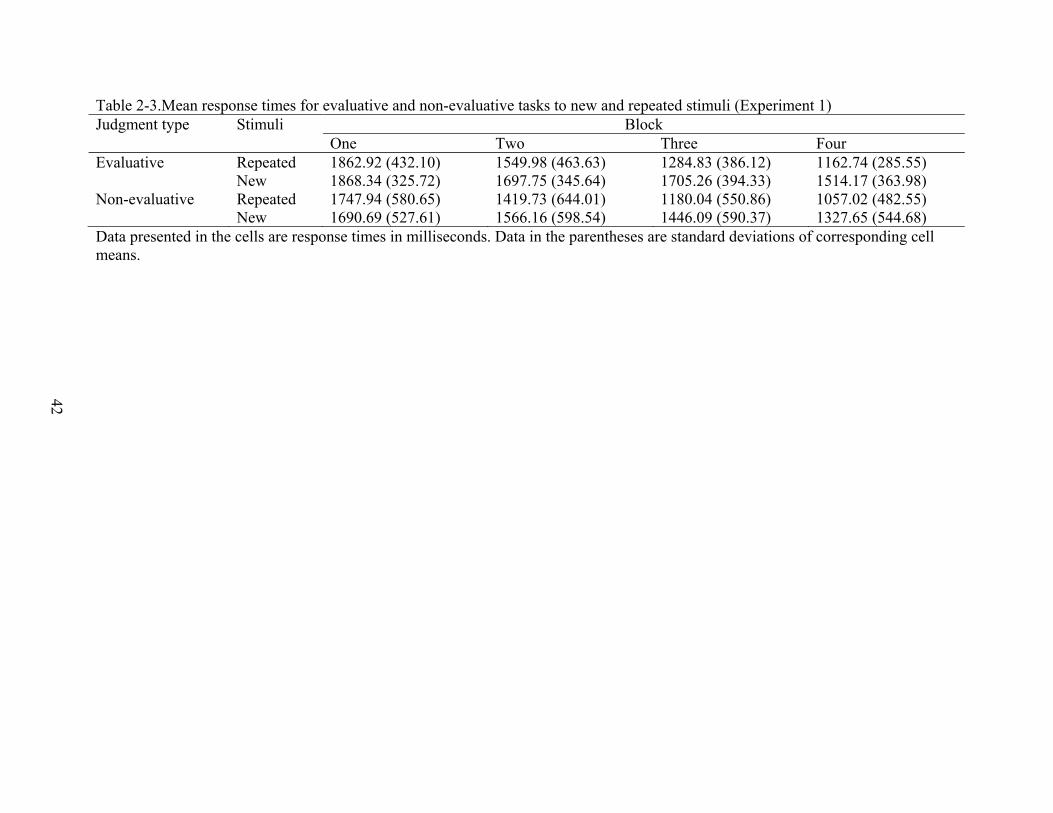
Table 2-3.Mean response times for evaluative and non-evaluative tasks to new and repeated stimuli (Experiment 1) Judgment type Stimuli Block
One Two Three Four Evaluative Repeated 1862.92 (432.10) 1549.98 (463.63) 1284.83 (386.12) 1162.74 (285.55) New 1868.34 (325.72) 1697.75 (345.64) 1705.26 (394.33) 1514.17 (363.98) Non-evaluative Repeated 1747.94 (580.65) 1419.73 (644.01) 1180.04 (550.86) 1057.02 (482.55) New 1690.69 (527.61) 1566.16 (598.54) 1446.09 (590.37) 1327.65 (544.68) Data presented in the cells are response times in milliseconds. Data in the parentheses are standard deviations of corresponding cell means.
42
43
Table 2-4. Ratings of pleasant and unpleasant images in each practice block (Experiment 1) Judgment type Valence Block
One Two Three Four Evaluative Pleasant 5.58 (0.87) 5.59 (0.91) 5.30 (0.95) 5.44 (0.79) Unpleasant 2.15 (0.94) 2.07 (1.02) 2.05 (0.98) 2.13 (1.02) Non-evaluative Pleasant 3.29 (1.26) 3.37 (1.34) 3.35 (1.41) 3.52 (1.50) Unpleasant 2.81 (1.06) 2.58 (1.08) 2.56 (1.24) 2.55 (1.09) Data presented in the cells are ratings to images presented in each block. Data in the parentheses are standard deviations of corresponding cell means.
1200
1300
1400
1500
1600
1700
1800
1900
2000
1 2 3 4
Block
Mea
n R
espo
nse
Late
ncy
(ms)
Evaluation Non-evaluation
Figure 2-1. Effects of task and practice block on response time (Experiment 1)
44
45
CHAPTER 3 EXPERIMENT 2
Method
Overview
The aim of Experiment 2 was to explore the effects of evaluation proceduralization at the
brain level. The procedures used in Experiment 2 were similar to the ones in Experiment 1 with
two exceptions. First, the participants were placed in an MRI scanner while they were
completing the practice tasks. Second, to test the effects of evaluation practice, the brain
activities of each participant were recorded during evaluative and non-evaluative ratings both
before and after a training run in evaluative tasks. Specifically, in the pre-training run, we
presented 60 images (30 for evaluative tasks, and 30 for non-evaluative tasks) to all participants.
Then, in the training run, all participants were asked to make evaluative judgments of 150 IAPS
images. Towards the end of the experiment, in the post-training run, participants reported
evaluative judgments and non-evaluative judgments of a new set of images. The brain activity of
each participant was measured during both the pre-training and the post-training runs using
functional magnetic resonance imaging (fMRI). In addition, response times were recorded for all
judgments.
In both the pre-training and post-training runs, participants had to attend to pictures,
generate ratings, and make motor responses for both types of tasks. However, only the evaluative
skill was trained in the training run. Thus, by comparing neural responses during evaluative (vs.
null trials) condition and non-evaluative (vs. null trials) condition before and after evaluative
skill learning, we could distinguish the underlying processes that are specific to
proceduralization of evaluation.

We hypothesized that the evaluation practice may influence the brain activity while
participants make evaluative judgments. Specifically, after the practice run, activities in the
amygdala and other evaluation related regions for evaluative tasks would either increase or
decrease compared to activities prior to the evaluative training run. Furthermore, increased
regional activities should be observed in the procedural learning regions and late visual regions,
whereas decreased activities should be detected in declarative learning related regions and
prefrontal areas.
Participants
Sixteen male students4 at the University of Florida participated in Experiment 2 to fulfill
the requirement of a general psychology class. One participant was excluded due to discrete head
movements greater than 1mm during the scanning. Due to technical reasons, data from another
participant were missing. Thus, data from 14 participants remained in the analysis. Participants’
ages ranged from 18 to 24 (M = 19.71, SD = 1.68).
Based on the results of screening tests and safety checks, none of the participants had a
history of medical, neurological or psychiatric disorder. Also, participants were not taking
psychotropic medication and did not have a history of substance abuse. Also, all participants had
normal visual acuity.
Procedures
The participants were recruited for participation in a social cognitive neuroscience study
that involved MRI scanning while viewing pictures. After turning in the signed informed consent
4 Because there was no difference in evaluation proceduralization between male and female participants in Experiment 1, F < 1, and the greater safety of fMRI for males, only male participants were recruited in the fMRI study.
46
forms, participants entered the scanning room. The scanning technician assisted participants to
get ready for the scan.
After completing a pre-training run on 30 evaluative and 30 non-evaluative judgments,
each participant completed an evaluation training run as well as a post-training run. In these three
runs of the study, participants were presented with pictures selected from the International
Affective Picture System (IAPS; Center for the Study of Emotion and Attention, 2001) which
contains a diverse range of pictures that have been reliably coded along several continuous
dimensions of emotionality (i.e., valence, and arousal) (see Table 3-1, 3-2, 3-3 for information of
IAPS pictures presented in the pre-training, training, post-training runs, respectively).
Specifically, in the pre- and post- training runs of the study, a cue below each picture instructed
participants to make either an evaluative or a non-evaluative judgment of the picture being
presented, while in the training run, only evaluative judgment cues were presented. The purpose
of the training run was to proceduralize evaluation, and the post-training run was performed to
evoke neural responses to evaluative and non-evaluative judgments to provide comparisons of
these responses with brain activities for evaluative and non-evaluative judgments in the pre-
training run.
Functional Imaging Data Acquisition
Participants were scanned using a Siemens Allegra 3 Tesla scanner (Siemens, Munich,
Germany) with a standard head coil. Anatomic images were acquired using an MPRAGE
sequence with TR = 1500 ms, TE = 4.38 ms, and flip angle = 8°. In the axial plane, 160 slices
were acquired (thickness 1.0–1.2 mm, according to the height of the brain) with in-plane field of
view of 240 mm × 180 mm and a matrix size of 256 × 192 voxels. Functional images covering
the whole brain were acquired using echo-planar imaging sensitive to blood-oxygenation level
dependent (BOLD) effects, with TR = 3000 ms, TE = 30 ms, and flip angle = 90°. In the axial
47
plane, 38 slices with a thickness of 3.8 mm were aligned with the plane of the intercommissural
line and had a 240 × 240 mm in-plane field of view and a matrix size of 64 × 64 voxels. The
functional tasks were presented using an Integrated Functional Imaging System (IFIS, MRI
Devices, Inc., Waukesha, WI) with a 7-inch LCD screen at 640 × 480 pixel resolution, mounted
over the participant’s head and viewed using a fixed prism mirror. The screen subtended
approximately 14° × 11° of the visual field. A PC running E-Prime (Psychology Software Tools,
Pittsburgh, PA) presented each task trial in synchronization with the first RF pulse of each scan.
Responses were collected using a MRI-compatible button glove attached to the participant’s
right hand5.
Materials and Measures
Image selection. The images selected from the IAPS picture system were moderately
intensive according to normative valence and arousal ratings obtained from a pilot study.
Pleasant pictures included images of a blue sky, food, and flowers, whereas unpleasant pictures
included stimuli such as images of a snake, a pit bull, and garbage. Different sets of stimuli were
used in the pre-training (see Table 3-1), the training (see Table 3-2), and the post-training (see
Table 3-3) runs of the study. In the pre-training run, pictures selected as pleasant images had
higher normative ratings in pleasantness [M = 6.39, SD = 0.64; t (29) = 11.93, p < .001],
compared to the neutral point of the 9-point scale used in IAPS system, whereas pictures in the
unpleasant set had lower pleasantness scores than the neutral scale point, M = 3.85, SD = 1.15, t
(29) = −5.45, p < .001. The same pattern was found for images selected for the post-training.
That is, pictures selected as pleasant received higher scores than the neutral point of the scale (M
5 All participants are right-handed, according to the pre-screening self-reports.
48
= 6.79, SD = 0.83; t (29) = 11.76, p < .001), whereas pictures selected as unpleasant received
lower scores than the neutral point of the scale, M = 3.82, SD = 0.89; t (29) = −7.24, p < .001.
More importantly, the IAPS picture sets selected for Experiment 2 were matched in
valence and arousal distribution across judgment type (evaluative vs. non-evaluative tasks) and
run (pre- vs. post- training runs). Specifically, in the pre-training run, the mean valence (pleasant
vs. unpleasant) score was 5.08 (SD = 0.64) for evaluative tasks and 5.16 (SD = 0.64) for non-
evaluative tasks, pairwise comparison, ns, and the mean arousal (exciting vs. calm) score was
4.44 (SD = 0.79) for evaluative tasks and 4.76 (SD = 0.79) for non-evaluative tasks, pairwise
comparison, ns. In the post-training run, the mean valence (pleasant vs. unpleasant) score was
5.30 (SD = 0.60) for evaluative tasks and 5.31 (SD = 0.60) for non-evaluative tasks, pairwise
comparison, ns, and the mean arousal (exciting vs. calm) score was 4.98 (SD = 0.90) for
evaluative tasks and 4.68 (SD = 0.90) for non-evaluative tasks, pairwise comparison, ns. In
addition, for evaluative tasks, there were no significant differences in pleasantness ratings (M =
5.08 vs. 5.30, ns, pre- vs. post- training run) or arousal ratings (M = 4.44 vs. 4.98, ns, pre- vs.
post- training run) between images presented in the pre- and post- training run. Also, there were
no between run differences in valence (M = 5.16 vs. M = 5.31, ns, pre- vs. post- training run) and
arousal (M = 4.76 vs. M = 4.68, ns, pre- vs. post- training run) ratings in pictures selected for
non-evaluative tasks. This similarity of input images should ensure that different brain responses
are due to evaluation proceduralization or judgment type, but not to the images themselves.
Parameters of images presentation. Unlike in Experiment 1, we did not use a between-
subjects design in the pre- and post-training sessions. Instead, we alternated the presentation of
the evaluative and non-evaluative tasks in a random order to avoid confounding training effects
with anticipation effects. Specifically, in the pre- and post- training runs, each participant was
49

presented with 60 images (30 for evaluative judgments, and 30 for non-evaluative judgments) for
3 seconds each, along with 30 null trials, during which a fixation cross was displayed for 3
seconds. Thus, the pre- and post-training runs each lasted 4 minutes and 30 seconds. Null trials
were included in the random sequence in order to jitter the stimulus onset asynchrony (SOA)
between trials, and to increase the variance in the resulting fMRI response and make the response
to rapid stimuli (SOA < 15 seconds) detectable (Burock et al., 1998). Moreover, jittering the
SOA with randomly interspersed null trials creates a geometric distribution of SOAs, which is
believed to be more efficient than uniform randomization (Serences, 2004). To minimize
response attenuation when repeating images while maximizing the number of trials in the pre-
training and post-training sessions (Soon, Venkatraman, & Chee, 2003), the resulting mean SOA
was set to 4.5 seconds, with a minimum of 3 seconds.
In the evaluative skill training run, 150 evaluative trials were presented for 2 seconds each
in ten 30-second blocks of 15 images, which were separated by 12-second rest blocks during
which a fixation cross was displayed. Thus, the training run lasted 7 minutes and 12 seconds.
The number of positive and negative trials was balanced in every two blocks. That is, if 7
positive and 8 negative trials were presented in the previous block, then 8 positive and 7 negative
trials were presented in the following block. The trials were presented more rapidly during
training than testing to induce proceduralization.
Evaluative and non-evaluative ratings. In the pre-training and the post-training sessions,
both evaluative and non-evaluative judgment cues were used (see Appendix A for instructions).
In the evaluation-training session, only evaluative judgments were requested. Specifically, in
Experiment 2, the evaluative-judgment cue was “How pleasant do you find the content of this
image?” (see Figure 3-1 for sample images), which was followed by a 4-point scale ranging from
50

extremely unpleasant to extremely pleasant. In contrast, the non-evaluative-judgment cue read,
“How frequently do images with similar content appear on television?” (see Figure 3-1 for
sample images) and was followed by a 4-point scale ranging from rarely/never to always. The
brain activities during evaluative and non-evaluative ratings were recorded as the dependent
measures.
Regions-of-interest selection. In the current research, a regions-of-interest (ROI)
approach was employed to test our hypothesized effects of practice of evaluative skills on brain
activity. There are advantages to an ROI approach. When subtracting two conditions in a whole-
brain group-analysis, the significance of all voxels is determined using a Bonferroni correction
for the number of voxels. Therefore, arguably, the correction for the number of all voxels is too
strict, as only a few regions are of real interest. Thus, regional analyses afford considerable
power by reducing the number of multiple comparisons and averaging multiple voxels within
each region, thereby increasing signal-to-noise ratios (Poldrack, 2007). In addition, because
regions are derived a priori, their signal estimates are unbiased (Maccotta & Buckner, 2004).
Our regional analyses explored signal magnitude estimates within a set of a priori regions
that spanned the basal ganglia system, prefrontal cortex, evaluative processing regions, early and
late visual cortex, and the motor cortex. First, peak locations of these regions were derived from
prior research on related tasks. For example, regions related to evaluative processing were
mainly derived from previous work on social evaluation and subjective emotional responses, and
regions related to learning were selected based on previous research on motor and cognitive skill
learning. Then, three-dimensional regions of interest were defined by including all voxels within
5 mm of each activation peak (Etkin et al., 2006; Maccotta & Buckner, 2004). This method of
creating small ROIs at the peaks of activation clusters based on previous research has been
51

regarded as particularly suitable for complex designs, such as factorial designs, and it can depict
signal patterns in specific regions within larger anatomical clusters (Poldrack, 2007).
Results
Our study was aimed at exploring the brain activity during evaluation procedualization,
using null trials as the comparison condition. We hypothesized that practice with evaluation
changes activation patterns in major brain regions related to affect and evaluation, such as the
activation patterns in the amygdala, the insula, the orbito-frontal cortex, the anterior cingulate
cortex, the temporal pole, and the frontal operculum. In addition, we expected that task
instructions (evaluative vs. non-evaluative task instructions) would influence the pattern of
activation change in regions associated with controlled (vs. automatic) evaluation. The direction
of the difference was an empirical question that we hoped analyses would resolve. Also, because
evaluative judgments are proceduralized during the training run, evaluative judgments (vs. null
trials) may produce differential activation in the procedural learning regions (declarative learning
regions) more (less) in the post-training run than in the pre-training run.
Behavioral Findings
Response Time
Response times for evaluative and non-evaluative tasks were recorded during both the pre-
training and the post-training runs. Unlike in Experiment 1, responses to images in Experiment 2
had a 3000ms window in both pre-training and post-training runs. Consequently, 47 responses
(3.22% of all responses) faster than 300 ms were regarded as missing data as they most likely
reflected late responses to the previously presented images. In addition, response times outside
the range of [M − 2.5SD, M + 2.5SD] for each individual in each run were deleted as outliers.
Overall, 20 response times were regarded as outliers (1.37% of all responses).
52
Response times were analyzed as a function of run (pre- vs. post-training) and task
(evaluative vs. non-evaluative) using a mixed model with linear and quadratic trends in time as
covariates. The analysis revealed a significant main effect of run on response time, F (1, 1387) =
14.99, p < .001. Specifically, participants responded to images faster in the post-training run than
in the pre-training run, Mdiff = −94.44 ms. In addition, there was a significant main effect of task,
F (1, 1387) = 32.72, p < .001. That is, across the pre- and post- training runs, participants
responded faster to evaluations than to frequency judgments, Mdiff = −139.55 ms. Moreover,
there was a marginal interaction between run and task in response time, F (1, 1387) = 2.98, p <
.10. Participants reported evaluations faster during the post-training run (M = 1866.87 ms) than
the pre-training run (M = 2003.41 ms), p < .001. Although response times for non-evaluative
tasks tended to be faster in the post-training run than in the pre-training run, the effect was not
significant, M = 2048.51 vs. 2100.86 ms, p > .10. In sum, these findings suggest that trained
evaluative responses speeded up, whereas untrained non-evaluative responses did not.
A manipulation check was also performed to examine whether evaluative and non-
evaluative judgments were proceduralized in the pre-training run. For this purpose, separate
mixed models of the effects of experiment time on response time were used for evaluative tasks
and non-evaluative tasks in the pre-training run. Results showed no linear trend or quadratic
trend in response times for either evaluative or non-evaluative tasks in the pre-training run, Fs <
1. Furthermore, the same analysis was performed for the post-training run to see whether
evaluative judgments received further proceduralization in the post-training run. Results showed
no speeding up in evaluations during the post-training run, F < 1, confirming that evaluations
were proceduralized during the evaluative skill learning session. In contrast, in the post-training
run, the linear trend in response times for non-evaluative judgments was marginally significant,
53
F (1, 21.85) = 3.68, p = .07. This manipulation check confirmed that there were no training
effects on either evaluative or non-evaluative tasks in the pre-training run. In contrast, evaluative
tasks were proficiently proceduralized in the evaluation training session as the speed was not
improved in the post-training run. However, because non-evaluative tasks were not practiced
between the pre- and post- training runs, we observed practice effects on non-evaluative tasks
during the post-training run.
Responses to Tasks
Ratings of visual stimuli that were made with invalid response times were regarded as
missing ratings. Then, to examine the effects of training on evaluative judgments on participants’
ratings of pleasantness, a 2 (run: pre-training vs. post-training run) X 2 (valence: pleasant vs.
unpleasant images) ANOVA was performed on task ratings. Means of responses related to this
analysis appear in Table 3-4. Results indicated a significant main effect of valence on
pleasantness ratings, F (1, 174) = 208.69, p < .001. Not surprisingly, pictures selected as pleasant
did receive higher pleasantness (M = 3.84) ratings than pictures selected as unpleasant (M =
2.86). Moreover, there was a significant interaction between run and valence, F (1, 24.70) =
29.64, p < .001. That is, the difference in pleasantness ratings of positive and negative images
was greater in the post-training run (M = 3.99 vs. 2.64, positive vs. negative images, pairwise
comparison, p < .001) than in the pre-training run (M = 3.69 vs. 3.08, positive vs. negative
images, pairwise comparison, p < .001). Furthermore, tests of simple effects showed that
pleasant images were rated as more pleasant in the post-training run than in the post-training run,
M = 3.99 vs. 3.69, p < .01. In addition, unpleasant images were rated as more unpleasant after the
evaluation training, M = 2.64 vs. 3.08, post-training vs. pre-training run, p < .001. No main effect
of run was found on evaluative responses, p < .30.
54
A comparison between non-evaluative (frequency-related) ratings in pre-training and post-
training runs was examined by conducting a 2 (run: pre-training vs. post-training run) X 2
(valence: pleasant vs. unpleasant images) ANOVA. Means of responses related to this analysis
appear in Table 3-4. First, the main effect of run was significant, F (1, 4.87) = 6.54, p < .05. That
is, images presented in the post-training run (M = 3.20) were rated as less frequently seen on TV
than the ones presented in the pre-training run (M = 3.37). Moreover, we found a marginal 2-way
interaction between run and valence, F (1, 2.26) = 3.04, p = .08. Specifically, there was no
difference in frequency ratings between positive (M = 3.36) and negative images (M = 3.37) in
the pre-training run, ns. However, in the post-training run, negative images (M = 3.09) were
regarded as seen less often than positive images (M = 3.31), p < .05. In other words, frequency
ratings to pleasant images did not differ across runs, whereas those to unpleasant images
decreased. No main effect of valence on frequency ratings was found, p > .10.
Furthermore, the distribution of ratings for both types of tasks in the pre- and post- training
run appears in Table 3-5. Specifically, participants made use of all four buttons during both
evaluative and non-evaluative tasks, rather than simplifying the task by using only the extreme
ratings. Importantly, although participants rated positive images as more pleasant than negative
images to a greater extent in the post-training (vs. pre-training) run, an equality test indicated that
the distribution of the frequency of responses did not change from the pre- to the post- training
runs, K-S Z < 1, ns. However, the frequency of using different buttons for non-evaluative tasks
was distributed differently in the post-training run than in the pre-training run, K-S Z = 1.65, p <
.01.
In addition, as another indicator of improved performance across runs, the percentage of
omitted trials for each type of task decreased significantly in the post-training (vs. pre-training)
55

run (see Table 3-5 for number of omitted trials for each condition). Specifically, for evaluative
tasks, the percentage of omitted trials dropped significantly from the pre- (rate = 19.50%) to the
post-training run (rate = 6.90%), χ2 (1, N = 840) = 29.16, p < .001. Reduced omit rate was also
found for non-evaluative tasks (26.70% vs. 10.95%, pre-training vs. post-training run,
respectively), χ2 (1, N = 840) = 33.96, p < .001.
Functional Imaging Data Analyses
The functional imaging data of each participant were analyzed using BrainVoyager 1.7.6
(Brain Innovations, Maastricht, Holland) and SPSS 13. The functional images were coregistered
with anatomic images, and normalized to Talairach space for each participant. Functional data
were processed with 3D motion correction, linear trend removal, slice scan time correction, and
spatial smoothing. The pre-training and post-training runs underwent Gaussian spatial smoothing
using a kernel of 5.7 mm (1.5 voxels) full-width half-maximum (FWHM).
Task-related activity was mapped using a voxel-wise general linear modeling analysis. For
event-related analyses, the BOLD responses were estimated using a standard hemodynamic
model (Friston, Josephs, Rees, & Turner, 1998). The estimated responses were fit to the MR
signal for each individual to generate a beta weight. Then, in the pre- and post-training runs,
BOLD responses in each ROI at each time point were obtained, including evaluative, non-
evaluative, and null trials.
After that, for each pre-training and post-training run event, percentage signal change was
calculated. Specifically, voxels within each ROI were averaged to create a single time series
(containing 90 time points) for each participant during each run. Within each run, percent
changes in BOLD signal associated with evaluative (non-evaluative) responses were calculated
as the difference between the magnetic resonance signal during the evaluative (non-evaluative)
tasks and the signal during the null trials, divided by the average BOLD signal during the null
56
trials. At last, a mixed model with linear and quadratic time trends as covariates was used to
estimate the effects of task (evaluative vs. non-evaluative judgments) and run (pre- vs. post-
training).
Tests of Evaluation Proceduralization
Regions-of-interest were created for regions proposed to be involved in evaluation
proceduralization (see Table 3-6 for relevant coordinates of each ROI). As ROIs were defined a
priori, the same ROI template was applied to all participants. For each individual participant,
separate estimates of the hemodynamic response were generated for each condition at each voxel
using a deconvolution analysis. All voxels within 5mm around the centers of the ROIs in Table
3-6 were included in the analysis. Specifically, the percentage of BOLD signal changes in these
ROIs at each second in the pre-training and the post-training runs were calculated as the
difference between the BOLD signal during the (evaluative, non-evaluative) tasks and the BOLD
signal during the fixation points (i.e., the null trials), divided by the BOLD signal in fixation
points in the corresponding run. For example, a BOLD signal change of 0.50 (−0.50) at a certain
time point indicates a regional activity of 50% percentage higher (lower) than the baseline
activity of that individual during the corresponding run (pre- or post- training run).
Mixed model analysis. In the current study, the evaluative and non-evaluative tasks, as
well as the null trials, were randomly presented in both the pre- and the post- training runs.
Therefore, for each participant, the time intervals between evaluative-task trials and between
non-evaluative-task trials were not constant. In this situation, autocorrelation coefficients can
only be obtained directly by fitting a smoothed approximation to the time series. Therefore, we
fitted time series using the mixed-model module of SPSS. This model incorporates between-
subjects variability and allows modeling covariances that need to be considered.
57

To test the significance of signal change, regional amplitude estimates in each region were
entered into the mixed model module of SPSS. Specifically, the mixed model entailed practice
run (pre- vs. post- training), valence (pleasant vs. unpleasant), and task (evaluative vs. non-
evaluative) as factors, with linear and quadratic time trends as covariates. The linear and
quadratic time trends were included to model the time series. All factors were fixed, and an
autoregressive residual covariance structure (AR1) was used to account for the autocorrelation in
the time series data. In addition, correlations between linear (quadratic) time trend and other
factors (i.e., task, valence, and run) were included in the analysis. The degrees of freedom in the
mixed model were calculated using the Satterthwaite approximation, which produces data
dependent degrees of freedom. Statistical thresholds for mixed-model analyses for each ROI
were set at p < .05.
Cluster analysis. To test our hypotheses of activity change in regions of similar functions,
estimated regional BOLD signals of ROIs with similar predicted functions were congregated into
clusters before entered to mixed models. Correction of alpha errors was applied at the cluster
level.
Findings in Regions Associated with Learning
Regions associated with procedural learning. To confirm our hypotheses that evaluation
proceduralization produces increased activities in brain regions previously associated with
procedural learning, we centered the caudate nucleus on ±9, 15, 4 (Poldrack et al., 1999), the
putamen on 18, −1, 15 (Mallol et al., 2007) and −27, 8, 4 (located in an independent study, N =
8), the nucleus accumbens on −4, 6, −2 (Lieberman et al., 2004), the cerebellum on 31, −65, −18
(Willingham et al., 2002), the precuneus on 12, −67, 50 (Willingham et al., 2002), the inferior
parietal lobe on 50, −26, 36 (Poldrack et al., 1999) and −34, −46, 56 (Mallol et al., 2007), and the
inferior frontal gyri on ±47, 17, 24 and ±43, 3, 32 (Maccotta & Buckner, 2004) (see Table 3-6
58

for a list of information for each ROI). These regions were included in the cluster of procedural
learning in the cluster analysis.
Caudate nucleus. The right caudate nucleus area (located around 9, 15, 4; Poldrack et al.,
1999) showed a significant main effect of run, F (1, 1310) = 9.46, p = .002. The activation of the
right caudate nucleus was higher in the post-training run than in the pre-training run, Mdiff = 0.11,
t (1310) = 3.08, p = .002. This between-run effect was present in the evaluative tasks (M = 0.14,
95% CI = 0.04, 0.24, vs. M = 0.29, 95% CI = 0.18, 0.39; pre-training vs. post-training run, p <
.01), but not in non-evaluative tasks (M = 0.21, 95% CI = 0.10, 0.32, vs. M = 0.28, 95% CI =
0.18, 0.38; pre-training vs. post-training run, p > .15). However, the interaction between run and
task did not reach significance, F (1, 1559) = 1.11, p > .20. Also, there were no simple effects of
different types of task on the right caudate nucleus in either the pre-training or the post-training
run, both ps > .30.
We found a similar BOLD signal change pattern in the left caudate nucleus (centered on
−9, 15, 4). Specifically, the effect of different run (pre-training vs. post-training run) was
marginally significant, F (1, 1293) = 3.45, p = .06. The left caudate nucleus was more active in
the post-training run (M = 0.25, 95% CI = 0.14, 0.36) than in the pre-training run (M = 0.19, 95%
CI = 0.08, 0.30). Moreover, the interaction between run and task reached a marginal significance,
F (1, 1534) = 3.66, p = .06. As in the right caudate nucleus, the activation of the left caudate
nucleus for evaluative tasks was higher in the post-training run (M = 0.28, 95% CI = 0.16, 0.40)
than in the pre-training run (M = 0.15, 95% CI = 0.03, 0.27; p < .01), but there was no between-
run difference in the activation for non-evaluative tasks (M = 0.23, 95% CI = 0.11, 0.36, vs. M =
0.23, 95% CI = 0.11, 0.35, pre-training vs. post-training run, ns). Again, we found no between-
task differences in the left caudate nucleus either before or after the training run, both ps > .05.
59
Because the findings in the left and right caudate nucleus were similar, BOLD signals were
combined to test the overall effects of evaluation proceduralization in the caudate nucleus region.
Results of the mixed model showed a main effect of run, F (1, 1297) = 6.94, p < .01. That is, the
bilateral caudate nucleus was more active in the post-training run (M = 0.27, 95% CI = 0.17,
0.37) than the pre-training run (M = 0.18, 95% CI = 0.09, 0.28). In addition, evaluative tasks
triggered higher activation in the bilateral caudate nucleus in the post-training run (M = 0.28,
95% CI = 0.18, 0.39) than in the pre-training run (M = 0.14, 95% CI = 0.04, 0.25), p < .01. In
contrast, the activation in the bilateral caudate nucleus for non-evaluative tasks did not change
(M = 0.22, 95% CI = 0.11, 0.33 vs. M = 0.26, 95% CI = 0.15, 0.37, pre-training vs. post-training
run, ns). However, the interaction between task and run did not reach significance, F (1, 1541) =
2.44, p = .12. No main effect of task was found, F < 1.
Putamen. There were main effects of run and task on the caudoventral regions of putamen
(centered on 18, −1, 15; Mallol et al., 2007). Specifically, activation in this putamen area was
higher in the post-training run (M = 0.27, 95% CI = 0.21, 0.33) than the pre-training run (M =
0.18, 95% CI = 0.11, 0.24), F (1, 1410) = 12.67, p < .001. Moreover, this increased activation in
the caudoventral putamen was found for both evaluative (M = 0.21, 95% CI = 0.14, 0.28, vs. M =
0.29, 95% CI = 0.22, 0.36; pre- vs. post- training run, p < .05) and non-evaluative tasks (M =
0.14, 95% CI = 0.07, 0.22, vs. M = 0.25, 95% CI = 0.18, 0.32; pre- vs. post- training run, p <
.01). In addition, evaluative tasks (M = 0.25, 95% CI = 0.19, 0.31) triggered more brain activity
in the caudoventral putamen than non-evaluative tasks (M = 0.20, 95% CI = 0.13, 0.26), F (1,
1625) = 4.63, p < .05. No other main effects or interactions were found, Fs < 1.
The rostrodorsal regions of the putamen (centered on −27, 8, 4; located in an independent
study, N = 8) exhibited a different pattern reflected in a significant main effect of run, F (1,
60

1392) = 18.36, p < .001. Specifically, activation in the rostrodorsal putamen decreased with
practice, both for evaluative tasks (M = 0.33, 95% CI = 0.18, 0.48, vs. M = 0.22, 95% CI = 0.07,
0.37, pre-training vs. post-training run, p < .01) and non-evaluative tasks (M = 0.35, 95% CI =
0.20, 0.49, vs. M = 0.20, 95% CI = 0.05, 0.35, pre-training vs. post-training run, p < .001).
Nucleus accumbens. There was a significant main effect of run on the left nucleus
accumbens area (located around −4, 6, −2; Lieberman et al., 2004), F (1, 1322) = 54.61, p <
.001. Specifically, the activation of the nucleus accumbens was higher in the post-training run
than in the pre-training run, for both evaluative tasks (M = 0.30, 95% CI = 0.12, 0.47, vs. M =
−0.11, 95% CI = −0.28, 0.07, post-training vs. pre-training run, p < .001) and non-evaluative
tasks (M = 0.34, 95% CI = 0.17, 0.52, vs. M = 0.01, 95% CI = −0.17, 0.19, post-training vs. pre-
training run, p < .001). There was no difference in nucleus accumbens activation between
different types of task within either the pre-training or the post-training run, ns.
Furthermore, we found a significant interaction between task and valence in the left
nucleus accumbens, F (1, 1562) = 4.08, p < .05. Specifically, when tasks were evaluative, the
average BOLD signal change in the nucleus accumbens was 0.11(95% CI = −0.07, 0.29) for
pleasant images and 0.06 (95% CI = −0.11, 0.24) for unpleasant images, ns. In contrast, when
tasks were non-evaluative, the average BOLD signal change was higher for unpleasant images
(M = 0.26, 95% CI = 0.08, 0.44) than for pleasant images (M = 0.11, 95% CI = −0.07, 0.29), p <
.05. No other main effects or interactions were significant, ps > .10.
Cerebellum. There was a main effect of run on the activation of the right cerebellum area
(located around 31, −65, −18; Willingham et al., 2002), F (1, 1217) = 15.01, p < .001. That is,
the cerebellum was more active in the post-training run (M = 1.54, 95% CI = 1.30, 1.79) than
was in the pre-training run (M = 1.29, 95% CI = 1.05, 1.54), p < .001. There was also a
61
significant interaction between run and task, F (1, 1499) = 4.52, p < .05. Specifically, the
cerebellum was more active for evaluative tasks in the post-training run (M = 1.59, 95% CI =
1.35, 1.85) than in the pre-training run (M = 1.20, 95% CI = 0.93, 1.45), p < .001. In contrast,
there was no between-run difference in the cerebellum activation for non-evaluative tasks, M =
1.39 (95% CI = 1.13, 1.66) vs. M = 1.50 (95% CI = 1.24, 1.76), pre-training vs. post-training, ns.
In addition, during the pre-training run, the cerebellum was more active for non-evaluative tasks
(M = 1.39) than for evaluative tasks (M = 1.20), p < .05. However, the activation of the
cerebellum in the post-training run did not differ across non-evaluative (M = 1.50) and evaluative
tasks (M = 1.59), ns. No other main effects or interactions were found, ns.
Superior parietal lobe. We found a significant main effect of run on the precuneus area
(BA 7; located around 12, −67, 50; Willingham et al., 2002), F (1, 1185) = 12.37, p < .001. In
general, the right BA 7 was more active after the training run (M = 0.42, 95% CI = 0.28, 0.55)
than before the training run (M = 0.28, 95% CI = 0.15, 0.41). Moreover, there was a significant
interaction between run and task, F (1, 1493) = 4.32, p < .05. Specifically, the precuneus
activation for evaluative tasks increased significantly in the post-training run (M = 0.44, 95% CI
= 0.29, 0.58) compared to the activation in the pre-training run (M = 0.22, 95% CI = 0.08, 0.36),
p < .001. In contrast, the activation in the precuneus did not change for non-evaluative tasks (M
= 0.34, 95% CI = 0.19, 0.49 vs. M = 0.39, 95% CI = 0.25, 0.54, pre-training vs. post-training run,
ns). In addition, the activity of the precuneus was higher for non-evaluative tasks (vs. evaluative
tasks) in the pre-training run, p < .05, but did not differ for the post-training run, ns. No other
main effects or interactions were found.
Inferior parietal lobe. In addition to the superior part of the parietal lobe, we tested
effects of run, task, and valence on the right inferior parietal lobe (centered on 50, −26, 36;
62

Poldrack et al., 1999). Results showed a marginally significant interaction between run and task
in this region, F (1, 1595) = 3.14, p = .08. Specifically, the right inferior parietal lobe was less
active for evaluative tasks in the post-training run (M = 0.15, 95% CI = 0.04, 0.25) than in the
pre-training run (M = 0.23, 95% CI = 0.12, 0.33), p < .05. However, there was no between-run
difference in the activation of the right inferior parietal lobe for non-evaluative tasks, (M = 0.14,
95% CI = 0.04, 0.25, vs. M = 0.16, 95% CI = 0.06, 0.27; pre-training vs. post-training run, ns).
No other main effects or interactions were found, Fs < 1.
We also found a marginally significant interaction between task type and run for the left
inferior parietal lobe (centered on −34, −46, 56; Mallol et al., 2007), F (1, 1654) = 3.35, p = .07.
However, the pattern of signal change was different from that of the right inferior parietal lobe.
Specifically, the activation at the left inferior parietal region for evaluative tasks increased
significantly from the pre- (M = −0.97, 95% CI = −1.757, −0.185) to the post- (M = 0.62, 95% CI
= −0.20, 1.44) training run, p < .01. In contrast, there was no significant regional activity change
for non-evaluative tasks (M = 0.33, 95% CI = −0.53, 1.20, vs. M = 0.39, 95% CI = −0.43, 1.22;
pre- vs. post- training run, ns).
BA 46. To test effects of training on evaluation in the inferior frontal area, we centered the
BA 46 on −47, 17, 24 (Maccotta & Buckner, 2004). Results showed a significant main effect of
run (pre-training vs. post-training), F (1, 1185) = 26.28, p < .001, indicating that the BA 46
region was more active in the post-training run (M = 0.56, 95% CI = 0.46, 0.66) than in the pre-
training run (M = 0.40, 95% CI = 0.30, 0.50). Moreover, there was an interaction between run
and task, F (1, 1484) = 4.47, p < .05. Specifically, post training increases in the activation in the
left BA 46 were greater for evaluative (M = 0.36, 95% CI = 0.25, 0.47, vs. M = 0.58, 95% CI =
0.47, 0.69; pre-training vs. post-training run, p < .001) than non-evaluative tasks (M = 0.45, 95%
63

CI = 0.34, 0.56, vs. M = 0.54, 95% CI = 0.43, 0.64; pre-training vs. post-training run, p = .05).
Further analysis revealed that, in the pre-training run, non-evaluative tasks (M = 0.45) triggered
higher left BA 46 activation than evaluative tasks (M = 0.36), p < .05, a pattern not present after
the training run for either evaluative or non-evaluative tasks (Ms= 0.58 and 0.54), ns.
In addition, we found a similar BOLD change pattern in the right BA 46 area (centered on
47, 17, 24). After evaluative training, activity in the right BA 46 area increased (M = 0.30, 95%
CI = 0.21, 0.40, vs. M = 0.41, 95% CI = 0.31, 0.50; pre- vs. post- training run), F (1230) = 13.80,
p < .001. Moreover, there was a marginally significant interaction between task and run, F (1,
1498) = 3.59, p = .06. The activity in the right BA 46 increased for evaluative tasks (M = 0.26,
95% CI = 0.16, 0.36 vs. M = 0.42, 95% CI = 0.32, 0.52; pre-training vs. post-training run, p <
.001), but did not change for non-evaluative tasks (M = 0.34, 95% CI = 0.24, 0.44 vs. M = 0.39,
95% CI = 0.29, 0.49; pre-training vs. post-training run, ns). Similar to the left BA 46 region, in
the pre-training run, the right BA 46 region was more active for non-evaluative tasks (M = 0.34)
than for evaluative tasks (M = 0.26), p = .06. However, the post-training run showed no effect of
type of task (M = 0.39 vs. 0.42, non-evaluative vs. evaluative tasks), ns. No effects of valence
(pleasant vs. unpleasant images) were found on either the left or right BA 46 areas.
BOLD signals in the left and right BA 46 areas were combined to represent the activation
change in bilateral BA 46 areas. Results of the mixed model revealed a main effect of run, F (1,
1201) = 26.23, p < .001. That is, the bilateral BA 46 was more active after (M = 0.47, 95% CI =
0.39, 0.55) than before (M = 0.35, 95% CI = 0.27, 0.42) the evaluative training, p < .001. As in
the left and right BA 46, there was an interaction between task and run in the bilateral BA 46, F
(1, 1483) = 5.40, p < .05. Specifically, the post-training activation of the bilateral BA 46
increased for evaluative tasks (M = 0.30, 95% CI = 0.22, 0.39, vs. M = 0.49, 95% CI = 0.41,
64
0.58, pre- vs. post- training run, p < .001), but not for non-evaluative tasks (M = 0.39, 95% CI =
0.30, 0.48, vs. M = 0.45, 95% CI = 0.37, 0.54, pre- vs. post- training run, p > .05).
BA 9. Similarly, we found an interaction of run and task in another inferior frontal area
around 43, 3, 32 (BA 9; located in Maccotta & Buckner, 2004), F (1, 1475) = 4.13, p < .05. After
training, activation in the right BA 9 increased more for evaluative tasks (M = 0.34 vs. 0.58, pre-
vs. post- training run, p < .001), than non-evaluative tasks (M = 0.44 vs. 0.56, pre- vs. post-
training run, p < .01). Also, activation in the left BA 9 (centered on −43, 3, 32) increased after
the training run for both evaluative (M = 0.38 vs. 0.62; pre-training vs. post-training run, p <
.001) and non-evaluative tasks (M = 0.43 vs. 0.60; pre-training vs. post-training run, p < .001).
Similarly to the BA 46, the left and right BA 9 areas were combined to represent the
activation change in bilateral BA 9 areas. Analyses revealed a main effect of run, F (1, 1199) =
56.72, p < .001, indicating more activity after (M = 0.59, 95% CI = 0.50, 0.68) than before (M =
0.39, 95% CI = 0.31, 0.48) the evaluative training, p < .001. Unlike in the left and right BA 9,
however, we found a marginal interaction between task and run in the bilateral BA 9, F (1, 1472)
= 3.16, p = .08. Specifically, the post-training activation of the bilateral BA 9 increased for
evaluative tasks (M = 0.36, 95% CI = 0.26, 0.45, vs. M = 0.60, 95% CI = 0.50, 0.69, pre- vs.
post- training run, p < .001) to a greater extent than for non-evaluative tasks (M = 0.43, 95% CI =
0.34, 0.53, vs. M = 0.58, 95% CI = 0.48, 0.67, pre- vs. post- training run, p < .001).
Summary. Results in above brain regions previously associated with procedural learning
showed that, when evaluations are proceduralized, activations in the striatal system (i.e., the
caudate nucleus, the caudoventral putamen, and the nucleus accumbens), the cerebellum, the
precuneus, and the inferior frontal cortices, increase. Moreover, as predicted, unlike the
caudoventral putamen, the rostrodorsal putamen activation decreased with evaluation
65
proceduralization. Also, different areas of the inferior parietal lobe showed different patterns of
signal change with evaluation proceduralization. A summary of findings in regions associated
with procedural learning appears in Table 3-7. Maps for brain activity changes for evaluative
tasks in regions linked to procedural learning are included in Figure 3-3.
Regions associated with declarative learning. To test our hypotheses that evaluation
proceduralization is associated with decreased activity in brain regions implicated in declarative
learning, we centered the medial temporal lobe on coordinates −32, −15, −24 (Rose et al., 2004),
the dorsolateral prefrontal cortex on −30, 55, 24 (Klingberg et al., 1997) and 48, 41, 9 (Taylor et
al., 2003), and the ventromedial prefrontal lobe on −22, 30, −16 (Lieberman et al., 2004) (see
Table 3-6 for a list of information for each ROI). These regions were included in the cluster of
declarative learning in the analysis at the cluster level.
Medial temporal lobe (MTL). Analyses revealed a marginally significant main effect of
run on the activation of the left medial temporal lobe area (located around −39, −15, −24; Rose et
al., 2004), F (1, 1458) = 3.08, p = .08. That is, the MTL area was less active during the post-
training run (M = −0.07, 95% CI = −0.17, 0.02) than the pre-training run (M = 0.05, 95% CI =
−0.05, 0.14). More interestingly, the decreased activation was present for evaluative tasks (M =
0.09, 95% CI = 0, 0.18, vs. M = −0.12, 95% CI = −0.21, −0.03; pre- vs. post- training run, p =
.002), but not for non-evaluative tasks (M = 0.07, 95% CI = −0.07, 0.21, vs. M = 0.01, 95% CI =
−0.12, 0.15; pre- vs. post- training run, ns), p > .10. Thus, in the pre-training run, the MTL was
equally active for evaluative (M = 0.09) and non-evaluative tasks (M = 0.07), ns. In contrast, in
the post-training run, evaluative tasks (M = −0.12) triggered lower activation in the MTL than
non-evaluative tasks (M = 0.01), p < .05. No effects of valence were found.
66
Dorsolateral prefrontal cortex (dlPFC). We found a main effect of task (evaluative vs.
non-evaluative tasks) on the dlPFC (located around −30, 55, 24; Klingberg et al., 1997), F (1,
1676) = 6.59, p = .01. The activation of dlPFC was higher for evaluative tasks (M = 0.37, 95%
CI = −0.01, 0.75) than for non-evaluative tasks (M = 0.12, 95% CI = −0.27, 0.50). In addition,
the interaction between task and run reached significance, F (1, 1673) = 3.77, p = .05.
Specifically, the dlPFC activation for evaluative tasks decreased significantly from the pre- (M =
0.55, 95% CI = 0.15, 0.95) to the post- training run (M = 0.20, 95% CI = −0.21, 0.60), p = .01.
However, the activation at the dlPFC for non-evaluative tasks did not change (M = 0.09, 95% CI
= −0.32, 0.50, vs. M = 0.14, 95% CI = −0.27, 0.54, ns, pre- vs. post- training run).
Furthermore, we found a main effect of run on the right dlPFC area (centered on 48, 41, 9;
Taylor et al., 2003), F (1, 1312) = 8.80, p < .01, indicating lower activation in the post-training
(M = 0.01, 95% CI = −0.06, 0.07) than in the pre-training (M = 0.15, 95% CI = 0.08, 0.21) run.
Moreover, this decreased activation was present for evaluative tasks (M = 0.17, 95% CI = 0.08,
0.26, vs. M = −0.01, 95% CI = −0.10, 0.08; pre- vs. post- training run, p < .01), but not for non-
evaluative tasks (M = 0.13, 95% CI = 0.03, 0.23, vs. M = 0.02, 95% CI = −0.07, 0.12; pre- vs.
post- training run, ns), p > .10. No other main effects or interactions were found, Fs < 1.
Because the findings in the left and right dlPFC areas are similar, the signal changes in
these two areas were combined to represent the activation change in the dlPFC region. Results
revealed a main effect of run, F (1, 1581) = 6.43, p = .01. That is, the dlPFC activation was lower
in the post-training run (M = 0.10, 95% CI = −0.15, 0.34) than the pre-training run (M = 0.24,
95% CI = −0.01, 0.48), p = .01. There was also a main effect of task on this region, F (1, 1635) =
5.51, p < .05. That is, across the runs, evaluative tasks (M = 0.23, 95% CI = −0.01, 0.47)
triggered higher activation in the dlPFC than did non-evaluative tasks (M = 0.10, 95% CI =
67

−0.14, 0.34). Moreover, we found an interaction between task and run, F (1, 1630) = 4.68, p <
.05. Specifically, the activation in the dlPFC for evaluative tasks decreased significantly (M =
0.37, 95% CI = 0.11, 0.62, vs. M = 0.10, 95% CI = −0.15, 0.35, pre-training vs. post-training
run), p < .001. In contrast, the dlPFC activation for non-evaluative tasks did not change (M =
0.11, 95% CI = −0.15, 0.36, vs. M = 0.09, 95% CI = −0.16, 0.34, pre-training vs. post-training
run), ns.
Ventromedial prefrontal cortex (vmPFC). There was a main effect of task on the left
vmPFC area (located around −22, 30, −16; Lieberman et al., 2004), F (1, 1656) = 7.32, p < .01.
That is, the left vmPFC was more active for evaluative (M = 0.09, 95% CI = −0.09, 0.27) than
for non-evaluative (M = −0.27, 95% CI = −0.45, −0.08) tasks. In addition, there was an
interaction between run and task, F (1, 1660) = 4.88, p < .05. Specifically, the activation in the
vmPFC for evaluative tasks decreased from the pre- (M = 0.32, 95% CI = 0.08, 0.57) to the post-
training run (M = −0.14, 95% CI = −0.40, 0.12), p = .01, whereas the activation for non-
evaluative tasks did not change (M = −0.33, 95% CI = −0.60, −0.06, vs. M = −0.21, 95% CI =
−0.46, 0.05, pre-training vs. post-training, ns). In addition, when looking at the activation pattern
within each run, we found that before the evaluation training run, the left vmPFC was more
active for evaluative (M = 0.32) than non-evaluative tasks (M = −0.33) tasks, p < .001. However,
there was no between-task difference after the training run (M = −0.14 vs. −0.21, evaluative vs.
non-evaluative tasks), ns. No other main effects or interactions were found, Fs < 1.
Summary. The above results in regions previously associated with declarative learning
indicate that evaluation proceduralization reduces brain activities in these regions. Specifically,
when evaluations were proceduralized, brain activities in the medial temporal lobe, the
dorsolateral prefrontal cortex, and the ventromedial prefrontal cortex decreased to or
68
significantly below the baseline activation. A summary of findings in regions associated with
declarative learning appears in Table 3-8. Maps for brain activity changes for evaluative tasks in
regions linked to declarative learning are included in Figure 3-3.
Findings in Regions Associated with Evaluation
To test the effects of practice with evaluations in regions associated with evaluative
processing, we obtained coordinates of ROIs from different sources. First, the bilateral amygdala
was located using a computer-generated image based on the Talarirach-defined coordinates
(Norris et al., 2004). Specifically, regions capturing the right and left amygdala ROIs extended
from ±33 (left) to ±12 (right) in the x-plane; from 2 (posterior) to −12 (anterior) in the y-plane;
and from −37 (inferior) to −7 (superior) in the z-plane. Moreover, several regions associated with
evaluative processing of images were taken directly from previous research. That is, voxels
within 5mm of the temporal pole (BA 38; 42, 8, −30) and the frontal operculum (-46, 14, 6) were
used to define the regions of interest (Lane et al., 1997). In addition, we located the anterior
cingulate cortex around −4, 24, 32 (Cunningham et al., 2004), the insula around −30, 23, 7
(located in an independent study, N = 8), and the orbito-frontal cortex around 45, 35, −4 (BA47;
Maccotta & Buckner, 2004) (see Table 3-6 for a list of coordinates of ROIs related to
evaluation). We expected that evaluation proceduralization would either increase or decrease
activities in these evaluation-related brain regions. Moreover, evaluation proceduralization
should produce comparable changes in regions associated with both automatic and controlled
evaluation. Regions previously linked to automatic (controlled) evaluation were included in the
cluster of automatic (controlled) evaluation in the cluster analysis of regional change with
evaluation proceduralization.
Amygdala. We found a significant between-run difference in the activation of the left
amygdala area, F (1, 1330) = 9.82, p = .002. Specifically, the left amygdala was more active
69
during the post-training run (M = 0.32, 95% CI = 0.21, 0.43) than the pre-training run (M = 0.22,
95% CI = 0.11, 0.34). This increased activation of the left amygdala was present for both
evaluative (M = 0.22, 95% CI = 0.10, 0.34, vs. M = 0.30, 95% CI = 0.18, 0.42; pre- vs. post-
training run, p = .09) and non-evaluative (M = 0.23, 95% CI = 0.11, 0.35, vs. M = 0.35, 95% CI
= 0.23, 0.47; pre- vs. post- training run, p < .01) tasks.
Moreover, we found a significant main effect of valence in the activation of the left
amygdala, F (1, 1577) = 4.27, p < .05. That is, the left amygdala had the tendency to be more
active for pleasant images (M = 0.31, 95% CI = 0.19, 0.42) than unpleasant images (M = 0.25,
95% CI = 0.13, 0.36), F (1, 1579) = 3.29, p = .07. Interestingly, there was a marginal interaction
between run and valence, F (1, 1553) = 3.01, p = .08. After the training run, the activation of the
left amygdala for pleasant images increased (M = 0.23, 95% CI = 0.11, 0.35, vs. M = 0.38, 95%
CI = 0.26, 0.51, p < .001), whereas the activation for unpleasant images did not change (M =
0.22, 95% CI = 0.11, 0.34, vs. M = 0.27, 95% CI = 0.15, 0.39, ns). In addition, in the pre-training
run, there was no difference in the activity of the left amygdala for pleasant (M = 0.23) and
unpleasant images (M = 0.22), ns. However, in the post-training run, the amygdala was
significantly more active for pleasant (M = 0.38) than for unpleasant images (M = 0.27), p < .05.
Thus, we can conclude that, over time, the more emotional images participants viewed, the more
the left amygdala was active, regardless of the explicit task participants performed.
In addition, consistent with previous findings (e.g., Cunningham et al., 2003), the left
amygdala was equally significantly active (vs. null trials) for both types of task in both the pre-
training run (M = 0.22 vs. 0.23, evaluative vs. non-evaluative tasks, ns) and the post-training run
(M = 0.30 vs. 0.35; evaluative vs. non-evaluative tasks, ns). Active amygdala function in
70
response to emotional images regardless of explicit task instructions and run supports the idea
that the amygdala is involved in the automatic aspect of evaluation.
Interestingly, the pattern of activity change in the left amygdala was not present in the right
amygdala. Specifically, although there was a significant main effect of run on the right
amygdala, F (1, 1386) = 8.15, p < .01, this effect was present only for non-evaluative tasks and
comprised an increase in activity (M = 0.24, 95% CI = 0.11, 0.38, vs. M = 0.39, 95% CI = 0.25,
0.52, pre- vs. post- training run, p < .01). In contrast, for evaluative tasks, run did not influence
activity of the right amygdala (M = 0.27, 95% CI = 0.13, 0.40, vs. M = 0.32, 95% CI = 0.18,
0.45, pre- vs. post- training run, ns). No other main effects or interactions were found, Fs < 1.
Insula. Like the left amygdala area, the left insula (BA 13; −30, 23, 7) was more active
during the post-training than the pre-training run, Mdiff = 1.08, F (1, 1655) = 109.55, p < .001.
This pattern was found for both evaluative (M = 0.34, 95% CI = −0.52, 1.19, vs. M = 1.38, 95%
CI = 0.53, 2.24; pre-training vs. post-training, p < .001) and non-evaluative tasks (M = 0.30, 95%
CI = −0.55, 1.16, vs. M = 1.42, 95% CI = 0.57, 2.28; pre-training vs. post-training, p < .001).
Moreover, in the pre-training run, the insula was not active (vs. null trials) for either evaluative
or non-evaluative tasks. Furthermore, the insula was equally active for evaluative and non-
evaluative tasks in the pre-training as well as the post-training run, both ts < 1. Therefore, in the
current study, the insula was apparently involved in automatic evaluation, as its activation was
not influenced by task instructions in either the pre-training or the post-training run.
Orbito-frontal cortex (OFC). After the evaluative training, the activation in the right
lateral orbito-frontal region (BA 47; located around 45, 35, −4; Maccotta & Buckner, 2004)
increased significantly, Mdiff = 0.53, F (1, 1655) = 40.95, p < .001. The increased activation was
present for both evaluative tasks (M = −0.06, 95% CI = −0.45, 0.33, vs. M = 0.43, 95% CI =
71

0.04, 0.82, pre- vs. post- training, p < .001) and non-evaluative tasks (M = −0.07, 95% CI =
−0.46, 0.33, vs. M = 0.49, 95% CI = 0.10, 0.89, pre- vs. post- training, p < .001). Moreover, the
right OFC region was equally active for evaluative and non-evaluative tasks in the pre-training
(pairwise comparison, ns) and the post-training run (pairwise comparison, ns). No other main
effects or interactions were found, Fs < 1. As the pattern of activation change in the OFC was
identical to the ones in the amygdala and the insula, we can conclude that, as expected, the OFC
was involved in automatic evaluation.
Anterior cingulate cortex. There was a marginal interaction between run and task in the
left dorsal ACC area (BA 32; centered on −4, 24, 32; Cunningham et al., 2004), F (1, 1491) =
3.53, p = .06. Specifically, for evaluative tasks, the activity of the ACC was higher in the post-
training run (M = 0.09, 95% CI = 0.02, 0.16) than in the pre-training run (M = 0.02, 95% CI =
−0.05, 0.09), p = .01. However, for non-evaluative tasks, the ACC activation did not change
across runs (M = 0.06, 95% CI = −0.01, 0.13, vs. M = 0.07, 95% CI = 0, 0.14; pre- vs. post-
training run respectively, ns). In addition, there were no between-task differences in the ACC
activation in either the pre-training run (M = 0.02 vs. 0.06, for evaluative and non-evaluative
tasks, ns) or the post- training run (M = 0.09 vs. 0.07, for evaluative and non-evaluative tasks,
ns). No other effects were found in this region, Fs < 1. In sum, as predicted, the activation of the
ACC only increased for the trained evaluative tasks, not for the untrained non-evaluative tasks.
Frontal operculum. We centered the frontal operculum area on −46, 14, 6 (Lane et al.,
1997), and found an increased activation in the BOLD signal across runs. That is, this region was
more active in the post-training run (M = 0.43, 95% CI = 0.31, 0.54) than in the pre-training run
(M = 0.34, 95% CI = 0.23, 0.45), F (1, 1271) = 4.33, p < .05. The increased activation in the
post-training (vs. pre-training) run was present for evaluative tasks (M = 0.42, 95% CI = 0.30,
72
0.55, vs. M = 0.28, 95% CI = 0.16, 0.41; p < .05), but not for non-evaluative tasks (M = 0.43,
95% CI = 0.30, 0.56, vs. M = 0.39, 95% CI = 0.26, 0.52; ns), p > .15. Further analysis indicated
that, the left frontal operculum was marginally more active for non-evaluative tasks (M = 0.39,
95% CI = 0.26, 0.52) than for evaluative tasks (M = 0.28, 95% CI = 0.16, 0.41) in the pre-
training run, p = .08, with no task differences (M = 0.43 vs. 0.43, evaluative vs. non-evaluative
tasks) in the post-training run, ns.
In addition, there was a significant interaction between task and valence in the left frontal
operculum area, F (1, 1554) = 5.94, p < .05. Specifically, during evaluative tasks, the average
BOLD signal of the left frontal operculum area was 0.29 (95% CI = 0.16, 0.41) for unpleasant
images and 0.41 (95% CI = 0.28, 0.53) for pleasant images, p = .05. However, when tasks were
non-evaluative, there was no difference between unpleasant (M = 0.46, 95% CI = 0.33, 0.59) and
pleasant (M = 0.36, 95% CI = 0.23, 0.49) images, ns.
Temporal pole. The right temporal pole (centered on 42, 8, −30; Lane et al., 1997) was
more active during the post-training run (M = 0.28, 95% CI = 0.17, 0.39) than during the pre-
training run (M = 0.16, 95% CI = 0.05, 0.27), F (1, 1296) = 13.47, p < .001. Moreover, there was
an interaction between run and task in this area, F (1, 1523) = 4.28, p < .05. Specifically, the
activation in the temporal pole during evaluative tasks was higher in the post-training run (M =
0.31, 95% CI = 0.19, 0.43) than in the pre-training run (M = 0.12, 95% CI = 0.01, 0.24), p <
.001. However, there was no between-run difference in the temporal pole activation during non-
evaluative tasks (M = 0.20, 95% CI = 0.08, 0.32, vs. M = 0.25, 95% CI = 0.13, 0.37; pre-training
and post-training run respectively, ns). This difference in temporal pole activation change for
evaluative and non-evaluative tasks confirmed that the temporal pole is involved in controlled
73

evaluation. Again, there was no between-task difference in the right temporal pole activation in
either the pre- or the post-training runs, ns.
Summary. Although activities in the evaluative processing ROIs all increased after
evaluation training, there are several differences in the change patterns. For example, regions
previously associated with automatic evaluation (i.e., the amygdala, the OFC, and the insula)
were more active in the post-training (vs. the pre-training) run for both evaluative and non-
evaluative tasks. In contrast, after the evaluation training, regions previously associated with
controlled evaluation (i.e., the anterior cingulate cortex, the temporal pole, and the frontal
operculum) were more active for evaluative tasks, but not for non-evaluative tasks. Nonetheless,
evaluation training enhanced the activation during evaluative tasks in various evaluative
processing regions. A summary of findings in regions associated with evaluation appears in
Table 3-9. Maps for brain activity changes for evaluative tasks in regions linked to evaluation are
included in Figure 3-4.
Findings in Visual Areas
For visual processing regions, we focused on both early and late visual regions (see Table
3-6 for a summary of ROI coordinates). Specifically, the early visual region was selected around
−17, −73, −17 (calcarine, Maccotta & Buckner, 2004). Moreover, in current study, late visual
regions included the posterior fusiform around −36, −73, −13 (Maccotta & Buckner, 2004), the
superior occipital lobe (32, −74, 29; Garavan et al., 1999), and the parietal occipital lobe (44,
−70, 20; Lane et al., 1997). Proceduralization was expected to produce no change in activation in
the early visual region but increases in the late visual regions. These regions were included in the
cluster of visual processing in the cluster analysis of brain activity change.
74
Calcarine. As predicted, we did not find any effects of evaluative skill training on the
calcarine area (centered on −17, −93, −17; Maccotta & Buckner, 2004), F < 1. In addition, this
region showed no effects of type of tasks, or image valence, Fs < 1.
Posterior fusiform. There was a main effect of run in the late visual region near the left
posterior fusiform gyrus (BA 18/19; −36, −73, −13; Maccotta & Buckner, 2004), F (1, 1227) =
13.70, p < .001. The means corresponding to this main effect indicated greater activation in the
left posterior fusiform gyrus in the post-training run (M = 1.15, 95% CI = 1.01, 1.30) than in the
pre-training run (M = 0.98, 95% CI = 0.84, 1.12), p < .001. There was also a marginal interaction
between run and task in this area, F (1, 1486) = 3.05, p = .08. For evaluative tasks, the left
posterior fusiform was more active after than before training (M = 0.90, 95% CI = 0.74, 1.05, vs.
M = 1.16, 95% CI = 1.00, 1.32; pre-training vs. post-training run), p < .01. However, there was
no between-run difference in activation for non-evaluative tasks (M = 1.06, 95% CI = 0.90, 1.22,
vs. M = 1.15, 95% CI = 0.99, 1.30; pre-training vs. post-training run, ns). No effects of image
valence were found, F < 1.
Parietal-occipital cortex. We also tested whether training in evaluation changed the brain
activity at the parietal-occipital cortex (BA 39), BOLD signals within 5mm around 44, −70, 20
(Lane et al., 1997). Results showed a significant main effect of run on this late visual area, F (1,
1268) = 64.31, p < .001. That is, the parietal-occipital cortex was more active in the post-training
run (M = 0.46, 95% CI = 0.40, 0.57) than in the pre-training run (M = 0.18, 95% CI = 0.07,
0.28). After training in evaluation, the activation in the right parietal-occipital region increased
for evaluative tasks (M = 0.15, 95% CI = 0.04, 0.27, vs. M = 0.47, 95% CI = 0.35, 0.58, pre-
training vs. post-training run, pairwise comparison, p < .001), as well as for non-evaluative tasks
75

(M = 0.20, 95% CI = 0.09, 0.32, vs. M = 0.46, 95% CI = 0.34, 0.57, pre-training vs. post-training
run, pairwise comparison, p < .001). No other effects were found, Fs < 1.
Superior occipital gyrus. For the brain activity in the superior occipital gyrus (located
around 32, −74, 29; Garavan et al., 1999), analyses showed a significant main effect of run, F (1,
1142) = 25.44, p < .001, and a significant interaction between task and run, F (1, 1479) = 5.41, p
= .02. Generally, the right superior occipital gyrus was more active during the post-training run
(M = 0.54, 95% CI = 0.43, 0.65) than the pre-training run (M = 0.37, 95% CI = 0.26, 0.48), p <
.001. Moreover, post training activation in this area increased for evaluative tasks (M = 0.31,
95% CI = 0.19, 0.43, vs. M = 0.57, 95% CI = 0.45, 0.69; pre-training vs. post-training, p < .001),
but not for non-evaluative tasks (M = 0.43, 95% CI = 0.30, 0.55 vs. M = 0.52, 95% CI = 0.39,
0.64, pre-training vs. post-training run, p > .05).
Summary. In sum, training in evaluative tasks did not have an effect on early visual
regions such as the calcarine. However, late visual regions, such as the posterior fusiform and the
superior occipital lobes showed greater activity increases for evaluative tasks than non-
evaluative tasks. In addition, there was increased activation in the parietal occipital gyrus for
both types of tasks. A summary of findings in the visual areas appears in Table 3-10. Maps for
brain activity changes in visual processing regions for evaluative tasks are included in Figure 3-
5.
Findings in Motor Areas
Motor cortex. To examine whether training in evaluative skills influenced the activity in
motor areas, the hand response execution region (BA 4) in the left motor cortex was selected
around −37, −25, 50 (Maccotta & Buckner, 2004). Results revealed a significant main effect of
training on the left motor cortex. That is, overall, activity in the left motor cortex decreased in the
post-training run (M = 0.50, 95% CI = 0.41, 0.60) relative to the pre-training run (M = 0.61, 95%
76

CI = 0.51, 0.70), F (1, 1156) = 8.15, p < .01. Specifically, this decrease was found in non-
evaluative tasks (M = 0.65, 95% CI = 0.54, 0.77, vs. M = 0.50, 95% CI = 0.39, 0.60, pre-training
vs. post-training, pairwise comparison, p < .01), but not in evaluative tasks (M = 0.56, 95% CI =
0.46, 0.67, vs. M = 0.51, 95% CI = 0.40, 0.62; pre-training vs. post-training, pairwise
comparison, ns), F (1, 1503) = 1.94, p > .15. Moreover, before the training run, non-evaluative
tasks (M = 0.65) tended to trigger higher activation in the motor cortex than did evaluative tasks
(M = 0.56), p < .10. In contrast, there was no between-task difference in the motor cortex
activation after the training run (M = 0.51 vs. 0.50, evaluative vs. non-evaluative tasks, ns).
More interestingly, there was a 3-way interaction between run, task, and valence in the left
motor cortex, F (1, 1543) = 5.07, p < .05. Specifically, after training, activity in the left motor
cortex decreased significantly for pleasant images (M = 0.61 vs. 0.44; pre- vs. post- training run,
p < .05), but did not change for unpleasant images (M = 0.51 vs. 0.57; pre- vs. post- training run,
ns), F (1, 730) = 3.95, p < .05. However, the pattern of brain activity in the left motor cortex was
different when the tasks were non-evaluative. Compared to the activation during the pre-training
run, the left motor cortex was less active in the post-training run for both pleasant (M = 0.65 vs.
0.49; pre- vs. post- training run, p = .05) and unpleasant images (M = 0.66 vs. 0.50; pre- vs. post-
training run, p < .05).
Therefore, as predicted, overall, evaluation proceduralization had no effects on the
activation in the motor cortex (BA 4, the hand region) for evaluative tasks. However, we
observed a decreased activation in the BA 4 region for evaluative tasks of pleasant images (vs.
unpleasant images). A summary of these findings appears in Table 3-10. Maps for brain activity
changes in the motor cortex for evaluative tasks are included in Figure 3-5.
77
Correlations between Behavioral Performance and Brain Activities in Regions Associated with Learning and Evaluation
ROIs activation change. It was also important to show that BOLD signal changes
correlated with our behavioral measures. For each ROI, we computed a regional-activity-change
score by taking the difference between BOLD signals for evaluative tasks in the post-training
and the pre-training run. Thus, a positive regional activation change indicates higher regional
activity in the post-training (vs. pre-training) run, whereas a negative regional change indicates
lower regional activity after training in evaluative skills. Then, we conducted correlational
analyses of activity changes in each ROI and task response time (see Appendix B).
Response time and ROIs. To examine association between brain activity and our
behavioral data, we grouped regions with significant training effects for evaluative tasks. The
cluster of regions previously linked to procedural learning included the striatal regions (i.e., the
nucleus accumbens, the bilateral caudate nucleus, and the putamen areas), bilateral BA 46,
bilateral BA 9, the cerebellum, and the precuneus (α = 0.72), whereas the cluster of regions
previously linked to declarative learning included the medial temporal lobe, the dorsolateral
prefrontal cortices, and the ventromedial prefrontal cortex (α = 0.69). Furthermore, the cluster of
regions involved in automatic evaluation included the amygdala, the orbito-frontal cortex, and
the insula (α = 0.70), whereas the cluster of regions involved in controlled evaluation consisted
of the temporal pole, the anterior cingulate cortex, and the frontal operculum (α = 0.86). Last, a
cluster of regions previously associated with late visual processing included the posterior
fusiform, the superior occipital gyrus, and the parietal-occipital cortex (α = 0.82).
Using these clusters, we next examined the effect of evaluation training on brain activation
changes for evaluative tasks by using the earlier mixed model of run (pre-training vs. post-
training) with time linear trend and quadratic trend as covariates. Results showed significant
78
main effects of run in each cluster, ps < .004 (Bonferroni correction was applied, the α level was
set at .01 as there are five clusters in this analysis). Specifically, activations for evaluative tasks
increased in the procedural-learning cluster (M = 0.32, 95% CI = 0.22, 0.41, vs. M = 0.56, 95%
CI = 0.46, 0.66; pre-training vs. post-training run), F (1, 582) = 54.02, p < .001, the automatic-
evaluation cluster (M = 0.14, 95% CI = −0.25, 0.54, vs. M = 0.68, 95% CI = 0.28, 1.08; pre-
training vs. post-training run), F (1, 821) = 47.02, p < .001, the controlled-evaluation cluster (M
= 0.20, 95% CI = 0.10, 0.29, vs. M = 0.31, 95% CI = 0.21, 0.41; pre-training vs. post-training
run), F (1, 605) = 8.44, p < .004, and the late-visual cluster (M = 0.44, 95% CI = 0.35, 0.54, vs.
M = 0.73, 95% CI = 0.63, 0.82; pre-training vs. post-training run, p < .001). At the same time,
the activation in the declarative learning cluster decreased to baseline following training (M =
0.24, 95% CI = 0.07, 0.40, vs. M = −0.07, 95% CI = −0.23, 0.10; pre-training vs. post-training
run), F (1, 791) = 14.02, p < .001. Practice-related activation changes for evaluative tasks of each
cluster are shown in Figure 3-2.
Analysis of these regional clusters indicated that the change in activation of regions of
controlled evaluation from the pre- to the post- training run positively correlated with the change
in the procedural learning regions (r = 0.78, p < .001), the late visual regions (r = 0.57, p < .05),
and the motor cortex (r = 0.60, p < .05). In addition to the activation changes in controlled
evaluation regions, activation change in the motor cortex also correlated with the changes in late
visual regions (r = 0.64, p < .05) and procedural learning regions (r = 0.58, p < .05). The
activation change in procedural learning regions was also marginally correlated with the change
in late visual regions, r = 0.48, p < .10. No other significant correlations between cluster
activation changes (pre- vs. post- training run) were found, ns. Correlation coefficients between
activation changes in each cluster appear in Table 3-11.
79
We next examined the relation between effects of training on regional activity and
behavioral response time by regressing behavioral practice effects for evaluative tasks on
activation changes for evaluative tasks. Behavioral practice effects were computed by subtracting
response time for evaluative tasks in the post-training run from the response time for evaluative
tasks in the pre-training run. Therefore, larger differences in response time indicate faster
response time in the post-training (vs. pre-training) run and are an indication of
proceduralization. Results of the regression analysis revealed that this score correlated positively
with activation change in the automatic evaluation regions (Beta = 0.43, t = 4.83, p < .01), the
controlled evaluation regions (Beta = 0.52, t = 3.87, p < .01), and the declarative learning regions
(Beta = 0.61, t = 6.66, p < .001). Moreover, this score correlated negatively with activation
change in the procedural learning regions (Beta = −0.49, t = −3.58, p < .05), the motor cortex
(BA 4, Beta = −0.32, t = −2.81, p < .05), and the early visual region (the calcarine, Beta = −0.35,
t = −3.03, p < .05). No significant relation between the change in response time and the change
in brain activation at the late visual regions was found, Beta = 0.21, t = 1.76, p > .10. The
regression model was significant, R square = 0.96, F (7, 13) = 22.22, p < .001.
Omit rate and ROIs. Similar procedures were applied to examine the relation between
changes in omit rate across runs and changes in brain activity. Specifically, the change in omit
rate was computed by subtracting the omit rate in the post-training run from the one in the pre-
training run. Therefore, larger differences in omit rate indicate improved behavioral
performance. Then, we correlated changes in brain activity and changes in omit rate (see
Appendix B). The change in omit rate from the pre- to the post- training run was positively
correlated with the change in BA 4 activation, r = 0.51, p = .07. That is, increased activation in
80
BA 4 across runs contributed to greater omit rate reduction for evaluative tasks. No other
significant relations were found.
Discussion
Experiment 2 was conducted to explore the underlying brain functional processes of
evaluation proceduralization observed in Experiment 1. As in Experiment 1, at the behavioral
level, participants responded to evaluative tasks more quickly after than before receiving
training. In contrast, with no training in non-evaluative tasks, the response times to non-
evaluative tasks did not change over runs. Moreover, the omit rate decreased for both evaluative
and non-evaluative tasks after the training in evaluative skills.
In addition to the response times to tasks, we observed changes in the pattern of how
participants responded to different types of task (evaluative vs. frequency-related tasks).
Specifically, unpleasant images presented in the post-training run were rated as less frequently
seen on TV than the unpleasant images presented in the pre-training run. Moreover, the
pleasantness ratings were more polarized after than before the evaluation training run. That is, in
the post-training run, pleasant images were rated as more pleasant and unpleasant images as
more unpleasant than comparable images in the pre-training run. This finding is consistent with
previous research on attitude polarization in which repeated attitude expressions lead to attitude
extremity (Brauer, Judd, & Gliner, 1995). Importantly, the current research indicated that the
increased attitude extremity can also occur with practiced expressions of evaluations of different
targets. Furthermore, a distribution test indicated that practice with evaluative judgments
polarized pleasantness ratings to images but not the pattern of selection of response buttons
during evaluative tasks. In contrast, the pattern of response selection for untrained non-evaluative
tasks did change.
81
At the brain level, evaluation proceduralization was reflected by increased activation in the
striatal system and other procedural learning regions (i.e., the cerebellum, the precuneus, and
inferior frontal cortices) during evaluative tasks after evaluation training. The increased regional
activity in striatal areas (e.g., the bilateral caudate nucleus, the putamen, and the nucleus
accumbens) suggests that the striatal system is involved in proceduralization not only of
cognitive tasks, but also of evaluative tasks. Within the striatal system, we also detected specific
functions of sub-putamen areas in evaluation proceduralization. That is, consistent with previous
findings (Lehericy et al., 2005), post training activation increased in the caudoventral putamen
but decreased in the rostrodorsal putamen. Also, there were significant decreases in activation in
several regions previously linked to declarative learning, such as the medial temporal pole and
the prefrontal cortices (e.g., the dorsolateral prefrontal cortex, and the ventromedial prefrontal
cortex).
The finding that activity in the medial temporal lobe declined as activity in fronto-striatal
regions increased is consistent with Seger and Cincotta’s (2006) research on explicit rule
learning. In addition, the increased activation in the inferior frontal regions along with decreased
activation in the prefrontal regions suggests the facilitation of frontally mediated processes in
evaluation proceduralization. Moreover, the findings in the posterior parietal lobe offer further
evidence indicating that the superior parietal lobe is involved in procedural learning (see also
Nadel et al., 2007). However, the findings in the inferior parietal lobe were not congruent. The
right inferior parietal became less active with practice (see also Klingberg et al., 1997), whereas
the left inferior parietal became more active with practice. Moreover, changes in these two
inferior parietal areas did not correlate with any other regional activation change. More research
82

needs to be conducted to address directly the role of inferior parietal lobe in evaluative
procedural learning.
In conclusion, the current research demonstrated that proceduralization of evaluation was
accompanied by decreases in the involvement of the declarative learning regions, along with
increases in the involvement of the procedural learning regions. These changes in turn suggest
that after being proceduralized in the practice run, the evaluation processes were transformed
from declarative memory to procedural memory. Specifically, converging evidence supports the
notion that the functional brain network for implicit learning includes the basal ganglia, the
cerebellum, the superior parietal lobe, and the prefrontal cortices, whereas the network for
explicit learning includes the medial temporal pole and the inferior frontal cortices. Therefore,
our study supports the well-known independence of brain correlates of declarative and
procedural learning (see also Willingham et al., 2002).
Another important finding was that proceduralization affected brain areas related to
evaluation. Specifically, we found significant increases for evaluative tasks in the activation in
evaluative processing regions (i.e., the amygdala, the insula, the OFC, the ACC, the temporal
pole, and the frontal operculum). This finding suggests that practice with evaluative judgments
increases instead of decreases brain activation of task-specific regions (Grossman, Blake, &
Kim, 2004). Among these evaluative processing regions, there are several unique patterns in
each region. First, while evaluative judgments are proceduralized, the activity in the left
amygdala increased whereas in the activity in the right amygdala remained unaltered. This
finding is consistent with previous findings of dissociable function of bilateral amygdala in
emotional memory and the involvement of the left amygdala in emotional memory retrieval
(Sergerire, Lepage, & Armony, 2006). Interestingly, the increased activation of the left amygdala
83

was found for positive but not for negative targets. One might relate this finding to a
developmental view of evaluative-skill learning. For example, Mather and colleagues (2004)
found that viewing positive pictures led to greater amygdala activation than viewing negative
pictures for adults over 70 years but not for adults under 30 years. Therefore, with age/practice,
the amygdala may show decreased reactivity to negative information along with increased
reactivity to positive information. Second, although all the evaluative processing regions were
more active in the post-training than in the pre-training run, their post-training activation levels
differed as a function of task instructions. That is, activations in regions previously associated
with automatic evaluation (i.e., the amygdala, the insula, and the OFC) increased for both
evaluative and non-evaluative tasks. In contrast, activation in regions associated with controlled
evaluation (i.e., the ACC, the temporal pole, and the frontal operculum) only increased for
trained evaluative tasks. Furthermore, the finding of increased amygdala activity and decreased
vmPFC activity when evaluations are proceduralized is consistent with reports of the top-down
inhibitory effect of the vmPFC on the amygdala (Urry et al., 2006).
Moreover, similar to findings from previous research (e.g., Maccotta & Buckner, 2004),
we found no significant training effects of evaluative judgments on the motor cortex (e.g., the
hand response execution region) or the early visual cortex (e.g., the calcarine). Therefore,
practice with evaluative judgments did not alter brain activity in regions associated with basic
motor and visual functions. In contrast, we observed increased activation of late visual regions
(e.g., the superior occipital cortex, the posterior fusiform, and the parietal occipital cortex) for
previously trained evaluative tasks. This finding also supports the hypothesis that practice
increases activation in task-related regions, including late visual areas when the stimuli are
visual.
84
In sum, practice with evaluation produced both increases and decreases in brain activity.
As summarized by Kelly and Garavan (2005), decreased activation during task practice is
usually a result of a reduced neural representation of the stimulus or a more efficient firing of a
more precise functional circuit. In contrast, increased activation during task practice often
indicates recruitment of additional cortical units resulting in increased spatial extent of activation
or a strengthened response within a region. As different regions engaged in evaluative task
performance before and after practice, we can conclude that practice in evaluative judgments
reorganizes functional activations in several brain regions. Specifically, before practice in
evaluation, active regions related to procedural learning, declarative learning, controlled
evaluation, and late visual processing. After practice in evaluation, however, regions associated
with declarative learning were no longer active, whereas regions related to automatic evaluation
became involved.
85

Table 3-1. IAPS picture codes, valence and arousal ratings for images presented in the pre-training run (Experiment 2)
Task Valence set
Code Description Valence rating Arousal rating
Evaluative Negative 5731 Flowers 5.39 (1.58) 2.74 (1.95) 9471 Burnt bull dog 3.16 (1.35) 4.48 (2.02) 9040 Starving child 1.67 (1.07) 5.82 (2.15) 7036 Shipyard 4.88 (1.08) 3.32 (2.04) 1113 Snake 3.81 (1.75) 6.06 (2.12) 9472 Bridge 4.07 (1.34) 4.16 (2.00) 7035 Mug 4.98 (0.96) 2.66 (1.82) 9700 Trash 4.77 (1.24) 3.21 (1.92) 9140 Cow 2.19 (1.37) 5.38 (2.19) 2810 Boy 4.31 (1.65) 4.47 (1.92) 3170 Baby tumor 1.46 (1.01) 7.21 (1.99) 6560 Attack 2.16 (1.41) 6.53 (2.42) 5535 Still life 4.81 (1.52) 4.11 (2.31) 1303 Dog 4.68 (2.11) 5.70 (2.04) 2393 Factory worker 4.87 (1.06) 2.93 (1.88) Positive 4220 Erotic female 6.60 (1.72) 5.18 (2.33) 7430 Candy 7.11 (1.78) 4.72 (2.29) 5811 Flowers 7.23 (1.60) 3.30 (2.33) 8130 Pole vaulter 6.58 (1.34) 5.49 (2.07) 1620 Sprg bok 7.37 (1.56) 3.54 (2.34) 5849 Flowers 6.65 (1.93) 4.89 (2.43) 4000 Artist 4.82 (1.66) 3.97 (2.15) 4003 Erotic female 5.48 (2.05) 5.09 (2.07) 8040 Diver 6.64 (1.56) 5.61 (2.01) 1601 Giraffes 6.86 (1.51) 3.92 (2.07) 7500 Building 5.33 (1.44) 3.26 (2.18) 1670 Cow 5.82 (1.63) 3.33 (1.98) 8330 Winner 6.65 (1.39) 4.06 (2.28) 7620 Jet 5.78 (1.72) 4.92 (2.11) 5220 Nature 7.01 (1.50) 3.91 (2.27) Non-evaluative
Negative 4536 Attractive man 6.01 (1.49) 3.95 (2.30)
9594 Injection 3.76 (1.70) 5.17 (2.17) 9342 Pollution 2.85 (1.41) 4.49 (1.88) 6230 Aimed gun 2.37 (1.57) 7.35 (2.01) 2795 Boy 3.92 (1.77) 4.70 (2.00) 1321 Bear 4.32 (1.87) 6.64 (1.89) 6550 Attack 2.73 (2.38) 7.09 (1.98) 2200 Neutral face 4.79 (1.38) 3.18 (2.17) 6242 Gang 2.69 (1.59) 5.43 (2.36) 9913 Truck 4.38 (1.89) 4.42 (2.14) 7161 Pole 4.98 (1.02) 2.98 (1.99)
86
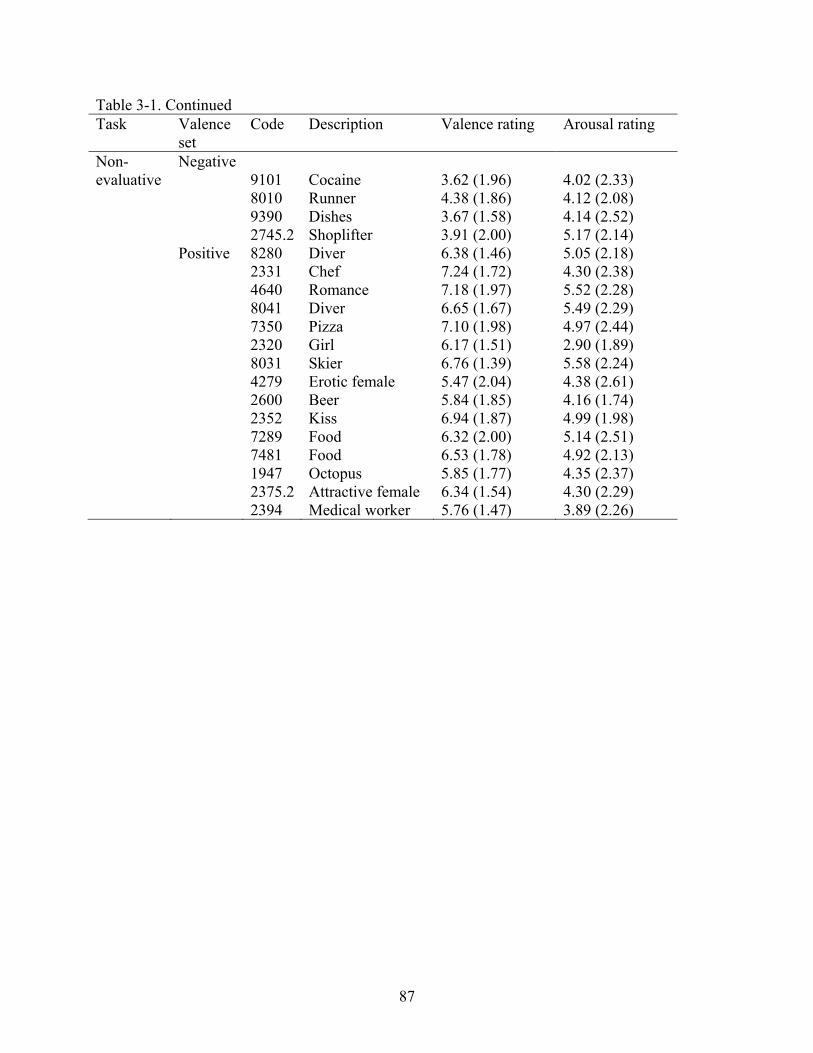
87
Table 3-1. Continued Task Valence
set Code Description Valence rating Arousal rating
Non-evaluative
Negative 9101 Cocaine 3.62 (1.96) 4.02 (2.33)
8010 Runner 4.38 (1.86) 4.12 (2.08) 9390 Dishes 3.67 (1.58) 4.14 (2.52) 2745.2 Shoplifter 3.91 (2.00) 5.17 (2.14) Positive 8280 Diver 6.38 (1.46) 5.05 (2.18) 2331 Chef 7.24 (1.72) 4.30 (2.38) 4640 Romance 7.18 (1.97) 5.52 (2.28) 8041 Diver 6.65 (1.67) 5.49 (2.29) 7350 Pizza 7.10 (1.98) 4.97 (2.44) 2320 Girl 6.17 (1.51) 2.90 (1.89) 8031 Skier 6.76 (1.39) 5.58 (2.24) 4279 Erotic female 5.47 (2.04) 4.38 (2.61) 2600 Beer 5.84 (1.85) 4.16 (1.74) 2352 Kiss 6.94 (1.87) 4.99 (1.98) 7289 Food 6.32 (2.00) 5.14 (2.51) 7481 Food 6.53 (1.78) 4.92 (2.13) 1947 Octopus 5.85 (1.77) 4.35 (2.37) 2375.2 Attractive female 6.34 (1.54) 4.30 (2.29) 2394 Medical worker 5.76 (1.47) 3.89 (2.26)
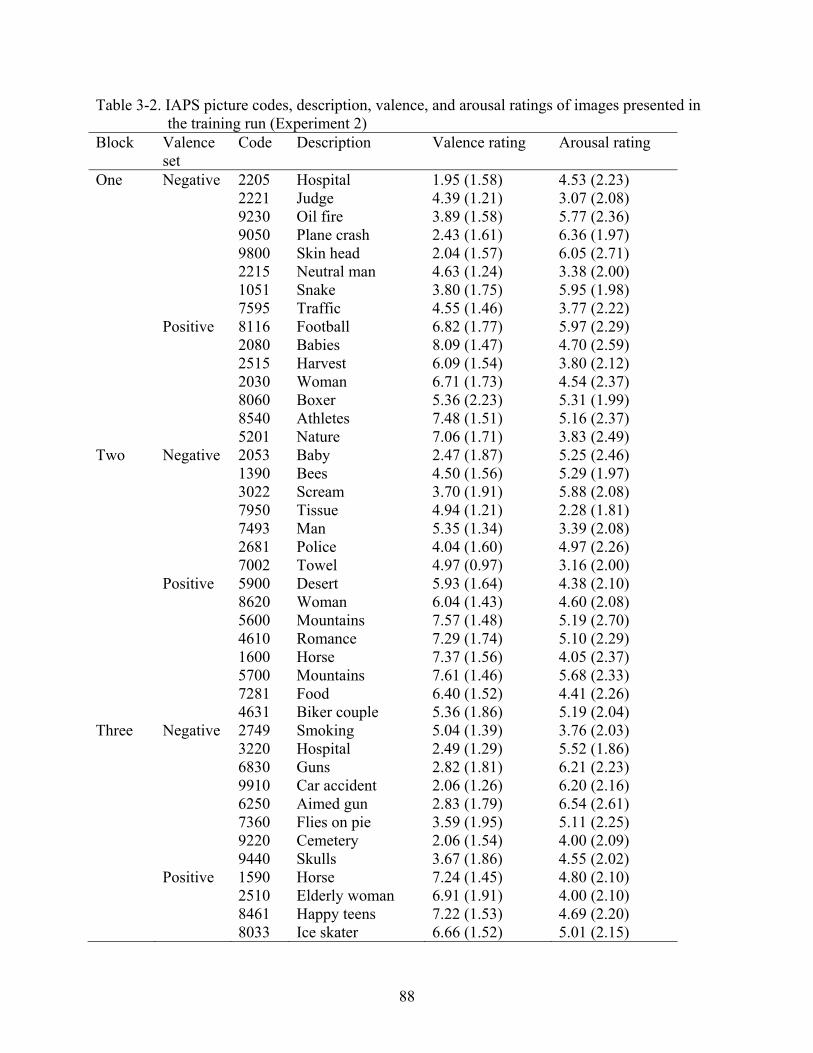
Table 3-2. IAPS picture codes, description, valence, and arousal ratings of images presented in the training run (Experiment 2)
Block Valence set
Code Description Valence rating Arousal rating
One Negative 2205 Hospital 1.95 (1.58) 4.53 (2.23) 2221 Judge 4.39 (1.21) 3.07 (2.08) 9230 Oil fire 3.89 (1.58) 5.77 (2.36) 9050 Plane crash 2.43 (1.61) 6.36 (1.97) 9800 Skin head 2.04 (1.57) 6.05 (2.71) 2215 Neutral man 4.63 (1.24) 3.38 (2.00) 1051 Snake 3.80 (1.75) 5.95 (1.98) 7595 Traffic 4.55 (1.46) 3.77 (2.22) Positive 8116 Football 6.82 (1.77) 5.97 (2.29) 2080 Babies 8.09 (1.47) 4.70 (2.59) 2515 Harvest 6.09 (1.54) 3.80 (2.12) 2030 Woman 6.71 (1.73) 4.54 (2.37) 8060 Boxer 5.36 (2.23) 5.31 (1.99) 8540 Athletes 7.48 (1.51) 5.16 (2.37) 5201 Nature 7.06 (1.71) 3.83 (2.49) Two Negative 2053 Baby 2.47 (1.87) 5.25 (2.46) 1390 Bees 4.50 (1.56) 5.29 (1.97) 3022 Scream 3.70 (1.91) 5.88 (2.08) 7950 Tissue 4.94 (1.21) 2.28 (1.81) 7493 Man 5.35 (1.34) 3.39 (2.08) 2681 Police 4.04 (1.60) 4.97 (2.26) 7002 Towel 4.97 (0.97) 3.16 (2.00) Positive 5900 Desert 5.93 (1.64) 4.38 (2.10) 8620 Woman 6.04 (1.43) 4.60 (2.08) 5600 Mountains 7.57 (1.48) 5.19 (2.70) 4610 Romance 7.29 (1.74) 5.10 (2.29) 1600 Horse 7.37 (1.56) 4.05 (2.37) 5700 Mountains 7.61 (1.46) 5.68 (2.33) 7281 Food 6.40 (1.52) 4.41 (2.26) 4631 Biker couple 5.36 (1.86) 5.19 (2.04) Three Negative 2749 Smoking 5.04 (1.39) 3.76 (2.03) 3220 Hospital 2.49 (1.29) 5.52 (1.86) 6830 Guns 2.82 (1.81) 6.21 (2.23) 9910 Car accident 2.06 (1.26) 6.20 (2.16) 6250 Aimed gun 2.83 (1.79) 6.54 (2.61) 7360 Flies on pie 3.59 (1.95) 5.11 (2.25) 9220 Cemetery 2.06 (1.54) 4.00 (2.09) 9440 Skulls 3.67 (1.86) 4.55 (2.02) Positive 1590 Horse 7.24 (1.45) 4.80 (2.10) 2510 Elderly woman 6.91 (1.91) 4.00 (2.10) 8461 Happy teens 7.22 (1.53) 4.69 (2.20) 8033 Ice skater 6.66 (1.52) 5.01 (2.15)
88

Table 3-2. Continued Block Valence
set Code Description Valence rating Arousal rating
Three Positive 5982 Sky 7.61 (1.48) 4.51 (2.85) 4004 Erotic female 5.14 (1.85) 4.44 (2.14) 7480 Pasta 7.08 (1.62) 4.55 (2.42) Four Negative 2830 Woman 4.73 (1.60) 3.64 (2.23) 2190 Man 4.83 (1.28) 2.41 (1.80) 5130 Rocks 4.45 (1.13) 2.51 (1.72) 7034 Hammer 4.95 (0.87) 3.06 (1.95) 2840 Chess 4.91 (1.52) 2.43 (1.82) 6350 Attack 1.90 (1.29) 7.29 (1.87) 9470 Ruins 3.05 (1.51) 5.05 (1.98) Positive 7200 Brownie 7.63 (1.74) 4.87 (2.59) 2499 Neutral male 5.34 (1.43) 3.08 (1.73) 2340 Family 8.03 (1.26) 4.90 (2.20) 4535 Weight lifter 6.27 (1.70) 4.95 (2.32) 5830 Sunset 8.00 (1.48) 4.92 (2.65) 9156 Plane 6.43 (1.59) 5.79 (2.30) 2191 Farmer 5.30 (1.62) 3.61 (2.14) 4150 Attractive female 6.53 (1.86) 4.86 (2.55) Five Negative 2700 Woman 3.19 (1.56) 4.77 (1.97) 9181 Dead cows 2.26 (1.85) 5.39 (2.41) 7700 Office 4.25 (1.45) 2.95 (2.17) 9530 Boys 2.93 (1.84) 5.20 (2.26) 1930 Shark 3.79 (1.92) 6.42 (2.07) 2493 Neutral male 4.82 (1.27) 3.34 (2.10) 6571 Car theft 2.85 (5.59) 5.59 (2.50) Positive 8497 Carnival ride 7.26 (1.44) 4.19 (2.18) 2435 Mom/Son 5.84 (1.27) 3.94 (1.93) 2395 Family 7.49 (1.69) 4.19 (2.40) 2530 Couple 7.80 (1.55) 3.99 (2.11) 7286 Pancakes 6.36 (1.72) 4.44 (2.44) 2580 Chess 5.71 (1.41) 2.79 (1.78) 2389 Teens 6.61 (1.69) 5.63 (2.00) 7320 Desserts 6.54 (1.63) 4.44 (2.12) Six Negative 7590 Traffic 4.75 (1.55) 3.80 (2.13) 2710 Drug addict 2.52 (1.69) 5.46 (2.29) 9330 Garbage 2.89 (1.74) 4.35 (2.07) 1220 Spider 3.47 (1.82) 5.57 (2.34) 2455 Sad girls 2.96 (1.79) 4.46 (2.12) 9010 Barbed wire 3.94 (1.70) 4.14 (2.05) 6313 Attack 1.98 (1.38) 6.94 (2.23) Positive 2501 Couple 6.89 (1.78) 3.09 (2.21) 2311 Mother 7.54 (1.37) 4.42 (2.28) 8490 Roller coaster 7.20 (2.35) 6.68 (1.97)
89
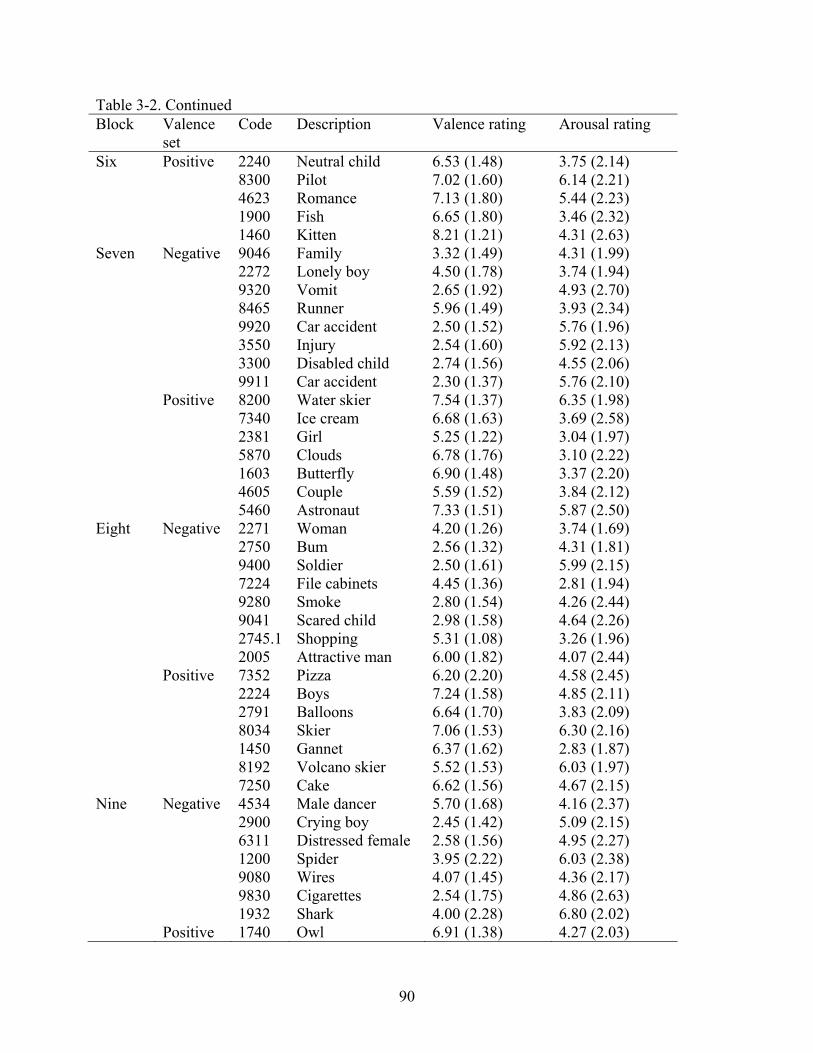
Table 3-2. Continued Block Valence
set Code Description Valence rating Arousal rating
Six Positive 2240 Neutral child 6.53 (1.48) 3.75 (2.14) 8300 Pilot 7.02 (1.60) 6.14 (2.21) 4623 Romance 7.13 (1.80) 5.44 (2.23) 1900 Fish 6.65 (1.80) 3.46 (2.32) 1460 Kitten 8.21 (1.21) 4.31 (2.63) Seven Negative 9046 Family 3.32 (1.49) 4.31 (1.99) 2272 Lonely boy 4.50 (1.78) 3.74 (1.94) 9320 Vomit 2.65 (1.92) 4.93 (2.70) 8465 Runner 5.96 (1.49) 3.93 (2.34) 9920 Car accident 2.50 (1.52) 5.76 (1.96) 3550 Injury 2.54 (1.60) 5.92 (2.13) 3300 Disabled child 2.74 (1.56) 4.55 (2.06) 9911 Car accident 2.30 (1.37) 5.76 (2.10) Positive 8200 Water skier 7.54 (1.37) 6.35 (1.98) 7340 Ice cream 6.68 (1.63) 3.69 (2.58) 2381 Girl 5.25 (1.22) 3.04 (1.97) 5870 Clouds 6.78 (1.76) 3.10 (2.22) 1603 Butterfly 6.90 (1.48) 3.37 (2.20) 4605 Couple 5.59 (1.52) 3.84 (2.12) 5460 Astronaut 7.33 (1.51) 5.87 (2.50) Eight Negative 2271 Woman 4.20 (1.26) 3.74 (1.69) 2750 Bum 2.56 (1.32) 4.31 (1.81) 9400 Soldier 2.50 (1.61) 5.99 (2.15) 7224 File cabinets 4.45 (1.36) 2.81 (1.94) 9280 Smoke 2.80 (1.54) 4.26 (2.44) 9041 Scared child 2.98 (1.58) 4.64 (2.26) 2745.1 Shopping 5.31 (1.08) 3.26 (1.96) 2005 Attractive man 6.00 (1.82) 4.07 (2.44) Positive 7352 Pizza 6.20 (2.20) 4.58 (2.45) 2224 Boys 7.24 (1.58) 4.85 (2.11) 2791 Balloons 6.64 (1.70) 3.83 (2.09) 8034 Skier 7.06 (1.53) 6.30 (2.16) 1450 Gannet 6.37 (1.62) 2.83 (1.87) 8192 Volcano skier 5.52 (1.53) 6.03 (1.97) 7250 Cake 6.62 (1.56) 4.67 (2.15) Nine Negative 4534 Male dancer 5.70 (1.68) 4.16 (2.37) 2900 Crying boy 2.45 (1.42) 5.09 (2.15) 6311 Distressed female 2.58 (1.56) 4.95 (2.27) 1200 Spider 3.95 (2.22) 6.03 (2.38) 9080 Wires 4.07 (1.45) 4.36 (2.17) 9830 Cigarettes 2.54 (1.75) 4.86 (2.63) 1932 Shark 4.00 (2.28) 6.80 (2.02) Positive 1740 Owl 6.91 (1.38) 4.27 (2.03)
90
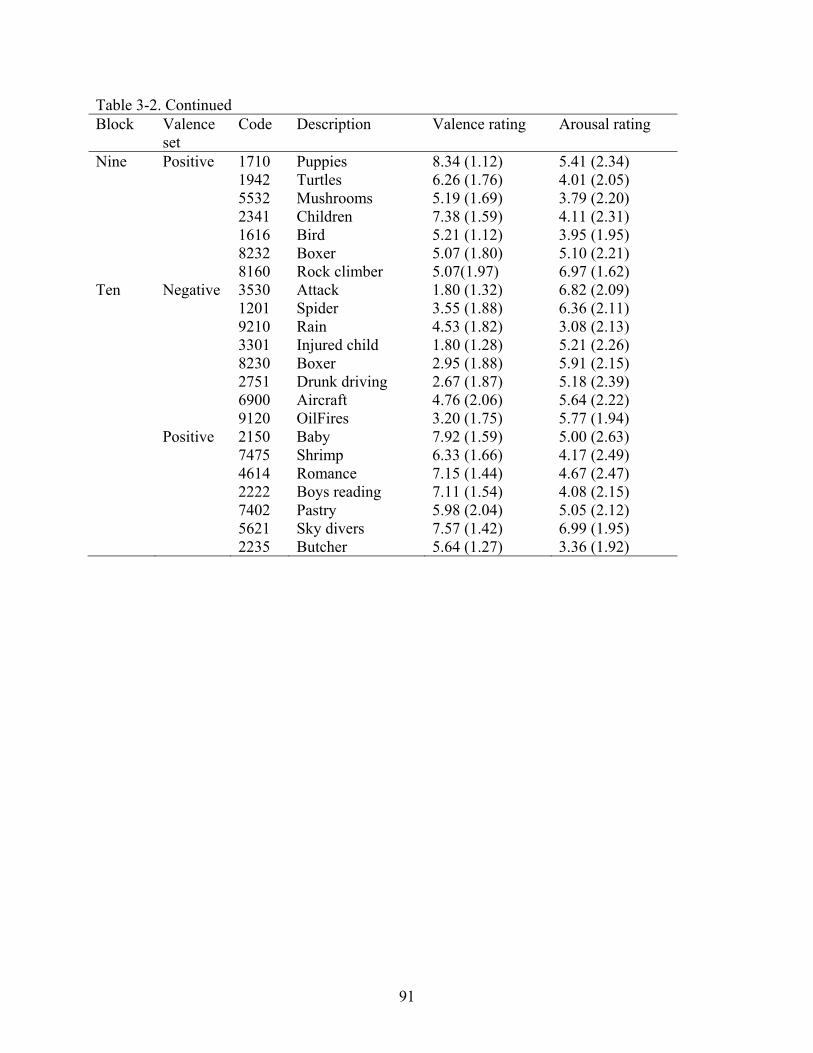
Table 3-2. Continued Block Valence
set Code Description Valence rating Arousal rating
Nine Positive 1710 Puppies 8.34 (1.12) 5.41 (2.34) 1942 Turtles 6.26 (1.76) 4.01 (2.05) 5532 Mushrooms 5.19 (1.69) 3.79 (2.20) 2341 Children 7.38 (1.59) 4.11 (2.31) 1616 Bird 5.21 (1.12) 3.95 (1.95) 8232 Boxer 5.07 (1.80) 5.10 (2.21) 8160 Rock climber 5.07(1.97) 6.97 (1.62) Ten Negative 3530 Attack 1.80 (1.32) 6.82 (2.09) 1201 Spider 3.55 (1.88) 6.36 (2.11) 9210 Rain 4.53 (1.82) 3.08 (2.13) 3301 Injured child 1.80 (1.28) 5.21 (2.26) 8230 Boxer 2.95 (1.88) 5.91 (2.15) 2751 Drunk driving 2.67 (1.87) 5.18 (2.39) 6900 Aircraft 4.76 (2.06) 5.64 (2.22) 9120 OilFires 3.20 (1.75) 5.77 (1.94) Positive 2150 Baby 7.92 (1.59) 5.00 (2.63) 7475 Shrimp 6.33 (1.66) 4.17 (2.49) 4614 Romance 7.15 (1.44) 4.67 (2.47) 2222 Boys reading 7.11 (1.54) 4.08 (2.15) 7402 Pastry 5.98 (2.04) 5.05 (2.12) 5621 Sky divers 7.57 (1.42) 6.99 (1.95) 2235 Butcher 5.64 (1.27) 3.36 (1.92)
91
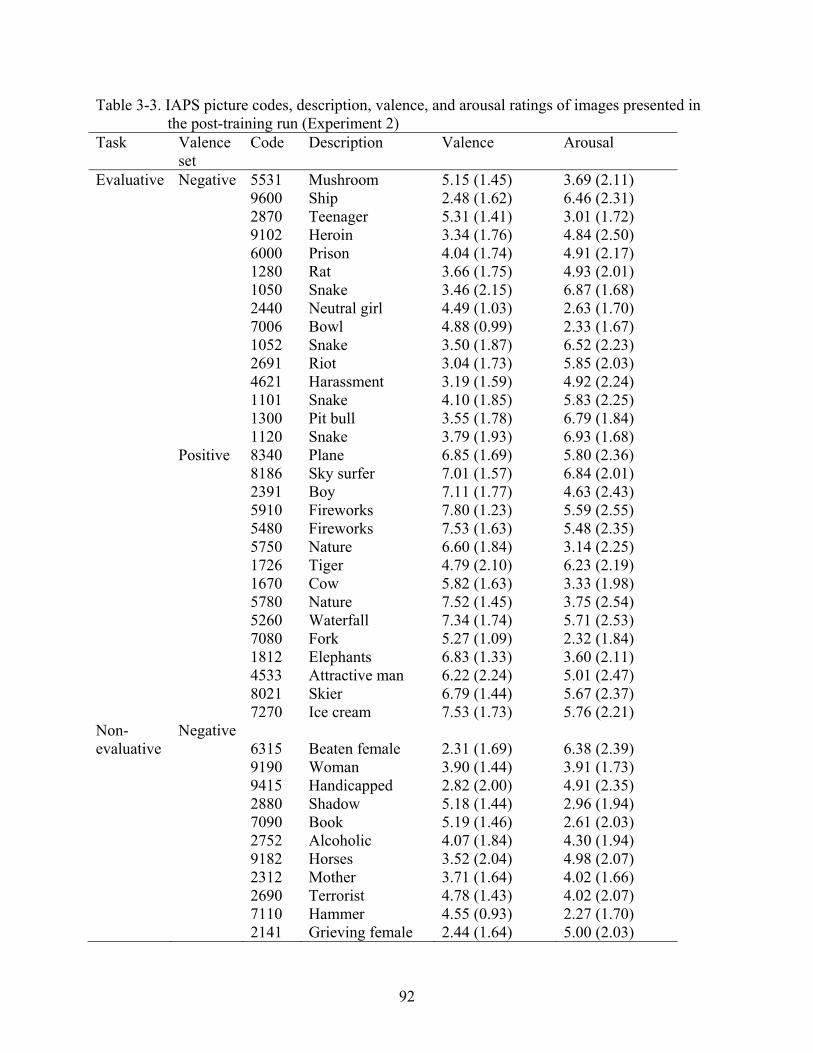
Table 3-3. IAPS picture codes, description, valence, and arousal ratings of images presented in the post-training run (Experiment 2)
Task Valence set
Code Description Valence Arousal
Evaluative Negative 5531 Mushroom 5.15 (1.45) 3.69 (2.11) 9600 Ship 2.48 (1.62) 6.46 (2.31) 2870 Teenager 5.31 (1.41) 3.01 (1.72) 9102 Heroin 3.34 (1.76) 4.84 (2.50) 6000 Prison 4.04 (1.74) 4.91 (2.17) 1280 Rat 3.66 (1.75) 4.93 (2.01) 1050 Snake 3.46 (2.15) 6.87 (1.68) 2440 Neutral girl 4.49 (1.03) 2.63 (1.70) 7006 Bowl 4.88 (0.99) 2.33 (1.67) 1052 Snake 3.50 (1.87) 6.52 (2.23) 2691 Riot 3.04 (1.73) 5.85 (2.03) 4621 Harassment 3.19 (1.59) 4.92 (2.24) 1101 Snake 4.10 (1.85) 5.83 (2.25) 1300 Pit bull 3.55 (1.78) 6.79 (1.84) 1120 Snake 3.79 (1.93) 6.93 (1.68) Positive 8340 Plane 6.85 (1.69) 5.80 (2.36) 8186 Sky surfer 7.01 (1.57) 6.84 (2.01) 2391 Boy 7.11 (1.77) 4.63 (2.43) 5910 Fireworks 7.80 (1.23) 5.59 (2.55) 5480 Fireworks 7.53 (1.63) 5.48 (2.35) 5750 Nature 6.60 (1.84) 3.14 (2.25) 1726 Tiger 4.79 (2.10) 6.23 (2.19) 1670 Cow 5.82 (1.63) 3.33 (1.98) 5780 Nature 7.52 (1.45) 3.75 (2.54) 5260 Waterfall 7.34 (1.74) 5.71 (2.53) 7080 Fork 5.27 (1.09) 2.32 (1.84) 1812 Elephants 6.83 (1.33) 3.60 (2.11) 4533 Attractive man 6.22 (2.24) 5.01 (2.47) 8021 Skier 6.79 (1.44) 5.67 (2.37) 7270 Ice cream 7.53 (1.73) 5.76 (2.21) Non-evaluative
Negative 6315 Beaten female 2.31 (1.69) 6.38 (2.39)
9190 Woman 3.90 (1.44) 3.91 (1.73) 9415 Handicapped 2.82 (2.00) 4.91 (2.35) 2880 Shadow 5.18 (1.44) 2.96 (1.94) 7090 Book 5.19 (1.46) 2.61 (2.03) 2752 Alcoholic 4.07 (1.84) 4.30 (1.94) 9182 Horses 3.52 (2.04) 4.98 (2.07) 2312 Mother 3.71 (1.64) 4.02 (1.66) 2690 Terrorist 4.78 (1.43) 4.02 (2.07) 7110 Hammer 4.55 (0.93) 2.27 (1.70) 2141 Grieving female 2.44 (1.64) 5.00 (2.03)
92
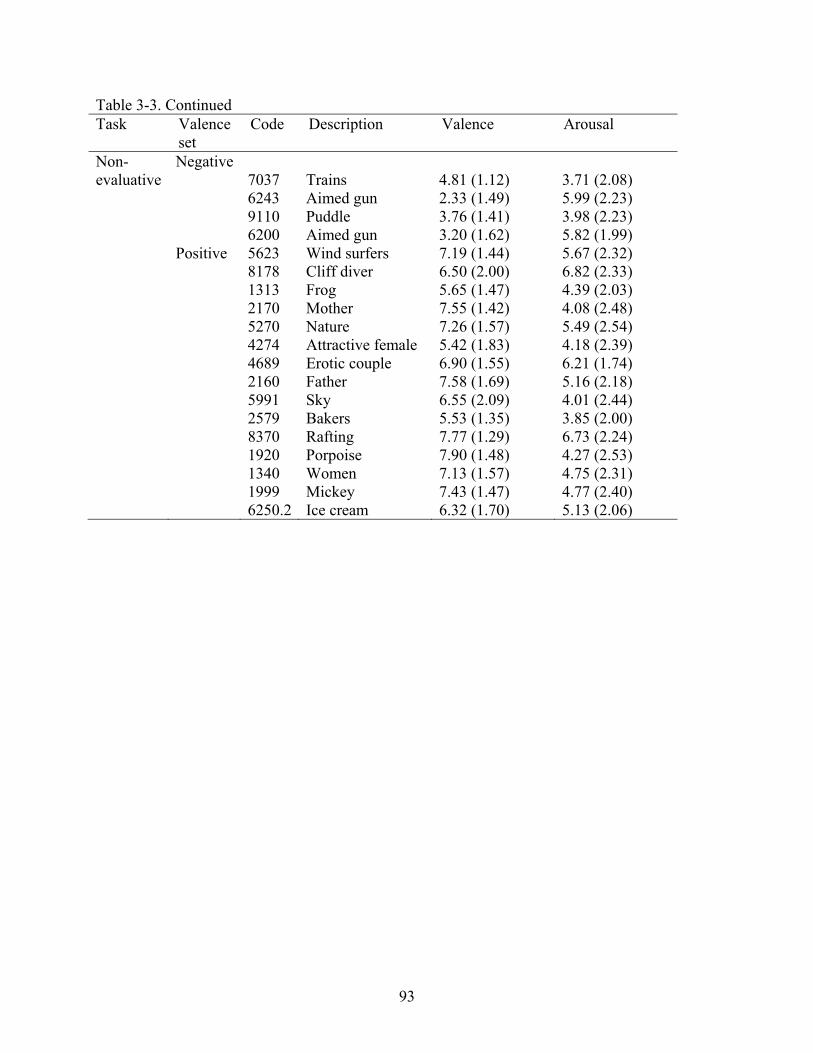
93
Table 3-3. Continued Task Valence
set Code Description Valence Arousal
Non-evaluative
Negative 7037 Trains 4.81 (1.12) 3.71 (2.08)
6243 Aimed gun 2.33 (1.49) 5.99 (2.23) 9110 Puddle 3.76 (1.41) 3.98 (2.23) 6200 Aimed gun 3.20 (1.62) 5.82 (1.99) Positive 5623 Wind surfers 7.19 (1.44) 5.67 (2.32) 8178 Cliff diver 6.50 (2.00) 6.82 (2.33) 1313 Frog 5.65 (1.47) 4.39 (2.03) 2170 Mother 7.55 (1.42) 4.08 (2.48) 5270 Nature 7.26 (1.57) 5.49 (2.54) 4274 Attractive female 5.42 (1.83) 4.18 (2.39) 4689 Erotic couple 6.90 (1.55) 6.21 (1.74) 2160 Father 7.58 (1.69) 5.16 (2.18) 5991 Sky 6.55 (2.09) 4.01 (2.44) 2579 Bakers 5.53 (1.35) 3.85 (2.00) 8370 Rafting 7.77 (1.29) 6.73 (2.24) 1920 Porpoise 7.90 (1.48) 4.27 (2.53) 1340 Women 7.13 (1.57) 4.75 (2.31) 1999 Mickey 7.43 (1.47) 4.77 (2.40) 6250.2 Ice cream 6.32 (1.70) 5.13 (2.06)

Table 3-4. Ratings of pleasant and unpleasant images in the pre-training and the post-training run (Experiment 2) Judgment type Valence Run
Pre-training run Post-training run Evaluative Pleasant 3.69 (1.01) 3.99 (0.84) Unpleasant 3.08 (1.09) 2.64 (0.71) Non-evaluative Pleasant 3.36 (0.92) 3.31 (0.85) Unpleasant 3.37 (0.91) 3.09 (0.79) Data presented in the cells are ratings to images presented in each run. Data in the parentheses are standard deviations of corresponding cell means.
94

95
Table 3-5. Distribution of responses for evaluative and non-evaluative tasks in pre-training and post-training runs (Experiment 2) Judgment type Run Responses (frequency and %)
Button 1 Button 2 Button 3 Button 4 omitted Evaluative Pre-training 93 (27.5) 86 (25.4) 92 (27.2) 67 (19.8) 82 (19.5) Post-training 105 (26.9) 116 (29.7) 111 (28.4) 59 (15.1) 29 (6.9) Non-evaluative Pre-training 58 (18.8) 112 (36.4) 105 (34.1) 33 (10.7) 112 (26.7) Post-training 72 (19.3) 182 (48.7) 94 (25.1) 26 (7.0) 46 (11.0) For evaluative tasks, button 1 represents extremely unpleasant, button 2 represents unpleasant, button 3 represents pleasant, and button 4 represents extremely pleasant. For non-evaluative tasks, button 1 represents rarely/never, button 2 represents occasionally, button 3 represents often, and button 4 represents always. For button 1, 2, 3 and 4, the data in the parentheses are percentage of frequency of button selection in all valid responses for corresponding tasks in corresponding run. For missing responses, data in the parentheses are percentage of omitted trials in all 420 possible responses for corresponding tasks in corresponding run.

Table 3-6. List of references of regions-of interest selected in the fMRI study of evaluation proceduralization (Experiment 2) Region BA Side Coordinates Voxels Reference x y z Caudate nucleus L & R ±9 15 4 485 Poldrack et al., 1999 Putamen L −27 8 4 485 An independent study R 18 −1 15 485 Mallol et al., 2007 Nucleus accumbens L −4 6 −2 485 Lieberman et al., 2004 Cerebellum R 31 −65 −18 485 Willingham et al., 2002 Superior parietal lobe 7 R 12 −67 50 485 Willingham et al., 2002 Inferior parietal lobe L −34 −46 56 485 Mallol et al., 2007 40 R 50 −26 36 485 Poldrack et al., 1999 Medial temporal lobe L −39 −15 −24 485 Rose et al., 2004 Dorsolateral prefrontal cortex L −30 55 24 485 Klingberg et al., 1997 R 48 41 9 485 Taylor et al., 2003 Ventromedial prefrontal cortex L −22 30 −16 485 Lieberman et al., 2004 Amygdala L −24 −1 −14 1764 Anatomically defined (Norris et al., 2004) Insula 13 L −30 23 7 111 An independent study Orbito-frontal cortex 47 R 45 35
96
−4 485 Maccotta & Buckner, 2004 Anterior cingulate cortex 32 L −4 24 32 485 Cunningham et al., 2004 Frontal operculum L −46 14 6 485 Lane et al., 1997 Temporal pole 21/38 R 42 8 −30 485 Lane et al., 1997 Calcarine L −17 −93 −17 485 Maccotta & Buckner, 2004 Posterior fusiform 18/19 L −36 −73 −13 485 Maccotta & Buckner, 2004 Superior occipital gyrus R 32 −74 29 485 Garavan et al., 1999 Parieto-occipital cortex 39 R 44 −70 20 485 Lane et al., 1997 Motor cortex 4 L −37 −25 50 485 Maccotta & Buckner, 2004 Inferior frontal gyrus 46 L & R ±47 17 24 485 Maccotta & Buckner, 2004 9 L & R ±43 3 32 485 Maccotta & Buckner, 2004 BA = Brodmann’s area; L, left; R, right; x, y, z: coordinates of the centroid of the region in Tailarach coordinates; Voxels: volume of the region in mm3. References indicate the articles from which the coordinates of ROIs were extracted.
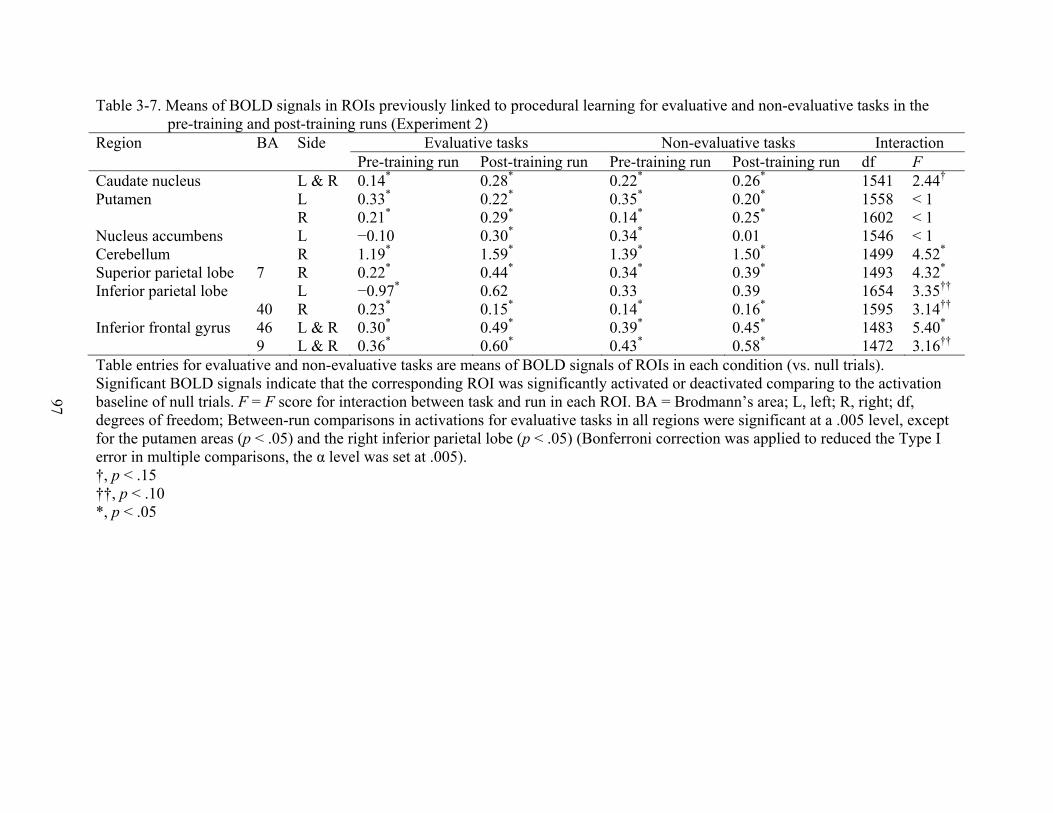
Table 3-7. Means of BOLD signals in ROIs previously linked to procedural learning for evaluative and non-evaluative tasks in the pre-training and post-training runs (Experiment 2)
Region BA Side Evaluative tasks Non-evaluative tasks Interaction Pre-training run Post-training run Pre-training run Post-training run df F Caudate nucleus L & R 0.14* 0.28* 0.22* 0.26* 1541 2.44† Putamen L 0.33* 0.22* 0.35* 0.20* 1558 < 1 R 0.21* 0.29* 0.14* 0.25* 1602 < 1 Nucleus accumbens L −0.10 0.30* 0.34* 0.01 1546 < 1 Cerebellum R 1.19* 1.59* 1.39* 1.50* 1499 4.52* Superior parietal lobe 7 R 0.22* 0.44* 0.34* 0.39* 1493 4.32* Inferior parietal lobe L −0.97* 0.62 0.33 0.39 1654 3.35†† 40 R 0.23* 0.15* 0.14* 0.16* 1595 3.14†† Inferior frontal gyrus 46 L & R 0.30* 0.49* 0.39* 0.45* 1483 5.40* 9 L & R 0.36* 0.60* 0.43* 0.58* 1472 3.16†† Table entries for evaluative and non-evaluative tasks are means of BOLD signals of ROIs in each condition (vs. null trials). Significant BOLD signals indicate that the corresponding ROI was significantly activated or deactivated comparing to the activation baseline of null trials. F = F score for interaction between task and run in each ROI. BA = Brodmann’s area; L, left; R, right; df, degrees of freedom; Between-run comparisons in activations for evaluative tasks in all regions were significant at a .005 level, except for the putamen areas (p < .05) and the right inferior parietal lobe (p < .05) (Bonferroni correction was applied to reduced the Type I error in multiple comparisons, the α level was set at .005).
97
†, p < .15 ††, p < .10 *, p < .05

Table 3-8. Means of BOLD signals in ROIs previously linked to declarative learning for evaluative and non-evaluative tasks in the pre-training and post-training runs (Experiment 2)
Region BA Side Evaluative tasks Non-evaluative tasks Interaction Pre-training run Post-training run Pre-training run Post-training run df F Medial temporal lobe L 0.09* −0.12* 0.07 0.01 1656 < 1 Dorsolateral prefrontal cortex L & R 0.37* 0.10 0.11 0.09 1630 4.68*
Ventromedial prefrontal cortex L 0.32* −0.14 −0.33 4.88*−0.21 1660Table entries for evaluative and non-evaluative tasks are means of BOLD signals of ROIs in each condition (vs. null trials). Significant BOLD signals indicate that the corresponding ROI was significantly activated or deactivated comparing to the activation baseline of null trials. F = F score for interaction between task and run in each ROI. BA = Brodmann’s area; L, left; R, right; df, degrees of freedom; Between-run comparisons in activations for evaluative tasks in all regions were significant at a .01 level (Bonferroni correction was applied to reduced the Type I error in multiple comparisons, the α level was set at .017). *, p < .05
98

Table 3-9. Means of BOLD signals in ROIs previously linked to evaluative processing for evaluative and non-evaluative tasks in the pre-training and post-training runs (Experiment 2)
Region BA Side Evaluative tasks Non-evaluative tasks Interaction Pre-training run Post-training run Pre-training run F Post-training run df Regions associated with automatic evaluation Amygdala L 0.22* 0.30* 0.23* 0.35* 1535 < 1 Insula 13 L 0.34 1.38* 0.30 1.42* 1655 < 1 Orbito-frontal cortex 47 R −0.06 0.43* −0.07 0.49* 1655 < 1 Regions associated with controlled evaluation Anterior cingulate cortex 32 L 0.02 0.09* 0.06 0.07 1491 3.53†† Frontal operculum L 0.28* 0.42* 0.39* 0.43* 1528 1.52 Temporal pole 21/38 R 0.12* 0.31* 0.20* 0.25* 1523 4.28* Table entries for evaluative and non-evaluative tasks are means of BOLD signals of ROIs in each condition (vs. null trials). Significant BOLD signals indicate that the corresponding ROI was significantly activated or deactivated comparing to the activation baseline of null trials. F = F score for interaction between task and run in each ROI. BA = Brodmann’s area; L, left; R, right; df, degrees of freedom; Between-run comparisons in activations for evaluative tasks in all regions were significant at a .001 level, except for the amygdala (p < .10), the anterior cingulate cortex (p = .01), and the frontal operculum (p = .02) (Bonferroni correction was applied to reduced the Type I error in multiple comparisons, the α level was set at .008).
99
††, p < .10 *, p < .05
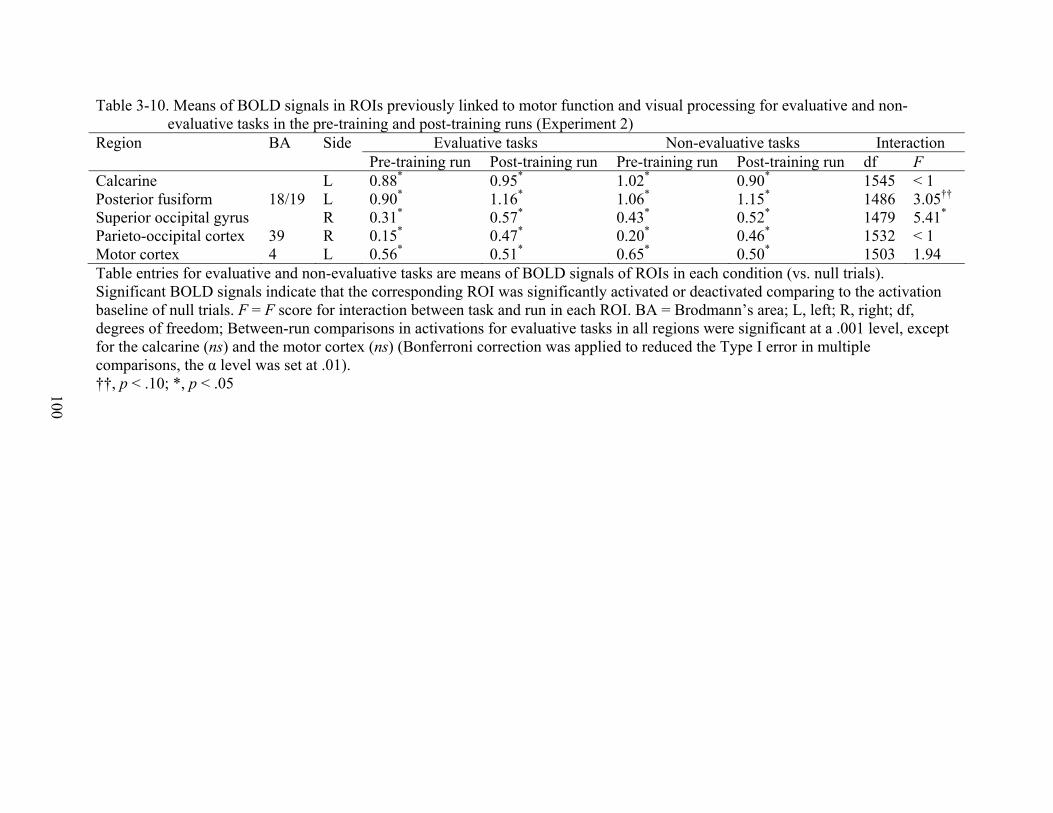
Table 3-10. Means of BOLD signals in ROIs previously linked to motor function and visual processing for evaluative and non-evaluative tasks in the pre-training and post-training runs (Experiment 2)
Region BA Side Evaluative tasks Non-evaluative tasks Interaction Pre-training run Post-training run Pre-training run Post-training run df F Calcarine L 0.88* 0.95* 1.02* 0.90* 1545 < 1 Posterior fusiform 18/19 L 0.90* 1.16* 1.06* 1.15* 1486 3.05†† Superior occipital gyrus R 0.31* 0.57* 0.43* 0.52* 1479 5.41* Parieto-occipital cortex 39 R 0.15* 0.47* 0.20* 0.46* 1532 < 1 Motor cortex 4 L 0.56* 0.51* 0.65* 0.50* 1503 1.94 Table entries for evaluative and non-evaluative tasks are means of BOLD signals of ROIs in each condition (vs. null trials). Significant BOLD signals indicate that the corresponding ROI was significantly activated or deactivated comparing to the activation baseline of null trials. F = F score for interaction between task and run in each ROI. BA = Brodmann’s area; L, left; R, right; df, degrees of freedom; Between-run comparisons in activations for evaluative tasks in all regions were significant at a .001 level, except for the calcarine (ns) and the motor cortex (ns) (Bonferroni correction was applied to reduced the Type I error in multiple comparisons, the α level was set at .01). ††, p < .10; *, p < .05 100
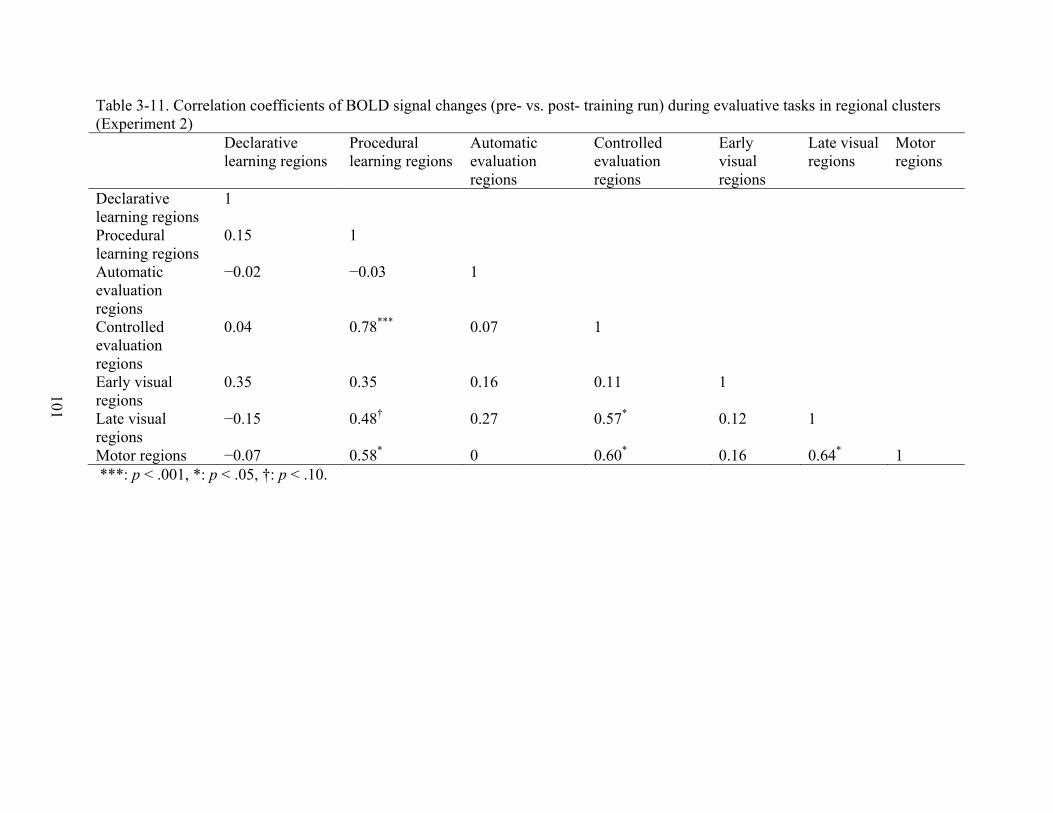
101
Table 3-11. Correlation coefficients of BOLD signal changes (pre- vs. post- training run) during evaluative tasks in regional clusters (Experiment 2) Declarative
learning regions Procedural learning regions
Automatic evaluation regions
Controlled evaluation regions
Early visual regions
Late visual regions
Motor regions
Declarative learning regions
1
Procedural learning regions
0.15 1
Automatic evaluation regions
−0.02 −0.03 1
Controlled evaluation regions
0.04 0.78*** 0.07 1
Early visual regions
0.35 0.35 0.16 0.11 1
Late visual regions
−0.15 0.48† 0.27 0.57* 0.12 1
Motor regions −0.07 0.58* 0 0.60* 0.16 0.64* 1 ***: p < .001, *: p < .05, †: p < .10.

A B
C D Figure 3-1. Sample IAPS pictures used in Experiment 2. A) Sample pleasant image presented for
evaluative tasks. B) Sample unpleasant image presented for evaluative tasks. C) Sample pleasant image presented for non-evaluative tasks. D) Sample unpleasant image presented for non-evaluative tasks.
102
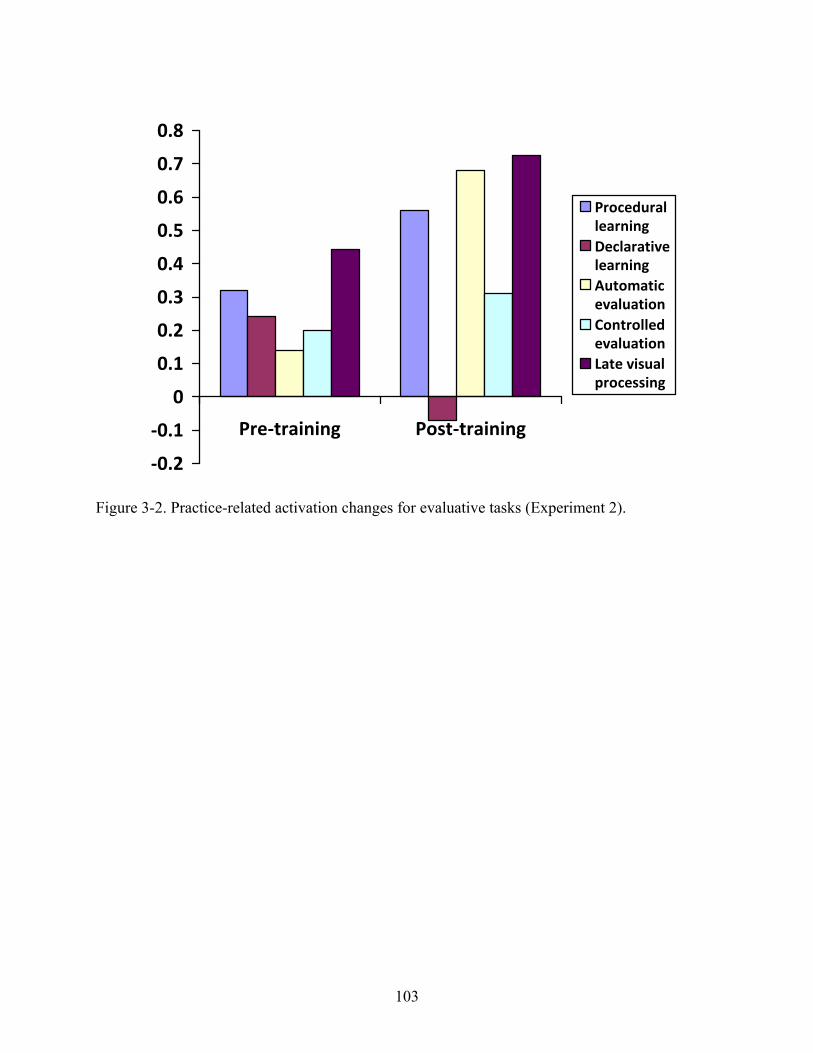
‐0.2
‐0.1
0
0.1
0.2
0.3
0.4
0.5
0.6
0.7
0.8
Pre‐training Post‐training
ProcedurallearningDeclarativelearningAutomaticevaluationControlledevaluationLate visualprocessing
Figure 3-2. Practice-related activation changes for evaluative tasks (Experiment 2).
103

Figure 3-3. Maps for brain activity changes for evaluative tasks in learning-related regions (Experiment 2). Areas previously linked to procedural learning include the putamen (A, the left putamen, t = −7.04; B, the right putamen, t = 5.03), the inferior parietal lobe (C, the right IPL, t = −4.41; D, the left IPL, t = 7.53), the caudate nucleus (E, the left caudate nucleus, t = 7.42; F, the right caudate nucleus, t = 8.79), the right superior parietal lobe (G, t = 16.04), the BA 46 (H, the right BA 46, t = 16.23; I, the left BA 46, t = 26.75), the cerebellum (J, t = 18.68), the BA 9 (K, the left BA 9, t = 30.95; L, the right BA 9, t = 37.31), and the left nucleus accumbens (M, t = 33.58). Areas previously linked to declarative learning include the medial temporal lobe (N, t = −10), the dorsolateral prefrontal cortex (O, the right dlPFC, t = −7.41; P, the left dlPFC, t = −6.51), and the left ventromedial prefrontal cortex (Q, t = −6.49). Color scale represents the order of t-values of pre- vs. post- training comparisons in BOLD responses for evaluative tasks.
104
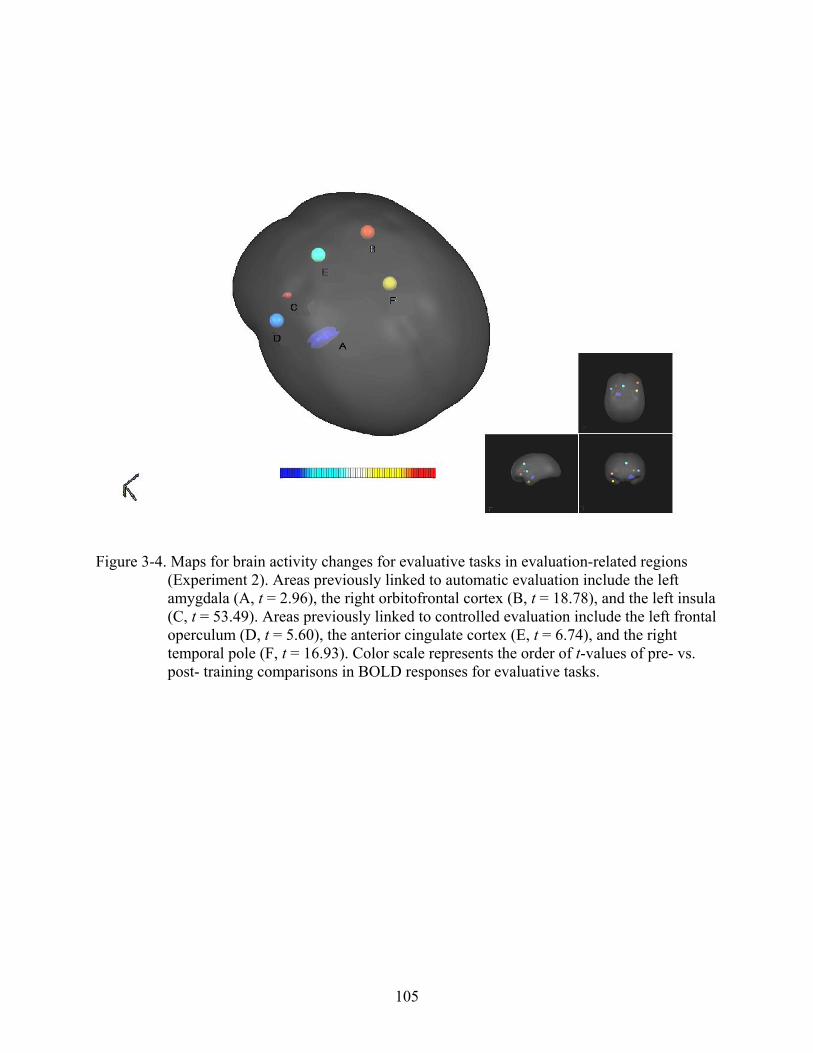
Figure 3-4. Maps for brain activity changes for evaluative tasks in evaluation-related regions (Experiment 2). Areas previously linked to automatic evaluation include the left amygdala (A, t = 2.96), the right orbitofrontal cortex (B, t = 18.78), and the left insula (C, t = 53.49). Areas previously linked to controlled evaluation include the left frontal operculum (D, t = 5.60), the anterior cingulate cortex (E, t = 6.74), and the right temporal pole (F, t = 16.93). Color scale represents the order of t-values of pre- vs. post- training comparisons in BOLD responses for evaluative tasks.
105
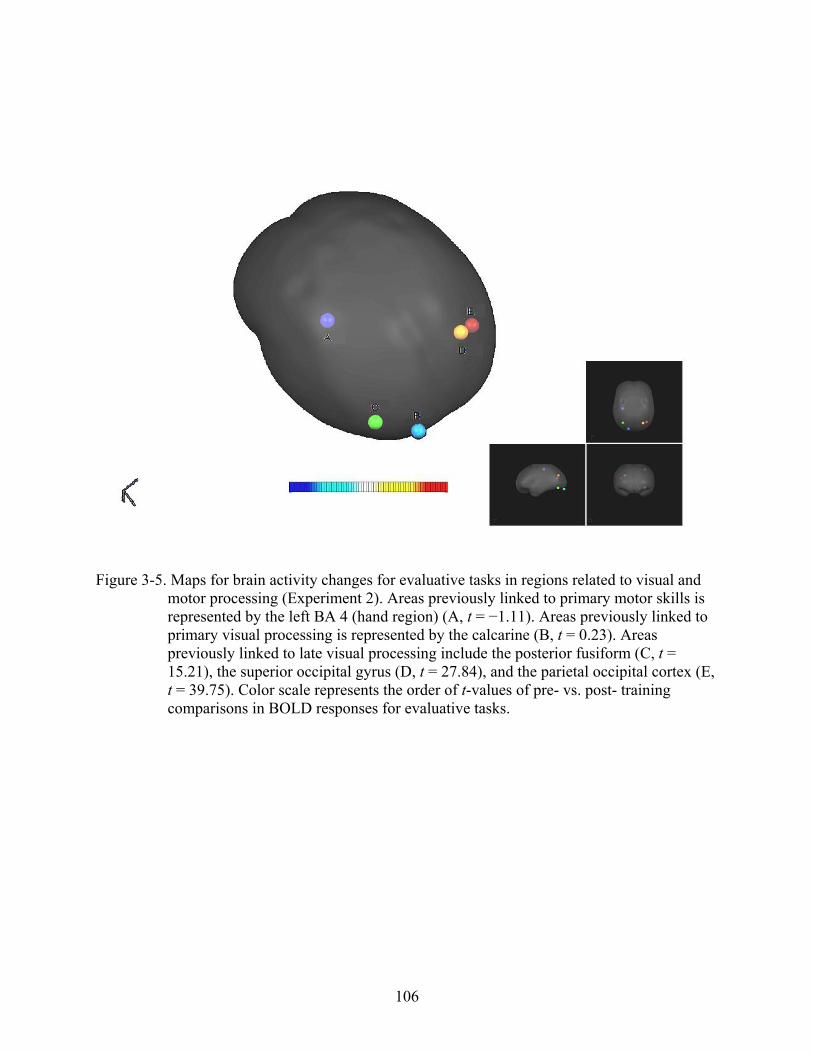
Figure 3-5. Maps for brain activity changes for evaluative tasks in regions related to visual and motor processing (Experiment 2). Areas previously linked to primary motor skills is represented by the left BA 4 (hand region) (A, t = −1.11). Areas previously linked to primary visual processing is represented by the calcarine (B, t = 0.23). Areas previously linked to late visual processing include the posterior fusiform (C, t = 15.21), the superior occipital gyrus (D, t = 27.84), and the parietal occipital cortex (E, t = 39.75). Color scale represents the order of t-values of pre- vs. post- training comparisons in BOLD responses for evaluative tasks.
106

107
CHAPTER 4 GENERAL DISCUSSION
We began with a question: As evaluation is often automatic, is there room for increases in
the procedural efficiency of explicit evaluative judgments? That is, can evaluative judgments be
proceduralized through practice, and if so, what aspects of the process of making evaluative
judgments are being proceduralized? To answer these questions, we first investigated whether
there are decreases in the times required to make evaluative judgments of emotional visual
stimuli following practice, and subsequently explored the functional anatomic correlates of
proceduralized evaluations of emotional stimuli. Together, our findings provide important
evidence of the effects of proceduralization on behavioral and neural responses to emotional
stimuli.
Summary of Findings
The results from Experiment 1 demonstrated that, like various cognitive, social and motor
skills, evaluative judgments can also be proceduralized or speeded up through practice.
Moreover, consistent with Smith and his colleagues’ (1986, 1994) work on procedural
efficiency, Experiment 1 showed that evaluative judgments quickly automate with repeated
execution. More importantly, evaluation proceduralization does not have to be content-specific,
but instead generalizes or transfers to novel stimuli. Specifically, participants who had practiced
evaluations of pictures were more likely to make spontaneous evaluative responses of new
pictures than participants who had practiced non-evaluative judgments. Interestingly, non-
evaluative (frequency-rating) judgments of the same set of images were also proceduralized
through practice, but their procedural efficiency did not facilitate corresponding responses to
new stimuli.

Experiment 2 further contributed to understanding which aspects of evaluation
proceduralize by providing evidence on brain correlates of evaluation proceduralization.
Generally, the results of Experiment 2 suggest that multiple brain regional systems are involved
in evaluation proceduralization. Specifically, following practice, evaluative judgments evoked
higher responses in task-related areas, such as regions associated with automatic and controlled
evaluation (i.e., the amygdala, the insula, the anterior cingulate cortex, the temporal pole, the
frontal operculum and the orbitofrontal cortex), as well as regions associated with late visual
processing (i.e., the posterior fusiform, the parietal occipital lobe, and the superior occipital
lobe). Also, when evaluative tasks proceduralized, regions related to procedural learning (i.e., the
striatal system, the superior parietal lobe, the inferior frontal cortex, and the cerebellum) were
more responsive to evaluative tasks, whereas regions related to declarative learning (i.e., the
medial temporal lobe, the dorsolateral prefrontal cortex, and the ventromedial prefrontal cortex)
were correspondingly less responsive. These fMRI results provide insight into how practice
proceduralizes evaluations at the brain level.
Contributions
The current study contributes to the area of social cognitive neuroscience of evaluation in
several aspects. First, we found that the amygdala, as well as the frontal operculum, showed
different activation patterns for pleasant and unpleasant images. These findings suggest that the
amygdala and the frontal operculum are sensitive to valence.
Second, the findings in the present research confirm that evaluation is not a single process
but involves both automatic and controlled aspects. Brain regions associated with automatic
evaluation, as well as those associated with controlled evaluation, were more active after than
before the training in evaluative tasks. However, regions previously associated with automatic
evaluation were more active regardless of explicit task instruction, whereas regions related to
108

controlled evaluation were only more active for trained evaluative tasks but not untrained non-
evaluative tasks. Therefore, effects of practice with evaluation on regions related to automatic
evaluation generalized to other type of judgments, whereas the effects on controlled evaluation
regions were task-specific.
Third, extensive research has distinguished functions of cerebral regions in implicit and
explicit evaluation based on their differential activities during explicit and implicit evaluative
tasks (e.g., Cunningham et al., 2003; Cunningham et al., 2004). Specifically, previous research
suggest that the amygdala, the insula, and the OFC are involved in automatic evaluation as they
are active with the presentation of emotional stimuli regardless of whether or not explicit
evaluations are required. In contrast, the ACC, the temporal lobe, and the frontal operculum
might be involved in controlled evaluation as their activation were higher when explicit
evaluations of targets were required than when they were not (Lane et al., 1997). Consistently
with the above previous findings in regions associated with automatic evaluation (Cunningham,
Raye, & Johnson, 2004; Cunningham et al., 2003; Lane et al., 1997; Wright & Liu, 2005; Wright
et al., 2008), we did not detect task (evaluation vs. non-evaluation) differences in activations in
the amygdala, the insula, or the OFC either before or after training in evaluation. However, the
current study also did not detect any differences between activations in the controlled-evaluation
regions for either evaluative or non-evaluative tasks during either the pre-training and the post-
training run. That is, the anterior cingulate, as well as the temporal pole and the frontal
operculum, were equally activated (vs. null trials) for evaluative and non-evaluative tasks before
and after training. One possible reason for the lack of between-task difference in activations in
controlled-evaluation regions might be the design of the current study. That is, our rapid
109

presentation of stimuli (less than 3000 ms) may have reduced the detectability of differential
responses. Further research should be conducted to explain this discrepancy.
Importantly, the present findings shed light on the processes that contribute to evaluation
proceduralization. Although numerous studies have suggested a decreased regional activation
due to practice, our findings suggest that evaluation practice produces an increased regional
activation in evaluative processing areas. One possible explanation is that experimental
paradigms of repetition suppression (Buchel et al., 1999; Maccotta & Buckner, 2004) only entail
repeated presentation of the same stimuli. Therefore, increased activations in regions linked to
evaluative processing can also reflect a progressive optimization of neuronal responses elicited
by evaluative tasks. In addition, this progressive optimization may be facilitated by more focused
activation voxels when evaluations proceduralized. In any case, the findings of increased brain
activation in the evaluative processing areas are consistent with previous reports of practice
induced increases in task-specific brain areas (Grossman et al., 2004). Moreover, the increased
activation in the left amygdala when evaluation proceduralizes can be explained by increased left
amygdala demands for evaluative-memory retrieval (Sergerie, Lepage, & Armony, 2006). More
direct comparisons of brain function during evaluations of identical stimuli and non-repeated
stimuli should be done to understand how progressive optimization occurs in each case.
In closing, the current study supports a model in which brain activation changes as a
function of experience. Practice with evaluative judgments reorganizes regional activations, as
brain regions activated early in the practice differ from the ones activated late in the practice.
More specifically, evaluation proceduralization increases activity in brain regions associated
with automatic evaluation but decreases activity in brain regions associated with declarative
learning. Moreover, regression analyses revealed that the effects of practice on response times
110

111
for evaluative judgments can be predicted from activation changes in declarative and procedural
learning regions, automatic and controlled evaluation regions, motor cortex, as well as the early
visual regions.
Taken together, our findings show the ways in which long-standing theories of attitude and
evaluation can be tested using a social-cognitive-neuroscience approach. Such analyses
demonstrate the value of social psychological theories for understanding the work of the brain
during practice with evaluation. By using neuroimaging to identify these brain correlates and
drawing inferences from what is already known about the processing roles of these regions, we
were able to generate new insights regarding the behavioral and brain functional consequences of
practice in evaluation. Such insights suggest that a social cognitive neuroscience approach can
trigger promising advance for both social psychological theory and neuroscience.
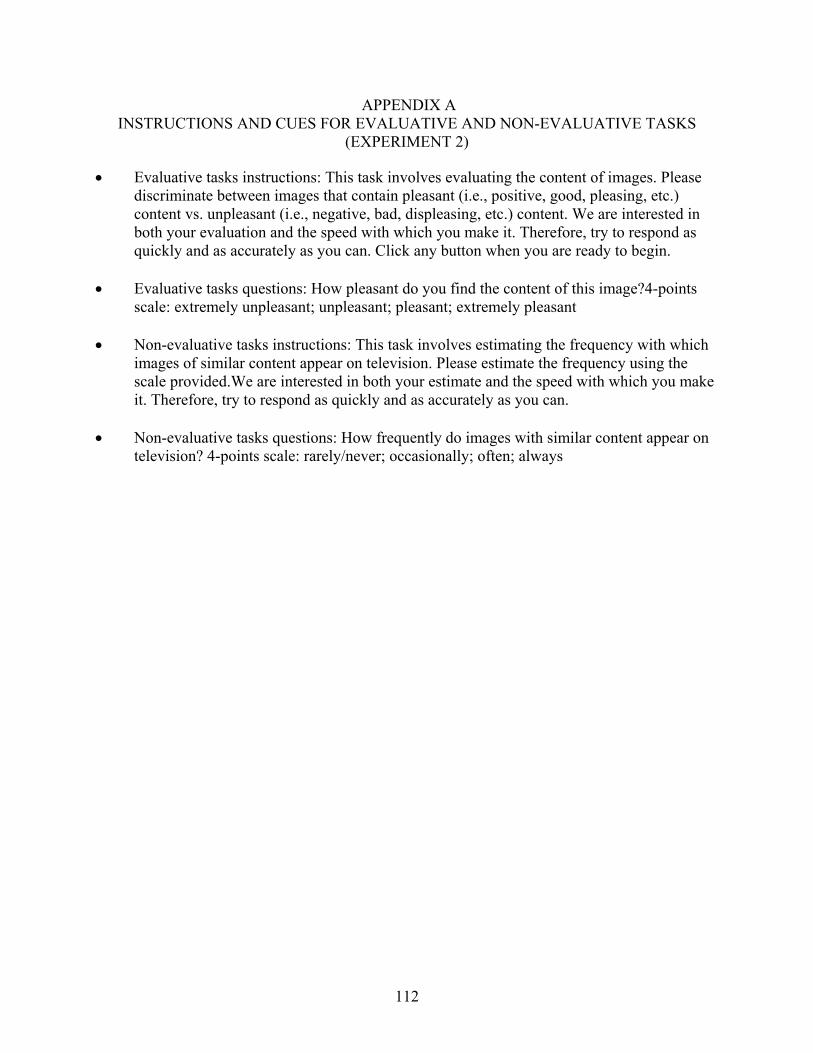
APPENDIX A INSTRUCTIONS AND CUES FOR EVALUATIVE AND NON-EVALUATIVE TASKS
(EXPERIMENT 2)
• Evaluative tasks instructions: This task involves evaluating the content of images. Please discriminate between images that contain pleasant (i.e., positive, good, pleasing, etc.) content vs. unpleasant (i.e., negative, bad, displeasing, etc.) content. We are interested in both your evaluation and the speed with which you make it. Therefore, try to respond as quickly and as accurately as you can. Click any button when you are ready to begin.
• Evaluative tasks questions: How pleasant do you find the content of this image?4-points scale: extremely unpleasant; unpleasant; pleasant; extremely pleasant
• Non-evaluative tasks instructions: This task involves estimating the frequency with which images of similar content appear on television. Please estimate the frequency using the scale provided.We are interested in both your estimate and the speed with which you make it. Therefore, try to respond as quickly and as accurately as you can.
• Non-evaluative tasks questions: How frequently do images with similar content appear on television? 4-points scale: rarely/never; occasionally; often; always
112

APPENDIX B CORRELATION COEFFICIENTS OF ROI ACTIVITY CHANGES AND BEHAVIORAL
PERFORMANCE CHANGE FROM THE PRE- TO THE POST- TRAINING RUN (EXPERIMENT 2).
113
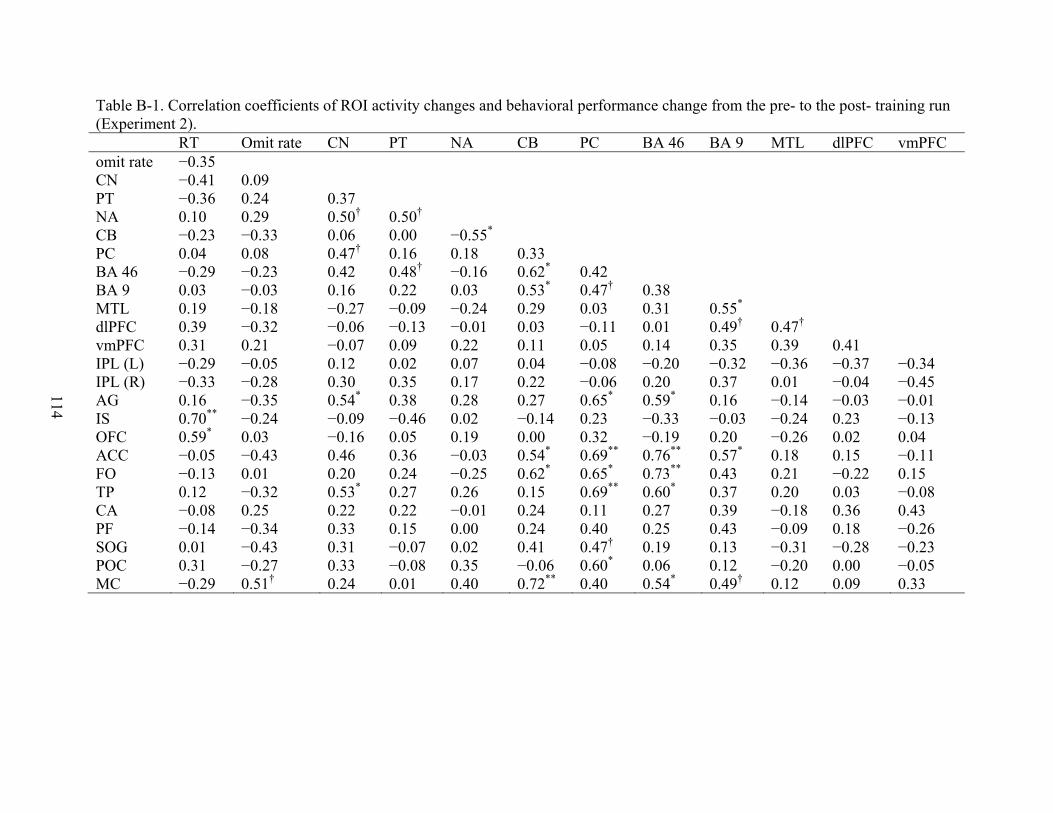
Table B-1. Correlation coefficients of ROI activity changes and behavioral performance change from the pre- to the post- training run (Experiment 2). RT Omit rate CN PT NA CB PC BA 46 BA 9 MTL dlPFC vmPFC omit rate −0.35 CN −0.41 0.09 PT −0.36 0.24 0.37 NA 0.10 0.29 0.50† 0.50† CB −0.23 −0.33 0.06 0.00 −0.55* PC 0.04 0.08 0.47† 0.16 0.18 0.33 BA 46 −0.29 −0.23 0.42 0.48† −0.16 0.62* 0.42 BA 9 0.03 −0.03 0.16 0.22 0.03 0.53* 0.47† 0.38 MTL 0.19 −0.18 −0.27 −0.09 −0.24 0.29 0.03 0.31 0.55* dlPFC 0.39 −0.32 −0.06 −0.13 −0.01 0.03 −0.11 0.01 0.49† 0.47† vmPFC 0.31 0.21 −0.07 0.09 0.22 0.11 0.05 0.14 0.35 0.39 0.41 IPL (L) −0.29 −0.05 0.12 0.02 0.07 0.04 −0.08 −0.20 −0.32 −0.36 −0.37 −0.34 IPL (R) −0.33 −0.28 0.30 0.35 0.17 0.22 −0.06 0.20 0.37 0.01 −0.04 −0.45 AG 0.16 −0.35 0.54* 0.38 0.28 0.27 0.65* 0.59* 0.16 −0.14 −0.03 −0.01 IS 0.70** −0.24 −0.09 −0.46 0.02 −0.14 0.23 −0.33
114
−0.03 −0.24 0.23 −0.13 OFC 0.59* 0.03 −0.16 0.05 0.19 0.00 0.32 −0.19 0.20 −0.26 0.02 0.04 ACC −0.05 −0.43 0.46 0.36 −0.03 0.54* 0.69** 0.76** 0.57* 0.18 0.15 −0.11 FO −0.13 0.01 0.20 0.24 −0.25 0.62* 0.65* 0.73** 0.43 0.21 −0.22 0.15 TP 0.12 −0.32 0.53* 0.27 0.26 0.15 0.69** 0.60* 0.37 0.20 0.03 −0.08 CA −0.08 0.25 0.22 0.22 −0.01 0.24 0.11 0.27 0.39 −0.18 0.36 0.43 PF −0.14 −0.34 0.33 0.15 0.00 0.24 0.40 0.25 0.43 −0.09 0.18 −0.26 SOG 0.01 −0.43 0.31 −0.07 0.02 0.41 0.47† 0.19 0.13 −0.31 −0.28 −0.23 POC 0.31 −0.27 0.33 −0.08 0.35 −0.06 0.60* 0.06 0.12 −0.20 0.00 −0.05 MC −0.29 0.51† 0.24 0.01 0.40 0.72** 0.40 0.54* 0.49† 0.12 0.09 0.33
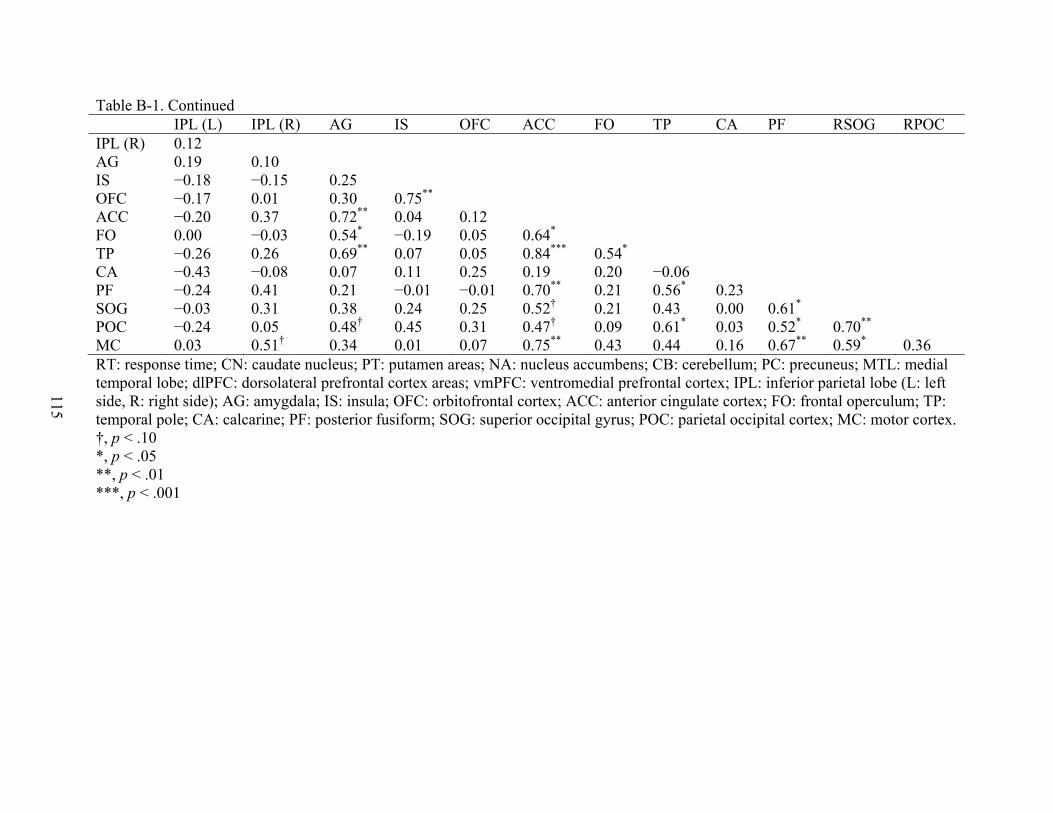
115
Table B-1. Continued IPL (L) IPL (R) AG IS OFC ACC FO TP CA PF RSOG RPOC IPL (R) 0.12 AG 0.19 0.10 IS −0.18 −0.15 0.25 OFC −0.17 0.01 0.30 0.75** ACC −0.20 0.37 0.72** 0.04 0.12 FO 0.00 −0.03 0.54* −0.19 0.05 0.64* TP −0.26 0.26 0.69** 0.07 0.05 0.84*** 0.54* CA −0.43 −0.08 0.07 0.11 0.25 0.19 0.20 −0.06 PF −0.24 0.41 0.21 −0.01 −0.01 0.70** 0.21 0.56* 0.23 SOG −0.03 0.31 0.38 0.24 0.25 0.52† 0.21 0.43 0.00 0.61* POC −0.24 0.05 0.48† 0.45 0.31 0.47† 0.09 0.61* 0.03 0.52* 0.70** MC 0.03 0.51† 0.34 0.01 0.07 0.75** 0.43 0.44 0.16 0.67** 0.59* 0.36 RT: response time; CN: caudate nucleus; PT: putamen areas; NA: nucleus accumbens; CB: cerebellum; PC: precuneus; MTL: medial temporal lobe; dlPFC: dorsolateral prefrontal cortex areas; vmPFC: ventromedial prefrontal cortex; IPL: inferior parietal lobe (L: left side, R: right side); AG: amygdala; IS: insula; OFC: orbitofrontal cortex; ACC: anterior cingulate cortex; FO: frontal operculum; TP: temporal pole; CA: calcarine; PF: posterior fusiform; SOG: superior occipital gyrus; POC: parietal occipital cortex; MC: motor cortex. †, p < .10 *, p < .05 **, p < .01 ***, p < .001
LIST OF REFERENCES
Adolphs, R., Tranel, D., & Damasio, A. R. (1998). The human amygdala in social judgment. Nature, 393, 470-474.
Alexander, G. E., Crutcher, M. D., & DeLong, M. R. (1990). Basal ganglia-thalamocortical circuits: Parallel substrates for motor, oculomotor, “prefrontal” and “limbic” functions. Progress in Brain Research, 85, 119-146.
Anderson, J. R. (1982). Acquisition of cognitive skill. Psychology Review, 89, 369-406.
Baldo, J. V., & Dronkers, N. F. (2006). The role of inferior parietal and inferior frontal cortex in working memory. Neuropsychology, 20, 529-538.
Bargh, J. A., Chaiken, S., Govender, R., & Pratto, F. (1992). The generality of the automatic attitude activation effect. Journal of Personality and Social Psychology, 62, 893-912.
Bargh, J. A., & Ferguson, M. J. (2000). Beyond behaviorism: On the automaticity of higher mental processes. Psychological Bulletin, 126, 925-945.
Bassili, J. N. (1993). Procedural efficiency and the spontaneity of trait inference. Personality and Social Psychology Bulletin, 19, 200-205.
Bechara, A., Damasio, A. R., Damasio, H., & Anderson, S. W. (1994). Insensitivity to future consequences following damage to human prefrontal cortex. Cognition, 50, 7-15.
Bechara, A., Damasio, H., Damasio, A. R., & Lee, G. P. (1999). Different contributions of the human amygdala and ventromedial prefrontal cortex to decision-making. Journal of Neuroscience, 19, 5473-5481.
Berryhill, M. E., & Olson, I. R. (2008). Is the posterior parietal lobe involved in working memory retrieval? Evidence from patients with bilateral parietal lobe damage. doi: 10.1016/j.neuropsychologia.2008.03.005
Brauer, M., Judd, C. M., & Gliner, M. D. (1995). The effects of repeated expressions on attitude polarization during group discussions. Journal of Personality and Social Psychology, 68, 1014-1029.
Breckler, S. J., & Wiggins, E. C. (1989). Affect versus evaluation in the structure of attitudes. Journal of Experimental Social Psychology, 25, 253-271.
Buchel, C., Coull, J. T., & Friston, K. J. (1999). The predictive value of changes in effective connectivity for human learning. Science, 283, 1538-1541.
Burock, M. A., Buckner, R. L., Woldorff, M. G., Rosen, B. R., & Dale, A. M. (1998). Randomized event-related experimental designs allow for extremely rapid presentation rates using functional MRI. Neuroreport, 16, 3735-3739.
116

Cabeza, R., & Nyberg, L. (1997). Imaging cognition: An empirical review of PET studies with normal subjects. Journal of Cognitive Neuroscience, 9, 1-26.
Carlson, R. A., Sullivan, M. A., & Schneider, W. (1989). Practice and working memory effects of building procedural skill. Journal of Experimental Psychology: Learning, Memory, and Cognition, 15, 517-526.
Castelli, L., Zogmaister, C., Smith, E. R., & Arcuri, L. (2004). On the automatic evaluation of social exemplars. Journal of Personality and Social Psychology, 86, 373-387.
Center for the Study of Emotion and Attention [CSEA-NIMH] (2001). The international affective picture system: Digitized photographs. Gainesville, FL, The Center for Research in Psychophysiology, University of Florida.
Critchley, H. D. (2005). Neural mechanisms of autonomic, affective, and cognitive integration. The Journal of Comparative Neurology, 493, 154-166.
Cunningham, W. A., Johnson, M. K., Gatenby, J. C., Gore, J. C., & Banaji, M. R. (2003). Neural components of social evaluation. Journal of Personality and Social Psychology, 85, 639-649.
Cunningham, W. A., Raye, C. L., & Johnson, M. K. (2004). Implicit and explicit evaluation: fMRI correlates of valence, emotional intensity, and control in the processing of attitudes. Journal of Cognitive Neuroscience, 16, 1717-1729.
Cunningham, W. A., & Zelazo, P. D. (2007). Attitudes and evaluations: a social cognitive neuroscience perspective. Trends in Cognitive Sciences, 11, 97-104.
Destrebecqz, A., Peigneux, P., Laureys, S., Degueldre, C., Del Firore, G., Aerts, J., Luxen, A., Van Der Linden, M., Cleeremans, A., & Maquet, P. (2005). The neural correlates of implicit and explicit sequence learning: Interacting networks revealed by the process dissociation procedure. Learning & Memory, 12, 480-490.
Devine, P. G. (1989). Stereotypes and prejudice: Their automatic and controlled components. Journal of Personality and Social Psychology, 56, 5-18.
Doya, K. (1999). What are the computations of the cerebellum, the basal ganglia, and the cerebral cortex. Neural Networks, 12, 961-974.
Doya, K. (2000). Complementary roles of basal ganglia and cerebellum in learning and motor control. Current Opinion in Neurobiology, 10, 732-739.
Doyon, J., Penhune, V., & Ungerleider, L. G. (2003). Distinct contribution of the cortico-striatal and cortico-cerebellar systems to motor skill learning. Neuropsychologia, 41, 252-262.
Eddy, M. D., Schnyer, D. Schmid, A., & Holcomb, P. J. (2007). Spatial dynamics of masked picture repetition effects. NeuroImage, 34, 1723-1732.
117
Egan, G., Silk, T., Zamarripa, F., Williams, J., Federico, P., Cunnington, R., Carabott, L., Blair – West, J., Shade, R., McKinley, M., Farrell, M., Lanscaster, J., Jackson, G., Fox, P., & Denton, D. (2003). Neural correlates of the emergence of consciousness of thirst. Proceedings of the National Academy of Sciences of the United States of America, 100, 15241-15246.
Etkin, A., Egner, T. Peraza, D. M., Kandel, E. R., Hirsch, J. (2006). Resolving emotional conflict: A role for the rostral anterior cingulate cortex in modulating activity in the amygdala. Neuron, 51, 871-882.
Exner, C., Koschack, J., & Irle, E. (2002). The differential role of premotor frontal cortex and basal ganglia in motor sequence learning: Evidence from focal basal ganglia lesions. Learning & Memory, 9, 376-386.
Fazio, R. H., Sanbonmatsu, D. M., Powell, M. C., Kardes, F. R. (1986). On the automatic activation of attitudes. Journal of Personality and Social Psychology, 50, 229-238.
Ferguson, M. J., Bargh, J. A., & Nayak, D. A. (2005). After-affects: How automatic evaluations influence the interpretation of subsequent, unrelated stimuli. Journal of Experimental Social Psychology, 41, 182-191.
Fitts, P. M. (1964). Categories of Human Learning. In Melton, A. W. (Eds.), pp. 243-285, Academic Press.
Friston, K.J., Josephs, O., Rees, G., & Turner, R. (1998). Nonlinear event-related responses in fMRI. Magnetic Resonance Medicine, 39, 41-52.
Gabrieli, J. D. E. Brewer, J. B., Desmond, J. E., & Glover, G. H. (1997). Separate neural bases of two fundamental memory processes in the human medial temporal lobe. Science, 276, 264-266.
Garavan, H., Ross, T. J., & Stein, E. A. (1999). Right hemispheric dominance of inhibitory control: An event-related functional MRI study. Proceedings of the National Academy of Sciences (USA), 96, 8301-8306.
Graybiel, A. M. (2000). The basal ganglia. Current Biology, 10, 509-511.
Graybiel, A. M. (2005). The basal ganglia: Learning new tricks and loving it. Current Opinion in Neurobiology, 15, 638-644.
Greenberg, L. S., & Safran, J. D. (1987). Emotion in psychotherapy: Affect, cognition, and the process of change. New York: Guilford.
Greenwald, A. G., McGhee, D. E., & Schwartz, J. L. K. (1998). Measuring individual differences in implicit cognition: The implicit association test. Journal of Personality and Social Psychology, 74, 1464-1480.
118

Grossman, E. D., Blake, R., & Kim, C. Y. (2004). Learning to see biological motion: Brain activity parallels behavior. Journal of Cognitive Neuroscience, 16, 1669-1679.
Hamann, S. B., Ely, T. D., Hoffman, J. M., & Kilts, C. D. (2002). Ecstacy and agony: activation in the human amygdala in positive and negative emotion. Psychological Science, 13, 135-141.
Hariri, A. R., Mattay, V. S., Tessitore, A., Fera, F., & Weinberger, D. R. (2003). Neocortical modulation of the amygdala response to fearful stimuli. Biological Psychiatry, 53, 494-501.
Haruno, M., Kuroda, T., Doya, K., Toyama, K., Kimura, M., Samejima, K., Irnamizu, H., & Kawato, M. (2004). A neural correlate of reward-based behavioral learning in caudate nucleus: A functional magnetic resonance imaging study of a stochastic decision task. The Journal of Neuroscience, 24, 1660-1665.
Hikosaka, O., Nakamura, K., Sakai, K., & Nakahara, H. (2002). Central mechanisms of motor skill learning. Current Opinion in Neurobiology, 12, 217-222.
Hoshi, E., Tremblay, L., Feger, J., Carras, P. L., & Strick, P. L. (2005). The cerebellum communicates with the basal ganglia. Nature Neuroscience, 8, 1491-1493.
Irwin, W., Davidson, R. J., Lowe, M. J., Mock, B. J., Sorenson, J. A., & Turski, P. A. (1996). Human amygdala activation detected with echo-planar functional magnetic resonance imaging. NeuroReport, 7, 1765-1769.
Jarvis, W.B.G., & Petty, R.E. (1996). The need to evaluate. Journal of Personality and Social Psychology, 70, 172-194.
Kelly, A. M. C., & Garavan, H. (2005). Human functional neuroimaging of brain changes associated with practice. Cerebral Cortex, 15, 1089-1102.
Klingberg, T., O’Sullivan, B. T., & Roland, P. E. (1997). Bilateral activation of fronto-parietal networks by incrementing demand in a working memory task. Cerebral Cortex, 7, 465-471.
Kolers, P. A., & Roediger, H. L. III. (1984). Procedures of mind. Journal of Verbal Learning and Verbal Behavior, 23, 425-449.
Kringelbach, M. L., & Rolls, E. T. (2004). The functional neuroanatomy of the human orbitofrontal cortex: Evidence from neuroimaging and neuropsychology. Progress in Neurobiology, 72, 341-372.
Lane, R. D., Chau, P. M., & Dolan, R. J. (1999). Common effects of emotional valence, arousal and attention on neural activation during visual processing of pictures. Neuropsychologia, 37, 989-997.
119
120
Lane, R. D., Fink, G. R., Chau, P. M-L., & Dolan, R. J. (1997). Neural activation during selective attention to subjective emotional responses. NeuroReport, 8, 3969-3972.
Lang, P. J., Bradley, M. M., & Cuthbert, B. N. (2001). International affective picture system (IAPS): Instruction manual and affective ratings. Technical Report, A-5. Gainesville, FL, The Center for Research in Psychophysiology, University of Florida.
Lehericy, S., Benali, H., Moortele, P.-F. V., Pelegrini-Issac, M., Waechter, T., Ugurbil, K., & Doyon, J. (2005). Distinct basal ganglia territories are engaged in early and advanced motor sequence learning. Proceedings of the National Academy of Sciences of the United States of America, 102, 12566-12571.
Lieberman, M. D., Jarcho, J. M., & Satpute, A. B. (2004). Evidence-based and intuition-based self-knowledge: An fMRI study. Journal of Personality and Social Psychology, 87, 421-435.
Maccotta, L., & Buckner, R. L. (2004). Evidence for neural effects of repetition that directly correlate with behavioral priming. Journal of Cognitive Neuroscience, 16, 1625-1632.
Mallol, R., Barros-Loscertales, A., Lopez, M., Belloch, V., Parcet, M. A., & Avila, C. (2007). Compensatory cortical mechanisms in Parkinson’s disease evidenced with fMRI during the performance of pre-learned sequential movements. Brain Research, 1147, 265-271.
Mather, M., Canli, T., English, T., Whitfield, S., Wais, P., Ochsner, K., Gabrieli, J. D. E., & Carstensen, L. L. (2004). Amygdala responses to emotionally valenced stimuli in older and younger adults. Psychological Science, 15, 259-263.
Morris, J. S., Frith, C. D., Perrett, D. I., Rowland, D., Young, A. W., Calder, A. J., & Dolan, R. J. (1996). A differential neural response in the human amygdala to fearful and happy facial expressions. Nature, 383, 812–815.
Murphy, S. T., & Zajonc, R. B. (1993). Affect, cognition, and awareness: Affective priming with optimal and suboptimal stimulus exposures. Journal of Personality and Social Psychology, 64, 723-739.
Nadel, L., Campell, J., & Ryan, L. (2007). Autobiographical memory retrieval and hippocampal activation as a function of repetition and the passage of time. Neural Plasticity, doi:10.1155/2007/90472.
Neves, D. M., & Anderson, J. R. (1981). Knowledge compilation: Mechanisms for the automatization of cognitive skills. In J. R. Anderson (Ed.), Cognitive skills and their acquisition. Hillsdale, NJ: Erlbaum.
Norris, C. J., Chen, E. E., Zhu, D. C., Small, S. L., & Cacioppo, J. T. (2004). The interaction of social and emotional processes in the brain. Journal of Cognitive Neuroscience, 16, 1818-1829.
Osgood, C. E., Suci, G. J., & Tannenbaum, P. H. (1957). The measurement of meaning. Chicago: University of Illinois Press.
Packard, M. G., & Knowlton, B. J. (2002). Learning and memory functions of the basal ganglia. Annual Review in Neuroscience, 25, 563-593.
Papez, J. W. (1937). A proposed mechanism of emotion. Archives of Neurology & Psychiatry, 38, 725-743.
Peigneux, P., Maquet, P., Meulemans, T., Destrebecqz, A., Laureys, S., Degueldre, C., Delfiore, G., Aerts, J., Luxen, A., Franck, G., Linden, V. M., & Cleeremans, A (2000). Striatum forever, despite sequence learning variability: A random effect analysis of PET data. Human Brain Mapping, 10, 179-194.
Petrides, M. (2007). The orbitofrontal cortex: Novelty, deviation from expectation, and memory. Annals of the New York Academy of Sciences, 1121, 33-53.
Phan, K. L., Taylor, S. F., Welsh, R. C., Ho, S. H., Britton, J. C., & Liberzon, I. (2004). Neural correlates of individual ratings of emotional salience: a trial-related fMRI study. NeuroImage, 21, 768-780.
Poldrack, R. A. (2007). Region of interest analysis for fMRI. Social Cognitive and Affective Neuroscience, 2, 67-70.
Poldrack, R. A., Clark, J., Pare-Blagoev, E. J., Shohamy, D., Creso, M. J., Myers, C., Gluck, M. (2001). Interactive memory systems in the human brain. Nature, 414, 546-550.
Poldrack, R. A., Prabhakaran, V., Seger, C. A., & Gabrieli, J. D. E. (1999). Striatal activation during acquisition of a cognitive skill. Neuropsychology, 13, 564-574.
Ramus, S. J., Davis, J. B., Donahue, R. J., Discenza, C. B., & Waite, A. A. (2007). Interactions between the orbitofrontal cortex and the hippocampal memory system during the storage of long-term memory. Annals of the New York Academy of Sciences, 1121, 216-231.
Reekum, C. M., Urry, H. L., Johnstone, T., Thurow, M. E., Frye, C. J., Jackson, C. A., Schaefer, H. S., Alexander, A. L., & Davidson, R. J. (2007). Individual differences in amygdala and ventromedial prefrontal cortex activity are associated with evaluation speed and psychological well-being. Journal of Cognitive Neuroscience, 19, 237-248.
Rempel-Clower, N. L. (2007). Role of orbitofrontal cortex connections in emotion. Annals of the New York Academy of Sciences, 1121, 72-86.
Rhine, R. J., Hill, S. J., & Wandruff, S. E. (1967). Evaluative responses of preschool children. Child Development, 38, 1035-1042.
Robertson, E. M. (2007). The serial reaction time task: Implicit motor skill learning? The Journal of Neuroscience, 27, 10073-10075.
121
Rose, M., Haider, H., Weiller, C., & Buchel, C. (2004). The relevance of the nature of learned associations for the differentiation of human memory systems. Learning & Memory, 11, 145-152.
Royet, J. P., Plailly, J., Delon-Martin, C., Kareken, D. A., & Segebarth, C. (2003). fMRI of emotional responses to odors: Influence of hedonic valence and judgment, handedness, and gender. Neuroimage, 20, 713-728.
Schimmack, U., & Stephen L. C. Jr. (2005). The Structure of Affect. In Albarracin, D., Johnson, B. T., & Zanna, M. (Eds.), Handbook of attitudes (pp 397-436). Mahwah, NJ: Lawrence Erlbaum Associates.
Schoenbaum, G., & Setlow, B. (2003). Lesions of nucleus accumbens disrupt learning about aversive outcomes. The Journal of Neuroscience, 23, 9833-9841.
Seger, C. A. (2006). The basal ganglia in human learning. Neuroscientist, 12, 285-290.
Seger, C. A., & Cincotta, C. M. (2006). Dynamics of frontal, striatal, and hippocampal systems during rule learning. Cerebral Cortex, 16, 1546-1555.
Serences, J. T. (2004). A comparison of methods for characterizing the event-related BOLD time series in rapid fMRI. Neuroimage, 21, 1690-1700.
Sergerie, K., Lepage, M., & Armony, J. L. (2006). A process-specific functional dissociation of the amygdala in emotional memory. Journal of Cognitive Neuroscience, 18, 1359-1367.
Smith, E. R. (1989). Procedural efficiency: General and specific components and effects on social judgment. Journal of Experimental Social Psychology, 25, 500-523.
Smith, E. R. (1994). Procedural knowledge and processing strategies. In R. S. Wyer, & T. K. Srull (Eds.), Handbook of social cognition (Vol. 1, pp 99-151). Hillsdale, NJ: Lawrence Erlbaum Associates.
Smith, E. R., Branscombe, N. R., & Bormann, C. (1988). Generality of the effects of practice on social judgment tasks. Journal of Personality and Social Psychology, 54, 385-395.
Smith, E. R., Fazio, R. H., & Cejka, M. A. (1996). Accessible attitudes influence categorization of multiple categorizable objects. Journal of Personality and Social Psychology, 71, 888-898.
Smith, E. R., & Lerner, M. (1986). Development of automatism of social judgments. Journal of Personality and Social Psychology, 50, 246-259.
Smith, E. R., Stewart, T. L., & Buttram, R. T. (1992). Inferring a trait from a behavior has long-term, highly specific effects. Journal of Personality and Social Psychology, 62, 753-759.
Soon, C. S., Venkatraman, V., & Chee, M. W. (2003). Stimulus repetition and hemodynamic response refractoriness in event-related fMRI. Human Brain Mapping, 20, 1-12.
122
SPSS for Windows, Rel. 13.0, 2004. Chicago: SPSS Inc.
Squire, L. R., Stark, C. E., & Clark, R. E. (2004). The medial temporal lobe. Annual Review in Neuroscience, 27, 279-306.
Taylor, S. F., Phan, K. L., Decker, L. R., & Liberzon, I. (2003). Subjective rating of emotionally salient stimuli modulates neural activity. NeuroImage, 18, 650-659.
Torriero, S., Oliveri, M., Koch, G., Caltagirone, C., & Petrosini, L. (2004). Interference of left and right cerebellar rTMS with procedural learning. Journal of Cognitive Neuroscience, 16, 1605-1611.
Urry, H. L., van Reekum, C. M., Johnstone, T., Kalin, N. H., Thurow, M. E., Schaefer, H. S., Jackson, C. A., Frye, C. J., Greischar, L. L., Alexander, A. L., & Davidson, R. J. (2006). Amygdala and ventromedial prefrontal cortex are inversely coupled during regulation of negative affect and predict the diurnal pattern of cortisol secretion among older adults. The Journal of Neuroscience, 26, 4415-4425.
Vakil, E., Kahan, S., Huberman, M., & Osimani, A. (2000). Motor and non-motor sequence learning in patients with basal ganglia lesions: the case of serial reaction time (SRT). Neuropsychologia, 38, 1-10.
Willingham, D. B., Salidis, J., & Gabrieli, J. D.E. (2002). Direct comparison of neural systems mediating conscious and unconscious skill learning. Journal of Neurophysiology, 88, 1451-1460.
Winston, J. S., Strange, B. A., O’Doherty, J., & Dolan, R. J. (2002). Automatic and intentional brain responses during evaluation of trustworthiness of faces. Nature Neuroscience, 5, 277-283.
Wright, P., Albarracin, D., Brown, R. D., Li, H., He, G., & Liu, Y. (2008). Dissociated responses in the amygdala and orbitofrontal cortex to bottom-up and top-down components of emotional evaluation. NeuroImage, 39, 894-902.
Wright, P., & Liu, Y. (2005). Neutral faces activate the amygdala during identity matching. NeuroImage, 29, 628-636.
Wyer, R. S., & Srull, T. K. (1989). Memory and cognition in its social context. Hillsdale, NJ: Lawrence Erlbaum.
Zajonc, R. B. (1980). Feeling and thinking: Preferences need no inferences. American Psychologist, 35, 151-175.
123
124
BIOGRAPHICAL SKETCH
Hong Li has a Bachelor of Engineering degree from the Qingdao University, China,
majoring in electrical engineering, and a Master of Education degree from the Peking University,
China, majoring in personality and social psychology. She joined the Ph.D. program of social
psychology at the University of Florida in August 2003, and received her Master of Science
degree, majoring in social psychology, in August 2005. Hong Li will receive her Doctor of
Philosophy degree, majoring in social psychology, in December 2008.