Embed Size (px)
Citation preview

SSRG International Journal of Civil Engineering (SSRG-IJCE) – Volume 6 Issue 5–May 2019
ISSN: 2348 – 8352 www.internationaljournalssrg.org Page 16
Behavior of Reinforced Concrete Planted
Columns Supported on Reinforced Concrete
Beams Ahmed S. Rashed
1 and Heba M. Issa
2
1Civil Engineering Department, Higher Institute of Engineering, El-Shorouk City, Cairo, Egypt 2Reinforced Concrete Research Institute, Housing and Building National Research Center, HRBC, Cairo, Egypt
Abstract
Changing columns positions or its directions
through different floors levels may cause many
problems if not taken in design considerations.
Unfortunately, there are no specifications or design
requirements in the different codes of practice for the
design of beams that have planted columns. The goal
of this theoretical investigation is to specify the behavior of the planted column-beam connection
taking in considerations the beam width, the direction
of the column, its dimensions, and shear
reinforcement distributions. Therefore, a three-
dimensional nonlinear finite element analysis was
carried out for 17 models sorted in 5 groups. It was
observed that longer side of the planted column
direction which is perpendicular to the beam span
had a better behavior in failure load and deflection
than it was parallel to the beam span. Also, the
planted column length preferred to be taken the same as the beam width for better behavior.
Keywords - supported beams; planted columns;
shear stresses; bending stresses.
I. INTRODUCTION
Columns are the most critical compression
members which transmit loads from the top level to
the lowers and then to the soil passing through the
foundations. A planted column is a vertical
compression member that is supported on a non-axial
bearing member such as slabs or beams to be able to
answer the structural requirements without sacrificing
interior and architectural needs. Unfortunately, there are not many studies about the behavior of planted
columns and the supported beam.
Hansapinyo et al. (2003) [1], have an
experimental study on thirteen reinforced concrete
beams with square and rectangular cross sections to
study ultimate capacity under bi-axial shear loading,
and the ultimate bi-axial shear capacities of concrete
and shear reinforcement were defined separately. The
estimations of bi-axial shear capacity of the shear
reinforcement for rectangular sections gave the value
in the rage of 0.88-1.27 of the tests. Also, the ellipse formula was underestimated bi-axial shear
capacity.While it was overestimated the bi-axial shear
capacity of shear reinforcement of specimens with a
rectangular section in which a model to calculate shear
reinforcement capacity is formulated based on
diagonal crack configuration. Waryosh et al. (2014)
[2] had tested four reinforced concrete beams with
variation in shear reinforcement ratio, the ellipse
interaction relation results seem to underestimate bi-
axial shear capacity of concrete about (119 to 188%)
and (43 to 50%) according to ACI and JSCE design
codes respectively, while overestimate bi-axial shear capacity of shear reinforcement of reinforced concrete
members with rectangular cross sections by the range
of (21) to (6) % and (25) to (11) % according to ACI
and JSCE code, respectively.
Chaisomphob et al. (2003) [3], made an
experimental study on four reinforced concrete
members to study the mode of failure and failure load
of a reinforced concrete beam with a rectangular
cross-section under combined of bi-axial shear load
accompanied with a torsional moment. The results
showed that as the torsional moment increased to about 69%, the bi-axial shear capacity decreased to
about 12% to 39% based on the ratio of bi-axial
shears.
The use of Finite Element Methods in the
reinforced concrete beams analysis has become a very
useful and handy tool in modern times due to the
emergence of powerful computers. The use of Finite
Element Analysis is high-speed and economical as
compared to laboratory testing.
A. Objective
The main goal of this theoretical investigation is
to study the load capacity and deflection behavior of
planted columns supported on beams that have been
tested in the laboratory.Accordingly, to achieve these
objected, seventeen finite element models dividedinto
five groups.
B. Analytical program
The analytical program performed through this
study began with the element types, model’s details
and models’ grouping.A nonlinear finite element
model (ANSYS 14package) [4] was used to closely
foretell the behavior of the reinforced concrete beam
carrying a planted column.
ISSN: 2348 – 8352 www.internationaljournalssrg.org Page 2
a). Elements types
1). The concrete element Concrete in compression: the idealized stress-
strain curve based on the Egyptian Code of Practice
(ECP 203-07) [5] can be used for representing the
actual behavior of concrete in compression. It
consists of a parabola up to a strain of 0.002 and
straight horizontal line up to a strain of 0.003.
SOLID65, the solid element used to model the
concrete has eight nodes with three degrees of
freedom at each node and translations in the nodal x,
y, and z directions. This element is capable of predicting cracking in three orthogonal directions,
crushing, creep and plastic deformation.The
"SOLID65" element requires linear and multi-linear
isotropic material properties to model the concrete.
"Willam et al. (1974) [6] use the multi-linear
isotropic material, model to define the failure of the
concrete and "ACI code, MacGregor (2011) [7]" use
the multi-linear isotropic compressive stress-strain
curve in the concrete model according to.
The model is capable of foretelling failure ofthe
concrete as shown in Figure1, where cracking and crushing failure modes were taken into consideration.
Figure1: the surface of the concrete failure
In concrete element, when the principal tensile
stress in any directions lies outside the failure surface
the cracking occurs. After cracking, Young's modulus
of the concrete element was set to zero in the
direction parallel to the principal tensile stress
direction. When all principal stresses are compressive
and lie outside the failure surface the crushing occurs.
After that, Young's modulus again was set to zero but
in all directions, and the element effectively
disappears.Material model in “ANSYS (14)”[4]
requires defining the properties of concrete as shown in Table (1), also multi-linear isotropic stress-strain
curve shown in Table (2).
Table1 :Materials properties for concrete
Property
Ec (N/mm2
)
σcu (N/mm
2)
σtu (N/m
m2)
υ
βr (opene
d crack)
βr (closed
crack)
Model 22000 25 3 0.2
0.2 1.0
Table2 : Multi-linear isotropic stress-strain curve for
the concrete curve used in modeling
2). The reinforcement element
The mechanical properties of steel are familiar
and understood. Reinforcement steel is homogeneous
material and usually has the same yield strength in
tension and compression. In the present study
reinforcing steel is modeled a bilinear elastoplastic
material essentially using the idealized stress-strain
curve.
A 3-D element (LINK180) was used to model
the steel. LINK180 is a uniaxial tension-compression
element with three degrees of freedoms at each node,
translations in the nodal x, y, and z directions.
Inhinged joint structure, no bending of the element is
considered. The summary of material properties for
the reinforcement steel are in Table (3).
Table3: Material properties for the reinforcement
Property Es
(N/mm2) Elastic
modulus Fy
(N/mm2) Υ
Reinforcement
200000 0.0 360 0.30
Steel plates 200000 0.0 --- 0.30
3). Steel plate's element
SOLID65, was used for the steel plates where
were added at loading and supportspoints in the
models to provide even stress distribution over the
loading areas and prevent local failure of concrete at
these points.
b). Main Parameters
The main parameters taken into consideration
are: 1. Beambreadth (b).
2. Planted column's longer side
direction according to the beam.
3. Vertical shear reinforcement. In
order to study these parameters.
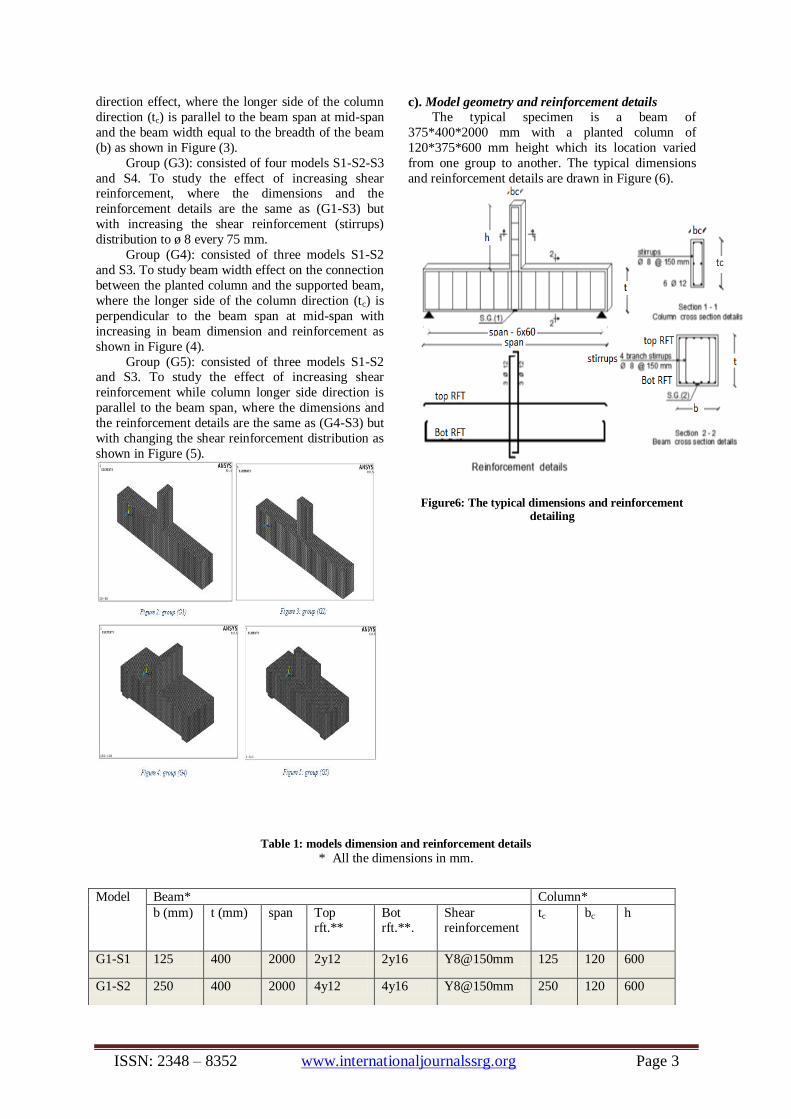
Five groups is assumed and shown in Table (4).
Group (G1): consisted of four models S1-S2-S3and S4. To study beam width effect on the
connection between the planted column and
supported beam, where the longer side of the column
direction (tc) is perpendicular to the beam span at
mid-span, and the beam width is equal to the breadth
of the supported beam (b) as shown in Figure (2).
Group (G2): consisted of four models S1-S2-
S3and S4. To study the effect of column's longer side
Point 1 2 3 4 5 6 7 8 9 10
Stress 8.36
10.0
12.0
14.0
16.0
18.0
20.00
22.0
25.0
25.0
Strain *10-6
380 470
580
690
820
960
1310
1350
2520
2500
ISSN: 2348 – 8352 www.internationaljournalssrg.org Page 3
direction effect, where the longer side of the column
direction (tc) is parallel to the beam span at mid-span
and the beam width equal to the breadth of the beam
(b) as shown in Figure (3).
Group (G3): consisted of four models S1-S2-S3
and S4. To study the effect of increasing shear reinforcement, where the dimensions and the
reinforcement details are the same as (G1-S3) but
with increasing the shear reinforcement (stirrups)
distribution to ø 8 every 75 mm.
Group (G4): consisted of three models S1-S2
and S3. To study beam width effect on the connection
between the planted column and the supported beam,
where the longer side of the column direction (tc) is
perpendicular to the beam span at mid-span with
increasing in beam dimension and reinforcement as
shown in Figure (4).
Group (G5): consisted of three models S1-S2 and S3. To study the effect of increasing shear
reinforcement while column longer side direction is
parallel to the beam span, where the dimensions and
the reinforcement details are the same as (G4-S3) but
with changing the shear reinforcement distribution as
shown in Figure (5).
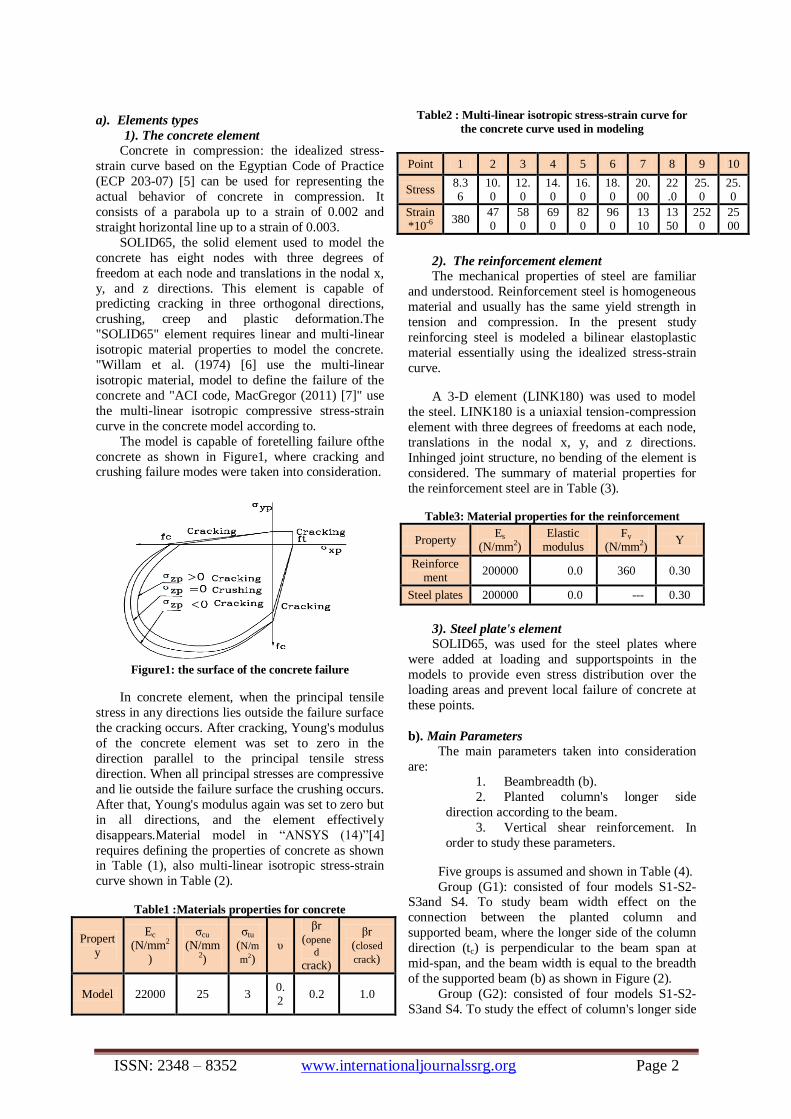
c). Model geometry and reinforcement details
The typical specimen is a beam of
375*400*2000 mm with a planted column of
120*375*600 mm height which its location varied
from one group to another. The typical dimensions
and reinforcement details are drawn in Figure (6).
Figure6: The typical dimensions and reinforcement detailing
Table 1: models dimension and reinforcement details
* All the dimensions in mm.
Model Beam* Column*
b (mm) t (mm) span Top rft.**
Bot rft.**.
Shear reinforcement
tc bc h
G1-S1 125 400 2000 2y12 2y16 Y8@150mm 125 120 600
G1-S2 250 400 2000 4y12 4y16 Y8@150mm 250 120 600
ISSN: 2348 – 8352 www.internationaljournalssrg.org Page 2
** y represent steel grade 36/52
D. Finite Element Results, Analysis, and Discussions
The following factors were recorded for each
model:
1. Failure load.
2. Maximum Deflection at mid-span of the
supported beam. 3. Cracks propagations.
Table 2: results of the group (G1)
a). Effect of changing of beam width
Table (5) shows group (G1) failure load and its
deflection value at the mid-span of the supported
beam, It can be concluded that the increasein beam
width of the supported beam which has a planted
column perpendicular to the beam span is linearly
directly proportional to the failure with less
deflection values as shown in Figures (7)&(8).
G1-S3 375 400 2000 6y12 6y16 Y8@150mm 375 120 600
G1-S4 500 400 2000 8y12 8y16 Y8@150mm 500 120 600
G2-S1 125 400 2000 2y12 2y16 Y8@150mm 125 120 600
G2-S2 250 400 2000 4y12 4y16 Y8@150mm 250 120 600
G2-S3 375 400 2000 6y12 6y16 Y8@150mm 375 120 600
G2-S4 500 400 2000 8y12 8y16 Y8@150mm 500 120 600
G3-S1 375 400 2000 6y12 6y16 Y8@150mm 375 120 600
G3-S2 375 400 2000 6y12 6y16 Y8@125mm 375 120 600
G3-S3 375 400 2000 6y12 6y16 Y8@100mm 375 120 600
G3-S4 375 400 2000 6y12 6y16 Y8@75mm 375 120 600
G4-S1 1000 1000 4000 10y12 10y16 Y8@150mm 1000 300 1000
G4-S2 1200 1000 4000 12y12 12y16 Y8@125mm 1200 300 1000
G4-S3 1500 1000 4000 15y12 15y16 Y8@100mm 1500 300 1000
G5-S1 1500 1000 4000 15y12 15y16 Y8@150mm 1500 300 1000
G5-S2 1500 1000 4000 15y12 15y16 Y8@125mm 800 300 1000
G5-S3 1500 1000 4000 15y12 15y16 Y8@100mm 800 300 1000
Model Code G1-S1 G1-S2 G1-S3 G1-S4
beam width/beam depth 0.3125 0.625 0.9375 1.25
Failure load (kN). 136.95 272.9 389.3 509.5
Max. deflection at mid-span in (mm) 10.19 9.96 9.31 9.10

SSRG International Journal of Civil Engineering (SSRG-IJCE) – Volume 6 Issue 5–May 2019
ISSN: 2348 – 8352 www.internationaljournalssrg.org Page 1
Figure 7: relation bet. load& b/t for G1 Figure 8: relations bet.deflection& b/t for G1
b) Effects of changingthe column’s longer side
direction
Table (6) shows group (G2) failure load and its
deflection at the middle of the supported beam, It can
be concluded that, As increasing the beam width
ratio which leads to increase the failure load but with
less failure loads rate compared by group (1) as
shown in Figure (11) . Figures (9) & (10) show the
relationship between the failure load and max
deflections with (b/t). The relation is almost constant
after the first point with absolutely the same values
of deflection at the failure load.
Table 3: results of the group (G2)
Model Code G2-S1 G2-S2 G2-S3 G2-S4
Beam width/Beam depth 0.3125 0.625 0.9375 1.25
Failure load (kN) 136.95 191.1 293.1 388.2
Maximum def.at mid-span in (mm) 10.19 6.764 6.80 6.857
Figure 9: relation bet. load& b/t for G2 Figure 10: relation bet. deflection& b/t for G2
It can be concluded that the changing of column
direction of the planted column in the group (2) to be the
column length parallel to beam span at the center line of the beam has a significant drop on the beam capacity with about
23.8% compared by Group (1). There is less propagation of
cracks and less deflection values at the failure load
compared by the models of Group (1). Figure 11: the relation between load & b/t for G1&
G2
ISSN: 2348 – 8352 www.internationaljournalssrg.org Page 2
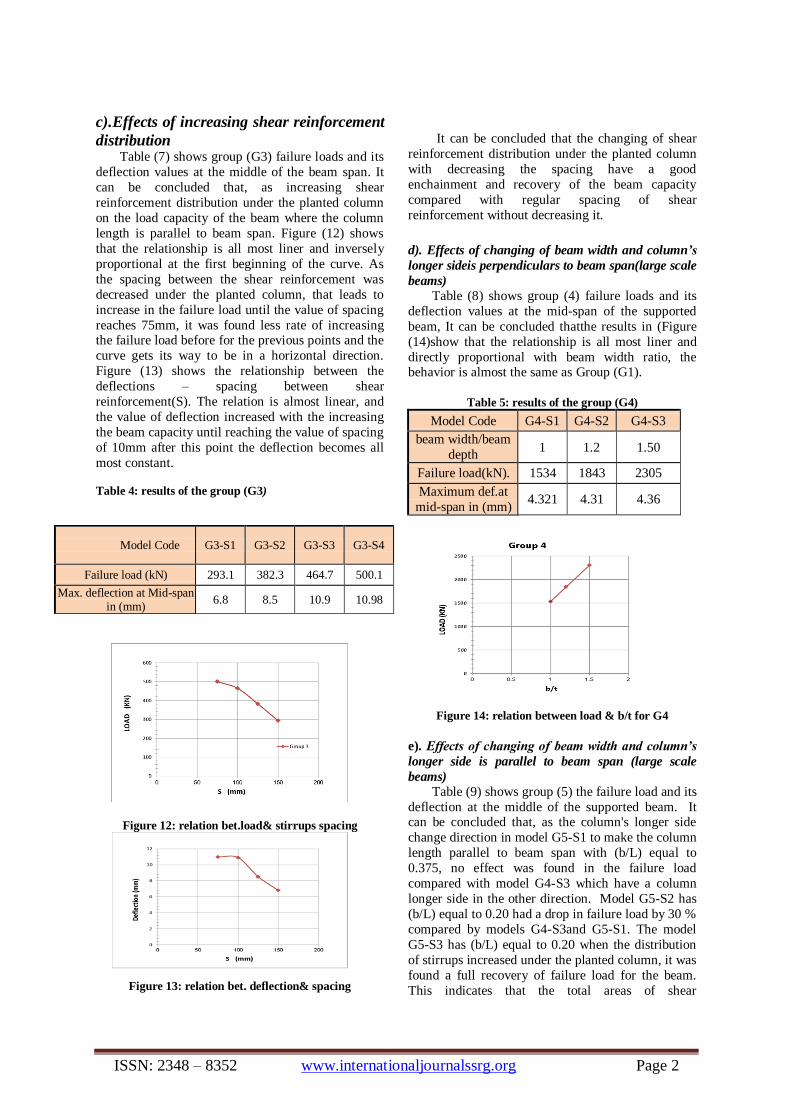
c).Effects of increasing shear reinforcement
distribution Table (7) shows group (G3) failure loads and its
deflection values at the middle of the beam span. It
can be concluded that, as increasing shear
reinforcement distribution under the planted column
on the load capacity of the beam where the column
length is parallel to beam span. Figure (12) shows
that the relationship is all most liner and inversely
proportional at the first beginning of the curve. As
the spacing between the shear reinforcement was
decreased under the planted column, that leads to
increase in the failure load until the value of spacing
reaches 75mm, it was found less rate of increasing the failure load before for the previous points and the
curve gets its way to be in a horizontal direction.
Figure (13) shows the relationship between the
deflections – spacing between shear
reinforcement(S). The relation is almost linear, and
the value of deflection increased with the increasing
the beam capacity until reaching the value of spacing
of 10mm after this point the deflection becomes all
most constant.
Table 4: results of the group (G3)
Figure 12: relation bet.load& stirrups spacing
Figure 13: relation bet. deflection& spacing
It can be concluded that the changing of shear
reinforcement distribution under the planted column
with decreasing the spacing have a good
enchainment and recovery of the beam capacity
compared with regular spacing of shear
reinforcement without decreasing it.
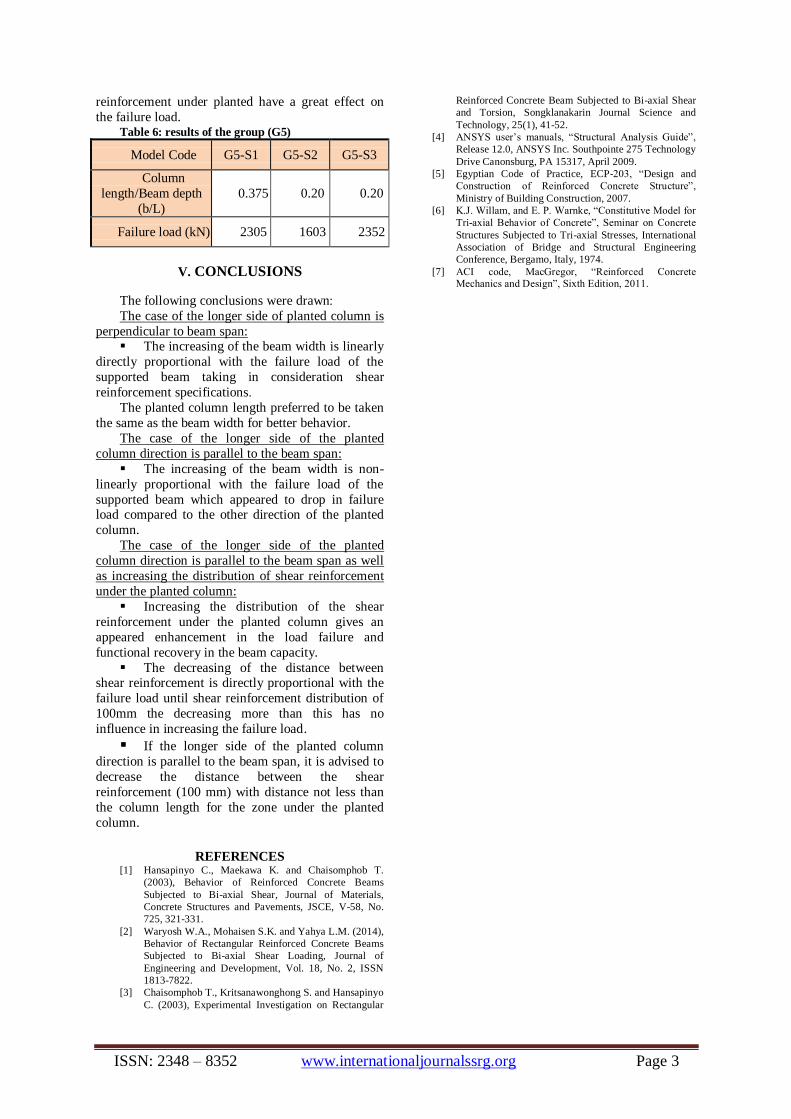
d). Effects of changing of beam width and column’s
longer sideis perpendiculars to beam span(large scale
beams)
Table (8) shows group (4) failure loads and its
deflection values at the mid-span of the supported
beam, It can be concluded thatthe results in (Figure
(14)show that the relationship is all most liner and
directly proportional with beam width ratio, the behavior is almost the same as Group (G1).
Table 5: results of the group (G4)
Model Code G4-S1 G4-S2 G4-S3
beam width/beam
depth 1 1.2 1.50
Failure load(kN). 1534 1843 2305
Maximum def.at
mid-span in (mm) 4.321 4.31 4.36
Figure 14: relation between load & b/t for G4
e). Effects of changing of beam width and column’s
longer side is parallel to beam span (large scale
beams)
Table (9) shows group (5) the failure load and its
deflection at the middle of the supported beam. It can be concluded that, as the column's longer side
change direction in model G5-S1 to make the column
length parallel to beam span with (b/L) equal to
0.375, no effect was found in the failure load
compared with model G4-S3 which have a column
longer side in the other direction. Model G5-S2 has
(b/L) equal to 0.20 had a drop in failure load by 30 %
compared by models G4-S3and G5-S1. The model
G5-S3 has (b/L) equal to 0.20 when the distribution
of stirrups increased under the planted column, it was
found a full recovery of failure load for the beam.
This indicates that the total areas of shear
Model Code G3-S1 G3-S2 G3-S3 G3-S4
Failure load (kN) 293.1 382.3 464.7 500.1
Max. deflection at Mid-span in (mm)
6.8 8.5 10.9 10.98
ISSN: 2348 – 8352 www.internationaljournalssrg.org Page 3
reinforcement under planted have a great effect on
the failure load. Table 6: results of the group (G5)
Model Code G5-S1 G5-S2 G5-S3
Column
length/Beam depth
(b/L)
0.375 0.20 0.20
Failure load (kN) 2305 1603 2352
V. CONCLUSIONS
The following conclusions were drawn:
The case of the longer side of planted column is
perpendicular to beam span: The increasing of the beam width is linearly
directly proportional with the failure load of the
supported beam taking in consideration shear
reinforcement specifications.
The planted column length preferred to be taken
the same as the beam width for better behavior.
The case of the longer side of the planted
column direction is parallel to the beam span:
The increasing of the beam width is non-
linearly proportional with the failure load of the
supported beam which appeared to drop in failure load compared to the other direction of the planted
column .
The case of the longer side of the planted
column direction is parallel to the beam span as well
as increasing the distribution of shear reinforcement
under the planted column:
Increasing the distribution of the shear
reinforcement under the planted column gives an
appeared enhancement in the load failure and
functional recovery in the beam capacity.
The decreasing of the distance between shear reinforcement is directly proportional with the
failure load until shear reinforcement distribution of
100mm the decreasing more than this has no
influence in increasing the failure load .
If the longer side of the planted column
direction is parallel to the beam span, it is advised to
decrease the distance between the shear
reinforcement (100 mm) with distance not less than
the column length for the zone under the planted
column.
REFERENCES [1] Hansapinyo C., Maekawa K. and Chaisomphob T.
(2003), Behavior of Reinforced Concrete Beams
Subjected to Bi-axial Shear, Journal of Materials,
Concrete Structures and Pavements, JSCE, V-58, No.
725, 321-331.
[2] Waryosh W.A., Mohaisen S.K. and Yahya L.M. (2014),
Behavior of Rectangular Reinforced Concrete Beams
Subjected to Bi-axial Shear Loading, Journal of
Engineering and Development, Vol. 18, No. 2, ISSN
1813-7822.
[3] Chaisomphob T., Kritsanawonghong S. and Hansapinyo
C. (2003), Experimental Investigation on Rectangular
Reinforced Concrete Beam Subjected to Bi-axial Shear
and Torsion, Songklanakarin Journal Science and
Technology, 25(1), 41-52.
[4] ANSYS user’s manuals, “Structural Analysis Guide”,
Release 12.0, ANSYS Inc. Southpointe 275 Technology
Drive Canonsburg, PA 15317, April 2009.
[5] Egyptian Code of Practice, ECP-203, “Design and
Construction of Reinforced Concrete Structure”,
Ministry of Building Construction, 2007.
[6] K.J. Willam, and E. P. Warnke, “Constitutive Model for
Tri-axial Behavior of Concrete”, Seminar on Concrete
Structures Subjected to Tri-axial Stresses, International
Association of Bridge and Structural Engineering
Conference, Bergamo, Italy, 1974.
[7] ACI code, MacGregor, “Reinforced Concrete Mechanics and Design”, Sixth Edition, 2011.