Embed Size (px)
Citation preview

IOSR Journal of Mechanical and Civil Engineering (IOSR-JMCE)
e-ISSN: 2278-1684,p-ISSN: 2320-334X, Volume 14, Issue 1 Ver. III (Jan. - Feb. 2017), PP 28-41
www.iosrjournals.org
DOI: 10.9790/1684-1401032841 www.iosrjournals.org 28 | Page
Evaluation of the Seismic Response Parameters for Infilled
Reinforced Concrete Frame Buildings
Dina Hesham Mohamed Helmy1, Hussein Okail
2, Mostafa Zidan
3
1Graduate Researcher, Structural Engineering Department, Faculty of Engineering, Ain Shams University,
Cairo, Egypt 2Associate Professor of structural engineering, Structural Engineering Department, Faculty of Engineering, Ain
Shams University, Cairo, Egypt 3Professor of structural engineering, Structural Engineering Department, Faculty of Engineering and
Technology, Future University, Cairo, Egypt
Abstract: RC frames with unreinforced masonry infill walls are a common form of construction all around the
world. Often, engineers do not consider masonry infill walls in the design process because the final distribution
of these elements may be unknown to them, or because masonry walls are regarded as non-structural elements.
Separation between masonry walls and frames is often not provided and, as a consequence, walls and frames
interact during strong ground motion. This leads to structural response deviating radically from what is
expected in the design. The presence of masonry infills can result in higher stiffness and strength and it is cheap
and built with low cost labor. Under lateral load, Masonry walls act as diagonal struts subjected to
compression, while reinforced concrete confining members (Frames) act in tension and/or compression,
depending on the direction of lateral earthquake forces. The main objective of this research is to develop a
realistic matrix for the response modification factors for medium-rise skeletal buildings with masonry infills. In
this study, the contribution of the masonry infill walls to the lateral behavior of reinforced concrete buildings
was investigated. For this purpose, a five, seven and ten stories buildings are modelled as bare and infilled
frames. The parameters investigated were infill ratio, panel aspect ratio, unidirectional eccentricity,
bidirectional eccentricities. A Parametric study was developed on the behavior of medium rise infilled frame
buildings under lateral loads to investigate the effect of these parameters as well as infill properties on this
behavior.
Keywords: Diagonal struts, Infill, Masonry, Response modification.
I. Introduction Infilled reinforced concrete (RC) frames are reinforced concrete frames with unreinforced masonry
infill walls. These structures are amongst the most common structural forms for low to medium-rise buildings in
the world. For infilled frame buildings, infill panels are used as partitions, whereas the bounding frame is
designed as a structural skeleton to withstand gravity and lateral loading. Masonry structural walls are usually
used by architects for its aesthetic qualities but it also contributes in resisting lateral loads such as wind loads
and seismic loads. Design engineers consider infills as non-structural components and neglect its influence on
the overall structural performance. Thus, the actual performance of infilled RC frames will differ from the
expected performance based on the structural analyses. However, the structural behavior of infilled frames and
bare frames structures differ because the presence of infills, regularly and irregularly arranged infills, can
significantly alter local stress distributions in the adjacent frame members and vary the overall structural
dynamic behavior. Furthermore, the brittle nature of masonry infill materials often imposes more harm on the
hysteretic behavior of structures and causes severe localized damage in the adjacent braced structural members
under reversed cyclic loading. Consequently design engineers should consider the effect of infills on the overall
structural performance in their analyses. This research presents an analytical program conducted to assess the
structural performance of infilled reinforced concrete frames buildings with different configurations under
lateral loads and study their dynamic response. Also the seismic response modification factors will be evaluated
for those buildings according to FEMA 695 [1]. And a realistic response modification factors matrix will be
proposed for medium-rise infilled frames buildings.
1.1 Load Transfer Mechanism Infills contribute in the resistance of the lateral deformations of the RC frame; it acts as a diagonal
compression strut. Thus, infills add lateral stiffness to the building. The structural load transfer mechanism is
changed from frame action to truss action as shown in Fig.1; the columns of the frame now bear increased axial
forces but with reduced bending moments and shear forces.
Evaluation of the Seismic Response Parameters for Infilled Reinforced Concrete Frame Buildings
DOI: 10.9790/1684-1401032841 www.iosrjournals.org 29 | Page
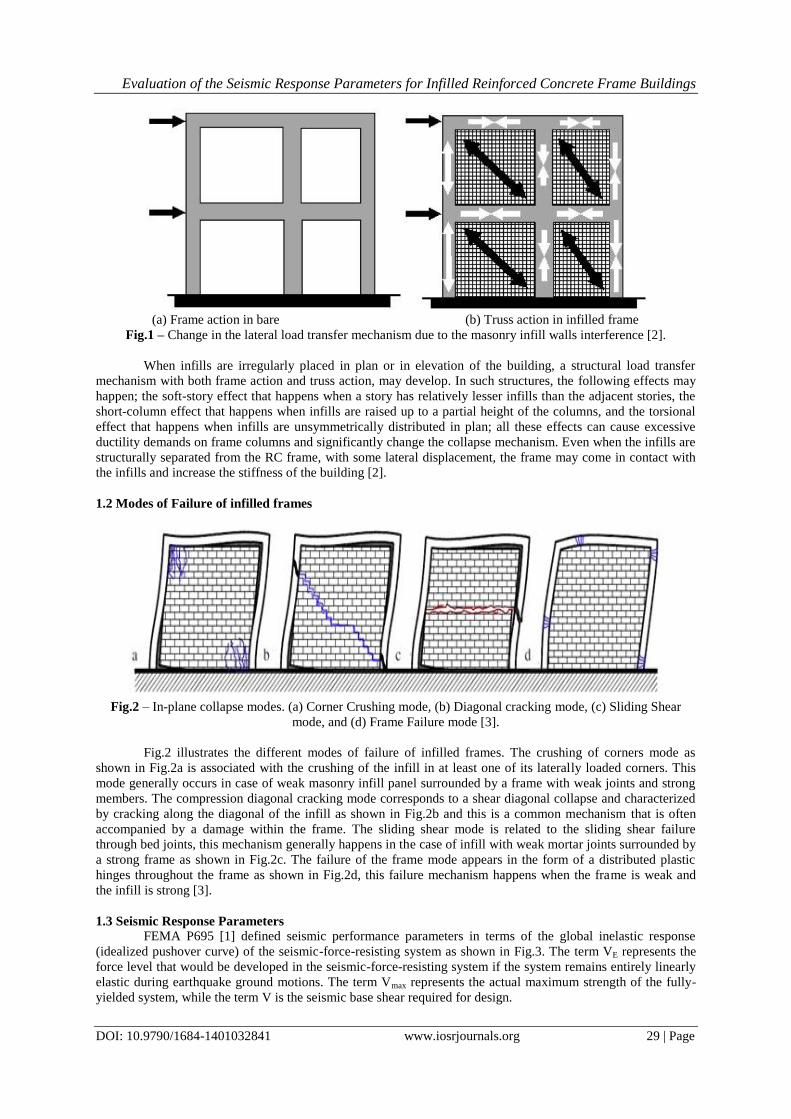
(a) Frame action in bare (b) Truss action in infilled frame
Fig.1 – Change in the lateral load transfer mechanism due to the masonry infill walls interference [2].
When infills are irregularly placed in plan or in elevation of the building, a structural load transfer
mechanism with both frame action and truss action, may develop. In such structures, the following effects may
happen; the soft-story effect that happens when a story has relatively lesser infills than the adjacent stories, the
short-column effect that happens when infills are raised up to a partial height of the columns, and the torsional
effect that happens when infills are unsymmetrically distributed in plan; all these effects can cause excessive
ductility demands on frame columns and significantly change the collapse mechanism. Even when the infills are
structurally separated from the RC frame, with some lateral displacement, the frame may come in contact with
the infills and increase the stiffness of the building [2].
1.2 Modes of Failure of infilled frames
Fig.2 – In-plane collapse modes. (a) Corner Crushing mode, (b) Diagonal cracking mode, (c) Sliding Shear
mode, and (d) Frame Failure mode [3].
Fig.2 illustrates the different modes of failure of infilled frames. The crushing of corners mode as
shown in Fig.2a is associated with the crushing of the infill in at least one of its laterally loaded corners. This
mode generally occurs in case of weak masonry infill panel surrounded by a frame with weak joints and strong
members. The compression diagonal cracking mode corresponds to a shear diagonal collapse and characterized
by cracking along the diagonal of the infill as shown in Fig.2b and this is a common mechanism that is often
accompanied by a damage within the frame. The sliding shear mode is related to the sliding shear failure
through bed joints, this mechanism generally happens in the case of infill with weak mortar joints surrounded by
a strong frame as shown in Fig.2c. The failure of the frame mode appears in the form of a distributed plastic
hinges throughout the frame as shown in Fig.2d, this failure mechanism happens when the frame is weak and
the infill is strong [3].
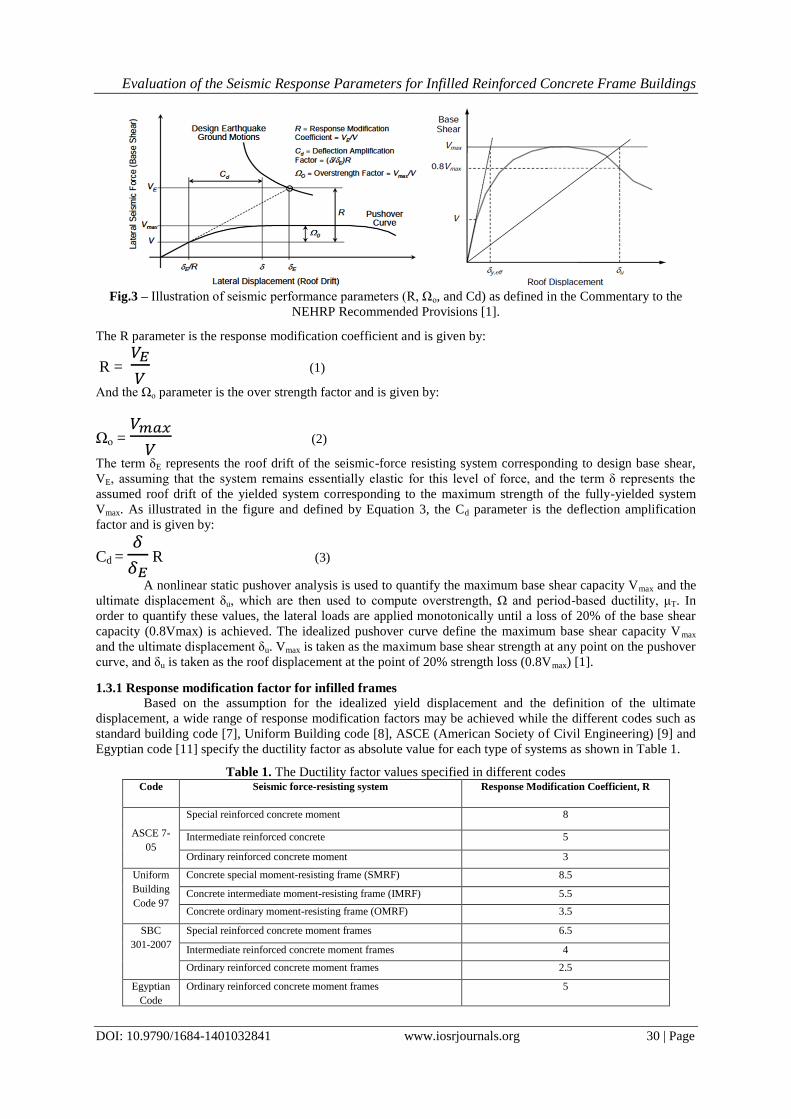
1.3 Seismic Response Parameters FEMA P695 [1] defined seismic performance parameters in terms of the global inelastic response
(idealized pushover curve) of the seismic-force-resisting system as shown in Fig.3. The term VE represents the
force level that would be developed in the seismic-force-resisting system if the system remains entirely linearly
elastic during earthquake ground motions. The term Vmax represents the actual maximum strength of the fully-
yielded system, while the term V is the seismic base shear required for design.
Evaluation of the Seismic Response Parameters for Infilled Reinforced Concrete Frame Buildings
DOI: 10.9790/1684-1401032841 www.iosrjournals.org 30 | Page
Fig.3 – Illustration of seismic performance parameters (R, Ωο, and Cd) as defined in the Commentary to the
NEHRP Recommended Provisions [1].
The R parameter is the response modification coefficient and is given by:
R =
(1)
And the Ωο parameter is the over strength factor and is given by:
Ωο =
(2)
The term δE represents the roof drift of the seismic-force resisting system corresponding to design base shear,
VE, assuming that the system remains essentially elastic for this level of force, and the term δ represents the
assumed roof drift of the yielded system corresponding to the maximum strength of the fully-yielded system
Vmax. As illustrated in the figure and defined by Equation 3, the Cd parameter is the deflection amplification
factor and is given by:
Cd =
R (3)
A nonlinear static pushover analysis is used to quantify the maximum base shear capacity Vmax and the
ultimate displacement δu, which are then used to compute overstrength, Ω and period-based ductility, μT. In
order to quantify these values, the lateral loads are applied monotonically until a loss of 20% of the base shear
capacity (0.8Vmax) is achieved. The idealized pushover curve define the maximum base shear capacity Vmax
and the ultimate displacement δu. Vmax is taken as the maximum base shear strength at any point on the pushover
curve, and δu is taken as the roof displacement at the point of 20% strength loss (0.8Vmax) [1].
1.3.1 Response modification factor for infilled frames Based on the assumption for the idealized yield displacement and the definition of the ultimate
displacement, a wide range of response modification factors may be achieved while the different codes such as
standard building code [7], Uniform Building code [8], ASCE (American Society of Civil Engineering) [9] and
Egyptian code [11] specify the ductility factor as absolute value for each type of systems as shown in Table 1.
Table 1. The Ductility factor values specified in different codes Code Seismic force-resisting system Response Modification Coefficient, R
ASCE 7-
05
Special reinforced concrete moment
frames
8
Intermediate reinforced concrete
moment frames
5
Ordinary reinforced concrete moment
frames
3
Uniform
Building
Code 97
Concrete special moment-resisting frame (SMRF)
8.5
Concrete intermediate moment-resisting frame (IMRF) 5.5
Concrete ordinary moment-resisting frame (OMRF) 3.5
SBC
301-2007
Special reinforced concrete moment frames 6.5
Intermediate reinforced concrete moment frames 4
Ordinary reinforced concrete moment frames 2.5
Egyptian
Code
Ordinary reinforced concrete moment frames 5

Evaluation of the Seismic Response Parameters for Infilled Reinforced Concrete Frame Buildings
DOI: 10.9790/1684-1401032841 www.iosrjournals.org 31 | Page
II. Analytical program Modelling of masonry infill panels requires a detailed description of materials. Masonry is a brittle
material that is characterized by special directional properties due to the mortar joints which act as plane of
weakness. Several trials in the analysis of infilled frames since Mid-1950 have yielded several analytical
models. These analytical models can be classified as macro and micro models depending on their complexity,
the detail by which they model an infill wall, and the information they provide concerning the behavior of the
structure [4]. A basic characteristic of a macro-model is that it tries to include the overall global behavior of a
structural element without modelling all the possible modes of local failure. On the other hand, micro-models
model the structural element behavior with great detail trying to consider possible modes of failure. The most
commonly used macro model practical approach is the so called ‘diagonal strut model’. According to this
approach the infilled masonry is represented by a diagonal strut under compression. The first who suggested the
possibility of considering the effect of the infill as an equivalent diagonal bracing was Polyakov 1960 [5]. This
suggestion was taken up by Holmes 1961 [6], who modelled the infill by an equivalent diagonal strut made of
the same material with the same thickness as the infill panel and a width equal to one-third of the infill diagonal
length. Many authors suggested alternative proposals for the evaluation of the equivalent strut width. Some of
these studies provide analytical expressions, which include the presence of openings in the infill or analyze
special layouts such as the case in which infill and frame are not bonded together [3].
2.1 Outlines of Analytical Program: A five-story, seven-story, and ten-story reinforced concrete infilled frames buildings of a plan shown in
Fig.4 were modelled using FE program SeismoStruct [12]. Each building was modelled with different infill
panels' configurations also a different infill ratio and the different models are shown in Table 2 as well as a bare
frame model. A fixed support condition was provided at the base of all columns while beam column joints were
rigidly connected and the structural elements (beams and columns) were modelled as inelastic frame elements
(infrmDB) which is capable of modelling members of space frames with geometric and material nonlinearities.
Fig.4 – plan showing the geometry of each floor of the three buildings (all dimensions are in mm).
The models that have a symmetrical walls distribution throughout the story with different walls
configurations are the control and translational mode buildings while the models that have an unsymmetrical
walls distribution throughout the story with different walls configurations are the torsional mode buildings.
Table 2 illustrates the distribution of masonry infill walls throughout the typical story of each model (building)
with different number of stories.

Evaluation of the Seismic Response Parameters for Infilled Reinforced Concrete Frame Buildings
DOI: 10.9790/1684-1401032841 www.iosrjournals.org 32 | Page
Table 2: The different models investigated with the walls distribution throughout the story.
2.2 Modeling Methodology: SeismoStruct is a Finite Element package for structural analysis, capable of predicting the large
displacement behavior of space frames under static or dynamic loadings, taking into account both geometric
nonlinearities and material inelasticity. The infill masonry was modelled as a four-node masonry panel element,
Each panel is represented by six strut members; each diagonal direction features two parallel struts, of a length
(dm) which varies between 3.9 and 6.7 m for the infill panels have an aspect ratio (length/height) varies from
0.833 to 2 depending on the location of the structural member in the plan as shown in Fig.4, to carry axial loads
across two opposite diagonal corners and a third one to carry the shear from the top to the bottom of the panel as
shown in Fig.4. This latter strut only acts across the diagonal that is on compression, hence its "activation"
depends on the deformation of the panel. The axial load struts use the masonry strut hysteresis model, while the
shear strut uses a dedicated bilinear hysteresis rule. See Table 3 and 4.
Table 3. Strut curve parameters
Curve properties Values
Initial Young modulus - Em 1600000 kPa
Compressive strength - fmθ 1000 kPa
Tensile strength - ft 0 kPa
Strain at maximum stress - εm 0.0012
Ultimate strain - εu 0.024
Closing strain - εcl 0.004
Strut area reduction strain - ε1 0.0006
Residual strut area strain - ε2 0.001
Starting unload. stiffness factor - γun 1.5
Strain reloading factor - αre 0.2
Strain inflection factor - αch 0.7
Complete unloading strain factor - βa 1.5
Stress inflection factor - βch 0.9
Zero stress stiffness factor - γplu 1
Reloading stiffness factor - γpre 1.5
Plastic unloading stiffness factor – ex1 3
Repeated cycle strain factor – ex2 1.4

Evaluation of the Seismic Response Parameters for Infilled Reinforced Concrete Frame Buildings
DOI: 10.9790/1684-1401032841 www.iosrjournals.org 33 | Page
Table 4. Shear Curve Parameters
Also as can be observed in Fig.5, four internal nodes are employed to account for the actual points of
contact between the frame and the infill panel (i.e. to account for the width and height of the columns and
beams, respectively), whilst Four dummy nodes are introduced with the objective of accounting for the contact
length between the frame and the infill panel (hz) which introduced as percentage of the vertical height of the
panel and was taken 0.87 m. All the internal forces are transformed to the exterior four nodes (which are distant
horizontally (Xoi) by 2% of the horizontal side of panel and vertically (Yoi) by 8% of the vertical side of panel)
where the element is connected to the frame. Also the out of plane failure drift introduced as a percentage of the
vertical height was taken 5%.
Fig.5 – Model of infill
For all models ( 5-story, 7-story and 10-story models), the beam section was 250 mm wide and 500
mm deep, the slab thickness was 100 mm and the infill was 250 mm thick. But the cross section of columns was
250x400 mm, 250x500 mmm, 300x550 mm for 5-story, 7-story and 10-story buildings respectively. Though the
masonry infill consists of bricks and mortar, it’s modelled as strut members. The compressive strength of
concrete was 30 MPa while its tensile strength was 3 MPa, and the modulus of elasticity of reinforcement steel
was 200 GPa while its yield strength was 360 MPa. And the specific weight of masonry was 18 kN/m3 and the
structural elements were designed using SAP 2000; the typical floor proposed was modelled and loaded by floor
cover loads of 2 kN/m2 and live loads of 3 kN/m
2. Therefore the designed reinforcement steel was 3 bars of 12
mm diameter (lower reinforcement) and 2 bars of 12 mm diameter (upper reinforcement) for all beams in the
different structures mentioned above; and the reinforcement of columns was 4, 6, 8 bars of 18 mm diameter for
5, 7, 10-story buildings respectively. The story height in all models was maintained three meters uniformly
throughout the story levels.An example of different models are shown in Fig.6.
Fig.6 – Example of bare frame and infilled frames FE models
Curve properties Values
Shear bond strength - τθ 300 kPa
Friction coefficient - µ 0.7
Maximum shear strength - τmax 600 kPa
Reduction shear factor - αs 1.5

Evaluation of the Seismic Response Parameters for Infilled Reinforced Concrete Frame Buildings
DOI: 10.9790/1684-1401032841 www.iosrjournals.org 34 | Page
In addition to permanent gravity actions, each model of building was subjected to an inverted triangle
of incremental horizontal loads distributed linearly with the height of building from 0 (at the ground) to 10 kN
(at top) in X-direction. A series of incremental static analyses have been conducted on all structures under
lateral loads and the results obtained are discussed and shown.
III. Analytical Results The static pushover analysis results of the bare frame are regarded as the baseline data for investigating the
effect of different infill configurations on the structural behavior of RC frames.
3.1 The Strength Capacity Investigation: The masonry infills have significantly increased the strength capacity of reinforced concrete frames buildings;
the load-displacement charts and the percentage of increase are shown in Fig.7, 8, 9.
Fig.7 – Comparison between the behavior of bare frame and five-story infilled frames models under incremental
static lateral load.
Fig.8–Comparison between the behavior of bare frame and seven-story infilled frames models under
incremental static lateral load.

Evaluation of the Seismic Response Parameters for Infilled Reinforced Concrete Frame Buildings
DOI: 10.9790/1684-1401032841 www.iosrjournals.org 35 | Page
Fig.9 – Comparison between the behavior of bare frame and ten-story infilled frames models under incremental
static lateral load.
Table 5. The strength capacity increase of all buildings with respect to the percentage of infills
Model T1X T2X T1Y T2Y T3Y E1X E2X E3X E1XY E2XY E3XY E4XY CTRL
%infills(x)1 84.12 84.12 33.33 58.73 58.73 71.43 58.73 46 71.43 58.73 71.43 58.73 84.12
%infills(y)2 90 70 100 100 100 100 100 100 95 95 85 85 100
Is % - 5S3 482 464 242 340 341 384 329 286 386 335 386 333 448
Is % - 7S4 504 492 248 366 357 397 351 298 411 351 415 384 499
Is % - 10S5 577 565 262 409 410 375 372 331 463 382 473 335 574
1 % infills(x) is the percentage of infills in X-direction (lateral load direction).
2 % infills(y) is the percentage of infills in Y-direction.
3 Is % - 5S is the percentage of strength capacity increase for 5-story models compared to that of bare frame.
4 Is % - 7S is the percentage of strength capacity increase for 7-story models compared to that of bare frame.
5 Is % - 10S is the percentage of strength capacity increase for 10-story models compared to that of bare frame.
From Table 5, the model (T1Y) with the least percentage of infills has the least increase in strength
capacity and models with the highest percentage of infills (such as T1X and CTRL) have the highest increase in
strength capacity so it can be concluded that the strength capacity of the building is directly proportional to the
percentage of infills in the building while the ductility of structure is inversely proportional to the infill ratio of
the structure that the bare frame building has the most ductile performance of all structures performances. For
the 7-story buildings, the strength capacity has significantly increased than the strength capacity of the 5-story
buildings. Also the performance of models is more ductile than that of the 5-story models as some models
(CTRL and T1Y) have reached a displacement of 0.5 m before collapse. For the 10-story buildings, the strength
capacity has slightly increased than that of 7-story buildings but the models performance has significantly
changed as clearly the ductility increased and most of models reached 0.5 m displacement or more before
collapse.
For each model performance, the first drop in strength for the partially-infilled frame is due to the
brittle failure of masonry materials initiating in the first-story infill walls. Lateral loads are subsequently
redistributed and the pushover curve reaches its peak strength again as the walls in upper stories and frame
elements are subjected to higher loads. This behavior after first-story wall failure is due to wall-frame
interaction and depends on the relative strength of the infill and framing.
3.2 The Response of buildings under Incremental Lateral Load: For almost all buildings, the first cracks resulted from lateral loading are detected in the concrete cover
of beams in the first stories then the cracks extend to the confined concrete of beams in tension. After cracking
of beams, the cracking of columns starts from the concrete cover to the confined concrete in tension. The
reinforcement steel starts yielding at the first stories beams then for the whole building. The last cracks happen
Evaluation of the Seismic Response Parameters for Infilled Reinforced Concrete Frame Buildings
DOI: 10.9790/1684-1401032841 www.iosrjournals.org 36 | Page
to appear in the confined concrete of columns in compression as shown in figures. Also the models were studied
with different number of stories such as 5, 7 and 10 stories and it can be concluded that the overall performance
of 7-story buildings is in between the 5-story and 10-story buildings.
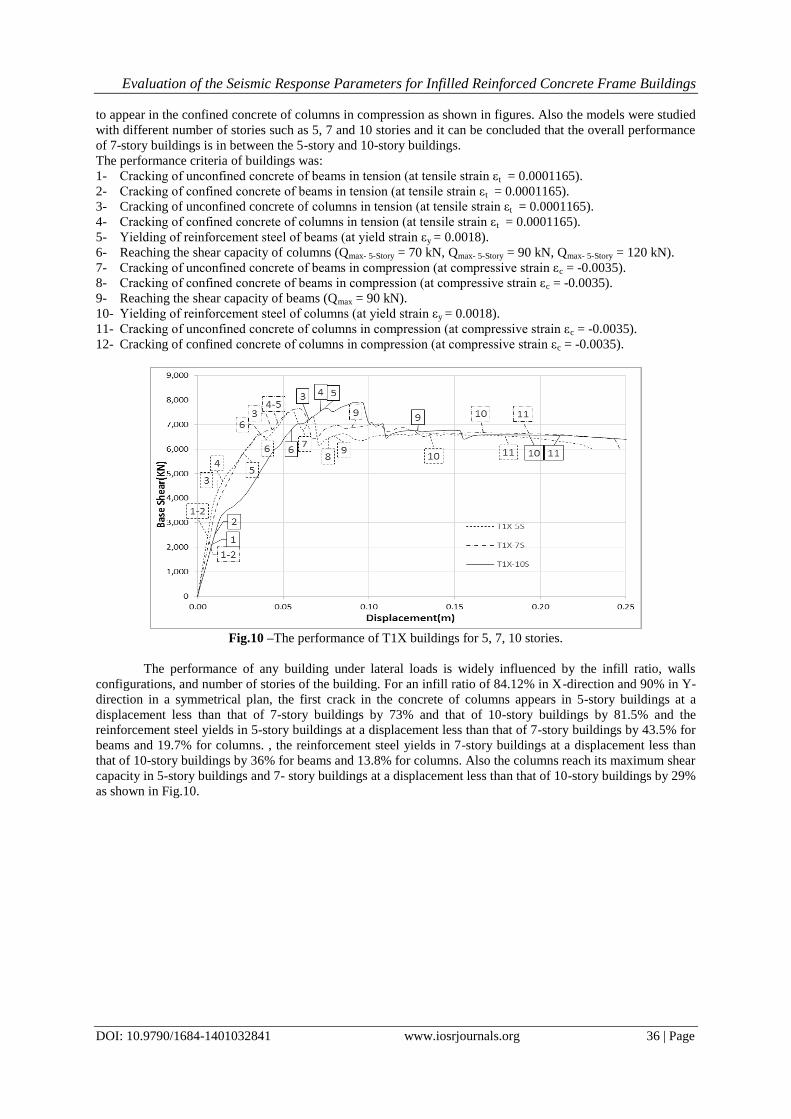
The performance criteria of buildings was:
1- Cracking of unconfined concrete of beams in tension (at tensile strain εt = 0.0001165).
2- Cracking of confined concrete of beams in tension (at tensile strain εt = 0.0001165).
3- Cracking of unconfined concrete of columns in tension (at tensile strain εt = 0.0001165).
4- Cracking of confined concrete of columns in tension (at tensile strain εt = 0.0001165).
5- Yielding of reinforcement steel of beams (at yield strain εy = 0.0018).
6- Reaching the shear capacity of columns (Qmax- 5-Story = 70 kN, Qmax- 5-Story = 90 kN, Qmax- 5-Story = 120 kN).
7- Cracking of unconfined concrete of beams in compression (at compressive strain εc = -0.0035).
8- Cracking of confined concrete of beams in compression (at compressive strain εc = -0.0035).
9- Reaching the shear capacity of beams (Qmax = 90 kN).
10- Yielding of reinforcement steel of columns (at yield strain εy = 0.0018).
11- Cracking of unconfined concrete of columns in compression (at compressive strain εc = -0.0035).
12- Cracking of confined concrete of columns in compression (at compressive strain εc = -0.0035).
Fig.10 –The performance of T1X buildings for 5, 7, 10 stories.
The performance of any building under lateral loads is widely influenced by the infill ratio, walls
configurations, and number of stories of the building. For an infill ratio of 84.12% in X-direction and 90% in Y-
direction in a symmetrical plan, the first crack in the concrete of columns appears in 5-story buildings at a
displacement less than that of 7-story buildings by 73% and that of 10-story buildings by 81.5% and the
reinforcement steel yields in 5-story buildings at a displacement less than that of 7-story buildings by 43.5% for
beams and 19.7% for columns. , the reinforcement steel yields in 7-story buildings at a displacement less than
that of 10-story buildings by 36% for beams and 13.8% for columns. Also the columns reach its maximum shear
capacity in 5-story buildings and 7- story buildings at a displacement less than that of 10-story buildings by 29%
as shown in Fig.10.

Evaluation of the Seismic Response Parameters for Infilled Reinforced Concrete Frame Buildings
DOI: 10.9790/1684-1401032841 www.iosrjournals.org 37 | Page
Fig.11 –The performance of E1X buildings for 5, 7, 10 stories.
For an infill ratio of 71.43% in X-direction and 100% in Y-direction in an unsymmetrical plan, the first
crack in the concrete of columns appears in 5-story buildings at a displacement less than that of 7-story
buildings by 68% and that of 10-story buildings by 80% and the reinforcement steel yields in 5-story buildings
at a displacement less than that of 7-story buildings by 49% for beams and 23.2% for columns. , the
reinforcement steel yields in 7-story buildings at a displacement less than that of 10-story buildings by 36.4%
for beams and 26.7% for columns. Also the columns reach its maximum shear capacity in 5-story buildings at a
displacement less than that of 7- story buildings by 13% and at a displacement less than that of 10-story
buildings by 45% as shown in Fig.11.
Fig.12 –The performance of CTRL buildings for 5, 7, 10 stories.
For an infill ratio of 84.12% in X-direction and 100% in Y-direction in a symmetrical plan, the first
crack in the concrete of columns appears in 5-story buildings at a displacement less than that of 7-story
buildings by 77.3% and that of 10-story buildings by 86.2% and the reinforcement steel yields in 5-story
buildings at a displacement less than that of 7-story buildings by 9% for beams and 56% for columns. , the
reinforcement steel yields in 7-story buildings at a displacement less than that of 10-story buildings by 5% for
beams and greater than that of 10-story buildings by 6.5% for columns. Also the columns reach its maximum
shear capacity in 5-story buildings at a displacement less than that of 7- story buildings by 46% and at a
displacement less than that of 10-story buildings by 72% as shown in Fig.12.
Evaluation of the Seismic Response Parameters for Infilled Reinforced Concrete Frame Buildings
DOI: 10.9790/1684-1401032841 www.iosrjournals.org 38 | Page
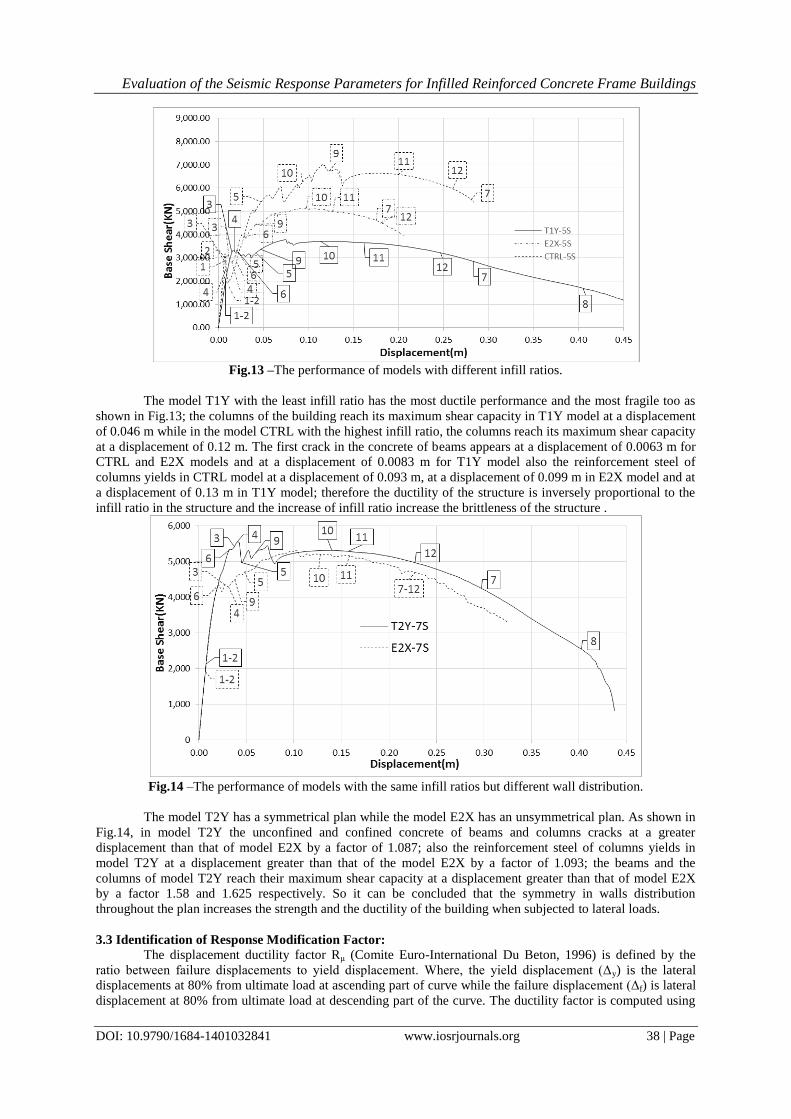
Fig.13 –The performance of models with different infill ratios.
The model T1Y with the least infill ratio has the most ductile performance and the most fragile too as
shown in Fig.13; the columns of the building reach its maximum shear capacity in T1Y model at a displacement
of 0.046 m while in the model CTRL with the highest infill ratio, the columns reach its maximum shear capacity
at a displacement of 0.12 m. The first crack in the concrete of beams appears at a displacement of 0.0063 m for
CTRL and E2X models and at a displacement of 0.0083 m for T1Y model also the reinforcement steel of
columns yields in CTRL model at a displacement of 0.093 m, at a displacement of 0.099 m in E2X model and at
a displacement of 0.13 m in T1Y model; therefore the ductility of the structure is inversely proportional to the
infill ratio in the structure and the increase of infill ratio increase the brittleness of the structure .
Fig.14 –The performance of models with the same infill ratios but different wall distribution.
The model T2Y has a symmetrical plan while the model E2X has an unsymmetrical plan. As shown in
Fig.14, in model T2Y the unconfined and confined concrete of beams and columns cracks at a greater
displacement than that of model E2X by a factor of 1.087; also the reinforcement steel of columns yields in
model T2Y at a displacement greater than that of the model E2X by a factor of 1.093; the beams and the
columns of model T2Y reach their maximum shear capacity at a displacement greater than that of model E2X
by a factor 1.58 and 1.625 respectively. So it can be concluded that the symmetry in walls distribution
throughout the plan increases the strength and the ductility of the building when subjected to lateral loads.
3.3 Identification of Response Modification Factor: The displacement ductility factor Rμ (Comite Euro-International Du Beton, 1996) is defined by the
ratio between failure displacements to yield displacement. Where, the yield displacement (Δy) is the lateral
displacements at 80% from ultimate load at ascending part of curve while the failure displacement (Δf) is lateral
displacement at 80% from ultimate load at descending part of the curve. The ductility factor is computed using

Evaluation of the Seismic Response Parameters for Infilled Reinforced Concrete Frame Buildings
DOI: 10.9790/1684-1401032841 www.iosrjournals.org 39 | Page
Eq.(4) [10].
(4)
Where:
Δf: the failure displacement,
Δy: the yield displacement.
The percentage of infills in Y-direction is defined by the ratio between the total lengths of infills in Y-
direction to the total lengths of frames in the same direction while the percentage of infills in X-direction is
defined by the ratio between the total lengths of infills in X-direction to the total lengths of frames in the same
direction. The maximum global drift is defined by the ratio between the maximum roof drift displacement to the
total height of the building and its values are shown in Table 6.
Table 6. Resulted global drift and ductility from static pushover analysis for all models
No.
of stories MODELS % of infills(Y)* % of infills(X)**
Max. Global
Drift %*** Ductility
5 S
TO
RIE
S
NO INFILL 0 0 5.4 7.89
CTRL 100 84.127 1.893 5.37
T1X 90 84.127 1.53 7.93
T2X 70 84.127 1.53 7.18
T1Y 100 33.33 3.13 19.92
T2Y 100 58.73 1.68 16.24
T3Y 100 58.73 1.67 17.45
E1X 100 71.43 1.4 7.16
E2X 100 58.73 1.37 7.69
E3X 100 46 1.96 9.72
E1XY 95 71.43 1.63 14.66
E2XY 95 58.73 1.37 11.17
E3XY 85 71.43 1.59 7.74
E4XY 85 58.73 1.91 13.06
7 S
TO
RIE
S
NO INFILL 0 0 4.7 6.62
CTRL 100 84.127 2.38 8.31
T1X 90 84.127 1.43 8.13
T2X 70 84.127 1.75 6.98
T1Y 100 33.33 2.37 18.21
T2Y 100 58.73 2.07 13.52
T3Y 100 58.73 1.66 14.65
E1X 100 71.43 1.3 8.08
E2X 100 58.73 1.54 13.1
E3X 100 46 1.283 10.71
E1XY 95 71.43 1.79 13.19
E2XY 95 58.73 1.34 10.56
E3XY 85 71.43 2.38 3.73
E4XY 85 58.73 1.63 8.65
10 S
TO
RIE
S
NO INFILL 0 0 4 6.09
CTRL 100 84.127 0.955 5.72
T1X 90 84.127 0.916 5.24
T2X 70 84.127 1.96 5.88
T1Y 100 33.33 3.23 17.15
T2Y 100 58.73 2.583 11.36
T3Y 100 58.73 2.167 11.72
E1X 100 71.43 1.196 7.56
E2X 100 58.73 1.163 9.43
E3X 100 46 1.471 12.2
E1XY 95 71.43 1.667 7.96
E2XY 95 58.73 1.4 10.82
E3XY 85 71.43 1.244 8.2
E4XY 85 58.73 1.14 11.75
*
**
***

Evaluation of the Seismic Response Parameters for Infilled Reinforced Concrete Frame Buildings
DOI: 10.9790/1684-1401032841 www.iosrjournals.org 40 | Page
Fig.15 – The effect of infill ratio on the global drift of the control, translational and torsional mode (symmetrical
and asymmetrical wall distribution in plan) buildings
For 5-story buildings with regular wall distribution, the percentage of global drift decreases by 43%
when the infill ratio increases by 33.33% while decreases by 69% when the infill ratio increases by 58.73%;
with irregular wall distribution, the percentage of global drift decreases by 75% when the infill ratio increases
by 58.73%. For 7-story buildings with regular wall distribution, the percentage of global drift decreases by 56%
when the infill ratio increases by 58.73% while for irregular wall distribution buildings, the percentage of global
drift decreases by 67% when the infill ratio increases by 58.73%. And for 10-story buildings with regular wall
distribution, the percentage of global drift decreases by 37.5% when the infill ratio increases by 58.73% while
for irregular wall distribution buildings, the percentage of global drift decreases by 71% when the infill ratio
increases by 58.73%. So it can be conclude that the top drift of buildings subjected to lateral loads decreases
with the increase of infill ratio and the number of stories as shown in Fig.15.
Fig.16 – The effect of infill ratio on the ductility of the control, translational and torsional mode (symmetrical
and asymmetrical wall distribution in plan) buildings compared with ductility values in different codes.
The ductility factor varies with respect to the percentage of infills and the wall configurations in each
building (see Table 6), so it's not accurate to specify a certain value for each system. Whereas for 5-story
buildings with regular wall distribution, the ductility factor decreases by 18.5% with the increase of infill ratio
by 25.4% and decreases by 84% with the increase of infill ratio by 50.79% while for 7-story buildings with
regular wall distribution, the ductility factor decreases by 26% with the increase of infill ratio by 25.4% and
decreases by 55% with the increase of infill ratio by 50.79% and for 10-story buildings with regular wall
distribution, the ductility factor decreases by 34% with the increase of infill ratio by 25.4% and decreases by
67% with the increase of infill ratio by 50.79%. But for 5-story buildings with irregular wall distribution, the
ductility factor decreases by 20.89% with the increase of infill ratio by 12.73% and decreases by 27.4% with the
increase of infill ratio by 25.43% while for 10-story buildings with irregular wall distribution, the ductility factor
decreases by 23% with the increase of infill ratio by 12.73% and decreases by 38% with the increase of infill

Evaluation of the Seismic Response Parameters for Infilled Reinforced Concrete Frame Buildings
DOI: 10.9790/1684-1401032841 www.iosrjournals.org 41 | Page
ratio by 25.43%. From Fig.16, it can be concluded that the similarity in wall distribution throughout the story
increases the ductility factor by approximately by 100% that the torsional effect cause excessive ductility
demands on the structure also the ductility factor decreases in higher structures.
IV. Conclusion This paper presented an analytical investigation in the seismic response of infilled-frame buildings. A
number of prototypical building structures were analyzed using different number of stories and infill distribution
patterns. The key finding of this investigation may be summarized as follows:
1- Nonlinear push-over analysis showed that the lateral strength and stiffness of the structure with infill walls
increased significantly due to the contribution of the infill walls, which are generally neglected due to their
tendency to premature strength loss during seismic events. Capacity increase reached values as high as 482
%, 504 %, 577 % compared to the bare frames for five, seven and ten stories building, respectively.
2- Ductility factors of structures, expressed as the maximum deformation divided by the corresponding yield
deformation, are useful non-dimensional indices of inelastic deformations. However using fixed values for
these factors across all the similar type of structures was shown to be unreasonable, and may yield overly
conservative designs for the ductile building structures.
3- Analytical results demonstrated that as the percentage of the infills increases, the corresponding response
modification factor decreases. A similar inverse proportionality relationship also holds for the building drift
under lateral loads. This is attributed to the added stiffness contribution of the infill walls to the bare frames.
4- Although this study did not cover all possible factors affecting the seismic response of infilled frame
buildings, it is clear that the response modification factors presented in national and international codes
needs revisiting. The margin of overestimation of the seismic forces is considered large given the inherent
strength and ductility of the system. This shall lead to more efficient and economic designs if the response
modification factors are related to infill percentages and distributions.
References [1]. Applied technology council and Federal emergency management agency, FEMA P695 Quantification of Building Seismic
Performance Factors, June 2009. [2]. CVR Murty and Sudhir K Jain, “Beneficial influence of masonry infill walls on seismic performance of RC frame buildings”,
12WCEE 2000.
[3]. Ivo Caliò and Bartolomeo Pantò, “A macro-element modelling approach of Infilled Frame Structures”, Computers and Structures 143 (2014) 91–107.
[4]. A. Kadida, S. Nouia, A. Zinea and D. Yahiaouib, “Behavior of Reinforced Concrete Infilled Frames under Seismic Loads”, Cher-
Siang Tan et al. / Jurnal Teknologi (Sciences & Engineering) 61:3 (2013). [5]. Polyakov SV, “The interaction between masonry filler walls and enclosing frame when loading in the plane of the wall”,
Earthquake Engineering Research Institute; 1960.
[6]. Holmes M., “Steel frame with brickwork and concrete infilling”, Inst Technol, Bradford 1961. [7]. Standard building code SBC 301, 2007.
[8]. Uniform Building Code UBC-volume 2, 1997.
[9]. American Society of Civil Engineering ASCE 7-05, 2005. [10]. Ahmed Sayed, Ahmed Tawfik Essa, Mohamed Ragai Kotp Badr and Ashraf Hasan El-Zanaty, “Effect of infill wall on the ductility
and behavior of high strength reinforced concrete frames”, HBRC Journal (2014) 10, 258–264.
[11]. Egyptian code of practice of reinforced concrete ECP 203; 2007 [12]. SeismoStruct v6.0 – "A computer program for static and dynamic nonlinear analysis of framed structures" Seismosoft [2012].