Embed Size (px)
Citation preview

BEAAquaLogic™ Interaction Analytics
Administrator Guide
Version 2.0Document Revised: September 1, 2006

CopyrightCopyright © 1995-2006 BEA Systems, Inc. All Rights Reserved.
Restricted Rights LegendThis software is protected by copyright, and may be protected by patent laws. No copying or other use of this software is permitted unless you have entered into a license agreement with BEA authorizing such use. This document is protected by copyright and may not be copied photocopied, reproduced, translated, or reduced to any electronic medium or machine readable form, in whole or in part, without prior consent, in writing, from BEA Systems, Inc.
Information in this document is subject to change without notice and does not represent a commitment on the part of BEA Systems. THE DOCUMENTATION IS PROVIDED “AS IS” WITHOUT WARRANTY OF ANY KIND INCLUDING WITHOUT LIMITATION, ANY WARRANTY OF MERCHANTABILITY OR FITNESS FOR A PARTICULAR PURPOSE. FURTHER, BEA SYSTEMS DOES NOT WARRANT, GUARANTEE, OR MAKE ANY REPRESENTATIONS REGARDING THE USE, OR THE RESULTS OF THE USE, OF THE DOCUMENT IN TERMS OF CORRECTNESS, ACCURACY, RELIABILITY, OR OTHERWISE.
Trademarks and Service MarksCopyright © 1995-2005 BEA Systems, Inc. All Rights Reserved. BEA, BEA JRockit, BEA WebLogic Portal, BEA WebLogic Server, BEA WebLogic Workshop, Built on BEA, Jolt, JoltBeans, SteelThread, Top End, Tuxedo, and WebLogic are registered trademarks of BEA Systems, Inc. BEA AquaLogic, BEA AquaLogic Data Services Platform, BEA AquaLogic Enterprise Security, BEA AquaLogic Service Bus, BEA AquaLogic Service Registry, BEA Builder, BEA Campaign Manager for WebLogic, BEA eLink, BEA Liquid Data for WebLogic, BEA Manager, BEA MessageQ, BEA WebLogic Commerce Server, BEA WebLogic Communications Platform, BEA WebLogic Enterprise, BEA WebLogic Enterprise Platform, BEA WebLogic Enterprise Security, BEA WebLogic Express, BEA WebLogic Integration, BEA WebLogic Java Adapter for Mainframe, BEA WebLogic JDriver, BEA WebLogic Log Central, BEA WebLogic Network Gatekeeper, BEA WebLogic Personalization Server, BEA WebLogic Personal Messaging API, BEA WebLogic Platform, BEA WebLogic Portlets for Groupware Integration, BEA WebLogic Server Process Edition, BEA WebLogic SIP Server, BEA WebLogic WorkGroup Edition, Dev2Dev, Liquid Computing, and Think Liquid are trademarks of BEA Systems, Inc. BEA Mission Critical Support, BEA Mission Critical Support Continuum, and BEA SOA Self Assessment are service marks of BEA Systems, Inc.
All other names and marks are property of their respective owners.

Administrator Guide for BEA AquaLogic Interaction Analytics v
Contents
1. WelcomeHow To Use This Book. . . . . . . . . . . . . . . . . . . . . . . . . . . . . . . . . . . . . . . . . . . . . . . . . . 1-1
Audience . . . . . . . . . . . . . . . . . . . . . . . . . . . . . . . . . . . . . . . . . . . . . . . . . . . . . . . . . 1-1
Typographical Conventions . . . . . . . . . . . . . . . . . . . . . . . . . . . . . . . . . . . . . . . . . . . 1-2
BEA Documentation and Resources . . . . . . . . . . . . . . . . . . . . . . . . . . . . . . . . . . . . . . . . 1-3
2. Overview of AnalyticsComponents of Analytics . . . . . . . . . . . . . . . . . . . . . . . . . . . . . . . . . . . . . . . . . . . . . . . . 2-2
3. Working with Analytics ReportsOverview of Analytics Reports . . . . . . . . . . . . . . . . . . . . . . . . . . . . . . . . . . . . . . . . . . . . 3-1
Accessing Analytics Reports. . . . . . . . . . . . . . . . . . . . . . . . . . . . . . . . . . . . . . . . . . . . . . 3-6
Managing Security for Analytics Reports. . . . . . . . . . . . . . . . . . . . . . . . . . . . . . . . . . . . 3-6
Creating Analytics Portlets . . . . . . . . . . . . . . . . . . . . . . . . . . . . . . . . . . . . . . . . . . . . . . . 3-7
Working with Analytics - Advanced Tips and Techniques . . . . . . . . . . . . . . . . . . . . . . 3-7
Tips and Techniques - Using Analytics Reports . . . . . . . . . . . . . . . . . . . . . . . . . . . 3-8
Tips and Techniques - Maximizing Portal Usage Tracking . . . . . . . . . . . . . . . . . . . 3-9
4. Using Analytics AdministrationAccessing Analytics Administration. . . . . . . . . . . . . . . . . . . . . . . . . . . . . . . . . . . . . . . . 4-1
Using Analytics Administration . . . . . . . . . . . . . . . . . . . . . . . . . . . . . . . . . . . . . . . . . . . 4-1
Configuring Runtime Settings . . . . . . . . . . . . . . . . . . . . . . . . . . . . . . . . . . . . . . . . . 4-2
Configuring Security Settings . . . . . . . . . . . . . . . . . . . . . . . . . . . . . . . . . . . . . . . . . 4-4
vi Administrator Guide for BEA AquaLogic Interaction Analytics
Super Users Role . . . . . . . . . . . . . . . . . . . . . . . . . . . . . . . . . . . . . . . . . . . . . . . 4-5
Capabilities . . . . . . . . . . . . . . . . . . . . . . . . . . . . . . . . . . . . . . . . . . . . . . . . . . . 4-6
Configuring Partition Settings. . . . . . . . . . . . . . . . . . . . . . . . . . . . . . . . . . . . . . . . . 4-6
Working with the Scrolling View Window . . . . . . . . . . . . . . . . . . . . . . . . . . . 4-7
Previewing Partitions . . . . . . . . . . . . . . . . . . . . . . . . . . . . . . . . . . . . . . . . . . . . 4-8
Registering Events . . . . . . . . . . . . . . . . . . . . . . . . . . . . . . . . . . . . . . . . . . . . . . . . . 4-8
Overview of Event Registration. . . . . . . . . . . . . . . . . . . . . . . . . . . . . . . . . . . . 4-8
Overview of Events, Event Parameters, and Dimensions . . . . . . . . . . . . . . . . 4-8
Creating Custom Dimensions . . . . . . . . . . . . . . . . . . . . . . . . . . . . . . . . . . . . . 4-9
Creating Events . . . . . . . . . . . . . . . . . . . . . . . . . . . . . . . . . . . . . . . . . . . . . . . . 4-9
Event Names. . . . . . . . . . . . . . . . . . . . . . . . . . . . . . . . . . . . . . . . . . . . . . 4-10
Table Names . . . . . . . . . . . . . . . . . . . . . . . . . . . . . . . . . . . . . . . . . . . . . . 4-10
Parameter Names . . . . . . . . . . . . . . . . . . . . . . . . . . . . . . . . . . . . . . . . . . 4-10
Delivered Parameters . . . . . . . . . . . . . . . . . . . . . . . . . . . . . . . . . . . . . . . 4-10
Saving Event Data . . . . . . . . . . . . . . . . . . . . . . . . . . . . . . . . . . . . . . . . . . . . . 4-11
Stopping Event Data Storage . . . . . . . . . . . . . . . . . . . . . . . . . . . . . . . . . . . . . 4-11
Limiting Access to Analytics Administration . . . . . . . . . . . . . . . . . . . . . . . . . . . . . . . 4-11
5. Managing the Analytics DatabaseSizing the Analytics Database . . . . . . . . . . . . . . . . . . . . . . . . . . . . . . . . . . . . . . . . . . . . 5-1
Overview of Analytics Database Growth . . . . . . . . . . . . . . . . . . . . . . . . . . . . . . . . 5-1
Fact Table Growth . . . . . . . . . . . . . . . . . . . . . . . . . . . . . . . . . . . . . . . . . . . . . . 5-2
Dimension Table Growth . . . . . . . . . . . . . . . . . . . . . . . . . . . . . . . . . . . . . . . . . 5-2
Restricting Portlet View Data . . . . . . . . . . . . . . . . . . . . . . . . . . . . . . . . . . . . . . . . . 5-3
Tuning the Analytics Database - Oracle . . . . . . . . . . . . . . . . . . . . . . . . . . . . . . . . . 5-3
Working with Delivered Fact Tables. . . . . . . . . . . . . . . . . . . . . . . . . . . . . . . . . . . . 5-4
Archiving and Restoring Partitions . . . . . . . . . . . . . . . . . . . . . . . . . . . . . . . . . . . . . . . . 5-5

Administrator Guide for BEA AquaLogic Interaction Analytics vii
6. Synchronizing AnalyticsOverview of Analytics Synchronization. . . . . . . . . . . . . . . . . . . . . . . . . . . . . . . . . . . . . 6-1
Synchronized Dimension Data and Associated Jobs . . . . . . . . . . . . . . . . . . . . 6-3
Performing Force Synchronizations . . . . . . . . . . . . . . . . . . . . . . . . . . . . . . . . . . . . . . . . 6-4
Performing a Force Synchronization of All Dimension Data . . . . . . . . . . . . . 6-4
Performing a Force Synchronization of a Single Object’s Dimension Data . . 6-5
Strategizing Synchronization Scheduling. . . . . . . . . . . . . . . . . . . . . . . . . . . . . . . . . . . . 6-5
A. TroubleshootingOverview of Logs . . . . . . . . . . . . . . . . . . . . . . . . . . . . . . . . . . . . . . . . . . . . . . . . . . . . . .A-2
Troubleshooting Common Runtime Problems . . . . . . . . . . . . . . . . . . . . . . . . . . . . . . . .A-4
Index

viii Administrator Guide for BEA AquaLogic Interaction Analytics

Administrator Guide for BEA AquaLogic Interaction Analytics 1-1
C H A P T E R 1
Welcome
This book describes how to perform administration tasks for BEA AquaLogic Interaction Analytics (“Analytics”) 2.0.
Note: “BEA AquaLogic Interaction Analytics” is the updated product name for “Plumtree Analytics”. This guide, however, still refers to some portal objects using their old Plumtree names. Also, some portal installation path examples contain Plumtree directories instead of BEA directories.
How To Use This Book
AudienceThis guide is written for Analytics administrators who are responsible for configuring Analytics reports, working with the Analytics database, and maintaining the Analytics system.

Welcome
1-2 Administrator Guide for BEA AquaLogic Interaction Analytics
Typographical ConventionsThis book uses the following typographical conventions.
Table 1-1 Typographical Conventions
Convention Typeface Example
• File names• Folder names• Screen elements
bold • Upload Procedures.doc to the portal.• Open the General folder.• To save your changes, click Apply Changes.
• Text you enter computer • Type Marketing as the name of your community.
• Variables you enter italic computer
• Enter the base URL for the Portlet Server. For example, http://my_computer/.
• New terms• Emphasis• Portal object
example names
italic • Portlets are Web tools, embedded in your portal.• The URI must be a unique number.• The example Knowledge Directory displayed in
Figure 5 shows the Human Resources folder.

BEA Documentat i on and Resources
Administrator Guide for BEA AquaLogic Interaction Analytics 1-3
BEA Documentation and ResourcesThis section describes the documentation and resources provided by BEA.
Table 1-2 BEA Documentation and Resources (Sheet 1 of 3)
Resource Description
Installation and Upgrade guide
This book is written for Analytics administrators. It describes how to install and upgrade Analytics.
It is available in electronic form (PDF) in the release package and on edocs.bea.com.
Release Notes These files are written for Analytics administrators. They include information about new features and known issues in the release.
They are available in electronic form (HTML) on edocs.bea.com.
Developer Guides, Articles, API Documentation, Blogs, Newsgroups, and Sample Code
These resources are provided for developers on the BEA dev2dev site (dev2dev.bea.com). They describe how to build custom applications using AquaLogic User Interaction and how to customize AquaLogic User Interaction products and features.
Deployment Guide This document is written for business analysts and system administrators. It describes how to plan your BEA AquaLogic User Interaction deployment.
It is available in electronic form (PDF) on edocs.bea.com.
Online Help The online help is written for all levels of Analytics users. It describes the user interface for Analytics and gives detailed instructions for completing tasks in the console and portal.
To access online help, click Help in the upper-right corner of the portal banner or console page.

Welcome
1-4 Administrator Guide for BEA AquaLogic Interaction Analytics
AquaLogic User Interaction Support Center
The AquaLogic User Interaction Support Center is a comprehensive repository for technical information on AquaLogic User Interaction products. From the Support Center, you can access products and documentation, search knowledge base articles, read the latest news and information, participate in a support community, get training, and find tools to meet most of your AquaLogic User Interaction-related needs. The Support Center encompasses the following communities:
Technical Support Center
Submit and track support incidents and feature requests, search the knowledge base, access documentation, and download service packs and hotfixes.
News & Events
The News & Events Center features information on rolling-out a successful deployment. Visit the Super User Group page to collaborate with peers and view upcoming meetings.
Product Center
Download products, read Release Notes, access recent product documentation, and view interoperability information.
Education Center
Find information about available training courses, purchase training credits, and register for upcoming classes.
If you do not see the Support Center when you log in tohttp://portal.plumtree.com, contact [email protected] for the appropriate access privileges.
Table 1-2 BEA Documentation and Resources (Sheet 2 of 3)
Resource Description
BEA Documentat i on and Resources
Administrator Guide for BEA AquaLogic Interaction Analytics 1-5
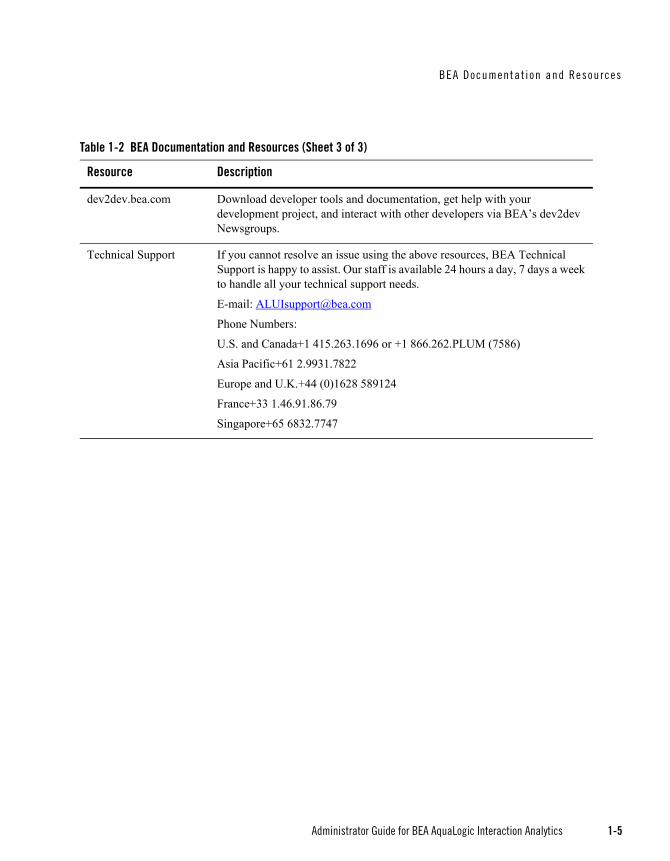
dev2dev.bea.com Download developer tools and documentation, get help with your development project, and interact with other developers via BEA’s dev2dev Newsgroups.
Technical Support If you cannot resolve an issue using the above resources, BEA Technical Support is happy to assist. Our staff is available 24 hours a day, 7 days a week to handle all your technical support needs.
E-mail: [email protected]
Phone Numbers:
U.S. and Canada+1 415.263.1696 or +1 866.262.PLUM (7586)
Asia Pacific+61 2.9931.7822
Europe and U.K.+44 (0)1628 589124
France+33 1.46.91.86.79
Singapore+65 6832.7747
Table 1-2 BEA Documentation and Resources (Sheet 3 of 3)
Resource Description

Welcome
1-6 Administrator Guide for BEA AquaLogic Interaction Analytics
Administrator Guide for BEA AquaLogic Interaction Analytics 2-1
C H A P T E R 2
Overview of Analytics
Analytics allows portal managers and business owners to track and analyze portal usage. Analytics provides the following basic functionality:
Usage Tracking Metrics: Analytics collects and reports metrics of common portal functions, including community, portlet and document hits.
Behavior Tracking: Users of Analytics reports can analyze portal metrics to determine usage patterns, such as portal visit duration and usage over time.
User Profile Correlation: Users of Analytics reports can correlate metric information with user profile information. Usage tracking reports can be viewed and filtered by user profile data such as country, company or title.
Custom Event Tracking: Portal Administrators and developers can register custom portal and non-portal events that are sent to Analytics using the OpenUsage API. Event data is saved to the Analytics database, which can then be queried for reporting to a portal or non-portal application.
For details on using the OpenUsage API, see the document Using the AquaLogic Interaction Analytics OpenUsage API at http://dev2dev.bea.com/pub/a/2006/08/openusage-analytics.html
Note: You must understand star schema database concepts in order to use Analytics’ custom event tracking features.

Overv iew o f Ana l y t i cs
2-2 Administrator Guide for BEA AquaLogic Interaction Analytics
Components of AnalyticsAnalytics is comprised of the following components:
Figure 2-1 Analytics Architecture

Components o f Ana l y t i cs
Administrator Guide for BEA AquaLogic Interaction Analytics 2-3
The following table describes the components that are delivered with Analytics. For a list of ports used by Analytics, see Installation and Upgrade Guide for BEA AquaLogic Interaction Analytics.
Table 2-1 Analytics components
Component Description
Interaction component The Interaction component gathers portal usage tracking metrics. It is installed on the same server that hosts the portal. For details on installing the Interaction component, see Installation and Upgrade Guide for BEA AquaLogic Interaction Analytics.
OpenUsage API The OpenUsage API sends the following metrics to the BEA AquaLogic Interaction Analytics Collector service via the Portal Message Bus (PMB):• Portal usage tracking metrics.• Custom portal and non-portal events.
For details on using the OpenUsage API, see the document Using the AquaLogic Interaction Analytics OpenUsage API at http://dev2dev.bea.com/pub/a/2006/08/openusage-analytics.html
Analytics services The following Analytics services are installed on a stand-alone server:• BEA AquaLogic Interaction Analytics Collector service receives data
from the Interaction component and gathers data from the portal database through the AquaLogic Interaction Development Kit (“IDK”).
• The BEA AquaLogic Interaction Analytics service provides Analytics data to the end user through the Analytics Console or portlets that are created from Analytics portlet templates.
For details on installing Analytics services, see Installation and Upgrade Guide for BEA AquaLogic Interaction Analytics.
Image Service component (not shown in diagram)
Provides the Image Service with the necessary files to run Analytics. For details on installing the Image Service component, see Installation and Upgrade Guide for BEA AquaLogic Interaction Analytics.
Automation Service component (not shown in diagram
Provides the Automation Service with the necessary jobs to synchronize Analytics with the portal. For details on installing the Automation Service component, see Installation and Upgrade Guide for BEA AquaLogic Interaction Analytics.
Analytics database The Analytics database component provides storage for metrics that are gathered from custom portal and non-portal events. For details on configuring the Analytics database, see Installation and Upgrade Guide for BEA AquaLogic Interaction Analytics.

Overv iew o f Ana l y t i cs
2-4 Administrator Guide for BEA AquaLogic Interaction Analytics

Administrator Guide for BEA AquaLogic Interaction Analytics 3-1
C H A P T E R 3
Working with Analytics Reports
This chapter provides information on using and analyzing analytics reports, creating portlets, and configuring the portal for most favorable tracking. It includes the following topics:
Overview of Analytics Reports
Accessing Analytics Reports
Managing Security for Analytics Reports
Creating Analytics Portlets
Working with Analytics - Advanced Tips and Techniques
Overview of Analytics ReportsThis section provides descriptions of the reports that are delivered with Analytics. For advanced tips and techniques on using Analytics reports, see “Tips and Techniques - Using Analytics Reports” on page 3-8.

Work ing wi th Anal y t i cs Repor ts
3-2 Administrator Guide for BEA AquaLogic Interaction Analytics
The following table describes reports that are delivered with Analytics.
Table 3-1 Descriptions of Analytics Reports
Analytics Report Description
Summary Metrics - Traffic The Traffic console page displays metrics for many common events within the portal including community page views, my pages views, search events, directory document views, Collaboration document views, Content Items views and directory views.
Summary Metrics - Pages The Pages console page aggregates My Pages and community page views. The report displays the most visited pages (top pages), the least visited pages (bottom pages), the top entry pages and the top exit pages for the portal.
The data can be summed by hits (total number of page views) or users (unique number of users who viewed pages). Additionally, the report can be filtered to show only pages from specific communities. Finally, if My Page views are included in the report they are summarized so that every user's My Pages are counted as one page.
Summary Metrics - Users The Users console page displays counts of total, added, inactive and active users. An active user is one who logged into the portal within the Active User Timeout. The Active User Timeout can be adjusted via the Analytics Administration Utility. For details, see “Configuring Runtime Settings” on page 4-2.
Summary Metrics - Logins The Logins console page displays counts of logins into the portal, even if users have Remember my password selected on their home page, thereby logging them in automatically. The data can be summed by Logins (total logins into the portal) or Users (unique users who logged into the portal).
Overv iew o f Ana l y t i cs Repo r ts
Administrator Guide for BEA AquaLogic Interaction Analytics 3-3
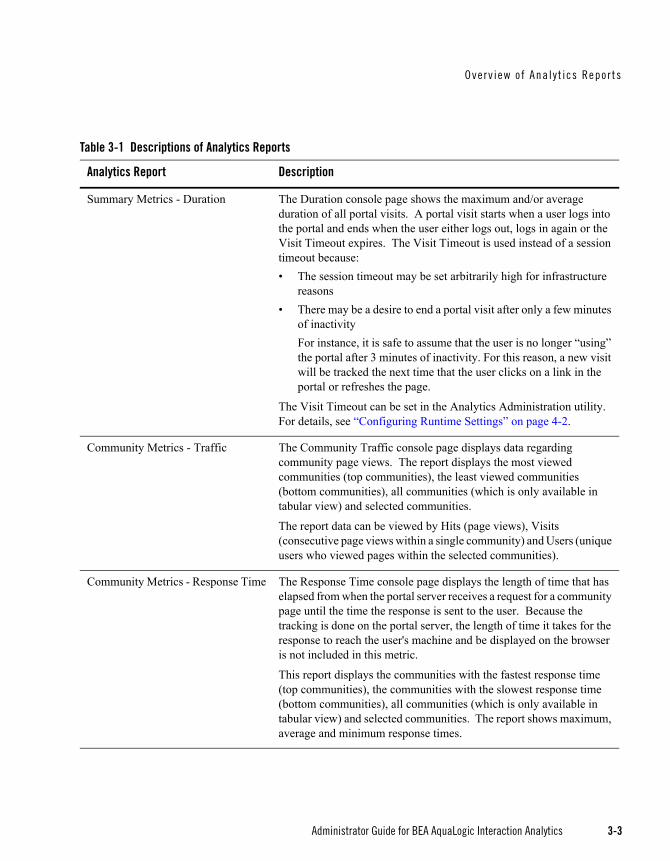
Summary Metrics - Duration The Duration console page shows the maximum and/or average duration of all portal visits. A portal visit starts when a user logs into the portal and ends when the user either logs out, logs in again or the Visit Timeout expires. The Visit Timeout is used instead of a session timeout because:• The session timeout may be set arbitrarily high for infrastructure
reasons• There may be a desire to end a portal visit after only a few minutes
of inactivityFor instance, it is safe to assume that the user is no longer “using” the portal after 3 minutes of inactivity. For this reason, a new visit will be tracked the next time that the user clicks on a link in the portal or refreshes the page.
The Visit Timeout can be set in the Analytics Administration utility. For details, see “Configuring Runtime Settings” on page 4-2.
Community Metrics - Traffic The Community Traffic console page displays data regarding community page views. The report displays the most viewed communities (top communities), the least viewed communities (bottom communities), all communities (which is only available in tabular view) and selected communities.
The report data can be viewed by Hits (page views), Visits (consecutive page views within a single community) and Users (unique users who viewed pages within the selected communities).
Community Metrics - Response Time The Response Time console page displays the length of time that has elapsed from when the portal server receives a request for a community page until the time the response is sent to the user. Because the tracking is done on the portal server, the length of time it takes for the response to reach the user's machine and be displayed on the browser is not included in this metric.
This report displays the communities with the fastest response time (top communities), the communities with the slowest response time (bottom communities), all communities (which is only available in tabular view) and selected communities. The report shows maximum, average and minimum response times.
Table 3-1 Descriptions of Analytics Reports
Analytics Report Description

Work ing wi th Anal y t i cs Repor ts
3-4 Administrator Guide for BEA AquaLogic Interaction Analytics
Portlet Metrics - Usage The Portlet Usage console page displays data about clicks within portlets. Analytics tracks user clicks on a gatewayed button or link within portlets.
The report displays the most used portlets (top portlets), the least used portlets (bottom portlets), all portlets (which is only available in tabular view), selected portlets and portlets within selected communities. The report data can be viewed by Activity (portlet clicks) and Users (unique users who used the selected portlets).
Portlet Metrics - Views The Portlet Views console page tracks the number of times a portlet is displayed within the portal. That is, each time a page is viewed, all of the portlets on that page are counted as being viewed.
The report displays the most viewed portlets (top portlets), the least viewed portlets (bottom portlets), all portlets (which is only available in tabular view), selected portlets and portlets within selected communities. The report data can be viewed by Views and Users (unique users who viewed the selected portlets).
Note: Portlet view data only appears in reports when running Analytics on version 5.0.4J/5.0.5J or 6.0 (UNIX and Windows) of the portal.
Portlet Metrics - Response Time The Response Time console page displays the time from when the portal sends a request for a portlet until the time the remote server responds with the portlet content. This report is important because typically a community page response equals the response of the slowest portlet on that page. For this reason, when troubleshooting slow communities it is important to find the worst performing portlet. The amount of time it takes for the response to reach the user's machine and be displayed on the browser is not included in this metric because the tracking occurs on the portal server.
This report displays the portlets with the fastest response time (top portlets), the portlets with the slowest response time (bottom portlets), all portlets (Note: This option is only available in tabular view), selected portlets and portlets within selected communities. The report shows maximum, average or minimum response time.
Note: Response time data only appears in reports when running Analytics on version 5.0.4J/5.0.5J or 6.0 (UNIX and Windows) of the portal.
Table 3-1 Descriptions of Analytics Reports
Analytics Report Description

Overv iew o f Ana l y t i cs Repo r ts
Administrator Guide for BEA AquaLogic Interaction Analytics 3-5
Other Metrics - Search The Search console page tracks portal searches.
The report displays the top search terms. Additionally, for each search term the report displays the number of times the search was performed and abandoned. An abandoned search means that the user did not select any of the search results. Also, for each search term the report displays the documents that the user clicked on. Finally, the report can display searches that returned zero results.
For each search phrase, click the Details link to view the names of the documents that were opened in the search results.
Note: The Other Metrics - Search report only includes abandoned search results, the zero results option, and the Details link when running Analytics on Plumtree Foundation 6.0.
Other Metrics - Documents The Documents console page tracks knowledge directory document views. Document views include documents opened from the directory and search results page. Additionally, document views include documents opened from snapshot and link portlets, and custom portlets that include gatewayed document links.
The report displays the top documents viewed in the portal. Additionally, the report can be used to show the document views of all documents in a particular folder, or in a particular folder and its subfolders.
Other Metrics - Projects The Projects console page displays metrics for AquaLogic Interaction Collaboration. The metrics include document views, new documents and discussion posts.
These three metrics can be used to report on the projects with the most traffic (top projects), projects with the least traffic (bottom projects), all projects (which is only available in tabular view) and selected projects.
Other Metrics - Content Items The Content Items console page tracks AquaLogic Interaction Publisher content item views. A content item view refers to each time a user views a published content item from within a Publisher portlet.
The report displays the most viewed content items (top content items) and the least viewed content items (bottom content items). Additionally, the report can display content item views within a folder or within a folder and its subfolders. Finally, the report can group content item views by Publisher Explorer folders.
Table 3-1 Descriptions of Analytics Reports
Analytics Report Description

Work ing wi th Anal y t i cs Repor ts
3-6 Administrator Guide for BEA AquaLogic Interaction Analytics
Accessing Analytics ReportsTo access Analytics reports:
1. Log in to the portal as an administrator.
Note: If you cannot log in to the portal as the administrator, you must join the Analytics Console community in order to add it to your My Communities list.
2. Choose My Communities | Analytics Console.
The Analytics Console appears, as shown in the following figure.
Figure 3-1 Analytics Console
Managing Security for Analytics ReportsAnalytics reports are intended to make usage metrics visible to a limited set of administrative users who perform particular business functions, such as capacity planning, QoS analysis, ROI analysis, “best bet” customization for Search, and so on.
The Analytics Console and portlet reports contain usage data that is valuable for enterprise portal analysis but might be regarded as private or sensitive to portal users. For example, the Search, Document, Community, and Portlet reports can be configured to display activity metrics for a
Creat ing Ana l y t i cs Por t l e ts
Administrator Guide for BEA AquaLogic Interaction Analytics 3-7
particular user, based on several user properties such as E-mail Address, First Name, or Last Name.
To protect security and privacy interests before you roll out Analytics reports:
Manage administrative access to the Analytics Console and portlet templates.
To ensure that only a limited number of administrative users can add the Analytics Console community to their My Communities or create portlets based on Analytics portlet templates, create a new administrative group and manage group membership accordingly. Members of this administrative group require Read access to the Analytics Console community and Select access to the Admin Objects directory that contains the portlet templates.
Manage user access to Analytics portlets.
When you create portlets, configure metrics that do not contain private or sensitive data unless such a view is particularly intended. If the metrics in the report do contain private or sensitive data, configure security so that only appropriate, specified users have Select access and can therefore add the portlet to their My Pages.
Ensure that guest users are never allowed to add Analytics portlets to their My Pages.
For information on creating administrative groups and managing user and guest access to portal objects, see Administrator Guide for BEA AquaLogic Interaction (Plumtree Foundation).
Note: Users should not add many Analytics portlets to a single My Page; each additional Analytics portlet slows down performance. If users experience unacceptable performance or timeouts, you can recommend that they include fewer Analytics portlets on each My Page.
Creating Analytics PortletsYou can use the Analytics portlet templates to create portlets that provide custom usage reports. For information on creating portlets from portlet templates, see Administrator Guide for BEA AquaLogic Interaction (Plumtree Foundation).
When you create portlets, be sure to consider security and privacy issues, described in “Managing Security for Analytics Reports” on page 3-6.
Working with Analytics - Advanced Tips and TechniquesThis section provides advanced tips and techniques for using Analytics reports and maximizing portal usage tracking.

Work ing wi th Anal y t i cs Repor ts
3-8 Administrator Guide for BEA AquaLogic Interaction Analytics
Tips and Techniques - Using Analytics ReportsThe following table provides tips and techniques for how you can more effectively use Analytics reports to track activity and improve the performance of your portal.
Table 3-2 Tips and Techniques - Using Analytics Reports
Tip Tip
Tip #1: Combine filtering and grouping when viewing reports
Combining filtering and grouping lets you utilize Analytics reports in some powerful ways. For example, you can view a breakdown of sales force activity by city, determine the most active city, then view the departments that are making that city so active. The following example provides steps that you might perform to make these determinations in a similar report of your own:1. Filter the report by the Department user property, which contains the Sales
property value.2. Group the report by the City user property.
The report displays a breakdown of sales force activity by city.3. Determine the most active city in the report.4. Filter the report by the most active city.5. Group the report by the Department user property.
The report displays the departments that are making that city so active.
Tip #2: Use the Analytics Console as a portal “clean up” tool
Analyzing reports that track community, project and portlet usage can help you to improve the performance of your portal. You can use Analytics reports to:• Find the least-active communities and projects in your portal. Once you have
done this, determine if these communities and projects are valuable. If they are not valuable, remove them from your portal.
• Find the communities and portlets that have the slowest performance in your portal, and determine whether you should fix or remove these communities or portlets from your portal; then take appropriate action.

Work ing wi th Ana l y t i cs - Advanced T ips and Techniques
Administrator Guide for BEA AquaLogic Interaction Analytics 3-9
Tips and Techniques - Maximizing Portal Usage TrackingThe following table provides tips and techniques for what you can do within your portal to most effectively track usage.
Table 3-3 Tips and Techniques - Maximizing Usage Tracking
Tip Description
Tip #1: Gateway links in portlets
Configuring your portlets to contain gatewayed links only improves the accuracy of the Portlet Metrics - Usage report.
Tip #2: Import user properties using a profile Web service
Importing user properties makes Analytics reports more powerful and compelling because you can cross-reference user profile data with tracked metrics. For example, if you import the Department and Region user properties, you can easily create reports such as Community Visits by Department and Logins by Region. For details on importing user profile information with profile Web services, see Administrator Guide for BEA AquaLogic Interaction (Plumtree Foundation).

Work ing wi th Anal y t i cs Repor ts
3-10 Administrator Guide for BEA AquaLogic Interaction Analytics

Administrator Guide for BEA AquaLogic Interaction Analytics 4-1
C H A P T E R 4
Using Analytics Administration
This chapter provides information on accessing and working with the Analytics Administration console. It includes the following topics:
Accessing Analytics Administration
Using Analytics Administration
Limiting Access to Analytics Administration
Accessing Analytics AdministrationTo access Analytics Administration:
1. Log in to the portal as an administrator.
2. Click Administration.
3. From the Select Utility drop-down list, choose Analytics Administration.
Using Analytics AdministrationThis section contains the following topics:
Configuring Runtime Settings
Configuring Security Settings
Configuring Partition Settings
Us ing Ana l y t i cs Admin is t ra t i on
4-2 Administrator Guide for BEA AquaLogic Interaction Analytics
Registering Events
Configuring Runtime SettingsThe Runtime Settings page lets you configure timeout periods, enable portlet view and response time data capture, and limit the number of rows in exported reports. The timeout settings that you specify on the Runtime Settings page are only for Analytics reporting purposes; there is no relationship between these timeout settings and other portal timeout settings.
Us ing Ana l y t i cs Admin is t rat i on
Administrator Guide for BEA AquaLogic Interaction Analytics 4-3
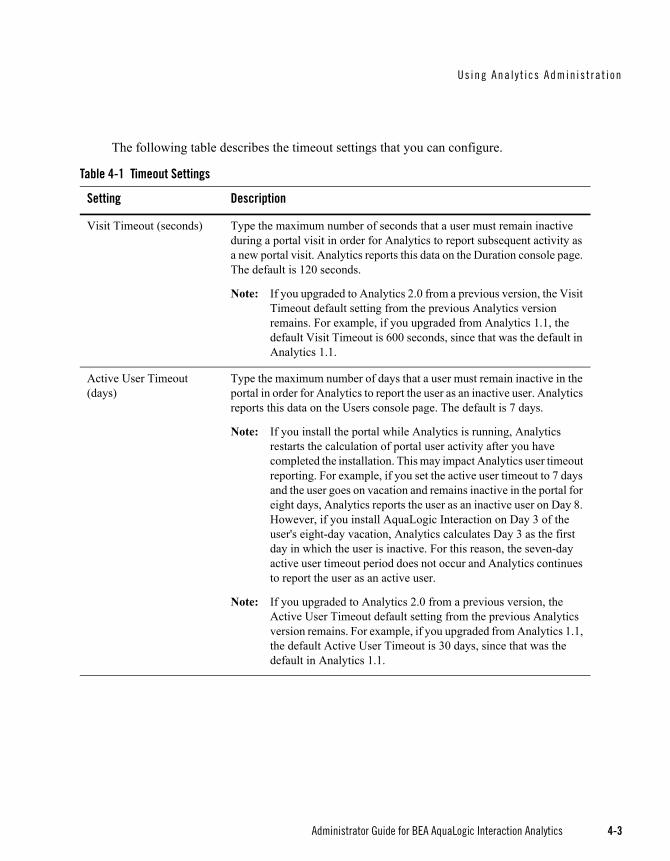
The following table describes the timeout settings that you can configure.
Table 4-1 Timeout Settings
Setting Description
Visit Timeout (seconds) Type the maximum number of seconds that a user must remain inactive during a portal visit in order for Analytics to report subsequent activity as a new portal visit. Analytics reports this data on the Duration console page. The default is 120 seconds.
Note: If you upgraded to Analytics 2.0 from a previous version, the Visit Timeout default setting from the previous Analytics version remains. For example, if you upgraded from Analytics 1.1, the default Visit Timeout is 600 seconds, since that was the default in Analytics 1.1.
Active User Timeout (days)
Type the maximum number of days that a user must remain inactive in the portal in order for Analytics to report the user as an inactive user. Analytics reports this data on the Users console page. The default is 7 days.
Note: If you install the portal while Analytics is running, Analytics restarts the calculation of portal user activity after you have completed the installation. This may impact Analytics user timeout reporting. For example, if you set the active user timeout to 7 days and the user goes on vacation and remains inactive in the portal for eight days, Analytics reports the user as an inactive user on Day 8. However, if you install AquaLogic Interaction on Day 3 of the user's eight-day vacation, Analytics calculates Day 3 as the first day in which the user is inactive. For this reason, the seven-day active user timeout period does not occur and Analytics continues to report the user as an active user.
Note: If you upgraded to Analytics 2.0 from a previous version, the Active User Timeout default setting from the previous Analytics version remains. For example, if you upgraded from Analytics 1.1, the default Active User Timeout is 30 days, since that was the default in Analytics 1.1.
Us ing Ana l y t i cs Admin is t ra t i on
4-4 Administrator Guide for BEA AquaLogic Interaction Analytics
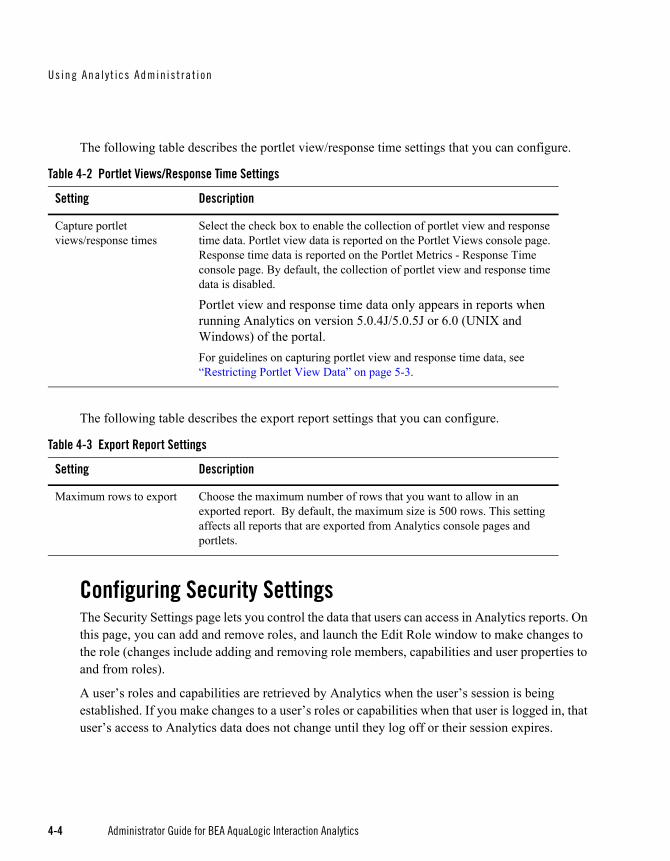
The following table describes the portlet view/response time settings that you can configure.
The following table describes the export report settings that you can configure.
Configuring Security SettingsThe Security Settings page lets you control the data that users can access in Analytics reports. On this page, you can add and remove roles, and launch the Edit Role window to make changes to the role (changes include adding and removing role members, capabilities and user properties to and from roles).
A user’s roles and capabilities are retrieved by Analytics when the user’s session is being established. If you make changes to a user’s roles or capabilities when that user is logged in, that user’s access to Analytics data does not change until they log off or their session expires.
Table 4-2 Portlet Views/Response Time Settings
Setting Description
Capture portlet views/response times
Select the check box to enable the collection of portlet view and response time data. Portlet view data is reported on the Portlet Views console page. Response time data is reported on the Portlet Metrics - Response Time console page. By default, the collection of portlet view and response time data is disabled.
Portlet view and response time data only appears in reports when running Analytics on version 5.0.4J/5.0.5J or 6.0 (UNIX and Windows) of the portal.For guidelines on capturing portlet view and response time data, see “Restricting Portlet View Data” on page 5-3.
Table 4-3 Export Report Settings
Setting Description
Maximum rows to export Choose the maximum number of rows that you want to allow in an exported report. By default, the maximum size is 500 rows. This setting affects all reports that are exported from Analytics console pages and portlets.

Us ing Ana l y t i cs Admin is t rat i on
Administrator Guide for BEA AquaLogic Interaction Analytics 4-5
Super Users RoleThe Super Users role is delivered with Analytics and, by default, is added to Analytics Administration. The Super Users role grants portal Administrators Group and Administrator user access to all capabilities and user properties.
Notes: For new Analytics installations, you must run the User Property Sync Job before assigning user properties to the Super Users role. The User Property Sync Job exists in the Analytics Jobs subfolder within the Analytics subfolder of the Admin Objects directory.
Removing the Super Users role permanently deletes it from the system. To add the Super Users role again, you must re-create it.

Us ing Ana l y t i cs Admin is t ra t i on
4-6 Administrator Guide for BEA AquaLogic Interaction Analytics
CapabilitiesThe following table describes the capabilities that you can assign to roles.
Configuring Partition SettingsThis section discusses the configuration of Analytics Administration’s Partition Settings page. For guidelines on archiving and restoring partitions in your Analytics database, see “Archiving and Restoring Partitions” on page 5-5.
Table 4-4 Analytics Role Capabilities
Capability Description
Export User Details Report Lets the role export user-level data from reports. User-level data is exported into an .xls file that can be used with Microsoft Excel. By default, this capability is not granted. The option to export user-level data exists in these reports:• Summary Metrics - Traffic• Summary Metrics - Logins• Community Metrics - Traffic• Portlet Metrics - Usage• Other Metrics - Search• Other Metrics - Documents• Other Metrics - Projects• Other Metrics - Content Items
Select All/Top/Bottom Options
Lets the role use the All/Top/Bottom display options. The reports that include these display options are: Summary Metrics - Pages, Community Metrics - Traffic, Community Metrics - Response Time, Portlet Metrics - Usage, Portlet Metrics - Views, Portlet Metrics - Response Time, Other Metrics - Documents, Other Metrics - Projects, and Other Metrics - Content Items.
When a role is not granted the capability to select All/Top/Bottom options, the role must choose one community or project; the option that is available depends on the report. By default, this capability is not granted.
View Portal Document Related Data
Lets the role view the Other Metrics - Documents report, as well as view document details in the Other Metrics - Search report. By default, this capability is not granted.
Us ing Ana l y t i cs Admin is t rat i on
Administrator Guide for BEA AquaLogic Interaction Analytics 4-7
Analytics data is segregated into month-by-month partitions in the database. The Partition Settings page lets Portal Administrators specify the number of data partitions that are accessible to Analytics reports. The Analytics Engine regularly scans each data partition that is accessible. For this reason, you can have more control over system performance by limiting the number of accessible partitions to only those that are needed.
At the beginning of each month, the system creates a new partition and stores all new Analytics data in that partition until the month ends.
Note: You also use the Partition Settings page to refresh database views after archiving or restoring partitions. To do so, click Finish. If you do not refresh the database views, Analytics reports will fail.
Working with the Scrolling View WindowThe Scrolling View Window, which you configure on the Partition Settings page, is a rolling database view that changes month-to-month. For example, suppose that on August 5, you enable the Scrolling View Window and set its size to 4 months. The following occurs:
The Scrolling View Window makes data from 4 months available: May, June, July, and August. (Note that even though the month of August has not completed, the Scrolling View Window makes data from the August partition available so that the most current data appears in Analytics reports).
On September 1, the Scrolling View Window scrolls one month forward and makes data from the June, July, August, and September partitions accessible. Though the Scrolling View Window removes the May partition from view, the partition and its data is still stored in the database. In this example, if in December of the same year the Portal Administrator wanted to make the data from the May partition available to reports, he or she would increase the Scrolling View Window size to 8 months so that it includes the May to December time frame.
To set the number of months, that are accessible to Analytics reports, first enable the Scrolling View Window, then specify the number of months: between 3 and 60. Data from monthly partitions that do not fall within the Scrolling View Window size is made unavailable to Analytics reports.
Note: If you do not enable the Scrolling View Window, all data from all partitions is accessible to Analytics reports.

Us ing Ana l y t i cs Admin is t ra t i on
4-8 Administrator Guide for BEA AquaLogic Interaction Analytics
Previewing PartitionsAt any time, you can click Preview on the Partition Settings page to view a chart that displays a representation of all partitions and indicates whether they are available or unavailable to Analytics reports:
Green squares indicate partitions whose data is available to Analytics reports.
Red squares with an X indicate partitions whose data is unavailable to Analytics reports; these partitions still exist in the database.
Grey squares indicate partitions for months that currently fall within the Scrolling View Window's date range, but whose data is unavailable to Analytics reports. This usually occurs after a partition has been archived out of the database.
Registering Events
Overview of Event RegistrationThe Event Registration feature lets Portal Administrators and developers register custom portal and non-portal events that are sent to Analytics using the OpenUsage API. Event data is saved to the Analytics database, which can then be queried for reporting to a non-portal application. This feature's user interface includes the Event Registration and Create Event pages.
Use the Event Registration page to:
Launch the Create Event page, which you use to create events and their parameters.
Enable and disable the storage of data generated by individual events. Once event data is stored in the database, you can query the data for reporting in a portal or non-portal application.
Create dimensions, which are discussed below.
Note: This topic only discusses the Event Registration user interface. To utilize the full capabilities of this feature, you must use the OpenUsage API. For details on using the OpenUsage API, see the document Using the AquaLogic Interaction Analytics OpenUsage API at http://dev2dev.bea.com/pub/a/2006/08/openusage-analytics.html
Overview of Events, Event Parameters, and DimensionsAn event typically defines one user action that you would like to capture. Each event is composed of several event parameters, which defines the various kinds of data that is generated by the

Us ing Ana l y t i cs Admin is t rat i on
Administrator Guide for BEA AquaLogic Interaction Analytics 4-9
event. By default, each event includes the USERID, TIMEID, VISITID, and OCCURRED event parameters (for more details on these parameters, see “Delivered Parameters” on page 4-10).
Event Registration also lets you create your own event parameters to capture data that is not defined by the delivered defaults. To capture data of type Date, Integer, or Float, simply create an event parameter for that data type. To capture data of type String, you must create a dimension to define this data. After you create the dimension, you must create a new event parameter of type String, and associate it to the dimension that you created.
Note: We recommend that you do not create too many dimensions, since they slow down the speed of data collection and reporting.
Event Registration also lets you use dimensions from your own application's tables. To do so, create a parameter of type Integer. Then, using your database schema, map the parameter to the ID column in your dimension table.
Creating Custom DimensionsThe Managed Dimensions section of the Event Registration page lets you create custom dimensions to define data of type String.
To use a dimension, you must associate it to an event parameter on the Edit Event page. You can associate a dimension to multiple event parameters and use that dimension in multiple events.
Dimension names can be up to 20 characters in length and can only include letters, numbers, spaces, and underscores.
The names that you create only define how dimensions appear on the Event Registration page. In the database, custom dimension tables use the following naming convention: ascdim_<dimension_name> (spaces in dimension names are replaced by underscores).
Note: You cannot remove or change the name of a dimension after clicking Finish on the Event Registration page. To do so, contact the Support Center for assistance.
To store only unique values in this dimension's table, check Unique?.
Creating EventsThe Create Event page lets you define the event name and parameters that are included in the event. After you define the event and its parameters, click Finish to save an event and create its fact table in the database. Access the Create Event page by clicking Add on the Event Registration page.

Us ing Ana l y t i cs Admin is t ra t i on
4-10 Administrator Guide for BEA AquaLogic Interaction Analytics
Note: After you save an event, you cannot change the names of the event and its parameters; you also cannot delete parameters from an event. To do any of these, contact the Support Center for assistance. You can, however, add parameters after saving an event.
Event NamesEvent names can be up to 14 characters in length and can only include letters, numbers, spaces, and underscores.
Note: You must set the OpenUsage API to send data to the fact table using the event name that you specified on this page, not its column name in the database.
Table NamesTable names are read-only, and define the name of the fact table that will store the event's data. Custom event tables use the following naming convention in the database: ascfact_<event_name> (spaces in event names are replaced with underscores). For complete details on the fact tables that are delivered with Analytics, see “Working with Delivered Fact Tables” on page 5-4.
Parameter NamesParameter names can be up to 14 characters in length and can only include letters, numbers, spaces, and underscores. Use this parameter name when passing parameters with the OpenUsage API.
Note: You cannot remove or change the name of a parameter after clicking Finish on the New Event page. To do either of these, contact the Support Center for assistance.
Delivered ParametersThe following table describes the parameters that are delivered with Analytics which are, by default, included in every event:
Table 4-5 Parameters Delivered with Analytics
Parameter Description
USERID The ID of the user who triggers the event. You must use the OpenUsage API to set the User ID.
TIMEID The unique ID number that is created for each occurrence of the event. This value is set by Analytics.

L imi t ing Access to Ana l y t i cs Admin is t ra t ion
Administrator Guide for BEA AquaLogic Interaction Analytics 4-11
Saving Event Data To begin saving an event’s data, select the check box next to an event on the Event Registration page and click Enable. By default, the BEA AquaLogic Interaction Analytics Collector Service starts saving the event's data 30 minutes after you click Enable.
Stopping Event Data StorageTo stop saving an event’s data, select the check box next to an event on the Event Registration page and click Disable. You can edit events even when they are disabled. By default, the BEA AquaLogic Interaction Analytics Collector Service stops saving the event's data 30 minutes after you click Disable.
Limiting Access to Analytics AdministrationUsers who have access rights to the Analytics Administration web service have the ability to access the Analytics Administration console by way of its URL, even if these users are not administrators (administrators have access to the Analytics Administration console by way of the portal user interface).
To prevent users from accessing Analytics Administration by way of its URL, remove the users’ access rights to the Analytics Administration web service. For details, see Administrator Guide for BEA AquaLogic Interaction (Plumtree Foundation).
If you want users to access Analytics Administration by way of its URL, you must grant these users (at minimum) Read access to the Analytics Administration web service.
VISITID The portal visit ID of the user who triggered the event.
Note: This parameter is only compatible with events that occur in the portal. This value is set by Analytics.
OCCURRED The date and time when the event was generated. The format of the date/time stamp is determined by your database type. This value is set by Analytics.
Table 4-5 Parameters Delivered with Analytics
Parameter Description

Us ing Ana l y t i cs Admin is t ra t i on
4-12 Administrator Guide for BEA AquaLogic Interaction Analytics
Administrator Guide for BEA AquaLogic Interaction Analytics 5-1
C H A P T E R 5
Managing the Analytics Database
This chapter includes the following topics:
Sizing the Analytics Database
Archiving and Restoring Partitions
Sizing the Analytics DatabaseThis section provides information and recommendations that should help you manage the size and growth of your Analytics database to, which should increase performance. It includes the following topics:
Overview of Analytics Database Growth
Restricting Portlet View Data
Tuning the Analytics Database - Oracle
Overview of Analytics Database GrowthThe majority of growth in the Analytics database occurs in the fact tables that are delivered with Analytics. The rest of the delivered Analytics tables -- including dimension tables -- generate negligible growth in the Analytics database. This section provides details on the growth of fact and dimension tables.
Managing the Analy t ics Database
5-2 Administrator Guide for BEA AquaLogic Interaction Analytics
Fact Table GrowthFact tables capture event parameter data of types Date, Integer, and Float. Of the delivered Analytics fact tables, the ASFACT_PAGEVIEWS, ASFACT_PORTLETUSES, and ASFACT_PORTLETVIEWS tables grow at the fastest rate. For this reason, you should closely monitor these tables. For a complete list of delivered fact tables, see “Working with Delivered Fact Tables” on page 5-4.
Custom events that you create and register using the Event Registration section of Analytics Administration are also stored in fact tables. If you expect any of your custom events to generate large volumes of data (in the range of one million events per year), we recommend that you monitor their tables, and perhaps archive older partitions. For guidelines on archiving and restoring partitions, see “Archiving and Restoring Partitions” on page 5-5.
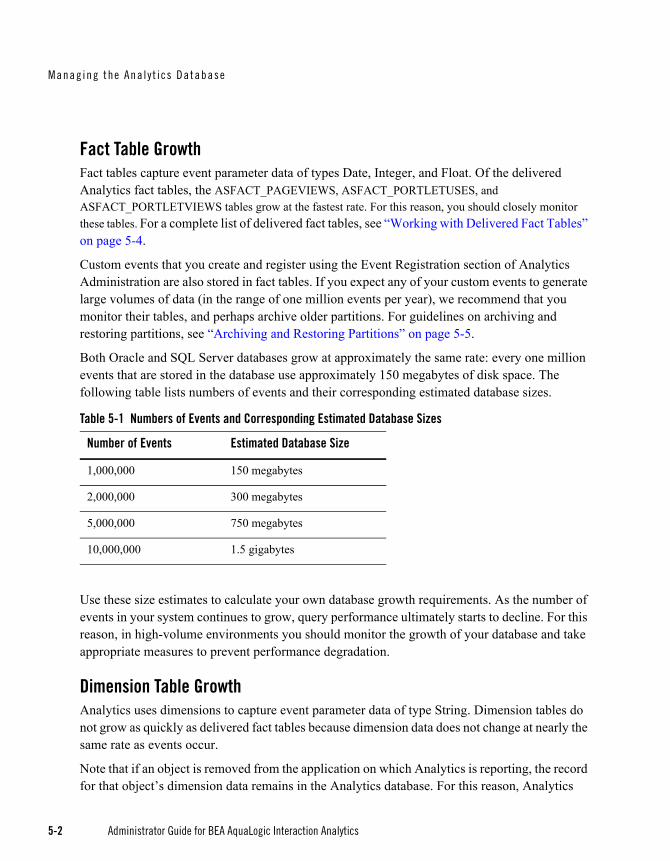
Both Oracle and SQL Server databases grow at approximately the same rate: every one million events that are stored in the database use approximately 150 megabytes of disk space. The following table lists numbers of events and their corresponding estimated database sizes.
Use these size estimates to calculate your own database growth requirements. As the number of events in your system continues to grow, query performance ultimately starts to decline. For this reason, in high-volume environments you should monitor the growth of your database and take appropriate measures to prevent performance degradation.
Dimension Table GrowthAnalytics uses dimensions to capture event parameter data of type String. Dimension tables do not grow as quickly as delivered fact tables because dimension data does not change at nearly the same rate as events occur.
Note that if an object is removed from the application on which Analytics is reporting, the record for that object’s dimension data remains in the Analytics database. For this reason, Analytics
Table 5-1 Numbers of Events and Corresponding Estimated Database Sizes
Number of Events Estimated Database Size
1,000,000 150 megabytes
2,000,000 300 megabytes
5,000,000 750 megabytes
10,000,000 1.5 gigabytes

Si z ing the Analy t ics Database
Administrator Guide for BEA AquaLogic Interaction Analytics 5-3
continues to report the events that occurred on this object before it was removed from the application.
Restricting Portlet View DataPortlet views are the most heavily-generated events in the system. For this reason, we recommend that you do not collect portlet view data continuously, which results in tripling the growth rate of your database. Instead, you should only “sample” portlet views periodically. To do this, enable the Capture portlet views/response times option for a limited period of time, such as one or two weeks. You enable this option in Analytics Administration’s Runtime Settings page. For details, see “Configuring Runtime Settings” on page 4-2.
If you decide to continuously collect portlet view data, you should aggressively archive older data partitions to prevent the database from reaching its capacity too quickly.
Portlet view data is reported on the Portlet Metrics - Views console page. Response time data is reported on the Portlet Metrics - Response Time console page.
Note: Portlet view and response time data only appears in reports when running Analytics on version 5.0.4J/5.0.5J or 6.0 (UNIX and Windows) of the portal.
Tuning the Analytics Database - OracleTo obtain the best performance with Oracle, we recommend that you:
Edit the create_analytics_tablespaces.sql script and include appropriate sizing information for your database. The create_analytics_tablespaces.sql script is located in a platform-specific subdirectory within the Analytics database’s host computer.
Note: The default values in the create_analytics_tablespaces.sql script are acceptable for a development or staging database. You should, however, change these values accordingly in a production environment.
Move the ANALYTICSTABLE tablespace to a different drive than the one used for the ANALYTICSINDEX tablespace.
Managing the Analy t ics Database
5-4 Administrator Guide for BEA AquaLogic Interaction Analytics
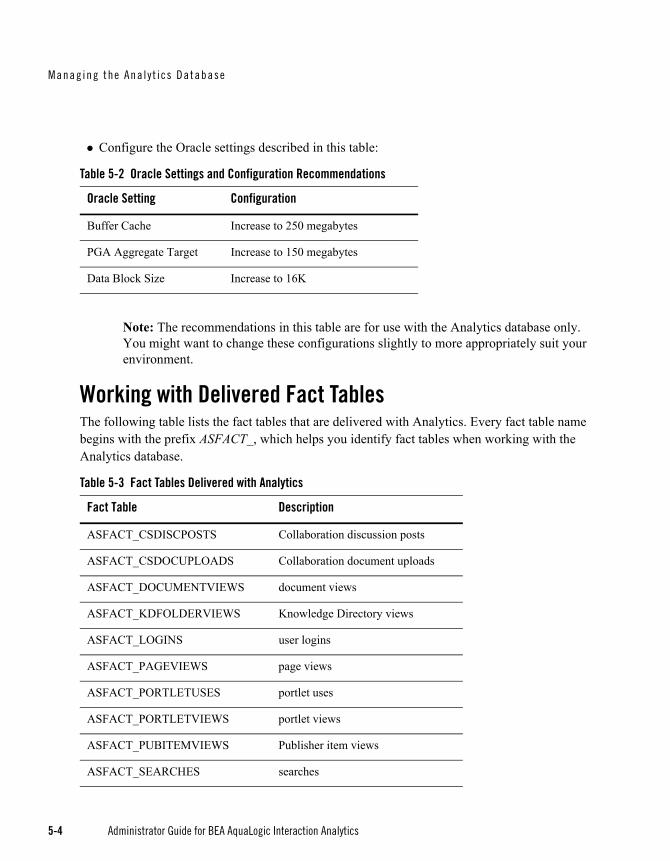
Configure the Oracle settings described in this table:
Note: The recommendations in this table are for use with the Analytics database only. You might want to change these configurations slightly to more appropriately suit your environment.
Working with Delivered Fact TablesThe following table lists the fact tables that are delivered with Analytics. Every fact table name begins with the prefix ASFACT_, which helps you identify fact tables when working with the Analytics database.
Table 5-2 Oracle Settings and Configuration Recommendations
Oracle Setting Configuration
Buffer Cache Increase to 250 megabytes
PGA Aggregate Target Increase to 150 megabytes
Data Block Size Increase to 16K
Table 5-3 Fact Tables Delivered with Analytics
Fact Table Description
ASFACT_CSDISCPOSTS Collaboration discussion posts
ASFACT_CSDOCUPLOADS Collaboration document uploads
ASFACT_DOCUMENTVIEWS document views
ASFACT_KDFOLDERVIEWS Knowledge Directory views
ASFACT_LOGINS user logins
ASFACT_PAGEVIEWS page views
ASFACT_PORTLETUSES portlet uses
ASFACT_PORTLETVIEWS portlet views
ASFACT_PUBITEMVIEWS Publisher item views
ASFACT_SEARCHES searches

Arch iv ing and Res to r ing Par t i t i ons
Administrator Guide for BEA AquaLogic Interaction Analytics 5-5
For descriptions of all tables that are delivered with Analytics, see the Database_Schema_BEA_AquaLogic_Interaction_Analytics_v2.0.pdf document in the release package.
Archiving and Restoring PartitionsThis section provides guidelines for archiving and restoring the partitions within your Analytics database. For details on using Analytics Administration’s Partition Settings page, see “Configuring Partition Settings” on page 4-6.
To maintain a steady size of your Analytics database and keep your queries performing quickly, we recommend archiving partitioned data that is greater than six months old. You can identify partitioned tables by their date/year suffix. For example: _08_2006.
After archiving or restoring partitions, you must refresh the database views by clicking Finish on the Partition Settings page. If you do not refresh the database views, Analytics reports will fail.
Caution: Never remove the current fact table, which is not partitioned. Also, never remove database views. Instead, use the scrolling view window to set the number of partitions that are accessible to Analytics reports.

Managing the Analy t ics Database
5-6 Administrator Guide for BEA AquaLogic Interaction Analytics
Administrator Guide for BEA AquaLogic Interaction Analytics 6-1
C H A P T E R 6
Synchronizing Analytics
This chapter includes the following topics:
Overview of Analytics Synchronization
Performing Force Synchronizations
Strategizing Synchronization Scheduling
Overview of Analytics SynchronizationAnalytics synchronization is a process by which object dimension data is sent from the remote database to the dimension tables of the Analytics database, where the data is stored. The Automation Service runs the synchronization process using the Analytics sync jobs that are delivered with Analytics. Dimension data is transferred through a JDBC connection.
An Analytics sync job exists for each object. The Analytics Jobs subfolder exists within the Analytics subfolder of the Admin Objects directory. For a complete list of synchronized objects and their associated products and Automation Service jobs, see “Synchronized Dimension Data and Associated Jobs” on page 6-3.
The Automation Service automatically runs all Analytics sync jobs after you have installed or upgraded Analytics (including having added Analytics jobs to the Automation Service). The first synchronization is a full synchronization, in which the sync jobs transfer dimension data about all of the products’ reported objects and populate the Analytics database’s job records.
After this initial synchronization, the Automation Service automatically and regularly runs partial synchronizations, in which all Analytics sync jobs transfer only dimension data about

Synchron i z ing Ana ly t ics
6-2 Administrator Guide for BEA AquaLogic Interaction Analytics
objects that are new or have been changed since the previous synchronization. Note that if an object is removed from the application on which Analytics is reporting, the record for that object’s dimension data remains in the Analytics database. For this reason, Analytics continues to report the events that occurred on this object before it was removed from the application.
By default, the Automation Service performs a partial synchronization once per day. You can, however, edit each sync job’s schedule to better suit your environment and its usage patterns. For synchronization scheduling guidelines, see “Strategizing Synchronization Scheduling” on page 6-5.
You can find details of sync jobs in the portal's job history log or in Analytics's sync.log file. For the location of the Analytics sync.log file, see “Overview of Logs” on page A-2.

Overv iew o f Ana l y t ics Synchron i zat ion
Administrator Guide for BEA AquaLogic Interaction Analytics 6-3
Synchronized Dimension Data and Associated JobsThe following table lists the products that are synchronized with Analytics, the objects whose dimension data is synchronized, and the Analytics job that triggers synchronization of that dimension data. The Analytics Jobs subfolder exists within the Analytics subfolder of the Admin Objects directory.
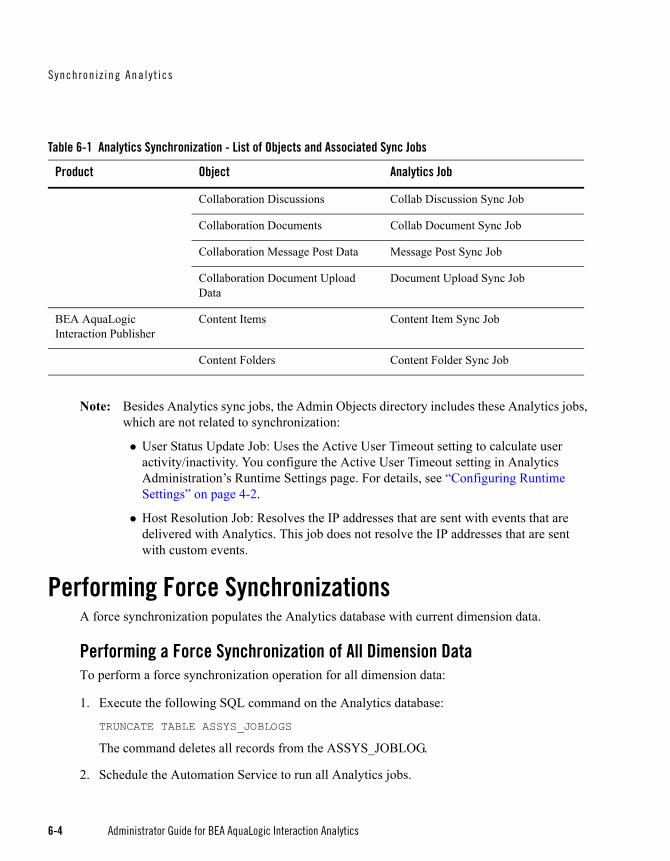
Table 6-1 Analytics Synchronization - List of Objects and Associated Sync Jobs
Product Object Analytics Job
BEA AquaLogic Interaction (“portal”)
Communities Community Sync Job
Community Pages Community Page Sync Job
Portlets Portlet Sync Job
Auth Sources Auth Source Sync Job
Community to Portlet Relationships Community Portlet Map Sync Job
Directory Folders Directory Folder Sync Job
Document Data Sources Document Data Source Sync Job
KD Documents Document Sync Job
KD Document to Directory Folder Relationships
Document Folder Map Sync Job
User Properties Property Sync Job
User Property Values User Property Sync Job
Note: User property values that are over 255 characters in length are truncated to 255 characters in the Analytics database. The user property values are not altered in the portal database.
Users User Sync Job
BEA AquaLogic Interaction Collaboration
Collaboration Projects Collab Project Sync Job
Synchron i z ing Ana ly t ics
6-4 Administrator Guide for BEA AquaLogic Interaction Analytics
Note: Besides Analytics sync jobs, the Admin Objects directory includes these Analytics jobs, which are not related to synchronization:
User Status Update Job: Uses the Active User Timeout setting to calculate user activity/inactivity. You configure the Active User Timeout setting in Analytics Administration’s Runtime Settings page. For details, see “Configuring Runtime Settings” on page 4-2.
Host Resolution Job: Resolves the IP addresses that are sent with events that are delivered with Analytics. This job does not resolve the IP addresses that are sent with custom events.
Performing Force SynchronizationsA force synchronization populates the Analytics database with current dimension data.
Performing a Force Synchronization of All Dimension DataTo perform a force synchronization operation for all dimension data:
1. Execute the following SQL command on the Analytics database:
TRUNCATE TABLE ASSYS_JOBLOGS
The command deletes all records from the ASSYS_JOBLOG.
2. Schedule the Automation Service to run all Analytics jobs.
Collaboration Discussions Collab Discussion Sync Job
Collaboration Documents Collab Document Sync Job
Collaboration Message Post Data Message Post Sync Job
Collaboration Document Upload Data
Document Upload Sync Job
BEA AquaLogic Interaction Publisher
Content Items Content Item Sync Job
Content Folders Content Folder Sync Job
Table 6-1 Analytics Synchronization - List of Objects and Associated Sync Jobs
Product Object Analytics Job
St rateg i z ing Synchron i zat ion Schedu l ing
Administrator Guide for BEA AquaLogic Interaction Analytics 6-5
The Analytics jobs populate the Analytics database with current dimension data.
Performing a Force Synchronization of a Single Object’s Dimension DataTo perform a force synchronization of a single object’s dimension data:
1. Delete the log records for the object’s associated sync job.
The log records are located in the ASSYS_JOBLOGS table.
2. Schedule the Automation Service to run the object’s associated sync job.
The Analytics job populates the Analytics database with the object’s dimension data.
For descriptions of all tables that are delivered with Analytics, see the Database_Schema_BEA_AquaLogic_Interaction_Analytics_v2.0.pdf document in the release package.
Strategizing Synchronization SchedulingBecause some dimension data in you environment might change more frequently than other dimension data, we recommend that you adopt a job scheduling strategy that reflects your environment’s unique circumstances.
Following are some examples of scheduling strategies that you can adopt:
If your portal contains objects that rarely change, run the appropriate Analytics sync job manually. For example, if your portal’s authentication sources rarely change, run the Auth Source Sync Job manually.
If your portal contains objects that change only once per week, schedule the appropriate Analytics sync job to run once per week. For example, if new portlets and communities are added to your production portal once per week, schedule the appropriate sync job to run once per week.
If your portal contains data that changes on a constant basis, schedule the appropriate Analytics sync job to run frequently. For example, if your registration Web site creates portal user accounts throughout the day, schedule the User Sync Job to run once per hour.
For complete details on how to schedule Automation Service jobs, see Administrator Guide for BEA AquaLogic Interaction (Plumtree Foundation).

Synchron i z ing Ana ly t ics
6-6 Administrator Guide for BEA AquaLogic Interaction Analytics

Administrator Guide for BEA AquaLogic Interaction Analytics A-1
A P P E N D I X A
Troubleshooting
This appendix provides information on troubleshooting problems that occur in Analytics runtime. It includes the following topics:
Overview of Logs
Troubleshooting Common Runtime Problems
Note: For details on troubleshooting the installation and configuration of Analytics, see Installation and Upgrade Guide for BEA AquaLogic Interaction Analytics.
Troub leshoot ing
A-2 Administrator Guide for BEA AquaLogic Interaction Analytics
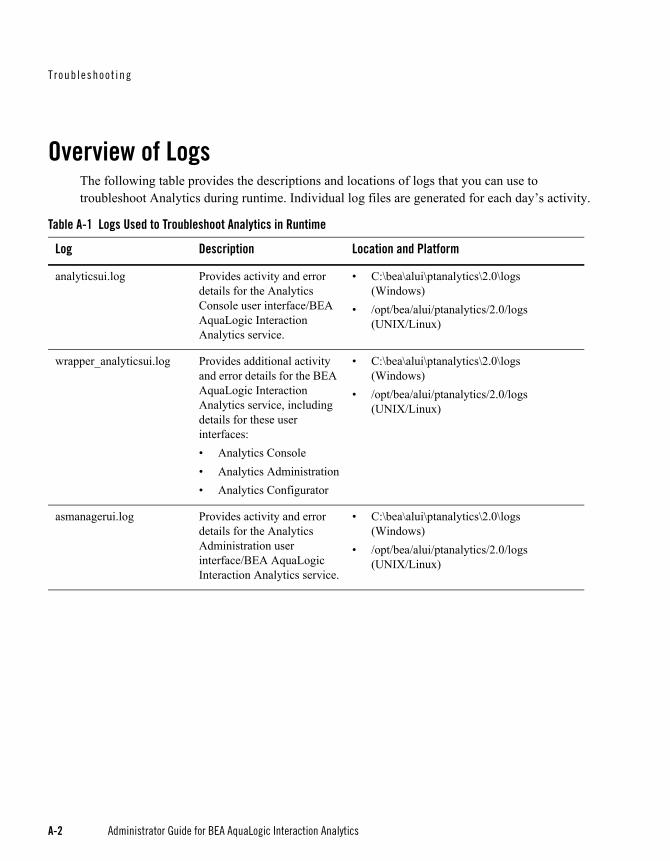
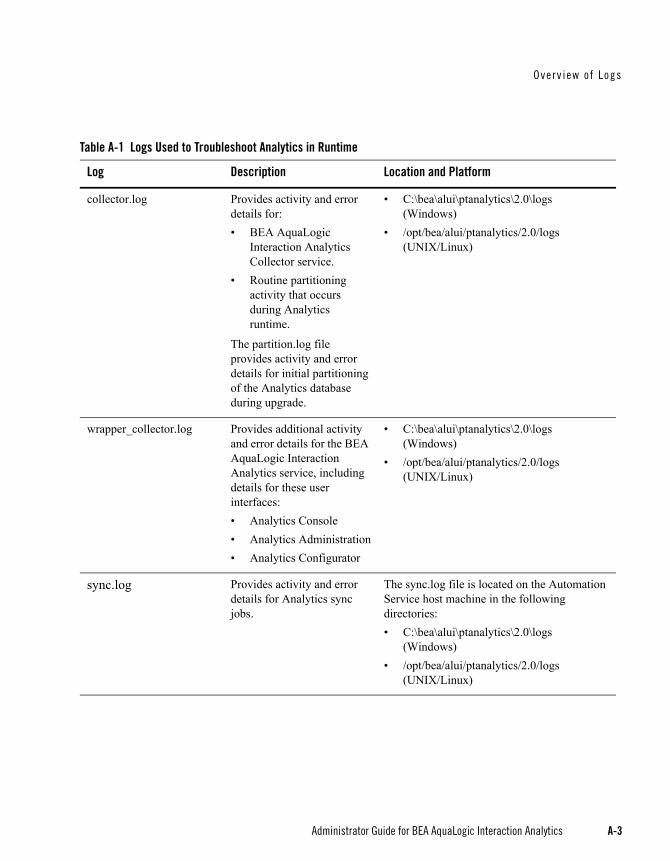
Overview of LogsThe following table provides the descriptions and locations of logs that you can use to troubleshoot Analytics during runtime. Individual log files are generated for each day’s activity.
Table A-1 Logs Used to Troubleshoot Analytics in Runtime
Log Description Location and Platform
analyticsui.log Provides activity and error details for the Analytics Console user interface/BEA AquaLogic Interaction Analytics service.
• C:\bea\alui\ptanalytics\2.0\logs(Windows)
• /opt/bea/alui/ptanalytics/2.0/logs(UNIX/Linux)
wrapper_analyticsui.log Provides additional activity and error details for the BEA AquaLogic Interaction Analytics service, including details for these user interfaces:• Analytics Console• Analytics Administration• Analytics Configurator
• C:\bea\alui\ptanalytics\2.0\logs(Windows)
• /opt/bea/alui/ptanalytics/2.0/logs(UNIX/Linux)
asmanagerui.log Provides activity and error details for the Analytics Administration user interface/BEA AquaLogic Interaction Analytics service.
• C:\bea\alui\ptanalytics\2.0\logs(Windows)
• /opt/bea/alui/ptanalytics/2.0/logs(UNIX/Linux)
Ove rv iew o f Logs
Administrator Guide for BEA AquaLogic Interaction Analytics A-3
collector.log Provides activity and error details for:• BEA AquaLogic
Interaction Analytics Collector service.
• Routine partitioning activity that occurs during Analytics runtime.
The partition.log file provides activity and error details for initial partitioning of the Analytics database during upgrade.
• C:\bea\alui\ptanalytics\2.0\logs(Windows)
• /opt/bea/alui/ptanalytics/2.0/logs(UNIX/Linux)
wrapper_collector.log Provides additional activity and error details for the BEA AquaLogic Interaction Analytics service, including details for these user interfaces:• Analytics Console• Analytics Administration• Analytics Configurator
• C:\bea\alui\ptanalytics\2.0\logs(Windows)
• /opt/bea/alui/ptanalytics/2.0/logs(UNIX/Linux)
sync.log Provides activity and error details for Analytics sync jobs.
The sync.log file is located on the Automation Service host machine in the following directories:• C:\bea\alui\ptanalytics\2.0\logs
(Windows)• /opt/bea/alui/ptanalytics/2.0/logs
(UNIX/Linux)
Table A-1 Logs Used to Troubleshoot Analytics in Runtime
Log Description Location and Platform

Troub leshoot ing
A-4 Administrator Guide for BEA AquaLogic Interaction Analytics
Troubleshooting Common Runtime ProblemsThe following table describes common runtime problems and provides solutions to them.
Table A-2 Common Runtime Problems and Solutions
Problem Description and Details Cause and Solution
• Problem: No data is being generated in the report.
• Details: Analytics reports are not being populated with data.
• Cause 1: The Interaction component has the incorrect server name for the host of Analytics Services.
• Solution 1: Re-run the installer on the portal server(s), providing the correct information for the host of Analytics Services. Make sure that you type the fully qualified domain name of the host computer on which you installed Analytics Services (not the host computer(s) on which you installed AquaLogic Interaction). For more information, see Installation and Upgrade Guide for BEA AquaLogic Interaction Analytics.
• Cause 2: The BEA AquaLogic Interaction Analytics Collector service is not running.
• Solution 2: Verify that the BEA AquaLogic Interaction Analytics Collector service is started. For details, see Installation and Upgrade Guide for BEA AquaLogic Interaction Analytics.
• Cause 3: You did not redeploy the portal.war or portal.ear file to your portal application server after installing the Interaction component.
• Solution 3: Perform one of the following: – If you are running on Java, restart the application
server. Then redeploy your portal.war or portal.ear file to your portal application server.
– If you are running on IIS, restart the application server. For instructions, see your application server’s documentation.
• Cause 4: You did not refresh the database views after archiving or restoring partitions.
• Solution 4: After archiving or restoring partitions, you must refresh the database views by clicking Finish on the Partition Settings page in Analytics Administration.

Troub leshoot ing Common Runt ime Prob lems
Administrator Guide for BEA AquaLogic Interaction Analytics A-5
• Problem: Unacceptable portlet performance.
• Details: Users are experiencing unacceptable performance or timeouts when using the Analytics portlets.
• Cause 1: Too many Analytics portlets have been added to a single My Page.
• Solution 1: Encourage users to include fewer Analytics portlets on a single My Page.
• Cause 2: Reports with very large amounts of data are timing out.• Solution 2: You may be able to solve this problem by changing the
Gateway Timeout setting in the report’s web service to a higher value.
• Problem: When using filtering options, reports do not query on all data.
• Details: Reports only query on data that is associated to properties included in the filter.
• Example: A company employs 10,000 employees. Only the 200 newest employees are assigned to Departments in their user profiles. The administrator runs a report and queries on a date range, and filters on the Department property, containing the “Human Resources” property value. The report only filters through the 200 newest employees, since only those employees are assigned to a Department. The report does not filter through the other 800 employees, since those employees are not assigned to a Department.
• Solution: This behavior works as designed. If you want your filtered reports to query on all data, make sure that all data is associated to properties that are included in the filters. Using the example, if you want the report to filter through all 10,000 employees, then you must make sure that all 10,000 employees are assigned to a Department.
Table A-2 Common Runtime Problems and Solutions
Problem Description and Details Cause and Solution

Troub leshoot ing
A-6 Administrator Guide for BEA AquaLogic Interaction Analytics
• Problem: The text in Japanese reports does not appear correctly.
• Details: The Y axis does not display Japanese characters.
• Cause: The analytics.war file is not configured to display Japanese characters in the Y axis of Analytics reports.
• Solution: Configure the AnalyticsUIParams.properties file to include font settings that are appropriate to your locale and platform:
1. Unpack the analytics.war file. 2. Open the AnalyticsUIParams.properties file for editing. You can
find this file in the analyticsui.jar file.3. Add these locale entries:
<LocaleCode>_font_<OSName>=<LocalFont>
<LocaleCode>_fontSize=14
<LocaleCode>_fontSmallSize=10
4. Save and repackage .war file.
The locale entries should include these values:• <LocaleCode> should include the appropriate two letter language
code• <OSName> should include your operating system: Windows,
Solaris, or Linux• <LocalFont> should include the name of the font that is
appropriate to your locale and platform
Windows example:
ja_font_Windows=MS PGothic
ja_fontSize=14
ja_fontSmallSize=10
Table A-2 Common Runtime Problems and Solutions
Problem Description and Details Cause and Solution

Troub leshoot ing Common Runt ime Prob lems
Administrator Guide for BEA AquaLogic Interaction Analytics A-7
• Problem: Usage data for cached portlets does not appear in the Portlet Metrics - Usage report.
• Details: Portlet usage events for gatewayed portlets are not recording cached portlet uses on the browser.
• Cause: The http headers have not been set to return “no-cache”.• Solution: Set the http headers to return "no-cache". Visit this URL
for the http header specification protocol: http://www.w3.org/Protocols/rfc2616/rfc2616-sec14.html
Table A-2 Common Runtime Problems and Solutions
Problem Description and Details Cause and Solution

Troub leshoot ing
A-8 Administrator Guide for BEA AquaLogic Interaction Analytics

Administrator Guide for BEA AquaLogic Interaction Analytics Index-1
Index
Aactive user timeout, configuring 4-3administration. See Analytics Administrationadministrative access, managing 3-7All/Top/Bottom options, enabling access 4-6Analytics
about 2-1architecture 2-2portlet templates 3-7reports 3-2services 2-3
Analytics Administrationaccessing 4-1limiting access 4-11runtime settings 4-2using 4-1
Analytics databaseabout 2-3dimension naming convention 4-9estimated sizes 5-2growth 5-1sizing 5-1tuning for Oracle 5-3
Analytics database viewswarning about removal 5-5
Analytics portlet templatesabout 3-7managing administrative access 3-7
Analytics portletsmanaging guest user access 3-7performance problems A-5
Analytics reportsaccessing 3-6
security 3-6Analytics service. See BEA AquaLogic Interaction Analytics serviceAnalytics services 2-3Analytics sync jobs 6-3ANALYTICSINDEX tablespace 5-3ANALYTICSTABLE tablespace 5-3analyticsui.log A-2architecture 2-2asmanagerui.log A-2ASSYS_JOBLOG 6-4Auth Source Sync Job 6-3Automation Service component 2-3Automation Service jobs 6-3
BBEA AquaLogic Interaction Analytics Collector service 2-3BEA AquaLogic Interaction Analytics service 2-3Buffer Cache (Oracle setting) 5-4
Ccapabilities 4-6Capture portlet views/response times 4-4Collab Discussion Sync Job 6-4Collab Document Sync Job 6-4Collab Project Sync Job 6-3Collaboration
discussion posts fact table 5-4document uploads fact table 5-4synchronization with 6-3

Index-2 Administrator Guide for BEA AquaLogic Interaction Analytics
Collector service. See BEA AquaLogic Interaction Analytics Collector servicecollector.log A-3Community Page Sync Job 6-3Community Portlet Map Sync Job 6-3Community Sync Job 6-3Community Traffic report 3-3configuring data capture 4-4Content Folder Sync Job 6-4Content Item Sync Job 6-4Content Items report 3-5Create Event page 4-9create_analytics_tablespaces.sql 5-3custom dimensions 4-9custom events
creating 4-9recommendation for monitoring 5-2
DData Block Size (Oracle setting) 5-4database. See Analytics databasedefaults
active user timeout 4-3event parameters 4-9Export User Details Report capability 4-6maximum rows to export 4-4portlet view and response time data
collection 4-4saving of event data 4-11Select All/Top/Bottom Options capability
4-6stopping event data storage 4-11Super Users role 4-5synchronization frequency 6-2values in create_analytics_tablespaces.sql
5-3View Portal Document Related Data
capability 4-6visit timeout period 4-3
dimension names 4-9
dimension tablesdefined 5-2growth 5-2
dimensionscustom 4-9forcing synchronization 6-4name length 4-9
Directory Folder Sync Job 6-3Document Data Source Sync Job 6-3Document Folder Map Sync Job 6-3Document Sync Job 6-3Document Upload Sync Job 6-4document views fact table 5-4documentation 1-3Documents report
about 3-5enabling access 4-6
Duration report 3-3
Eevent names 4-10event parameters. See parametersEvent Registration page 4-8events
defined 4-8name length 4-10saving data 4-11table naming convention 4-10
Export User Details Report capability 4-6
Ffact tables
defined 5-2delivered 5-4growth 5-2naming convention 4-10warning about removing 5-5
filtering 3-8force synchronizations 6-4full synchronization 6-1

Administrator Guide for BEA AquaLogic Interaction Analytics Index-3
Ggatewayed links 3-9grouping 3-8guest users
managing access to portlets 3-7
HHost Resolution Job 6-4
IImage Service component 2-3Interaction component 2-3IP addresses, resolving 6-4
KKnowledge Directory views fact table 5-4
LLogins report 3-2logs A-2
Mmanaged dimensions 4-9Maximum rows to export 4-4Message Post Sync Job 6-4My Pages, managing guest user access 3-7
OOCCURRED parameter 4-11OpenUsage API 2-3Oracle database, tuning 5-3
Ppage views fact table 5-4Pages report 3-2
parametersdefined 4-8delivered 4-10name length 4-10
partial force synchronization 6-5partial synchronization, defined 6-1Partition Settings page 4-7partitions
about 4-7archiving and restoring guidelines 5-5previewing 4-8
PGA Aggregate Target (Oracle setting) 5-4portal
cleaning up 3-8synchronization with 6-3
Portlet Sync Job 6-3portlet templates. See Analytics portlet templatesPortlet Usage report
about 3-4improving accuracy 3-9
portlet uses fact table 5-4portlet views
configuring the capture of 4-4fact table 5-4
Portlet Views report 3-4portlets
gatewayed links 3-9restricting view data 5-3
portlets. See also Analytics portletsproblems with viewing data A-3Projects report 3-5Property Sync Job 6-3Publisher item views fact table 5-4Publisher, synchronization with 6-4
Rreports
descriptions 3-2managing administrative access 3-7maximizing 3-8

Index-4 Administrator Guide for BEA AquaLogic Interaction Analytics
Response Time report (community metrics) 3-3Response Time report (portlet metrics) 3-4response times, configuring the capture of 4-4rows, configuring maximum number for export 4-4runtime problems A-3Runtime Settings page 4-2
SScrolling View Window 4-7Search report
about 3-5enabling user access to document details 4-6
searches fact table 5-4security
Analytics Administration 4-11managing for Analytics reports 3-6Security Settings page 4-4
Select All/Top/Bottom Options capability 4-6services 2-3Super Users role 4-5sync jobs. See Analytics sync jobssync.log A-3synchronization
about 6-1full 6-1partial 6-1scheduling 6-5
Ttablespaces, separating 5-3TIMEID parameter 4-10Traffic report 3-2troubleshooting A-3
Uuser access, managing 3-7user logins fact table 5-4user properties
assigning to Super Users role 4-5reasons for importing 3-9
User Property Sync Job 6-3User Status Update Job 6-4User Sync Job 6-3USERID parameter 4-10user-level data, enabling access 4-6Users report 3-2
VView Portal Document Related Data capability 4-6visit timeout period, configuring 4-3VISITID parameter 4-11
Wwrapper_analyticsui.log A-2wrapper_collector.log A-3