Embed Size (px)
Citation preview

Munich, 16 August 2019
BayernLB Group financial report H1 2019 BayernLB continues to post solid performance

Contents › Results of operations
› Detailed charts
2

3
Solid capital base:
CET1 ratio at 14.1%1
H1 2019 Earnings boosted by one-off
income, which was, however,
lower than the year-before
period
Operating income on target – net
interest and net commission income on
par with H1 2018 at over EUR 1 bn
Good profit before taxes of EUR 315 m
after charges for the bank levy and deposit
guarantee scheme of EUR 119 m
Good portfolio quality results in low risk
provisions; NPL ratio remains very low
at 0.7%
1 Before acceptance of the positive effects from the half-yearly financial statements by the supervisory authorities

4
Earnings in line with our expectations, decrease due to lower one-off income
452
315
H1 2019 H1 2018
Profit before taxes
EUR m Consolidated profit/loss
EUR m
CIR
In %
RoE
In %
342 294
H1 2018 H1 2019
H1 2018 H1 2019
59.5 61.2
H1 2018 H1 2019
10.0
6.5

5
Sound capital base enables moderate growth
Total assets
EUR bn RWAs
EUR bn
CET1 capital
EUR bn
CET1 capital ratio
in %
Dec 2018
240.3
Jun 2019
220.2 65.6
Dec 2018 Jun 2019
67.6
Jun 2019 Dec 2018
10.0 9.6 1
Dec 2018
14.1 1
Jun 2019
15.2
1 Before acceptance of the positive effects from the half-yearly financial statements by the supervisory authorities

6
Net interest and net commission income on par with H1 2018 at approx. EUR 1 bn
› Net interest income in line with our expectations in
an intensely competitive environment
› Net interest income rose at BayernLB, while it fell
slightly at DKB
› Increase of some 7%
› Positive contribution from Group subsidiaries
Net interest income
EUR m
Net commission income
EUR m
879 870
H1 2019 H1 2018
132 141
H1 2018 H1 2019
7
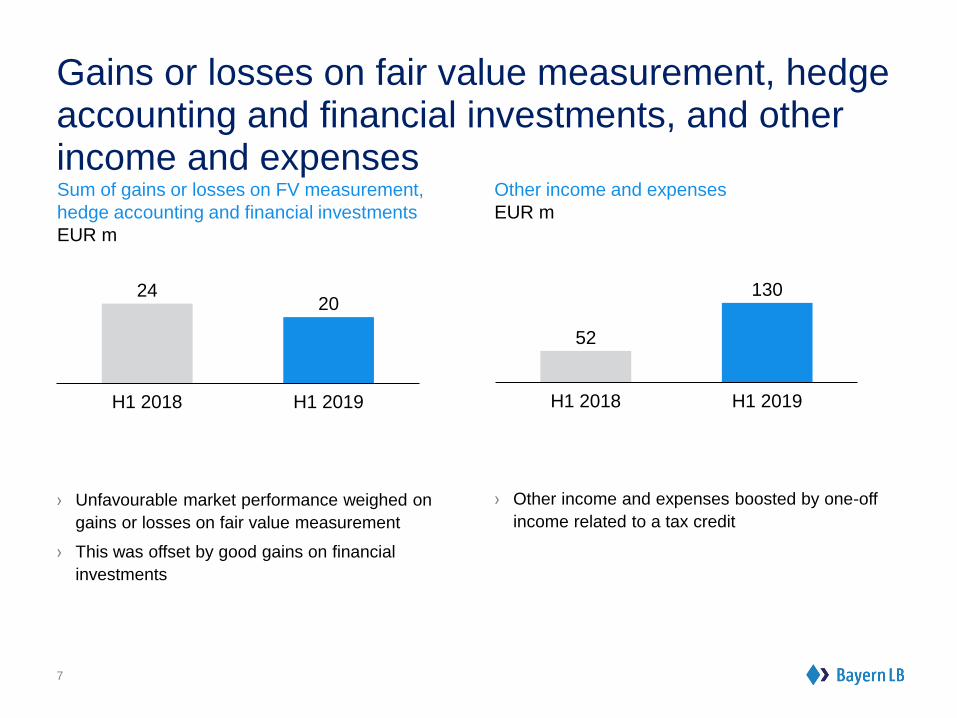
Gains or losses on fair value measurement, hedge accounting and financial investments, and other income and expenses
› Unfavourable market performance weighed on
gains or losses on fair value measurement
› This was offset by good gains on financial
investments
› Other income and expenses boosted by one-off
income related to a tax credit
Sum of gains or losses on FV measurement,
hedge accounting and financial investments
EUR m
Other income and expenses
EUR m
24 20
H1 2019 H1 2018
52
130
H1 2018 H1 2019

8
Higher administrative expenses; very low risk provisions
› Higher expenses for major regulatory projects and
investments in sales activities, digitalisation and
Group-wide strategic initiatives
Administrative expenses
EUR m
-644 -713
H1 2019 H1 2018
› Very low risk provisions; year-before period buoyed
by high releases and recoveries on written down
receivables
› NPL ratio remains very good at 0.7%
Risk provisions
EUR m
103
-10
H1 2018 H1 2019

9
Major earnings contributions from real estate business and DKB
Profit before taxes by segment
EUR m
DKB
204 147
Corporates &
Mittelstand
181
57
Real Estate &
Savings Banks/
Association
73 105
Central Areas &
Others
-26 -9
Financial Markets
21 15
H1 2018 H1 2019
› The very tough market environment and
measurement losses weighed on performance in
the FM segment. The previous year included
measurement gains
› DKB’s earnings fell as expected, due to the low
interest rate environment, higher costs of meeting
regulatory requirements and strategic investments
in digitalisation
› Corporates & Mittelstand posted stable operating
performance in a challenging market environment.
Earnings in the year-before period were favoured
by high releases of risk provisions
› Operating earnings in Real Estate & Savings
Banks/Association were positive thanks to good
performance of new business in the Real Estate
Division. Earnings also benefited from releases of
risk provisions

10
Corporates & Mittelstand
› Profit before taxes fell to EUR 57 m (H1 2018:
EUR 181 m) as a result of high releases of risk
provisions and recoveries on written down
receivables in the year-before period
› Performance was stable overall in a difficult
market environment
› Net interest income and net commission
income unchanged year on year
› Income from the sale of Financial Markets
products to customers was also on par with
H1 2018
› Administrative expenses were higher, driven by
Bank-wide capex for sales and projects
› RWAs swelled due to new business activities
RoE
In %
CIR
In %
72.4
H1 2019 H1 2018
76.2
H1 2018 H1 2019
14.6
3.8
EUR m H1 2019 H1 2018
Net interest income 132 131
Risk provisions in the credit business 9 125
Net commission income 52 53
Other earnings components 15 18
Administrative expenses -152 -147
Profit/loss before taxes 57 181
Risk-weighted assets (RWAs) 21,709 20,499

11
Real Estate & Savings Banks/Association
› Profit before taxes rose to EUR 105 m
(H1 2018: EUR 73 m) due to positive operating
performance, driven in particular by good new
business in Real Estate and releases of risk
provisions
› The positive performance is most evident in net
interest and net commission income, which
stood at EUR 205 m (H1 2018: EUR 187 m)
› Other earnings components (EUR 22 m) was
marked by measurement effects from interest
rate hedges (BayernLabo) and the conclusion
of derivatives
› The increase in administrative expenses is the
result of Bank-wide capex for sales and
projects
› Earnings at BayernLabo jumped to EUR 28 m
(H1 2018: EUR 19 m), operating earnings were
stable
› Operating earnings at Real I.S. climbed to
EUR 9 m (H1 2018: EUR 6 m)
RoE
In %
CIR
In %
H1 2018 H1 2019
61.6 62.7
H1 2018
14.6
H1 2019
16.3
EUR m H1 2019 H1 2018
Net interest income 140 125
Risk provisions in the credit business 18 -5
Net commission income 65 62
Other earnings components 22 20
Administrative expenses -140 -130
Profit/loss before taxes 105 73
Risk-weighted assets (RWAs) 9,465 8,176

12
Financial Markets
› Profit before taxes dropped to EUR 15 m
(H1 2018: EUR 21 m) as a result of
measurement gains in the year-before period
› Net commission income rose due to increasing
business activities with financial institutions,
which also account for most of the increase in
RWAs
› Other earnings components was mainly
impacted by measurement losses at Group
Treasury. The year-before period included
measurement gains
› The earnings from Financial Markets products
on behalf of the other customer-serving
business segments were higher, despite the
tough market conditions; they continued to be
reported under the relevant segments
› Profit before taxes at BayernInvest was up year
on year at EUR 5 m (H1 2018: EUR 3 m)
RoE
In %
CIR
In %
H1 2019
83.9
H1 2018
87.9
2.2
H1 2018 H1 2019
4.0
EUR m H1 2019 H1 2018
Net interest income 99 83
Risk provisions in the credit business 0 0
Net commission income 26 17
Other earnings components 1 32
Administrative expenses -111 -110
Profit/loss before taxes 15 21
Risk-weighted assets (RWAs) 9,743 8,318

13
DKB
› Profit before taxes fell to EUR 147 m (H1 2018:
EUR 204 m) dampened by the decline in net
interest income and higher risk provisions and
administrative expenses
› The decrease in net interest income was in line
with expectations and stems from tightening in
the interest margin as a result of market
pressure
› Other earnings components was marked by high
expenses for the bank levy and deposit
guarantee scheme of EUR 32 m (H1 2018:
EUR 29 m) and measurements gains, for
example from funds
› Administrative expenses rose to EUR 288 m
(H1 2018: EUR 248 m), mainly driven by
regulatory costs and strategic investment in
digitalisation
› Bayern Card-Services posted profit before taxes
of EUR 2 m; figure of EUR 12 m in the year-
before period was boosted by the sale of a
shareholding
RoE
In %
CIR
In %
H1 2019 H1 2018
49.2 56.6
H1 2018 H1 2019
13.3 8.8
EUR m H1 2019 H1 2018
Net interest income 480 511
Risk provisions in the credit business -42 -23
Net commission income 2 4
Other earnings components -5 -41
Administrative expenses -288 -248
Profit/loss before taxes 147 204
Risk-weighted assets (RWAs) 23,970 24,543

14
Central Areas & Others
› Other earnings components included high
expenses for the bank levy and deposit
guarantee scheme of EUR 87 m (H1 2018:
EUR 61 m), which were offset by one-off tax-
related gains
› Administrative expenses jumped to EUR 23 m
(H1 2018: EUR 10 m) due to higher
mandatory contributions and an unfavourable
US dollar
EUR m H1 2019 H1 2018
Net interest income 20 29
Risk provisions in the credit business 5 5
Net commission income -5 -3
Other earnings components -5 -47
Administrative expenses -23 -10
Profit/loss before taxes -9 -26
Risk-weighted assets (RWAs) 2,757 2,833

Performance in 2019 – forecast confirmed
We still expect that BayernLB will post a profit before
taxes in the mid-triple-digit million range for the full
year.
15
Outlook
Strategy process
BayernLB is working from a position of strength on
shaping the Bank’s future strategic direction. In
doing so, we are responding to the challenging
market environment with low interest rates set to
persist for years to come, intense competition and
continuously growing regulatory requirements.
The goal of the strategy process is to focus our
business, in order to optimally position the Group
for the future in the interests of our customers and
owners. As a first step, the decision has been
taken to combine the two segments Corporates &
Mittelstand and Financial Markets.

Contents › Results of operations
› Detailed charts
16

17
Year-on-year earnings comparison
EUR m H1 2019 H1 2018 Change in %
Net interest income 870 879 -1.1
Risk provisions in the credit business -10 103 -
Net interest income after risk provisions 859 982 -12.5
Net commission income 141 132 6.8
Gains or losses on fair value measurement -23 35 -
Gains or losses on hedge accounting -7 -44 -84.8
Gains or losses on derecognised financial assets 3 -6 -
Gains or losses on financial investments 50 33 51.2
Administrative expenses -713 -644 10.6
Expenses for the bank levy and deposit guarantee scheme -119 -90 31.9
Other income and expenses 130 52 >100.0
Gains or losses on restructuring -7 2 -
Profit/loss before taxes 315 452 -30.3
Income taxes -21 -105 -79.6
Profit/loss after taxes 294 347 -15.4
Profit/loss attributable to non-controlling interests 0 -5 -
Consolidated profit/loss 294 342 -14.1

18
Quarterly earnings comparison
EUR m Q2 2019 Q1 2019
Net interest income 447 423
Risk provisions in the credit business -18 7
Net interest income after risk provisions 429 430
Net commission income 72 70
Gains or losses on fair value measurement -11 -13
Gains or losses on hedge accounting 5 -12
Gains or losses on derecognised financial assets 3 0
Gains or losses on financial investments 19 31
Administrative expenses -347 -366
Expenses for the bank levy and deposit guarantee scheme -26 -93
Other income and expenses 126 4
Gains or losses on restructuring -7 0
Profit/loss before taxes 264 51
Income taxes -14 -7
Profit/loss after taxes 250 44
Profit/loss attributable to non-controlling interests 0 0
Consolidated profit/loss 250 44

19
Segment overview
EUR m
Corporates
&
Mittelstand
Real Estate
& Savings
Banks/
Association
Financial
Markets DKB
Central
Areas
& Others
Group
Net interest income 132 140 99 480 20 870
Risk provisions in the credit business 9 18 0 -42 5 -10
Net interest income after risk provisions 141 158 99 437 24 859
Net commission income 52 65 26 2 -5 141
Gains or losses on fair value measurement 15 17 -55 14 -14 -23
Gains or losses on hedge accounting 0 2 3 -4 -7 -7
Gains or losses on derecognised fin. assets 0 0 0 2 0 3
Gains or losses on financial investments 1 2 48 11 -13 50
Administrative expenses -152 -140 -111 -288 -23 -713
Expenses for the bank levy and deposit guarantee scheme 0 0 0 -32 -87 -119
Other income and expenses -2 1 4 5 123 130
Gains or losses on restructuring 0 0 0 0 -7 -7
Profit/loss before taxes 57 105 15 147 -9 315
Return on equity (RoE) (%) 3.8 16.3 2.2 8.8 - 6.5
Cost/income ratio (CIR) (%) 76.2 61.6 87.9 56.6 - 61.2

20
Segment overview H1 2018
EUR m
Corporates
&
Mittelstand
Real Estate
& Savings
Banks/
Association
Financial
Markets DKB
Central
Areas
& Others
Group
Net interest income 131 125 83 511 29 879
Risk provisions in the credit business 125 -5 0 -23 5 103
Net interest income after risk provisions 257 120 83 488 34 982
Net commission income 53 62 17 4 -3 132
Gains or losses on fair value measurement 19 18 4 7 -13 35
Gains or losses on hedge accounting 0 0 -3 -34 -6 -44
Gains or losses on derecognised fin. assets 0 0 0 -6 0 -6
Gains or losses on financial investments 0 2 25 6 1 33
Administrative expenses -147 -130 -110 -248 -10 -644
Expenses for the bank levy and deposit guarantee
scheme 0 0 0 -29 -61 -90
Other income and expenses 0 -1 7 16 31 52
Gains or losses on restructuring 0 0 0 0 1 2
Profit/loss before taxes 181 73 21 204 -26 452
Return on equity (RoE) (%) 14.6 14.6 4.0 13.3 - 10.0
Cost/income ratio (CIR) (%) 72.4 62.7 83.9 49.2 - 59.5

21
Balance sheet overview
EUR bn Jun 2019 Dec 2018 Change in %
Loans and advances to banks 44.4 36.6 21.2
Loans and advances to customers 144.6 138.9 4.1
Assets held for trading 15.9 12.3 29.0
Financial investments 25.3 25.5 -0.8
Total assets 240.3 220.2 9.1
Liabilities to banks 59.7 54.1 10.5
Liabilities to customers 103.0 93.5 10.2
Securitised liabilities 46.1 45.5 1.5
Liabilities held for trading 11.3 8.2 36.8
Subordinated capital 2.1 1.9 8.2
Equity 11.4 11.3 1.6

22
Key capital figures
Fully loaded Jun 2019 Dec 2018
CET1 capital (EUR bn) 9.61 10.0
CET1 ratio (%) 14.11 15.2
Total capital (EUR bn) 10.91 11.2
Total capital ratio (%) 16.11 17.0
RWAs (EUR bn) 67.6 65.6
Leverage ratio (%) 3.71 4.1
LCR (%) 178 143
1 Before acceptance of the positive effects from the half-yearly financial statements by the supervisory authorities

Disclaimer
23
The information in this presentation constitutes neither an offer nor an invitation to subscribe to or purchase securities or a
recommendation to buy. It is solely intended for informational purposes and does not serve as a basis for any kind of obligation,
contractual or otherwise.
Rounding differences may occur in the presentation.

The Bavarian bank for the German economy.