Embed Size (px)
Citation preview

Baw BawShire CouncilAnnual Financial Report.2018/19

Customer Service Centres33 Young Street Smith Street (Annex Building) Drouin Vic 3818 Warragul Vic 3820
-P 03 5624 2411
www.bawbawshire.vic.gov.au www.facebook.com/bawbawshirecouncil
Inside front cover: NoojeeFront Cover: Thorpdale
1
Understanding the Financial Statements 2
Financial StatementsComprehensive Income Statement 4Balance Sheet 5Statement of Changes in Equity 6Statement of Cash Flows 7Statement of Capital Works 8
Notes to Financial Statements 9
Note 1 - Performance against budget 10 1.1 Income and expenditure 10 1.2 Capital works 11
Note 2.1 - Analysis of Council results by program 10
Note 3 - Funding for the delivery of our services 12
3.1 Rates and charges 14 3.2 Statutoryfeesandfines 14 3.3 User fees 14 3.4 Funding from other levels
of government 15 3.5 Contributions 16 3.6 Net gain/(loss) on disposal of
property, infrastructure, plant and equipment 16
3.7 Other income 16
Note 4 - The cost of delivering services 17 4.1 Employee costs 17 4.2 Materials and services 17 4.3 Depreciation and amortisation 17 4.4 Borrowing costs 18 4.5 Other expenses 18
Note5- Ourfinancialposition 18 5.1 Financial assets 18 5.2 Non-current assets 19 5.3 Non-financialassets 20 5.3 Payables 20 5.4 Interest bearing liabilities 21 5.5 Provisions 21 5.6 Financing arrangements 23 5.7 Commitments 23
Note 6 - Assets we manage 25 6.1 Property infrastructure plant and
equipment 25 6.2 Investments in associates, joint
arrangements and subsidiaries 32
Note 7 - People and relationships 33 7.1 Council and key management
remuneration 33 7.2 Related party disclosure 34
Note 8 - Managing uncertainties 35 8.1 Contingent assets and liabilities 35 8.2 Change in accounting standards 36 8.3 Financial instruments 36 8.4 Fair value measurement 38 8.5 Events occurring after balance date 39
Note 9 - Other matters 40 9.1 Reserves 41 9.2 Prior Year Adjustments 42 9.3 Reconciliationofcashflows
from operating activities to surplus/(deficit) 43
9.4 Superannuation 43
Certification of the Financial Statements 44
VAGO - Independent Auditors Report 45
Performance Statements 48
Certification of the Performance Statements 59
VAGO - Independent Auditors Report 60
Table of Contents

2
The Financial Statements compare the current 2018/19financialyeartotheprevious2017/18financialyear.
They comprise two main sections mainly the financialstatementsandthenotestothefinancialstatements..
There are six main statements:
1. Comprehensive Income Statement2. Balance Sheet3. Statement of Changes in Equity4. Cash Flow Statement5. Statement of Capital Works6. Performance Statement
1. Comprehensive Income Statement
The Comprehensive Income Statement is designed to show if Council’s operations were in surplusordeficitduringthefinancialyear.
Thesurplus/(deficit)amountiscalculatedas total income less total expenses. A surplus means that income was greater than expenses.
The Comprehensive Income Statement contains:
• Income - the sources of Council’s income under various income headings.
• Expenses - the expenditure incurred in running the Council during the year. This expenditure relates to the ‘operations’ and does not include the capital costs associated with the purchase or the creationoffixedassets.Whileassetpurchase costs are not included in the expenses they are included within ‘Depreciation and amortisation’. This amount is the value of the assets ‘used up’ during the year.
• Other comprehensive income – this section includes items such as net asset revaluation increments and impairment of expenses. Impairment occurs when the value of Council’s assets are reduced or impaired usually due to damage or obsolescence. The comprehensive result is arrived at by adjustingthenetsurplus/(deficit)bytheother comprehensive income items. The comprehensive result is also equal to the movement in Council’s net assets (total equity) from the prior year.
Understanding the Financial Statements

Annual Financial Report 2018/19 3
2. Balance SheetThe Balance Sheet shows what Council owns as assets and what it owes as liabilities. It presents a one page summary which is a snapshot of the financialpositionasat30June.
The bottom line of this statement is called ‘net assets’ which is the net worth of Council which has been built up over many years.
Net assets = Total assets – total liabilities = Total equity
Assets and liabilities are separated into current and non-current. Generally, current means those assets or liabilities which will fall due in the next 12 months.
3. Statement of Changes in Equity
During the course of the year the value of total equity as set out in the Balance Sheet changes. The Statement of Changes in Equity shows the values of these changes that may include:
• The‘profitorloss’fromoperations,described in the statement as ‘surplus/(deficit)fortheyear’.
• The use of monies from Council’s reserves and transfers to Council’s reserves.
• Therevaluationoffixedassets.
• The share of revaluations of investments in joint venture assets.
• Therecognitionofanassetforthefirsttime.
4. Statement of Cash FlowsThe Statement of Cash Flows provides a summary of Council’s cash receipts and cash payments during the year. The bottom line is the cashbalanceattheendofthefinancialyear.
This statement shows the movements in the bank balance during the course of the year and is dissected into the following three sections:
• Cashflowsfromoperatingactivities–Allreceipts to and payments from Council’s bank account for normal operations. Receipts include monies from rates, grants and from amounts owing to Council. Payments mainly include monies paid to suppliers and employees.
• Cashflowfrominvestingactivities–Thissection mainly comprises payments for the creationorpurchaseoffixedassets(capitalitems) as well as the proceeds from asset sales.
• Cashflowfromfinancingactivities–Thissection includes the proceeds from loan borrowing as well as loan interest and the repayment of outstanding loans.
5. Statement of Capital WorksStatement of capital works shows all capital expenditure of Baw Baw Shire Council in relation to non-current assets and asset expenditure type prepared in accordance with the model statement of capital works in the Local Government Financial Report.
6. Performance StatementThe Performance Statement provides the results of the sustainable capacity, service performanceandfinancialperformanceindicators and measures required under the Local Government Act 1989 and Local Government (Planning and Reporting) Regulations 2014.

4
Baw Baw Shire Council2018/2019 Financial Report
Note 2019 2018$'000 $'000
IncomeRates and charges 3.1 57,616 54,257 Statutory fees and fines 3.2 2,317 1,857 User fees 3.3 2,958 2,298 Grants - operating 3.4 14,670 15,300 Grants - capital 3.4 7,886 7,960 Contributions - monetary 3.5 3,727 2,187 Contributions - non monetary 3.5 16,167 7,077 Share of net profits of associates and joint ventures 6.2 177 166 Other income 3.7 1,813 2,110 Total income 107,331 93,212
ExpensesEmployee costs 4.1 (27,278) (25,131)Materials and services 4.2 (34,309) (28,323)Depreciation and amortisation 4.3 (16,177) (15,131)Borrowing costs 4.4 (496) (572)Other expenses 4.5 (4,223) (4,142)Net loss on disposal of property, infrastructure, plant and equipment 3.6 (601) (4,705)Total expenses (83,084) (78,004)
Surplus for the year 24,247 15,208
Other comprehensive incomeItems that will not be reclassified to surplus or deficit in future periodsNet asset revaluation increment 6.1 78,466 24,696 Share of other comprehensive income of associates and joint ventures 6.2 1 - Total comprehensive result 102,714 39,904
Comprehensive Income StatementFor the Year Ended 30 June 2019
The above comprehensive income statement should be read in conjunction with the accompanying notes.
Page 4
Comprehensive Income StatementFor the Year Ended 30 June 2019
The above comprehensive income statement should be read in conjunction with the accompanying notes.

Annual Financial Report 2018/19 5
Balance SheetAs at 30 June 2019
The above balance sheet should be read in conjunction with the accompanying notes.
Baw Baw Shire Council2018/2019 Financial Report
Note 2019 2018
Restated Refer Note 9.2
Assets $'000 $'000 Current assetsCash and cash equivalents 5.1 25,885 20,500 Trade and other receivables 5.1 6,969 6,049 Other financial assets 5.1 25,115 19,112 Non current assets classified as held for sale 5.2 499 - Inventories 5.3 7 - Other assets 5.3 992 805 Total current assets 59,467 46,466
Non-current assetsInvestments in associates, joint arrangements and subsidiaries 6.2 1,959 1,777 Property, infrastructure, plant and equipment 6.1 770,227 669,985 Intangible assets 5.3 363 568 Total non-current assets 772,549 672,330 Total assets 832,016 718,796
LiabilitiesCurrent liabilitiesTrade and other payables 5.4 15,033 8,882 Trust funds and deposits 5.4 4,482 2,718 Provisions 5.6 6,534 5,789 Interest-bearing liabilities 5.5 4,442 4,807 Total current liabilities 30,491 22,196
Non-current liabilitiesProvisions 5.6 9,922 7,270 Interest-bearing liabilities 5.5 7,168 7,609 Total non-current liabilities 17,090 14,879 Total liabilities 47,581 37,075
Net assets 784,435 681,721
EquityAccumulated surplus 373,293 350,637 Reserves 9.1 411,142 331,084 Total Equity 784,435 681,721
Balance SheetAs at 30 June 2019
The above balance sheet should be read in conjunction with the accompanying notes.Page 5

6
Statement of Changes in EquityFor the Year Ended 30 June 2019
The above states of changes in equity should be read in conjunction with the accompanying notes.
Baw Baw Shire Council
Accumulated Revaluation OtherTotal Surplus Reserve Reserves
2019 $'000 $'000 $'000 $'000
Balance at beginning of the financial year 681,721 350,637 326,209 4,875 Surplus for the year 24,247 24,247 - - Net asset revaluation increment 6.1 78,466 - 78,466 - Adjustment due to change in library ownership 6.2 1 - 1 - Transfers to other reserves 9.1 - (3,845) - 3,845 Transfers from other reserves 9.1 - 2,254 - (2,254)Balance at end of the financial year 784,435 373,293 404,676 6,466
Accumulated Revaluation OtherTotal Surplus Reserve Reserves
2018 Restated (refer note 9.1 and 9.2) $'000 $'000 $'000 $'000
Balance at beginning of the financial year 640,044 334,282 301,511 4,251 Net found and derecognised assets 1,763 1,763 - - Restated opening balance 641,807 336,045 301,511 4,251 Surplus for the year 15,208 15,208 - - Net asset revaluation increment 6.1 24,696 - 24,696 - Adjustment due to change in library ownership 6.2 10 8 2 - Transfers to other reserves 9.1 - (2,203) - 2,203 Transfers from other reserves 9.1 - 1,579 - (1,579)Balance at end of the financial year 681,721 350,637 326,209 4,875
Page 6
2018/2019 Financial Report
Statement of Changes in EquityFor the Year Ended 30 June 2019
Note
The above statement of changes in equity should be read in conjunction with the accompanying notes.

Annual Financial Report 2018/19 7
Statement of Cash FlowsFor the Year Ended 30 June 2019
Theabovestatementofcashflowsshouldbereadinconjunctionwiththeaccompanying notes.
Baw Baw Shire Council
2019 2018Inflows/ Inflows/
(Outflows) (Outflows)Note $'000 $'000
Cash flows from operating activities
Rates and charges 58,029 53,789 Statutory fees and fines 2,319 1,860 User fees 3,135 2,621 Grants - operating 14,861 16,615 Grants - capital 6,403 7,339 Contributions - monetary 3,727 2,188 Interest received 1,031 1,025 Trust funds and deposits taken 12,210 8,235 Other receipts 1,028 1,362 Net GST refund/payment 2,451 2,609 Employee costs (26,412) (25,145)Materials and services (29,472) (31,619)Trust funds and deposits repaid (10,498) (7,318)Other payments (4,335) (4,278)Net cash provided by/(used in) operating activities 9.3 34,477 29,283
Cash flows from investing activities
Payments for property, infrastructure, plant and equipment (21,881) (24,644)Proceeds from sale of property, infrastructure, plant and equipment 119 239 Payments for investments (6,003) (2,502)Net cash provided by/(used in) investing activities (27,765) (26,907)
Cash flows from financing activities
Finance costs (493) (581)Proceeds from borrowings 4,000 - Repayment of borrowings (4,834) (1,512)Net cash provided by/(used in) financing activities (1,327) (2,093)
Net increase (decrease) in cash and cash equivalents 5,385 283 Cash and cash equivalents at the beginning of the financial year 20,500 20,217 Cash and cash equivalents at the end of the financial year 25,885 20,500
Financing arrangements 5.7 7,079 9,969 Restrictions on cash assets 5.1 13,383 11,100
2018/2019 Financial Report
Statement of Cash FlowsFor the Year Ended 30 June 2019
The above statement of cash flows should be read in conjunction with the accompanying notes.Page 7

8
Statement of Capital WorksFor the Year Ended 30 June 2019
The above statement of capital works should be read in conjunction with the accompanying notes.
Baw Baw Shire Council
Note 2019 2018$'000 $'000
Property
Land 24 49 Total land 24 49
Buildings 6,054 9,148 Total buildings 6,054 9,148
Total property 6,078 9,197
Plant and equipmentPlant, machinery and equipment 1,023 738 Computers and telecommunications 775 605 Total plant and equipment 1,798 1,343
InfrastructureRoads 11,626 8,618 Bridges 975 347 Footpaths and cycleways 995 783 Drainage 547 2,767 Waste management 273 83 Parks, open space and streetscapes 2,184 1,950 Other infrastructure 241 232 Total infrastructure 16,841 14,780
Total capital works expenditure 24,717 25,320
Represented by:Asset renewal expenditure 12,095 12,201 Asset expansion expenditure 4,034 4,451 Asset upgrade expenditure 8,588 8,668 Total capital works expenditure 24,717 25,320
2018/2019 Financial Report
Statement of Capital WorksFor the Year Ended 30 June 2019
The above statement of capital works should be read in conjunction with the accompanying notes.Page 8

Annual Financial Report 2018/19 9
Notes to the Financial StatementsFor the Year Ended 30 June 2019
Baw Baw Shire Council2018/2019 Financial Report
OVERVIEW
IntroductionThe Baw Baw Shire Council was established by an Order of the Governor in Council on 2 December 1994 and is a body corporate. The Council's main office is located at Drouin.
Statement of compliance
These financial statements are a general purpose financial report that consists of a Comprehensive Income Statement, Balance Sheet, Statement of Changes in Equity, Statement of Cash Flows, Statement of Capital Works and Notes accompanying these financial statements. The general purpose financial report complies with the Australian Accounting Standards (AAS), other authoritative pronouncements of the Australian Accounting Standards Board, the Local Government Act 1989, and the Local Government (Planning and Reporting) Regulations 2014.
Significant accounting policies
(a) Basis of accountingThe accrual basis of accounting has been used in the preparation of these financial statements, whereby assets, liabilities, equity, income and expenses are recognised in the reporting period to which they relate, regardless of when cash is received or paid.
Judgements, estimates and assumptions are required to be made about the carrying values of assets and liabilities that are not readily apparent from other sources. The estimates and associated judgements are based on professional judgement derived from historical experience and various other factors that are believed to be reasonable under the circumstances. Actual results may differ from these estimates.
Revisions to accounting estimates are recognised in the period in which the estimate is revised and also in future periods that are affected by the revision. Judgements and assumptions made by management in the application of AAS's that have significant effects on the financial statements and estimates relate to: - the fair value of land, buildings, infrastructure, plant and equipment (refer to Note 6.1) - the determination of depreciation for buildings, infrastructure, plant and equipment (refer to Note 6.1) - the determination of employee provisions (refer to Note 5.6) - the determination of landfill provisions (refer to Note 5.6) - other areas requiring judgements
Unless otherwise stated, all accounting policies are consistent with those applied in the prior year. Where appropriate, comparative figures have been amended to accord with current presentation, and disclosure has been made of any material changes to comparatives.
Notes to the Financial ReportFor the Year Ended 30 June 2019
Page 9

10
Notes to the Financial StatementsFor the Year Ended 30 June 2019
Baw Baw Shire Council2018/2019 Financial Report
Note 1 Performance against budget
1.1 Income and expenditureBudget Actual Variance
2019 2019 2019$'000 $'000 $'000 Ref
IncomeRates and charges 57,234 57,616 382 Statutory fees and fines 1,531 2,317 786 1 User fees 3,259 2,958 (301)Grants - operating 14,090 14,670 580 2 Grants - capital 2,400 7,886 5,486 3 Contributions - monetary 2,026 3,727 1,701 4 Contributions - non monetary 6,500 16,167 9,667 5 Share of net profits/(losses) of associates and joint ventures 37 177 140 Other income 1,101 1,813 712 6 Total income 88,178 107,331 19,153
ExpensesEmployee costs (27,488) (27,278) 210 Materials and services (27,759) (34,309) (6,550) 7 Depreciation and amortisation (14,688) (16,177) (1,489) 8 Borrowing costs (522) (496) 26 Other expenses (4,618) (4,223) 395 Net loss on disposal of property, infrastructure, plant and equipment (1,338) (601) 737 9 Total expenses (76,413) (83,084) (6,671)
Surplus/(deficit) for the year 11,765 24,247 12,482
(i) Explanation of material variationsVariance
RefItem Explanation
Ref1 Statutory fees and
fines
2 Grants - operating
3 Grants - capital
4 Contributions - monetary
5 Contributions - non monetary
6 Other Income
7 Materials and services
8 Depreciation and amortisation
9 Net loss on disposal of property, infrastructure, plant and equipment
Page 10
Notes to the Financial ReportFor the Year Ended 30 June 2019
The performance against budget notes compare Council’s financial plan, expressed through its annual budget, with actual performance. The Local Government (Planning and Reporting) Regulations 2014 requires explanation of any material variances. Council has adopted a materiality threshold of $500,000 where further explanation is warranted. Explanations have not been provided for variations below the materiality threshold unless the variance is considered to be material because of its nature.
The budget figures detailed below are those adopted by Council on 27 June 2018. The Budget was based on assumptions that were relevant at the time of adoption of the Budget. Council sets guidelines and parameters for income and expense targets in this budget in order to meet Council’s planning and financial performance targets for both the short and long-term. The budget did not reflect any changes to equity resulting from asset revaluations, as their impacts were not considered predictable.
These notes are prepared to meet the requirements of the Local Government Act 1989 and the Local Government (Planning and Reporting) Regulations 2014 .
The variance of $0.79m is mainly due to higher than budget revenue for Statutory Planning & Building Services related fees & charges. This fee revenue comprises plan permit fees $0.20m, lodgement fees $0.16m, subdivision certification fees $0.16m, planning checking fees $0.07m, asset protection fees $0.05m and discharges fees $0.07m. These fees have been impacted by the high level of economic development in the Shire.
The overbudget depreciation expense is mainly due to the impact of revaluation of two asset classes namely Roads and Land & Buildings. This is the second successive year that Land & Buildings (mainly the land comment) was required to be revalued due to the substantial increase in property values within the municipality.
The favourable budget variance is mainly due to the lower written down value (WDV or book value) of infrastructure required to be written off at the time of replacement.
The variance is mainly due to additional grant revenue in the areas of Family Day Care, Maternal and Child Health, Strategic Planning and Emergency Management. The additional grants were partly offset by lower than expected revenue from the Financial Assistance Grants. The variance is primarily due to grant funding of $3.50m for the West Gippsland Arts Centre that was budgeted to be received in the prior financial year. In addition a further $1.40m was received for sporting related infrastructure that will not be expended until the following financial year.
The additional contribution revenue mainly relates to Development Contribution Levies (DCP01 & DCP02) as a result of the high level of economic activity within the region. Monetary contributions revenue is transferred to Other Reserves for future allocation to capital infrastructure projects.
Contributions Non-Monetary exceeded budget due to an increased number of developer projects achieving practical completion compared to budget.
This variance is mainly due to the reallocation of $2.41m from fixed assets (capital works and work in progress) to operating expenses in line with Accounting policies. In addition a further $2.62m allocation was necessary to provide for the estimated aftercare costs of the former Trafalgar landfill site. Additional variances to budget include higher than budget agency staff costs (partly offset by underbudget employee costs) and overbudget expenditure for legal costs.
Interest on investments has exceeded budget by $0.31m. In addition, Council has received unbudgeted income of $0.30m for capital work projects and funds donated to the West Gippsland Arts Centre.

Annual Financial Report 2018/19 11
Notes to the Financial StatementsFor the Year Ended 30 June 2019
Baw Baw Shire Council2018/2019 Financial Report
Note 1 Performance against budget (cont'd)
1.2 Capital worksBudget Actual Variance
2019 2019 2019$'000 $'000 $'000 Ref
PropertyLand 939 24 (915) 1 Total land 939 24 (915)Buildings 3,507 6,054 2,547 2 Total buildings 3,507 6,054 2,547 Total property 4,446 6,078 1,632
Plant and equipmentPlant, machinery and equipment 551 1,023 472 3 Computers and telecommunications 632 775 143 Total plant and equipment 1,183 1,798 615
InfrastructureRoads 11,809 11,626 (183)Bridges 272 975 703 4 Footpaths and cycleways 1,495 995 (500) 5 Drainage 1,422 547 (875) 6 Waste management 20 273 253 Parks, open space and streetscapes 1,552 2,184 632 7 Other infrastructure 342 241 (101)Total infrastructure 16,912 16,841 (71)
Total capital works expenditure 22,541 24,717 2,176
Represented by:Asset renewal expenditure 11,048 12,095 1,047 Asset expansion expenditure 3,343 4,034 691 Asset upgrade expenditure 8,150 8,588 438 Total capital works expenditure 22,541 24,717 2,176
(i) Explanation of material variations
Variance Ref
Item Explanation
1 Land
2 Building
3 Plant, machinery and equipment
4 Bridges
5 Footpaths and cycleways
6 Drainage
7 Parks, open space and streetscapes
The variance is mainly due to higher than the allocated 2018/19 budget expenditure for the Western Park Recreation Oval Development and the Skate Park Yarragon. It should be noted that from a multi year project perspective, these projects remain within budget mainly due to prior year budget under expenditure.
Page 11
Notes to the Financial ReportFor the Year Ended 30 June 2019
The variance is mainly due to under expenditure for three drainage projects. The Trafalgar Drainage- design and land acquisition retardation project has not been finalised, with supporting infrastructure retardation works to be completed in 2019/20. The Cook and McKay Street Longwarry drainage works will not be completed as the application for external funding was not successful. The Yarragon Drainage Hazeldean Road retarding basin was deferred and scheduled for completion during 2019/20.
The variance is mainly due to higher than the allocated 2018/19 budget expenditure for the West Gippsland Arts Centre, the Willow Grove Recreation Reserve Multiuse Pavilion and the New Early Learning Centre Warragul. It should be noted that from a multi year project perspective, these projects remain within budget mainly due to prior year budget under expenditure.
The variance is due to scheduled land acquisitions that were not finalised by the end of the financial year. The acquisitions mainly comprise land for the Yarragon retardation plus land at the intersection of Sutton Street and Pharaohs Road.
The variance is mainly due to the purchase of major plant items that were budgeted as operating lease expenditure.
The variance is mainly due to higher than the budget expenditure for the Allambee Estate Road Bridge project - expenditure of $0.82m in 2018/19 compared to the adopted budget of $0.12m. This project reported a project under expenditure in the prior year with the identified savings available for carry forward to 2018/19 to fund the budget overrun.
The new footpath programme 2018/19 is underbudget by $0.59m. Delays in the project are primarily due to inclement weather. Funds will be carried over to the 2019/20 Financial Year.

12
Notes to the Financial StatementsFor the Year Ended 30 June 2019
Baw Baw Shire Council
Note 2.1 Analysis of Council results by program
2 (a) Community Infrastructure
Corporate and Community Services
Chief Executive Office
Planning and Development
Page 12
The Chief Executive Office (CEO) represents the management of Council, including day to day operations of the organisation in accordance with the Council plan, implementation of Council decisions, and advocating to government on behalf of Council and the community.
Planning and Development has responsibility for the management of the newly redeveloped iconic West Gippsland Arts Centre, which hosts a variety of performances and events each year. Additionally, Community Cultural Development promotes initiatives and opportunities for arts and cultural activities within the community.
Community Infrastructure is responsible for both the planning and delivery of Council’s annual and long-term capital works program, and the maintenance of Council’s assets. This includes Infrastructure Maintenance, Infrastructure Delivery, Civil Asset planning, Road maintenance, Fleet and Depot Support, Open Space Maintenance and Waste.
Corporate and Community Services provides a range of services for individuals and families within the Community, including Aged and Disability Services and Family and Children’s Services.
Recreational facilities are managed by Council, and include leisure and pool facilities contracts, support for committees of management of public halls and recreation reserves.
Planning services within the Directorate are designed to meet day to day, and strategic planning requirements in a major growth region. This includes Statutory Planning, Priority Development, Strategic and Community planning and building services.
Other services that support the community and Council are Community Compliance, Public Health, Emergency Management and Environmental Services
Information Technology and Business Information support the information requirements of Council, and the associated technical infrastructure.
The CEO directorate includes Communications which inform the community of council issues, and Customer Service, which is the first point of external customer contact.
Performance of these functions enable Council to operate strategically to support future growth and development.
Safety, Procurement, Human Resources, Payroll, Risk and Insurance Management and Revenue Services are performed within the organisation to ensure that Council meets all statutory compliance requirements and is financially sustainability.
Notes to the Financial ReportFor the Year Ended 30 June 20192018/2019 Financial Report
Council delivers its functions and activities through the following Directorates:

Annual Financial Report 2018/19 13
Notes to the Financial StatementsFor the Year Ended 30 June 2019
Baw Baw Shire Council2018/2019 Financial Report
Note 2.1 Analysis of council results by program 2.1 (b) Summary of revenues, expenses, assets and capital expenses by program
Income Expenses Surplus/ (Deficit)
Grants included in income
Total assets
2019 $'000 $'000 $'000 $'000 $'000Community Infrastructure 25,380 (46,234) (20,854) 7,997 770,227 Chief Executive Office 122 (6,555) (6,433) 117 363 Corporate & Community Services 73,656 (19,254) 54,402 13,778 61,426 Planning and Development 8,174 (11,042) (2,868) 664 - Total 107,332 (83,085) 24,247 22,556 832,016
Income Expenses Surplus/ (Deficit)
Grants included in income
Total assets
2018 $'000 $'000 $'000 $'000 $'000Community Infrastructure 17,078 (43,282) (26,204) 8,150 669,985 Chief Executive Office 33 (4,895) (4,862) 14 568 Corporate & Community Services 71,038 (20,858) 50,180 14,463 48,243 Planning and Development 5,063 (8,968) (3,905) 635 - Total 93,212 (78,004) 15,208 23,262 718,796
Page 13
Notes to the Financial ReportFor the Year Ended 30 June 2019

14
Notes to the Financial StatementsFor the Year Ended 30 June 2019
Baw Baw Shire Council Notes to the Financial Report2018/2019 Financial Report For the Year Ended 30 June 2019
Note 3 Funding for the delivery of our services 2019 20183.1 Rates and charges $'000 $'000
General rates 48,675 45,110 Waste management charge 8,028 7,592 Supplementary rates and rate adjustments 730 1,330 Interest on rates and charges 183 225 Total rates and charges 57,616 54,257
3.2 Statutory fees and fines
Infringements and costs 261 173 Town planning fees 641 481 Land information certificates 140 154 Permits 940 924 Other Fees 335 125 Total statutory fees and fines 2,317 1,857
3.3 User fees
Aged and health services 1,004 1,044 Art Centre 672 61 Registration and other permits 591 557 Waste management services 326 293 Leases and Rentals 132 89 Other fees and charges 233 254 Total user fees 2,958 2,298
User fees are recognised as revenue when the service has been provided or council has otherwise earned the income.
Page 14
Council uses Capital Improved Value as the basis of valuation of all properties within the municipal district. The Capital Improved Value (CIV) of a property is its market value of land and improvements as of January 2018.
The valuation base used to calculate general rates for 2018/19 was $12,386 million (2017/18 $9,634 million).
The date of the latest general revaluation of land for rating purposes within the municipal district was 1st January 2018, and the valuation will be first applied in the rating year commencing 1st July 2018.Annual rates and charges are recognised as revenues when Council issues annual rates notices. Supplementary rates are recognised when a valuation and reassessment is completed and a supplementary rates notice issued. Total rates and charges have increased due to continued growth within the shire.
Statutory fees and fines (including parking fees and fines) are recognised as revenue when the service has been provided, the payment is received, or when the penalty has been applied, whichever first occurs.

Annual Financial Report 2018/19 15
Notes to the Financial StatementsFor the Year Ended 30 June 2019
Baw Baw Shire Council Notes to the Financial Report2018/2019 Financial Report For the Year Ended 30 June 2019
2019 2018
$'000 $'0003.4 Funding from other levels of government
Grants were received in respect of the following :
Summary of grants
Commonwealth funded grants 14,057 16,197 State funded grants 8,499 7,063
Total grants received 22,556 23,260
(a) Operating GrantsRecurrent - Commonwealth GovernmentFinancial Assistance Grant 8,926 9,355 Family day care 748 734 Aged care 1,894 1,969 Recurrent - State GovernmentAged care 54 395 Arts culture and events 130 130 Community safety/public health 16 18 Disability services 428 658 Environmental management/landcare 43 88 Fire prevention and emergency response 98 60 Maternal and child health 764 831 Preschool and early years 70 72 Rural access and inclusive communities - 132 School crossing supervisors - 332 Other 135 217
Total recurrent operating grants 13,306 14,991
Non-recurrent - Commonwealth GovernmentOther 60 57 Non-recurrent - State GovernmentAged care 331 21 Arts culture and events 63 - Community safety/public health 62 10 Disability services - 45 Economic development 116 14 Fire prevention and emergency response 71 - Garbage recycling 44 51 Maternal and child health 232 - Preschool and early years 73 - Recreation 8 27 Rural Access and inclusive communities 135 - Other 169 84
Total non-recurrent operating grants 1,364 309 Total operating grants 14,670 15,300
Page 15

16
Notes to the Financial StatementsFor the Year Ended 30 June 2019
Baw Baw Shire Council Notes to the Financial Report2018/2019 Financial Report For the Year Ended 30 June 2019
3.4 Funding from other levels of government (cont'd)2019 2018
(b) Capital Grants $'000 $'000Recurrent - Commonwealth GovernmentRoads to recovery 217 2,082 Total recurrent capital grants 217 2,082 Non-recurrent - Commonwealth GovernmentBuildings 2,039 2,000 Recreation 173 - Non-recurrent - State GovernmentLocal and collector roads 1,648 771 Waste 221 7 Recreation 1,192 264 Bridges - 395 Drainage 18 266 Buildings 2,235 2,149 Footpaths 126 26 Future design and investigation 17 - Total non-recurrent capital grants 7,669 5,878
Total capital grants 7,886 7,960
(c) Unspent grants received on condition that they be spent in a specific mannerBalance at start of year 3,507 2,017 Received during the financial year and remained unspent at balance date 2,240 3,312 Received in prior years and spent during the financial year (3,312) (1,822) Balance at year end 2,435 3,507
3.5 Contributions
Monetary 3,727 2,187 Non-monetary 16,167 7,077 Total contributions 19,894 9,264
Land 3,339 502 Infrastructure 12,828 6,575 Total non-monetary contributions 16,167 7,077
3.6 Net loss on disposal of property, infrastructure, plant and equipment
Proceeds of sale 110 248 Written down value of assets disposed* (711) (4,953)Total net gain/(loss) on disposal of property, infrastructure, plant and equipment (601) (4,705)
3.7 Other incomeInterest 855 760 Other rent 241 294 Capital contributions 299 368 Other 418 688 Total other income 1,813 2,110
Grant income is recognised when Council obtains control of the contribution. Control is normally obtained upon receipt (or acquittal) or upon earlier notification that a grant has been secured.
The profit or loss on sale of an asset is determined when control of the asset has passed to the buyer.
Other income is measured at the fair value of the consideration received or receivable and is recognised when Council gains control over the right to receive the income.
Page 16
Monetary and non monetary contributions are recognised as revenue when Council obtains control over the contributed asset.
Contributions of non monetary assets were received in relation to the following asset classes.
Interest is recognised as it is earned.
* The $0.71m written down value of assets disposed comprise buildings of $0.22m, plant and equipment disposal of $0.04m (offset by the proceeds from sale of $0.11m) plus $0.45m relating to the write off of infrastructure that was replaced and upgraded by capital assets (included to note 6.1 Property, infrastructure, plant and equipment).

Annual Financial Report 2018/19 17
Notes to the Financial StatementsFor the Year Ended 30 June 2019
Baw Baw Shire Council Notes to the Financial Report2018/2019 Financial Report For the Year Ended 30 June 2019
2019 2018Note 4 The cost of delivering services $'000 $'0004.1(a) Employee costs
Wages and salaries 23,186 21,971 WorkCover 237 296 Casual staff 1,093 426 Superannuation 2,324 1,979 Fringe benefits tax 176 138 Other 262 321 Total employee costs 27,278 25,131
(b) SuperannuationCouncil made contributions to the following funds:
Defined benefit fundEmployer contributions to local authorities superannuation fund (Vision Super) 114 95
114 95
Employer contributions payable at reporting date. 34 40
Accumulation fundsEmployer contributions to local authorities superannuation fund (Vision Super) 2,210 1,884
2,210 1,884 Employer contributions payable at reporting date. 273 89
Refer to note 9.3 for further information relating to council's superannuation obligations.
4.2 Materials and services
Arts & culture 443 137 Building maintenance 693 610 Consultants 937 786 Delivered meals 311 198 Family day care 729 641 Fleet vehicles & plant costs 1,132 1,127 General maintenance 1,852 1,554 Information technology 988 558 Insurance 600 563 Legal 705 696 Marketing costs 694 476 Office administration 978 943 Recreation services 1,177 1,191 Roads and infrastructure 7,254 5,628 Training 537 409 Utilities 825 737 Waste* 9,767 7,671 Other contract payments 3,305 3,278 Other 1,382 1,120 Total materials and services 34,309 28,323
4.3 Depreciation and amortisation
Property 2,163 2,720 Plant and equipment 608 697 Infrastructure 12,839 10,405
Total depreciation 15,610 13,822
Intangible assets 567 1,309 Total depreciation and amortisation 16,177 15,131 Refer to note 5.3( c ) and 6.1 for a more detailed breakdown of depreciation and amortisation charges and accounting policy.
Page 17
* Waste costs - the total of waste expense for 2018/19 is $9.94m: $9.77m that is included in note 4.2, plus $0.14m in note 4.1 employee costs, plus $0.03m in note 4.5 other expenses. Total waste expenses for 2017/18 was $7.83m: $7.67m that is included in the above in note 4.2, plus $0.12m in note 4.1, plus $0.04m in note 3.5 other expenses.

18
Notes to the Financial StatementsFor the Year Ended 30 June 2019
Baw Baw Shire Council Notes to the Financial Report2018/2019 Financial Report For the Year Ended 30 June 2019
2019 2018$'000 $'000
4.4 Borrowing costs
Interest - borrowings 496 572 Total borrowing costs 496 572
4.5 Other expenses
Auditors' remuneration - VAGO - audit of the financial statements, performance statement and grant acquittals 50 42 Auditors' remuneration - Internal 46 38 Councillors' allowances 367 344 Operating lease rentals 513 489 Bank charges 182 169 Contributions - WGRL 1,827 1,830 Council grants 627 644 Others 611 586 Total other expenses 4,223 4,142
Note 5 Our financial position5.1 Financial assets(a) Cash and cash equivalents
Cash on hand 10 10 Cash at bank 13,875 5,490 Term deposits 12,000 15,000
Total cash and cash equivalents 25,885 20,500
(b) Other financial assetsTerm deposits - current 25,115 19,112 Total other financial assets 25,115 19,112
Total cash, cash equivalents and term deposits 51,000 39,612
- Trust funds and deposits (Note 5.4) 4,482 2,718 - Reserve funds allocated due to external restrictions (contractual agreement) 6,466 4,875 - Unspent Grants (Note 3.4 (c)) 2,435 3,507 Total restricted funds 13,383 11,100 Total unrestricted cash and cash equivalents 12,502 9,400
Intended allocations
- cash held to fund carried forward capital works 7,235 4,733 Total funds subject to intended allocations 7,235 4,733
Page 18
Borrowing costs are recognised as an expense in the period in which they are incurred, except where they are capitalised as part of a qualifying asset constructed by Council.
Other financial assets are valued at fair value, at balance date. Term deposits are measured at original cost. Any unrealised gains and losses on holdings at balance date are recognised as either a revenue or expense.
Cash and cash equivalents include cash on hand, deposits at call, and other highly liquid investments with original maturities of 90 days or less, net of outstanding bank overdrafts.
Councils cash and cash equivalents are subject to external restrictions that limit amounts available for discretionary use. These include:
Although not externally restricted the following amounts have been allocated for specific future purposes by Council:

Annual Financial Report 2018/19 19
Notes to the Financial StatementsFor the Year Ended 30 June 2019
Baw Baw Shire Council Notes to the Financial Report2018/2019 Financial Report For the Year Ended 30 June 2019
5.1 Financial assets (cont'd)2019 2018$'000 $'000
(c) Trade and other receivablesCurrentStatutory receivables
Rates debtors 3,097 3,519 Special rate scheme - 2
Non statutory receivables Sundry & other debtors 3,037 1,717
Net GST receivable 835 811
Total current trade and other receivables 6,969 6,049 Non-current
Total non-current trade and other receivables - -
Total trade and other receivables 6,969 6,049
(d) Ageing of receivables
Current (not yet due) 2,677 1,238 Past due by up to 30 days 119 135 Past due between 31 and 180 days 92 185 Past due between 181 and 365 days 57 48 Past due by more than 1 year 92 111
Total trade and other receivables 3,037 1,717
5.2 Non current assets classified as held for saleCost of acquisition 499 -
499 -
Page 19
Short term receivables are carried at invoice amount. A provision for doubtful debts is recognised based on an expected loss model. Long term receivables are carried at amortised cost using the effective interest rate method.
The ageing of the Council's trade and other receivables (excluding statutory receivables) that are not impaired was:
Non-current assets classified as held for sale (including disposal groups) are measured at the lower of its carrying amount and fair value less costs of disposal, and are not subject to depreciation. Non-current assets, disposal groups and related liabilities and assets are treated as current and classified as held for sale if their carrying amount will be recovered through a sale transaction rather than through continuing use. This condition is regarded as met only when the sale is highly probable and the asset's sale (or disposal group sale) is expected to be completed within 12 months from the date of classification.
20
Notes to the Financial StatementsFor the Year Ended 30 June 2019
Baw Baw Shire Council2018/2019 Financial Report
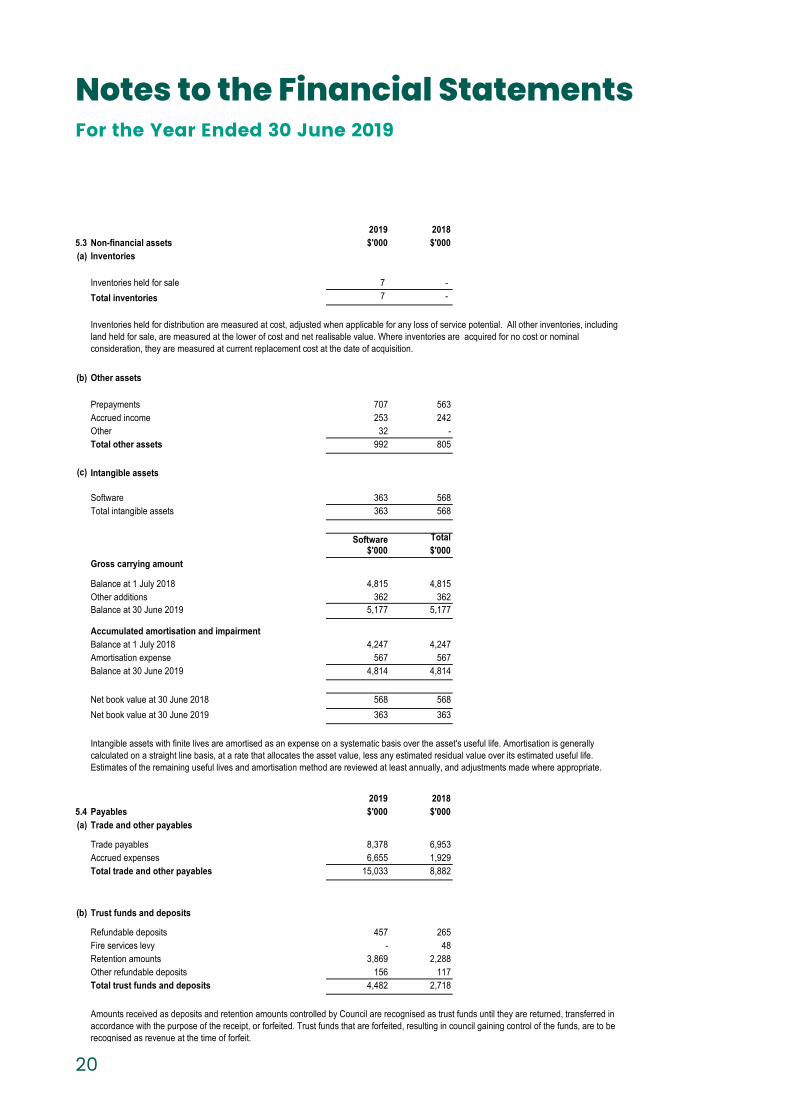
2019 20185.3 Non-financial assets $'000 $'000(a) Inventories
Inventories held for sale 7 - Total inventories 7 -
(b) Other assets
Prepayments 707 563 Accrued income 253 242 Other 32 - Total other assets 992 805
(c) Intangible assets
Software 363 568 Total intangible assets 363 568
Software Total$'000 $'000
Gross carrying amount
Balance at 1 July 2018 4,815 4,815 Other additions 362 362 Balance at 30 June 2019 5,177 5,177
Accumulated amortisation and impairmentBalance at 1 July 2018 4,247 4,247 Amortisation expense 567 567 Balance at 30 June 2019 4,814 4,814
Net book value at 30 June 2018 568 568 Net book value at 30 June 2019 363 363
2019 20185.4 Payables $'000 $'000(a) Trade and other payables
Trade payables 8,378 6,953 Accrued expenses 6,655 1,929 Total trade and other payables 15,033 8,882
(b) Trust funds and deposits
Refundable deposits 457 265 Fire services levy - 48 Retention amounts 3,869 2,288 Other refundable deposits 156 117 Total trust funds and deposits 4,482 2,718
Notes to the Financial ReportFor the Year Ended 30 June 2019
Page 20
Inventories held for distribution are measured at cost, adjusted when applicable for any loss of service potential. All other inventories, including land held for sale, are measured at the lower of cost and net realisable value. Where inventories are acquired for no cost or nominal consideration, they are measured at current replacement cost at the date of acquisition.
Intangible assets with finite lives are amortised as an expense on a systematic basis over the asset's useful life. Amortisation is generally calculated on a straight line basis, at a rate that allocates the asset value, less any estimated residual value over its estimated useful life. Estimates of the remaining useful lives and amortisation method are reviewed at least annually, and adjustments made where appropriate.
Amounts received as deposits and retention amounts controlled by Council are recognised as trust funds until they are returned, transferred in accordance with the purpose of the receipt, or forfeited. Trust funds that are forfeited, resulting in council gaining control of the funds, are to be recognised as revenue at the time of forfeit.
Annual Financial Report 2018/19 21
Notes to the Financial StatementsFor the Year Ended 30 June 2019
Baw Baw Shire Council2018/2019 Financial Report
Notes to the Financial ReportFor the Year Ended 30 June 2019
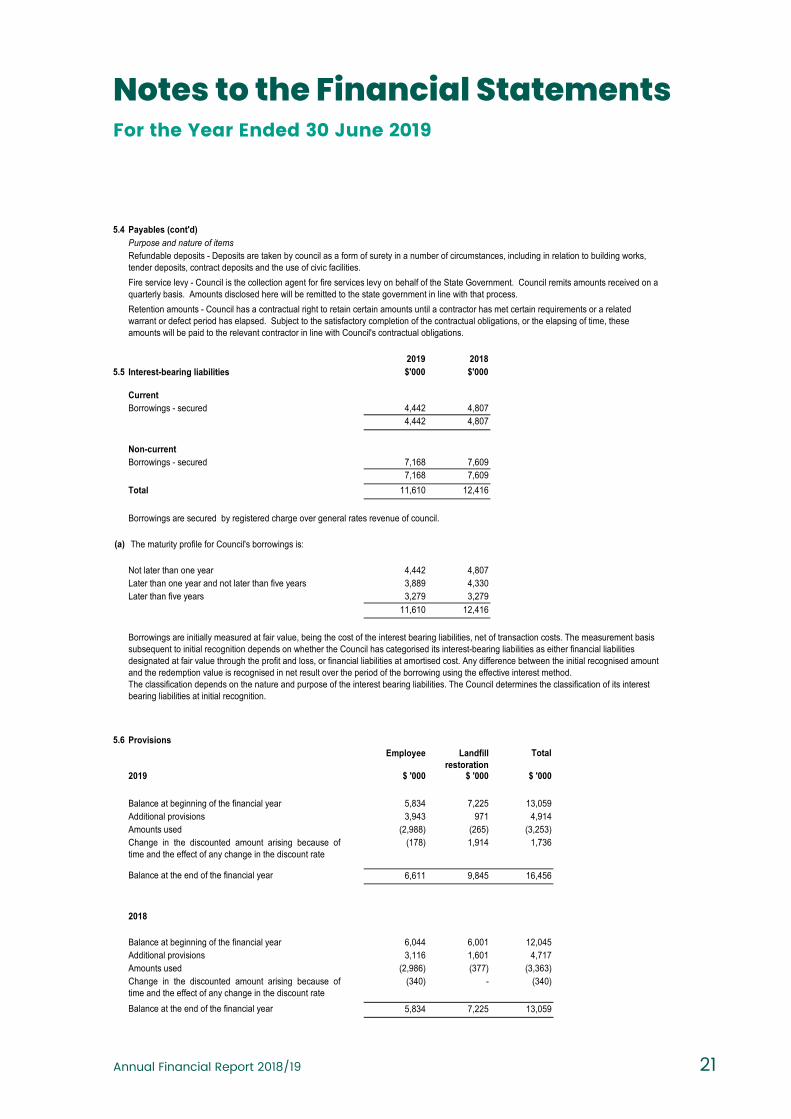
5.4 Payables (cont'd)
2019 20185.5 Interest-bearing liabilities $'000 $'000
CurrentBorrowings - secured 4,442 4,807
4,442 4,807
Non-currentBorrowings - secured 7,168 7,609
7,168 7,609 Total 11,610 12,416
(a) The maturity profile for Council's borrowings is:
Not later than one year 4,442 4,807 Later than one year and not later than five years 3,889 4,330 Later than five years 3,279 3,279
11,610 12,416
5.6 ProvisionsEmployee Landfill
restorationTotal
2019 $ '000 $ '000 $ '000
Balance at beginning of the financial year 5,834 7,225 13,059 Additional provisions 3,943 971 4,914 Amounts used (2,988) (265) (3,253)Change in the discounted amount arising because oftime and the effect of any change in the discount rate
(178) 1,914 1,736
Balance at the end of the financial year 6,611 9,845 16,456
2018
Balance at beginning of the financial year 6,044 6,001 12,045 Additional provisions 3,116 1,601 4,717 Amounts used (2,986) (377) (3,363)Change in the discounted amount arising because oftime and the effect of any change in the discount rate
(340) - (340)
Balance at the end of the financial year 5,834 7,225 13,059
Purpose and nature of items
Page 21
Refundable deposits - Deposits are taken by council as a form of surety in a number of circumstances, including in relation to building works, tender deposits, contract deposits and the use of civic facilities.Fire service levy - Council is the collection agent for fire services levy on behalf of the State Government. Council remits amounts received on a quarterly basis. Amounts disclosed here will be remitted to the state government in line with that process.Retention amounts - Council has a contractual right to retain certain amounts until a contractor has met certain requirements or a related warrant or defect period has elapsed. Subject to the satisfactory completion of the contractual obligations, or the elapsing of time, these amounts will be paid to the relevant contractor in line with Council's contractual obligations.
Borrowings are initially measured at fair value, being the cost of the interest bearing liabilities, net of transaction costs. The measurement basis subsequent to initial recognition depends on whether the Council has categorised its interest-bearing liabilities as either financial liabilities designated at fair value through the profit and loss, or financial liabilities at amortised cost. Any difference between the initial recognised amount and the redemption value is recognised in net result over the period of the borrowing using the effective interest method.The classification depends on the nature and purpose of the interest bearing liabilities. The Council determines the classification of its interest bearing liabilities at initial recognition.
Borrowings are secured by registered charge over general rates revenue of council.

22
Notes to the Financial StatementsFor the Year Ended 30 June 2019
Baw Baw Shire Council2018/2019 Financial Report
Notes to the Financial ReportFor the Year Ended 30 June 2019
5.6 Provisions (cont'd)2019 2018
(a) Employee provisions $'000 $'000
Annual leave 1,564 1,443 Long service leave 864 658 Other 314 293
2,742 2,394
Annual leave 704 619 Long service leave 2,603 2,341
3,307 2,960 Total current employee provisions 6,049 5,354
Non-current Long service leave 562 480 Annual leave - - Total non-current employee provisions 562 480
Current 6,049 5,354 Non-current 562 480
6,611 5,834
Wages and salaries and annual leave
Key assumptions: 2019 2018- discount rate 1.32% 2.65%- index rate 2.70% 2.20%
2019 2018(b) Landfill restoration $'000 $'000
Current 485 435 Non-current 9,360 6,790
9,845 7,225
Key assumptions: 2019 2018- discount rate 1.04% 2.18%- index rate 2.00% 1.98%
(c) Summary of provisions 2019 2018$'000 $'000
Current 6,534 5,789 Non-current 9,922 7,270
16,456 13,059
Page 22
Council is obligated to restore Trafalgar site to a particular standard. The forecast life of the site is based on current estimates of remaining capacity and the forecast rate of infill. The provision for landfill restoration has been calculated based on the present value of the expected cost of works to be undertaken. The expected cost of works has been estimated based on current understanding of work required to reinstate the site to a suitable standard. Accordingly, the estimation of the provision required is dependent on the accuracy of the forecast timing of the work, work required and related costs.
The calculation of employee costs and benefits includes all relevant on-costs and are calculated as follows at reporting date.
Liabilities for wages and salaries, including non-monetary benefits, annual leave and accumulated sick leave expected to be wholly settled within 12 months of the reporting date are recognised in the provision for employee benefits in respect of employee services up to the reporting date, classified as current liabilities and measured at their nominal values.
Current provisions expected to be wholly settled within 12 months
Liabilities that are not expected to be wholly settled within 12 months of the reporting date are recognised in the provision for employee benefits as current liabilities, measured at the present value of the amounts expected to be paid when the liabilities are settled using the remuneration rate expected to apply at the time of settlement.
Liability for long service leave (LSL) is recognised in the provision for employee benefits. LSL is measured at present value. Unconditional LSL is disclosed as a current liability. Conditional LSL that has been accrued, where an employee is yet to reach a qualifying term of employment, is disclosed as a non - current liability.
Aggregate carrying amount of employee provisions:
Total aggregate carrying amount of employee provisions
Long service leave
Current provisions expected to be wholly settled after 12 months

Annual Financial Report 2018/19 23
Notes to the Financial StatementsFor the Year Ended 30 June 2019
Baw Baw Shire Council2018/2019 Financial Report
Notes to the Financial ReportFor the Year Ended 30 June 2019
5.7 Financing arrangements
The Council has the following funding arrangements in place as at 30 June 2019.2019 2018
Bank overdraft 1,500 1,500 Credit card facilities 250 250 Other facilities 16,964 20,665 Total facilities 18,714 22,415
Used facilitiesCredit card facilities (25) (30)Borrowings (11,610) (12,416)Total used facilities (11,635) (12,446)Unused facilities 7,079 9,969
5.8 Commitments
2019Not later than
1 year
Later than 1 year and not
later than 2 years
Later than 2 years and not
later than 5 years
Later than 5 years Total
$'000 $'000 $'000 $'000 $'000OperatingRecycling 1,220 - - - 1,220 Garbage collection 11,616 8,535 2,210 - 22,361 Roads 5,448 - - - 5,448 Meals for delivery 320 - - - 320 Consultancies 48 - - - 48 Home care services 12 - - - 12 Cleaning contracts for council buildings 513 58 - - 571 Other 2,643 91 39 2,773 Total 21,820 8,684 2,249 - 32,753
CapitalBuildings 3,505 - - - 3,505 Roads 3,091 - - - 3,091 Consultancies 3 - - - 3 Other 1,080 - - - 1,080 Total 7,679 - - - 7,679
2018Not later than
1 year
Later than 1 year and not
later than 2 years
Later than 2 years and not
later than 5 years
Later than 5 years Total
$'000 $'000 $'000 $'000 $'000OperatingRecycling 1,675 - - - 1,675 Garbage collection 4,608 - - - 4,608 Roads 4,075 4,085 - - 8,160 Meals for delivery 305 305 - - 610 Other 2,578 1,374 - - 3,952 Total 13,241 5,764 - - 19,005
CapitalBuildings 3,103 - - - 3,103 Roads 1,556 - - - 1,556 Drainage 31 - - - 31 Other 1,264 30 - - 1,294 Total 5,954 30 - - 5,984
The Council has entered into the following commitments. Commitments are not recognised in the Balance Sheet. Commitments are disclosed at their nominal value and presented inclusive of the GST payable.
Page 23

24
Notes to the Financial StatementsFor the Year Ended 30 June 2019
Baw Baw Shire Council2018/2019 Financial Report
Notes to the Financial ReportFor the Year Ended 30 June 2019
5.8 Commitments (cont'd)2019 2018
Operating lease commitments $'000 $'000
Not later than one year 652 730 Later than one year and not later than five years 834 1,745 Later than five years 42 855
1,528 3,330
Page 24
Lease payments for operating leases are required by the accounting standard to be recognised on a straight line basis, rather than expensed in the years in which they are incurred.
At the reporting date, the Council had the following obligations under non-cancellable operating leases for the lease of equipment and land and buildings for use within Council's activities (these obligations are not recognised as liabilities):

Annual Financial Report 2018/19 25
Notes to the Financial StatementsFor the Year Ended 30 June 2019
Baw
Baw
Shire
Cou
ncil
2018
/2019
Fina
ncial
Rep
ort
Note
6.1Pr
oper
ty, in
frastr
uctu
re, p
lant a
nd eq
uipme
nt
6.1Su
mmar
y of p
rope
rty, in
frastr
uctu
re, p
lant a
nd eq
uipme
nt
Resta
ted A
t Fair
Va
lue 30
June
2018
Addit
ions
Note
3.5Co
ntrib
ution
sRe
valua
tion
Note
4.3
Depr
eciat
ionNo
te 3.6
Disp
osal
Writ
e-off
Tran
sfers
At Fa
ir Va
lue 30
Ju
ne 20
19$'0
00$'0
00$'0
00$'0
00$'0
00$'0
00$'0
00$'0
00$'0
00
Build
ings
73
,018
14
,600
-
-
(2,1
63)
(2
20)
-
-
8
5,235
La
nd
110
,454
-
3,33
9
17,66
5
-
(
2)
-
(4
99)
1
30,95
7 Pla
nt an
d equ
ipmen
t
2,88
2
4
38
-
-
(6
08)
(
42)
-
-
2,67
0 Inf
rastru
cture
455
,023
7
,832
12
,828
60
,801
(12
,839)
(4
47)
-
-
52
3,198
W
ork in
prog
ress
28
,608
24
,717
-
-
-
-
(
1,922
)
(
23,23
6)
28
,167
669
,985
47
,587
16
,167
78
,466
(15
,610)
(7
11)
(1
,922)
(23
,735)
7
70,22
7
Summ
ary o
f Wor
k in P
rogr
ess
Res
tated
Ope
ning
WIP
A
dditio
ns
Writ
e-off
Tran
sfers
C
losing
WIP
$'000
$'000
$'000
$'000
$'000
Build
ings
12
,784
6
,444
(259
)
(
15,08
2)
3,88
7 La
nd
84
23
-
-
10
7 Pla
nt an
d equ
ipmen
t
1,17
5
1,62
2
(
24)
(1
,145)
1
,628
Infras
tructu
re
14,56
5
16,62
8
(1,63
9)
(7,00
9)
22,54
5 To
tal
28,60
8
24,71
7
(1,92
2)
(23,23
6)
28,16
7 .
Notes
to th
e Fina
ncial
Rep
ort
For t
he Y
ear E
nded
30 Ju
ne 20
19
Page
25

26
Notes to the Financial StatementsFor the Year Ended 30 June 2019
Baw
Baw
Shire
Cou
ncil
2018
/2019
Fin
ancia
l Rep
ort
Note
s to
the F
inan
cial R
epor
tFo
r the
Yea
r End
ed 30
June
2019
6.1Pr
oper
ty, in
frast
ruct
ure,
plan
t and
equi
pmen
t(con
t'd)
(a)
Prop
erty
Lan
d - s
pecia
lised
L
and
- non
sp
ecial
ised
Tot
al La
nd &
Lan
d Im
prov
emen
ts
Bui
ldin
gs -
spec
ialise
d W
ork I
n Pr
ogre
ss
Tot
al Pr
oper
ty
$'000
$'000
$'000
$'000
$'000
$'000
At fa
ir valu
e 1 Ju
ly 20
18
58,67
3
51,71
7
1
10,39
0
1
23,15
0
12,86
8
24
6,408
Ac
cumu
lated
depr
eciat
ion at
1 Ju
ly 20
18
-
-
-
(50
,132)
-
(50
,132)
58
,673
51
,717
110
,390
73
,018
12
,868
196,2
76
Prio
r Per
iod
adju
stm
ent a
s at 3
0 Jun
e 201
8Fo
und a
ssets
at va
luatio
n
75
-
75
-
-
75
Foun
d ass
et ac
cumu
lated
depr
eciat
ion at
valua
tion
-
-
-
-
-
-
Dere
cogn
ised a
sset
at va
luatio
n
(
11)
-
(
11)
-
-
(
11)
Dere
cogn
ised a
sset
accu
mulat
ed de
prec
iation
at va
luatio
n
-
-
-
-
-
-
Rest
ated
Ope
ning
Bala
nce
At fa
ir valu
e 1 Ju
ly 20
18 R
estat
ed
58,73
7
51,71
7
1
10,45
4
1
23,15
0
12,86
8
24
6,472
Accu
mulat
ed de
prec
iation
at fa
ir valu
e 1 Ju
ly 20
18 R
estat
ed
-
-
-
(50
,132)
-
(50
,132)
58
,737
51
,717
110
,454
73
,018
12
,868
196,3
40
Move
men
ts in
fair
valu
eAd
dition
s
-
-
-
14
,600
6
,467
21,0
67
Contr
ibutio
ns
84
3
,255
3
,339
-
-
3,33
9
Reva
luatio
n
7,94
5
9,72
0
17,66
5
-
-
17
,665
Disp
osal
(2
)
-
(2
)
(5
82)
-
(584
)
Write
-off
-
-
-
-
(259
)
(259
)Tr
ansfe
rs
-
(499
)
(4
99)
-
(
15,08
2)
(1
5,581
)
8,02
7
12,47
6
20,50
3
14,01
8
(8,8
74)
25,6
47
Move
men
t in
accu
mul
ated
dep
recia
tion
Depr
eciat
ion an
d amo
rtisati
on
-
-
-
(2
,163)
-
(2
,163)
Accu
mulat
ed de
prec
iation
of di
spos
als
-
-
-
362
-
3
62
Impa
irmen
t loss
es re
cogn
ised i
n ope
ratin
g res
ult
-
-
-
-
-
-
Tran
sfers
-
-
-
-
-
-
-
-
-
(1
,801)
-
(1
,801)
At fa
ir valu
e 30 J
une 2
019
66
,764
64
,193
130
,957
137
,168
3
,994
272,1
19
Accu
mulat
ed de
prec
iation
at 30
June
2019
-
-
-
(
51,93
3)
-
(
51,93
3)
66,76
4
64,19
3
1
30,95
7
85,23
5
3,99
4
22
0,186
Pa
ge 26

Annual Financial Report 2018/19 27
Notes to the Financial StatementsFor the Year Ended 30 June 2019
Baw Baw Shire Council2018/2019 Financial Report
Notes to the Financial ReportFor the Year Ended 30 June 2019
6.1 Property, infrastructure, plant and equipment(cont'd)(b) Plant and Equipment
Plant machinery and equipment
Fixtures fittings and furniture Work in Progress Total plant and
equipment$'000 $'000 $'000 $'000
At fair value 1 July 2018 5,471 4,262 1,175 10,908 Accumulated depreciation at 1 July 2018 (2,848) (4,003) - (6,851)
2,623 259 1,175 4,057 Movements in fair valueAdditions 438 - 1,622 2,060 Contributions - - - - Revaluation - - - - Disposal (385) - - (385)Write-off - - (24) (24)Transfers - - (1,145) (1,145)Impairment losses recognised in operating result - - - -
53 - 453 506 Movements in accumulated depreciationDepreciation and amortisation (542) (66) - (608)Accumulated depreciation of disposals 343 - - 343 Impairment losses recognised in operating result - - - - Transfers - - - -
(199) (66) - (265)-
At fair value 30 June 2019 5,524 4,262 1,628 11,414 Accumulated depreciation at 30 June 2019 (3,047) (4,069) - (7,116)
2,477 193 1,628 4,298
Page 27

28
Notes to the Financial StatementsFor the Year Ended 30 June 2019
Baw
Baw
Shire
Cou
ncil
2018
/2019
Fina
ncial
Rep
ort
Notes
to th
e Fina
ncial
Rep
ort
For t
he Y
ear E
nded
30 Ju
ne 20
19
6.1Pr
oper
ty, in
frastr
uctu
re, p
lant a
nd eq
uipme
nt(co
nt'd)
(c) In
frastr
uctu
re
Road
sBr
idges
& M
ajor
Culve
rtsFo
otpa
ths a
nd
cycle
ways
Drain
age
Park
s, op
en sp
ace
and s
treets
cape
sOf
f stre
et ca
r pa
rks
Wor
k In P
rogr
ess
Total
Infra
struc
ture
$'000
$'000
$'000
$'000
$'000
$'000
$'000
$'000
At fa
ir valu
e 1 Ju
ly 20
18
3
90,75
4
28,43
6
36,98
8
71,02
9
25,71
7
7,284
14,56
5
5
74,77
3 Ac
cumu
lated
depr
eciat
ion at
1 Ju
ly 20
18
(78,7
38)
(5
,316)
(4
,999)
(1
1,962
)
(3,16
8)
(
2,701
)
-
(
106,8
84)
312
,016
23
,120
31
,989
59
,067
22
,549
4,5
83
14
,565
467
,889
Prior
Per
iod ad
justm
ent a
s at 3
0/06/1
8Fo
und a
ssets
at va
luatio
n
1,89
9
6
34
548
1
02
-
-
-
3
,183
Foun
d ass
et ac
cumu
lated
depr
eciat
ion at
valua
tion
(786
)
(6)
(111
)
(
29)
-
-
-
(9
32)
Dere
cogn
ised a
sset
at va
luatio
n
(4
99)
(42
)
(1
12)
(18
)
-
-
-
(671
)De
reco
gnise
d ass
et ac
cumu
lated
depr
eciat
ion at
valua
tion
80
4
33
2
-
-
-
119
Resta
ted O
penin
g Bala
nce
At fa
ir valu
e 1 Ju
ly 20
18 re
stated
392
,154
29
,028
37
,424
71
,113
25
,717
7,2
84
14
,565
577
,285
Accu
mulat
ed de
prec
iation
at fa
ir valu
e 1 Ju
ly 20
18 re
stated
(7
9,444
)
(5,31
8)
(5,07
7)
(11,9
89)
(3
,168)
(2,7
01)
-
(10
7,697
)
3
12,71
0
23,71
0
32,34
7
59,12
4
22,54
9
4,583
14,56
5
4
69,58
8 Mo
veme
nts i
n fair
value
Addit
ions
2
,960
87
5
93
1
,684
2
,236
2
72
16
,628
24
,460
Contr
ibutio
ns
6,46
7
9
10
2
,094
3
,357
-
-
-
12
,828
Reva
luatio
n
43,11
4
-
4
,038
-
-
-
-
47,15
2 Di
spos
al
(3
71)
-
(5
4)
(
70)
-
(26)
-
(521
)W
rite-o
ff
-
-
-
-
-
-
(1,6
39)
(1
,639)
Tran
sfers
(58
)
73
(73)
-
-
5
8
(7,00
9)
(7,00
9)Im
pairm
ent lo
sses
reco
gnise
d in o
pera
ting r
esult
-
-
-
-
-
-
-
-
52,11
2
1,07
0
6,59
8
4,97
1
2,23
6
304
7,98
0
75,27
1 Mo
veme
nts i
n acc
umula
ted de
prec
iation
Depr
eciat
ion an
d amo
rtisati
on
(10,3
54)
(358
)
(6
32)
(853
)
(4
66)
(1
76)
-
(
12,83
9)Re
valua
tion i
ncre
ments
/decre
ments
13
,520
-
1
29
-
-
-
-
13,64
9 Ac
cumu
lated
depr
eciat
ion of
disp
osals
36
-
16
10
-
12
-
74
Impa
irmen
t loss
es re
cogn
ised i
n ope
ratin
g res
ult
-
-
-
-
-
-
-
-
Tr
ansfe
rs
4
(10)
10
-
-
(4)
-
-
3
,206
(368
)
(4
77)
(843
)
(4
66)
(1
68)
-
88
4
At fa
ir valu
e 30 J
une 2
019
444
,266
30
,098
44
,022
76
,084
27
,953
7,5
88
22
,545
652
,556
Accu
mulat
ed de
prec
iation
at 30
June
2019
(7
6,238
)
(5,68
6)
(5,55
4)
(12,8
32)
(3
,634)
(2,8
69)
-
(10
6,813
)
3
68,02
8
24,41
2
38,46
8
63,25
2
24,31
9
4,719
22,54
5
5
45,74
3
Page
28

Annual Financial Report 2018/19 29
Notes to the Financial StatementsFor the Year Ended 30 June 2019
Baw Baw Shire Council2018/2019 Financial Report
6.1 Property, infrastructure, plant and equipment (cont'd)
Acquisition
Depreciation Period Threshold Limit
Asset recognition thresholds and depreciation periods $'000Land & land improvements land - All land under roads - All Buildings buildings 30-80 years 25 Plant and equipment plant, machinery and equipment 2-7 years All fixture fittings and furniture 1-20 years 10 computers and telecommunications 1-20 years 10 Infrastructure roads - pavement and seals 10-85 years 10 roads - formation and earthworks - 10 roads - kerbs, channel and minor culverts 80 years 5 road bridges 60-100 years 20 pedestrian bridges 60-100 years 10 major culverts 60-100 years 20 footpaths 10-80 years 10 drainage 10 years 10 waste management 10 years 10 open space and recreational facilities 10-100 years 5 off street car parks 25-85 years 10 Intangible assets Intangible assets 2-10 years 100
Land under roadsCouncil recognises land under roads it controls at fair value.
Depreciation and amortisation
Notes to the Financial ReportFor the Year Ended 30 June 2019
The purchase method of accounting is used for all acquisitions of assets, being the fair value of assets provided as consideration at the date of acquisition plus any incidental costs attributable to the acquisition. Fair value is the price that would be received to sell an asset (or paid to transfer a liability) in an orderly transaction between market participants at the measurement date.
Where assets are constructed by Council, cost includes all materials used in construction, direct labour, borrowing costs incurred during construction, and an appropriate share of directly attributable variable and fixed overheads.In accordance with Council's policy, the threshold limits have applied when recognising assets within an applicable asset class and unless otherwise stated are consistent with the prior year.
Buildings, land improvements, plant and equipment, infrastructure, and other assets having limited useful lives are systematically depreciated over their useful lives to the Council in a manner which reflects consumption of the service potential embodied in those assets. Estimates of remaining useful lives and residual values are made on a regular basis with major asset classes reassessed annually. Depreciation rates and methods are reviewed annually.
Where assets have separate identifiable components that are subject to regular replacement, these components are assigned distinct useful lives and residual values and a separate depreciation rate is determined for each component.
Road earthworks are not depreciated on the basis that they are assessed as not having a limited useful life.Straight line depreciation is charged based on the residual useful life as determined each year.Depreciation periods used are listed above and are consistent with the prior year unless otherwise stated.
Page 29
30
Notes to the Financial StatementsFor the Year Ended 30 June 2019
Baw Baw Shire Council2018/2019 Financial Report
Notes to the Financial ReportFor the Year Ended 30 June 2019
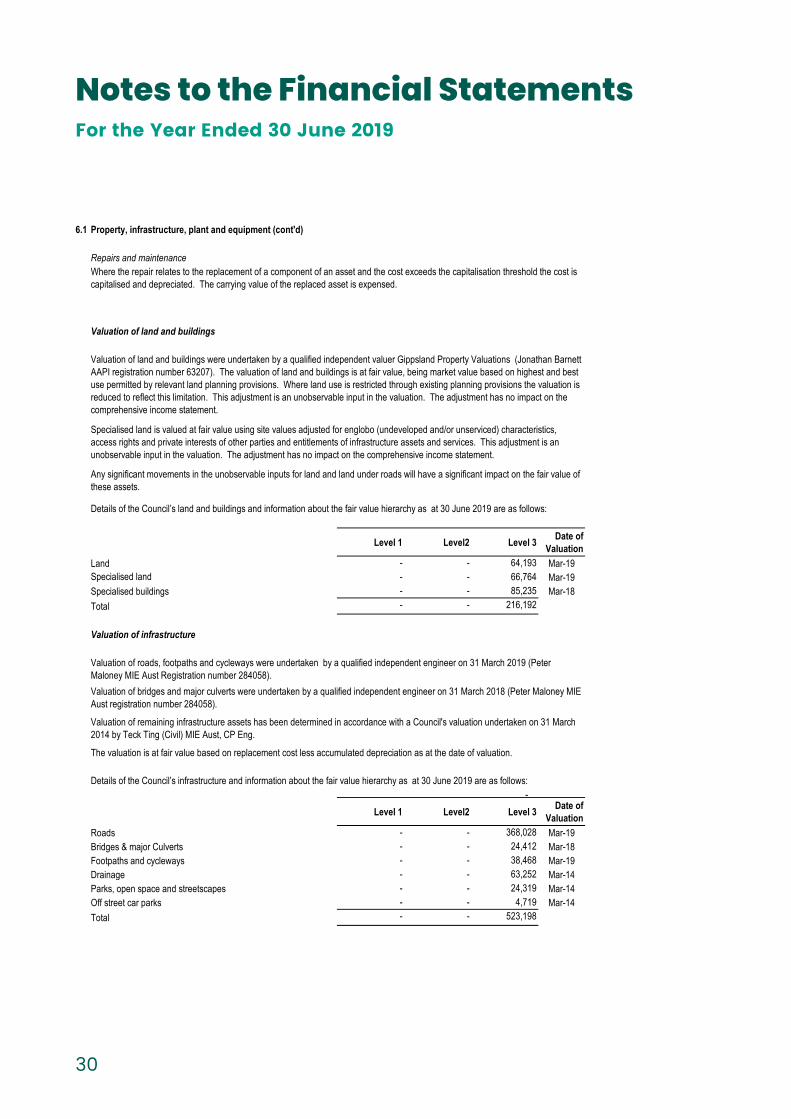
6.1 Property, infrastructure, plant and equipment (cont'd)
Repairs and maintenance
Valuation of land and buildings
Level 1 Level2 Level 3 Date of Valuation
Land - - 64,193 Mar-19Specialised land - - 66,764 Mar-19Specialised buildings - - 85,235 Mar-18Total - - 216,192
Valuation of infrastructure
- Level 1 Level2 Level 3 Date of
ValuationRoads - - 368,028 Mar-19Bridges & major Culverts - - 24,412 Mar-18Footpaths and cycleways - - 38,468 Mar-19Drainage - - 63,252 Mar-14Parks, open space and streetscapes - - 24,319 Mar-14Off street car parks - - 4,719 Mar-14Total - - 523,198
Valuation of land and buildings were undertaken by a qualified independent valuer Gippsland Property Valuations (Jonathan Barnett AAPI registration number 63207). The valuation of land and buildings is at fair value, being market value based on highest and best use permitted by relevant land planning provisions. Where land use is restricted through existing planning provisions the valuation is reduced to reflect this limitation. This adjustment is an unobservable input in the valuation. The adjustment has no impact on the comprehensive income statement.
Specialised land is valued at fair value using site values adjusted for englobo (undeveloped and/or unserviced) characteristics, access rights and private interests of other parties and entitlements of infrastructure assets and services. This adjustment is an unobservable input in the valuation. The adjustment has no impact on the comprehensive income statement.
Any significant movements in the unobservable inputs for land and land under roads will have a significant impact on the fair value of these assets.
Details of the Council’s land and buildings and information about the fair value hierarchy as at 30 June 2019 are as follows:
Where the repair relates to the replacement of a component of an asset and the cost exceeds the capitalisation threshold the cost is capitalised and depreciated. The carrying value of the replaced asset is expensed.
Valuation of bridges and major culverts were undertaken by a qualified independent engineer on 31 March 2018 (Peter Maloney MIE Aust registration number 284058)
Valuation of roads, footpaths and cycleways were undertaken by a qualified independent engineer on 31 March 2019 (Peter Maloney MIE Aust Registration number 284058).
Valuation of remaining infrastructure assets has been determined in accordance with a Council's valuation undertaken on 31 March 2014 by Teck Ting (Civil) MIE Aust, CP Eng.
The valuation is at fair value based on replacement cost less accumulated depreciation as at the date of valuation.
Details of the Council’s infrastructure and information about the fair value hierarchy as at 30 June 2019 are as follows:
Page 30
Baw Baw Shire Council2018/2019 Financial Report
Notes to the Financial ReportFor the Year Ended 30 June 2019
6.1 Property, infrastructure, plant and equipment (cont'd)
Repairs and maintenance
Valuation of land and buildings
Level 1 Level2 Level 3 Date of Valuation
Land - - 64,193 Mar-19Specialised land - - 66,764 Mar-19Specialised buildings - - 85,235 Mar-18Total - - 216,192
Valuation of infrastructure
- Level 1 Level2 Level 3 Date of
ValuationRoads - - 368,028 Mar-19Bridges & major Culverts - - 24,412 Mar-18Footpaths and cycleways - - 38,468 Mar-19Drainage - - 63,252 Mar-14Parks, open space and streetscapes - - 24,319 Mar-14Off street car parks - - 4,719 Mar-14Total - - 523,198
Valuation of land and buildings were undertaken by a qualified independent valuer Gippsland Property Valuations (Jonathan Barnett AAPI registration number 63207). The valuation of land and buildings is at fair value, being market value based on highest and best use permitted by relevant land planning provisions. Where land use is restricted through existing planning provisions the valuation is reduced to reflect this limitation. This adjustment is an unobservable input in the valuation. The adjustment has no impact on the comprehensive income statement.
Specialised land is valued at fair value using site values adjusted for englobo (undeveloped and/or unserviced) characteristics, access rights and private interests of other parties and entitlements of infrastructure assets and services. This adjustment is an unobservable input in the valuation. The adjustment has no impact on the comprehensive income statement.
Any significant movements in the unobservable inputs for land and land under roads will have a significant impact on the fair value of these assets.
Details of the Council’s land and buildings and information about the fair value hierarchy as at 30 June 2019 are as follows:
Where the repair relates to the replacement of a component of an asset and the cost exceeds the capitalisation threshold the cost is capitalised and depreciated. The carrying value of the replaced asset is expensed.
Valuation of bridges and major culverts were undertaken by a qualified independent engineer on 31 March 2018 (Peter Maloney MIE Aust registration number 284058)
Valuation of roads, footpaths and cycleways were undertaken by a qualified independent engineer on 31 March 2019 (Peter Maloney MIE Aust Registration number 284058).
Valuation of remaining infrastructure assets has been determined in accordance with a Council's valuation undertaken on 31 March 2014 by Teck Ting (Civil) MIE Aust, CP Eng.
The valuation is at fair value based on replacement cost less accumulated depreciation as at the date of valuation.
Details of the Council’s infrastructure and information about the fair value hierarchy as at 30 June 2019 are as follows:
Page 30

Annual Financial Report 2018/19 31
Notes to the Financial StatementsFor the Year Ended 30 June 2019
Baw Baw Shire Council2018/2019 Financial Report
Notes to the Financial ReportFor the Year Ended 30 June 2019
6.1 Property, infrastructure, plant and equipment(cont'd)
2019 2018Reconciliation of specialised land $'000 $'000Land under roads 18,188 18,041
Parks and reserves 18,911 15,932
Other 29,665 24,700
Total specialised land 66,764 58,673
Page 31
Specialised buildings are valued using a depreciated replacement cost technique. Significant unobservable inputs include the current replacement cost and remaining useful lives of buildings. Current replacement costs is calculated on a square metre basis and ranges from $890 to $3,620 per square metre. The remaining useful lives of buildings are determined on the basis of the current condition of buildings and vary from 30 years to 80 years. Replacement cost is sensitive to changes in market conditions, with any increase or decrease in cost flowing through to the valuation. Useful lives of buildings are sensitive to changes in expectations or requirements that could either shorten or extend the useful lives of buildings.
Infrastructure assets are valued based on the depreciated replacement cost. Significant unobservable inputs include the current replacement cost and remaining useful lives of infrastructure. The remaining useful lives of infrastructure assets are determined on the basis of the current condition of the asset and vary from 10 years to 100 years. Replacement cost is sensitive to changes in market conditions, with any increase or decrease in cost flowing through to the valuation. Useful lives of infrastructure are sensitive to changes in use, expectations or requirements that could either shorten or extend the useful lives of infrastructure assets.
Description of significant unobservable inputs into level 3 valuations
Specialised land and land under roads is valued using a market based direct comparison technique. Significant unobservable inputs include the extent and impact of restriction of use and the market cost of land per square metre. The extent and impact of restrictions on use varies and results in a reduction to surrounding land values between 5% and 95%. The market value of land varies significantly depending on the location of the land and the current market conditions. Currently land values range between $1.00 and $944 per square metre.

32
Notes to the Financial StatementsFor the Year Ended 30 June 2019
Baw Baw Shire Council2018/2019 Financial Report
2019 20186.2 Investments in associates, joint arrangements and subsidiaries $'000 $'000
(a) Investments in associatesInvestments in associates accounted for by the equity method are: - West Gippsland Regional Library Corporation 1,959 1,777
West Gippsland Regional Library CorporationBackgroundThe West Gippsland Regional Library Corporation was established by an order of the Governor in Council on the 11th December 1995 and is a Body Corporate. The corporations' main office is located at 64 Victoria Street Warragul. Council holds 44.05% equity (2018 43.84%, 2017 43.55%, 2016 41%) in the West Gippsland Regional Library corporation.
Fair value of council's investment in West Gippsland Regional Library Corporation. 1,959 1,777
Council's share of accumulated surplus/(deficit)Council's share of accumulated surplus(deficit) at start of year 1,368 1,194 Reported surplus(deficit) for year 177 166 Share of movement due to change in percentage in Ownership (37) 8 Distributions for the year - -
Council's share of accumulated surplus(deficit) at end of year 1,508 1,368 Council's share of reserves
Council's share of reserves at start of year 408 406 Share of movement due to change in percentage in ownership for other reserves 42 2 Share of movement due to change in percentage in ownership for asset revaluation reserve
1 - Council's share of reserves at end of year 451 408 Movement in carrying value of specific investment
Carrying value of investment at start of year 1,777 1,600 Share of surplus(deficit) for year 177 166 Share of movement due to change in percentage in ownership 5 11 Distributions received - -
Carrying value of investment at end of year 1,959 1,777
Committees of management
Notes to the Financial ReportFor the Year Ended 30 June 2019
Page 32
Principles of consolidation
Associates are all entities over which Council has significant influence but not control or joint control. Investments in associates are accounted for using the equity method of accounting, after initially being recognised at cost.
Investments in joint arrangements are classified as either joint operations or joint ventures depending on the contractual rights and obligations each investor has, rather than the legal structure of the joint arrangement.
For joint operations, Council recognises its direct right to, and its share of jointly held assets, liabilities, revenues and expenses of joint operations.Interests in joint ventures are accounted for using the equity method. Under this method, the interests are initially recognised in the consolidated balance sheet at cost and adjusted thereafter to recognise Council’s share of the post-acquisition profits or losses and movements in other comprehensive income in profit or loss and other comprehensive income respectively.
The consolidated financial statements of Council incorporate all entities controlled by Council as at 30 June 2019, and their income and expenses for that part of the reporting period in which control existed.
Subsidiaries are all entities over which Council has control. Council controls an entity when it is exposed to, or has rights to, variable returns from its involvement with the entity and has the ability to affect those returns through its power to direct the activities of the entity. Subsidiaries are fully consolidated from the date on which control is transferred to the Council. They are deconsolidated from the date that control ceases.
Where dissimilar accounting policies are adopted by entities and their effect is considered material, adjustments are made to ensure consistent policies are adopted in these financial statements.
All entities controlled by Council that have material revenues, expenses, assets or liabilities, such as committees of management, have been included in this financial report. Any transactions between these entities and Council have been eliminated in full.

Annual Financial Report 2018/19 33
Notes to the Financial StatementsFor the Year Ended 30 June 2019
Baw Baw Shire Council2018/2019 Financial Report
2019 2018Note 7 People and relationships No. No.
7.1 Council and key management remuneration
(a) Related partiesParent entityBaw Baw Shire council has no subsidiaries.
Subsidiaries and AssociatesInterests in subsidiaries and associates are detailed in Note 6.2.
(b) Key management personnel
Councillors Mayor M PowerDeputy Mayor D GossCouncillor J Gauci Councillor P KostosCouncillor T JonesCouncillor J O'DonnellCouncillor K CookCouncillor D WallaceCouncillor M Leaney
Key management personnel Chief Executive OfficerDirector Corporate & Community ServicesDirector Community Infrastructure Director Planning and DevelopmentChief Information OfficerExecutive Manager
Total number of councillors 9 9 Total of chief executive officer and other key management personnel 6 10 Total number of key management personnel 15 19
(c) Remuneration of key management personnel2019 2018
Total remuneration of key management personnel was as follows: $'000 $'000Short-term benefits 1,521 1,563 Long-term benefits 29 29 Termination benefits - 96 Post Employment benefits 134 144 Total 1,684 1,832
2019 2018No. No.
7 8 1 - 1 - - 1 - 1
$100,000 - $109,999 - 3 - 1
$130,000 - $139,999 - 1 $150,000 - $159,999 1 - $170,000 - $179,999 - 1 $180,000 - $189,999 - 1 $190,000 - $199,999 1 - $200,000 - $209,999 1 - $210,000 - $219,999 1 - $240,000 - $249,999 1 - $290,000 - $299,999 - 1 $310,000 - $319,999 - 1 $330,000 - $339,999 1 -
15 19
Details of persons holding the position of Councillor or other members of key management personnel at any time during the year are:
Notes to the Financial ReportFor the Year Ended 30 June 2019
The numbers of key management personnel whose total remuneration from Council and any related entities, fall within the following bands:
Page 33
$20,000 - $29,999
$80,000 - $89,999$90,000 - $99,999
$120,000 - $129,999
$60,000 - $69,999$70,000 - $79,999

34
Notes to the Financial StatementsFor the Year Ended 30 June 2019
Baw Baw Shire Council2018/2019 Financial Report
Notes to the Financial ReportFor the Year Ended 30 June 2019
Note 7 People and relationships (cont'd)(d) Senior officer remuneration
The number of senior officers are shown below in their relevant income bands:
2019 2018No. No.
1 3 9 10 3 1 1 - - 1
1 - - 1
15 16
2019 2018$'000 $'000
1,956 1,911
2019 2018$ $
7.2(a) Transactions with related parties
Gauci Electrics Pty Ltd 38,089 27,969
Mr Mark Dupe Cr Darren Wallace Cr Keith Cook 1,826,893 1,790,414
(b) Outstanding balances with related parties
(c)
(d)
No outstanding balances with related parties are in existence as at balance date.
No loans have been made, guaranteed or secured by the council to a related party.
A Senior Officer is an officer of Council, other than Key Management Personnel who: a) has management responsibilities and reports directly to the Chief Executive; orb) whose total annual remuneration exceeds $148,000
$148,000 - $149,999
$190,000 - $199,999
$230,000 - $239,999
The officer reported in income range $230,000 - $239,999 include a one-off redundancy expense(comprising redundancy payments, leave entitlements and normal pays).
Page 34
*Note that it is the total annual remuneration that determines if an officer is a senior officer, regardless of the actual remuneration paid in the period.
Councillor Joe Gauci
Related party disclosure
During the year the following key management personnel, were board members of the West Gippsland Regional Library Corporation to which the Shire made the following contributions as per the Regional Library Agreement.
During the period Council entered into the following transactions with related parties, on normal commercial terms and conditions.
Income Range:
Commitments to/from related parties
$150,000 - $159,999$160,000 - $169,999
$280,000 - $289,999
Loans to/from related parties
The aggregate amount of commitments in existence at balance date that have been made, guaranteed or secured by the council to a related party.
$200,000 - $209,999
Total remuneration for the reporting year for senior officers included above, amounted to

Annual Financial Report 2018/19 35
Notes to the Financial StatementsFor the Year Ended 30 June 2019
Baw Baw Shire Council2018/2019 Financial Report
Note 8 Managing uncertainties8.1
(a) Contingent Assets
(b) Contingent liabilitiesSuperannuation
Legal matters
(c)
Number Favouree Amount Issue Date Status
303398State of Victoria Environment Protection Authority (Trafalgar Landfill)
$446,688 24/06/08 Active
Total $446,688
Development Contributions Plans (DCPs)
Council has two DCPs (DCP02 Warragul and DCP03 Drouin) designed to collect levy income from developers for the purpose of funding the construction of infrastructure assets including roads, drainage and community facilities. As at balance date the estimated value of levies to be collected is $268.90m. As DCP02 and DCP03 are designed to be cost neutral the full amount of the $268.90m is expected to be expended on infrastructure assets.
Development Contributions Plans (DCPs)Council has one DCP (DCP01- whole of municipal district) where levy income collected will be insufficient to fully fund the construction of designated infrastructure assets. The balance of works not fully funded by DCP01 are to be met by Council. As at balance date the estimated value of infrastructure works to be funded by Council is $21.49m.
Council has received a claim from a contractor for additional costs, while undertaking a road maintenance contract. Council is defending the claim.
Financial guarantee contracts are not recognised as a liability in the balance sheet unless the lender has exercised their right to call on the guarantee or Council has other reasons to believe that it is probable that the right will be exercised.
Page 35
Notes to the Financial ReportFor the Year Ended 30 June 2019
Council has obligations under a defined benefit superannuation scheme that may result in the need to make additional contributions to the scheme, matters relating to this potential obligation are outlined below. As a result of the volatility in financial markets the likelihood of making such contributions in future periods exists.
The amount disclosed for financial guarantee in this note is the nominal amount of the underlying loan that is guaranteed by the Council, not the fair value of the financial guarantee.
The expected contributions to be paid to the Defined Benefit category of Vision Super for the year ending 30 June 2020 are $165,000.
Future superannuation contributions
Contingent assets and contingent liabilities are not recognised in the Balance Sheet, but are disclosed and if quantifiable, are measured at nominal value. Contingent assets and liabilities are presented inclusive of GST receivable or payable, respectively.
Contingent assets and liabilities
Guarantees for loans to other entities

36
Notes to the Financial StatementsFor the Year Ended 30 June 2019
Baw Baw Shire Council2018/2019 Financial Report
Notes to the Financial ReportFor the Year Ended 30 June 2019
8.2
8.3 Financial instruments
(a) Objectives and policies
(b) Market risk
Interest rate risk
Page 36
This Standard defers the mandatory effective date of AASB 15 for not-for-profit entities from 1 January 2018 to 1 January 2019.
Leases (AASB 16) (applies 2019/20)
Interest rate risk refers to the risk that the value of a financial instrument or cash flows associated with the instrument will fluctuate due to changes in market interest rates. Council's interest rate liability risk arises primarily from long term loans and borrowings at fixed rates which exposes council to fair value interest rate risk / Council does not hold any interest bearing financial instruments that are measured at fair value, and therefore has no exposure to fair value interest rate risk. Cash flow interest rate risk is the risk that the future cash flows of a financial instrument will fluctuate because of changes in market interest rates. Council has minimal exposure to cash flow interest rate risk through its cash and deposits that are at floating rates.
The standard shifts the focus from the transaction-level to a contract-based approach. Recognition is determined based on what the customer expects to be entitled to (rights and obligations), while measurement encompasses estimation by the entity of the amount expected to be entitled for performing under the contract. The full impact of this standard is not known however it is most likely to impact where contracts extend over time, where there are rights and obligations that may vary the timing or amount of the consideration, or where there are multiple performance elements. This has the potential to impact on the recognition of certain grant income.
Change in accounting standards
Revenue from contracts with customers (AASB 15) (applies 2019/20 for LG sector)
The following new AAS's have been issued that are not mandatory for the 30 June 2019 reporting period. Council has assessed these pending standards and has identified the following potential impacts will flow from the application of these standards in future reporting periods.
Income of not-for-profit entities (AASB 1058 ) (applies 2019/20)
The Council's principal financial instruments comprise cash assets, term deposits, receivables (excluding statutory receivables), payables (excluding statutory payables) and bank borrowings. Details of the significant accounting policies and methods adopted, including the criteria for recognition, the basis of measurement and the basis on which income and expenses are recognised, in respect of each class of financial asset, financial liability and equity instrument is disclosed in the notes of the financial statements. Risk management is carried out by senior management under policies approved by the Council. These policies include identification and analysis of the risk exposure to Council and appropriate procedures, controls and risk minimisation.
Market risk is the risk that the fair value or future cash flows of council financial instruments will fluctuate because of changes in market prices. The Council's exposure to market risk is primarily through interest rate risk with only insignificant exposure to other price risks and no exposure to foreign currency risk.
Amendments to Australian accounting standards – Deferral of AASB 15 for not-for-profit entities (AASB 2016-7) (applies 2019/20)
The classification of leases as either finance leases or operating leases is eliminated for lessees. Leases will be recognised in the Balance Sheet by capitalising the present value of the minimum lease payments and showing a ‘right-of-use’ asset, while future lease payments will be recognised as a financial liability. The nature of the expense recognised in the profit or loss will change. Rather than being shown as rent, or as leasing costs, it will be recognised as depreciation on the ‘right-of-use’ asset, and an interest charge on the lease liability. The interest charge will be calculated using the effective interest method, which will result in a gradual reduction of interest expense over the lease term.
Council has elected to adopt the modified retrospective approach to the transition to the new lease standard. This will mean that only existing operating leases for non low value assets, with remaining terms greater than 12 months, will be recognised on transition (1 July 2019). Based on our current lease commitments and an assumption of a continuation of the current leasing arrangements Council expects that the transition to the new standard will see the initial recognition of $1.42m in lease related assets and an equivalent liability.
This standard is expected to apply to certain transactions currently accounted for under AASB 1004 Contributions and establishes revenue recognition principles for transactions where the consideration to acquire an asset is significantly less than fair value to enable a not-for-profit entity to further its objectives.
Annual Financial Report 2018/19 37
Notes to the Financial StatementsFor the Year Ended 30 June 2019
Baw Baw Shire Council2018/2019 Financial Report
Notes to the Financial ReportFor the Year Ended 30 June 2019
8.3 Financial instruments (cont'd)
- diversification of investment product; - monitoring of return on investment; and - benchmarking of returns and comparison with budget.
(c) Credit risk
(d) Liquidity risk
- have a liquidity portfolio structure that requires surplus funds to be invested within various bands of liquid instruments;
Unless otherwise stated, the carrying amounts of financial instruments reflect their fair value.
There are no material financial assets which are individually determined to be impaired.
- monitor budget to actual performance on a regular basis; and - set limits on borrowings relating to the percentage of loans to rate revenue and percentage of loan principal repayments to rate revenue.
The Council's maximum exposure to liquidity risk is the carrying amounts of financial liabilities as disclosed on the face of the balance sheet and the amounts related to financial guarantees disclosed in Note 8.1(c), and is deemed insignificant based on prior periods' data and current assessment of risk.
There has been no significant change in Council's exposure, or its objectives, policies and processes for managing liquidity risk or the methods used to measure this risk from the previous reporting period.
Liquidity risk includes the risk that, as a result of council's operational liquidity requirements it will not have sufficient funds to settle a transaction when required or will be forced to sell a financial asset at below value or may be unable to settle or recover a financial asset.
Council may also be subject to credit risk for transactions which are not included in the balance sheet, such as when council provide a guarantee for another party. Details of our contingent liabilities are disclosed in Note 8.1(b).
To help reduce these risks Council:
Credit risk is the risk that a contracting entity will not complete its obligations under a financial instrument and cause Council to make a financial loss. Council have exposure to credit risk on some financial assets included in the balance sheet. Particularly significant areas of credit risk exist in relation to outstanding fees and fines as well as loans and receivables from sporting clubs and associations. To help manage this risk:
- council may require collateral where appropriate; and - council only invest surplus funds with financial institutions which have a recognised credit rating specified in council's investment policy.
Receivables consist of a large number of customers, spread across the ratepayer, business and government sectors. Credit risk associated with Council's financial assets mainly comprise rates receivables that are secured by a charge over the rateable property.
- council have a policy for establishing credit limits for the entities council deal with;
Interest rate movements have not been sufficiently significant during the year to have an impact on the Council's year end result.
Investment of surplus funds is made with approved financial institutions under the Local Government Act 1989 . Council manages interest rate risk by adopting an investment policy that ensures:
There has been no significant change in the Council's exposure, or its objectives, policies and processes for managing interest rate risk or the methods used to measure this risk from the previous reporting period.
- have a liquidity policy which targets a minimum and average level of cash and cash equivalents to be maintained; - have readily accessible standby facilities and other funding arrangements in place;
The maximum exposure to credit risk at the reporting date to recognised financial assets is the carrying amount, net of any provisions for impairment of those assets, as disclosed in the balance sheet and notes to the financial statements. Council does not hold any collateral over non rate debtors.
Page 37
With the exception of borrowings, all financial liabilities are expected to be settled within normal terms of trade. Details of the maturity profile for borrowings are disclosed at Note 5.5.
38
Notes to the Financial StatementsFor the Year Ended 30 June 2019
Baw Baw Shire Council2018/2019 Financial Report
Notes to the Financial ReportFor the Year Ended 30 June 2019
8.3 Financial Instruments (cont'd)(e) Sensitivity disclosure
analysis
8.4 Fair value measurement
These movements will not have a material impact on the valuation of Council's financial assets and liabilities, nor will they have a material impact on the results of Council's operations.
All assets and liabilities for which fair value is measured or disclosed in the financial statements are categorised within a fair value hierarchy, described as follows, based on the lowest level input that is significant to the fair value measurement as a whole:
Level 1 — Quoted (unadjusted) market prices in active markets for identical assets or liabilitiesLevel 2 — Valuation techniques for which the lowest level input that is significant to the fair value measurement is directly or indirectly observable; andLevel 3 — Valuation techniques for which the lowest level input that is significant to the fair value measurement is unobservable.
For the purpose of fair value disclosures, Council has determined classes of assets and liabilities on the basis of the nature, characteristics and risks of the asset or liability and the level of the fair value hierarchy as explained above.
Fair value hierarchyCouncil's financial assets and liabilities are not valued in accordance with the fair value hierarchy , Council's financial assets and liabilities are measured at amortised cost.
Council measures certain assets and liabilities at fair value where required or permitted by Australian Accounting Standards. AASB 13 Fair value measurement, aims to improve consistency and reduce complexity by providing a definition of fair value and a single source of fair value measurement and disclosure requirements for use across Australian Accounting Standards.
AASB 13 defines fair value as the price that would be received to sell an asset or paid to transfer a liability in an orderly transaction between market participants at the measurement date. Fair value under AASB 13 is an exit price regardless of whether that price is directly observable or estimated using another valuation technique.
Taking into account past performance, future expectations, economic forecasts, and management's knowledge and experience of the financial markets, Council believes the following movements are 'reasonably possible' over the next 12 months, a parallel shift of +0.5% and -0.25% in market interest rates (AUD) from year-end rates of 1.5%.
In addition, Council determines whether transfers have occurred between levels in the hierarchy by re-assessing categorisation (based on the lowest level input that is significant to the fair value measurement as a whole) at the end of each reporting period.
RevaluationSubsequent to the initial recognition of assets, non-current physical assets, other than plant and equipment, are measured at their fair value, being the price that would be received to sell an asset (or paid to transfer a liability) in an orderly transaction between market participants at the measurement date. At balance date, the Council reviewed the carrying value of the individual classes of assets measured at fair value to ensure that each asset materially approximated its fair value. Where the carrying value materially differed from the fair value at balance date, the class of asset was revalued.
Fair value valuations are determined in accordance with a valuation hierarchy. Changes to the valuation hierarchy will only occur if an external change in the restrictions or limitations of use of an asset result in changes to the permissible or practical highest and best use of the asset. In addition, Council undertakes a formal revaluation of land, buildings, and infrastructure assets on a regular basis ranging from 2 to 5 years. The valuation is performed either by experienced council officers or independent experts.
Where the assets are revalued, the revaluation increments are credited directly to the asset revaluation reserve except to the extent that an increment reverses a prior year decrement for that class of asset that had been recognised as an expense in which case the increment is recognised as revenue up to the amount of the expense. Revaluation decrements are recognised as an expense except where prior increments are included in the asset revaluation reserve for that class of asset in which case the decrement is taken to the reserve to the extent of the remaining increments. Within the same class of assets, revaluation increments and decrements within the year are offset.
Page 38

Annual Financial Report 2018/19 39
Notes to the Financial StatementsFor the Year Ended 30 June 2019
Baw Baw Shire Council2018/2019 Financial Report
Notes to the Financial ReportFor the Year Ended 30 June 2019
8.4 Fair value measurement (cont'd)
8.5
Page 39
At each reporting date, the Council reviews the carrying value of its assets to determine whether there is any indication that these assets have been impaired. If such an indication exists, the recoverable amount of the asset, being the higher of the asset's fair value less costs of disposal and value in use, is compared to the assets carrying value. Any excess of the assets carrying value over its recoverable amount is expensed to the comprehensive income statement, unless the asset is carried at the revalued amount in which case, the impairment loss is recognised directly against the revaluation surplus in respect of the same class of asset to the extent that the impairment loss does not exceed the amount in the revaluation surplus for that same class of asset.
Events occurring after balance date No matters have occurred after balance date that require disclosure in the financial report.
Impairment of assets
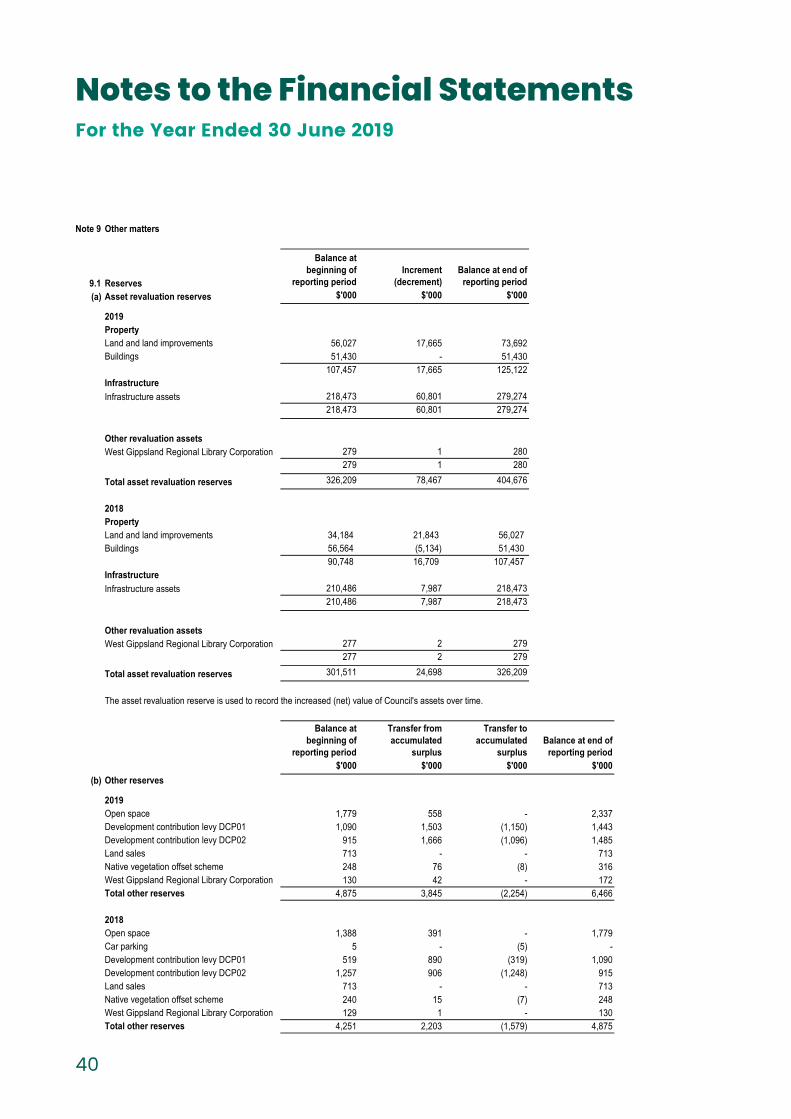
40
Notes to the Financial StatementsFor the Year Ended 30 June 2019
Baw Baw Shire Council2018/2019 Financial Report
Note 9 Other matters
9.1 Reserves
Balance atbeginning of
reporting periodIncrement
(decrement)Balance at end of
reporting period(a) Asset revaluation reserves $'000 $'000 $'000
2019PropertyLand and land improvements 56,027 17,665 73,692 Buildings 51,430 - 51,430
107,457 17,665 125,122 InfrastructureInfrastructure assets 218,473 60,801 279,274
218,473 60,801 279,274 Other revaluation assetsWest Gippsland Regional Library Corporation 279 1 280
279 1 280
Total asset revaluation reserves 326,209 78,467 404,676
2018PropertyLand and land improvements 34,184 21,843 56,027 Buildings 56,564 (5,134) 51,430
90,748 16,709 107,457 InfrastructureInfrastructure assets 210,486 7,987 218,473
210,486 7,987 218,473 Other revaluation assetsWest Gippsland Regional Library Corporation 277 2 279
277 2 279
Total asset revaluation reserves 301,511 24,698 326,209
The asset revaluation reserve is used to record the increased (net) value of Council's assets over time.
Balance atbeginning of
reporting period
Transfer from accumulated
surplus
Transfer to accumulated
surplusBalance at end of
reporting period$'000 $'000 $'000 $'000
(b) Other reserves
2019Open space 1,779 558 - 2,337 Development contribution levy DCP01 1,090 1,503 (1,150) 1,443 Development contribution levy DCP02 915 1,666 (1,096) 1,485 Land sales 713 - - 713 Native vegetation offset scheme 248 76 (8) 316 West Gippsland Regional Library Corporation 130 42 - 172 Total other reserves 4,875 3,845 (2,254) 6,466
2018Open space 1,388 391 - 1,779 Car parking 5 - (5) - Development contribution levy DCP01 519 890 (319) 1,090 Development contribution levy DCP02 1,257 906 (1,248) 915 Land sales 713 - - 713 Native vegetation offset scheme 240 15 (7) 248 West Gippsland Regional Library Corporation 129 1 - 130 Total other reserves 4,251 2,203 (1,579) 4,875
Notes to the Financial ReportFor the Year Ended 30 June 2019
Page 40

Annual Financial Report 2018/19 41
Notes to the Financial StatementsFor the Year Ended 30 June 2019
Baw Baw Shire Council2018/2019 Financial Report
Notes to the Financial ReportFor the Year Ended 30 June 2019
9.1(b) Other reserves (cont'd)
(c) Summary of reserves2019 2018$'000 $'000
Asset revaluation reserve 404,676 326,209
Other reserves 6,466 4,875 411,142 331,084
Page 41
Reconciliation to balance sheet for asset revaluation reserves and other reserves.
DCP01 & DCP02: These reserves retain funds received from developers for infrastructure provision related to the Baw Baw Shire Council development contributions plans. DCP01 refers to the Baw Baw Shire development contribution Plan 23 March 2007 and DCP02 refers to the Warragul development contributions plan September 2014. Transfers from these reserves will be nominated capital works for development infrastructure projects and community infrastructure projects. These funds are tied directly to the income received or cash funds refunded to developers for capital works completed directly by the developer.
West Gippsland Regional Library Corporation: This reserve comprises Council's share of the Regional Library Corporation Facilities Reserve. Refer to Note 6.2 that reports council's share of library reserves.
Land sales: This reserve comprises sale proceeds from land previously identified as open space land that, at the time of acquisition, would qualify for funding from the open space reserve.
Native vegetation offset: Funds contributed to Council from developers and residents who propose to remove native vegetation. The funds are then applied to offset the removal of native vegetation by making an equivalent contribution to Victoria's biodiversity. Offset requirements are determined in accordance with permitted clearing of native vegetation - Biodiversity assessment guidelines.
Car parking: This reserve retains funds contributed by developers for works associated with developments that require additional car parking with Council. Transfers to the reserve comprise contribution income from developers in lieu of the provision of additional car parking spaces.
Open space: The open Space Reserve holds fund contributed by developers for work associated with developing improved open space and recreational facilities within council. Funds are contributed in accordance with Section 18 of the Subdivision Act 1988 and transfers are restricted to the purpose of creating open space such as parks, playgrounds, pavilions and other such items where it is deemed that these works should occur at a later point than the initial development.

42
Baw Baw Shire Council2018/2019 Financial Report
9.2 Prior year adjustments
REASONS FOR ADJUSTMENTS:12
Restatement of financial statements as prior year adjustmentOpening Bal. Restated
Financial statement line item/balance affect Note Act 2018 Adj 2018 Actual 2018
$,000 $,000 $,000Balance sheet (extract)Non current assetsProperty, infrastructure, plant and equipment 6.1 668,222 1,763 669,985
Total non-current assets 670,567 - 670,567
Total assets 717,033 1,763 718,796
Current liability 22,196 - 22,196
Non current liability 14,879 - 14,879
Total liability 37,075 - 37,075
EquityAccumulated surplus 348,874 1,763 350,637
Reserves 331,084 - 331,084
Total equity 679,958 1,763 681,721
Statement of changes in equityAccumulated surplus 348,874 1,763 350,637
Balance at opening of the financial Year 679,958 1,763 681,721
2019 2018Found and derecognised assets $,000 $,000
- 64 - 694
Bridges & major culverts - 590 - 358 - 57
New found and derecognised assets - 1,763
Details of found and derecognised assets Current Cost Accumulated depreciation
Written down value
64 - 64 1,400 (706) 694
Bridges & major culverts 592 (2) 590 436 (78) 358 84 (27) 57
Total found and derecognised assets 2,576 (813) 1,763
Notes to the Financial ReportFor the Year Ended 30 June 2019
Land
Roads
Footpaths and cyclewaysDrainage
Page 42
Change in ownership was completed to recognise roads assets identified as controlled by third parties.Council completed a control and ownership test on roads, land, buildings, footpath and cycleways assets. This review resulted in the inclusion and exclusion of some asset items.A third balance sheet has not been presented to disclose the prior year adjustments as they were considered not material to the comparative amounts in the Balance Sheet. The net changes are displayed in the following table:
Land
Roads
Footpaths and cyclewaysDrainage
Notes to the Financial StatementsFor the Year Ended 30 June 2019
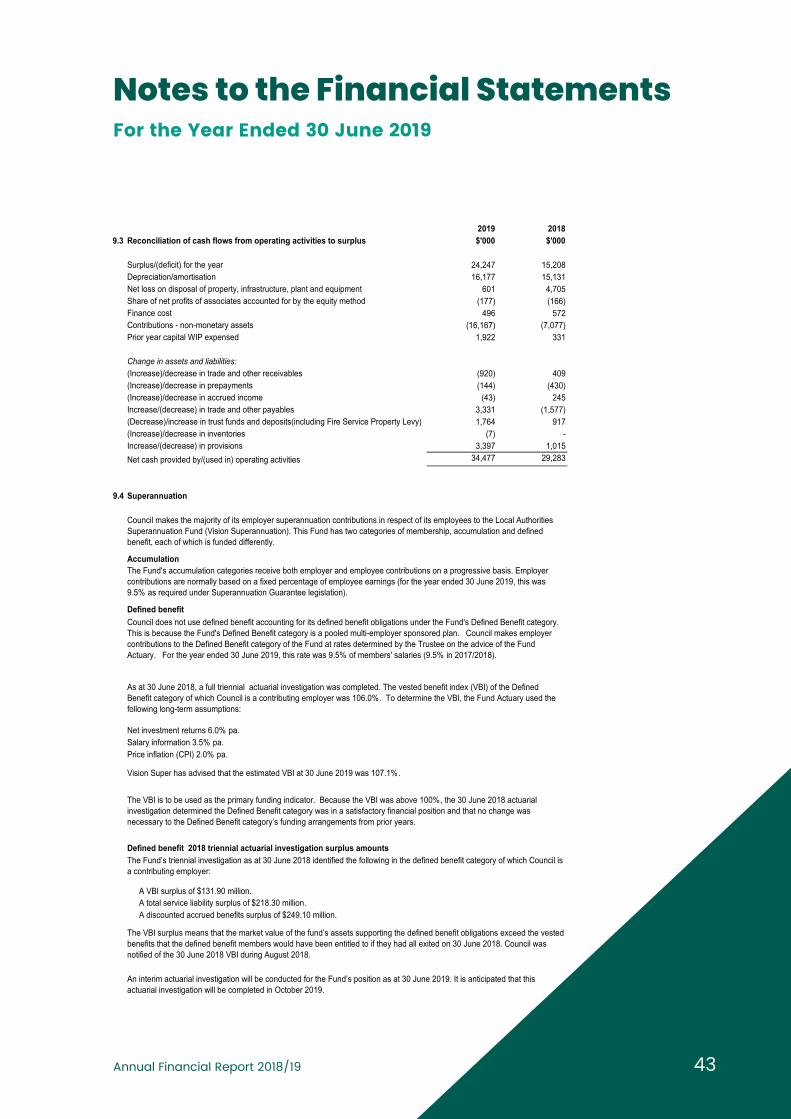
Annual Financial Report 2018/19 43
Baw Baw Shire Council2018/2019 Financial Report
2019 20189.3 Reconciliation of cash flows from operating activities to surplus $'000 $'000
Surplus/(deficit) for the year 24,247 15,208 Depreciation/amortisation 16,177 15,131 Net loss on disposal of property, infrastructure, plant and equipment 601 4,705 Share of net profits of associates accounted for by the equity method (177) (166)Finance cost 496 572 Contributions - non-monetary assets (16,167) (7,077)Prior year capital WIP expensed 1,922 331
Change in assets and liabilities:(Increase)/decrease in trade and other receivables (920) 409 (Increase)/decrease in prepayments (144) (430)(Increase)/decrease in accrued income (43) 245 Increase/(decrease) in trade and other payables 3,331 (1,577)(Decrease)/increase in trust funds and deposits(including Fire Service Property Levy) 1,764 917 (Increase)/decrease in inventories (7) - Increase/(decrease) in provisions 3,397 1,015 Net cash provided by/(used in) operating activities 34,477 29,283
9.4 Superannuation
Accumulation
Defined benefit
Net investment returns 6.0% pa.Salary information 3.5% pa.Price inflation (CPI) 2.0% pa.
Defined benefit 2018 triennial actuarial investigation surplus amounts
A VBI surplus of $131.90 million.A total service liability surplus of $218.30 million. A discounted accrued benefits surplus of $249.10 million.
Page 43
The Fund’s triennial investigation as at 30 June 2018 identified the following in the defined benefit category of which Council is a contributing employer:
The VBI surplus means that the market value of the fund’s assets supporting the defined benefit obligations exceed the vested benefits that the defined benefit members would have been entitled to if they had all exited on 30 June 2018. Council was notified of the 30 June 2018 VBI during August 2018.
An interim actuarial investigation will be conducted for the Fund’s position as at 30 June 2019. It is anticipated that this actuarial investigation will be completed in October 2019.
Notes to the Financial ReportFor the Year Ended 30 June 2019
As at 30 June 2018, a full triennial actuarial investigation was completed. The vested benefit index (VBI) of the Defined Benefit category of which Council is a contributing employer was 106.0%. To determine the VBI, the Fund Actuary used the following long-term assumptions:
Vision Super has advised that the estimated VBI at 30 June 2019 was 107.1%.
The VBI is to be used as the primary funding indicator. Because the VBI was above 100%, the 30 June 2018 actuarial investigation determined the Defined Benefit category was in a satisfactory financial position and that no change was necessary to the Defined Benefit category’s funding arrangements from prior years.
Council makes the majority of its employer superannuation contributions in respect of its employees to the Local Authorities Superannuation Fund (Vision Superannuation). This Fund has two categories of membership, accumulation and defined benefit, each of which is funded differently.
The Fund's accumulation categories receive both employer and employee contributions on a progressive basis. Employer contributions are normally based on a fixed percentage of employee earnings (for the year ended 30 June 2019, this was 9.5% as required under Superannuation Guarantee legislation).
Council does not use defined benefit accounting for its defined benefit obligations under the Fund's Defined Benefit category. This is because the Fund's Defined Benefit category is a pooled multi-employer sponsored plan. Council makes employer contributions to the Defined Benefit category of the Fund at rates determined by the Trustee on the advice of the Fund Actuary. For the year ended 30 June 2019, this rate was 9.5% of members' salaries (9.5% in 2017/2018).
Notes to the Financial StatementsFor the Year Ended 30 June 2019
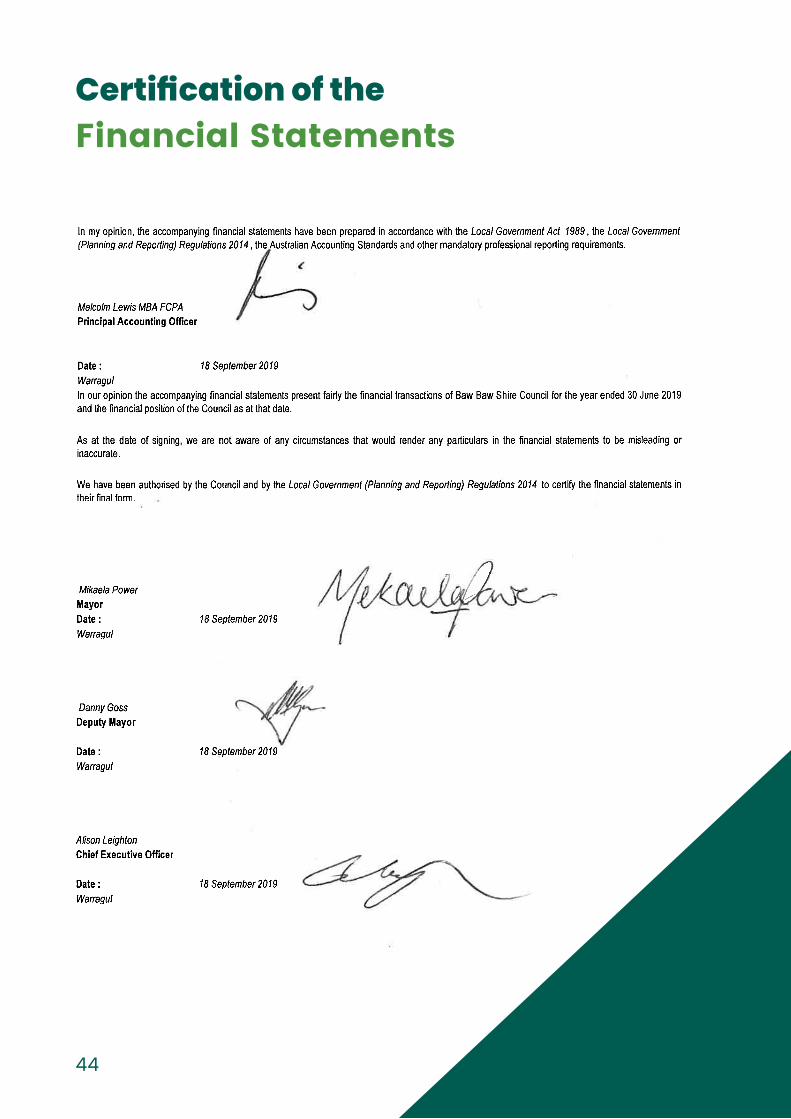
44
Certification of the Financial Statements

Jindivick 45

46
Independent Auditor’s Report To the Councillors of Baw Baw Shire Council
Opinion I have audited the financial report of Baw Baw Shire Council (the council) which comprises the:
balance sheet as at 30 June 2019 comprehensive income statement for the year then ended statement of changes in equity for the year then ended statement of cash flows for the year then ended statement of capital works for the year then ended notes to the financial statements, including significant accounting policies certification of the financial statements.
In my opinion the financial report presents fairly, in all material respects, the financial position of the council as at 30 June 2019 and its financial performance and cash flows for the year then ended in accordance with the financial reporting requirements of Part 6 of the Local Government Act 1989 and applicable Australian Accounting Standards.
Basis for Opinion
I have conducted my audit in accordance with the Audit Act 1994 which incorporates the Australian Auditing Standards. I further describe my responsibilities under that Act and those standards in the Auditor’s Responsibilities for the Audit of the Financial Report section of my report.
My independence is established by the Constitution Act 1975. My staff and I are independent of the council in accordance with the ethical requirements of the Accounting Professional and Ethical Standards Board’s APES 110 Code of Ethics for Professional Accountants (the Code) that are relevant to my audit of the financial report in Victoria. My staff and I have also fulfilled our other ethical responsibilities in accordance with the Code.
I believe that the audit evidence I have obtained is sufficient and appropriate to provide a basis for my opinion.
Councillors’ responsibilities for the financial report
The Councillors of the council are responsible for the preparation and fair presentation of the financial report in accordance with Australian Accounting Standards and the Local Government Act 1989, and for such internal control as the Councillors determine is necessary to enable the preparation and fair presentation of a financial report that is free from material misstatement, whether due to fraud or error.
In preparing the financial report, the Councillors are responsible for assessing the council’s ability to continue as a going concern, disclosing, as applicable, matters related to going concern and using the going concern basis of accounting unless it is inappropriate to do so.
Annual Financial Report 2017/18 47
2
Auditor’s responsibilities for the audit of the financial report
As required by the Audit Act 1994, my responsibility is to express an opinion on the financial report based on the audit. My objectives for the audit are to obtain reasonable assurance about whether the financial report as a whole is free from material misstatement, whether due to fraud or error, and to issue an auditor’s report that includes my opinion. Reasonable assurance is a high level of assurance, but is not a guarantee that an audit conducted in accordance with the Australian Auditing Standards will always detect a material misstatement when it exists. Misstatements can arise from fraud or error and are considered material if, individually or in the aggregate, they could reasonably be expected to influence the economic decisions of users taken on the basis of this financial report.
As part of an audit in accordance with the Australian Auditing Standards, I exercise professional judgement and maintain professional scepticism throughout the audit. I also:
identify and assess the risks of material misstatement of the financial report, whether due to fraud or error, design and perform audit procedures responsive to those risks, and obtain audit evidence that is sufficient and appropriate to provide a basis for my opinion. The risk of not detecting a material misstatement resulting from fraud is higher than for one resulting from error, as fraud may involve collusion, forgery, intentional omissions, misrepresentations, or the override of internal control.
obtain an understanding of internal control relevant to the audit in order to design audit procedures that are appropriate in the circumstances, but not for the purpose of expressing an opinion on the effectiveness of the council’s internal control
evaluate the appropriateness of accounting policies used and the reasonableness of accounting estimates and related disclosures made by the Councillors
conclude on the appropriateness of the Councillors’ use of the going concern basis of accounting and, based on the audit evidence obtained, whether a material uncertainty exists related to events or conditions that may cast significant doubt on the council’s ability to continue as a going concern. If I conclude that a material uncertainty exists, I am required to draw attention in my auditor’s report to the related disclosures in the financial report or, if such disclosures are inadequate, to modify my opinion. My conclusions are based on the audit evidence obtained up to the date of my auditor’s report. However, future events or conditions may cause the council to cease to continue as a going concern.
evaluate the overall presentation, structure and content of the financial report, including the disclosures, and whether the financial report represents the underlying transactions and events in a manner that achieves fair presentation.
I communicate with the Councillors regarding, among other matters, the planned scope and timing of the audit and significant audit findings, including any significant deficiencies in internal control that I identify during my audit.
MELBOURNE 23 September 2019
Jonathan Kyvelidis as delegate for the Auditor-General of Victoria

Baw Baw Shire CouncilPerformance StatementBaw Baw Shire CouncilPerformance Statement
48 Aberfeldy

Annual Financial Report 2017/18 49
Performance StatementFor the Year Ended 30 June 2019
2
Performance Statement For the year ended 30 June 2019
Description of municipality Baw Baw Shire Council is approximately 100 kilometres east of Melbourne in West Gippsland. The shire was formed
in 1994 from the amalgamation of the former Buln Buln and Narracan Shires, the Rural City of Warragul, and some parts of the Shire of Upper Yarra.
The northern half of the shire is heavily forested and lies in the Great Dividing Range and its foothills, including parts of the Mt Baw Baw National Park, while the shire is bounded by the Strzelecki Range and its foothills to the south. The middle part of the shire is more densely populated, particularly in areas close to the Princes Highway and the Gippsland railway line, but still retains its rural environment.
Baw Baw’s main industries (in terms of economic value of output) include manufacturing; construction; rental, hiring and real estate; agriculture, forestry and fishing; and health care and social assistance.
The council covers an area of 4,027 square kilometres and has an estimated resident population of 52,015 (as at 30 June 2018).

50
Sustainable Capacity IndicatorsFor the Year Ended 30 June 2019
3
Sustainable Capacity Indicators For the year ended 30 June 2019 Results Indicator/measure 2016 2017 2018 2019 Material Variations and Comments Population C1 Expenses per head of municipal
population [Total expenses / Municipal population]
$1,550 $1,551 $1,549 $1,597 Council’s operating expenses were $83.1 million, resulting in a cost to deliver Council services per head of population of $1,597 for 2018/19.
C2 Infrastructure per head of
municipal population [Value of infrastructure / Municipal population]
$11,418 $11,270 $11,076 $12,290 The result for 2018/19 was due to the increase in the value of Council's infrastructure including roads, drains, footpaths, bridges and buildings. The increase was also due to a revaluation of some asset classes (including roads) plus investment in new and replacement assets via the annual capital works program.
C3 Population density per length of
road [Municipal population / Kilometres of local roads]
26 27 28 29 There has been a marginal increase in population and number of road users for each kilometre of road length.
Own-source revenue
C4 Own-source revenue per head of municipal population [Own-source revenue / Municipal population]
$1,190 $1,212 $1,205 $1,247 This is a favourable result that reflects Council's increased ability to generate revenue from internal sources (mainly rates and user fees) when compared to the population within the municipality.
Recurrent grants
C5 Recurrent grants per head of municipal population [Recurrent grants / Municipal population]
$274 $462 $339 $260 There has been a decrease in recurrent grants per head of population, mainly due to a reduction in Roads to Recovery grants (which is expected to be reinstated in the ensuing 2019/20 year).
Disadvantage
C6 Relative Socio-Economic Disadvantage [Index of Relative Socio-Economic Disadvantage by decile]
6 6 6 6 The Australian Bureau of Statistics (ABS) prepares an index of relative socio-economic disadvantage. The result for the municipality is six, where one is the most and ten is the least disadvantaged.

51
Service Performance IndicatorsFor the Year Ended 30 June 2019
4
Service Performance Indicators For the year ended 30 June 2019
Results Service/indicator/measure 2016 2017 2018 2019 Material Variations and Comments
Aquatic Facilities
Utilisation
AF6 Utilisation of aquatic facilities [Number of visits to aquatic facilities / Municipal population]
1.4 4.7 5.2 5.0 Council aquatic facilities include those at Drouin, Neerim South, Rawson, Trafalgar, Thorpdale and the Warragul Leisure Centre. The result for this performance measure remains consistent with previous year's results.
Animal Management
Health and safety
AM4 Animal management
prosecutions [Number of successful animal management prosecutions]
7 9 3 15 During 2018/19, there was a significant increase of reported dog attacks and other reported offences, and as a result Council conducted a total of 15 animal management prosecutions for the year. Prosecutions are conducted on an as needs basis or when required under the Domestic Animals Act 1994. Council's primary strategy remains focused on communication, education and promotion of responsible pet ownership.
Food Safety
Health and safety
FS4 Critical and major non-
compliance outcome notifications [Number of critical non-compliance outcome notifications and major non-compliance notifications about a food premises followed up / Number of critical non-compliance outcome notifications and major non-compliance notifications about a food premises] x100
40.9% 58.9% 76.7% 100.0% Council's food safety service follow up on all major and critical non-compliance notifications for food premises. For the 2018 calendar year, there were 25 critical and major non-compliance notifications.
Governance
Satisfaction
G5 Satisfaction with council decisions [Community satisfaction rating out of 100 with how council has performed in making decisions in the interest of the community]
47 46 48 43 The annual Community Satisfaction Survey assess the community's satisfaction with Council's performance. Satisfaction with Council decisions was rated as 43 out of 100.

52
Service Performance IndicatorsFor the Year Ended 30 June 2019
5
Results Service/indicator/measure 2016 2017 2018 2019 Material Variations and Comments
Home and Community Care (HACC)
Participation
HC6 Participation in HACC service
[Number of people that received a HACC service / Municipal target population for HACC services] x100
44.1% Reporting ceased 1 July 2016
Reporting ceased 1 July 2016
Reporting ceased 1 July 2016
Reporting on HACC ceased on 1 July 2016 due to the introduction of the Commonwealth Government’s National Disability Insurance Scheme (NDIS) and Commonwealth Home Support Program (CHSP).
Participation
HC7 Participation in HACC service
by CALD people [Number of CALD people who receive a HACC service / Municipal target population in relation to CALD people for HACC services] x100
32.2% Reporting ceased 1 July 2016
Reporting ceased 1 July 2016
Reporting ceased 1 July 2016
Libraries
Participation
LB4 Active library members
[Number of active library members / Municipal population] x100
15.4% 15.0% 14.9% 14.5% During the year 7,531 library members borrowed a library collection item which is an increase on the prior year. However, the municipal population is growing faster than the number of active members using the service. Therefore there is a decrease in the percent of shire residents who are active library members. This indicator does not include the increasing number of members who use the library service for accessing Wi-Fi and computers, or who don't borrow an item whilst visiting our libraries.
Maternal and Child Health
(MCH)
Participation
MC4 Participation in the MCH
service [Number of children who attend the MCH service at least once (in the year) / Number of children enrolled in the MCH service] x100
76.1% 71.2% 72.1% 70.6% During the year, 2,583 children were enrolled in the Maternal and Child Health service and 1,824 of those children attended the service at least once during the year. This result is lower than previous years.
MC5 Participation
Participation in the MCH service by Aboriginal children [Number of Aboriginal children who attend the MCH service at least once (in the year) / Number of Aboriginal children enrolled in the MCH service] x100
53.1% 68.5% 81.5% 78.5% Participation in the Maternal and Child Health by Aboriginal children remains high. Sixty Aboriginal children enrolled in the Maternal and Child Health service and of those, 47 children attended the service at least once during the year. The result for the 2018/19 year is higher than the average for other municipalities as at 2017/18.

53
Service Performance IndicatorsFor the Year Ended 30 June 2019
6
Results Service/indicator/measure 2016 2017 2018 2019 Material Variations and Comments Roads
Satisfaction
R5 Satisfaction with sealed local
roads [Community satisfaction rating out of 100 with how council has performed on the condition of sealed local roads]
38 42 42 40 The annual Community Satisfaction Survey assesses the community's satisfaction with Council's performance. Satisfaction with sealed local roads remains consistent with previous years and was rated as 40 out of 100.
Statutory Planning
Decision making
SP4 Council planning decisions upheld at VCAT [Number of VCAT decisions that did not set aside Councils decision in relation to a planning application / Number of VCAT decisions in relation to planning applications] x100
62.5% 57.1% 90.0% 50.0% Four of Council's planning decisions were appealed to VCAT during the 2018/19 year. Two out of those four applications were upheld by VCAT, the remaining two were set aside with a permit granted.
Waste Collection
Waste diversion
WC5 Kerbside collection waste
diverted from landfill [Weight of recyclables and green organics collected from kerbside bins / Weight of garbage, recyclables and green organics collected from kerbside bins] x100
52.0% 53.0% 52.5% 53.2% Consistent with previous years, over half of the Shire's waste is recycled or placed into the green organics bin, rather than into landfill. Baw Baw is diverting more waste from landfill than the average result for other municipalities compared to the 2017/18 year.

54
Service Performance IndicatorsFor the Year Ended 30 June 2019
7
Finan
cial P
erfo
rman
ce In
dicato
rs
For th
e yea
r end
ed 30
June
2019
Resu
lts
Fore
casts
Di
mens
ion/in
dicato
r/mea
sure
20
16
2017
20
18
2019
20
20
2021
20
22
2023
Ma
terial
Var
iation
s and
Com
ment
s
Effic
iency
Re
venu
e lev
el
E1
Aver
age r
eside
ntial
rate
per r
eside
ntial
prop
erty
asse
ssme
nt [R
eside
ntial
rate r
even
ue / N
umbe
r of
reside
ntial
prop
erty
asse
ssme
nts]
$1,79
7 $1
,846
$1,87
6 $1
,899
$1,85
9 $1
,896
$1,93
9 $1
,983
Ther
e was
a sm
all in
creas
e in a
vera
ge
rates
inco
me fo
r eac
h res
identi
al pr
oper
ty, m
ainly
due t
o the
incre
ase i
n rat
es th
at is
capp
ed by
the S
tate
Gove
rnmen
t rate
cap l
egisl
ation
.
Ex
pend
iture
leve
l
E2
Expe
nses
per p
rope
rty as
sess
ment
[Tota
l exp
ense
s / N
umbe
r of p
rope
rty
asse
ssme
nts]
$2,72
9 $2
,930
$3,00
2 $3
,147
$3,04
7 $3
,086
$3,12
2 $3
,154
Coun
cil's
oper
ating
expe
nses
wer
e $8
3.1 m
illion d
uring
2018
/19, r
esult
ing
in a c
ost to
deliv
er Co
uncil
servi
ces
per p
rope
rty as
sess
ment
of $3
,147.
W
orkfo
rce t
urno
ver
E3
Re
signa
tions
and t
ermi
natio
ns
comp
ared
to av
erag
e staf
f [N
umbe
r of p
erma
nent
staff
resign
ation
s and
term
inatio
ns /
Aver
age n
umbe
r of p
erma
nent
staff
for th
e fina
ncial
year
] x10
0
17.5%
17
.2%
20.1%
14
.2%
15.8%
11
.6%
11.5%
11
.4%
This
is a f
avou
rable
resu
lt as t
urno
ver
has r
educ
ed fr
om 20
per c
ent to
14 pe
r ce
nt in
2018
/19, b
ased
on 48
res
ignati
ons a
nd te
rmina
tions
co
mpar
ed to
an av
erag
e of 3
38
perm
anen
t staf
f.
Liq
uidity
W
orkin
g cap
ital
L1
Cu
rrent
asse
ts co
mpar
ed to
curre
nt lia
bilitie
s [C
urren
t ass
ets / C
urren
t liab
ilities
] x1
00
195.1
% 22
9.5%
209.3
% 19
5.0%
203.5
% 18
2.5%
211.6
% 22
2.9%
Ther
e has
been
a ma
rgina
l dec
rease
in
curre
nt as
sets
comp
ared
to
liabil
ities,
which
is st
ill a h
ealth
y res
ult.
This
ratio
is a
meas
ure o
f fina
ncial
su
staina
bility
and r
epres
ents
curre
nt

55
Service Performance IndicatorsFor the Year Ended 30 June 2019
8
Resu
lts
Fore
casts
Di
mens
ion/in
dicato
r/mea
sure
20
16
2017
20
18
2019
20
20
2021
20
22
2023
Ma
terial
Var
iation
s and
Com
ment
s as
sets
of $5
9.5 m
illion d
ivide
d by
curre
nt lia
bilitie
s of $
30.5
millio
n.
Un
restr
icted
cash
L2
Unre
strict
ed ca
sh co
mpar
ed to
curre
nt lia
bilitie
s [U
nres
tricted
cash
/ Cur
rent li
abilit
ies]
x100
49
.7%
27.4%
21
.0%
17.3%
10
5.2%
91.4%
10
1.3%
107.9
%
This
ratio
mea
sure
s Cou
ncil's
abilit
y to
meet
liabil
ities a
s the
y fall
due.
Budg
et an
d futu
re ye
ars (
2019
/20 to
2022
/23)
assu
mes t
here
are n
o 'oth
er fin
ancia
l as
sets'
and a
ll cas
h is u
nres
tricted
res
ulting
in a
highe
r rati
o for
for
ecas
ted fu
ture y
ears.
Ob
ligati
ons
Asse
t ren
ewal
O1
Asse
t ren
ewal
comp
ared
to
depr
eciat
ion
[Ass
et re
newa
l exp
ense
/ Ass
et de
prec
iation
] x10
0 11
8.5%
89.2%
80
.6%
77.5%
86
.6%
86.9%
85
.4%
76.1%
Th
is me
asur
e com
pares
the a
moun
t sp
ent o
n ren
ewal
capit
al ex
pend
iture
div
ided b
y tota
l dep
reciat
ion. T
he
marg
inal d
ecrea
se is
main
ly du
e to a
n inc
rease
in de
prec
iation
expe
nse.
Loan
s and
borro
wing
s
O2
Loan
s and
borro
wing
s com
pare
d to
rates
[In
teres
t bea
ring l
oans
and b
orrow
ings
/ Rate
reve
nue]
x100
22.9%
26
.9%
22.9%
20
.2%
18.6%
26
.8%
25.9%
25
.0%
Ther
e has
been
a sm
all de
creas
e in
loans
and b
orrow
ings c
ompa
red to
rat
es be
twee
n the
2017
/18 an
d 20
18/19
year
s. Co
uncil
is ab
le to
increa
se bo
rrowi
ng to
a ma
ximum
of
40 pe
r cen
t of r
ate re
venu
e. Th
e 20
18/19
varia
nce i
s due
to a
redu
ction
in
the to
tal lo
an po
rtfolio
as w
ell as
due
to the
expe
cted a
nnua
l incre
ase i
n tot
al ra
te re
venu
e. Fu
ture y
ears
are
increa
sing d
ue to
prop
osed
futur
e ye
ars b
orrow
ings t
o par
tly fu
nd ne
w inf
rastr
uctur
e.

56
Service Performance IndicatorsFor the Year Ended 30 June 2019
9
Resu
lts
Fore
casts
Di
mens
ion/in
dicato
r/mea
sure
20
16
2017
20
18
2019
20
20
2021
20
22
2023
Ma
terial
Var
iation
s and
Com
ment
s O3
Lo
ans a
nd bo
rrowi
ngs r
epay
ments
co
mpar
ed to
rates
[In
teres
t and
princ
ipal re
paym
ents
on
inter
est b
earin
g loa
ns an
d bor
rowing
s / R
ate re
venu
e] x1
00
4.0%
3.7%
3.9%
9.3%
8.2%
0.9%
7.1%
1.1%
This
ratio
refle
cts to
tal pa
ymen
ts for
pr
incipa
l and
inter
est d
ivide
d by t
otal
rate r
even
ue. T
he re
sults
indic
ate
Coun
cil’s
adeq
uate
abilit
y to m
eet d
ebt
comm
itmen
ts fro
m ra
tes re
venu
e. Fo
r 20
18/19
, the h
igher
perce
ntage
is du
e to
the re
paym
ent o
f a $4
millio
n loa
n, wh
ich ha
s bee
n sub
sequ
ently
ref
inanc
ed an
d roll
ed ov
er to
the
2019
/20 ye
ar. T
he lo
wer p
erce
ntage
ind
icator
s for
2020
/21 an
d 202
2/23 i
s ref
lectiv
e of m
inima
l loan
repa
ymen
ts for
ecas
ted fo
r thes
e yea
rs.
Indeb
tedne
ss
O4
No
n-cu
rrent
liabil
ities c
ompa
red t
o ow
n sou
rce re
venu
e [N
on-cu
rrent
liabil
ities /
Own
sour
ce
reven
ue] x
100
31.6%
31
.7%
24.5%
26
.3%
29.5%
30
.9%
35.3%
34
.1%
This
is a f
avou
rable
resu
lt tha
t refl
ects
Coun
cil's
increa
sed a
bility
to ge
nera
te rev
enue
from
inter
nal s
ource
s (ma
inly
rates
and u
ser f
ees)
avail
able
to re
pay
debts
(liab
ilities
) tha
t are
not d
ue fo
r at
least
a fur
ther 1
2 mon
ths. T
he
Victor
ian A
udito
r-Gen
eral’
s Offic
e has
ind
icated
40 pe
r cen
t or le
ss as
low
risk.
Coun
cil is
well
with
in the
requ
ired
40 pe
r cen
t thre
shold
.
Op
erati
ng po
sition
Ad
justed
unde
rlying
resu
lt
OP1
Adjus
ted un
derly
ing su
rplus
(or d
eficit
) [A
djuste
d und
erlyi
ng su
rplus
(defi
cit)/
Adjus
ted un
derly
ing re
venu
e] x1
00
-5.9%
7.6
% 0.1
% 0.5
% 4.3
% 3.2
% 2.8
% 2.6
%
The 2
018/1
9 pos
itive r
esult
of 0.
5 per
ce
nt an
d refl
ects
a fina
ncial
ly su
staina
ble po
sition
. Whil
e futu
re ye
ars a
re fo
reca
st to
rema
in po
sitive
, the
relat
ively
low pe
r cen
t forec
ast
(less
than
10 pe
r cen
t) re
flects
Co
uncil
's lim
ited c
apac
ity to
fund
futur
e inf
rastr
uctur
e ass
et re
place
ment
need
s.

57
Service Performance IndicatorsFor the Year Ended 30 June 2019
10
Resu
lts
Fore
casts
Di
mens
ion/in
dicato
r/mea
sure
20
16
2017
20
18
2019
20
20
2021
20
22
2023
Ma
terial
Var
iation
s and
Com
ment
s S1
St
abilit
y
Rates
conc
entra
tion
Ra
tes co
mpar
ed to
adjus
ted
unde
rlying
reve
nue
[Rate
reve
nue /
Adju
sted u
nder
lying
rev
enue
] x10
0
77.1%
64
.1%
69.5%
69
.0%
70.5%
71
.3%
71.6%
71
.8%
This
ratio
mea
sure
s the
relia
nce o
n rat
es as
a pe
rcenta
ge of
unde
rlying
rev
enue
(mea
ning r
even
ue us
ed to
fun
d day
to da
y ope
ratio
ns). T
here
is
minim
al an
nual
move
ment
in thi
s rati
o as
mos
t of C
ounc
il's da
y to d
ay
reven
ue so
urce
s (rat
es, u
ser f
ees a
nd
oper
ating
gran
ts) ar
e anti
cipate
d to
increa
se in
line w
ith an
nual
CPI
increa
ses.
This
mean
s tha
t both
rates
an
d adju
sted u
nder
lying
reve
nue w
ill bo
th inc
rease
by ap
prox
imate
ly the
sa
me ra
te of
incre
ase.
Ra
tes ef
fort
S2
Ra
tes co
mpar
ed to
prop
erty
value
s [R
ate re
venu
e / C
apita
l impr
oved
va
lue of
ratea
ble pr
oper
ties i
n the
mu
nicipa
lity] x
100
0.53%
0.5
4%
0.53%
0.4
6%
0.41%
0.4
1%
0.40%
0.4
0%
This
ratio
comp
ares
the m
ovem
ent in
rat
e rev
enue
to th
e mov
emen
t in th
e va
lue of
ratep
ayer
prop
ertie
s. Th
e rati
o is
reduc
ing as
prop
erty
valua
tions
are
increa
sing a
t a hi
gher
perce
nt tha
n the
an
nual
perce
nt inc
rease
in ra
tes. T
he
increa
se in
rates
is ca
pped
by th
e St
ate G
over
nmen
t rate
cap w
hile
prop
erty
valua
tions
are i
ncrea
sing i
n lin
e with
the p
rope
rty m
arke
t.
58
Other informationFor the Year Ended 30 June 2019
11
Other information For the year ended 30 June 2019
Basis of preparation
Council is required to prepare and include a performance statement within its annual report. The performance statement includes the results of the prescribed sustainable capacity, service performance and financial performance indicators and measures together with a description of the municipal district and an explanation of material variations in the results. This statement has been prepared to meet the requirements of the Local Government Act 1989 and Local Government (Planning and Reporting) Regulations 2014.
Where applicable the results in the performance statement have been prepared on accounting bases consistent with those reported in the Financial Statements. The other results are based on information drawn from council information systems or from third parties (e.g. Australian Bureau of Statistics).
The performance statement presents the actual results for the current year and for the prescribed financial performance indicators and measures, the results forecast by the Councils strategic resource plan. The Local Government (Planning and Reporting) Regulations 2014 requires explanation of any material variations in the results contained in the performance statement.

59
Certification of the Performance Statement

60
Independent Auditor’s Report To the Councillors of Baw Baw Shire Council
Opinion I have audited the accompanying performance statement of Baw Baw Shire Council (the council) which comprises the:
description of municipality for the year ended 30 June 2019 sustainable capacity indicators for the year ended 30 June 2019 service performance indicators for the year ended 30 June 2019 financial performance indicators for the year ended 30 June 2019 other information for the year ended 30 June 2019 (basis of
preparation) certification of the performance statement.
In my opinion, the performance statement presents fairly, in all material respects, the performance of the council for the year ended 30 June 2019, in accordance with the performance reporting requirements of Part 6 of the Local Government Act 1989.
Basis for Opinion I have conducted my audit in accordance with the Audit Act 1994 which incorporates the Australian Standards on Assurance Engagements. I further describe my responsibilities under that Act and those standards in the Auditor’s Responsibilities for the Audit of the Performance Statement section of my report.
My independence is established by the Constitution Act 1975. My staff and I are independent of the council in accordance with the ethical requirements of the Accounting Professional and Ethical Standards Board’s APES 110 Code of Ethics for Professional Accountants (the Code) that are relevant to my audit of the performance statement in Victoria. My staff and I have also fulfilled our other ethical responsibilities in accordance with the Code.
I believe that the audit evidence I have obtained is sufficient and appropriate to provide a basis for my opinion.
Councillors' responsibilities for the performance statement
The Councillors of the council are responsible for the preparation and fair presentation of the performance statement in accordance with the performance reporting requirements of the Local Government Act 1989, and for such internal control as the Councillors determine is necessary to enable the preparation and fair presentation of the statement of performance that is free from material misstatement, whether due to fraud or error.
Auditor’s responsibilities for the audit of the performance statement
As required by the Audit Act 1994, my responsibility is to express an opinion on the performance statement based on the audit. My objectives for the audit are to obtain reasonable assurance about whether the performance statement as a whole is free from material misstatement, whether due to fraud or error, and to issue an auditor’s report that includes my opinion. Reasonable assurance is a high level of assurance, but is not a guarantee that an audit conducted in accordance with the Australian Standards on Assurance

61
2
Engagements will always detect a material misstatement when it exists. Misstatements can arise from fraud or error and are considered material if, individually or in the aggregate, they could reasonably be expected to influence the decisions of users taken on the basis of this performance statement.
As part of an audit in accordance with the Australian Standards on Assurance Engagements, I exercise professional judgement and maintain professional scepticism throughout the audit. I also:
identify and assess the risks of material misstatement of the performance statement, whether due to fraud or error, design and perform audit procedures responsive to those risks, and obtain audit evidence that is sufficient and appropriate to provide a basis for my opinion. The risk of not detecting a material misstatement resulting from fraud is higher than for one resulting from error, as fraud may involve collusion, forgery, intentional omissions, misrepresentations, or the override of internal control.
obtain an understanding of internal control relevant to the audit in order to design audit procedures that are appropriate in the circumstances, but not for the purpose of expressing an opinion on the effectiveness of the council’s internal control
evaluate the overall presentation, structure and content of the performance statement, including the disclosures, and whether the performance statement represents the underlying events and results in a manner that achieves fair presentation.
I communicate with the Councillors regarding, among other matters, the planned scope and timing of the audit and significant audit findings, including any significant deficiencies in internal control that I identify during my audit.
MELBOURNE 23 September 2019
Jonathan Kyvelidis as delegate for the Auditor-General of Victoria

62Blue Rock Dam