Embed Size (px)
Citation preview
Chapter 5
Batteries and Supercapacitors for Electric Vehicles
Monzer Al Sakka, Hamid Gualous, Noshin Omar andJoeri Van Mierlo
Additional information is available at the end of the chapter
http://dx.doi.org/10.5772/53490
1. Introduction
Due to increasing gas prices and environmental concerns, battery propelled electric vehicles(BEVs) and hybrid electric vehicles (HEVs) have recently drawn more attention. In BEV andHEV configurations, the rechargeable energy storage system (RESS) is a key design issue [1–3]. Thus, the system should be able to have good performances in terms of energy densityand power capabilities during acceleration and braking phases. However, the thermal stabil‐ity, charge capabilities, life cycle and cost can be considered also as essential assessment pa‐rameters for RESS systems.
Presently batteries are used as energy storage devices in most applications. These batteriesshould be sized to meet the energy and power requirements of the vehicle. Furthermore, thebattery should have good life cycle performances. However, in many BEV applications therequired power is the key factor for battery sizing, resulting in an over-dimensioned batterypack [4,5] and less optimal use of energy [4]. These shortcomings could be solved by combi‐nation of battery system with supercapacitors [6–8]. In [9], it is documented that such hy‐bridization topologies can result into enhancing the battery performances by increasing itslife cycle, rated capacity, reducing the energy losses and limiting the temperature rising in‐side the battery. Omar et al. concluded that these beneficial properties are due to the averag‐ing of the power provided by the battery system [4,6,9]. However, the implementation ofsupercapacitors requires a bidirectional DC–DC converter, which is still expensive. Further‐more, such topologies need a well-defined energy flow controller (EFC). Price, volume andlow rated voltage (2.5–3 V) hamper the combination of battery with supercapacitors [6,10].In order to overcome these difficulties, Cooper et al. introduced the Ultra-Battery, which is acombination of lead-acid and supercapacitor in the same cell [11]. The new system encom‐passes a part asymmetric and part conventional negative plate. The proposed system allows
© 2012 Sakka et al.; licensee InTech. This is an open access article distributed under the terms of the CreativeCommons Attribution License (http://creativecommons.org/licenses/by/3.0), which permits unrestricted use,distribution, and reproduction in any medium, provided the original work is properly cited.
to deliver and to absorb energy at very high current rates. The Ultra-Batteries have beentested successfully in the Honda Insight. However, this technology is still under develop‐ment. In the last decade, a number of new lithium-ion battery chemistries have been pro‐posed for vehicular applications. In [12–15], it is reported that the most relevant lithium-ionchemistries in vehicle applications are limited to lithium iron phosphate (LFP), lithium nick‐el manganese cobalt oxide (NMC), lithium nickel cobalt aluminum oxide (NCA), lithiummanganese spinel in the positive electrode and lithium titanate oxide (LTO) in the negativeelectrode. In this chapter, the performance and characteristics of various lithium-ion basedbatteries and supercapacitor will be evaluated and discussed. The evaluation will be mainlybased on the electrical behavior. Then the characteristics of these RESS systems will be in‐vestigated based on the electrical and thermal models.
2. Batteries
2.1. Electrical characterization
It is well known that the key consideration in the design of rechargeable energy storage sys‐tems in PHEV and BEV applications mainly depend on the power density (kW/kg) and en‐ergy density (Wh/kg) due to the design concept. However, the battery technology alsoshould be able to have good performances in the terms of energy efficiency, lifetime, andcharging rate [12-15]. In this section all these parameters have been analyzed for 10 lithium-ion battery types as presented in Table 1.
Table 1. Specifications investigated lithium-ion battery brands [12].
In [16] the main design concepts of PHEV applications are discussed, compared to the threesets of influential technical goals, and explained the trade-offs in PHEV battery design. Theymentioned that the energy and power requirements according to the U.S. Advanced BatteryConsortium (USABC) should be in the range of 82 Wh/kg and 830 W/kg for PHEV-10 and140 Wh/kg and 320 W/kg for PHEV-40. Pesaran specified these two battery types as highpower/energy ratio battery (PHEV-10) and low power/energy battery (PHEV-40). The firstcategory PHEV-10 is set for a “crossover utility vehicle” weighing 1950 kg and PHEV-40 isset for a midsize sedan weighing 1600kg [16]. In this study, only the battery performance
New Generation of Electric Vehicles136

characteristics for PHEV-40 (40 miles All Electric Range) is investigated based on theUSABC goals [16].
Figure 1 shows the results of the Dynamic Discharge Performance test (DDP) and the Ex‐tended Hybrid Pulse Power Characterization (HPPC) test [12,17-19]. As one can see, the en‐ergy density of nickel manganese cobalt oxide (LiNiCoMnO2) based battery types D&E is inthe range of 126 – 149Wh/kg while the cells using iron phosphate in the positive electrodeshow energy density being in the range of 75 – 118Wh/kg. In [20], is reported that the highenergy density values for the LiNiCoMnO2 batteries is mainly due to the higher nominalvoltage (e.g. 3.7V) and good electrode specific capacities. However, the situation regardingthe power density is not clear due the fact that power is varying over a wide range. Figure 1shows that only cell type D using LiNiCoMnO2 has the highest power density around2100Wh/kg. This result is mainly due to the good specific impedance [20].
The results indicate also that iron phosphate based battery types B and H have good powerperformances being in the range of 1580-1650 W/kg. However, based on the USABC goals,all the tested cells can meet the power requirements of 320W/kg with exception of battery F290W/kg. Although the battery type E has the best energy density, the power capabilities ofthis battery are limited in comparison to the batteries types B, D and H, which indicates thatthis battery is more appropriate for BEV applications as reported in [12]. The presented re‐sults in Figure 1 are based on the maximum discharge C-rate at 50% state of charge.
Figure 1. Power density versus energy density at room temperature [12].
Batteries and Supercapacitors for Electric Vehicleshttp://dx.doi.org/10.5772/53490
137
2.1.1. Energy efficiency
In PHEV applications, energy efficiency during charge and discharge phases can be consid‐ered as one of the key factors. High-energy efficiency is desired to limit the temperature riseinside a battery pack. In this section, the energy efficiency of the proposed battery types hasbeen considered based on the DDP test [19].
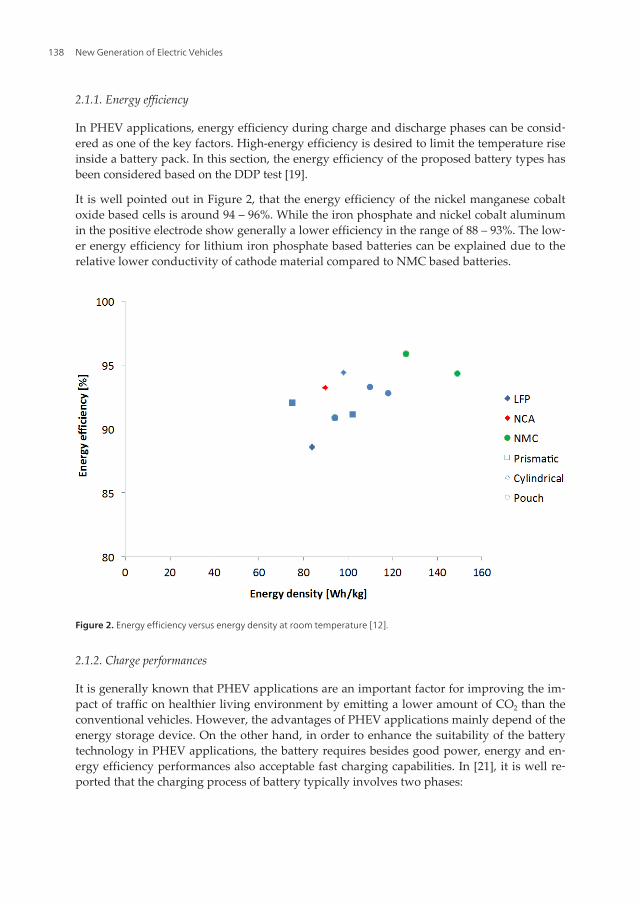
It is well pointed out in Figure 2, that the energy efficiency of the nickel manganese cobaltoxide based cells is around 94 – 96%. While the iron phosphate and nickel cobalt aluminumin the positive electrode show generally a lower efficiency in the range of 88 – 93%. The low‐er energy efficiency for lithium iron phosphate based batteries can be explained due to therelative lower conductivity of cathode material compared to NMC based batteries.
Figure 2. Energy efficiency versus energy density at room temperature [12].
2.1.2. Charge performances
It is generally known that PHEV applications are an important factor for improving the im‐pact of traffic on healthier living environment by emitting a lower amount of CO2 than theconventional vehicles. However, the advantages of PHEV applications mainly depend of theenergy storage device. On the other hand, in order to enhance the suitability of the batterytechnology in PHEV applications, the battery requires besides good power, energy and en‐ergy efficiency performances also acceptable fast charging capabilities. In [21], it is well re‐ported that the charging process of battery typically involves two phases:
New Generation of Electric Vehicles138

• The main charging phase, where the bulk of energy is recharged into the battery (constantcurrent),
• The final charge phase, where the battery is conditioned and balanced (constant voltage).
In this section, the fast charging performances of the different batteries until the main charg‐ing phase have been analyzed. In this study the main charging phase has been considered atdifferent charge current rates (0.33 It, 1 It, 2 It and 5 It). The reference test current It can beexpressed as according to the standard IEC 61434 [22]:
It A =Cn Ah
1h(1)
Figure 3 shows clearly that lithium-ion battery technology have high charge performan‐ces. For most lithium-ion batteries, the stored capacity up to Vmax is above 60% at 5 It. Dueto the higher charge current rates, the charge time can be reduced with a factor 10. Thedischarge time is less than 1 hour instead of 8 hours as mentioned in [15]. Here it shouldbe noted that battery cells with high energy density, which are designed for BEVs andPHEVs show high performances between 1 It and 2 It but indicate less performances athigher current rates (> 2 It) [12].
Figure 3. Evolution of stored capacity during main charging phase [12].
Batteries and Supercapacitors for Electric Vehicleshttp://dx.doi.org/10.5772/53490
139
2.2. Thermal characterization
According to the United States Advanced Battery Consortium, the battery system in HEVs,PHEVs and BEVs should operate over a wide operating temperate (from -40°C until 60°C)In order to illustrate the battery behavior at different working temperatures, the same dy‐namic discharge performance test as described above has been performed at -18°C, 0°C,25°C and 40°C as described in the standard ISO 12405-1/2 and IEC 62660-1 [23-25].
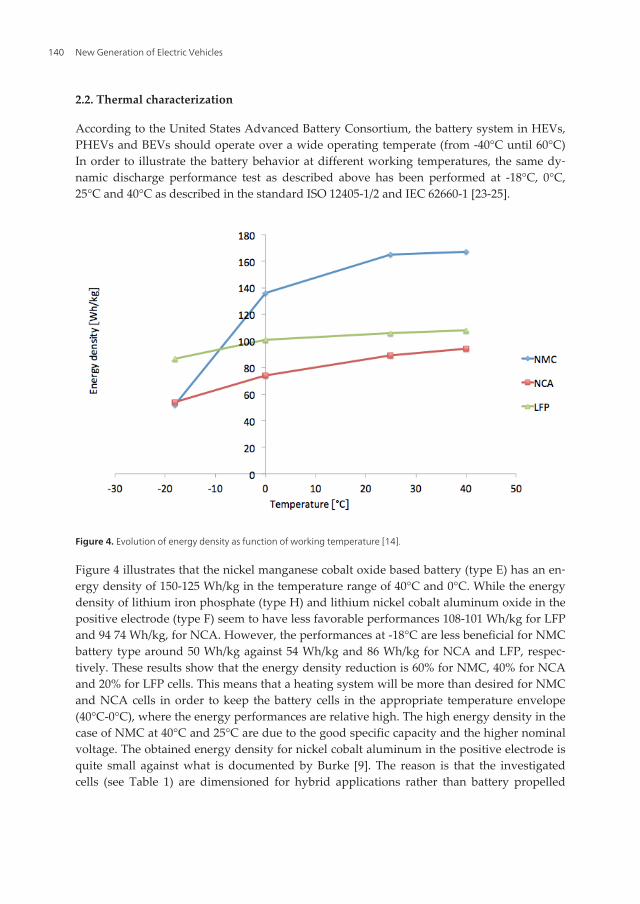
Figure 4. Evolution of energy density as function of working temperature [14].
Figure 4 illustrates that the nickel manganese cobalt oxide based battery (type E) has an en‐ergy density of 150-125 Wh/kg in the temperature range of 40°C and 0°C. While the energydensity of lithium iron phosphate (type H) and lithium nickel cobalt aluminum oxide in thepositive electrode (type F) seem to have less favorable performances 108-101 Wh/kg for LFPand 94 74 Wh/kg, for NCA. However, the performances at -18°C are less beneficial for NMCbattery type around 50 Wh/kg against 54 Wh/kg and 86 Wh/kg for NCA and LFP, respec‐tively. These results show that the energy density reduction is 60% for NMC, 40% for NCAand 20% for LFP cells. This means that a heating system will be more than desired for NMCand NCA cells in order to keep the battery cells in the appropriate temperature envelope(40°C-0°C), where the energy performances are relative high. The high energy density in thecase of NMC at 40°C and 25°C are due to the good specific capacity and the higher nominalvoltage. The obtained energy density for nickel cobalt aluminum in the positive electrode isquite small against what is documented by Burke [9]. The reason is that the investigatedcells (see Table 1) are dimensioned for hybrid applications rather than battery propelled
New Generation of Electric Vehicles140

electric vehicles. In [26] is reported that the limitation of the energy density at low tempera‐tures is mostly related to the considerable increasing of the internal resistance. However,Figure 5 indicates that the aspect does not apply for LFP based battery. The normalized in‐ternal resistance increases in the case of the latter mentioned cell chemistry is 650% com‐pared at the reference temperature (25°C). The internal resistance has been determined at100% SoC and the applied current was 0.1 It and 1 It.
Figure 5. Evolution of the internal resistance as function of the working temperature [14].
In order investigate the behavior of the proposed LFP and NMC based batteries in depth, anumber of capacity tests have been carried out at current rates 2 It, 5 It and 10 It at 0°C. Fig‐ure 6 and Figure 7 show the favorable performances of the LFP chemistry against the NMC.Especially at 0°C, the LFP battery demonstrates the excellent performances due to the self-heating mechanism that occur at high current rates. In Figure 6, we observe that the voltageat 10 It drops fast but remains above the minimal voltage: 2V. Then, the voltage recoverswhen the battery temperature considerable increases (43°C) due to the higher internal resist‐ance. The battery is able to attain almost the same discharge capacity as at lower current rateand high working temperature as it is illustrated in Figure 8. Here, we can notice that thePeukert number in the temperature range (0°C – 40°C) is close to one as is reported by Omaret al. [7]. However, at low temperatures (-18°C and forward) the Peukert number increases(1.85) due to the reducing of the discharge capacity, which is caused by the significantlyhigh internal resistance. It should be pointed out that in the region 0.33 It and 2 It, the Peu‐kert number is smaller than 1, which is in contradiction with the Peukert phenomena. Theexplanation of this behavior is due to the fact that the Peukert relationship has been extract‐ed particularly for lead acid batteries and for relative low current rates and in operatingtemperatures, which is close to the room temperature. However, for lithium-ion batteriesand mainly at low temperatures (-18°C), there are another complex phenomena that occurthat only cannot be explained by Peukert.
Batteries and Supercapacitors for Electric Vehicleshttp://dx.doi.org/10.5772/53490
141

Figure 6. Illustration of the voltage and temperature evolution of LFP based battery versus depth of discharge at dif‐ferent current rates at 0°C [14].
Figure 7. Illustration of the voltage and temperature evolution of NMC based battery versus depth of discharge atdifferent current rates at 0°C [14].
2.3. Electrical and thermal modeling
In development of an appropriate battery pack system, the battery management system canbe assumed as a key system [27]. The accuracy and the performances of this system dependon the developed balancing system and an accurate electrical and thermal battery model
New Generation of Electric Vehicles142

which can predict the battery cell behavior under all operational conditions. The electricalmodel is required for prediction of the battery behavior such as energy, power, internal re‐sistance, life cycle and energy efficiency. On the other hand the thermal model is needed topredict the surface temperature of the battery cell for operating of the cooling and heatingsystem when required. Further, the output of the thermal model will be used as an input forthe electrical model due to the dependency of the model parameters as a function of thetemperature. In this section the performances of the well-known first order FreedomCar bat‐tery model will be analyzed by using a dedicated test protocol and a new estimation techni‐que. Then, the analysis is extended with a novel developed thermal model that has beendeveloped at the Vrije Univeriteit Brussel for lithium-ion batteries.
Figure 8. Illustration of the Peukert as function of the operating temperature (LFP) [14].
2.3.1. Electrical model: FreedomCar battery model
As reported above, the BMS requires an accurate electrical battery model for prediction ofthe battery behavior during the short and long term. Therefore, in the literature, one canfind a number of electrical models such as Thévenin, FreedomCar, second order Freedom‐Car and RC battery model [28, 29]. The Thévenin battery model is a modified model of theFreedomCar battery model as it is presented in Figure 9. The Thévenin model is duringsteady state operations less accurate than the FreedomCar model due to the absent of thefictive capacitor 1/OCV’. The second order FreedomCar battery model has relatively higherperformances than the Thévenin battery model, but this model is also more complicated dueto the present of two RC-circuits in the system, which seems in the reality too heavy for BMSin PHEVs and BEVs where 100 battery cells are connected in series. Therefore, the process‐ing unit should be very powerful.
Batteries and Supercapacitors for Electric Vehicleshttp://dx.doi.org/10.5772/53490
143

In the framework of this section, only the characteristics of the first order FreedomCarbattery model will be addressed and compared with experimental results. As it presentedin Figure 9, the FreedomCar model exists mainly of an ohmic resistance (Ro), a fictive ca‐pacitor (1/OCV’) which represents the variation of the voltage over the time, an open cir‐cuit voltage OCV and a RC circuit existing of a polarization resistance Rp and capacitorC. The model assumes that the battery model parameters should be as function of state ofcharge and temperature. However, the researchers at the Vrije Universiteit Brussel foundthat the impact of the current rate and cycle life are also important parameters that can‐not be avoided [28]. Then, the researchers found also that the ohmic resistance should bedivided into two parts: the charge ohmic resistance and the discharge ohmic resistancedue to the battery hysteresis [28].
Figure 9. First order FreedomCar battery model [28].
2.3.2. Calibration and validation results
Prior starting with validation of the proposed battery model, the model has been calibratedby performing a new developed test profile at the Vrije Universitiet Brussel as it is presentedin Figure 10. As we can observe, there is a good agreement between the simulation and theexperimental results. According to these results, the error percentage is not higher than3.5%. This indicates the powerful performances of the proposed battery model with the de‐veloped estimation technique.
New Generation of Electric Vehicles144

Figure 10. Calibration of the first order FreedomCar battery model at room temperature [28].
2.3.3. Thermal model
Regarding the prediction the thermal behavior of a battery, this can be performed by usinghigh accurate thermal sensors or by dedicated thermal battery models. However, thermalmodels have many advantages against thermal sensors. The sensors can only measure onespecific point. As it is generally know the heat distribution over the surface temperature ofthe battery is not uniform. In order to have a good sight of the heat development inside thebattery, several thermal sensors are needed. This issue will complicate the BMS and theprocessing time of the BMS will be significantly longer. Therefore, it is more of high interestto issue thermal model which can predict the heat development and distribution over thebattery surface. Further, such models allow in advance the battery pack designer to investi‐gate the weakness in the battery pack and to dimension the cooling system more accurately.Finally, the development cost of such battery model is less than the cost of the significanthigher number thermal sensors that are needed. In this perspective, a novel thermal modelhas been developed at the Vrije Universiteit Brussel that can be used for lithium-ion batter‐ies and supercapacitors [30, 31]. In Figure 11 the thermal model is illustrated. As we can ob‐serve, the model exists of the following components [30, 31]:
• Pgen represents the heat generation (irreversible heat)
• Cth stands for the thermal capacitance,
• Rthi is the thermal resistance,
• Rcon represents the convection thermal resistance,
2.3.4. Calibration and validation results
In order to verify the developed thermal battery model, series of comparisons are madebased on simulation and experimental results. The first test is presented in Figure 12. As we
Batteries and Supercapacitors for Electric Vehicleshttp://dx.doi.org/10.5772/53490
145

observe, the model is in good agreement with experimental results. The errors percentagebased on this test is in the range of 1°C. In this test, the model has been compared with ex‐perimental results based on the load profile as proposed in Figure 13 until the surface tem‐perature has reached the steady stated condition.
Figure 11. Novel thermal batter model for lithium-ion batteries and electrical double-layer capacitors [30].
Figure 12. Comparison of simulated and measured at 25°C working temperature [30].
New Generation of Electric Vehicles146

Figure 13. Used load profile for extraction of the thermal model parameters [30].
However, there is a need for validation step to evaluate the performances and accuracy ofthe developed battery model at other conditions without to perform any calibration in themodel. In Figure 14 a validation test has been carried out at room temperature about 24°C.The corresponding simulation and experimental comparison are illustrated in Figure 15.Here again, we recognize that the high accuracy of the battery model against the experimen‐tal results. Based on these results, we can conclude that the developed battery model is ableto predict the surface temperature of the battery cell with significantly low errors.
Figure 14. Load profile for validation [30].
Batteries and Supercapacitors for Electric Vehicleshttp://dx.doi.org/10.5772/53490
147

Figure 15. Comparison of experimental and simulation results at room temperature (~24°C) [30].
3. Supercapacitors
Supercapacitors, also known as Electric Double-Layer Capacitors (EDLCs)or ultra capaci‐tors, have a high energy density when compared to conventional capacitors, typically thou‐sands of times greater than a high capacitance electrolytic capacitor. For example, a typicalelectrolytic capacitor will have a capacitance in the range of tens of milli-farads. The samesize supercapacitor would have a capacitance of several farads. Larger supercapacitors havecapacitance up to 5000 farads. The highest energy density in production is 30 Wh/kg. Al‐though supercapacitors have very high power density and capacitance values of thousandsof Farads are possible, the cell voltage is limited to about 2.7 V to avoid electrolysis of theelectrolyte with the consequent emission of gas and deterioration of the supercapacitor cell.The structure of a basic cell is mostly cylindrical. However, there are also now commercialpouch supercapacitors available. The technology achievement is identical to that used forconventional capacitors. The supercapacitors cells used in this study are the BCAP310F andBCAP1500F. Their properties are based on the double layer capacitance at the interface be‐tween a solid conductor and an electrolyte. The elementary structure consists of two activat‐ed carbon electrodes and a separator impregnated with an electrolyte. The electrodes aremade up of a metallic collector, coated on both side with an active material, which has ahigh surface area part which is required for the double layer. The two electrodes are separat‐ed by a membrane (separator), which prevents the electronic conduction by physical contactbetween the electrodes but allows the ionic conduction between them. This composite issubsequently rolled and placed into a cylindrical container. The system is impregnated withan organic electrolyte. The two electrodes are metalized and connected to the outside (+) and(-) terminal connections of the supercapacitor.
3.1. Electrical characterization
Equivalent series resistance and capacitance of supercapacitor calculation methods:
New Generation of Electric Vehicles148
3.1.1. Using an Electrochemical Impedance Spectroscopy (EIS)
Electrochemical impedance spectroscopy (EIS) is used in the characterization of electro‐chemical behavior of energy storage devices. Impedance analysis of linear circuits is mucheasier than analysis of non-linear ones. Electrochemical cells are not linear. Doubling thevoltage will not necessarily double the current. However, the electrochemical systems canbe pseudo-linear. In normal EIS practice, a small (1 to 10 mV) AC signal is applied to thecell. With such a small potential signal, the system is pseudo-linear.
The supercapacitor is polarized with a dc voltage. A small voltage ripple, typically 10mV, issuperimposed on the dc component. The ripple frequency is swept between 1 mHz and 1kHz. The measurement of the current amplitude and phase with respect to the injected volt‐age permits the determination of the real and imaginary components of the impedance as afunction of the frequency. The measurements were performed in a controlled climatic cham‐ber. The supercapacitor capacitance C and the series resistance (ESR) are deduced from theexperimental results, respectively.
12 Im( )
Cz fp
-=
× × (2)
( )ReESR z= (3)
Where:
• Im(z) is the imaginary component of the supercapacitor impedance,
• Re(z) is the real component of the supercapacitor impedance,
• F is the frequency.
The Maxwell BCAP310F and BCAP1500F supercapacitors used in this study are based on ac‐tivated carbon technology and organic electrolyte. These devices were characterized usingthe Electrochemical Impedance Spectroscopy (EIS) [32].
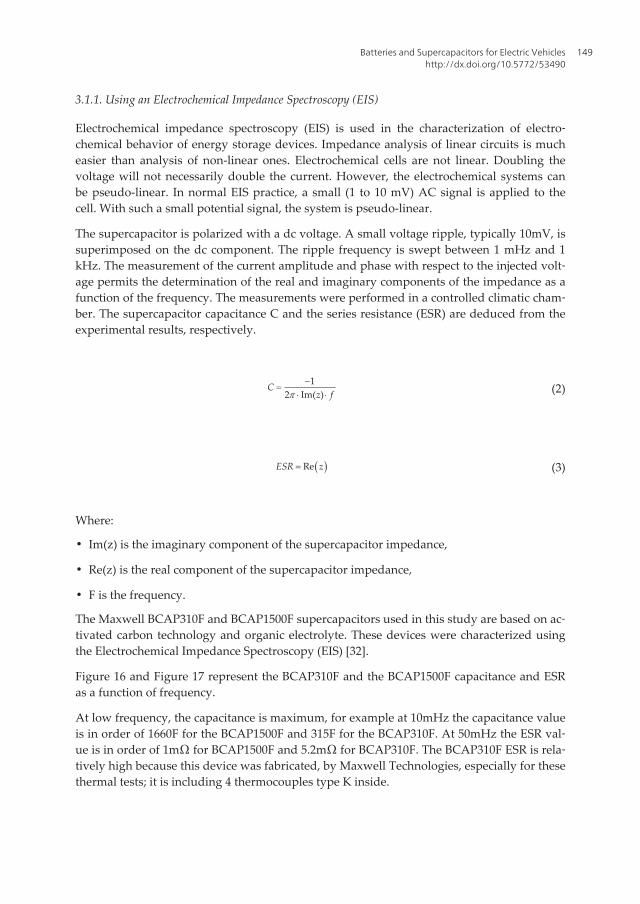
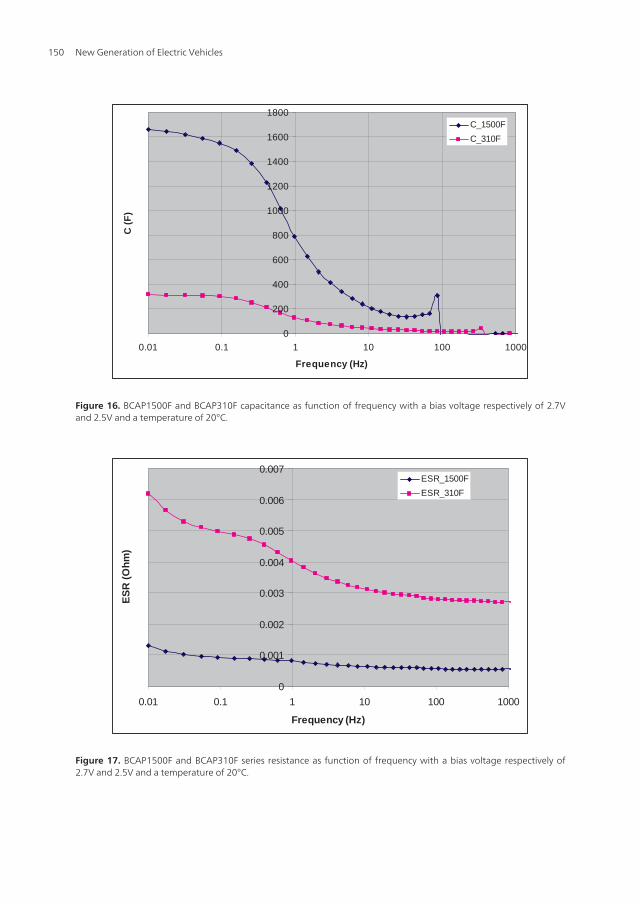
Figure 16 and Figure 17 represent the BCAP310F and the BCAP1500F capacitance and ESRas a function of frequency.
At low frequency, the capacitance is maximum, for example at 10mHz the capacitance valueis in order of 1660F for the BCAP1500F and 315F for the BCAP310F. At 50mHz the ESR val‐ue is in order of 1mΩ for BCAP1500F and 5.2mΩ for BCAP310F. The BCAP310F ESR is rela‐tively high because this device was fabricated, by Maxwell Technologies, especially for thesethermal tests; it is including 4 thermocouples type K inside.
Batteries and Supercapacitors for Electric Vehicleshttp://dx.doi.org/10.5772/53490
149
0
200
400
600
800
1000
1200
1400
1600
1800
0.01 0.1 1 10 100 1000
Frequency (Hz)
C (
F)
C_1500F
C_310F
Figure 16. BCAP1500F and BCAP310F capacitance as function of frequency with a bias voltage respectively of 2.7Vand 2.5V and a temperature of 20°C.
0
0.001
0.002
0.003
0.004
0.005
0.006
0.007
0.01 0.1 1 10 100 1000
Frequency (Hz)
ES
R (
Oh
m)
ESR_1500F
ESR_310F
Figure 17. BCAP1500F and BCAP310F series resistance as function of frequency with a bias voltage respectively of2.7V and 2.5V and a temperature of 20°C.
New Generation of Electric Vehicles150

3.1.2. Based on the IEC 62576 standard
The standard IEC (International Electro-technical Commission) 62576 [33,34] defines the cal‐culation methods of the equivalent series resistance and the capacitance of electric double-layers capacitors.
Figure 18 presents the calculation method of the equivalent series resistance. The supercapa‐citor is charged at constant current to its nominal voltage, this voltage should be maintainedat this value during 30 min. Then, the supercapacitor is discharged at constant current up to0V. The value of the constant current depends on the applications. The IEC 62576 suggeststo choose 10xC, 4xCxUr, 40*C*Ur and 400xCxUr mA for the supercapacitors applied asmemory backup (class 1), energy storage (class 2), power unit (class 3) and instantaneouspower unit (class 4), respectively [33,34]. Where, C is the capacitance and Ur represents therated voltage.
T im e (s )
Vol
tage
(V
)
V n
1800 s
3V
Figure 18. Charge and discharge of the supercapacitor at constant current
The ESR value is calculated based on the following expression:
3VESRI
= (4)
Where ΔV3 is the voltage drop obtained from the intersection of the auxiliary line extendedfrom the straight part and the time base when the discharge starts, and I is the constant dis‐charging current.
Figure 19 presents the calculation method of the capacitance.
Batteries and Supercapacitors for Electric Vehicleshttp://dx.doi.org/10.5772/53490
151
T im e (s )
Vol
tage
(V
)
V m ax
V 1
V 2
t1 t2
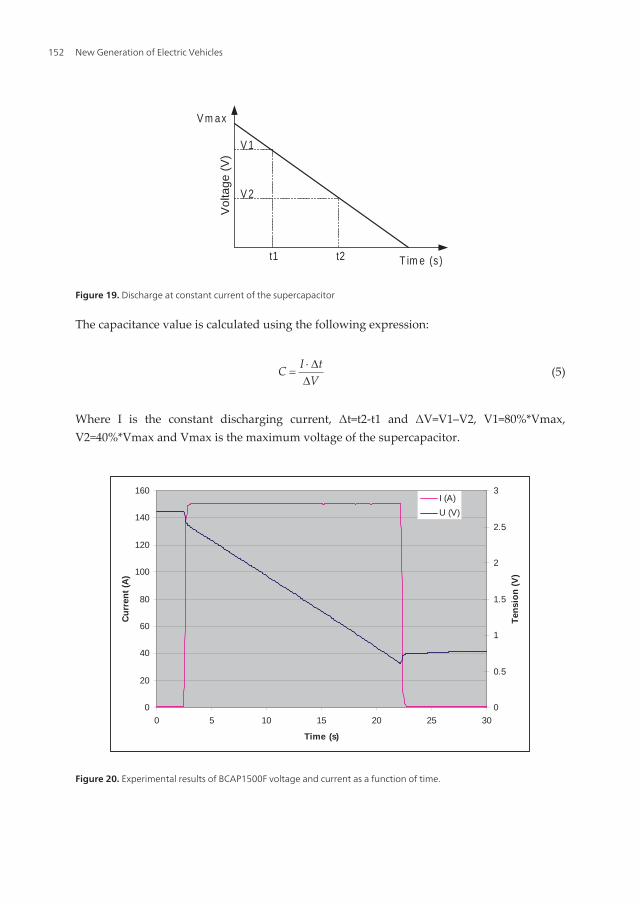
Figure 19. Discharge at constant current of the supercapacitor
The capacitance value is calculated using the following expression:
I tCV×
=
(5)
Where I is the constant discharging current, Δt=t2-t1 and ΔV=V1–V2, V1=80%*Vmax,V2=40%*Vmax and Vmax is the maximum voltage of the supercapacitor.
0
20
40
60
80
100
120
140
160
0 5 10 15 20 25 30
Time (s)
Cu
rren
t (A
)
0
0.5
1
1.5
2
2.5
3
Ten
sio
n (
V)
I (A)
U (V)
Figure 20. Experimental results of BCAP1500F voltage and current as a function of time.
New Generation of Electric Vehicles152

The BCAP1500F capacitance and ESR were calculated according to the IEC 62576 standard.The supercapacitor is discharged at constant current 100mA/F. Figure 20 represents theBCAP1500F voltage and current versus time during the discharge. ESR and C are 1.07mΩand 1525F, respectively.
3.2. Thermal characterization
Heat production in supercapacitor is related exclusively to Joule losses. The supercapacitorssupport currents up to 400A or more depending on cell capacitance and used technology.The repetitive charge and discharge cycles of the supercapacitor cause a significant warmingeven though the equivalent series resistance value is around the mΩ according to the capaci‐tance. Several authors showed that the supercapacitor ESR varies according to the tempera‐ture [35-37]. In [38] the authors have studied the effect of the temperature and the voltage onthe supercapacitors ageing. They have established a model which allows analyzing self-ac‐celerating degradation effects caused by elevated voltages and temperatures, this model is aholistic simulation model that combines electrical and thermal simulation of supercapacitormodules with an ageing model.
In the reference [39] the authors have studied and modeled the temperature effect on the su‐percapacitor self discharge.
This rise in temperature can have the following consequences:
• The deterioration of the supercapacitor characteristics, especially ESR, self discharge andlifetime [39,40], which affect its reliability and its electrical performance.
• The pressure inside the supercapacitor is increased.
• A premature aging of metal contacts, in fact the repetitive heating and significant temper‐atures can deteriorate rapidly the terminal connections of the supercapacitor.
• The evaporation of the electrolyte and hence the destruction of the supercapacitor if thetemperature exceeds 81.6°C which is the boiling point of the electrolyte.
Therefore, it is important to know and understand the heat behavior of supercapacitor cellsand modules. This leads to an estimation of the space-time evolution of the temperature.
This study deals with the thermal modeling and heat management of supercapacitor mod‐ules for vehicular applications. The thermal model developed is based on thermal-electricanalogy and allows the determination of supercapacitor temperature. Relying on this model,heat management in supercapacitor modules was studied for vehicle applications. Thus, themodules were submitted to real life driving cycles and the evolution of temperatures of su‐percapacitors was estimated according to electrical demands. The simulation results showthat the hotspot is located in the middle of supercapacitors module and that a forced airflowcooling system is necessary.
For supercapacitor thermal behavior, the device was characterized by using the EIS for dif‐ferent temperature. Figure 21 presents the Maxwell BCAP0310F ESR variations according tothe temperature. The ESR increases at negative temperature values. The ESR variation ishigher for negative temperature than for positive one. This is due to the fact that the electro‐
Batteries and Supercapacitors for Electric Vehicleshttp://dx.doi.org/10.5772/53490
153
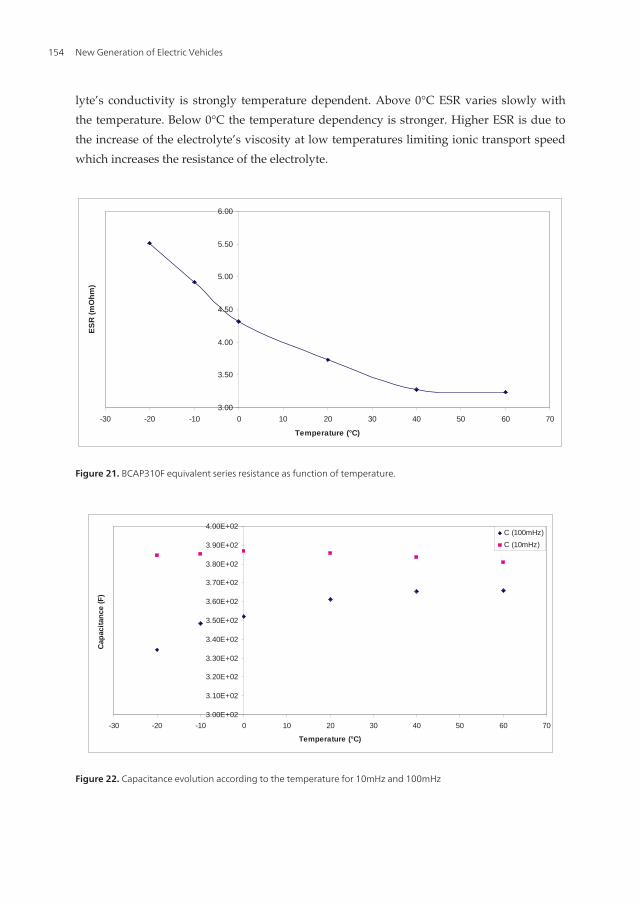
lyte’s conductivity is strongly temperature dependent. Above 0°C ESR varies slowly withthe temperature. Below 0°C the temperature dependency is stronger. Higher ESR is due tothe increase of the electrolyte’s viscosity at low temperatures limiting ionic transport speedwhich increases the resistance of the electrolyte.
3.00
3.50
4.00
4.50
5.00
5.50
6.00
-30 -20 -10 0 10 20 30 40 50 60 70
Temperature (°C)
ES
R (
mO
hm
)
Figure 21. BCAP310F equivalent series resistance as function of temperature.
3.00E+02
3.10E+02
3.20E+02
3.30E+02
3.40E+02
3.50E+02
3.60E+02
3.70E+02
3.80E+02
3.90E+02
4.00E+02
-30 -20 -10 0 10 20 30 40 50 60 70
Temperature (°C)
Cap
acit
ance
(F
)
C (100mHz)
C (10mHz)
Figure 22. Capacitance evolution according to the temperature for 10mHz and 100mHz
New Generation of Electric Vehicles154

In the case of the capacitance, the experimental results show that the capacitance is lower atnegative temperature as shown in Figure 22. For example, at f=10mHz there is no variationof the capacitance with temperature. At 100mHz, C=335F at -20°C whereas C= 361F at 20°C.At negative temperature, the supercapacitor capacitance decreases with temperature.
In conclusion, it is clear that the supercapacitor electric performances and lifetime dependon the temperature.
3.3. Electrical modeling
In literature, several supercapacitors have been developed for different purposes [47-51]. In[47], a model has been proposed by Faranda et al (see Figure 23). The model exists of threebranches. The first branch containing R0 represents the fast response of the supercapacitorin term of few seconds. The second branch contains a resistance and a large capacitor. Thenthe second branch demonstrates the long-term behavior in term of few minutes. However,the analysis that has been carried out by Chalmers University showed that the error be‐tween the simulated and experimental results for such model is in the range of 10%, whichis statistically high.
Figure 23. Three branches model [47]
In [48] a second order model has been proposed to demonstrate the supercapacitors behavior.The proposed model is strong similar to the second order Thévenin battery model. The modelhas significantly higher accuracy (error between the simulated and experimental results <5%)than the previous supercapacitor model due to the non-linear behavior of the model.
Batteries and Supercapacitors for Electric Vehicleshttp://dx.doi.org/10.5772/53490
155
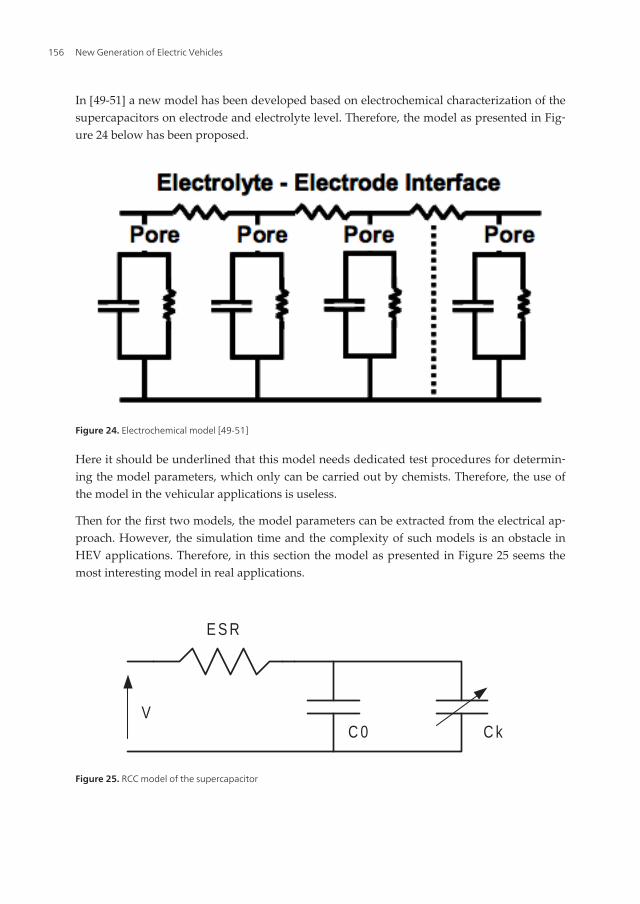
In [49-51] a new model has been developed based on electrochemical characterization of thesupercapacitors on electrode and electrolyte level. Therefore, the model as presented in Fig‐ure 24 below has been proposed.
Figure 24. Electrochemical model [49-51]
Here it should be underlined that this model needs dedicated test procedures for determin‐ing the model parameters, which only can be carried out by chemists. Therefore, the use ofthe model in the vehicular applications is useless.
Then for the first two models, the model parameters can be extracted from the electrical ap‐proach. However, the simulation time and the complexity of such models is an obstacle inHEV applications. Therefore, in this section the model as presented in Figure 25 seems themost interesting model in real applications.
E S R
C 0 C kV
Figure 25. RCC model of the supercapacitor
New Generation of Electric Vehicles156
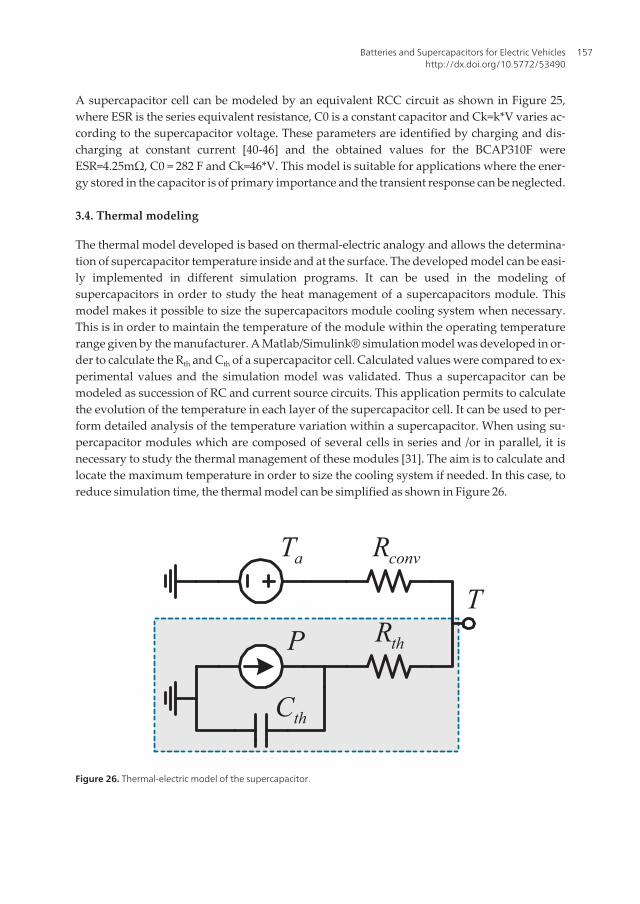
A supercapacitor cell can be modeled by an equivalent RCC circuit as shown in Figure 25,where ESR is the series equivalent resistance, C0 is a constant capacitor and Ck=k*V varies ac‐cording to the supercapacitor voltage. These parameters are identified by charging and dis‐charging at constant current [40-46] and the obtained values for the BCAP310F wereESR=4.25mΩ, C0 = 282 F and Ck=46*V. This model is suitable for applications where the ener‐gy stored in the capacitor is of primary importance and the transient response can be neglected.
3.4. Thermal modeling
The thermal model developed is based on thermal-electric analogy and allows the determina‐tion of supercapacitor temperature inside and at the surface. The developed model can be easi‐ly implemented in different simulation programs. It can be used in the modeling ofsupercapacitors in order to study the heat management of a supercapacitors module. Thismodel makes it possible to size the supercapacitors module cooling system when necessary.This is in order to maintain the temperature of the module within the operating temperaturerange given by the manufacturer. A Matlab/Simulink® simulation model was developed in or‐der to calculate the Rth and Cth of a supercapacitor cell. Calculated values were compared to ex‐perimental values and the simulation model was validated. Thus a supercapacitor can bemodeled as succession of RC and current source circuits. This application permits to calculatethe evolution of the temperature in each layer of the supercapacitor cell. It can be used to per‐form detailed analysis of the temperature variation within a supercapacitor. When using su‐percapacitor modules which are composed of several cells in series and /or in parallel, it isnecessary to study the thermal management of these modules [31]. The aim is to calculate andlocate the maximum temperature in order to size the cooling system if needed. In this case, toreduce simulation time, the thermal model can be simplified as shown in Figure 26.
thC
thR
aT convR
TP
Figure 26. Thermal-electric model of the supercapacitor.
Batteries and Supercapacitors for Electric Vehicleshttp://dx.doi.org/10.5772/53490
157
The thermal model gives the evaluation of the temperature on the external surface of the su‐percapacitor depending on the electrical power, the ambient temperature and the convectiveheat transfer coefficient. The total power dissipated in the supercapacitor is given by:
( ) ( )2P t ESR I t= ´ (6)
Where:
• ESR : the equivalent series resistance of the supercapacitor,
• I(t) : the RMS current value passing through the supercapacitor.
The resistance Rconv represents the heat transfer between the surface of the supercapacitorand the ambient air. Its value depends on the convective heat transfer coefficient h and theheat exchange surface of the supercapacitor Ssc.
This coefficient can be calculated by using the following expression:
1conv
scR
h S=
×(7)
7500 7600 7700 7800 7900 8000 8100 8200 8300 8400 8500-75
0
75
Cu
rren
t/A
7500 7600 7700 7800 7900 8000 8100 8200 8300 8400 85001
1.5
2
2.5
3
t/s
Po
ten
tial d
iffer
ence
/V
Potential difference
Current
Figure 27. Current and voltage of the 1500F supercapacitor.
New Generation of Electric Vehicles158
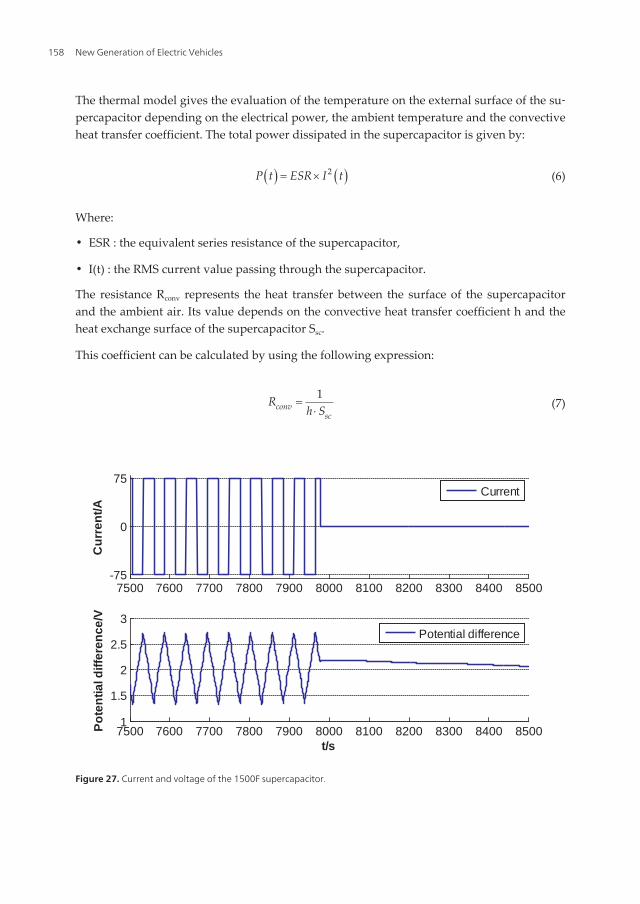
In order to validate this model, the parameters were calculated for a 1500F supercapacitor cell.This supercapacitor cell was experimentally tested; it was charged and discharged at 75A witha thermocouple type K placed on the outer surface. Figure 27 shows a zoom of the supercapaci‐tor current and voltage during the receptive cycle which was applied to the 1500F supercapaci‐tor. It shows the warming phase in which the supercapacitor is charged and discharged at 75Aconstant current then the phase of no cycling where the current is zero.
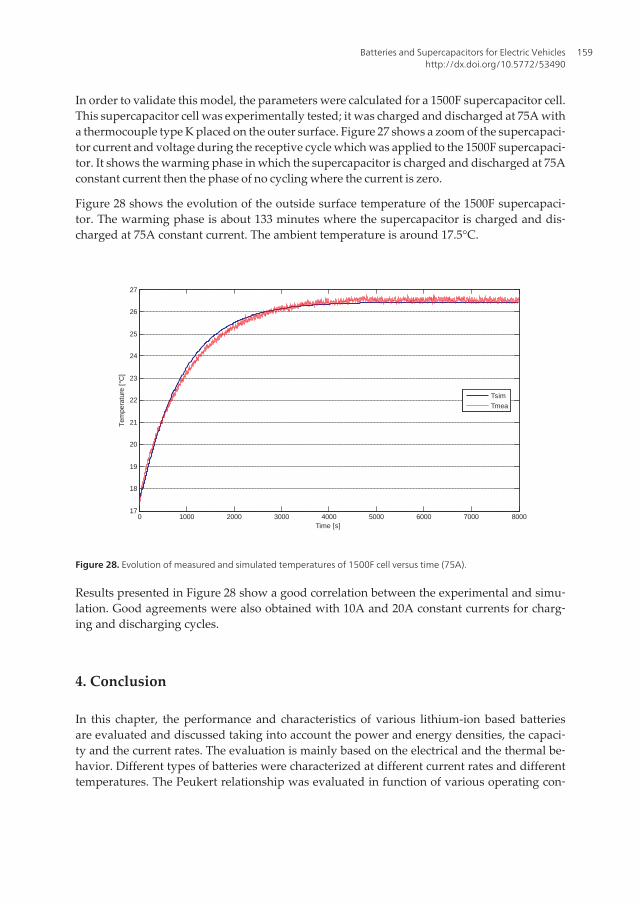
Figure 28 shows the evolution of the outside surface temperature of the 1500F supercapaci‐tor. The warming phase is about 133 minutes where the supercapacitor is charged and dis‐charged at 75A constant current. The ambient temperature is around 17.5°C.
0 1000 2000 3000 4000 5000 6000 7000 800017
18
19
20
21
22
23
24
25
26
27
Time [s]
Tem
pera
ture
[°C
]
Tsim
Tmea
Figure 28. Evolution of measured and simulated temperatures of 1500F cell versus time (75A).
Results presented in Figure 28 show a good correlation between the experimental and simu‐lation. Good agreements were also obtained with 10A and 20A constant currents for charg‐ing and discharging cycles.
4. Conclusion
In this chapter, the performance and characteristics of various lithium-ion based batteriesare evaluated and discussed taking into account the power and energy densities, the capaci‐ty and the current rates. The evaluation is mainly based on the electrical and the thermal be‐havior. Different types of batteries were characterized at different current rates and differenttemperatures. The Peukert relationship was evaluated in function of various operating con‐
Batteries and Supercapacitors for Electric Vehicleshttp://dx.doi.org/10.5772/53490
159

ditions. Electrical and thermal models are developed and presented. The battery electricalmodel is based on the first order FreedomCar model. The parameters of the electrical modelwere obtained and calibrated based on a new developed test profile. A battery thermal mod‐el is proposed, discussed and validated. Electrical and thermal characterizations of superca‐pacitors were studied. The different basic calculation methods based on the EIS and the IEC62576 of the Equivalent Series Resistance (ESR) and the capacitance of a supercapacitor arepresented. An electrical model of the supercapacitor based on RCC circuit is presented. Athermal model of the supercapacitor is presented and it is based on the thermal-electric anal‐ogy. The model was validated using experimental results of the BCAP1500F supercapacitorcell. The simulation results of the thermal model can be used to find out if a cooling/heatingsystem is necessary for the use of supercapacitor in order to improve its efficiency. The mod‐els developed are simple enough to be implemented in different simulation programs andthermal management systems for hybrid electric vehicles.
Author details
Monzer Al Sakka1, Hamid Gualous2, Noshin Omar1 and Joeri Van Mierlo1
1 Vrije Universiteit Brussel, Belgium
2 Université de Caen Basse-Normandie, France
References
[1] G. Maggetto, J. Van Mierlo, Annales de Chimie – Science des matériaux, in: Thermat‐ic Issue on “Material for Fuel Cell Systems”, vol. 26, 2000, p. 9.
[2] J. Van Mierlo, G. Maggetto, Ph. Lataire, Energy Convers. Manage. 47 (2006) 196.
[3] P. Van den Bossche, F. Vergels, J. Van Mierlo, J. Matheys, W. Van Autenboer, J. Pow‐er Sources 26 (2005) 1277.
[4] N. Omar, F. Van Mulders, J. Van Mierlo, P. Van den Bossche, J. Asian Electric Vehi‐cles 7 (2009) 1277.
[5] H. Abderrahmane, B. Emmanuel, Assessment of real behavior of VHE Energy Stor‐age System in heavy vehicles, in: Proceeding of EET-2008 European Ele- Drive Con‐ference, Geneva, March, 2008.
[6] N. Omar, B. Verbrugge, P. Van den Bossche, J. Van Mierlo, Electrochim. Acta 25(2010) 7534.
[7] J. Cheng, J. VanMierlo, P. Van den Bossche, Ph. Lataire, Super capacitor based energystorage as peak power unit in the applications of hybrid electric vehicles, in: Proceed‐ing of PEMD 2006, Ireland, 2006.
New Generation of Electric Vehicles160
[8] C.R. Akli, X. Roboam, B. Sareni, A. Jeunesse, Energy management and sizing of a hy‐brid locomotive, in: Proceeding of EPE 2007, Denmark, 2007.
[9] Sh. Lu, K.A. Corzine, M. Ferdowsi, IEEE Trans. Veh. Technol. 56 (2007) 1516.
[10] N. Omar, M. Al Sakka, M. Daowd, Th. Coosemans, J. Van Mierlo, P. Van den Bos‐sche, Assessment of behavior of active EDLC-battery system in heavy hybrid chargedepleting vehicles, in: Proceeding of 4th European Symposium on Super Capacitorsand Applications, Bordeaux, October, 2010.
[11] A. Cooper, M. Kellaway, Advanced lead-acid – the new battery system for hybridelectric vehicles, in: Proceeding of EET-2008 European Ele-Drive Conference, Gene‐va, March, 2008.
[12] N. Omar, M. Daowd, B. Verbrugge, G. Mulder, P. Van den Bossche, J. Van Mierlo, M.Dhaens, S. Pauwels, F. Leemans, Assessment of performance characteristics of lithi‐um-ion batteries for PHEV vehicles applications based on a newly test methodology,in: Proceeding of the 25th World Battery, Hybrid and Fuel Cell Electric Vehicle Sym‐posium, Shenzhen, November, 2010.
[13] N. Omar, B. Verbrugge, G. Mulder, P. Van den Bossche, J. Van Mierlo, M. Daowd, M.Dhaens, S. Pauwels, Evaluation of performance characteristics of various lithium-ionbatteries for use in BEV application, in: Proceeding of IEEE Vehicle Power and Pro‐pulsion Conference, Lille, September, 2010.
[14] N. Omar, M. Daowd, G. Mulder, J.M. Timmermans, J. Van Mierlo, S. Pauwels, As‐sessment of performance of lithium ion phosphate oxide, nickel manganese cobaltoxide and nickel cobalt aluminum oxide based cells for using in plug-in battery elec‐tric vehicle applications, in: Proceeding of IEEE Vehicle Power and Propulsion Con‐ference, Chicago, September, 2011.
[15] A. Burke, M. Miller, Performance characteristics of lithium-ion batteries of variouschemistries for plug-in hybrid vehicles, in: Proceeding of the 24th World Battery, Hy‐brid and Fuel Cell Electric Vehicle Symposium, Stavanger, May, 2009.
[16] J. Axsen, Burke, K. Kurani, Batteries for Plug-in Hybrid Electric Vehicles (PHEVs):Goals and State of the Technology, May, 2008.
[17] N. Omar, M. Daowd, O. Hegazy, G. Mulder, J.M. Timmermans, Th. Coosemans, P.Van Den Bossche, J. Van Mierlo, Standardization work for BEV and HEV Applica‐tions: Critical Appraisal of Recent Traction Battery Documents. J. Energies 2012, 5,138-156
[18] G. Mulder, N. Omar, S. Pauwels, F. Leemans, B. Verbrugge, W. De Nijs, P. Van denBossche, D. Six, J. Van Mierlo, J, Enhanced test methods to characterise automotivebattery cells. J. Power Sources 2011, 196, 100079 – 10087.
[19] IEC 61982-2, Secondary batteries for the propulsion of electric road vehicles - Part 2:Dynamic discharge performance test and dynamic endurance test, August 2002.
Batteries and Supercapacitors for Electric Vehicleshttp://dx.doi.org/10.5772/53490
161

[20] A. Amine, C.H. Chen, J. Liu, J. Hammond, A. Jansen, D. Dees, I. Bloom, D. Vissers, G.Hendriksen, Factors responsible for impedance rise in high power lithium ion batter‐ies, Vol. 97, No: 8, 2001, Jul., pp: 684-687.
[21] P. Van den Bossche, B. Verbrugge, N. Omar, J. Van Mierlo, The Electric VehicleCharged by the Grid: Voltages and Power Levels, PHEV-09, September, 2009.
[22] IEC 61434, Secondary cells and batteries containing alkaline or other non-acid elec‐trolytes - Guide to designation of current in alkaline secondary cell and batterystandards, 1996.
[23] IEC 62660-1 Ed. 1: Secondary batteries for the propulsion of electric road vehicles –Part 1: Performance testing for lithium-ion cells, May, 2010.
[24] ISO 12405-1 Electrically propelled road vehicles – Test specification for lithium-iontraction battery packs and systems – Part 1: High- power applications. IEC, 2011.
[25] ISO 12405-2 Electrically propelled road vehicles – Test specification for lithium-iontraction battery packs and systems – Part 1: High- energy applications. IEC, 2011.
[26] K. Sawai, R. Yamato, T. Ohzuku, Impedance measurements on lithium-ion batteryconsisting of Li(Li1/3Ti5/3)O4 and LiCo1/2Ni1/2O2, Journal of Electrochemistry, No.51, PP: 1651-1655.
[27] M. Daowd, N. Omar, P. Van den Bossche, J. Van Mierlo, A Review of Passive andActive Battery Balancing based on MATLAB/Simulink, INTERNATIONAL REVIEWOF ELECTRICAL ENGINEERING-IREE, Vol. 6, pp: 2974–2989, 2011
[28] M. Daowd, N. Omar, P. Van den Bossche, J. Van Mierlo, Extended PNGV BatteryModel for Electric and Hybrid Vehicles, INTERNATIONAL REVIEW OF ELECTRI‐CAL ENGINEERINGIREE, Vol. 6, pp: 1264–1278, 2010
[29] V.H. Johnson, A. Pesaran, Th. Sack, Temperature-dependent battery models for high-power lithium-ion batteries. Proceedings EVS-17, October 2000, Montréal, Canada.
[30] N. Omar, M. Al Sakka, M. Daowd, O. Hegazy, Th. Coosemans, P. Van den Bossche, J.Van Mierlo, Development of a Thermal Model for Lithium–Ion Batteries for Plug-InHybrid Electric Vehicles, Proceedings EVS 26, 2012, Los Angeles, USA
[31] M. Al Sakka, Gualous H., Van Mierlo J., and Culcu H. Thermal modeling and heatmanagement of supercapacitor modules for vehicle applications. Journal of PowerSources, 194:581–587, 2009.
[32] Monzer Al Sakka: Supercapacitors and DC/DC Converters for Fuel Cell Electric Ve‐hicle, PhD at Vrije Universiteit Bruseel, Brussels, September 2010, ISBN: 978 90 5487802 5.
[33] IEC 62576, Electric Double-Layer Capacitors for Use in Hybrid Electric Vehicles -Test Methods for Electrical Characteristics, IEC, 2008.
New Generation of Electric Vehicles162

[34] Yonghua Cheng, “Assessement of Energy Capacity and Energy Losses of supercapa‐citors in Fast Charging-Discgarging Cycles”, Energy Conversion, IEEE Transactions,Volume : 25, Issue. 1, pp. 253 – 261, 2010.
[35] R. Kötz, M. Hahn, R. Gallay, “Temperature behaviour and impedance fundamentalsof supercapacitors”, Journal of Power Sources, 154 (2006) pp. 550–555, 2006.
[36] H. Gualous, D. Bouquain, A. Berthon, J. M. Kauffmann “Experimental study of su‐percapacitor serial resistance and capacitance variations with temperature” Journalof Power Sources, Vol. 123, pp.86-93, 2003.
[37] F. Rafik, H. Gualous, R. Gallay, A. Crausaz, A. Berthon “Frequency, thermal andvoltage supercapacitor characterization and modelling”, Journal of Power Sources,Vol. 165, pp. 928-934, 2007.
[38] Oliver Bohlen, Julia Kowal, Dirk Uwe Sauer “Ageing behaviour of electrochemicaldouble layer capacitors: Part II. Lifetime simulation model for dynamic applications”Journal of Power Sources, Volume 173, Issue 1, Pages 626-632, 2007.
[39] Y. Diab; P. Venet, H. Gualous, G. Rojat, “Self-Discharge Characterization and Model‐ing of Electrochemical Capacitor Used for Power Electronics Applications” IEEETransactions On Power Electronics. Vol. 24, Issue 2, pp. 510-517, 2009.
[40] F. Rafik, H. Gualous, R. Gallay, A. Crausaz, A. Berthon, “Supercapacitors characteri‐zation for hybrid vehicle applications”, Proc. IEEE 5th Power Electronics and MotionControl Conference, Shanghai, China, pp. 1-5, 2006.
[41] A. Hammar, R. Lallemand, P. Venet, G. Coquery, G. Rojat, J. Chabas, “Electrical char‐acterization and modelling of round spiral supercapacitors for high power applica‐tions”, Proc. 2nd European Symp. on Super Capacitors & Applications, Lausanne,Switzerland, 2006.
[42] L. Zubieta, R. Bonert, “Characterization of double-layer capacitors for power elec‐tronics applications”, Proc. IEEE 33rd Industrial Applications Society annual meet‐ing, St. Louis, MO, USA, pp. 1149 – 1154, 1998
[43] L. Zubieta, R. Bonert, “Characterization of double-layer capacitors for power elec‐tronics applications”, IEEE Transactions on Industry Applications Vol. 36 Issue 1, pp.199-205, 2000.
[44] John M. Miller, Uday Deshpande, Marius Rosu, “CarbonCarbon UltracapacitorEquivalent Circuit Model, Parameter Extraction, and Application”, Maxwell Tech‐nologies, Inc Ansoft Corp. San Diego, CA Pittsburg, PA, Ansoft First Pass Workshop,Southfield, 2007.
[45] Bavo Verbrugge, Frederik Van Mulders, Hasan Culcu, Peter Van Den Bossche, JoeriVan Mierlo, “Modelling the RESS: Describing Electrical Parameters of Batteries andElectric Double-Layer Capacitors through Measurements”, World Electric VehicleJournal, Vol. 3, 2009.
Batteries and Supercapacitors for Electric Vehicleshttp://dx.doi.org/10.5772/53490
163

[46] Joeri Van Mierlo, Gaston Maggetto, Peter Van Den Bossche Impact, “Models of Ener‐gy Sources for EV and HEV: Fuel cells, Batteries, Ultra-Capacitors, Flywheels and En‐gine-generators”, Journal of Power Sources, Vol. 28, N° 128, pp: 76 - 89, 2004.
[47] Faranda, R.; Gallina, M.; Son, D.T.; A new simplified model of Double-Layer Capaci‐tors 2007; ICCEP '07. International Conference on Clean Electrical Power 21-23 May2007 Page(s):706 – 710; ISBN: 1- 4244-0632-3
[48] Data sheet for supercapacitor from EPCOS with Part No.: B48621-S0203-Q288
[49] Qu, D. Y. and H. Shi (1998). "Studies of activated carbons used in double-layer capac‐itors." Journal of Power Sources 74(1): 99-107.
[50] Shi, H. (1996). "Activated carbons and double layer capacitance." Electrochimica Acta41(10): 1633-1639.
[51] Vix-Guterl, C., E. Frackowiak, et al. (2005). "Electrochemical energy storage in or‐dered porous carbon materials." Carbon 43(6): 1293-1302.
New Generation of Electric Vehicles164