Embed Size (px)
Citation preview

Brady Weldon Decagon Devices, Inc.
Basics of Water Activity

Objectives
Define Water Activity and Moisture Content
Compare and Contrast Water Activity and Moisture Content
Water Activity and Moisture Content Measurements Methods

Water activity vs. Moisture
content Moisture Content
Quantitative amount of water in a sample on a wet or dry basis.
An extensive property that depends on the amount of material.
Water Activity
A measure of the energy status of the water in a system (Qualitative).
A intensive property that does not depend on the amount of material.

Water Activity Defined
aw = f/fo = p/po
aw = ——————————————————
aw = ERH (%) /100
Vapor pressure of water above sample @ °C
Vapor pressure of pure water @ same °C
Correct Definition: Water Activity is a measure of the energy
status of the water in a system.
Old Definition: Water activity is the amount of “free” or
“available” water in a product as opposed to “bound” water.

Moisture Content Defined
Quantitative measure of amount of water
Empirical measurement with no standard
Loss on Drying – Fick’s Equation
Titration

Cheese & Cracker System
Initial Final
Moisture Content 4% 20% Water Activity 0.30 0.75
Initial Final
Moisture Content 60% 30% Water Activity 0.90 0.75
Cracker Cheese
Cracker and Cheese is equilibrated over saturated NaCl in separate sealed containers

Cheese & Cracker System
Cracker and Cheese are placed together in a sealed container
Which way does water move? Sodium Chloride .753
20% Moisture 30% Moisture

Moisture Analysis Comparison Water Activity Moisture Content
Measures Energy of Water Amount of “Water”
Standard Available Yes, salt standards No, empirical
measurement
Cost $1000-$10,000 $250-$25,000
Reporting
Methods aw units Dry or wet basis %
Methods 4 methods 35 methods
Sample
Preparation Little to none Depends on method

Water Activity vs. Moisture
Content

Chilled Mirror Dew Point Advantages
Primary method of measuring vapor pressure (not calibrated)
Highest accuracy ±0.003aw
Rapid measurement <5 minutes
Measures entire aw range (0.03 – 1.0aw)
High reliability
Disadvantages Need clean mirror
Readings affected by alcohol and propylene glycol
Infrared Sensor Mirror
Optical Sensor Fan
Sample

Accurate Measurements Calibration / Verification Standards
Saturated Salt Slurries
Unsaturated Salt Solutions
Temperature
Sample Preparation Need representative sample
If slicing / grinding – be consistent
Prevent moisture exchange with environment

Instruments from Decagon

Decagon Devices, Inc. Brady Weldon
International Product Manager www.aqualab.com
Decagon Devices, Inc.
Thank You!

Complete Moisture Analysis
Presented by:
Wendy Ortman
Application Engineer
Decagon Devices

Applications for Water Activity
and Moisture Content
Water Activity Can Help You:
Control microbial growth
Control chemical reaction rates
Conduct shelf life testing
Predict effects of temperature abuse
Formulate profitable products
Achieve optimal texture
Control moisture migration
Model dry ingredient mixing
Avoid caking and clumping
Predict packaging needs
Characterize products
Moisture Content Can Help You: Adjust texture at a given water
activity Control chemical reactivity and
rates
Determine ingredient concentrations
Determine nutritional content

Microbial Growth Growth Limit
Every microorganism has a water activity level below which it cannot grow.
aw limit Microorganisms
0.91 Gram Negative Bacteria
0.86 Gram Positive Bacteria
0.88 Yeast (practical limit)
0.80 Production of mycotoxins
0.70 Molds (practical limit)
0.62 Osmophilic yeast
0.61 Xerophilic molds
0.60 Absolute limit for all growth
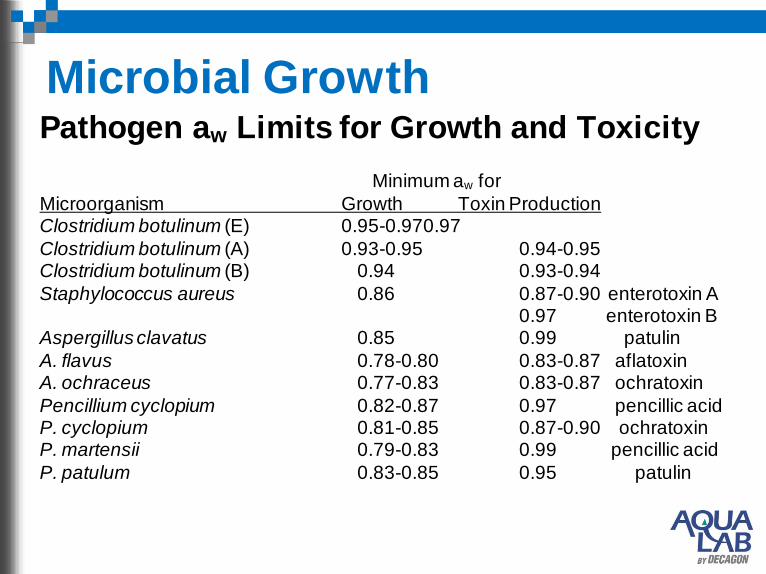
Microbial Growth Pathogen aw Limits for Growth and Toxicity
Minimum aw for
Microorganism Growth Toxin Production Clostridium botulinum (E) 0.95-0.970.97
Clostridium botulinum (A) 0.93-0.95 0.94-0.95 Clostridium botulinum (B) 0.94 0.93-0.94
Staphylococcus aureus 0.86 0.87-0.90 enterotoxin A 0.97 enterotoxin B Aspergillus clavatus 0.85 0.99 patulin
A. flavus 0.78-0.80 0.83-0.87 aflatoxin A. ochraceus 0.77-0.83 0.83-0.87 ochratoxin
Pencillium cyclopium 0.82-0.87 0.97 pencillic acid P. cyclopium 0.81-0.85 0.87-0.90 ochratoxin P. martensii 0.79-0.83 0.99 pencillic acid
P. patulum 0.83-0.85 0.95 patulin

Microbial Growth Survival of Bacteria at Reduced Water Activity Bacteria can survive for long periods of time in foods at low water activity.
Examples: Salmonella in Chocolate at
aw = 0.30
Salmonella in Peanut Butter at
aw = 0.50
Salmonella and S. aureus in
powder milk at aw = 0.26
Low water activity is not a kill step, but the microorganisms will not proliferate.

Government Compliance
Water activity is a critical parameter for compliance with:
FDA’s Good Manufacturing Practices
(21CFR)
HACCP – critical control
point
ANSI/NSF Standard 75 for
shelf stable baked goods
USP Method <1112>

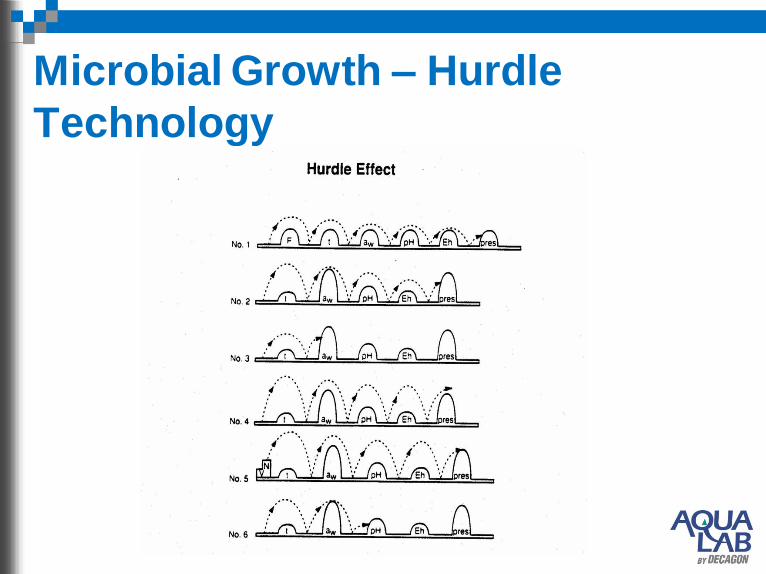
Hurdle technology deliberately combines existing and new preservation techniques to establish a series of preservative factors (hurdles) that the microorganisms in question are unable to overcome (jump over). These hurdles may be:
temperature
water activity
acidity
redox potential
preservatives
others
Leistner, L., (1994) Further developments in the utilization of hurdle technology for food preservation., Journal of Food Engineering, 22:421-432.
Microbial Growth – Hurdle Technology
Microbial Growth – Hurdle
Technology

Chemical/Biochemical Stability
Water activity effect on reaction rate
Most reaction rates increase with
increasing water activity
Most rates correlate better with aw than
moisture content
Water may act as a:
solvent
reactant
change the mobility of reactants (viscosity)

General Effect of Water Activity on Reaction
Rates
Chemical/Biochemical Stability
Water Activity
Re
actio
n R
ate
0.0 0.2 0.4 0.6 0.8 1.0 0.0
0.2
0.4
0.6
0.8
1.0
1.2
1.4
mo
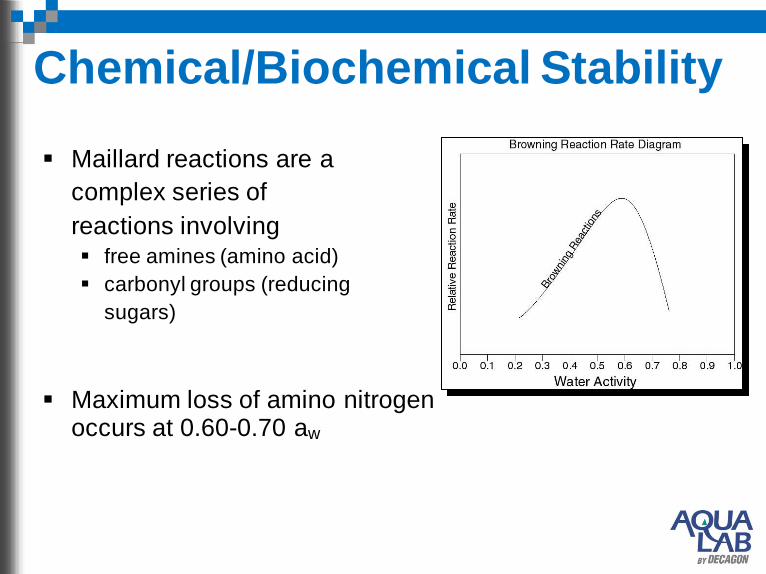
Chemical/Biochemical Stability
Maillard reactions are a
complex series of
reactions involving free amines (amino acid)
carbonyl groups (reducing
sugars)
Maximum loss of amino nitrogen occurs at 0.60-0.70 aw

Chemical/Biochemical Stability Lipid Oxidation
A minimum reaction rate at a water activity of about ~0.3 aw
Rate increase from
0-0.3aw Less available metal ions
due to hydration spheres
Reduced oxygen diffusion
Free radical quenching
Rate increase from
0.3-0.8aw
Increased dissolution of catalysts
Increased mobility of oxygen and metal ions

Nutrient Degradation
Vitamin Stability
Ascorbic acid (vitamin C)
Riboflavin
Thiamin
Aspartame
Chemical/Biochemical Stability

General Effect of Water Activity on Enzymatic
Activity
Chemical/Biochemical Stability

Determining Shelf Life
The presence of water influences the shelf life.
Water solubilizes reactants and increases their mobility, both of which can lead to faster deterioration.
Define unacceptable product conditions: microbial growth, chemical status (loss of nutrient), physical properties, sensory

Controlling Water Activity
Dehydrate Product
Edible films and coatings
Keep water from migrating between the different components in a composite samples.
They are located on the surface or as thin layers between several parts within the product.
Additives
Ingredients involved in water binding
Humectants:
salt – (NaCl)
sugars – (glucose, fructose, sucrose, syrups)
glycols – (glycerol, PEG, propylene glycol)
amino acids – (glycine, alanine)
polymers – (starch, gums)
acids – (citric acid, lactic acid)
Anticaking agents

Process Control of Water
Activity
aw measurement confirms shelf life, quality,
and safety testing data on-line
aw is a more effective production specification
Control belt speed, oven temperature
Archive information for inspections, customer
complaints

The water activity concept should be
incorporated from the beginning.
If start with aw concept then new products
will be safe, have a maximized shelf life,
and of the highest quality.
Water activity data can be used to predict
potential hazards for new products.
Product Formulation

Product Formulation Raw ingredient inspection Many companies are requiring their
suppliers to meet water activity specifications on the ingredients.
Specifying water activity levels to ingredient suppliers insures consistent product.
When product aw changes, problems can be traced to either processing or ingredients

Product Formulation Snack Cake
All 3 components have
same water activity
3 components have
very different moisture
contents
Each component has a
unique texture
Icing serves as a
moisture barrier for the
cake
0
5
10
15
20
25
30
35
40
45
50
0 0.1 0.2 0.3 0.4 0.5 0.6 0.7 0.8 0.9 1
Water Activity
Mo
istu
re C
on
ten
t (%
d.b
.)
Icing
Creme Filling
Cake

Physical Properties
Texture, Hardness, Compaction
Dissolution
Coating Integrity
Moisture migration
Caking and Clumping of powders
Physical Properties

Texture
Hard or crisp products low water activity
break when physically stressed
are crisp and crunchy
soften when exposed to aw
Soft products intermediate to high aw
bend when stressed
are moist, juicy, tender, and chewy.
harden when exposed to aw

Moisture Migration
Two distinct regions at different aw
Water moves from areas of high water activity to areas of low
water activity.
Driving force for water
migration directly
related to aw difference.
Rate of migration depends on structure/diffusion properties.
Can lead to Excipient/Drug interactions and increased degradation of API
Causes coatings to crack or become sticky

Moisture Migration Moisture migration can lead to:
texture changes
microbial growth
degradation reactions
Examples of Multi-domain systems cheese / cracker
cereal with fruit pieces
baked dough – filling
frozen pizza crust – sauce
ice cream in cone
gelatin capsules

Caking is water activity, time and temperature
dependent process.
Free flowing powder is transformed into
lumps and eventually an agglomerated solid.
Problem is ubiquitous in the food and
pharmaceutical industries.
Powder Flow and Caking

Solutions: To maintain the flow properties and prevent caking of powders
Establish a Critical Water Activity
Treatment of the powders below critical water activity
packaging in high moisture barrier packages
storage at low temperatures
in package desiccation
addition of anticaking agents
Powder Flow and Caking

Uses for Complete Moisture
R&D QC Storage Ingredients Semi-
Moist Dry RTE
Control Microbial Growth Formulate profitable products Control chemical reaction rates Predict effects of temperature abuse Control moisture migration Achieve optimal texture Avoid caking and clumping Predict packaging needs Determine ingredient concentrations

Complete moisture analysis is a relatively simple but powerful way to control product safety and quality.
Water Activity and moisture content can easily be measured with instrumentation
Complete moisture analysis relates to: Microbial Growth
Chemical / Biochemical Stability
Shelf Life
Product Formulation
Physical Properties
Conclusion

Fundamentals of Moisture Sorption Isotherms

Water activity vs. Moisture content
Moisture Content Quantitative amount of water in a sample on a wet or
dry basis.
An extensive property that depends on the amount of material.
Water Activity A measure of the energy status of the water in a
system (Qualitative).
A intensive property that does not depend on the amount of material.

Moisture Sorption Isotherms The relationship between water activity and equilibrium moisture content of a
sample at a specified temperature is called the moisture sorption isotherm.

Moisture Sorption Isotherm
Each product has its
own unique moisture
sorption isotherm – due
to different interactions
(colligative, capillary,
and surface effects)
between the water and
the solid components at
different moisture
contents. 0
5
10
15
20
25
30
35
40
45
50
0 0.1 0.2 0.3 0.4 0.5 0.6 0.7 0.8 0.9 1
Water Activity
Mo
istu
re C
on
ten
t (%
d.b
.)
Icing Creme Filling Cake
Wood Pulp Granola Bar Milk Powder

Full Isotherm
0
5
10
15
20
25
0 0.2 0.4 0.6 0.8 1
Water Activity
Mo
istu
re C
on
ten
t (%
d.b
.)
*Data is for Starch
Adsorption
Desorption

Working Isotherm
0
5
10
15
20
25
0 0.2 0.4 0.6 0.8 1 1.2
Water Activity
Mo
istu
re C
on
ten
t (%
d.b
.)Working Desorb Working Adsorb Full
*Data is for Starch

Which Isotherm?
Full Isotherm
Product
Characterization
Transition Points
Hysteresis
Moisture Content
Prediction
Working Isotherm
Sorption from native
state
Scanning Curves
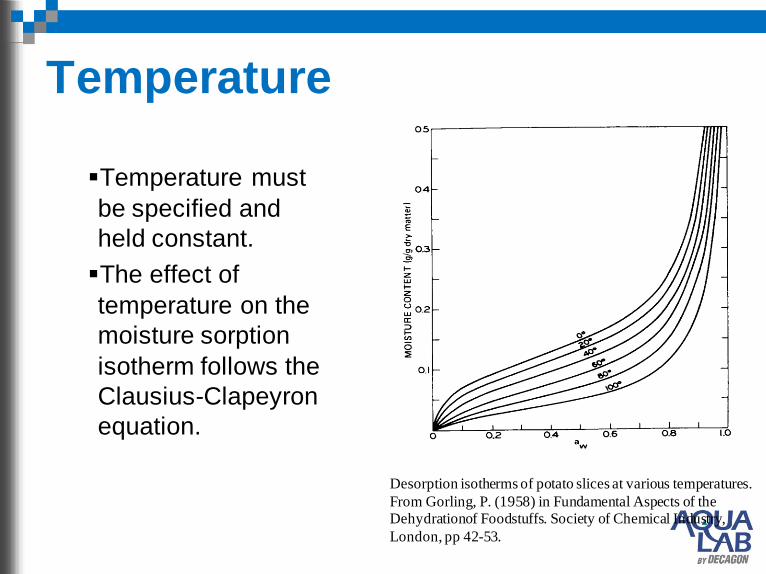
Temperature
Temperature must
be specified and
held constant.
The effect of
temperature on the
moisture sorption
isotherm follows the
Clausius-Clapeyron
equation.
Desorption isotherms of potato slices at various temperatures.
From Gorling, P. (1958) in Fundamental Aspects of the Dehydrationof Foodstuffs. Society of Chemical Industry,
London, pp 42-53.

Method 1: Desiccator Isotherm
Method
Determine equilibrium moisture contents
at several water activities.
Place product (dried or hydrated) into
controlled humidity chambers at constant
temperature
Need six to nine different aw levels (5 min)
Temperature control
Measure the weight gain or loss with time
until equilibrium.
One to three weeks for equilibrium

Desiccator Isotherm Method
Very slow
Very laborious
Lots of Space
Few data points
Usually only working
isotherm

Interpolation with Model
0
2
4
6
8
10
12
14
0 0.2 0.4 0.6 0.8 1
Water Activity
Mo
istu
re C
on
ten
t (%
d.b
.)Traditional Desiccator GAB Model Fit

Isotherm Models
BET isotherm (Brunauer, Emmet and Teller) (0-0.5aw)
GAB equation (Guggenheim, Anderson, de Boer) (0-0.85aw)
m = moisture in g/g solid at water activity aw
mo = monolayer moisture content
C, C1 and k = constants
Cm
1Ca
Cm
1
ma-1
a
o
w
ow
w
w1ww
wo1
kaCka1ka-1
akmCm

Isotherm Models
DLP (Double Log Polynomial) (0-0.95aw)
m = b3x3 + b2x
2 + b1x + b0
x = ln(-ln(aw)) (Chi Value)

Isotherm Model Comparison
6
8
10
12
14
16
18
0 0.2 0.4 0.6 0.8 1
Water Activity
Mo
istu
re C
on
ten
t (%
d.b
.)
Actual Data DLP Model GAB Model

Method 2: Dynamic Vapor
Sorption (DVS) Cycling of water activity is
automatic
Gravimetrically determines when weight change has slowed to an acceptable level
Faster than traditional methods
Facilitates evaluation of sorption kinetics
Still relies on equilibration to set water activity levels
DVS Change In Mass (ref) Plot
-0.5
0
0.5
1
1.5
2
2.5
3
3.5
4
250 350 450 550 650 750 850
Time/mins
Ch
an
ge
In
Ma
ss
(%
) -
Re
f
0
10
20
30
40
50
60
70
80
90
100
Ta
rge
t R
H (
%)
dm - dry Target RH
© Surface Measurement Systems Ltd UK 1996-2007DVS - The Sorption Solution
Temp: 25.0 °C
Meth: polymer film.sao
MRef: 2.28063

57
Highlights of Static Isotherms
+ Decrease equilibration time, no mold growth
+ Sample not exposure to room Temp and %RH conditions
+ Can select any %RH between 0 and ~95 to 98%
+ Decreased manual labor
+ Can be used to investigate kinetics of water sorption
- Still time consuming (usual only one sample can be run at a time)
- Limited data resolution
- Difficult to capture real-time sorption events, such as Tg and
hydrate formation and loss

Method 3: Dynamic Dewpoint
Isotherm (DDI) Method
Wet air for adsorption, dry air for desorption
Water activity directly measured
Equilibration to known water activity not necessary
Fast with unequalled data resolution
Provides a more real world sorption picture
Does not provide kinetics of sorption
Infrared Sensor Mirror
Optical Sensor
Fan
Sample
Dry Air Wet Air
Precision Balance

Highlights of Dynamic Isotherms
+ Equilibration to known water activity not necessary,
making them very fast. + Incredibly high data resolution
+ Can be used to investigate sorption changes due to matrix transitions
+ Provides a more real world sorption picture, but does not provide kinetics of sorption
− Can result in non-equilibrium conditions and larger
hysteresis
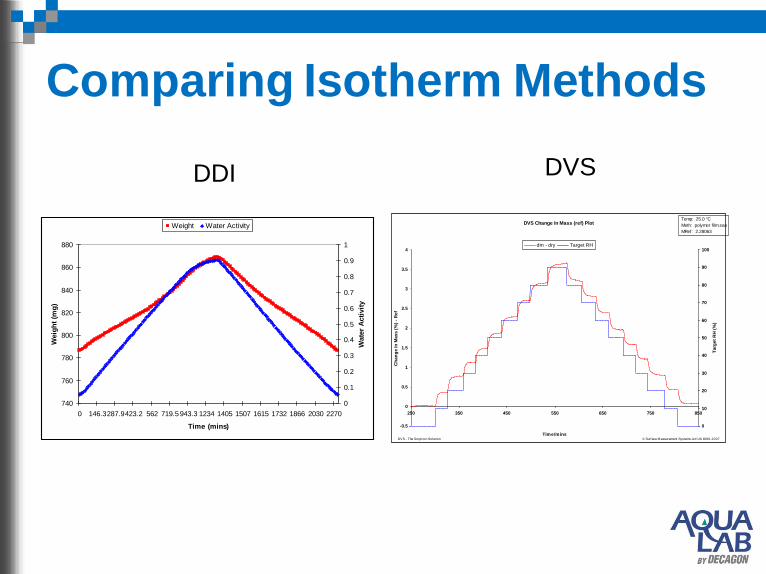
Comparing Isotherm Methods
740
760
780
800
820
840
860
880
0 146.3287.9423.2 562 719.5943.3 1234 1405 1507 1615 1732 1866 2030 2270
Time (mins)
Weig
ht
(mg
)
0
0.1
0.2
0.3
0.4
0.5
0.6
0.7
0.8
0.9
1
Wate
r A
cti
vit
y
Weight Water ActivityDVS Change In Mass (ref) Plot
-0.5
0
0.5
1
1.5
2
2.5
3
3.5
4
250 350 450 550 650 750 850
Time/mins
Ch
an
ge In
Mass (
%)
- R
ef
0
10
20
30
40
50
60
70
80
90
100
Targ
et
RH
(%
)
dm - dry Target RH
© Surface M easurement Systems Ltd UK 1996-2007DVS - The Sorpt ion Solut ion
Temp: 25.0 °C
Meth: polymer f ilm.sao
MRef: 2.28063
DDI DVS

Comparing Isotherm Methods
0
5
10
15
20
25
0.00 0.10 0.20 0.30 0.40 0.50 0.60 0.70 0.80 0.90 1.00
Water Activity
Mo
istu
re C
on
ten
t (%
d.b
.)
DVS Dessicator DVS2 PEC DDI Method

Milk Powder Adsorption Isotherm
0
2
4
6
8
1012
14
16
18
20
0 0.2 0.4 0.6 0.8 1
Water Activity
Mo
istu
re C
on
ten
t (%
d.b
.)
Traditional Desiccator GAB Model Fit DDI Method

AquaLab Vapor Sorption Analyzer Dynamic and Static in One Instrument Dynamic and static methods
can be analyzed on 1 sample
Dynamic isotherms for matrix transitions
Static isotherms for kinetic research
Run a sample initially with Dynamic isotherm to determine regions of interest
Investigate the time dependency in the regions of interest using a Static isotherm

VSA is a Stand Alone
Instrument
External computer only needed for downloading data
No external gas is needed (but optional)
No special power needed.
Only requires desiccant tubes and a full
water chamber

VSA Can be Controlled by a
Computer
USB connection to a computer
VSA Downloader software
Downloads data from instrument
Allows viewing in table or chart format
Allows viewing of multiple isotherm tests
Can also be used to setup new tests (interface
easier than on the instrument)
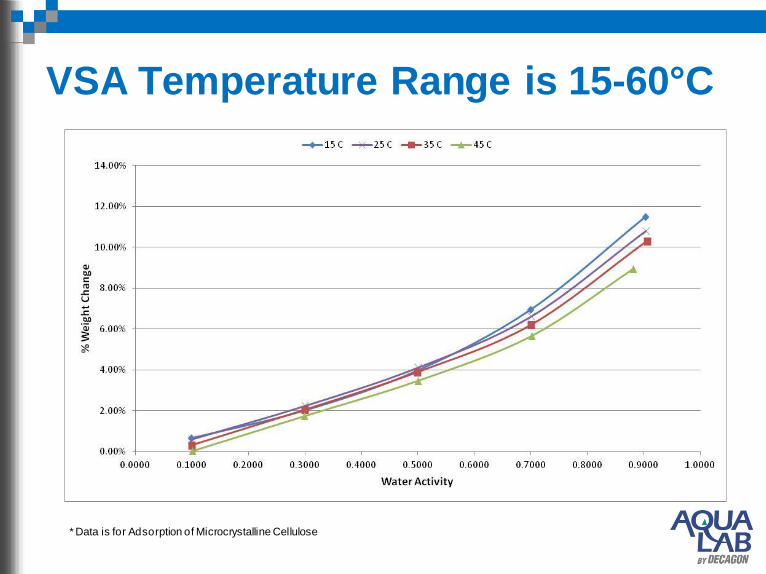
VSA Temperature Range is 15-60°C
* Data is for Adsorption of Microcrystalline Cellulose

VSA is Easy to Maintain
Instrument performance verified with water activity and weight standards
Chamber is easily accessible for cleaning
Unique actuator system eliminates
balance drift
Diagnostics screen provides information about current instrument performance

VSA is Also a Water Activity
Instrument
Uses same chilled mirror technology as the AquaLab water activity meters.
Accuracy of +/- 0.005

VSA Can Generate DDI
Isotherms Dynamic Dewpoint
Isotherm Controls neither the water
content nor the water activity
Water activity is determined using a standard chilled-mirror dewpoint sensor
Weight tracked by magnetic force balance
Isotherm data in approx. 24 hrs
Infrared Sensor Mirror
Optical Sensor
Fan
Sample
Dry Air Wet Air
Precision Balance

VSA Can Generate Equilibrium
Isotherms Cycling of water activity is
automatic
Gravimetrically determines when weight change has slowed to an acceptable level
Faster than traditional methods
Facilitates evaluation of sorption kinetics
Still relies on equilibration to set water activity levels
DVS Change In Mass (ref) Plot
-0.5
0
0.5
1
1.5
2
2.5
3
3.5
4
250 350 450 550 650 750 850
Time/mins
Ch
an
ge
In
Ma
ss
(%
) -
Re
f
0
10
20
30
40
50
60
70
80
90
100
Ta
rge
t R
H (
%)
dm - dry Target RH
© Surface Measurement Systems Ltd UK 1996-2007DVS - The Sorption Solution
Temp: 25.0 °C
Meth: polymer film.sao
MRef: 2.28063
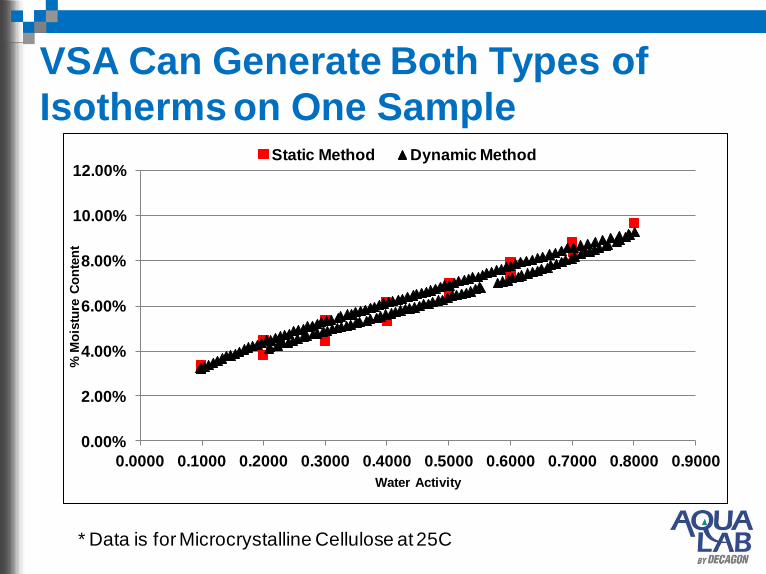
VSA Can Generate Both Types of
Isotherms on One Sample
* Data is for Microcrystalline Cellulose at 25C
0.00%
2.00%
4.00%
6.00%
8.00%
10.00%
12.00%
0.0000 0.1000 0.2000 0.3000 0.4000 0.5000 0.6000 0.7000 0.8000 0.9000
% M
ois
ture
Co
nte
nt
Water Activity
Static Method Dynamic Method

Why have both Dynamic and
Equilibrium Isotherms?

Dynamic Isotherm Only
0
5
10
15
20
0 0.5 1
Mo
istu
re C
on
ten
t (%
d
.b.)
Water Activity
DDI Method
Glass Transition Inflection Point
No Crystallization or Kinetics
* Data is for Spray Dried Milk Powder at 25C

Static Isotherm Only
* Data is for Spray Dried Milk Powder at 25C
0.0000
0.1000
0.2000
0.3000
0.4000
0.5000
0.6000
0.7000
0.8000
0.00%
1.00%
2.00%
3.00%
4.00%
5.00%
6.00%
7.00%
8.00%
9.00%
10.00%
0.0 2000.0 4000.0 6000.0
Wa
ter
Ac
tiv
ity
% M
ois
ture
Co
nte
nt
Time (min)
0.00%
1.00%
2.00%
3.00%
4.00%
5.00%
6.00%
7.00%
8.00%
9.00%
10.00%
0.0000 0.2000 0.4000 0.6000 0.8000
% M
ois
ture
Co
nte
nt
Water Activity
No inflection point visible to indicate glass transition
Crystallization
Kinetics of Sorption and Diffusion

Static and Dynamic on 1 sample
0
5
10
15
20
25
0.0000 0.2000 0.4000 0.6000 0.8000 1.0000
% M
ois
ture
Co
nte
nt
Water Activity
Static Isotherm Dynamic Isotherm
* Data is for Spray Dried Milk Powder at 25C
Glass Transition Inflection Point
Crystallization

VSA’s Stage Interface Maximizes
Utility
A test can consist of 1 to 20 stages
All stages performed on 1 sample
Each stage has unique settings
One test could have a DDI stage, a DVS
stage, each with different starting and
stopping points and each at a different temperature

VSA Review
Stand Alone Instrument
Can be Controlled by a Computer
Temperature Range is 15-60 °C
Easy to Maintain
Also a Water Activity Instrument
Can Generate DDI Isotherms
Can Generate Equilibrium Isotherms
Can Generate Both Types of Isotherms on One Sample
Stage Interface Maximizes Utility

Who Uses Isotherms and for
What? Companies Uses
Kraft Ingredient mixing, powder flow,
product formulation, DUO
General Mills Ingredient mixing, product
formulation, deliquescence
Glaxo-Smith Kline Excipient stability, glass transition,
moisture migration, API stability
Quaker Ingredient mixing, product
formulation, deliquescence
Meade Johnson Powder flow, caking, chemical
stability, glass transition, DUO
Nestle Pet Care Powder flow, caking, chemical
stability, glass transition,
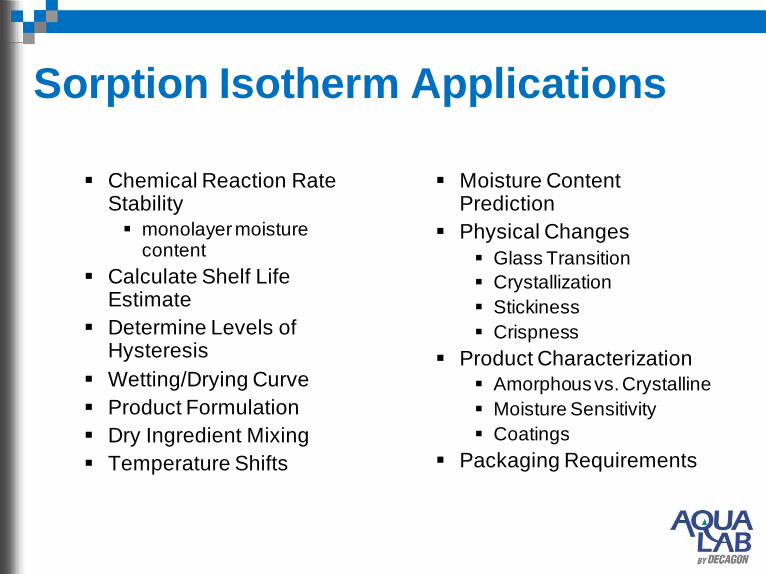
Sorption Isotherm Applications
Chemical Reaction Rate Stability
monolayer moisture content
Calculate Shelf Life Estimate
Determine Levels of Hysteresis
Wetting/Drying Curve
Product Formulation
Dry Ingredient Mixing
Temperature Shifts
Moisture Content Prediction
Physical Changes
Glass Transition
Crystallization
Stickiness
Crispness
Product Characterization
Amorphous vs. Crystalline
Moisture Sensitivity
Coatings
Packaging Requirements

Monolayer Stability Value
For most dry foods at or below the monolayer value
(from the BET or GAB isotherm) the rates of quality
loss are negligible. The monolayer moisture content
corresponds to an aw of 0.2 – 0.4.

Shelf Life – critical aw value
The higher the aw the faster the reaction rate,
thus, the shorter the shelf life.
For most dry foods,
an increase in aw
by 0.1 unit decreases
shelf life two to
three times.
Bell, L. N. and Labuza, T. P. (1994).
Influence of the low-moisture state on pH and its implication for reaction kinetics.
Journal of Food Engineering. 22:291-312.

Hysteresis
Adsorption
starts from the dry state, aw = 0
Desorption
starts from the initial wet state, aw ~ 1.

Drying/Wetting Curve
0
1
2
3
4
5
6
7
8
9
0 0.2 0.4 0.6 0.8 1
Water Activity
Mo
istu
re C
on
ten
t (%
d.b
.)
Product Safe
Product
Could Mold

Product Formulation
Moisture sorption
isotherms of cellulose
model systems
containing various
amounts of glycerol at
37°C.
Labuza, T. P., Heidelbaugh, N. D., Silver, M., and Karel, M. (1971). Oxidation at intermediate
moisture contents. Journal of American Oil Chemists Society. 48:86-90.

Determine Relative Hygroscopisity
At low aw, Croscarmellose is most hygroscopic
At aw > than 0.70, Sorbitol and Sucrose experience phase changes and become hygroscopic
Mannitol is non-hygroscopic over the entire water activity range

Dry Ingredient Mixing
When two ingredients
of different water
activities are mixed
together in a sealed
package they will
exchange moisture
until an equilibrium aw
(chemical potential) is
reached.
aeq
0
5
10
15
20
25
0 0.2 0.4 0.6 0.8 1 Mo
istu
re C
on
ten
t (%
w.b
.)
Water Activity
Ingredient 1 Ingredient 2

Example of Ingredient Mixing
)]exp(exp[ eqeqwa
iiww DLP Combined Isotherm
i = mass f raction of component i
wi = moisture content of component i.
Where b3, b2, b1, and b0 are empirical constants from
the DLP isotherm model and χ is ln(-ln(aw))
0
5
10
15
20
25
0 0.5 1
Mo
istu
re C
on
ten
t (%
w
.b.)
Water Activity
Ingredient 1 Ingredient 2
Combined
iiiii bbbbw 01
2
2
3
3
'''' 012
2
3
3bbbbw eqeqeq
Where b3’, b2‘, b1‘, and b0’ are the DLP constants for
the combined isotherm and χeq is ln(-ln(aw(eq)))
b3’ = ∑Φib3i , b2’ = ∑Φib2i , b1’ = ∑Φib1i , b0’ = ∑Φib0i

Modeling Temperature Abuse
y = -0.4634x + 1.1543
R2 = 0.9599
-0.5
-0.45
-0.4
-0.35
-0.3
-0.25
-0.2
-0.15
-0.1
-0.05
0
3.15 3.2 3.25 3.3 3.35 3.4 3.45 3.5
1000/Temp (K-1)
ln(a
w)
80.0353
1
298
1463exp680.0
11exp
21
12
TTR
Haa ww
What is the water activity of Granola Bar with 25% m.c. at 80C (353K)?

Isotherms at Different Temperatures
0
5
10
15
20
25
0 0.2 0.4 0.6 0.8 1
Water Activity
Mo
istu
re C
on
ten
t (%
d.b
.)
15c 20c 25c 30c 35c 40c
*Data is for Spray Dried Milk Powder

Isotherm and Phase Transitions
0
5
10
15
20
0 0.2 0.4 0.6 0.8 1
Water Activity
Mo
istu
re C
on
ten
t (%
d.b
.)
Critical Water Activity
Amorphous Glassy State
Rubbery State
Surface and Bulk
Adsorption
Surface
Adsorption
Particles are wetting and
going into solution
*Data is for Spray Dried Milk Powder

Savitsky/Golay 2nd Derivative
-0.5
-0.4
-0.3
-0.2
-0.1
0
0.1
0.2
0 0.2 0.4 0.6 0.8 1
Glass Transition at
0.437
Dissolution Onset at
0.731
*Data is for Spray Dried Milk Powder

DDI Method for Phase Transitions
Low %Moisture Content or aw High
Low
High
Constant T
Scan aw
Critical %MC or aw
Tg
Glassy State
Rubbery State

Amorphous vs. Crystalline
0
1
2
3
4
5
6
7
0 0.2 0.4 0.6 0.8 1
Water Activity
Mo
istu
re C
on
ten
t (%
d.b
.)Amorphous Crystalline
*Data is for Sucrose

Determining Deliquescence
Point
0
0.5
1
1.5
2
2.5
3
3.5
4
4.5
0 0.2 0.4 0.6 0.8 1
Water Activity
Mo
istu
re C
on
ten
t (%
d.b
.)
*Data is for Sucrose
Deliquescence
Point

Whole Vs. Ground
0
5
10
15
20
25
0 0.2 0.4 0.6 0.8 1
Water Activity
Mo
istu
re C
on
ten
t (%
d.b
.)
Ground Corn Whole Corn

Water Activity as a CPP for Gel
Coating Integrity
Coatings start to stick at the point when water
penetrates the coating as indicated by the moisture
sorption isotherm.
0
2
4
6
8
10
12
14
16
18
20
0 0.2 0.4 0.6 0.8 % W
eig
ht
Ch
an
ge
fro
m I
nit
ial
Water Activity
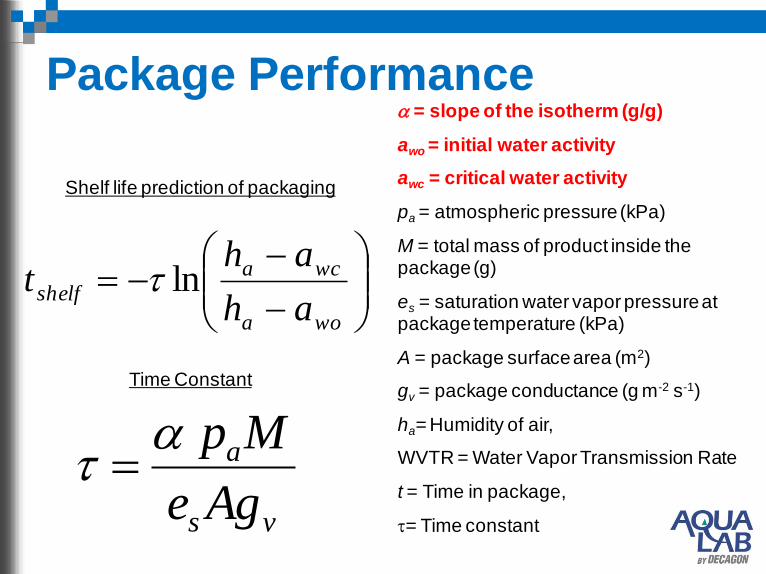
Package Performance
vs
a
Age
Mp
= slope of the isotherm (g/g)
awo = initial water activity
awc = critical water activity
pa = atmospheric pressure (kPa)
M = total mass of product inside the package (g)
es = saturation water vapor pressure at package temperature (kPa)
A = package surface area (m2)
gv = package conductance (g m-2 s-1)
ha= Humidity of air,
WVTR = Water Vapor Transmission Rate
t = Time in package,
= Time constant
woa
wca
shelfah
aht ln
Shelf life prediction of packaging
Time Constant

Package Performance Example
y = 2.59x + 2.89
R2 = 0.97
0
2
4
6
8
10
12
14
0 0.2 0.4 0.6 0.8
Water Activity
Mo
istu
re C
on
ten
t (%
wb
)
Example: A milk powder producer wants to know more information
about his packaging material, especially under abuse conditions.
Critical aw = 0.43

Packaging Calculations
Predict shelf life in a given type of packaging
Determine package conductance
Determine required package conductance

Conclusions
Isotherms characterize the relationship between
water activity and moisture content
Different types of isotherms
DDI method is a different method for measuring
isotherms
Isotherms have many applications
VSA is a versatile instrument for isotherm
generation

Thank you
Wendy Ortman
Decagon Devices, Inc.
2365 NE Hopkins Court
Pullman, Washington 99163
Phone: (509) 332-2756 / (800) 755-2751
Fax: (509) 332-5158
Email: [email protected]
Web: www.aqualab.com


![UNIVERSITI MALAYSIA PERLISportal.unimap.edu.my/portal/page/portal30/STD_ACA_BULL...Teori Litar Elektrik [Electric Circuit Theory] 9.00 pagi (am) 3 jam (hours) DKD 4 EKT112 Prinsip-prinsip](https://img.dokumen.tips/doc/110x75/60d5df26c10ff54a770fff61/universiti-malaysia-teori-litar-elektrik-electric-circuit-theory-900-pagi.jpg)


![UNIVERSITI MALAYSIA PERLISportal.unimap.edu.my/portal/page/portal30/STD_ACA... · ERT108 Kimia Fizikal [Physical Chemistry] PDT222 Metalurgi [Metallurgy] PDT346 Pengurusan Produk](https://img.dokumen.tips/doc/110x75/6098cbb99400df41a3745961/universiti-malaysia-ert108-kimia-fizikal-physical-chemistry-pdt222-metalurgi-metallurgy.jpg)
![UNIVERSITI MALAYSIA PERLISportal.unimap.edu.my/portal/page/portal30/STD_ACA_BULL_BOARD/ABB... · Asas Elektrik dan Elektronik [Basic Electrical and Electronic] PDT255 Kawalan Proses](https://img.dokumen.tips/doc/110x75/5e22eebce03c6c27371472ea/universiti-malaysia-asas-elektrik-dan-elektronik-basic-electrical-and-electronic.jpg)


![UNIVERSITI MALAYSIA PERLISportal.unimap.edu.my/portal/page/portal30/STD_ACA... · Prinsip -prinsip Pengurusan [Principles Of Management] 9.00 pagi (am) 3 jam (hours) DSKG DKG 3 DKG](https://img.dokumen.tips/doc/110x75/5e48859838368360262be250/universiti-malaysia-prinsip-prinsip-pengurusan-principles-of-management-900.jpg)


![UNIVERSITI MALAYSIA PERLISportal.unimap.edu.my/portal/page/portal30/STD_ACA... · Pengurusan dan Penggunaan Bahan Buangan [Waste Management and Utilization] 2.30 petang (pm) 3 jam](https://img.dokumen.tips/doc/110x75/5e46133f45d1fc74fc488e4d/universiti-malaysia-pengurusan-dan-penggunaan-bahan-buangan-waste-management-and.jpg)


![[PPT]Piping Drafting & Drawing - Universiti Malaysia Perlisportal.unimap.edu.my/portal/page/portal30/Lecturer Notes... · Web viewUses of Industrial Piping Water Natural gas Electric](https://img.dokumen.tips/doc/110x75/5abeef377f8b9a8e3f8d9e32/pptpiping-drafting-drawing-universiti-malaysia-notesweb-viewuses-of-industrial.jpg)


