Embed Size (px)
Citation preview

SUBCOURSE EDITIONFI0921 B
BASIC STATISTICS

BASIC STATISTICS
Subcourse Number FI0921
Edition BApril 1991
United States Army Soldier Support InstituteFort Jackson, South Carolina
13 Credit Hours
SUBCOURSE OVERVIEW
This subcourse covers comparative measures expressed as ratios (fractions, decimals,percentages, and index numbers); descriptive measures of central tendency (mean, median,and mode), and variability (range, and standard deviation); properties of the normal curve; theuse of the Empirical rule; and the use of the normal curve table.
Terminal Learning Objective
Actions: Identify, define, and apply to problem solving situations, basic statisticalconcepts and indices that include ratios, measures of central tendency,measures of dispersion, and the properties of the normal curve.
Conditions: You will be given various instructional frames contained within thissubcourse.
Standards: You will identify and define the concepts contained within this subcoursein accordance with the provisions of standard statistical referencematerial. Moreover, you must be able to correctly work computationsand solve all problems presented in the instructional frames.
There are no prerequisites for this subcourse.
This subcourse reflects the doctrine which was current at the time it was prepared. In yourown work situation, always refer to the latest publications.
The words "he," "him," "his," and "men," when used in this publication, represent both themasculine and feminine genders unless otherwise stated.
i FI0921
TABLE OF CONTENTS
Section Page
Subcourse Overview................................................................................................................. i
Lesson 1: Comparative Measures......................................................................................... 1
Types of Ratios..................................................................................................... 3
Uses of Indices..................................................................................................... 23
Practice Exercise.................................................................................................. 27
Answer Key and Feedback................................................................................... 29
Lesson 2: Descriptive Measures.......................................................................................... 31
Measures of Central Tendency............................................................................. 37
Measures of Dispersion........................................................................................ 49
Practice Exercise.................................................................................................. 61
Answer Key and Feedback................................................................................... 64
Lesson 3: The Normal Curve................................................................................................. 67
Characteristics of the Normal Curve.................................................................... 68
The Empirical Rule................................................................................................ 78
The z Score........................................................................................................... 87
Table for Areas Under the Standard Normal Curve.............................................. 92
Practice Exercise.................................................................................................. 108
Answer Key and Feedback................................................................................... 110
iii FI0921
PROGRAMED INSTRUCTION
The purpose of this subcourse is to introduce you to basic descriptive statistical methods andtheir applications. These methods can aid managers in the analysis of problems and in decisionmaking.
Concepts, principles, and methods for working problems and learning techniques of basicstatistics are presented in programed format. Graphs, drawings, and charts are included to giveemphasis to the applications of statistics.
The text contains frames (units of instruction) each of which presents a concept, principle, ortechnique. You are asked questions or given problems to work to ensure that you understandthe material. Self-examination and appraisal are means by which you may measure yourprogress and work toward self improvement.
Begin with Frame 1 and work through the programed text in a systematic, step-by-step manner.You have the opportunity to check your work as you proceed from frame to frame. Though notrequired, a hand calculator with a square root function would be helpful in working problems.The answer to a question in a frame appears on the following page. In this way, you receiveinstant feedback on whether you are correct or incorrect. If you answer incorrectly, return to theframe and restudy the material for greater understanding.
The frames in this programed instruction text are numbered consecutively from Frame 1 throughFrame 72 as follows:
Frame Lesson Title
1-19 1 Comparative Measures
20-43 2 Descriptive Measures
44-72 3 The Normal Curve
iv FI0921

LESSON 1
COMPARATIVE MEASURES
LEARNING OBJECTIVE
Actions: Identify and compute values for ratios in terms of fractions, decimals,percents, and index numbers.
Conditions: You will be given instructional problems relative to fractions, decimals,percents, and index numbers.
Standards: You must be able to correctly calculate percent change, percent of total,percent of programed, and percent deviation, and to correctly apply a priceindex to values from several time periods and convert these values intoconstant dollars.
FRAME 1.
INTRODUCTION
Comparative measures, or ratios, point out existing relationships between factors expressednumerically. They compare two numbers. For example, miles and gallons can he compared--25miles to each gallon. For each 25 miles we travel, it will take 1 gallon of gasoline. Thus, we havea meaningful relationship, comparing related items.
The gasoline used should be directly and logically related to the miles traveled. The moremiles we travel the more gasoline we will use. The ratio, 25 miles to 1 gallon, expresses thisrelationship exactly. Note two things. First, the two different items compared in ratio form mustbe logically related--miles and gallons. Second, the related items have to be able to beexpressed numerically--25 miles and 1 gallon.
In summary, a ratio compares numerical items that are related.
QUESTION:
From what you have just read, what are two requirements for ratios?
a._________________________________________________________________
b._________________________________________________________________
1 FI0921

ANSWER TO FRAME 1.
a. There must be a logical relationship between the items.
b. They must be able to be expressed as numbers.
2 FI0921

FRAME 2.
TYPES OF RATIOS
Now that you know generally what a ratio is, you will learn to calculate and interpret 4 typesof ratios:
a. fractions.
b. decimals.
c. percentages.
d. index numbers.
Each of these ratios will be covered in the following sections.
The first and most basic form of ratio is the FRACTION. It compares two numbers bydivision of one by the other. For instance, in our previous example, 25 miles to 1 gallon would beexpressed as 25/1. It still means that 25 miles is divided by 1 gallon. It can also be expressed25 to 1, 25/1, or 25 4 1. They all mean the same thing but we will work here with the fraction.
QUESTION:
If you traveled 50 miles on 2 gallons of gasoline, what would the fraction be thatexpressed miles to gallons?__________________________________
3 FI0921

ANSWER TO FRAME 2.
50/2 (50 miles to 2 gallons) which further reduces to 25/1.
4 FI0921

FRAME 3.
During the first half of a fiscal year $40,000 was spent out of $100,000 budgeted for thewhole year.
QUESTION:
What fraction relates the actual amount spent to the total amount budgeted?
_____________________________________________________________________
__________________________________________________________________________
FRAME 4.
The enrollment in a service school is 4,000 students.
QUESTION:
If 1,000 are officers, what fraction expresses the relationship of officers to total students?
_____________________________________________________________________
__________________________________________________________________________
FRAME 5.
Seventy-five of the 200 AWOLS at your installation last year were returned within 5 days.
QUESTION:
What fraction relates the AWOLS returned within 5 days to the total number of AWOLS?
_____________________________________________________________________
5 FI0921

ANSWER TO FRAME 3.
$40,000__ Equivalent expressions are $ 4, $2 ($40,000 to $100,000)$1000,000 $10 $5
ANSWER TO FRAME 4.
1,000/4,000 An equivalent expressions is 1/4, (1 officer to 4 students)
ANSWER TO FRAME 5.
75 An equivalent expression is 3, (3 returned for each 8 who went AWOL)200 8
6 FI0921
FRAME 6.
Note that in all cases there is a logical relationship and it is expressed in terms ofnumbers--50 miles to 2 gallons, $2 to $5, 1 officer to 4 students, and 3 returned AWOLS to 8who went AWOL.
The second form of a ratio is the decimal. A decimal is a fraction where the indicateddivision has been performed. For example, 1/4 would be 1 divided by 4, which is equal to .25.Note the fraction 1 to 4 is the same as the decimal .25 to 1. However, when expressing adecimal, the "to 1" is understood and left off. So the ratio would be stated as the decimal .25.
QUESTION:
How would you express the following fractions as decimals?
A. 34
B. 15 8
C. 56
D. 45
7 FI0921

ANSWER TO FRAME 6.
A. .75
B. 1.875 or 1.88 (Note that we round our answer to two digits to the right of the decimalpoint.)
C. .83333 or .83
D. .80
A word about rounding.
As a general rule, carry rounding results just two places beyond or to the right of the decimalwhen you finish your computations.
If the third digit is 6, 7, 8, or 9, then raise the second digit to the next higher number.
Thus, 1.876 = 1.88
If the third digit is 5, then raise the second digit if it is odd.
Thus, 1.875 = 1.88
Thus, 1.835 = 1.84
If the third digit is 5, then drop the 5 and do not raise the second digit if it is even.
Thus, 1.865 = 1.86
If the third digit is 0, 1, 2, 3, or 4, then drop that digit and leave the second digit as it is.
Thus, 1.874 = 1.87
8 FI0921
FRAME 7.
The third form of ratio to be discussed is the PERCENTAGE. It is similar to a decimal. Tomake a percentage, you would move the decimal point two places to the right by multiplyingby 100. For example, the decimal relating 1,000 officer students to 4,000 total students was.25 to 1 or simply .25. The percentage in this case would be 25 percent. Note that thedecimal point is simply moved two places to the right (.25.) and the "percent" symbol isadded. It is still a ratio: 25% (officers) to 100% (total students). However, as with a decimal,the "to 100l is understood and left off. The symbol "%" may be used instead of writing theword percent.
QUESTION:
How would you express the following fractions and decimals as percentages?
A. 1 =2
B. 3=4
C. 6.3=
D. 5 =8
E. .856 =
F. .1 =
G. 3.46 =
9 FI0921

ANSWER TO FRAME 7.
A. 1 = 50%2
B. 3 = 75%4
C. 6.3 = 630%
D. 5 = 62.5%8
E. .856 = 85.6%
F. .1 = 10%
G. 3.46 = 346%
Note that the decimal point was simply moved two places to the right and "%" was added.
10 FI0921

FRAME 8.
PERCENTAGE is the relationship of a part to the whole. There are four basic variations ofpercentage that must be examined before this tool can be properly utilized.
a. Percent of total.
b. Percent change.
c. Percent deviation.
d. Percent of programed.
PERCENT OF TOTAL compares one item or group of items to the total number of items. Forexample, if the total budget of $400,000 for a service school includes $60,000 for TDY trips, theTDY trips ($60,000) would be 15% ($60,000/$400,000) X (100) of the total budget ($400,000).Note that a part of the budget (TDY trips) has been compared to the total budget. In terms of aformula it would be:
Percent of total = Part X 100Total
= 60,000 X 100400,000
Percent of total = 15%
QUESTION:
If civilian pay and benefits amounts to $300,000, what percent of the total would this be of a$400,000 budget? __________
11 FI0921

ANSWER TO FRAME 8.
Percent of Total = $300,000 X 100$400,000
= 0.75 X 100
Percent of Total = 75%
12 FI0921
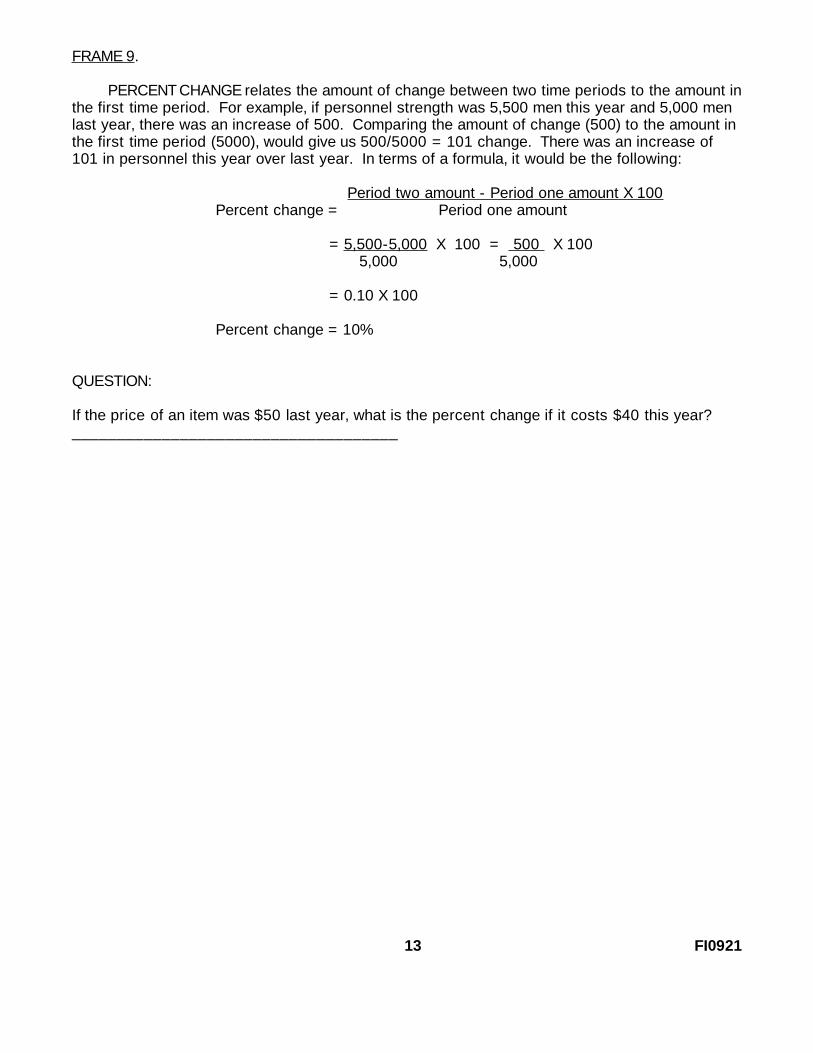
FRAME 9.
PERCENT CHANGE relates the amount of change between two time periods to the amount inthe first time period. For example, if personnel strength was 5,500 men this year and 5,000 menlast year, there was an increase of 500. Comparing the amount of change (500) to the amount inthe first time period (5000), would give us 500/5000 = 101 change. There was an increase of101 in personnel this year over last year. In terms of a formula, it would be the following:
Period two amount - Period one amount X 100Percent change = Period one amount
= 5,500-5,000 X 100 = 500 X 1005,000 5,000
= 0.10 X 100
Percent change = 10%
QUESTION:
If the price of an item was $50 last year, what is the percent change if it costs $40 this year?____________________________________
13 FI0921
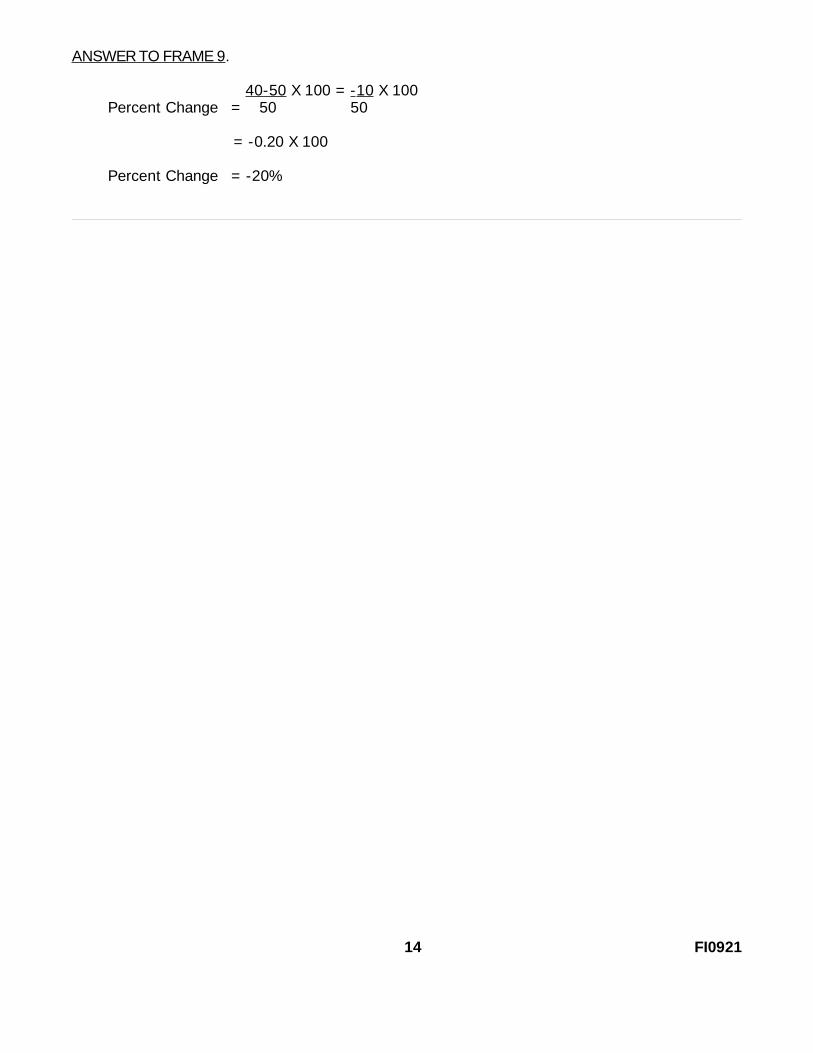
ANSWER TO FRAME 9.
40-50 X 100 = - 10 X 100Percent Change = 50 50
= -0.20 X 100
Percent Change = -20%
14 FI0921

FRAME 10.
If the cost last year was $80,000, what is the percent change if this year's cost was$72,000?
FRAME 11.
PERCENT DEVIATION compares the amount by which the actual amount differed from theplanned amount. Suppose the actual amount spent was $392,000 while $400,000 had beenbudgeted. The difference between actual and planned was -$8000. Comparing this -$8000 tothe planned amount of $400,000, we get a percent deviation of -2%. In other words, the actualamount was 2% less than the planned amount. In terms of a formula, we have the following:
Percent deviation = actual amount - planned amount X 100planned amount
= 392,000 - 400,000 X 100400,000
= -8,000 X 100400,000
Percent deviation a -2%
The percent deviation indicates how much the actual is above or below the planned amount interms of percent.
QUESTION:
If the amount budgeted for travel is $60,000 and the actual amount spent is $66,000, what is thepercent deviation and what does it mean?
15 FI0921
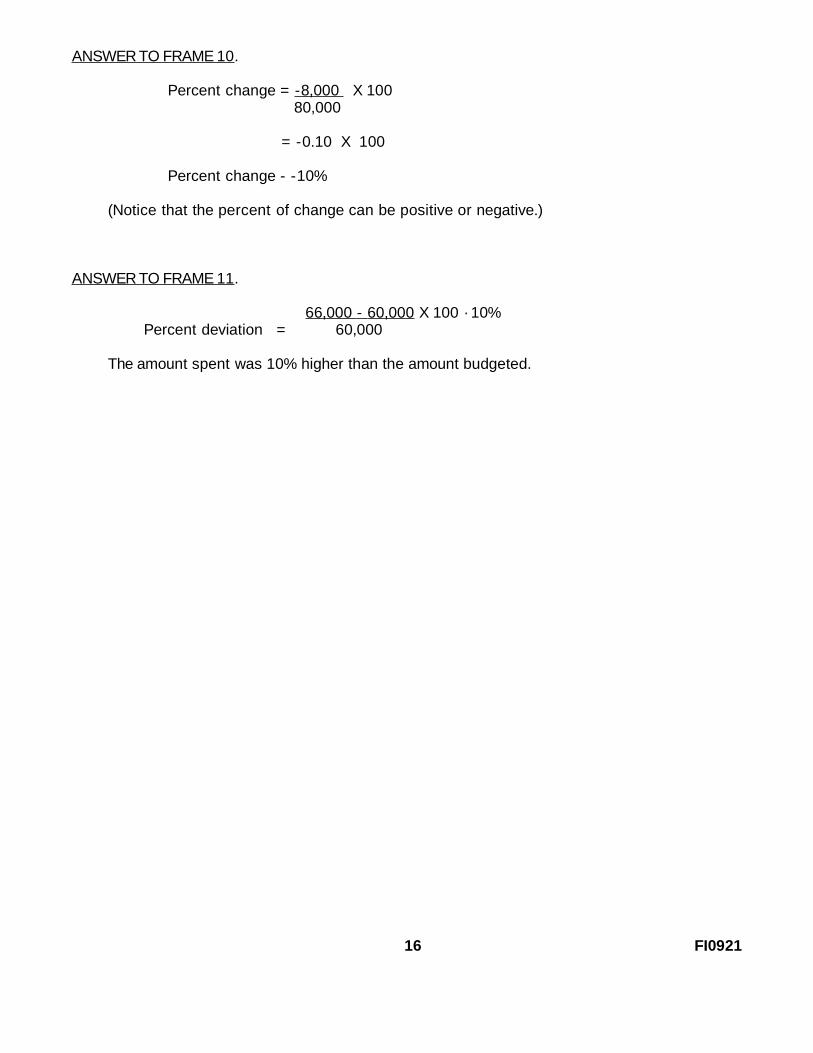
ANSWER TO FRAME 10.
Percent change = -8,000 X 10080,000
= -0.10 X 100
Percent change - -10%
(Notice that the percent of change can be positive or negative.)
ANSWER TO FRAME 11.
66,000 - 60,000 X 100 · 10%Percent deviation = 60,000
The amount spent was 10% higher than the amount budgeted.
16 FI0921
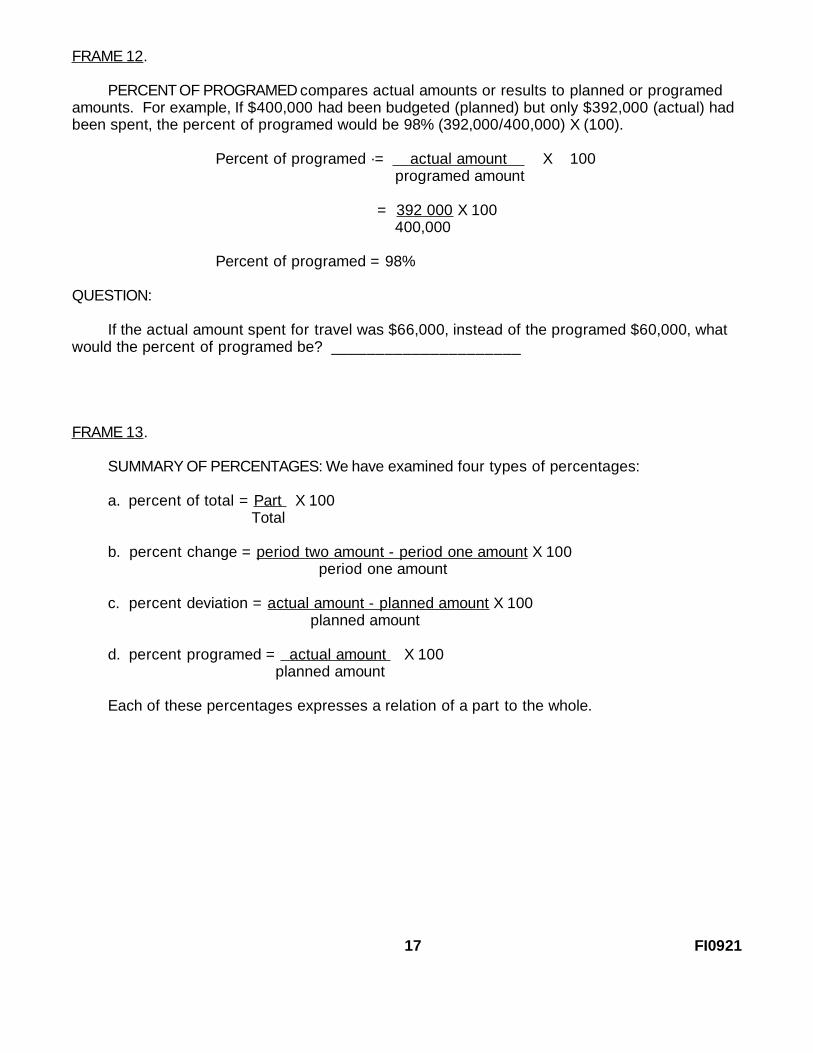
FRAME 12.
PERCENT OF PROGRAMED compares actual amounts or results to planned or programedamounts. For example, If $400,000 had been budgeted (planned) but only $392,000 (actual) hadbeen spent, the percent of programed would be 98% (392,000/400,000) X (100).
Percent of programed ·= actual amount X 100programed amount
= 392 000 X 100 400,000
Percent of programed = 98%
QUESTION:
If the actual amount spent for travel was $66,000, instead of the programed $60,000, whatwould the percent of programed be? _____________________
FRAME 13.
SUMMARY OF PERCENTAGES: We have examined four types of percentages:
a. percent of total = Part X 100Total
b. percent change = period two amount - period one amount X 100period one amount
c. percent deviation = actual amount - planned amount X 100planned amount
d. percent programed = actual amount X 100planned amount
Each of these percentages expresses a relation of a part to the whole.
17 FI0921
ANSWER TO FRAME 12.
$66,000 X 100 = 110%$60,000
18 FI0921
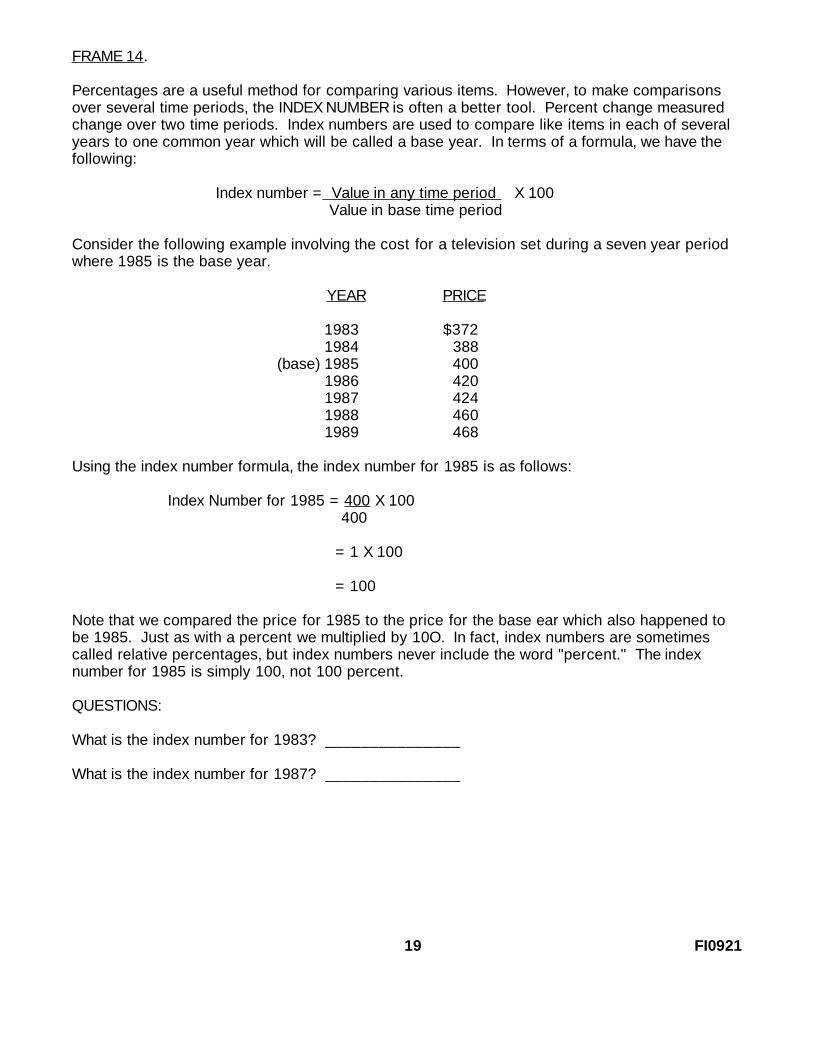
FRAME 14.
Percentages are a useful method for comparing various items. However, to make comparisonsover several time periods, the INDEX NUMBER is often a better tool. Percent change measuredchange over two time periods. Index numbers are used to compare like items in each of severalyears to one common year which will be called a base year. In terms of a formula, we have thefollowing:
Index number = Value in any time period X 100Value in base time period
Consider the following example involving the cost for a television set during a seven year periodwhere 1985 is the base year.
YEAR PRICE
1983 $3721984 388
(base) 1985 4001986 4201987 4241988 4601989 468
Using the index number formula, the index number for 1985 is as follows:
Index Number for 1985 = 400 X 100400
= 1 X 100
= 100
Note that we compared the price for 1985 to the price for the base ear which also happened tobe 1985. Just as with a percent we multiplied by 10O. In fact, index numbers are sometimescalled relative percentages, but index numbers never include the word "percent." The indexnumber for 1985 is simply 100, not 100 percent.
QUESTIONS:
What is the index number for 1983? _______________
What is the index number for 1987? _______________
19 FI0921

ANSWER TO FRAME 14.
Index number for 1983 = 372 X 100 93400
Index number for 1987 = 424 X 100 106400
20 FI0921

FRAME 15.
Note that when the price is greater than the base year price (as in 1987) the index Is over 100,and when the price Is less than the base year price (as in 1983) the index is less than 100.
QUESTION:
What are the Index numbers for 1984, 1986, 1988, and 1989?
YEAR PRICE INDEX
1983 $372 931984 388 _____
(base) 1985 400 1001986 420 _____1987 424 1061988 460 _____1989 468 _____
21 FI0921

ANSWER TO FRAME 15.
1983 372/400 X 100 = 931984 388/400 X 100 = 971985 400/400 X 100 = 1001986 420/400 X 100 = 1051987 424/400 X 100 = 1061988 460/400 X 100 = 1151989 468/400 X 100 = 117
22 FI0921

FRAME 16.
USES OF INDICES
Note that in every case we compared the price for each year to the base year price andmultiplied by 100. Index numbers are used to compare prices for like items over time. Thepurpose of any ratio is to compare values. It is much easier to relate the index each year to acommon base year index (100) than to compute the percentage change in price between each ofthe seven years. For instance, it is easier to look at the 117 for 1989 and compare it to the 100for 1985 than to compare the price $468 in 1989 to $400 in 1985. The index immediately tells usthat the price in 1989 is 17% greater than in the base year. It is important that the base yearselected be a "typical" year.
How are index numbers actually used? The most common area of application is priceindices. Two examples of price indices are the Simple Price Index (SPI) and the Consumer PriceIndex (CPI). The Simple Price Index includes just one item or commodity. If you combine SimplePrice Indices, then you have an aggregate price index. An example of an aggregate index is theCPI. The CPI is a statistical measure of change in prices of goods and services bought by urbanwage earners and clerical workers. There are some 400 food, housing, and transportation itemsin this index and they are grouped by type of commodity. These are then weighted to form theoverall index. Let us look at an income index. Your income has probably increased in dollarsover the past 5 years. What about its real purchasing power? Has it increased or decreased?To find out, we must convert your income for each of the 5 years into constant dollars so theycan be compared. Thus,
YEAR INCOME CPI1985 $10,000 1001986 10,500 1081987 11,500 1201988 12,000 1251989 13,500 150
To find the purchasing power of your 1989 income in 1985 dollars, use the following ratio:
Base Year Value = Current Year ValueBase Year Index Current Year Index
But since the base year index is always 100, we can rewrite the ratio as follows:
Base Year Value = Current Year Value X 100Current Year Index
Substituting values from the table, we have the following:
Base Year Value = 13,500 X 100 = 90 X 100 = 9,000150
1989 income is $9,000 vice 1985 income. You lost $1,000 in purchasing power.
QUESTION: What is your 1988 income in 1985 dollars? ____________
23 FI0921

ANSWER TO FRAME 16.
The ratio = Current Year Value X 100Current Index
= 12,000 X 100125
= 9.60 X 100
= $9,600
Thus, your 1988 income is $9,600. In terms of 1985 dollars, you lost $400 in purchasing power.
24 FI0921

FRAME 17.
Now complete the rest of the table.
YEAR INCOME CPI INCOME IN 1985 COLLARS
1985 $10,000 100 ___________________
1986 10,500 108 ___________________
1987 11,500 120 ___________________
1988 12,000 125 $ 9,600
1989 13,500 150 $ 9,000
FRAME 18.
The expenditures for maintenance during the past 5 years and the price Indices for this timeperiod are shown below. Compute the "real" cost of maintenance in terms of 1987 dollars for all5 years.
YEAR MAINTENANCE EXPENSE PRICE INDEX
1985 350 82
1986 475 93
1987 560 100
1988 720 111
1989 840 134
25 FI0921

ANSWER TO FRAME 17.
YEAR INCOME IN 1985 DOLLARS
1984 10,000 = 10,000 X 100100
1985 9,722 = 10,500 X 100108
1986 9,583 = 11,500 X 100120
ANSWER TO FRAME 18.
YEAR = REAL COST OF MAINTENANCE
1985 = 427 = 350 X 10082
1986 = 511 = 475 X 10093
1987 = 560 = 560 X 100100
1988 = 649 = 720 X 100111
1989 = 627 = 840 X 100134
FRAME 19.
As demonstrated above, a commonly used index is a price index used to compute the realvalue, or value in constant dollars, of incomes and expenditures over various time periods. Thisallows the analyst to compare like items over time, all measured with a constant standard.
Proceed now to the Practice Exercise for Lesson 1.
26 FI0921
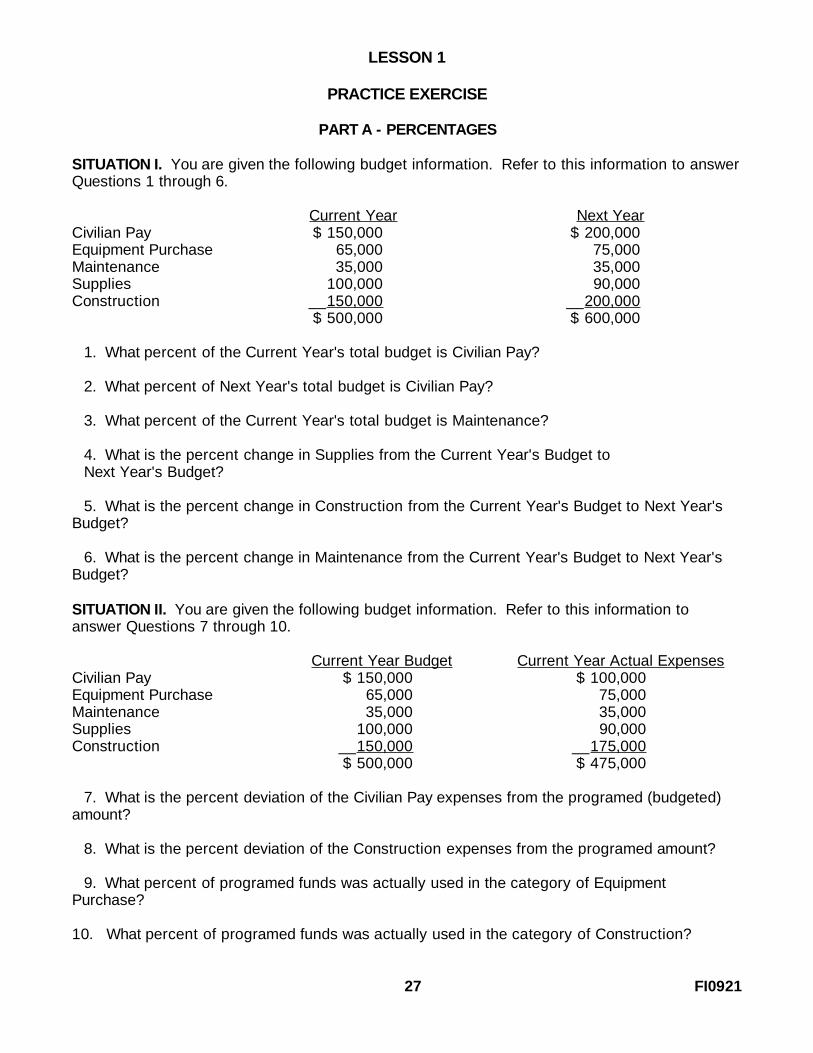
LESSON 1
PRACTICE EXERCISE
PART A - PERCENTAGES
SITUATION I. You are given the following budget information. Refer to this information to answerQuestions 1 through 6.
Current Year Next YearCivilian Pay $ 150,000 $ 200,000Equipment Purchase 65,000 75,000Maintenance 35,000 35,000Supplies 100,000 90,000Construction __150,000 __200,000
$ 500,000 $ 600,000
1. What percent of the Current Year's total budget is Civilian Pay?
2. What percent of Next Year's total budget is Civilian Pay?
3. What percent of the Current Year's total budget is Maintenance?
4. What is the percent change in Supplies from the Current Year's Budget toNext Year's Budget?
5. What is the percent change in Construction from the Current Year's Budget to Next Year'sBudget?
6. What is the percent change in Maintenance from the Current Year's Budget to Next Year'sBudget?
SITUATION II. You are given the following budget information. Refer to this information toanswer Questions 7 through 10.
Current Year Budget Current Year Actual ExpensesCivilian Pay $ 150,000 $ 100,000Equipment Purchase 65,000 75,000Maintenance 35,000 35,000Supplies 100,000 90,000Construction __150,000 __175,000
$ 500,000 $ 475,000
7. What is the percent deviation of the Civilian Pay expenses from the programed (budgeted)amount?
8. What is the percent deviation of the Construction expenses from the programed amount?
9. What percent of programed funds was actually used in the category of EquipmentPurchase?
10. What percent of programed funds was actually used in the category of Construction?
27 FI0921
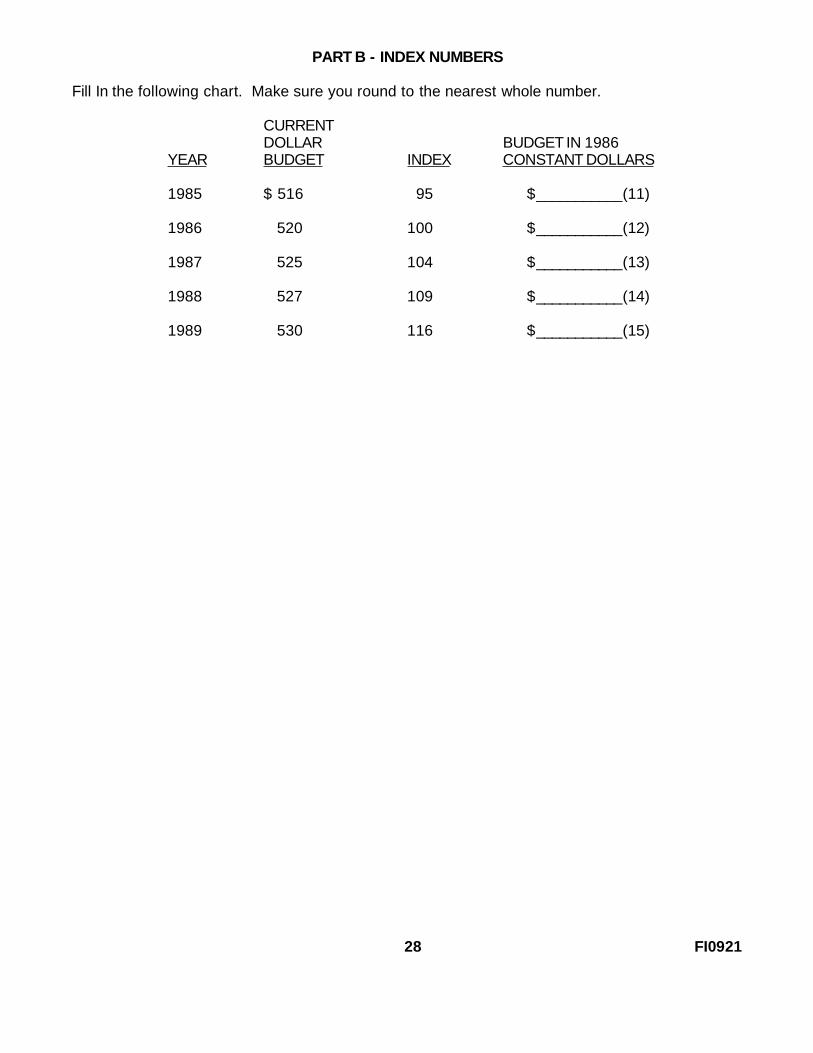
PART B - INDEX NUMBERS
Fill In the following chart. Make sure you round to the nearest whole number.
CURRENTDOLLAR BUDGET IN 1986
YEAR BUDGET INDEX CONSTANT DOLLARS
1985 $ 516 95 $___________(11)
1986 520 100 $___________(12)
1987 525 104 $___________(13)
1988 527 109 $___________(14)
1989 530 116 $___________(15)
28 FI0921

LESSON 1
PRACTICE EXERCISE
ANSWER KEY AND FEEDBACK
PART A - PERCENTAGES
1. 150,000 X 100 = 15 X 100 = .30 X 100 = 30% (See frame 8.) 500,000 50
2. 2 00,000 X 100 = 2 X 100 = .33 x 100 = 33% (See frame 8.) 600,000 6
3. 35,000 X 100 = 35 X 100 = .07 X 100 = 7% (See frame 8.) 500,000 500
4. -10,000 X 100 = -10 X 100 = -10 X 100 = -10% (See frame 9.) 100,000 100
5. 50,000 X 100 = 5 X 100 = .333 X 100 = 33% (See frame 9.) 150,000 15
6. 0 X 100 = 0% (See frame 9.) 35,000
7. 100,000-150,000 X 100 = -50 000 X 100 = -.33 X 100 = -33% 150,000 150,000
(See frame 11.)
8. 175,000-150,000 X 100 = 25,000 X 100 = .17 X 100 = 17% 150,000 150,000
(See frame 11.)
9. 75,000 X 100 = 15 X 100 = 1.15 X 100 = 115% 65,000 13 (See frame 12.)
10. 175,000 X 100 = 7 X 100 = 1.17 X 100 = 117% 150,000 6 (See frame 12.)
If you missed any of the exercises return to the indicated frame.
29 FI0921

Part B - INDEX NUMBERS
YEAR BUDGET IN 1986 CONSTANT DOLLARS
11. 1985 16 X 100 = 5.43 X 100 = 54395
12. 1986 520 X 100 = 5.20 X 100 = 520100
13. 1987 525 X 100.X 5.05 X 100 = 505104
14. 1988 527 X 100 X 4.83 X 100 = 483109
15. 1989 530 X 100 X 4.57 X 100 = 457116
If you missed any part of this exercise for reasons other than arithmetic errors, return to frame14 and rework the entire INDEX NUMBER SECTION.
30 FI0921

LESSON 2
DESCRIPTIVE MEASURES
LEARNING OBJECTIVE
Actions: Identify and compute measures of central tendency and dispersion.
Conditions: In this lesson you will be given questions and problems that pertain todescriptive measures.
Standards: Your explanations and computations will be In accordance with thedescriptions provided In this lesson.
FRAME 20.
INTRODUCTION
The advances in the size and complexity of organizations have given rise to the development of anew type of manager. With commercial Industries and the military establishment growing morecomplex, it becomes necessary to devise tools whereby the details and results of operations canbe simplified and presented to the manager in a way that will assist him to make better decisions.
31 FI0921

FRAME 20. (Continued)
One of the tools available to the manager is STATISTICS. Increasing numbers of executivesdesire the guidance of statistical analysis in making decisions. This growing use of statisticalmethods in business has been paralleled by a new emphasis on statistics by Governmentagencies. Government and business generate, manipulate, store and print incredible quantitiesof raw data. Statistics is a science that concerns itself with the measurable properties of a "pileof data" or group of objectives and thus can be helpful in bringing some order to the chaos.
We might separate statistics into closely related categories of quantitative techniques. Thesetwo categories are commonly called DESCRIPTIVE and INFERENTIAL statistics.
We use DESCRIPTIVE statistics to marshall and put data into some organized structure thathas meaning to the manager or decision maker. We attempt to identify those measurableproperties mentioned earlier, and to attach a number or value to them. We also try to identify a"shape" or form for the data, and relate that shape to some known shape that has thoroughlyunderstood and documented characteristics.
We use INFERENTIAL statistical techniques to analyze the data and draw a conclusion orconclusions from the results of the analysis. In doing so, we, as analysts, go beyond the datacollected, and predict, with some measure of accuracy, quantities to be realized.
There are terms in statistics that we will need to know.
The POPULATION is a set of data which consists of all possible observations of a certainevent. Another definition might be the totality of persons, items, time periods, equipment, and soforth, with a common characteristic. Perhaps the simplest definition would be to call thepopulation the WHOLE, whatever we define it to be.
Examples would include such disparate populations as all the people in the world who are UScitizens, all the automobiles produced by General Motors last year, all the tanks currently in theArmy inventory, all the members of a specified platoon, or all the people in your family.
Should we decide to look at each item in a population, we would be performing a CENSUS.Usually we can not perform a census. Some reasons which may deter us from doing a censusinclude lack of time, prohibitive expense, destructive nature of the census, and changingcharacteristics of the population. In these situations, we examine a SAMPLE drawn from thepopulation in question.
The SAMPLE is a set of data containing only a part of all the observations found in thepopulation. It is a part or a subset of the population. More simply, a sample is just a part of thewhole. We sample quite frequently. For example, when
32 FI0921

FRAME 20. (Continued)
you went to dinner at that fancy restaurant and pronounced their food 'excellent," you wereasking a statement based on a sample of only one meal about the population of all meals thathad keen, or will be, prepared at that restaurant.
If we have a small population, say an infantry platoon and we are interested in average age,we could take a census. The value we compute as the average age is called a PARAMETER. Ingeneral, a parameter is a value that can computed fro a population if the entire population isavailable.
However, the entire population is often not available. So, we use a port of the population( sample) to compute an ESTIMATE of the population value. This estimate, computed from asample, is called a STATISTIC.
QUESTION:
Now would you summarize this relationship? The________________________________is the whole; the _______________________ is a part of the whole.The ________________________________ is the true value computed from the population;the _________________________________is the estimate of this value computed from thesample.
33 FI0921

ANSWER TO FRAME 20.
Summarizing the relationship, the population is the whole; the sample a part of the whole. Theparameter is the true value computed from the population; the statistic is the estimate of thisvalue computed from the sample. Symbols such as those depicted in the diagram that followsare explained more fully in the notations found in lesson 2.
34 FI0921
FRAME 21.
There are two characteristics of a group of data that we will concern ourselves with in thistext. The first characteristic answers the question, "do the data tend to cluster or group aroundsome particular value or values?"
This first characteristic is CENTRAL TENDENCY. The three MEASURES OF CENTRALTENDENCY, discussed in the following pages, are used to identify the value around which thedata tend to cluster.
The second characteristic answers the question, "do the observations cluster very tightlyaround the measure of central tendency, or, are they spread out?" The second characteristic iscalled DISPERSION. Two measures of dispersion will be discussed in this text.
QUESTION:
What are the two characteristics of a group of data that we concern ourselves with in thistext?
a. ____________
b. ____________
35 FI0921
ANSWER TO FRAME 21.
a. Central Tendency
b. Dispersion
36 FI0921

FRAME 22.
MEASURES OF CENTRAL TENDENCY
The first of these characteristics that we will discuss is the tendency for data to clusteraround some particular value or values.
This characteristic is often referred to as CENTRAL TENDENCY.
There are three measures of CENTRAL TENDENCY:
MEAN, MEDIAN, AND MODE
The ARITHMETIC MEAN is found by adding the values of a group of data and dividing the sumby the number of items.
The term MEAN will be used in place of arithmetic mean in this text. For example, the mean ofthe five test scores:
98, 100, 82, 75, 95, is
mean score = sum of the scores = 450 = 90number of scores 5
QUESTION:
What is the mean of the following ages?
24, 25, 32, 28, 26? ________________
37 FI0921
ANSWER TO FRAME 22.
mean age = sum of the ages = 135 = 27number of ages 5
If we wanted one number to describe all the ages in our group of data, It would be 27.
38 FI0921

FRAME 23.
In the example above, we indicated the total of several measurements by using the term "sumof." We use this term so frequently that we have accepted a symbol to replace the words. Thesymbol is the Greek letter (pronounced Sigma). Thus, we could have expressed the problemΣas follows:
mean score = (test scores)___Σnumber of test scores
Since we do not limit ourselves to finding Just average test scores, we need to develop amore general statement for the relationship among the sum of the items we are interested in, thenumber of those items, and the mean value of those items. Such a general statement is called aformula. The formula is like a recipe, or set of general directions. It is composed of generalsymbols that we attach specific values to for specific problems. For example, the formula for thesample mean is:
X = XΣ n
Where,
X is the symbol for the sample mean,
X is the symbol for each observation of interest, and
n is the symbol for the number of observations.
In the example above, we are interested in 5 ages, thus X in this example represents each of thegiven ages. X represents the sum of the five ages. For each problem we do, or situation weΣencounter, what X represents will be specified.
FRAME 24.
Answer the following questions below using the following five dollar amounts, $35, $27, $24,$26, $28 taken from a group of 100 dollar amounts.
a. X represents ___, ___, ___, ___, ___
b. X = ___Σ
c. n = ___
d. X Σ = ___ n
39 FI0921

ANSWER TO FRAME 24.
a. X represents 35 , 27 , 24 , 26 , 28 , (the five observations of interest)
b. X = 140 (this is the sum of these 5 observations)Σ
c. n represents 5 (the number of observations)
d. XΣ = 140 = 28 (This is the sample mean for the 5 observations) n 5
40 FI0921

FRAME 25.
The preceding problem demonstrated the calculation of a sample mean. We knew it was asample because the five values of interest were taken from a population of 100. We could havecomputed the mean of all 100 dollar amounts. In such a case we would have had a populationmean. The difference between a sample mean and a population mean is that the populationmean includes every value in the population; whereas the sample mean includes only a portion ofthe values in the population. The population mean is still the sum of the values of interest dividedby the number of values of interest. Now we are interested in the entire population.
Even though they are computed in the same manner they are different concepts and we willneed a different symbol for each. The symbol for population mean is the Greek letter u(pronounced mu). The formula for the population mean is
u = XΣ where, N
X still represents each value of interest. However, we are now interested in all values in thepopulation)
N represents the number of items of interest in the population. Note this is a capital N ratherthan the small n used in the sample mean formula.
FRAME 26.
For example, suppose the number of calculator batteries used during all ten 3-week coursesheld this year is 37, 62, 28, 31, 58, 29, 35, 47, 52, and 25. We need to know the average numberof batteries used in a 3-week course this year.
a. Find the mean. __________________
b. Is this a sample or a population mean? __________________
41 FI0921

ANSWER TO FRAME 26.
a. mean = u = XΣ = 404 = 40.4N 10
b. We defined the population to be the batteries used in each of the ten 3-week courses thisyear. Since we used all 10 observations, we have computed a population mean.
42 FI0921

FRAME 27.
Suppose gathering all this data were very expensive. An alternative approach would be totake a sample from this population. Assume the observations 37, 58, 35, 54 were chosen as asample from the population above.
a. Compute the mean. _______________
b. Is this a sample or population mean? _______________
FRAME 28.
Compute the mean for the following samples.
Sample 1: 22, 29, 22, 7, 34. _________________
Sample 2: 22, 29, 22, 7, 10,000. ________________
FRAME 29.
The second measure of central tendency is called the MEDIAN. The median is a positionalaverage. It is determined by arranging the data in ascending or descending order and locatingthe middle value.
If there is an even number of observations in our data, we find the median by taking the meanof the MIDDLE two values. If there is an odd number of observations, there will always be onevalue in the data set that is the median.
For example, suppose we have the following nine observations: 1, 22, 29, 23, 7, 34, 14, 17, 31.We would find the median by arranging the data in ascending (or descending) order and selectingthe middle value. Putting the values in ascending order gives: 1, 7, 14, 17, 22, 23, 29, 31, 34. Themedian or middle value in this ordered list is 22. There are four values larger than 22 and fourvalues smaller than 22. If we arrange the data in descending order, the result would be the same.Try it.
QUESTION:
What is the median of the following eight observations:
8, 24, 28, 19, 7, 31, 2, 22 ________________
43 FI0921

ANSWER TO FRAME 27.
a. mean = X = XΣ = 184 = 46.0n 4
b. This is a sample mean because only four observations from the population were used incomputing it.
In a later text, we will use the sample mean to make a statement about the population mean. Forthe time being, note that the sample mean and the population mean DO NOT USUALLY GIVE THESAME VALUE.
ANSWER TO FRAME 28.
Sample 1 mean = X = XΣ = 114 = 22.80n 5
Sample 2 mean = X = XΣ = 10,080 = 2016n 5
Note the effect of extreme values on the sample mean. Although only one value changed, themean was changed significantly. This points out the key characteristic that the mean is affectedby extreme values and it may not be representative of all values in the sample (or population).
ANSWER TO FRAME 29.
Ordering the data gives: 2, 7, 8, 19, 22, 24, 28, 31. Since there are an even number ofobservations we must find the mean of the middle two values. This would be (19 + 22) /2 = 20.5.The median is then 20.5.
Note that, if you forgot to order the data, you would have computed the median to be (19 + 7) /2 = 13. This is incorrect. The data must be ordered.
44 FI0921

FRAME 30.
Find the median of the following two samples:
Sample A: 17, 22, 29, 23, 7, 34 ______________
Sample B: 22, 17, 10,000, 29, 7, 23 _________________
FRAME 31.
The median is a more appropriate measure of central tendency when there are extremevalues in the data. For example, average Income is usually a median, rather than a mean,because of the extremely large incomes of a few individuals.
The third measure of central tendency is called the MODE. The mode is the MOSTFREQUENTLY occurring observation in a group of data. For example, given the set of data: 38,19, 27, 25, 27, 26, 19, 27, 22, we see that the observation 27 occurs 3 times. The mode for thisset of data is 27. Find the mode for the following three samples:
Sample A: 22, 29, 22, 7, 34, 14, 17 ________
Sample B: 31, 2, 8. 22, 19, 28, 13 ________
Sample C: 22, 7, 29, 34, 22, 14, 31, 7 ________
45 FI0921

ANSWER TO FRAME 30.
Ordering both samples gives:
Sample A: 7, 17, 22, 23, 29, 34
Sample B: 7, 17, 22, 23, 29, 10,000
Since there are an even number of observations we find the mean of the middle two which gives:
Sample A: (22 + 23) /2 · 22.5
Sample B: (22 + 23) /2 - 22.5
Note that the median is not affected by extreme values as the mean was.
ANSWER TO FRAME 31.
Sample A: The value 22 occurs twice and all other values occur only once, so the mode is 22.
Sample B: Each value occurs the same number of times, once. The mode is the value orvalues that occur most often in the data set.
Sample C: The values 7 and 22 both occur twice. Both are modes of this group of data.Since two values occur twice, the data are bi-modal (two modes).
Notice there may be none, one, or more than one mode for a group of observations. There is,however, only one mean or median for any group of data.
46 FI0921

FRAME 32.
A typical application of the mode would be to determine the most frequent cause or reasonfor some event. For example, what is the most frequent cause of traffic accidents given thefollowing data?
CAUSES NUMBER OF ACCIDENTS
Mechanical Failure 100Reckless Driving 260Drunken Driving 130Speeding 380Weather Conditions _130
1000
Clearly the mean or median would not be appropriate in this case because the causes cannot benumerically measured. The modal cause is speeding because more accidents are attributed to itthan any other factor.
QUESTION:
The following data represents the number of hits on target by 10 tank crews selected at largefrom a tank battalion: 37, 43, 31, 40, 37, 45, 40, 37, 40, 38. Find the mean, median, and mode.
47 FI0921

ANSWER TO FRAME 32.
First order the data low to high:
31, 37, 37, 37, 38, 40, 40, 40, 43, 45
The mean is X = Σ X = 388 = 38.8 (This is a sample, not a population).n 10
The median is (38 + 40) /2 * 39. (There are an even number of observations.)
The modes are 37 and 40 because both occur three times.
48 FI0921

FRAME 33.
MEASURES OF DISPERSION
Now we will discuss two measures of dispersion. As indicated earlier, dispersion measuresthe spread or variability of the data about the mean value. The measures of central tendencyprovide significant information about a group of data. In most cases, however, more informationis needed. It is the combination of measures of central tendency and measures of dispersionthat provide a clearer description or summary of the data.
The following example illustrates that a measure of dispersion provides important additionalinformation about a group of observations.
ANNUAL WAGES OF TWO GROUPS OF WORKERS
Group A Group B
$ 1,000 $ 2,5001,275 2,7751,325 2,8001,350 2,8501,475 2,8751,525 3,0252,325 3,1752,475 3,2252,575 Median 3,2753,450 and 3,4503,825 Mean 3,7004,025 3,7254,425 3,7754,475 3,8754,525 3,9504,550 4,0004,575 4,0256,375 4,050
10,000 4,500
QUESTION:
How do the two groups differ?
49 FI0921

ANSWER TO FRAME 33.
Groups A and B have the same mean and median of $3,450. However, the observations ingroup A are spread out over a greater range of values than the observations in group B. Notethat the $10,000 extreme value in Group A markedly drives up the value of the arithmetic mean.Without it, the average annual wage for Group A workers drops by ten percent.
50 FI0921

FRAME 34.
From this example, it can be seen that to reach valid conclusions it is important to measurehow data are dispersed around the measure of central tendency.
Dispersion is important, not merely as a supplement to the mean, but also as a significantitem in itself. The performance of a student is judged not only by his average but also by hisconsistency. When a measure of central tendency and a measure of dispersion have beencomputed for a series, generally the two most important characteristics have been summarized.
The first measure of dispersion that we will examine is the range. The range is the differencebetween the highest and lowest values in a group of observations. In the example above, therange of Group A is 10,000 -1,000 9,000, and the range of Group B is 4,500 -2,500 = 2,000. Thisquickly illustrates that Group B's wages vary much less than Group A's wages.
FRAME 35.
Generally it is desirable to express the range in terms of the upper and lower limits; thus, wewould say A's range is $1,000 to $10,000 and B's is $2,500 to $4,500. This gives the reader anidea of the general location of the data.
Although it has the merit of being simple, the range is a rather unsatisfactory measurebecause it is determined only by the two extreme values in a group of observations, the high andthe low. Since these two figures are only "boundaries" of the rest of the data, they are insensitiveto the behavior or location of figures between them. The range should be used only in caseswhere a quick, cursory look at the data is desired.
QUESTION:
Find the range of the following costs:
$2600275024003800450031002800
Range = _________________
51 FI0921

ANSWER TO FRAME 35.
Ranges = $4,500 -$2,400 = $2,100. Note that the middle five values could have beenanything between $2,400 and $4,500 and the range would be the same. The range considersonly two values - the high and the low. All other values in between are not considered.
FRAME 36.
The second measure of dispersion is the standard deviation. The standard deviation is amuch better measure of dispersion than the range because it considers all observations, ratherthan just the two extremes. It measures an "average" dispersion around the mean.
As an example, let's find the standard deviation of the following seven observations: (15, 20,25, 30, 35, 40, 45).
The first step is to compute the mean. In this case the mean is
u = XΣ = 210 = 30.N 7
One approach to measuring dispersion is to measure the distance between each observation andthe mean. The formula for this relationship is X - u where X is an observation and u is the mean.Consider the following table:
_X_ X - u
15 15-30=-15 Notice that if an observation is20 20-30=-10 smaller than the mean, X - u is25 25-30=-5 negative.30 30-30= 035 35-30= 540 40-30= 1045 45-30= 15
(X-u) Σ = 0
In this example, (X-u) equals zero. This is Σ always true. Consequently, (X-u) is useless inΣhelping us compute a measure of dispersion. The combination of positive and negative valuesalways offset each other. To avoid this problem we will square the result of each X-u. (To squarea number means to multiply it by itself.)
52 FI0921
FRAME 37.
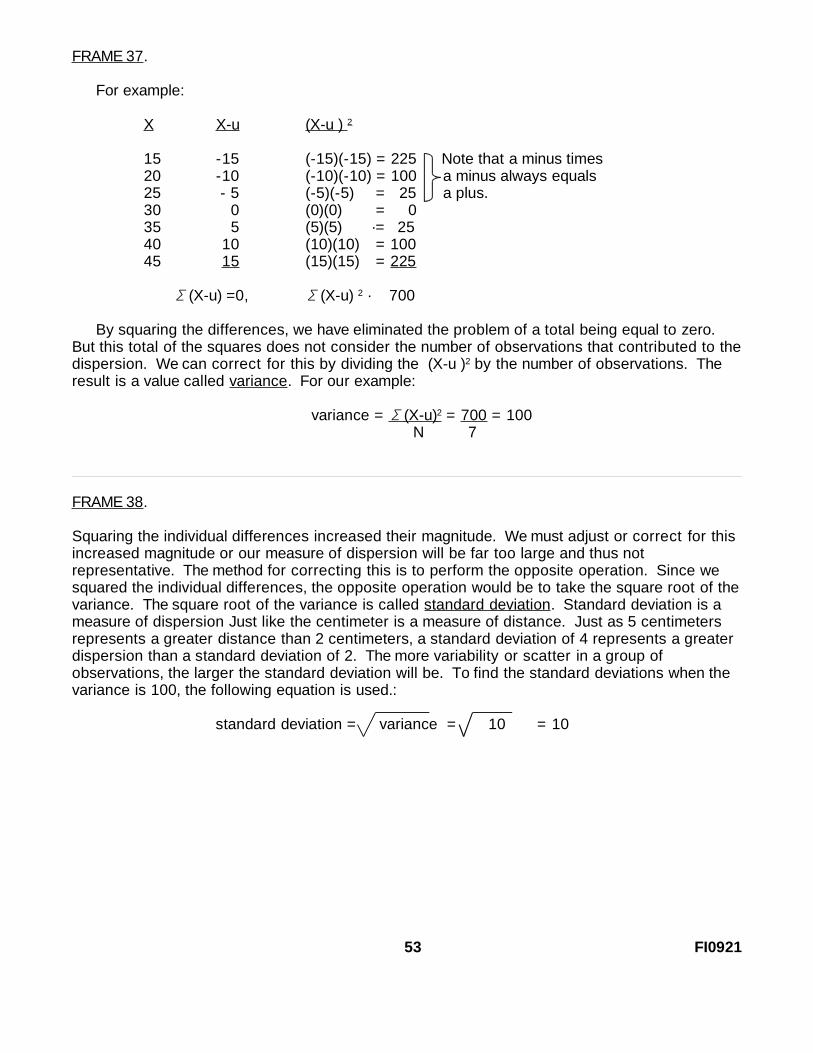
For example:
X X-u (X-u ) 2
15 -15 (-15)(-15) = 225 Note that a minus times20 -10 (-10)(-10) = 100 a minus always equals25 - 5 (-5)(-5) = 25 a plus.30 0 (0)(0) = 035 5 (5)(5) ·= 2540 10 (10)(10) = 10045 15 (15)(15) = 225
(X-u) =0,Σ (X-u) Σ 2 · 700
By squaring the differences, we have eliminated the problem of a total being equal to zero.But this total of the squares does not consider the number of observations that contributed to thedispersion. We can correct for this by dividing the (X-u )2 by the number of observations. Theresult is a value called variance. For our example:
variance = Σ (X-u) 2 = 700 = 100N 7
FRAME 38.
Squaring the individual differences increased their magnitude. We must adjust or correct for thisincreased magnitude or our measure of dispersion will be far too large and thus notrepresentative. The method for correcting this is to perform the opposite operation. Since wesquared the individual differences, the opposite operation would be to take the square root of thevariance. The square root of the variance is called standard deviation. Standard deviation is ameasure of dispersion Just like the centimeter is a measure of distance. Just as 5 centimetersrepresents a greater distance than 2 centimeters, a standard deviation of 4 represents a greaterdispersion than a standard deviation of 2. The more variability or scatter in a group ofobservations, the larger the standard deviation will be. To find the standard deviations when thevariance is 100, the following equation is used.:
standard deviation = variance = 10 = 10
53 FI0921

FRAME 39.
SUMMARY
1. Compute the population mean. The formula for the mean is u = XΣ . The procedure is adding N
the values of the data and dividing the total by the number of observations.
2. Subtract the mean from each value of the data. The formula is (X - u).
3. Square the difference between each value and the mean. The formula is
(X - u) 2 = (X - u) • (X - u).
4. Add together the squared difference between each value and the mean.
The formula is (X - u) Σ 2.
5. Divide the total (of the squared difference between each value and the mean) by the number ofobservations. The formula is (X-u) Σ 2
N
This value is called the variance.
6. Take the square root of the variance which will result in the standard deviation.
The formula is (X - U) Σ 2
N
The standard deviation can thus be computed using the formula:
= σ Σ (X - u) 2 N
where (pronounced sigma) is the symbol used to represent population standard deviation.σ
54 FI0921
FRAME 40.
Just as we make a distinction between population mean (u) and sample mean (X), we alsomake a distinction between population standard deviation (s) and sample standard deviation (s).Sample standard deviation is computed using the formula:
s = (X - X )Σ 2
n-1
where s represents sample standard deviation, n the number of observations in the sample, and Xthe sample mean. The sum of the squared differences, (X - X)Σ 2, is divided by n-1, rather than byn alone. This adjustment is called degrees of freedom. Allowing for degrees of freedom (df) alsogives a better estimate of the sample standard deviation since not all data points were analyzed.
As a rule of thumb, you should do the following: When dealing with a population, use thepopulation mean and population standard deviation. When dealing with a sample, use the samplemean and the sample standard deviation.
QUESTION:
From the following data, what is the mean and standard deviation of the days of accumulatedleave for all ten people in an office: 6, 6, 7, 8,
9, 11, 13, 13, 13, 14?
mean = _________
standard deviation ·__________
55 FI0921

ANSWER TO FRAME 40.
mean = u = XΣ = 100 = 10N 10
X X - u (X-u) 2
6 -4 16 Note: We are inter- 6 -4 16 ested in a popula- 7 -3 9 tion of all ten 8 -2 4 people in an office. 9 -1 1 Thus we compute the11 1 1 population mean and13 3 9 standard deviation.13 3 913 3 914 _4 16
X = 100Σ (X-u) = 0Σ (x-U)Σ 2 = 90
standard deviation = = σ (X - u) Σ 2 = 90 = 9 = 3N 10 1
56 FI0921

FRAME 41.
About 100 Government Property Lost or Damaged (GPLD) vouchers were processed thismonth. Five of these vouchers showed dollar amounts of $25, $30, $29, $23, and $33.
QUESTION:
Find the mean and standard deviation of these five dollar amounts.
mean = ______________________
standard deviation ________________________
57 FI0921

ANSWER TO FRAME 41.
mean = X = Σ X = 140 = 28n 5
_X_ X - X (X - X) 2
25 -3 9 Note that since we have a 30 2 4 sample of 5 taken from the 29 1 1 total population of 100 we 23 -5 25 must compute a sample mean 33 _5 25 and sample standard devia-115 0 64 tion.
standard deviation = s = (X - X)Σ 2 = _64_ = 16 = 4N-1 5-1
58 FI0921

FRAME 42.
SUMMARY OF THE MEASURES OF CENTRAL TENDENCY
MEAN
The mean is the sum of all observations divided by the number of observations. The meanconsiders all of the observations and it is greatly affected by extreme values. The mean can becomputed as shown below.
population mean = u = XΣN
sample mean = X = XΣn
MEDIAN
The median is the middle observation in a group of observations after arranging them inascending or descending order. If there are an even number of observations, the median is foundby taking the mean of the middle two values. Since the median is not affected by extreme values,it is the more appropriate measure of central tendency when there are extreme values in thedata.
MODE
The mode is the most frequently occurring observation in a group of data. A typical applicationof the mode would be to determine the most frequent cause or reason for some event when thecauses cannot be numerically measured.
59 FI0921

FRAME 43.
SUMMARY OF THE MEASURES OF DISPERSION
RANGE
The range is the difference between the highest and lowest values in a group of observations.The range is simple to compute but only considers the two extreme values. The range should beused only in cases where a quick, cursory look at the data is required.
STANDARD DEVIATION
The standard deviation is a unit of measure of dispersion. The more variability or scatter in agroup of data, the larger the standard deviation will be. Standard deviation is computed asshown.
Population Standard Deviation = =σ (X - u) Σ 2
N
Sample Standard Deviation = s = (X-X) Σ 2
n-1
Note that In the denominator, we are using n-1 rather than n. This expression, n-1, allows fordegrees of freedom (df). Df will not be discussed here because it is beyond the scope of thissubcourse. It is treated in inferential rather than descriptive statistics.
Proceed to the Practice Exercise for Lesson 2.
60 FI0921

LESSON 2
PRACTICE EXERCISE
SITUATION I: A review of the ten TDY travel vouchers filed by members of the Fort FlatlandComptroller Office during the last quarter was conducted recently. It was found the followingamounts (in dollars) were claimed from the airport: 14, 13, 9, 13, 11, 7, 6, 13, 6, 8. Note: Space towork the problems is provided at the end of this exercise.
Refer to Situation I to answer questions 1 through 5.
1. What is the MEAN cab fare?
A. $100.B. $10.C. $90.D. $13.
2. What is the MEDIAN cab fare?
A. $10.B. $13.C. $9.D. $18.
3. What is the MODE of this data set?
A. $3.B. $6.C. $10.D. $13.
4. What is the RANGE of this data set?
A. $7.B. $6.C. $9.D. $8.
5. What is the STANDARD DEVIATION of the cab fares for this data set?
A. $9.B. $90.C. $3.D. $3.16.
61 FI0921

SITUATION II: You are in charge of 28 keypunchers in the data conversion branch of theinstallation data processing center. You wonder how accurate your keypunchers are. A sampleof the work done by the keypunch section indicates the following number of errors per hundredcards punched: 2, 5, 9, 3, 5, 6, 2, 6, 5, 7. Note: Space to work the problems is provided at theend of this exercise.
Refer to SITUATION II to answer questions 6 through 10.
6. What is the MEAN of your sample?
A. 5.B. 6.56C. 50.D. 4.55
7. What is the MODE of your sample?
A. 6.B. 5.C. 5 and 6; it is bimodal.D. There is no mode.
8. What is the MEDIAN of your sample?
A. 4.B. 5.C. 6.D. 7.
9. What is the RANGE of your sample?
A. 4.B. 5.C. 6.D. 7.
10. What is the STANDARD DEVIATION of your sample?
A. 4.40B. 4.89C. 2.10D. 2.21
62 FI0921

USE THIS SPACE TO WORK YOUR PROBLEMS FOR LESSON 2.
SITUATION I and Questions 1-5.
SITUATION II and Questions 6-10.
63 FI0921

LESSON 2
ANSWER KEY AND FEEDBACK
Situation I
Construction of the table below facilitates computation of the measures of central tendency anddispersion. Note that the observations have been listed in ascending order.
X (X - u) (X-u) 2
6 -4 16 6 -4 16 7 -3 9 8 -2 4 9 -1 111 1 113 3 913 3 913 3 914 _4 16
X = 100Σ (X - u) = 0Σ (X-u)Σ 2 = 90
1. B Mean: = X = 100 = 10Σ (Frame 25)
2. A Median: 9 + 11 = 20 = 10. If you did not put the data in2 2
an ordered array, you would have obtained the wrong answer. (Frame 29)
3. D Mode: 13 (occurs 3 times) (Frame 31)
4. D Range = largest - smallest - 14 - 6 = 8 (Frame 34)
5. C Standard deviation σ = (X-u)2 = 90 = 9 = 3
N 10(Frame 36)
64 FI0921

Situation II
As was the case in I, a similar table for situation II is constructed below. Note that the X is usedinstead of u.
_X_ (X - X) (X-X) 2
2 -3 92 -3 93 -2 45 0 05 0 05 0 06 1 16 1 17 2 49 _4 16
X = 50Σ (X-X = 0Σ (X-X)2 = 44Σ
6. A Mean = X = XΣ = 50 = 5 (Frame 23)n 10
7. B Mode = 5 (occurs 3 times) (Frame 31)
8. B Median = 5 + 5 = 10 = 5 (Frame 29)2 2
9. B Range = 9 - 2 = 7 (Frame 34)
10. D Standard Deviation = s = (X X)Σ 2 (Frame 40)n-1
= 44 = 4.89 = 2.219
65 FI0921

LESSON 3
THE NORMAL CURVE
LEARNING OBJECTIVE
When you have completed this lesson, you should be able to perform the following task:
Actions: Identify and define the six characteristics of the normal curve and apply thenormal curve to decision making situations.
Conditions: You will be given several questions and problems dealing with the normalcurve. You may use Lesson 3, The Normal Curve, which explains the topic.
Standards: Your explanations and solutions will be in accordance with the instructionsin this subcourse.
FRAME 44.
INTRODUCTION
The distribution which occurs most frequently in nature is called the NORMAL DISTRIBUTION.
It occurs so often and in such diverse situations that mathematicians have carefully documentedand quantified its characteristics. Examples of situations which are closely approximated by thenormal distribution include: human characteristics, such as height, weight, and IQ; the outputs ofmany physical processes, such as the actual amount of paint put into a 'gallon' can; and theresults of human activity, such as consumer demand or a product.
67 FI0921

FRAME 45.
CHARACTERISTICS OF THE NORMAL CURVE
There are six characteristics of the normal curve which, when combined, make it differentfrom any other type of distribution.
First, it is SYMMETRICAL around the arithmetic mean. In other words, the half on each side ofthe mean will exactly fit the other half when 'flipped over." Both identically shaped halves of thecurve together take on the general shape of a bell.
FRAME 46.
Second, the tails at each end of the normal distribution get closer and closer to the base line,the farther they are from the mean. The tails never touch the base line, however. We say the tailsare asymptotic to the horizontal axis. This allows for extreme values - the three foot midget, theeight foot giant, very low expenses, or very high expenses, whichever the case may be.
68 FI0921

QUESTION A:
Which of the following distributions is symmetrical?
CURVE A: CURVE B:
QUESTION B:
Which of the following appears to be a normal curve?
CURVE A CURVE B

69 FI0921

ANSWER TO A.
Curve A is symmetrical because the left half is identical to the right half. This is not true for
curve b.
ANSWER TO B.
Curve B appears to be a normal curve because the tails get closer to but do not touch thebase
line. The tails on curve A are definitely touching the horizontal axis or base line.
70 FI0921

FRAME 47.
Third, the mean, median and mode all lie at the center of the normal distribution. The mean isan arithmetic average that is computed from all the values, and reasonably lies in the middle. Themedian divides the distribution into two equal parts: half greater, half smaller than the median.The mode is the most frequently occurring observation. By symmetry (the first characteristic)half the observations must lie on either side of the mean. So the mean, and the median are thesame. The height of the curve at any point is the frequency (number of occurrences), so themode must occur at the highest point on the curve. This must be the point that divides the curveinto two equal parts. So the mean, median, and mode all lie at the same place - the center - ofthe normal curve.
QUESTION:
A. If the curve was not normal, which measure of central tendency would indicate the highest
point? _______________________________
B. If the curve was not normal, which measure of central tendency would divide the areaunder
the curve in half? _________________________
71 FI0921
ANSWER TO FRAME 47.
A. The mode would indicate the highest point because the height represents the frequency.
B. The median divides the distribution in half. Half the items in the distribution are greaterthan
the median, half are less than the median.
72 FI0921
FRAME 48.
Fourth, the total area under the curve is one or 100%. All the items in the distribution arerepresented under the curve. The normal curve represents the shape of all the observations inthe population.
QUESTION:
Are all the elements of a normal population represented by the normal
curve? ____________________________
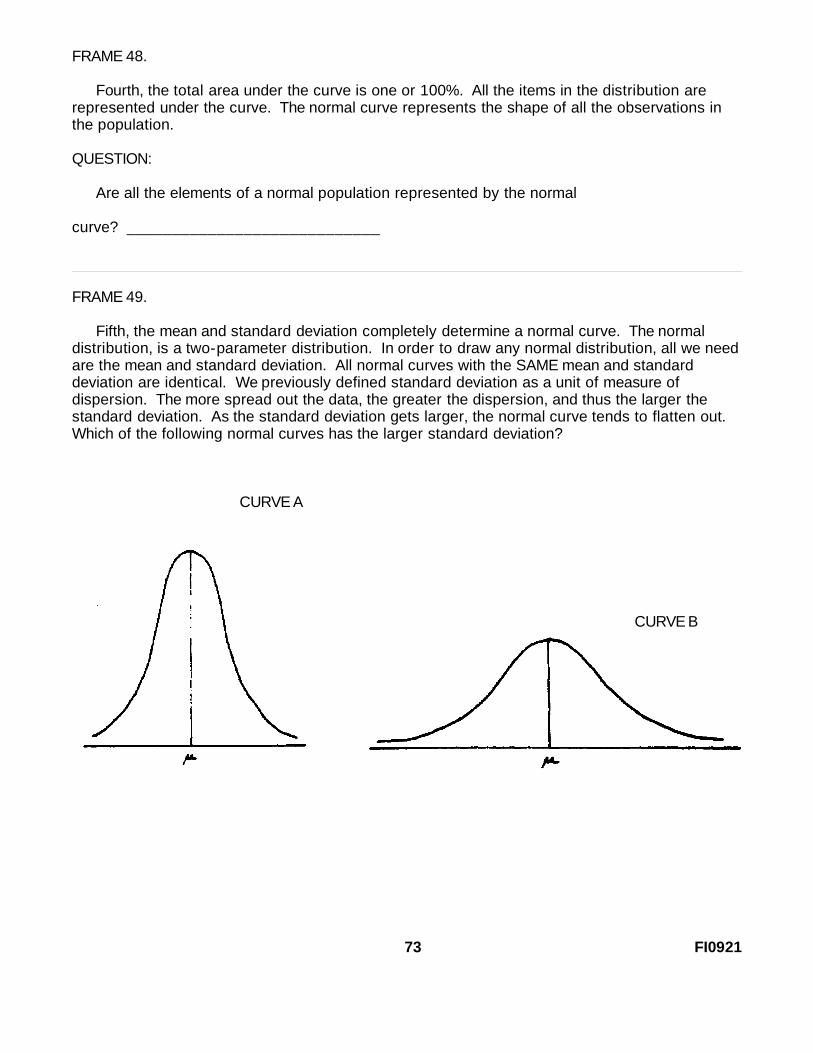
FRAME 49.
Fifth, the mean and standard deviation completely determine a normal curve. The normaldistribution, is a two-parameter distribution. In order to draw any normal distribution, all we needare the mean and standard deviation. All normal curves with the SAME mean and standarddeviation are identical. We previously defined standard deviation as a unit of measure ofdispersion. The more spread out the data, the greater the dispersion, and thus the larger thestandard deviation. As the standard deviation gets larger, the normal curve tends to flatten out.Which of the following normal curves has the larger standard deviation?
CURVE A
CURVE B
73 FI0921

ANSWER TO FRAME 48.
Yes. By definition, 100% (or all) of the observations of a normal population are includedunder
the normal curve.
ANSWER TO FRAME 49.
Curve B because it appears flatter or more spread out than Curve A.
74 FI0921

FRAME 50.
We might say that standard deviation specifies the shape (flat, peaked) of the normal curve.The mean, then, determines the location of the normal curve along the horizontal base line. Twonormal curves may have exactly the same standard deviation (and thus the same shape) but havedifferent means and thus be centered at different locations along the baseline. For example, let'slook at two curves which both have a standard deviation of 2 inches. Curve A has a mean of 56inches and Curve B has a mean of 66 inches. The curves would appear as follows along thesame continuum or baseline:
CURVE A CURVE B
QUESTION:
How would you specify the shape and the location of a normal curve?
75 FI0921

ANSWER TO FRAME 50.
The STANDARD DEVIATION specifies the shape of a normal curve and the MEAN specifies
the location of a normal curve along the base line.
76 FI0921
FRAME 51.
The sixth characteristic relates horizontal distances on the base line to areas under thenormal curve.
Thus far we have measured the horizontal base line in terms of the unit of measure we aredealing with in the specific problem: dollars, inches, etc. It would be more convenient if we coulduse the same unit of measure for all problems. Our unit of measure for dispersion, the standarddeviation, is used to measure this horizontal distance. When using standard deviations, wealways measure from the mean of the distribution. Thus we can find a relationship between thearea under the normal curve and the number of standard deviations measured from the mean.
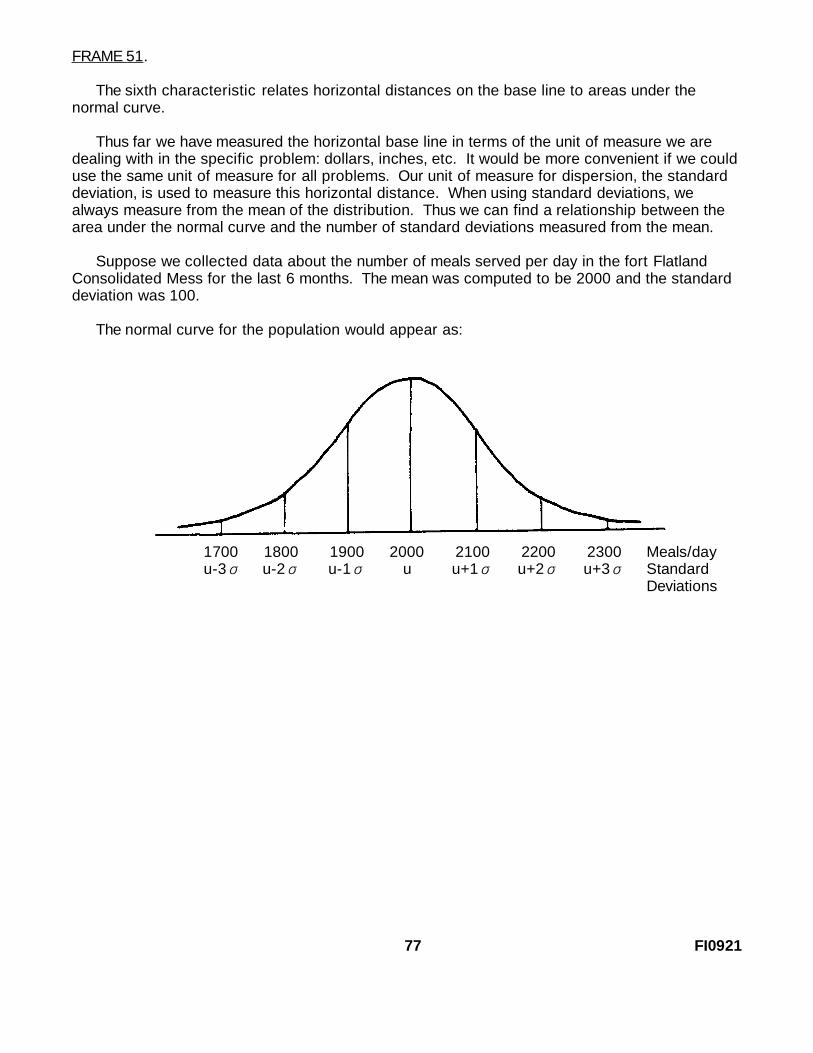
Suppose we collected data about the number of meals served per day in the fort FlatlandConsolidated Mess for the last 6 months. The mean was computed to be 2000 and the standarddeviation was 100.
The normal curve for the population would appear as:
1700 1800 1900 2000 2100 2200 2300 Meals/dayu-3σ u-2σ u-1σ u u+1σ u+2σ u+3σ Standard
Deviations
77 FI0921

FRAME 52.
THE EMPIRICAL RULE
Notice the curve has two horizontal scales; one measured in meals/day and the othermeasured in standard deviations from the mean. The distance 2000 to 2200 is the same as thedistance u to u +2 A special relationship exists between the area under the normal curve andσthe horizontal distance from the mean measured in standard deviations.
This relationship is the sixth characteristic of a normal curve and is commonly referred to asthe Empirical rule.
The rule states that: a) the area under the normal curve from u -a to u + is approximatelyσ68% of the total area under the curve. b) the area under the normal curve from u -2 to u + 2σ σis approximately 95%. c) the area under the normal curve from u -3 to u + 3 isσ σapproximately 99.7%.
The following diagram illustrates this Empirical rule:
78 FI0921

FRAME 53.
Since the normal curve is symmetric, we know that half of these areas will lie on either side ofthe mean. The areas for the right side are shown in the diagram below:
The areas for the left side are exactly the same as for the right side.
QUESTION:
What percentage of the area under the curve lies between:
a. u - 1 and u + 1 σ σ ? ______
b. u - 2 and u + 2 σ σ ? ______
c. u - 3 and u + 3 σ σ ? ______
d. u - 1 σ and u ? ______
e. u and u + 1 σ ? ______
f. u - 1 and u + 2σ σ ? ______
79 FI0921

ANSWER TO FRAME 53.
a. 68%
b. 95% by the EMPIRICAL rule
c. 99.7%
d. 34%
using the symmetrycharacteristic
e. 34%
f. 34% + 47.5$% = 81.5% In this case we identify the area under the curve on each sideof the man and add the areas.
80 FI0921

FRAME 54.
Suppose we want to find the area under the curve between u + 1 and u + 2 . This areaσ σ
cannot be measured directly because one edge doesn't lie on the mean. Since the relationship
between the area under the curve and the distance on the horizontal base line is measured from
the mean, this area must be found indirectly. we can find the area from u to u + 2 (47.5%) andσ
the area from u + 1 (345). The area from u to u + 2 includes the area from u to u + 1 . 8yσ σ σ
subtracting the smaller area from the larger area we eliminate this common area. what's left is
the area from u + 1 to u + 2 , or 47.5% - 34% - 13.5%.σ σ
QUESTION:
What is the area under the curve from u - 2 to u - 3 ? Draw a diagram and shade the area in σ σ
question.
81 FI0921
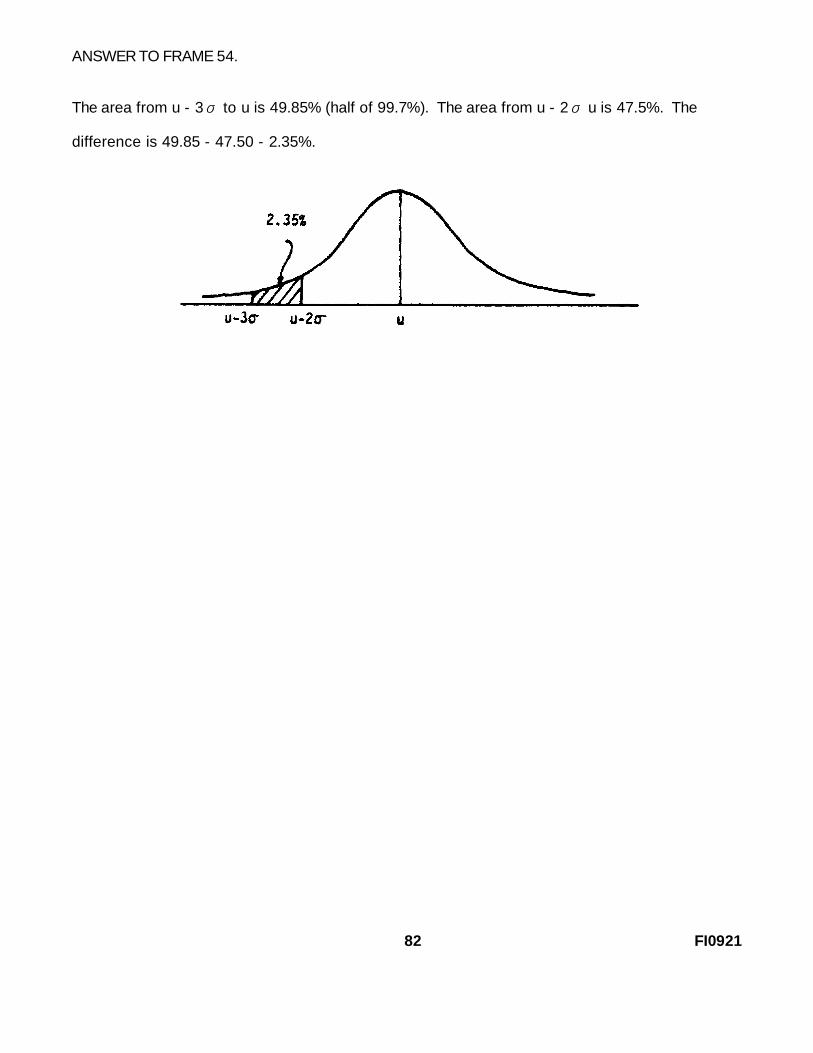
ANSWER TO FRAME 54.
The area from u - 3 to u is 49.85% (half of 99.7%). The σ area from u - 2 u is σ 47.5%. The
difference is 49.85 - 47.50 - 2.35%.
82 FI0921

FRAME 55.
One of the characteristics of the normal curve is that the area under the curve is 100%. By
symmetry, 50% of the area lies above the mean and 50% lies below the mean. We need this
characteristic to answer the following type of question:
What area lies under the normal curve from u + 1 to as far to the right as the curve goes?σ
Since the tails of the curve approach, but never touch the horizontal base line, the curve extends
infinitely far in both directions and we have to answer the question indirectly. We do know that
half of the area lies to the right of the mean. The area from u to 1 we know is 34%. Theσ
difference 50% - 34% = 16% is that area in the right half of the curve that lies above u + 1 .σ
The shaded area is referred to as the right tail of the curve.
83 FI0921

ANSWER TO FRAME 55 .
The diagram would be:
84 FI0921

FRAME 56.
What is the area under the curve in the left tail below u - 2 ? Include a diagram and shadeσ
the area in question.
85 FI0921
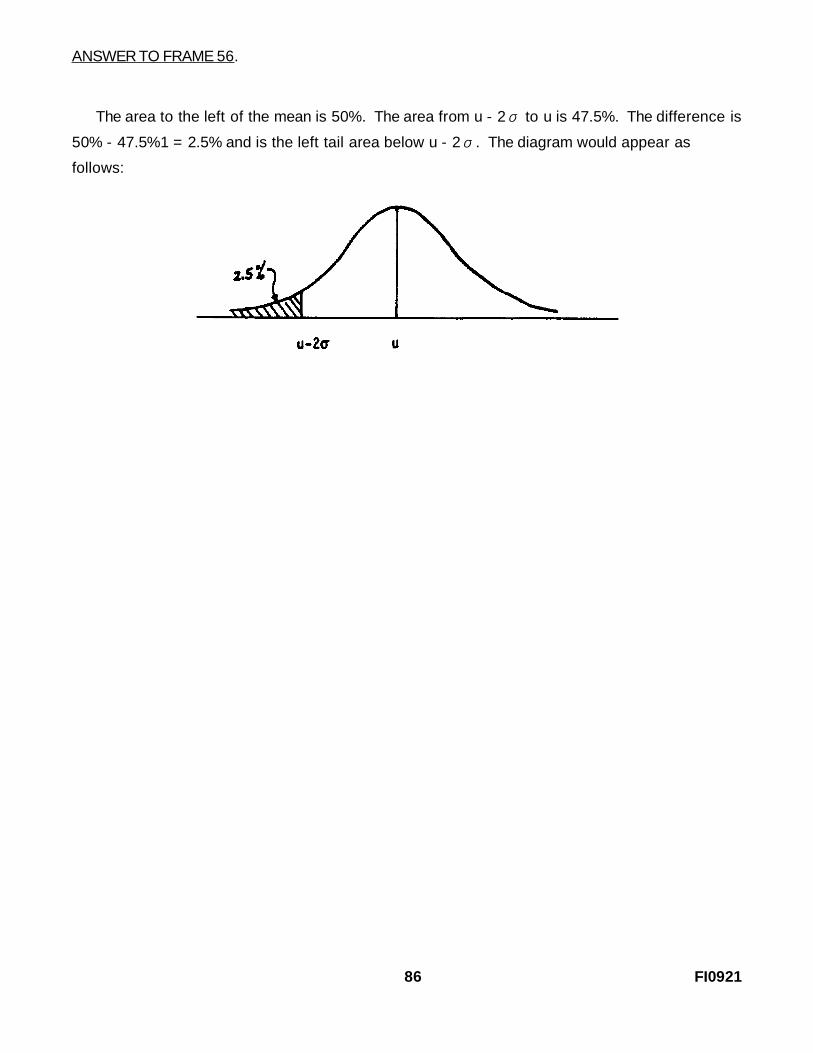
ANSWER TO FRAME 56.
The area to the left of the mean is 50%. The area from u - 2 to u is 47.5%. The difference isσ
50% - 47.5%1 = 2.5% and is the left tail area below u - 2 . The diagram would appear asσ
follows:
86 FI0921
FRAME 57.
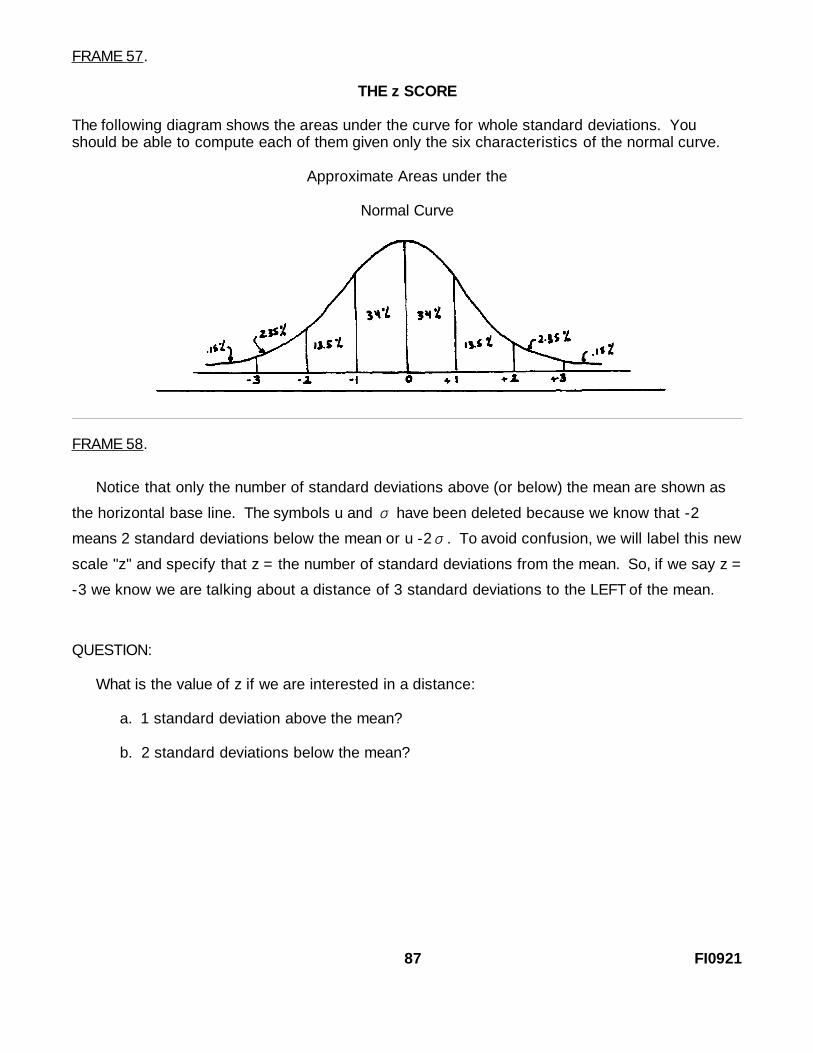
THE z SCORE
The following diagram shows the areas under the curve for whole standard deviations. Youshould be able to compute each of them given only the six characteristics of the normal curve.
Approximate Areas under the
Normal Curve
FRAME 58.
Notice that only the number of standard deviations above (or below) the mean are shown as
the horizontal base line. The symbols u and have been deleted because we know that -2σ
means 2 standard deviations below the mean or u -2 . To avoid confusion, we will label this newσ
scale "z" and specify that z = the number of standard deviations from the mean. So, if we say z =
-3 we know we are talking about a distance of 3 standard deviations to the LEFT of the mean.
QUESTION:
What is the value of z if we are interested in a distance:
a. 1 standard deviation above the mean?
b. 2 standard deviations below the mean?
87 FI0921
ANSWER TO FRAME 58.
a. = +1
b. = -2
FRAME 59 .
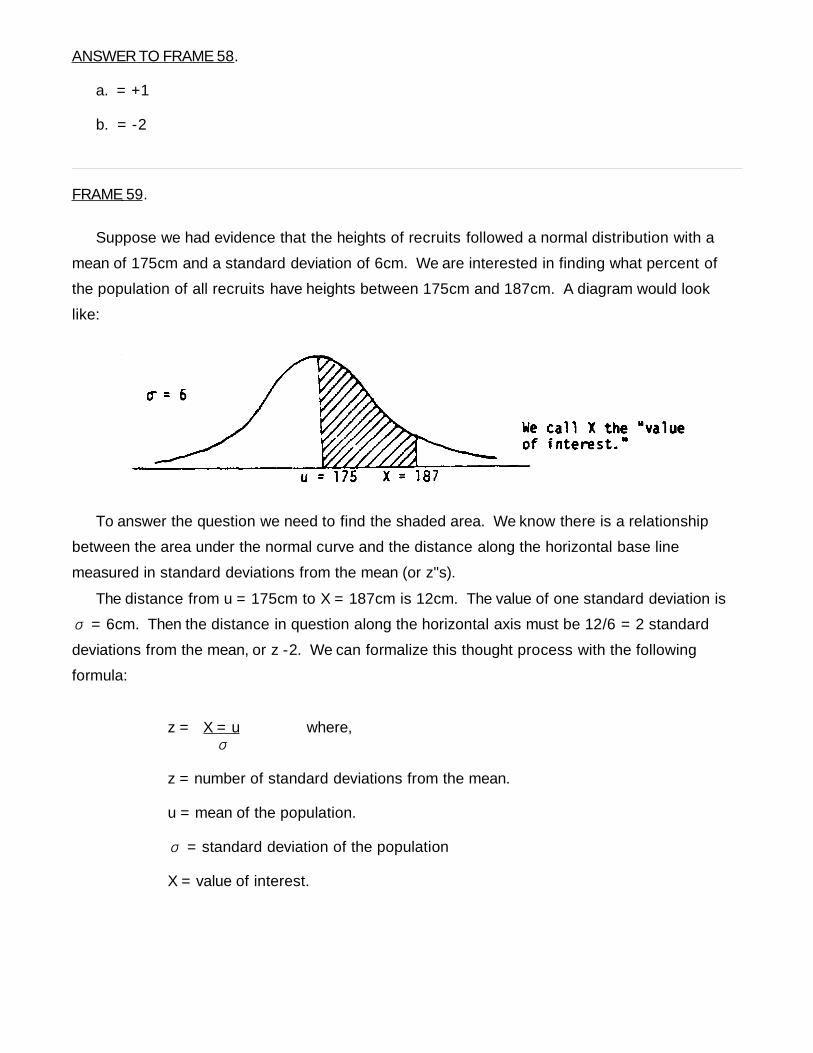
Suppose we had evidence that the heights of recruits followed a normal distribution with a
mean of 175cm and a standard deviation of 6cm. We are interested in finding what percent of
the population of all recruits have heights between 175cm and 187cm. A diagram would look
like:
To answer the question we need to find the shaded area. We know there is a relationship
between the area under the normal curve and the distance along the horizontal base line
measured in standard deviations from the mean (or z"s).
The distance from u = 175cm to X = 187cm is 12cm. The value of one standard deviation is
= 6cm. Then the distance in question along the horizontal axis must be 12/6 = 2 standardσ
deviations from the mean, or z -2. We can formalize this thought process with the following
formula:
z = X = u where,σ
z = number of standard deviations from the mean.
u = mean of the population.
= standard deviation of the populationσ
X = value of interest.

88 FI0921

FRAME 60.
Further, we know that the area under the curve for z = 2 is about 47.5% by the Empirical rule.
In a similar manner, find the percentage of recruits that have heights between 169 cm and175 cm.
Draw a diagram and shade the area of interest.
89 FI0921

ANSWER TO FRAME 60.
The diagram would appear as:
Convert the distance from X = 169 to u - 175 into a number of z's by using the relationship:
z = X - u = 169 - 175 = -6 = -1σ 6 6
Thus X = 169cm and lies 1 standard deviation below the mean. This corresponds to an area of
about 34%.
90 FI0921

FRAME 61.
When z is a whole number, the Empirical rule can be used to estimate the appropriate area
under the normal curve. What happens if z is not a whole number? Suppose we needed to know
the percent of recruits with heights between 175cm and 185cm. Using the z equation, we would
get z = X - u = 185 - 175 = 10 = 1.67. There is no value in the Empirical rule for 1.67standard σ 6 6deviations above the mean. Interpolating (finding the value 2/3 of the way between 1 and 2
standard deviations) would cause a large error because the normal curve is not a straight line.
Computing the area using a pocket calculator would be a lengthy and tedious task. The easiest
and most common method is to look up the area in a table. Such a table, titled AREAS UNDER
THE STANDARD NORMAL CURVE, is on the next page.
91 FI0921

92 FI0921

FRAME 62.
To find the area for z = 1.67, find 1.67 in the perimeter of the table. The units and tenthsdigits (1.6) determine the row and the hundredths digit (.07) determines the column. The value atthe intersection (.4525) is the area under the curve for a distance 1.67 standard deviations abovethe mean. The diagram below demonstrates how the area was found:
z 0 1 2 3 4 5 6 70.0 * * * * * * * ****1.6 .4452 .4463 .4474 .4484 * * * .4525
In a similar manner we would find the area under the normal curve from the mean to z = 2.51 tobe .4940. Find 2.51 in the perimeter of the table and, at the intersection of the 2.5 row and .01column, read the area .4940. If the value of z is negative, it simply means the area is to the left ofthe mean. We can ignore the sign and find the area under the curve as before. To precludeinterpolating between two z values, always round to two decimal points. The z value will berounded up if it is 5 or greater, or rounded down if it is 4 or less. Indicated below are examplesof rounding the z value.
Original z Value Rounded Area
1.2340 1.23 .39071.6667 1.67 .45252.4934 2.49 .4936
The normal curve table gives areas under the curve for a number of standard deviations (z's)measured from the mean.
FRAME 63.
Find the areas under the curve associated with the following values for z:
a. 1.34
b. 2.69
c. 1.00
d. 3.00
e. -.09
93 FI0921

ANSWER TO FRAME 63.
a. .4099 or 40.99%
b. .4964 or 49.64%. The minus sign indicates this is to the left or "below" the mean.
c. .3413 or 34.135. The Empirical rule gave an estimate of 34% -- very close.
d. .4987 or 49.875. Again very close to the Empirical rule value.
e. .0359 or 3.59%
94 FI0921
FRAME 64.
It is good procedure to draw a picture or diagram of the problem that includes all availableinformation. The diagram makes it easier to visualize which part of the normal curve you areinterested in. Also, after solving the problem, the diagram serves as a quick check to see if youranswers are reasonable."
You are responsible for ordering uniforms for the 10,000 recruits expected to be trained atFort Flatland next year. Size of the uniforms ordered depends on height in centimeters. Thereare five sizes available. Please note that our sizes overlap at the extremes (end of one, beginningof the other). We are using numbers here that are easily manipulated when performing thenecessary subtractions and divisions. You should assume, then, that we are dealing with fivegradations where size A ends at 164.9 and size 8 begins at 165, and so on. In doing thecomputations, however, use the numbers that are given.
Size A fits recruits having a height of 165cm or less.
Size B fits recruits 165cm to 173cm tall.
Size C fits recruits 173cm to 180cm tall.
Size D fits recruits 180cm to 191cm tall.
Size E fits recruits 191cm or taller.
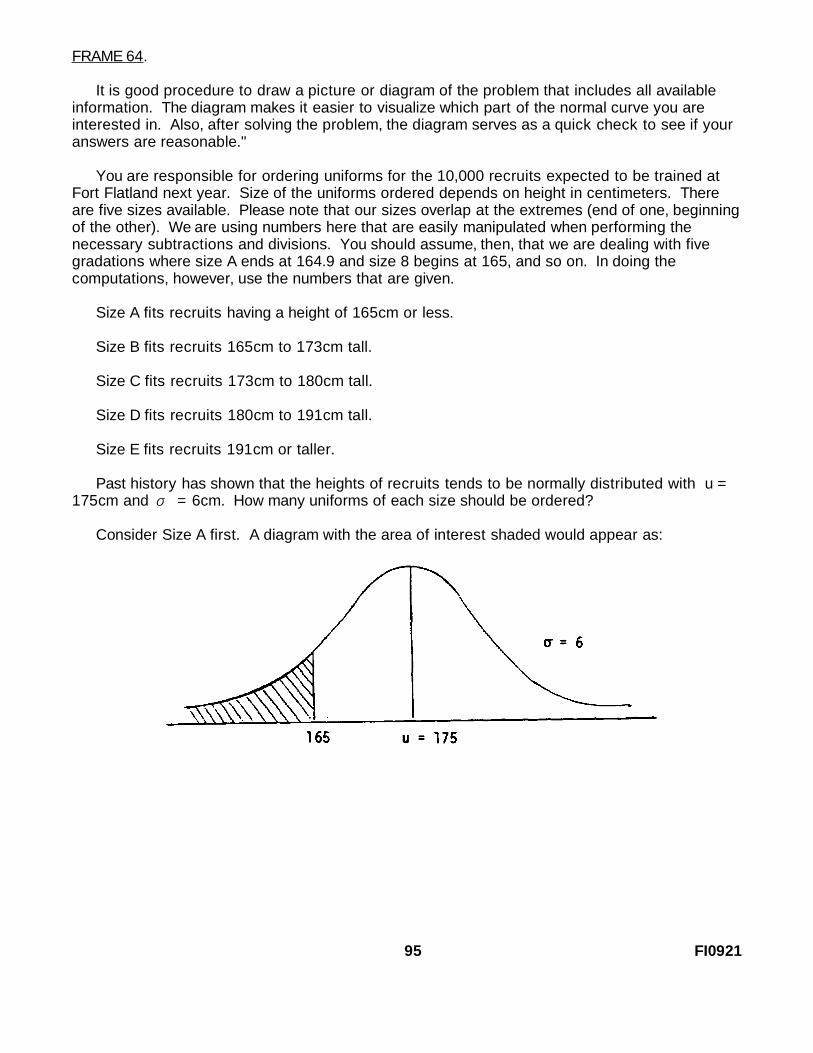
Past history has shown that the heights of recruits tends to be normally distributed with u =175cm and σ = 6cm. How many uniforms of each size should be ordered?
Consider Size A first. A diagram with the area of interest shaded would appear as:
95 FI0921
FRAME 65.
To find the shaded area we first find the area from 165cm to 175cm because we alwaysmeasure standard deviations from the mean. Using the z equation
z = X - u = 165 - 175 = -10 = -1.67σ 6 6
The table value for the area under the normal curve corresponding to -1.67 standard deviationsfrom the mean is .4525. The total area to the left of the mean is .5000, so the area of interest is .5000-.4525 = .0475 (4.75%). Thus, we can expect 475 (.0475 X 10,000 - 475) recruits to requireSize A uniforms.
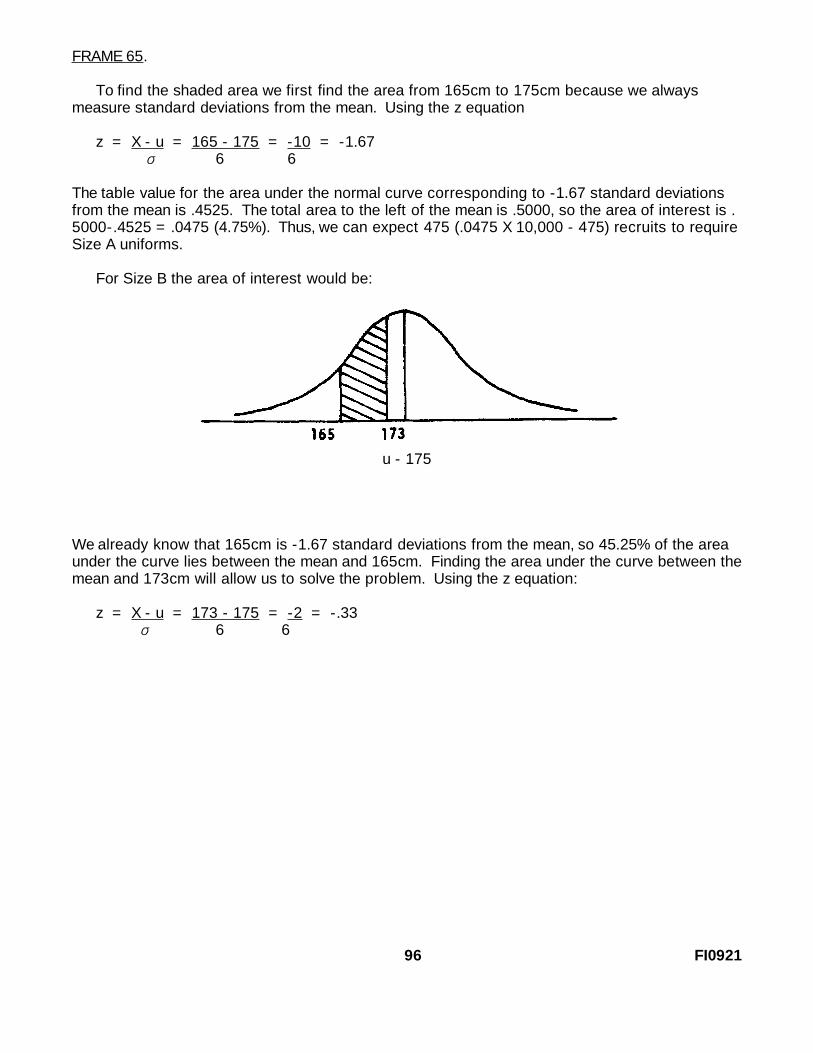
For Size B the area of interest would be:
u - 175
We already know that 165cm is -1.67 standard deviations from the mean, so 45.25% of the areaunder the curve lies between the mean and 165cm. Finding the area under the curve between themean and 173cm will allow us to solve the problem. Using the z equation:
z = X - u = 173 - 175 = -2 = -.33σ 6 6
96 FI0921

FRAME 66.
The table value for the area under the normal curve corresponding to -.33 standard deviationfrom the mean is .1293. The area between 165cm and 173cm is .4525 - .1293 = .3232. Thus wecan expect 32.32% of the 10,000 recruits to require Size B uniforms, which is 3,232. For Size Cthe area of interest would be:
u = 175
We already know that 12.93% of the area lies between 173cm and 175cm. Using the zequation we can find the number of standard deviations from u = 175cm to 180cm:
z = X - u = 180 - 175 = 5 = .83σ 6 6
The table value for .83 standard deviations above the mean is .2967. Then the area between173cm and 180cm is .1293 + .2967 = .4260. We would expect 42.60% of the recruits to requireSize C uniforms. Thus, we can expect 4,260 (.426 x 10,000 = 4,260) recruits to require Size Cuniforms.
QUESTION:
What percent of the recruits would take a Size D uniform? Draw the diagram.
97 FI0921
ANSWER TO FRAME 66.
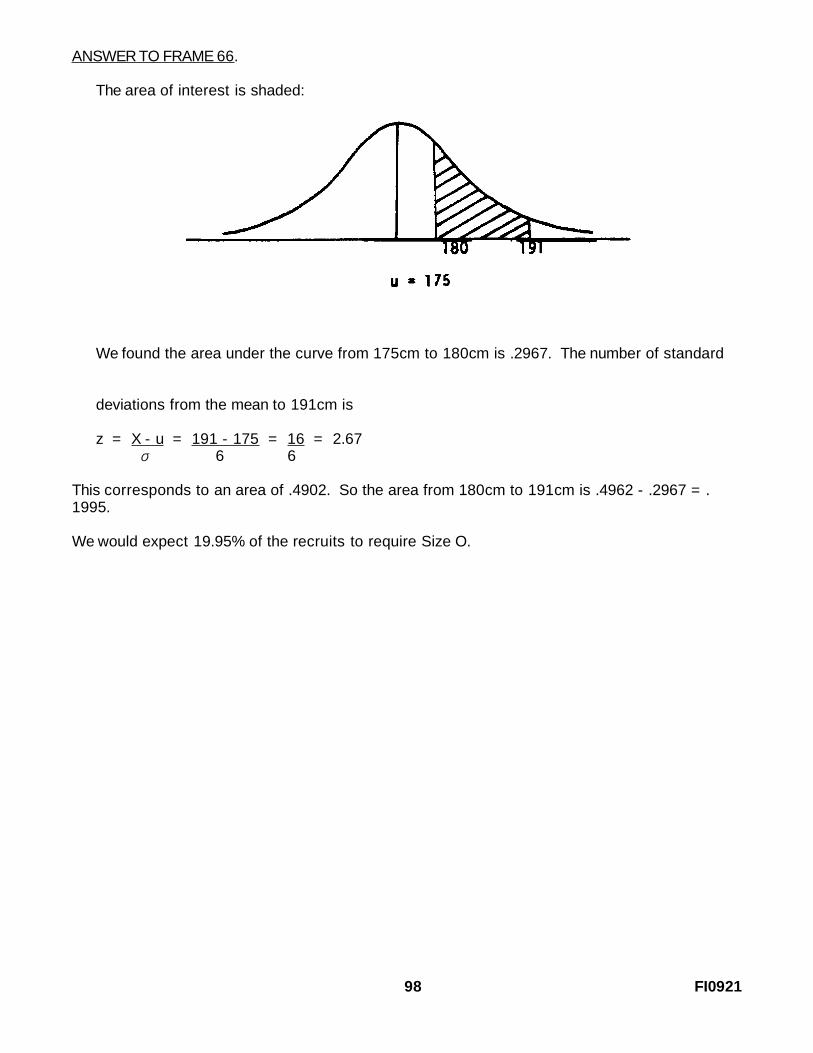
The area of interest is shaded:
We found the area under the curve from 175cm to 180cm is .2967. The number of standard
deviations from the mean to 191cm is
z = X - u = 191 - 175 = 16 = 2.67σ 6 6
This corresponds to an area of .4902. So the area from 180cm to 191cm is .4962 - .2967 = .1995.
We would expect 19.95% of the recruits to require Size O.
98 FI0921


FRAME 67.
How many of the recruits would wear a Size E uniform? Draw the diagram.
99 FI0921

ANSWER TO FRAME 67.
The area of interest is shaded:
u = 175
We found the area under the curve from the mean to 191cm was .4962. Since 50% of the area
falls to the right of the mean, the area from 191cm or greater is .5000 - .4962 = .0038. There are
10,000 recruits expected, so (10,000) (.0038) · 38 recruits who would require a Size E uniform.
100 FI0921

ANSWER TO FRAME 68.
A summary of the number of uniforms for each size is indicated below.
Size __%__ # of Uniforms
A 4.75 475B 32.32 3232C 42.60 4260D 19.95 1995E ____.38 ____38
TOTAL 100.00 10,000
Note that the total % is 100% which is the fourth characteristic of the normal curve asindicated earlier in the lesson (page 73).
101 FI0921

FRAME 69.
Often we know the area under the curve and want to find the associated values on thehorizontal base line. For example, the middle 80% of all trainees could be expected to haveheights between what two values? Unless otherwise specified, it is assumed the given area iscentered on the mean. A diagram would appear as follows:
u = 175
The shaded area is 801 (in this case) of the total area and the distance from a to 175cm is thesame as the distance from 175cm to b. We want to find values for a and b. By symmetry, theshaded area on each side of the mean is 40% (half of 80%). Recall the construction of the tableof areas under the normal curve. The perimeter values give standard deviations and the body ofthe table gives areas. In this case, we will work in the opposite direction. Instead of knowingstandard deviations and looking up the corresponding area, we will know the area and look upthe corresponding standard deviation. In our example, we will look up an area of .4000. From thetable we see that no entry is exactly .4000. We will use the higher z value if the area (%) fallsbetween two areas (%) on the table. For an area of .4000, the z value would be 1.29.
Initial Area Lower Area (A) Higher Area (%) Value__Value__ __and Value__ __and Value__ Selected
.4500 .4495 .45051.64 1.65 1.65
.4000 .3997 .40151.28 1.29 1.29
.3400 .3389 .3413.99 1.00 1.00
.2500 .2486 .2518.67 68 .68
.2075 .2054 .2088.54 55 .55
102 FI0921

FRAME 70.
The z equation can be manipulated algebraically. Since a and b are the values of interest, we willuse them instead of X:
Below the Mean Above the Mean
1. - z = a - u z = a b - uσ σ
2. - z = a - uσ z = b - u σ Multiply bothsides by σ
3. u - z = aσ u + z = b σ Add u to bothsides.
As before, -z is used to denote standard deviations below the mean, and z is used to denotestandard deviations above the mean.
We know 3 of the values in equation 3: u = 175, z = 1.29, and = 6. Given this informationσwe can compute a and b.
a = u - z σ b = u + z σ
a = 175 - (1.29) (6) b = 175 + (1.29) (6)
a = 175 - 7.74 b = 175. + 7.74
a = 167.26 b = 182.74
Thus, we can say that the middle 80% of the recruits have heights between 167.26cm and182.74cm.
The middle 95% of all trainees could be expected to have heights between what two values? Usethe table of areas under the normal curve to find the values. Draw the diagram.
103 FI0921
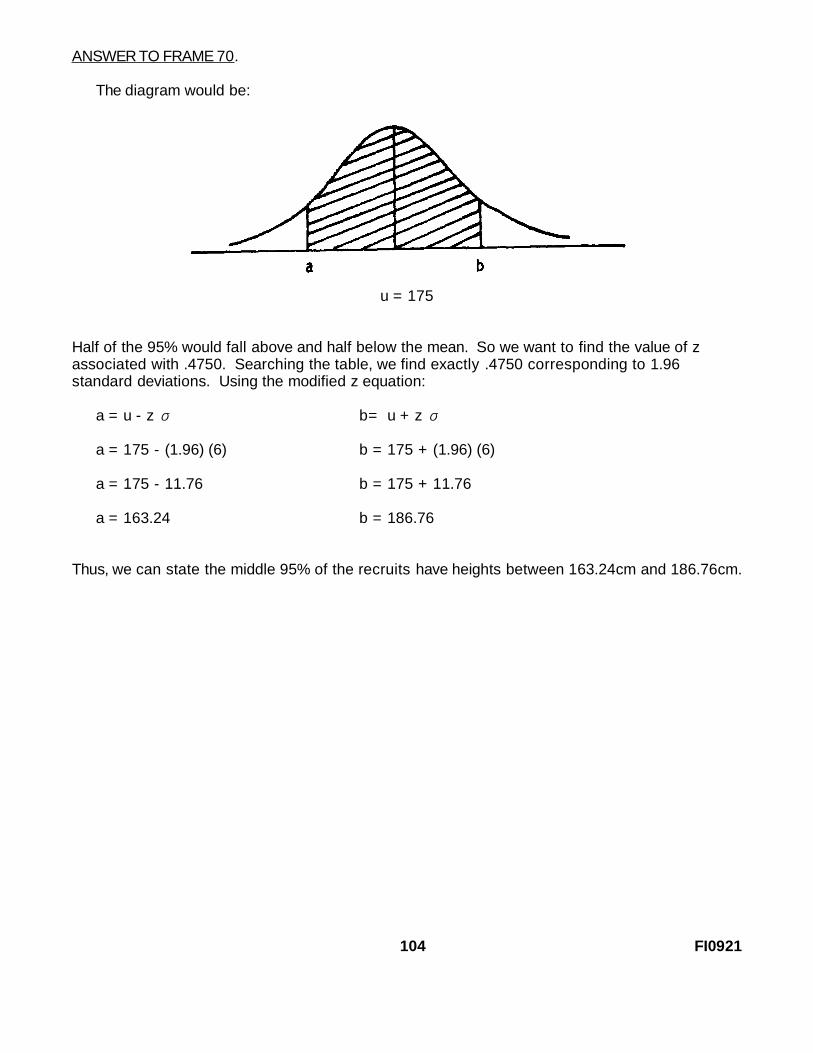
ANSWER TO FRAME 70.
The diagram would be:
u = 175
Half of the 95% would fall above and half below the mean. So we want to find the value of zassociated with .4750. Searching the table, we find exactly .4750 corresponding to 1.96standard deviations. Using the modified z equation:
a = u - z σ b= u + z σ
a = 175 - (1.96) (6) b = 175 + (1.96) (6)
a = 175 - 11.76 b = 175 + 11.76
a = 163.24 b = 186.76
Thus, we can state the middle 95% of the recruits have heights between 163.24cm and 186.76cm.
104 FI0921

FRAME 71.
We can also find the value on the horizontal base line when we are given the areas under thecurve less than or greater than that amount. For instance, suppose we wanted to find the heightbelow which 90% of all trainees fell. We would draw a diagram as follows:
find b when the shaded area is 90%, we must first determine the area between u and b. Sincethe entire area is 90%, and the area below u is 50%, the area between u and b is: 90% - 50% =40%. Converting to decimal form, we look in the table for .4000. As you might recall, that areafalls between .3997 (z= 1.28) and .4015 (z= 1.29). Our rule says that we must use the larger zvalue if our area falls between two areas on the table, so z = 1.29 for an area of .4000.
Using the formula from Frame 70 for values above the mean:
b = u + z σ
= 175 + 1.29 (6)
= 182.74
In other words, 90% of the time, recruits will be less than or equal to 182.74cm in height.
QUESTION:
Above what height will 95% of all recruits be? _______________________________
105 FI0921

ANSWER TO FRAME 71.
The area between a and u is: 955 - 505 = 45.The z value for .4500 is 1.65. Therefore:
a = 175 - 1.65(6) = 175 - 9.9 = 165.10
Thus, 95% of the time, recruits will be at or above 165.10 cm in height.
106 FI0921

FRAME 72.
In summary, the normal distribution has the following 6 characteristics:
1. It is symmetrical around the mean.
2. The tails of the curve are asymptotic, that is, they approach but never touch the base line.
3. The mean, median, and mode all lie at the center of the curve.
4. The area under the curve is 1.00 or 100%.
5. The mean determines the location of the center of the distribution and the standarddeviation determines the shape of the distribution.
6. The Empirical rule relates areas under the curve to horizontal distances on the baseline byusing the following approximations:
a. u + 1 encompasses about 68%.σ
b. u + 2 encompasses about 95%.σ
c. u + 3 encompasses about 99.7%.σ
Schematically, the Empirical rule would appear as follows:
The Empirical rule only reflects approximations whereas the normal curve table is moreprecise. The Empirical rule provides a quick analytical tool when the normal curve table is notavailable, such as in a meeting or a review and analysis. The z equation can be used to convertdistances from the mean in any unit of measure to our standard unit of measure, standarddeviations from the mean. The equation is z = X - u divided by , where z is the number ofσstandard deviations from the mean. Expressed symbolically, z = X - u
σ
We use the table of areas under the standard normal curve, or the Empirical rule, to find thearea under the curve between the mean and z. The Normal Curve Table is the more preferredchoice.
Proceed to the Practice Exercise for Lesson 3.
107 FI0921

LESSON 3
PRACTICE EXERCISE
REQUIREMENT: Answer the following seven (7) problems below.
Situation: An analysis of your organization's self-service supply account expenditures for thelast year indicates an average monthly expense of $2370 with a standard deviation of $375.Your experience has been that self-service accounts tend to be normally distributed and there isno reason to doubt this is the case for your current organization.
1. What percent of the time will your monthly expenditures exceed $2500?
2. How often will expenses be less than $1995 in a month?
3. You would expect expenditures to be between $2400 and $2600 what percent of the time?
4. Between what two values around the mean would you expect expenditures to be 80% of thetime?
108 FI0921

5. Between what two values around the mean would you expect expenditures to occur 95% ofthe time?
6. What should you budget if you wanted to be 90% sure of having enough money to cover yoursupply expense for a given month?
7. What should you budget if you wanted to be 95% sure of having enough money to cover yoursupply expense for a given month?
109 FI0921

LESSON 3
ANSWER KEY AND FEEDBACK
z = X - u = 2500 - 2370 = 130 = .35 σ 375 775
From table: z = .35,area = .1368or 13.68%
Since this is the area between u and X, we must subtract it from 50% to get the shaded area:
50% - 13.68% = 36.32%
There is a 36.32% chance of exceeding $2500. (Reference: Frame 65.)
2. z = 1995 - 2370 = -375 = -1.0375 375
Using the Empirical rule, the area between u and X is 34%. Therefore, we would have ashaded area of 50% - 34% = 16%. (Reference Frame 56.) Using the table, the area between uand X is 34.13%, so the shaded area of interest would be 50% - 34.13% = 15.87%. (ReferenceFrames 61-64.)
From the table, there is a 15.87% chance of getting an expense that is less than $1,995.
110 FI0921

3. z = X1 - u = 2400 - 2370 = .08σ 375
area = .0319 or 03.19%
Z = x2-u = 2600 - 2370 = .61σ 375
area = .2291 or 22.91%
In order to find the shaded area, we must subtract the smallest area from the largest: 22.91%- 3.19% = 19.72%.
There is a 19.72% chance that the supply expenditures for a given month are between $2400 and$2600. (Reference: Frames 67-68.)
4.
Area is 80%/2 = 40% or .4000, Therefore, z = 1.29.
b = u + z = 2370 + 1.29 (375) = $2853.75σ
a = u - z = 2370 - 1.29 (375) = $1886.25σ
80% of the time, supply expenses will be between $1886.25 and $2853.75. (Reference:Frames 69-70.)
111 FI0921

5.
This is the same as problem 4, except z = 1.96a = u - z =σ 2370 - 1.96(375) = 1635
b = u + z = 2370 + 1.96(375) = 3105σ
6.
For this problem, the area between u and b is 90% - 50 = 40%. Therefore, z = 1.29 (seeproblem 4) and b = $2370 + 1.29 ($375) = $2853.75. Reference: Frame 71.)
7.
Same as problem 6, except the area between u and b is 951 - 50% = 45%. Therefore, z =1.65 (.4500 or table between .4495 and .4505) and b = $2370 + 1.65 ($375) = $2988.75.(Reference: Frame 71.)
112 FI0921


![Addmath : f4ch11 - Index Numbers [v4]](https://img.dokumen.tips/doc/110x75/55cf8f7d550346703b9ce5fd/addmath-f4ch11-index-numbers-v4.jpg)


