Embed Size (px)
Citation preview
1
Chapter 12
Index Numbers
Chapter 12. Index Numbers
Definition of Index Numbers
Definition: An index number is a summary measure designed toshow changes in the value of a variable (or morecommonly, a group of related variables taken as whole)over a period of time, or geographic location, or someother characteristic.
Note: A simple relative is an example of an index number.
2
Chapter 12. Index Numbers
Three Major Indexes in Economics and Business
The price index is a summary measure that combines the price changes for a group of items, using weights to give each item its appropriate importance. Example: The consumer price index (CPI) measures the combined effect of price changes in many goods and services purchased by households with 1994 as base year (as last revised).
The quantity index is a summary measure of relative changes over time in the quantities or volume of some measurable characteristic such as production, sales, inventories, or consumption of a specific commodity or group of commodities. Example: The volume of production index (VoPI) monitors the changes in the quantity of a commodity produced or manufactured by the establishments.
The value index are summary measures of relative changes over time in the value (price of commodity x quantity consumed) of a commodity or group of commodities. Example: The All Shares Index of the Philippines Stock Exchange tracks the changes in total market capitalization (last traded price x outstanding shares) of all the common stocks of companies listed at the Exchange with base value of 1000 points in 1996 (as last revised).
Chapter 12. Index Numbers
Types of Aggregate Index Numbers based on the Method of Computation
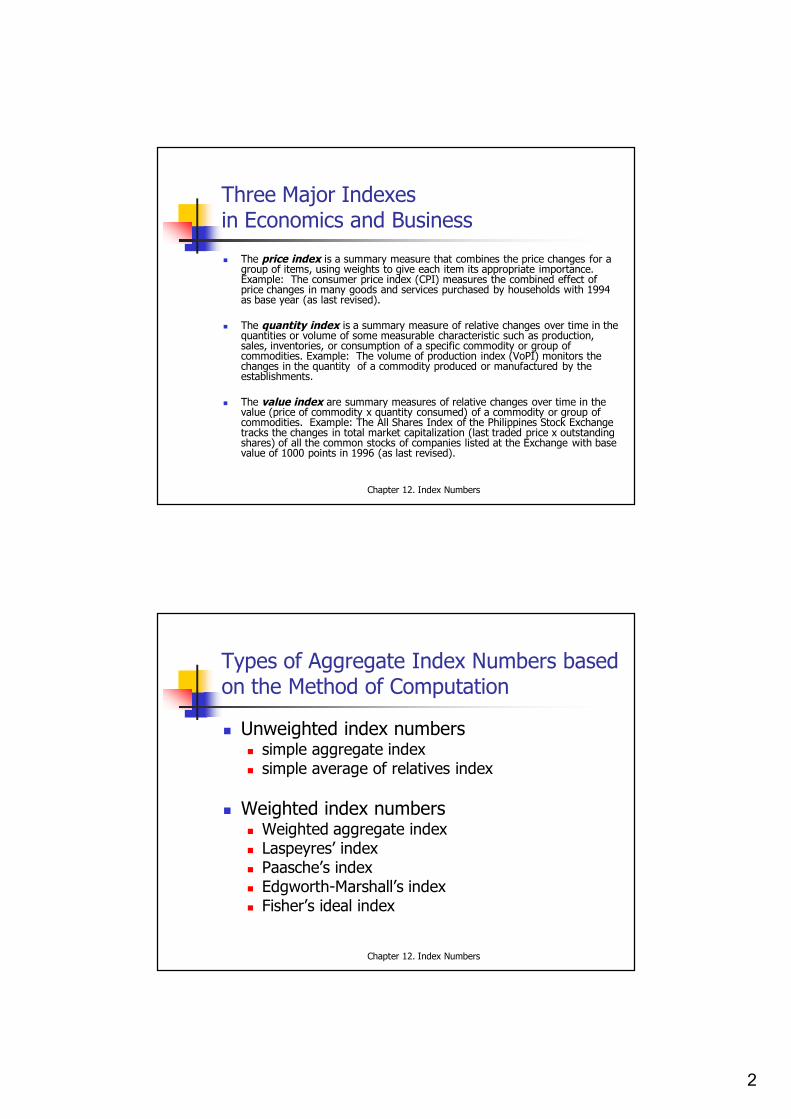
Unweighted index numbers simple aggregate index simple average of relatives index
Weighted index numbers Weighted aggregate index Laspeyres’ index Paasche’s index Edgworth-Marshall’s index Fisher’s ideal index
3
Chapter 12. Index Numbers
Simple Aggregate Index: Definition
Simple Aggregate Index (SAI) =
(n)i
1
(o)i
1
x100
x
k
ik
i
x
where x(n)
i is the magnitude of the ith item in year n x(o)
i is the magnitude of the ith item in the base year k is the number of items in the aggregate
Note: This can also be viewed as the average of the percent relative
series, ( )( ) ( )
1 2( ) ( ) ( )1 2
, ,...,nn nk
o o ok
xx xx x x
, where simple relatives with large bases are
given heavier weights.
Chapter 12. Index Numbers
Simple Aggregate Index:Example 1
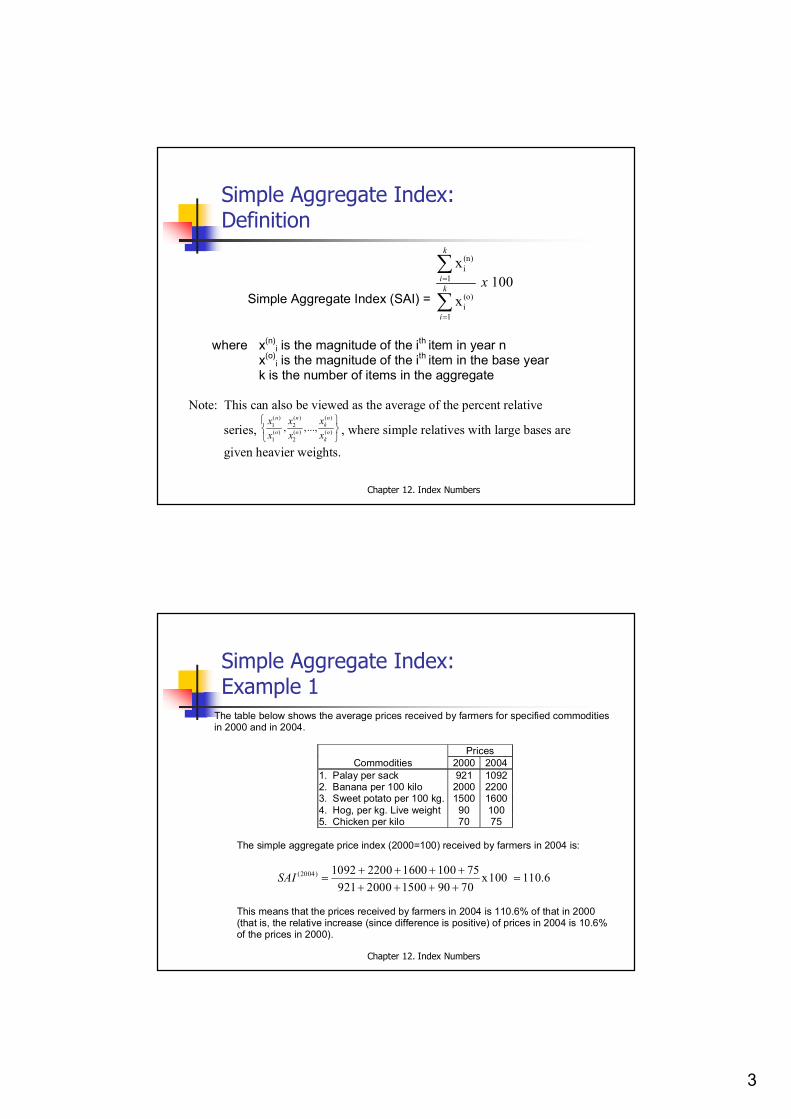
The table below shows the average prices received by farmers for specified commodities in 2000 and in 2004.
Prices Commodities 2000 2004
1. Palay per sack 921 1092 2. Banana per 100 kilo 2000 2200 3. Sweet potato per 100 kg. 1500 1600 4. Hog, per kg. Live weight 90 100 5. Chicken per kilo 70 75
The simple aggregate price index (2000=100) received by farmers in 2004 is:
(2004) 1092 2200 1600 100 75 x100 110.6
921 2000 1500 90 70SAI
This means that the prices received by farmers in 2004 is 110.6% of that in 2000
(that is, the relative increase (since difference is positive) of prices in 2004 is 10.6% of the prices in 2000).
4
Chapter 12. Index Numbers
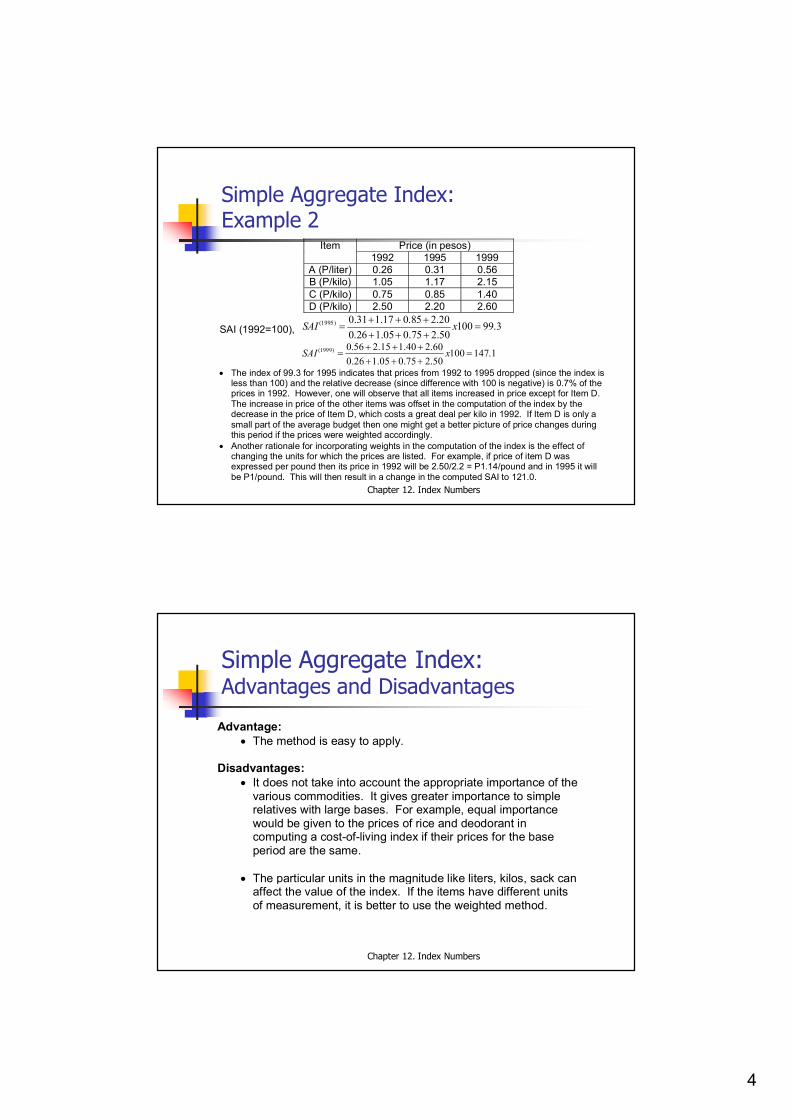
Simple Aggregate Index:Example 2
Price (in pesos) Item 1992 1995 1999
A (P/liter) 0.26 0.31 0.56 B (P/kilo) 1.05 1.17 2.15 C (P/kilo) 0.75 0.85 1.40 D (P/kilo) 2.50 2.20 2.60
SAI (1992=100), (1995) 0.31 1.17 0.85 2.20 100 99.3
0.26 1.05 0.75 2.50SAI x
(1999) 0.56 2.15 1.40 2.60 100 147.1
0.26 1.05 0.75 2.50SAI x
The index of 99.3 for 1995 indicates that prices from 1992 to 1995 dropped (since the index is less than 100) and the relative decrease (since difference with 100 is negative) is 0.7% of the prices in 1992. However, one will observe that all items increased in price except for Item D. The increase in price of the other items was offset in the computation of the index by the decrease in the price of Item D, which costs a great deal per kilo in 1992. If Item D is only a small part of the average budget then one might get a better picture of price changes during this period if the prices were weighted accordingly.
Another rationale for incorporating weights in the computation of the index is the effect of changing the units for which the prices are listed. For example, if price of item D was expressed per pound then its price in 1992 will be 2.50/2.2 = P1.14/pound and in 1995 it will be P1/pound. This will then result in a change in the computed SAI to 121.0.
Chapter 12. Index Numbers
Simple Aggregate Index:Advantages and Disadvantages
Advantage: The method is easy to apply.
Disadvantages:
It does not take into account the appropriate importance of the various commodities. It gives greater importance to simple relatives with large bases. For example, equal importance would be given to the prices of rice and deodorant in computing a cost-of-living index if their prices for the base period are the same.
The particular units in the magnitude like liters, kilos, sack can
affect the value of the index. If the items have different units of measurement, it is better to use the weighted method.
5
Chapter 12. Index Numbers
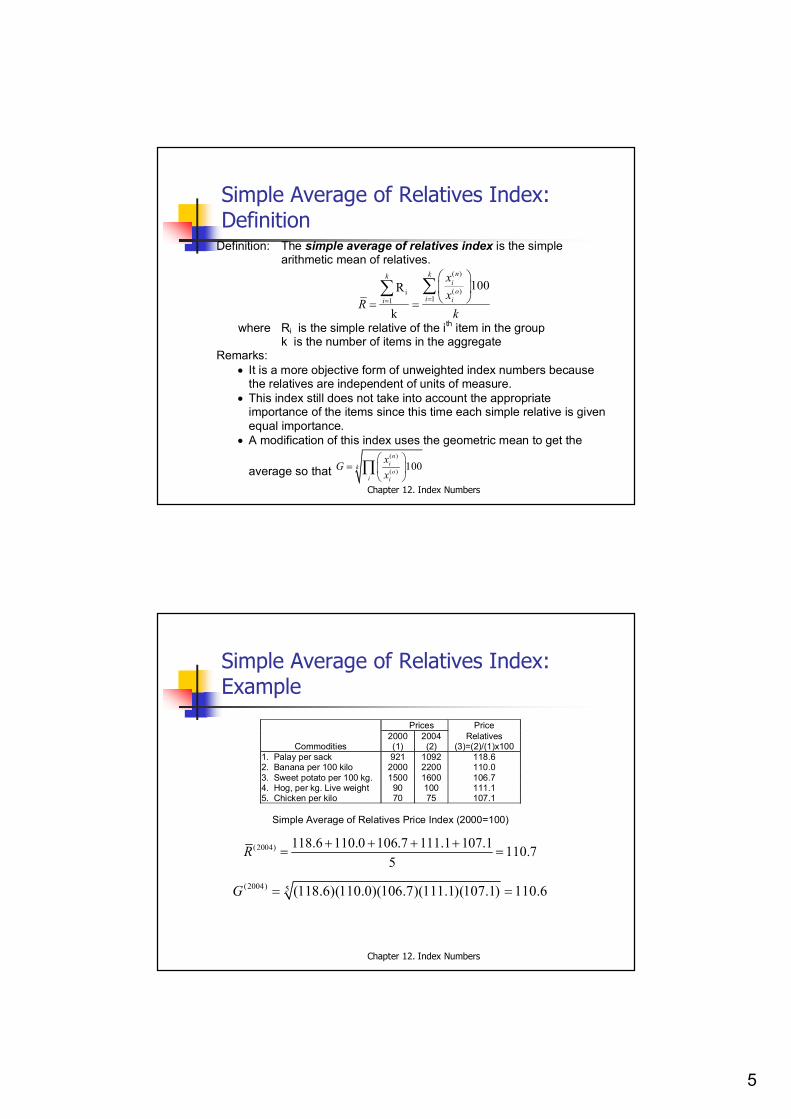
Simple Average of Relatives Index: Definition
Definition: The simple average of relatives index is the simple arithmetic mean of relatives.
( )
( )i11
100R
k
nkkio
i ii
xx
Rk
where Ri is the simple relative of the ith item in the group k is the number of items in the aggregate
Remarks: It is a more objective form of unweighted index numbers because
the relatives are independent of units of measure. This index still does not take into account the appropriate
importance of the items since this time each simple relative is given equal importance.
A modification of this index uses the geometric mean to get the
average so that ( )
( ) 100niko
i i
xGx
Chapter 12. Index Numbers
Simple Average of Relatives Index: Example
Prices Price 2000 2004 Relatives
Commodities (1) (2) (3)=(2)/(1)x100 1. Palay per sack 921 1092 118.6 2. Banana per 100 kilo 2000 2200 110.0 3. Sweet potato per 100 kg. 1500 1600 106.7 4. Hog, per kg. Live weight 90 100 111.1 5. Chicken per kilo 70 75 107.1
Simple Average of Relatives Price Index (2000=100)
(2004) 118.6 110.0 106.7 111.1 107.1 110.75
R
(2004) 5 (118.6)(110.0)(106.7)(111.1)(107.1) 110.6G
6
Chapter 12. Index Numbers
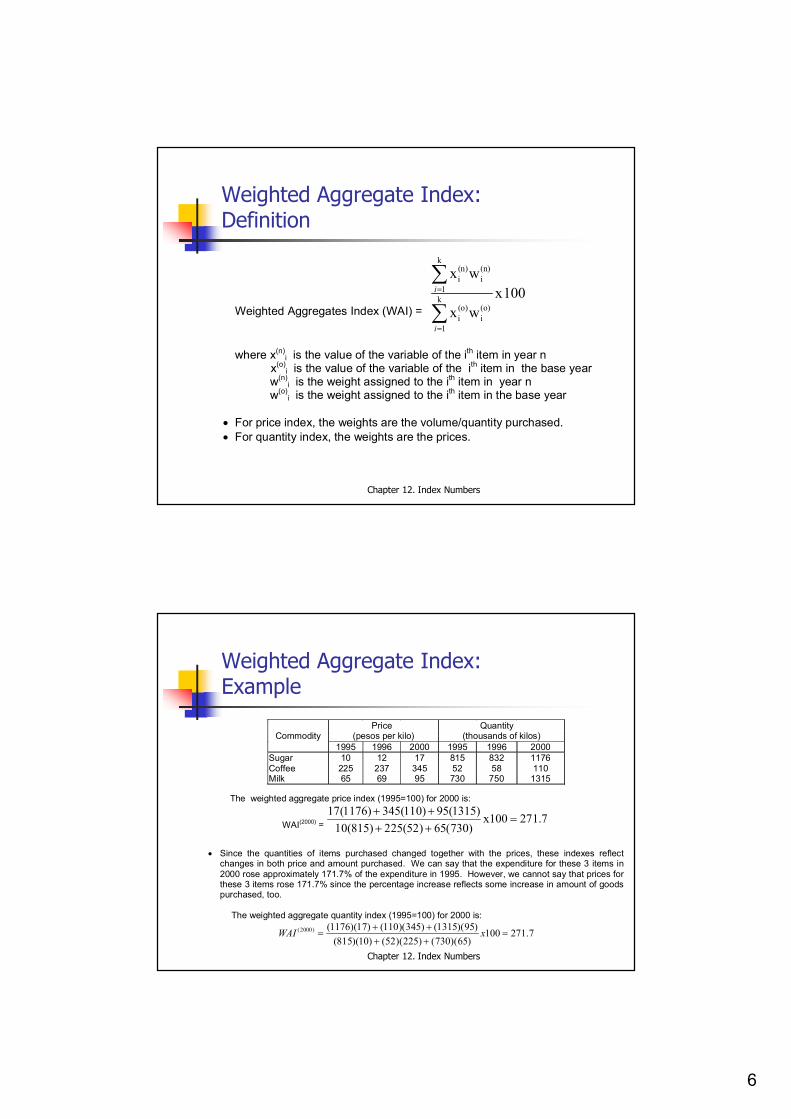
Weighted Aggregate Index: Definition
Weighted Aggregates Index (WAI) =
k(n) (n)i i
1k
(o) (o)i i
1
x wx100
x w
i
i
where x(n)
i is the value of the variable of the ith item in year n x(o)
i is the value of the variable of the ith item in the base year w(n)
i is the weight assigned to the ith item in year n w(o)
i is the weight assigned to the ith item in the base year For price index, the weights are the volume/quantity purchased. For quantity index, the weights are the prices.
Chapter 12. Index Numbers
Weighted Aggregate Index:Example
Price Quantity Commodity (pesos per kilo) (thousands of kilos)
1995 1996 2000 1995 1996 2000 Sugar 10 12 17 815 832 1176 Coffee 225 237 345 52 58 110 Milk 65 69 95 730 750 1315
The weighted aggregate price index (1995=100) for 2000 is:
WAI(2000) = 17(1176) 345(110) 95(1315) x100 271.7
10(815) 225(52) 65(730)
Since the quantities of items purchased changed together with the prices, these indexes reflect
changes in both price and amount purchased. We can say that the expenditure for these 3 items in 2000 rose approximately 171.7% of the expenditure in 1995. However, we cannot say that prices for these 3 items rose 171.7% since the percentage increase reflects some increase in amount of goods purchased, too.
The weighted aggregate quantity index (1995=100) for 2000 is:
(2000) (1176)(17) (110)(345) (1315)(95) 100 271.7
(815)(10) (52)(225) (730)(65)WAI x
7
Chapter 12. Index Numbers
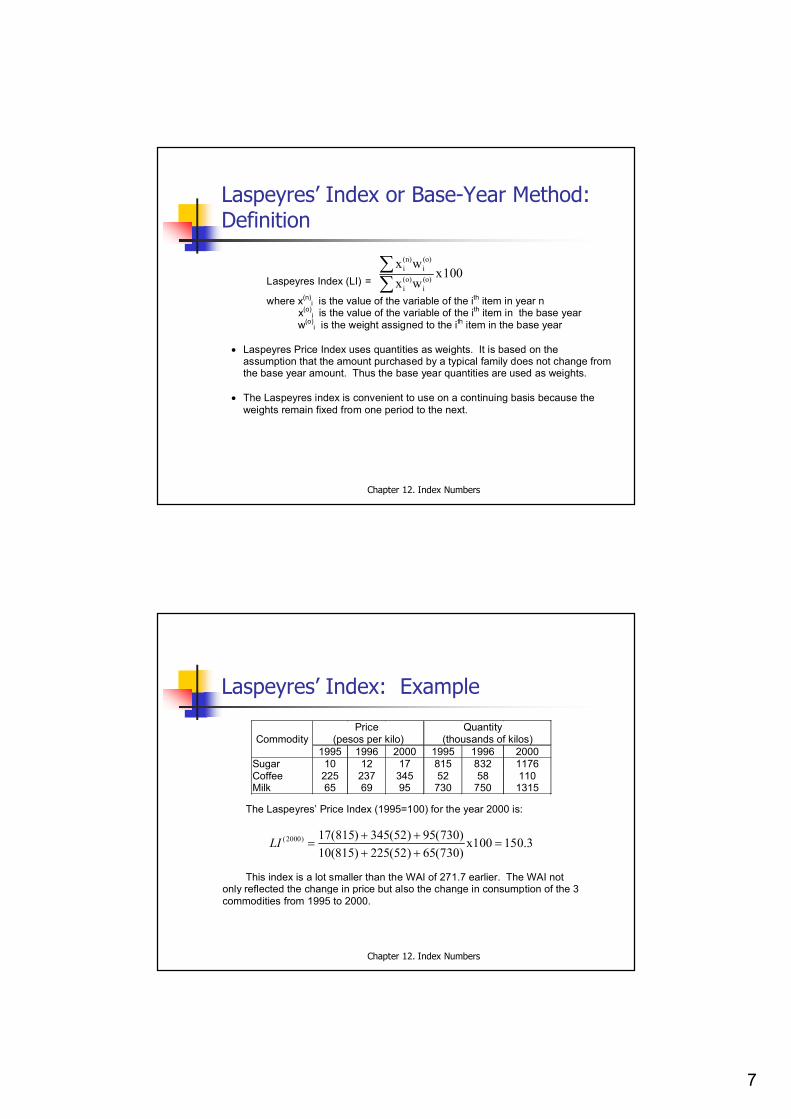
Laspeyres’ Index or Base-Year Method: Definition
Laspeyres Index (LI) =
(n) (o)i i(o) (o)i i
x wx100
x w
where x(n)i is the value of the variable of the ith item in year n
x(o)i is the value of the variable of the ith item in the base year
w(o)i is the weight assigned to the ith item in the base year
Laspeyres Price Index uses quantities as weights. It is based on the
assumption that the amount purchased by a typical family does not change from the base year amount. Thus the base year quantities are used as weights.
The Laspeyres index is convenient to use on a continuing basis because the
weights remain fixed from one period to the next.
Chapter 12. Index Numbers
Laspeyres’ Index: Example
Price Quantity Commodity (pesos per kilo) (thousands of kilos)
1995 1996 2000 1995 1996 2000 Sugar 10 12 17 815 832 1176 Coffee 225 237 345 52 58 110 Milk 65 69 95 730 750 1315
The Laspeyres’ Price Index (1995=100) for the year 2000 is:
(2000) 17(815) 345(52) 95(730) x100 150.3
10(815) 225(52) 65(730)LI
This index is a lot smaller than the WAI of 271.7 earlier. The WAI not only reflected the change in price but also the change in consumption of the 3 commodities from 1995 to 2000.
8
Chapter 12. Index Numbers
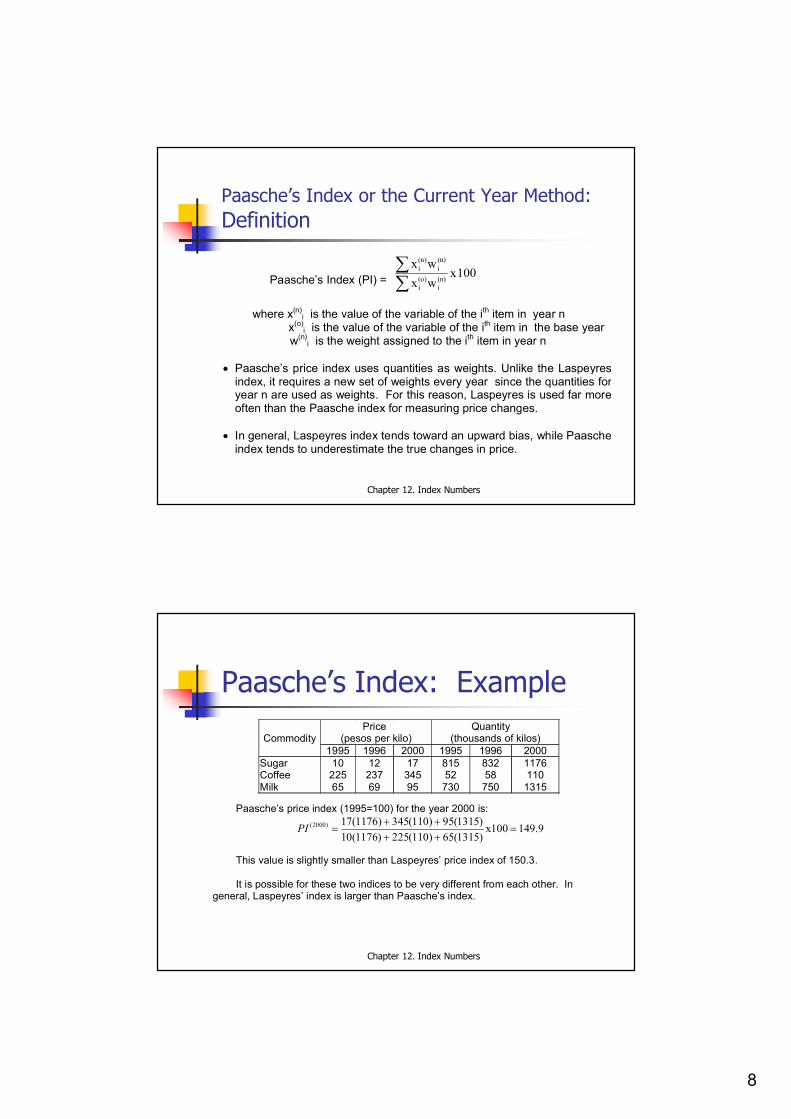
Paasche’s Index or the Current Year Method:Definition
Paasche’s Index (PI) =
(n) (n)i i(o) (n)i i
x wx100
x w
where x(n)
i is the value of the variable of the ith item in year n x(o)
i is the value of the variable of the ith item in the base year w(n)
i is the weight assigned to the ith item in year n
Paasche’s price index uses quantities as weights. Unlike the Laspeyresindex, it requires a new set of weights every year since the quantities for year n are used as weights. For this reason, Laspeyres is used far more often than the Paasche index for measuring price changes.
In general, Laspeyres index tends toward an upward bias, while Paasche
index tends to underestimate the true changes in price.
Chapter 12. Index Numbers
Paasche’s Index: Example Price Quantity
Commodity (pesos per kilo) (thousands of kilos) 1995 1996 2000 1995 1996 2000
Sugar 10 12 17 815 832 1176 Coffee 225 237 345 52 58 110 Milk 65 69 95 730 750 1315
Paasche’s price index (1995=100) for the year 2000 is:
(2000) 17(1176) 345(110) 95(1315) x100 149.910(1176) 225(110) 65(1315)
PI
This value is slightly smaller than Laspeyres’ price index of 150.3. It is possible for these two indices to be very different from each other. In
general, Laspeyres’ index is larger than Paasche’s index.
9
Chapter 12. Index Numbers
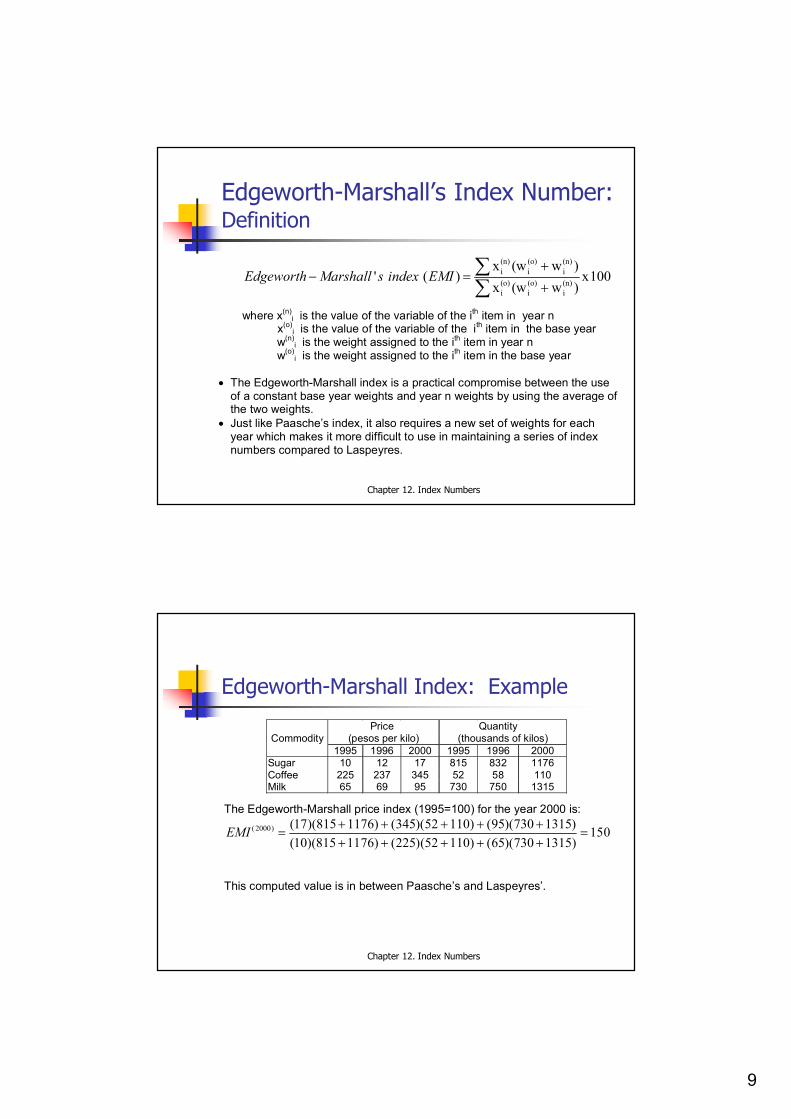
Edgeworth-Marshall’s Index Number:Definition
(n) (o) (n)i i i(o) (o) (n)i i i
x (w w )' ( ) x100
x (w w )Edgeworth Marshall s index EMI
where x(n)
i is the value of the variable of the ith item in year n x(o)
i is the value of the variable of the ith item in the base year w(n)
i is the weight assigned to the ith item in year n w(o)
i is the weight assigned to the ith item in the base year
The Edgeworth-Marshall index is a practical compromise between the use of a constant base year weights and year n weights by using the average of the two weights.
Just like Paasche’s index, it also requires a new set of weights for each year which makes it more difficult to use in maintaining a series of index numbers compared to Laspeyres.
Chapter 12. Index Numbers
Edgeworth-Marshall Index: Example
Price Quantity Commodity (pesos per kilo) (thousands of kilos)
1995 1996 2000 1995 1996 2000 Sugar 10 12 17 815 832 1176 Coffee 225 237 345 52 58 110 Milk 65 69 95 730 750 1315
The Edgeworth-Marshall price index (1995=100) for the year 2000 is:
(2000) (17)(815 1176) (345)(52 110) (95)(730 1315) 150.0(10)(815 1176) (225)(52 110) (65)(730 1315)
EMI
This computed value is in between Paasche’s and Laspeyres’.
10
Chapter 12. Index Numbers
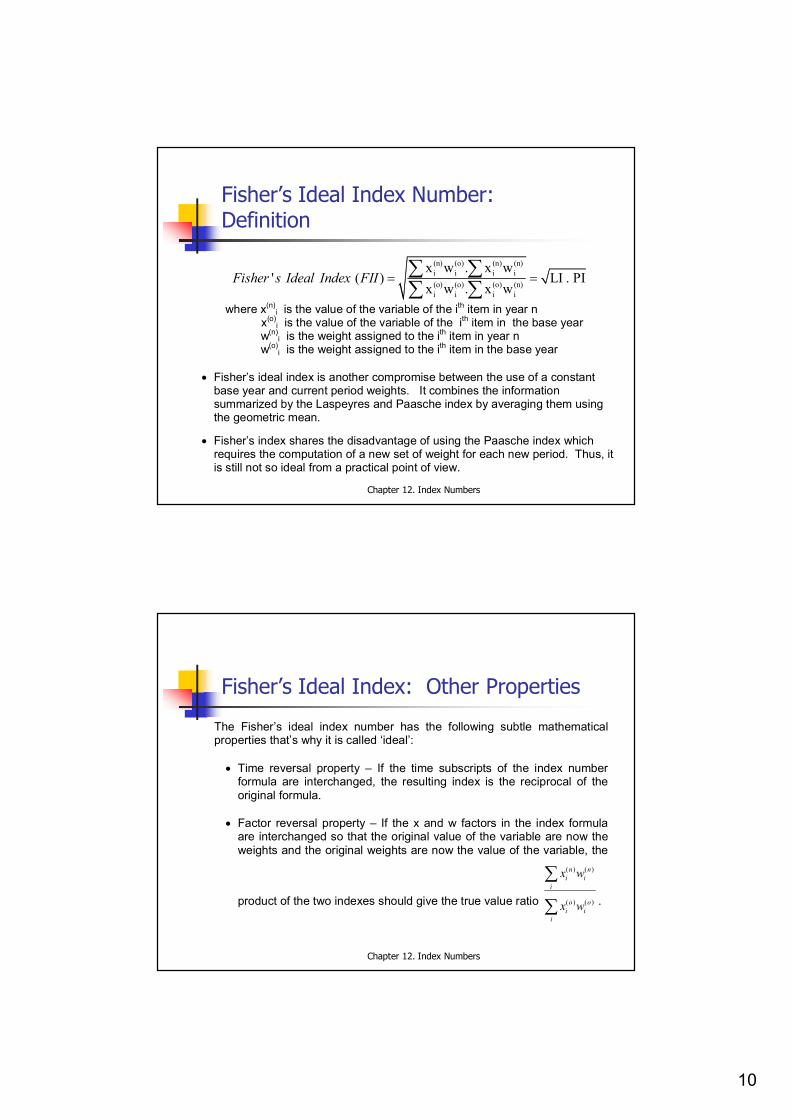
Fisher’s Ideal Index Number: Definition
(n) (o) (n) (n)i i i i(o) (o) (o) (n)i i i i
x w . x w' ( ) LI . PI
x w . x wFisher s Ideal Index FII
where x(n)i is the value of the variable of the ith item in year n
x(o)i is the value of the variable of the ith item in the base year
w(n)i is the weight assigned to the ith item in year n
w(o)i is the weight assigned to the ith item in the base year
Fisher’s ideal index is another compromise between the use of a constant
base year and current period weights. It combines the information summarized by the Laspeyres and Paasche index by averaging them using the geometric mean.
Fisher’s index shares the disadvantage of using the Paasche index which requires the computation of a new set of weight for each new period. Thus, it is still not so ideal from a practical point of view.
Chapter 12. Index Numbers
Fisher’s Ideal Index: Other Properties
The Fisher’s ideal index number has the following subtle mathematical properties that’s why it is called ‘ideal’:
Time reversal property – If the time subscripts of the index number
formula are interchanged, the resulting index is the reciprocal of the original formula.
Factor reversal property – If the x and w factors in the index formula
are interchanged so that the original value of the variable are now the weights and the original weights are now the value of the variable, the
product of the two indexes should give the true value ratio
( ) ( )
( ) ( )
n ni i
i
o oi i
i
x w
x w
.
11
Chapter 12. Index Numbers
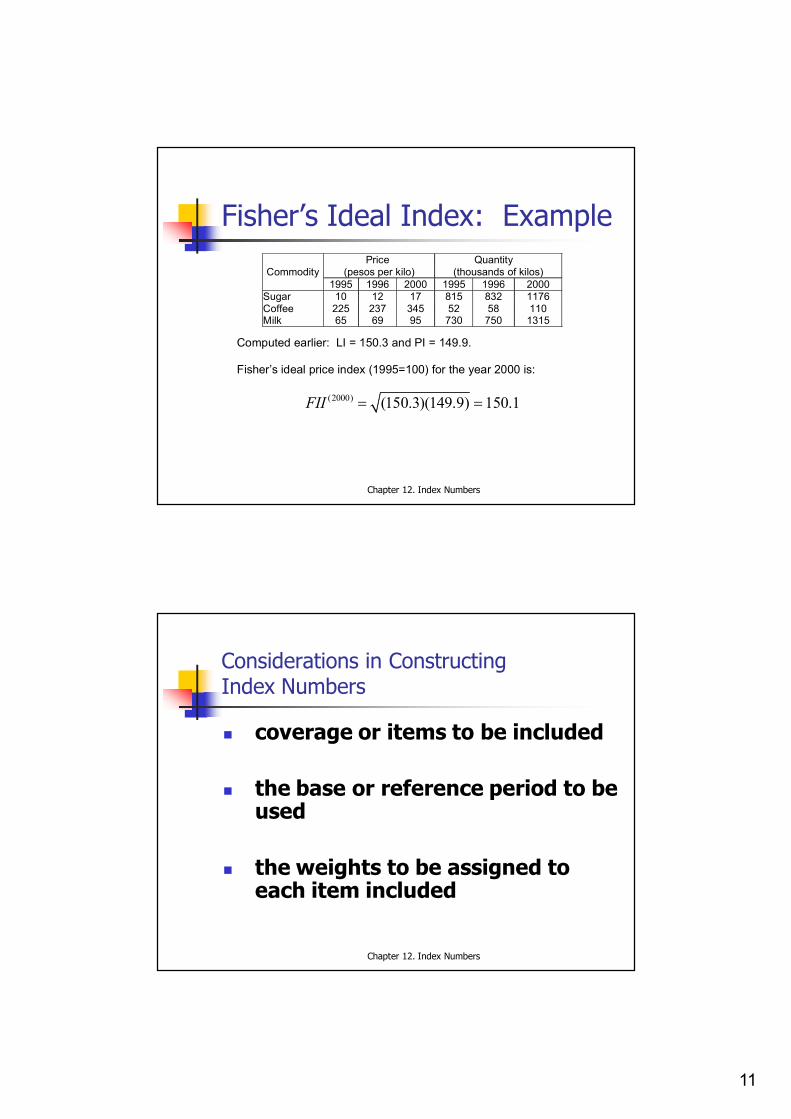
Fisher’s Ideal Index: Example Price Quantity
Commodity (pesos per kilo) (thousands of kilos) 1995 1996 2000 1995 1996 2000
Sugar 10 12 17 815 832 1176 Coffee 225 237 345 52 58 110 Milk 65 69 95 730 750 1315
Computed earlier: LI = 150.3 and PI = 149.9. Fisher’s ideal price index (1995=100) for the year 2000 is:
(2000) (150.3)(149.9) 150.1FII
Chapter 12. Index Numbers
Considerations in Constructing Index Numbers
coverage or items to be included
the base or reference period to be used
the weights to be assigned to each item included
12
Chapter 12. Index Numbers
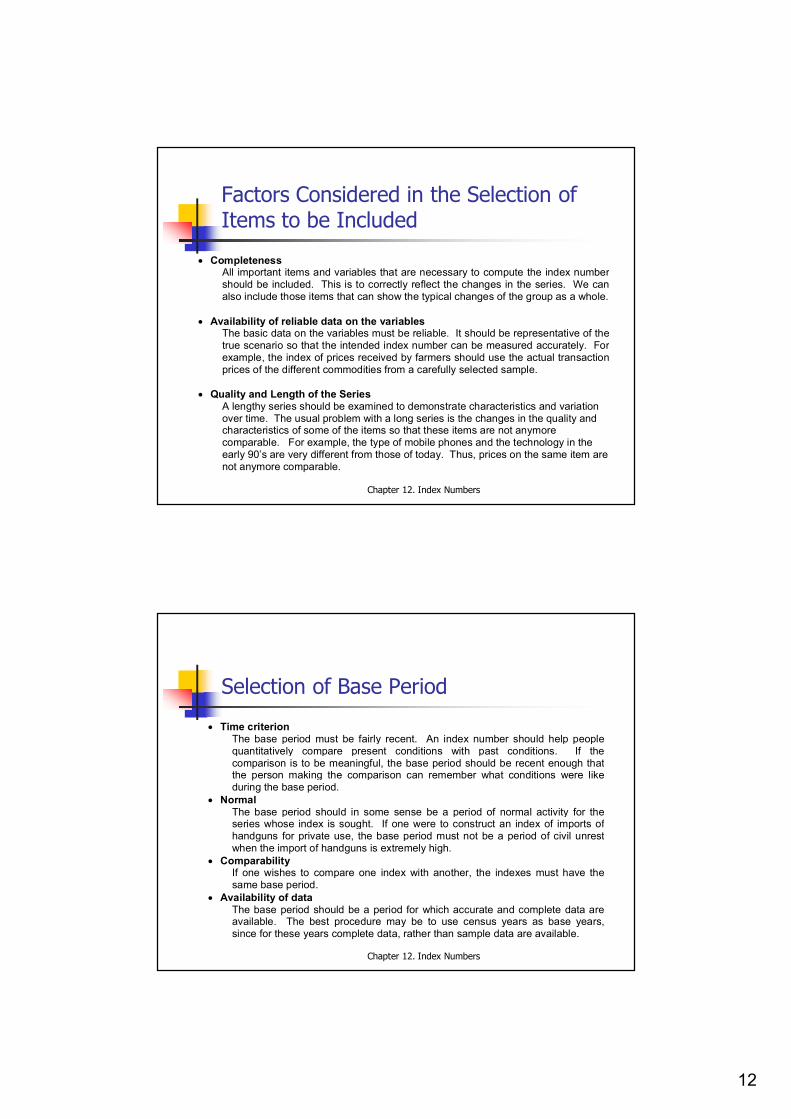
Factors Considered in the Selection of Items to be Included
Completeness All important items and variables that are necessary to compute the index number should be included. This is to correctly reflect the changes in the series. We can also include those items that can show the typical changes of the group as a whole.
Availability of reliable data on the variables
The basic data on the variables must be reliable. It should be representative of the true scenario so that the intended index number can be measured accurately. For example, the index of prices received by farmers should use the actual transaction prices of the different commodities from a carefully selected sample.
Quality and Length of the Series A lengthy series should be examined to demonstrate characteristics and variation over time. The usual problem with a long series is the changes in the quality and characteristics of some of the items so that these items are not anymore comparable. For example, the type of mobile phones and the technology in the early 90’s are very different from those of today. Thus, prices on the same item are not anymore comparable.
Chapter 12. Index Numbers
Selection of Base Period
Time criterion The base period must be fairly recent. An index number should help people quantitatively compare present conditions with past conditions. If the comparison is to be meaningful, the base period should be recent enough that the person making the comparison can remember what conditions were like during the base period.
Normal The base period should in some sense be a period of normal activity for the series whose index is sought. If one were to construct an index of imports of handguns for private use, the base period must not be a period of civil unrest when the import of handguns is extremely high.
Comparability If one wishes to compare one index with another, the indexes must have the same base period.
Availability of data The base period should be a period for which accurate and complete data are available. The best procedure may be to use census years as base years, since for these years complete data, rather than sample data are available.
13
Chapter 12. Index Numbers
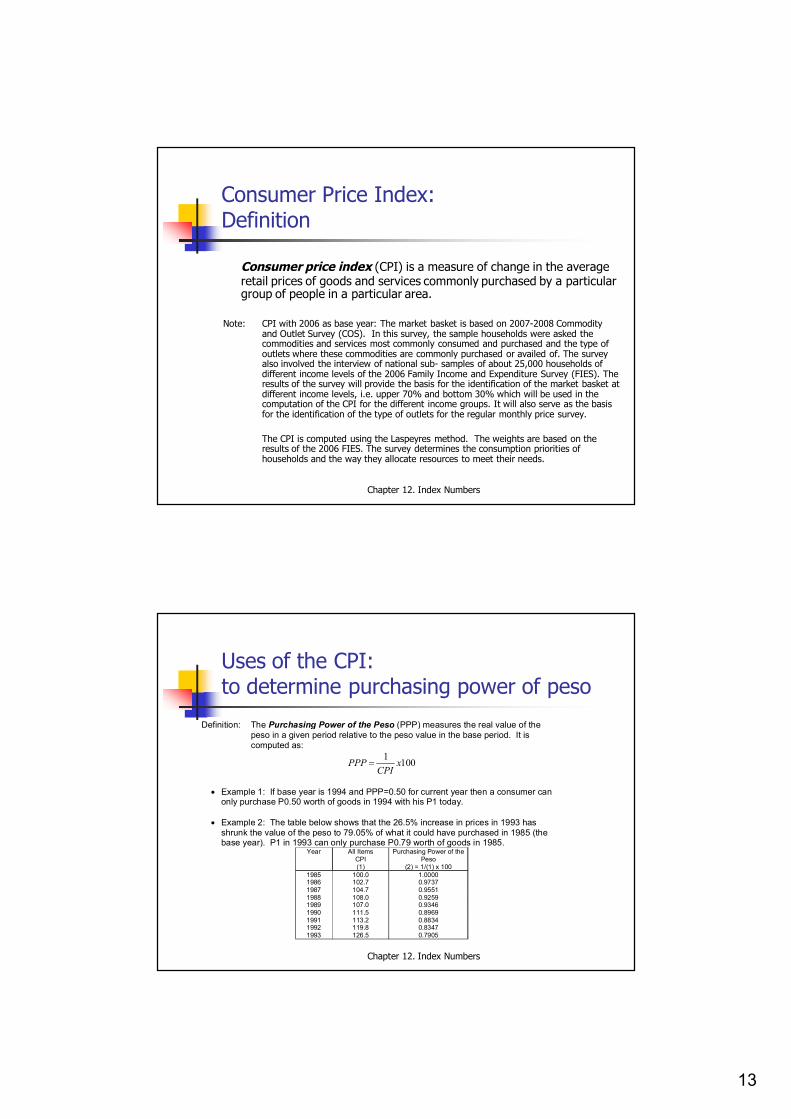
Consumer Price Index: Definition
Consumer price index (CPI) is a measure of change in the average retail prices of goods and services commonly purchased by a particular group of people in a particular area.
Note: CPI with 2006 as base year: The market basket is based on 2007-2008 Commodity and Outlet Survey (COS). In this survey, the sample households were asked the commodities and services most commonly consumed and purchased and the type of outlets where these commodities are commonly purchased or availed of. The survey also involved the interview of national sub- samples of about 25,000 households of different income levels of the 2006 Family Income and Expenditure Survey (FIES). The results of the survey will provide the basis for the identification of the market basket at different income levels, i.e. upper 70% and bottom 30% which will be used in the computation of the CPI for the different income groups. It will also serve as the basis for the identification of the type of outlets for the regular monthly price survey.
The CPI is computed using the Laspeyres method. The weights are based on the results of the 2006 FIES. The survey determines the consumption priorities of households and the way they allocate resources to meet their needs.
Chapter 12. Index Numbers
Uses of the CPI:to determine purchasing power of peso
Definition: The Purchasing Power of the Peso (PPP) measures the real value of the peso in a given period relative to the peso value in the base period. It is computed as:
1 100PPP xCPI
Example 1: If base year is 1994 and PPP=0.50 for current year then a consumer can
only purchase P0.50 worth of goods in 1994 with his P1 today.
Example 2: The table below shows that the 26.5% increase in prices in 1993 has shrunk the value of the peso to 79.05% of what it could have purchased in 1985 (the base year). P1 in 1993 can only purchase P0.79 worth of goods in 1985.
Year All Items CPI
Purchasing Power of the Peso
(1) (2) = 1/(1) x 100 1985 100.0 1.0000 1986 102.7 0.9737 1987 104.7 0.9551 1988 108.0 0.9259 1989 107.0 0.9346 1990 111.5 0.8969 1991 113.2 0.8834 1992 119.8 0.8347 1993 126.5 0.7905
14
Chapter 12. Index Numbers
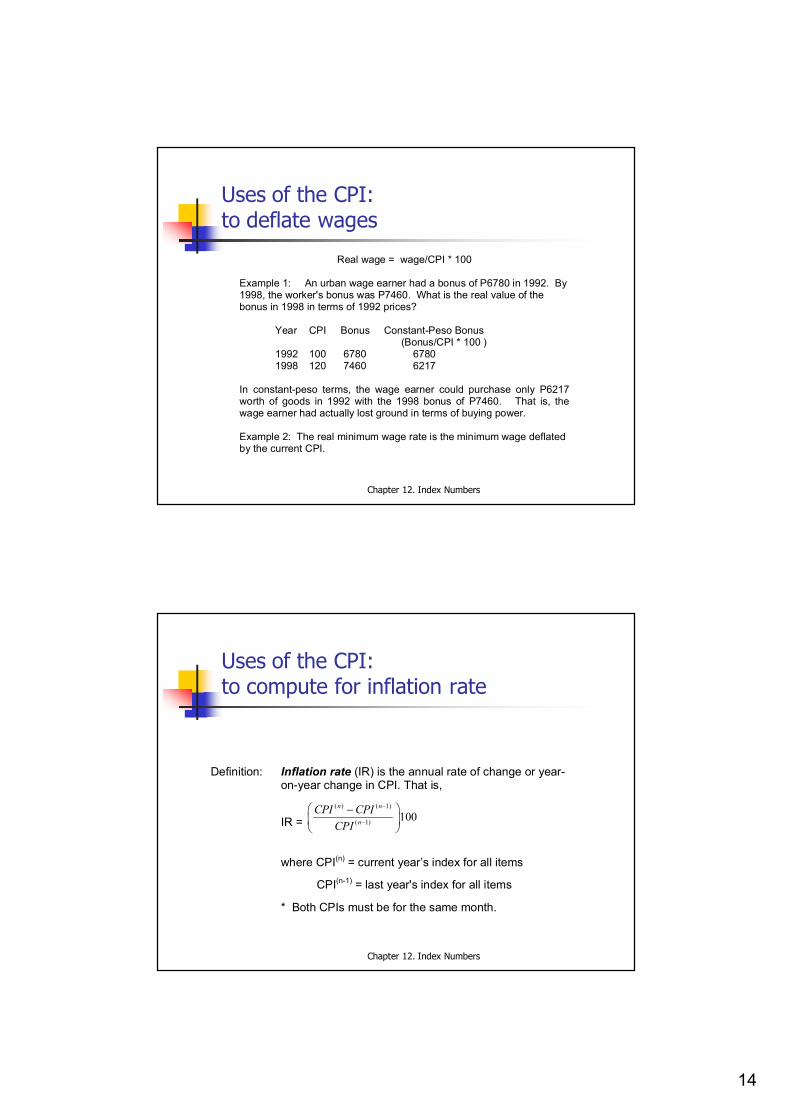
Uses of the CPI:to deflate wages
Real wage = wage/CPI * 100 Example 1: An urban wage earner had a bonus of P6780 in 1992. By 1998, the worker's bonus was P7460. What is the real value of the bonus in 1998 in terms of 1992 prices? Year CPI Bonus Constant-Peso Bonus (Bonus/CPI * 100 ) 1992 100 6780 6780 1998 120 7460 6217 In constant-peso terms, the wage earner could purchase only P6217 worth of goods in 1992 with the 1998 bonus of P7460. That is, the wage earner had actually lost ground in terms of buying power.
Example 2: The real minimum wage rate is the minimum wage deflated by the current CPI.
Chapter 12. Index Numbers
Uses of the CPI:to compute for inflation rate
Definition: Inflation rate (IR) is the annual rate of change or year-on-year change in CPI. That is,
IR = ( ) ( 1)
( 1) 100n n
nCPI CPI
CPI
where CPI(n) = current year’s index for all items
CPI(n-1) = last year's index for all items
* Both CPIs must be for the same month.
![INDEX—DOTY-DOTEN - digital editions · Web viewDOTY INDEX [Description of the Publication] [Note: numbers (dates and reference numbers) have been deleted from this index. The](https://img.dokumen.tips/doc/110x75/5e3baecc0134941c375f5e37/indexadoty-doten-digital-web-view-doty-index-description-of-the-publication.jpg)


![Index [] · 449 Index Index Note to the Reader: Throughout this index boldfaced page numbers indicate pri- mary discussions of a topic. Italicized page numbers indicate illustrations](https://img.dokumen.tips/doc/110x75/5f606338ba3dbd243131af5b/index-449-index-index-note-to-the-reader-throughout-this-index-boldfaced-page.jpg)


![Addmath : f4ch11 - Index Numbers [v4]](https://img.dokumen.tips/doc/110x75/55cf8f7d550346703b9ce5fd/addmath-f4ch11-index-numbers-v4.jpg)