Embed Size (px)
Citation preview

BASIC FINANCIAL STATEMENTS
Fiscal Year Ended June 30, 2020
Prepared through the joint efforts of CalPERS team members.
Available online at www.calpers.ca.gov
California Public Employees' Retirement System A Component Unit of the State of California
Agenda item 6a, Attachment 1, Page 1 of 82

This page intentionally left blank.
Agenda item 6a, Attachment 1, Page 2 of 82
Management's Discussion & Analysis (Unaudited) INTRODUCTION
This section presents Management’s Discussion & Analysis of the California Public Employees’ Retirement System’s (CalPERS or the System) financial performance during the fiscal year ended June 30, 2020. It is a narrative overview and analysis that is presented in conjunction with the Chief Executive Officer’s Letter of Transmittal included in the Introductory Section of this Comprehensive Annual Financial Report (CAFR). It should also be read in conjunction with the Basic Financial Statements as presented in this report.
In addition to historical information, the Management’s Discussion & Analysis includes certain forward-looking statements, which involve currently known facts and certain risks and uncertainties. CalPERS’ actual results, performance, and achievements may differ from the results, performance, and achievements expressed or implied in such forward- looking statements due to a wide range of factors, including changes in interest rates, changes in the securities markets, general economic conditions, legislative changes, and other factors.
CalPERS is primarily responsible for administering retirement and health benefits. CalPERS also administers long-term care benefits, a post-employment benefit fund for retiree health, and supplemental retirement savings plans.
MANAGEMENT DISCUSSION Strategic Planning CalPERS finished the third year of its 2017-22 Strategic Plan. This plan is a blueprint that guides the enterprise to meet the investment, retirement, and health benefit needs of our members and their families.
The 2017-22 Strategic Plan was developed over the course of a year-long effort by CalPERS Board of Administration (the Board) members, senior leaders, and team members, with contributions from multiple stakeholders including employer associations, labor groups, retiree associations, federal representatives, health and investment business partners, and state government officials.
The current strategic plan took effect on July 1, 2017, and has five overarching goals:
• Strengthen long-term sustainability of the pension fund • Transform health care purchasing and delivery to achieve
affordability • Reduce complexity across the enterprise • Cultivate a risk-intelligent organization • Promote a high-performing and diverse workforce
The 2017-22 Strategic Plan includes the annual Business Plan Initiatives. The 2019-20 Business Plan Initiatives allowed
the organization to set priorities and assisted in the allocation of resources. It aligned to the 2019-20 budget cycle to accomplish the goals and objectives of the strategic plan. CalPERS identified 28 initiatives to begin the work needed to support the overall strategic direction of the organization.
Key Initiatives CalPERS continued to enhance its operations as follows:
• CalPERS continues the Asset Liability Management (ALM) process to expand its review of assets and liabilities to ensure financial risks to the System are better understood, communicated, and mitigated. To establish appropriate levels of risk, ALM is focused on investment and actuarial policies. These policies include key decision factors and are intended to drive optimum asset allocations, while stabilizing employer contribution rates and the volatility of those rates from year to year. Additionally, to better manage risks arising from terminating agencies, CalPERS has enhanced its oversight of contracting public agencies’ financial health through its development of a standardized review criteria. These improvements include streamlining the collection and termination process to reduce the time frame, accelerating notifications to the Board and members, and adopting a risk oversight process to improve early detection of financial hardship issues. In Fiscal Year 2019-20, CalPERS continued the four-year asset allocation of the fund’s investment portfolio to align with a phased lowering of the discount rate to 7.0 percent. CalPERS also adopted new actuarial assumptions and modifications to the amortization policy during Fiscal Year 2017-18. Changes to the amortization policy included shortening the period over which actuarial gains and losses are amortized from 30 to 20 years for new Unfunded Accrued Liability (UAL) bases established June 30, 2019 and later.
• CalPERS’ five-year sustainable investment strategy (2017-22) takes an enterprise-wide view on improving the sustainability of long-term pension benefits and actively managing business risks. CalPERS has associated key performance indicators (KPIs) with this strategy, and includes a strategic focus on:
◦ Data and Corporate Reporting Standards ◦ Climate Action 100+ Engagement ◦ Diversity and Inclusion ◦ Manager Expectations ◦ Research ◦ Private Equity Fee and Profit Sharing
Transparency
Agenda item 6a, Attachment 1, Page 3 of 82
Management's Discussion & Analysis (Unaudited) (continued) Core work areas include integration of environmental, social, and governance (ESG) factors into the investment process, Financial Markets Advocacy, Shareowner Campaigns, Corporate & Manager Engagement, Proxy Voting, Responsible Contractor Program, Carbon Footprinting, and Ad Hoc Media & Stakeholder Requests.
OVERVIEW OF THE FINANCIAL STATEMENTS AND ACCOMPANYING INFORMATION
Management’s Discussion & Analysis provides an overview of the financial position, which is comprised of the following components: Basic Financial Statements, Notes to the Basic Financial Statements, Required Supplementary Information, and Other Supplementary Information. Collectively, this information presents the combined net position restricted for pension benefits, other post-employment benefits (OPEB), deferred compensation, replacement benefits, and the unrestricted net position of the proprietary funds administered by CalPERS as of June 30, 2020. It also summarizes the combined changes in fiduciary net position restricted for pension, other post-employment, and replacement benefits; the changes in unrestricted net position; and the cash flows of the proprietary funds for the year then-ended, along with disclosures about the net pension liabilities of the single- employer and cost-sharing multiple-employer defined benefit pension plans.
FINANCIAL HIGHLIGHTS Major events and initiatives impacting the current fiscal year’s financial statements include:
• The Public Employees’ Retirement Fund (PERF) realized a money-weighted rate of return (MWRR) of 5.0 percent and a realized time-weighted rate of return of 4.7 percent in Fiscal Year 2019-20 resulting from positive performance across most globally diversified asset classes. Drivers of the PERF’s investment return include a strong performance from fixed income. Real assets and public equity returns reflected market volatility, but performed relatively well. Additionally, investment allocation changes made during the period in response to financial market volatility contributed positively to fund performance.
• CalPERS requested health plans to submit estimated 2021 rates reflecting COVID-19 impacts in May 2020. The preliminary 2021 premiums with COVID-19 impacts for CalPERS health plans were submitted to the CalPERS Board of Administration in June 2020, with final rates adopted the following month. The overall impact of
COVID-19 on CalPERS’ 2021 rate was projected to be an increase of 0.57 percent.
• The California Employers’ Pension Prefunding Trust Fund (CEPPTF) was created on September 21, 2018, pursuant to Senate Bill (SB) 1413, Chapter 665, Statutes of 2018. The CEPPTF is reported as an investment trust fund under the fiduciary statements effective Fiscal Year 2019-20.
• During the calendar year 2020, the World Health Organization announced a global health emergency from a new strain of coronavirus (COVID-19) that has resulted in a global pandemic outbreak. This pandemic has adversely affected global economic activity and greatly contributed to uncertainty and instability in the global financial markets. CalPERS investment portfolio was exposed to the volatility of the financial markets during the last half of Fiscal Year 2019-20 but was also well positioned to take advantage of new investment opportunities that were present during this time. While negative market conditions could have an impact on CalPERS’ ability to earn the actuarial assumed rate of return and negatively impact the receipt of contributions and premiums due from public agencies and participants, CalPERS cannot predict the impact of the COVID-19 pandemic. Although CalPERS cannot estimate the length or gravity of the impact of the COVID-19 outbreak at this time, management continues to closely monitor the situation, to assess further possible adverse implications that may occur to operations, investments, public agencies and participants, and to take actions to mitigate resulting consequences.
On March 27, 2020, President Trump signed into law the “Coronavirus Aid, Relief, and Economic Security (CARES) Act.” The CARES Act, among other things, includes several relief provisions available to tax-qualified retirement plans and their participants. CalPERS has assessed the applicability of such funds and has not acted to take part in applying for and receiving any such relief funds. Management is continuing to monitor applicability of any new funding or programs that may become available.
BASIC FINANCIAL STATEMENTS The June 30, 2020, financial statements separate the funds administered by CalPERS into two categories: fiduciary funds and proprietary funds. With the exception of Old Age and Survivors’ Insurance Revolving Fund (OASI), CalPERS’ role as a trustee and monitoring of financial position occur in both categories, and a primary focus of fiduciary funds is CalPERS’
Agenda item 6a, Attachment 1, Page 4 of 82
Management's Discussion & Analysis (Unaudited) (continued) duty with respect to the payment of benefits, whereas a core function for proprietary funds is the payment of services.
Fiduciary Funds – include the PERF (split into PERF A, PERF B, and PERF C), Legislators’ Retirement Fund (LRF), JRF, Judges’ Retirement Fund II (JRF II), Public Employees’ Deferred Compensation Fund (DCF), Supplemental Contributions Program Fund (SCPF), CEPPTF, Annuitants’ Health Care Coverage Fund, also known as California Employers’ Retiree Benefit Trust Fund (CERBTF), OASI, and Replacement Benefit Fund (RBF). Generally, fiduciary funds are used to account for resources held for the benefit of CalPERS participants.
A Statement of Fiduciary Net Position and a Statement of Changes in Fiduciary Net Position are presented for the fiduciary funds as of, and for, the fiscal year ended June 30, 2020, along with comparative total information as of, and for, fiscal year ended June 30, 2019. These financial statements reflect the resources available to pay benefits to retirees and other beneficiaries as of year-end, and the changes in those resources during the year.
Proprietary Funds – include Public Employees’ Health Care Fund (HCF), Public Employees’ Contingency Reserve Fund (CRF), and the Public Employees’ Long-Term Care Fund (LTCF). A Statement of Net Position, a Statement of Revenues, Expenses, and Changes in Net Position, and a Statement of Cash Flows are presented for the proprietary funds as of, and for, fiscal year ended June 30, 2020, along with comparative total information as of, and for, fiscal year ended June 30, 2019. These financial statements reflect the net position, changes in net position, and cash flows resulting from CalPERS business-type activities.
NOTES TO THE BASIC FINANCIAL STATEMENTS The Notes to the Basic Financial Statements provide additional information that is essential to a full understanding of the information provided in the fund financial statements. Information available in the Notes to the Basic Financial Statements is described below:
Note 1 – provides general information on CalPERS, each of the funds administered, employer and member participation in the pension plans, and other post-employment benefit plans administered by CalPERS.
Note 2 – provides a summary of significant accounting policies, including the basis of accounting for each of the fund types, target asset allocation, management’s use of estimates, and other significant accounting policies.
Note 3 – provides information on cash and cash equivalents.
Note 4 – provides detail on the fair value of investments, and information on MWRR.
Note 5 – provides information about investment risk categorizations.
Note 6 – provides information about securities lending. Note 7 – provides information about derivatives. Note 8 – provides information about the net pension
liabilities/(asset) and actuarial assumptions for cost-sharing and single-employer plans.
Note 9 – provides information about the CEPPTF, including plan members, participating employers, and contributions.
Note 10 – provides information about the CERBTF, including plan members, participating employers, and contributions.
Note 11 – provides information about the RBF, as well as applicable internal revenue and government codes.
Note 12 – provides detailed information about the OASI. Note 13 – provides detailed information about the HCF and
the estimated claims liability of the HCF. Note 14 – provides additional information about participating
agencies and insurance premiums paid by the CRF. Note 15 – provides information about the LTCF actuarial
valuation and the estimated liability for future policy benefits. Note 16 – provides information on potential contingencies of
CalPERS. Note 17 – provides information about future accounting
pronouncements.
REQUIRED SUPPLEMENTARY INFORMATION The Required Supplementary Information schedules include information about the changes in the net pension liability, employer contributions, actuarial assumptions used to calculate the actuarially determined contributions, historical trends, and other required supplementary information related to the System’s cost-sharing multiple-employer and single- employer defined benefit pension plans as required by GASB Statement No. 67, Financial Reporting for Pension Plans—an amendment of GASB Statement No. 25 (GASB 67).
The MWRR expresses investment performance, net of investment expense, and is disclosed per the requirements of GASB 67 and GASB Statement No. 74, Financial Reporting for Postemployment Benefit Plans Other Than Pension Plans (GASB 74).
The Schedule of Claims Development Information for the HCF provides earned revenues and expenses over the past 10 years.
OTHER SUPPLEMENTARY INFORMATION Other schedules include detailed information on administrative expenses incurred by CalPERS-administered funds, investment expenses, and other professional services expenses incurred.
Agenda item 6a, Attachment 1, Page 5 of 82
Management's Discussion & Analysis (Unaudited) (continued)
FINANCIAL ANALYSIS
PUBLIC EMPLOYEES RETIREMENT FUND (PERF) The PERF is a trust fund established under section 20170 of the Public Employees’ Retirement Law (PERL). The PERF provides retirement benefits to State of California, school, and other California public agency employees. The PERF benefits are funded by member and employer contributions and by earnings on investments.
For financial reporting purposes only, the PERF is comprised of, and reported as, three separate entities. PERF A is comprised of agent multiple-employer plans, which includes the State of California and most public agency rate plans with more than 100 active members. PERF B is a cost- sharing multiple-employer plan of school employers consisting of non-teaching and non-certified employees. PERF C is a cost-sharing multiple-employer plan of public agencies with generally fewer than 100 active members. Under applicable law, the Board may terminate or a public agency may terminate that agency’s plan under either PERF A or PERF C. The terminated agency is liable to the System for all costs to fund all benefits under the agency’s contract. An unpaid deficit in funding will result in a commensurate reduction in benefits provided under that agency’s contract.
Movements of member account asset balances occur between PERF A, PERF B, and PERF C when employer rate plans have fewer than 100 members, or when there are other member accounting adjustments. These plan-to-plan resource movements are reported as a separate line item within the additions and deductions sections, respectively, of each plan’s Statement of Changes in Fiduciary Net Position.
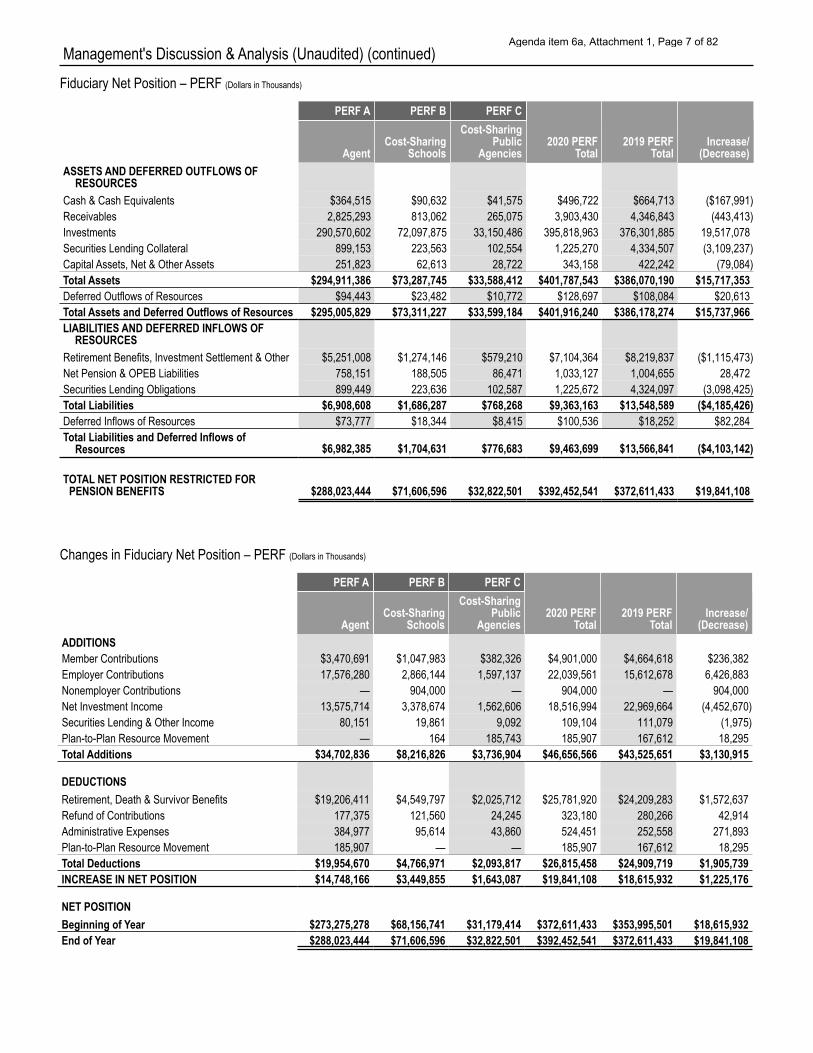
The PERF net position increased by $19.8 billion or 5.3 percent from $372.6 billion as of June 30, 2019, to $392.5 billion as of June 30, 2020, primarily due to continued market growth. Receivables decreased $0.4 billion or 10.2 percent due to lower outstanding investment trades. Investment balances increased by $19.5 billion from $376.3 billion as of June 30, 2019, to $395.8 billion as of June 30, 2020, due to continued market growth. Securities lending collateral decreased $3.1 billion or 71.7 percent, and securities lending obligations decreased $3.1 billion or 71.7 percent as a result of an overall decrease in demand to borrow securities at year-end. Capital Assets, Net and Other Assets decreased $79.1 million or 18.7 percent primarily due to increased cumulative amortization of capitalized intangible assets related to myCalPERS software development.
Similar to receivables, retirement benefits, investment settlement and other liabilities decreased $1.1 billion or 13.6 percent primarily due to lower outstanding investment trades. Total net pension and OPEB liabilities increased by $28.5 million or 2.8 percent. Net pension liability increased
primarily as a result of lower contributions and an unfavorable difference between expected and actual experience. Net OPEB liability also increased due to a decrease in the blended discount rate.
Additions to the PERF net position include member contributions, employer contributions, nonemployer contributions and investment income. Member contributions increased $0.2 billion or 5.1 percent. Employer and nonemployer contributions increased $7.3 billion or 47.0 percent. Employer contribution rates increased between 0.8 percent and 4.0 percent for state, 1.7 percent for schools, and between 1.9 percent and 4.8 percent on average for public agency miscellaneous and safety plans. Additionally, a large state supplemental employer contribution of $2.5 billion and nonemployer contribution of $904 million was received in Fiscal Year 2019-20.
Net investment income is comprised of interest income, dividend income, and net appreciation or depreciation in fair value of investments and is net of investment expenses.
Net investment income was $18.5 billion in Fiscal Year 2019-20, compared to $23.0 billion in Fiscal Year 2018-19, a decrease of $4.5 billion or 19.4 percent due to lower investment returns in Fiscal Year 2019-20. The current year returns were bolstered by strong performance in fixed income markets. The PERF recognized a MWRR of 5.0 percent for Fiscal Year 2019-20 compared with 6.5 percent for Fiscal Year 2018-19.
Deductions from the PERF are comprised of benefit payments, refunds of contributions to members and beneficiaries, and costs of administering the PERF. Benefit payments are the primary expense of a retirement system. For Fiscal Year 2019-20, retirement, death, and survivor benefits payments increased $1.6 billion or 6.5 percent, primarily due to cost-of-living increases in benefit payments, and an increase in the number of retirees and beneficiaries from 712,115 as of June 30, 2019, to 732,529 as of June 30, 2020. Administrative expenses for CalPERS personnel increased $0.3 billion or 107.7 percent, primarily due to an increase in the state’s pension and OPEB expenses as a result of increased net pension and OPEB liabilities.
Agenda item 6a, Attachment 1, Page 6 of 82
Management's Discussion & Analysis (Unaudited) (continued) Fiduciary Net Position – PERF (Dollars in Thousands)
PERF A PERF B PERF C
2020 PERF Total
2019 PERF Total
Increase/ (Decrease)Agent
Cost-Sharing Schools
Cost-Sharing Public
Agencies ASSETS AND DEFERRED OUTFLOWS OF
RESOURCES Cash & Cash Equivalents $364,515 $90,632 $41,575 $496,722 $664,713 ($167,991) Receivables 2,825,293 813,062 265,075 3,903,430 4,346,843 (443,413) Investments 290,570,602 72,097,875 33,150,486 395,818,963 376,301,885 19,517,078 Securities Lending Collateral 899,153 223,563 102,554 1,225,270 4,334,507 (3,109,237) Capital Assets, Net & Other Assets 251,823 62,613 28,722 343,158 422,242 (79,084) Total Assets $294,911,386 $73,287,745 $33,588,412 $401,787,543 $386,070,190 $15,717,353 Deferred Outflows of Resources $94,443 $23,482 $10,772 $128,697 $108,084 $20,613 Total Assets and Deferred Outflows of Resources $295,005,829 $73,311,227 $33,599,184 $401,916,240 $386,178,274 $15,737,966 LIABILITIES AND DEFERRED INFLOWS OF
RESOURCES Retirement Benefits, Investment Settlement & Other $5,251,008 $1,274,146 $579,210 $7,104,364 $8,219,837 ($1,115,473) Net Pension & OPEB Liabilities 758,151 188,505 86,471 1,033,127 1,004,655 28,472 Securities Lending Obligations 899,449 223,636 102,587 1,225,672 4,324,097 (3,098,425) Total Liabilities Deferred Inflows of Resources Total Liabilities and Deferred Inflows of
Resources
$6,908,608 $73,777
$6,982,385
$1,686,287 $18,344
$1,704,631
$768,268 $8,415
$776,683
$9,363,163 $100,536
$9,463,699
$13,548,589 $18,252
$13,566,841
($4,185,426) $82,284
($4,103,142)
TOTAL NET POSITION RESTRICTED FOR PENSION BENEFITS $288,023,444 $71,606,596 $32,822,501 $392,452,541 $372,611,433 $19,841,108
Changes in Fiduciary Net Position – PERF (Dollars in Thousands)
PERF A PERF B PERF C
2020 PERF Total
2019 PERF Total
Increase/ (Decrease)Agent
Cost-Sharing Schools
Cost-Sharing Public
Agencies ADDITIONS Member Contributions $3,470,691 $1,047,983 $382,326 $4,901,000 $4,664,618 $236,382 Employer Contributions 17,576,280 2,866,144 1,597,137 22,039,561 15,612,678 6,426,883 Nonemployer Contributions — 904,000 — 904,000 — 904,000 Net Investment Income 13,575,714 3,378,674 1,562,606 18,516,994 22,969,664 (4,452,670) Securities Lending & Other Income 80,151 19,861 9,092 109,104 111,079 (1,975) Plan-to-Plan Resource Movement — 164 185,743 185,907 167,612 18,295 Total Additions $34,702,836 $8,216,826 $3,736,904 $46,656,566 $43,525,651 $3,130,915
Refund of Contributions 177,375 121,560 24,245 323,180 280,266 42,914 Administrative Expenses 384,977 95,614 43,860 524,451 252,558 271,893 Plan-to-Plan Resource Movement 185,907 — — 185,907 167,612 18,295 Total Deductions $19,954,670 $4,766,971 $2,093,817 $26,815,458 $24,909,719 $1,905,739
DEDUCTIONS Retirement, Death & Survivor Benefits $19,206,411 $4,549,797 $2,025,712 $25,781,920 $24,209,283 $1,572,637
INCREASE IN NET POSITION $14,748,166 $3,449,855 $1,643,087 $19,841,108 $18,615,932 $1,225,176
NET POSITION Beginning of Year $273,275,278 $68,156,741 $31,179,414 $372,611,433 $353,995,501 $18,615,932 End of Year $288,023,444 $71,606,596 $32,822,501 $392,452,541 $372,611,433 $19,841,108
Agenda item 6a, Attachment 1, Page 7 of 82
Management's Discussion & Analysis (Unaudited) (continued)
OTHER DEFINED BENEFIT PLANS
LEGISLATORS’ RETIREMENT FUND (LRF) The LRF provides retirement benefits to California legislators elected to office before November 7, 1990, and to constitutional, legislative, and statutory officers elected or appointed prior to January 1, 2013. The number of LRF members has been declining as eligible incumbent legislators leave office and are replaced by others who are ineligible to participate in the LRF. Actuarially determined contributions will continue to be made by the State of California to supplement the existing assets until all benefit obligations have been fulfilled.
Because the LRF is closed to new members and income is primarily limited to investment returns and contributions based on a declining number of active members, CalPERS expects the net position of the fund to decrease over time.
The LRF’s net position in Fiscal Year 2019-20 decreased by less than $0.4 million or 0.3 percent from the beginning balance of $114.4 million to $114.0 million mainly due to lower return on investments. Investments at fair value decreased $0.2 million or 0.2 percent, due to the shift in the investment asset allocation and decreased market values of the holdings. The total liabilities increased slightly, mainly due to the increased net pension and OPEB liabilities in Fiscal Year 2019-20. The net pension liability increased primarily as a result of lower contributions and unfavorable difference between expected and actual experience. Net OPEB liability also increased due to a decrease in the blended discount rate.
Additions to the LRF’s net position primarily were the result of net investment income of $7.0 million in Fiscal Year 2019-20, which is 10.8 percent lower than in the prior year, or $0.8 million decrease due to unfavorable investment market conditions. The LRF recognized a MWRR of 6.2 percent for Fiscal Year 2019-20 compared with 7.0 percent for Fiscal Year 2018-19. In addition, both member and employer contributions decreased by a total of $0.2 million or 64.8 percent due to a decrease in the active members contributing to the fund.
Deductions from the LRF are primarily comprised of benefit payments, refunds, and administrative expenses. Total deductions decreased by $0.2 million or 2.4 percent due to a slight decrease in benefit payments and no refunds of contributions in Fiscal Year 2019-20, as opposed to $0.3 million refund in the prior fiscal year. This was partially offset by an increase of $0.2 million or 69.8 percent in administrative expenses for CalPERS personnel due to higher state pension and OPEB expenses as a result of increased net pension and OPEB liabilities.
JUDGES’ RETIREMENT FUND (JRF) The JRF provides retirement benefits to California Supreme and Appellate Court justices and Superior Court judges appointed or elected before November 9, 1994. The State of California does not pre-fund the benefits for this fund, and the benefits are funded on a pay-as-you-go basis.
The net position of the JRF increased $33.6 million or 330.0 percent, primarily due to increased contributions from the State General Fund. Also, the increased contributions from the State resulted in the $29.5 million or 160.8 percent increase in short-term investments. Total liabilities decreased $5.0 million or 46.1 percent, primarily due to reduced outstanding unclaimed benefits.
Additions to the JRF come from employer, member, and state balancing contributions from the General Fund. Additions increased $46.5 million or 23.0 percent, primarily due to an increase in the State General Fund contributions.
Deductions from JRF are primarily comprised of benefit payments, refunds, and administrative expenses. Retirement, death, and survivor benefits decreased by $9.2 million, or 4.1 percent, as well as administrative expenses for CalPERS personnel decreased $7.8 million or 77.4 percent, due to Fiscal Year 2018-19 costs associated with the back wages, including 10.0 percent interest, awarded to plan members in Fiscal Year 2018-19 by the court decision in the Robert Mallano judgment.
Agenda item 6a, Attachment 1, Page 8 of 82
Management's Discussion & Analysis (Unaudited) (continued) JUDGES’ RETIREMENT FUND II (JRF II) The JRF II provides retirement benefits to California Supreme and Appellate Court justices and Superior Court judges first appointed or elected on or after November 9, 1994.
The net position of JRF II in Fiscal Year 2019-20 increased by $169.9 million or 9.9 percent from the beginning net position of $1.7 billion to $1.9 billion. Receivables decreased by $1.2 million or 11.4 percent, primarily due to decreased outstanding employers’ contributions owed to the fund as of fiscal year ended June 30, 2020. JRF II investments increased by $171.8 million or 10.1 percent primarily due to positive net cash inflows from contributions less benefit payments, combined with a positive market return in Fiscal Year 2019-20. Total liabilities increased by $0.4 million or 6.0 percent primarily due to an increase in the net pension and OPEB liabilities and an increase in other liabilities. Net pension liability increased primarily as a result of lower contributions and unfavorable difference between expected and actual experience. Net OPEB liability also increased due to a decrease in the blended discount rate.
Additions to the JRF II net position include member contributions, employer contributions, and investment income. Despite a decrease in the number of active members from 1,645 as of June 30, 2019, to 1,625 as of June 30, 2020, member and employer contributions increased due to an increase in the required contribution rate and a general salary increase for state employees. Member contributions increased by $4.4 million or 14.1 percent, while employer contributions increased by $7.0 million or 8.4 percent. Net investment income decreased by $26.7 million or 25.0 percent from $106.8 million in Fiscal Year 2018-19 to $80.1 million in Fiscal Year 2019-20. This decrease resulted from a lower investment return in Fiscal Year 2019-20. The JRF II recognized a MWRR of 4.1 percent for Fiscal Year 2019-20 compared with 6.9 percent for Fiscal Year 2018-19.
Deductions from the JRF II are comprised of benefit payments, refunds of contributions to members and beneficiaries, and costs of administering the JRF II. Despite an increase in benefit recipients from 281 in Fiscal Year 2018-19 to 390 in Fiscal Year 2019-20, benefit payments decreased by $1.5 million or 4.2 percent due to a decrease in monetary credit payments in Fiscal Year 2019-20. Administrative expenses increased by $1.1 million or 72.8 percent primarily due to an increase in the state’s pension and OPEB expenses as a result of increased net pension and OPEB liabilities.
Agenda item 6a, Attachment 1, Page 9 of 82
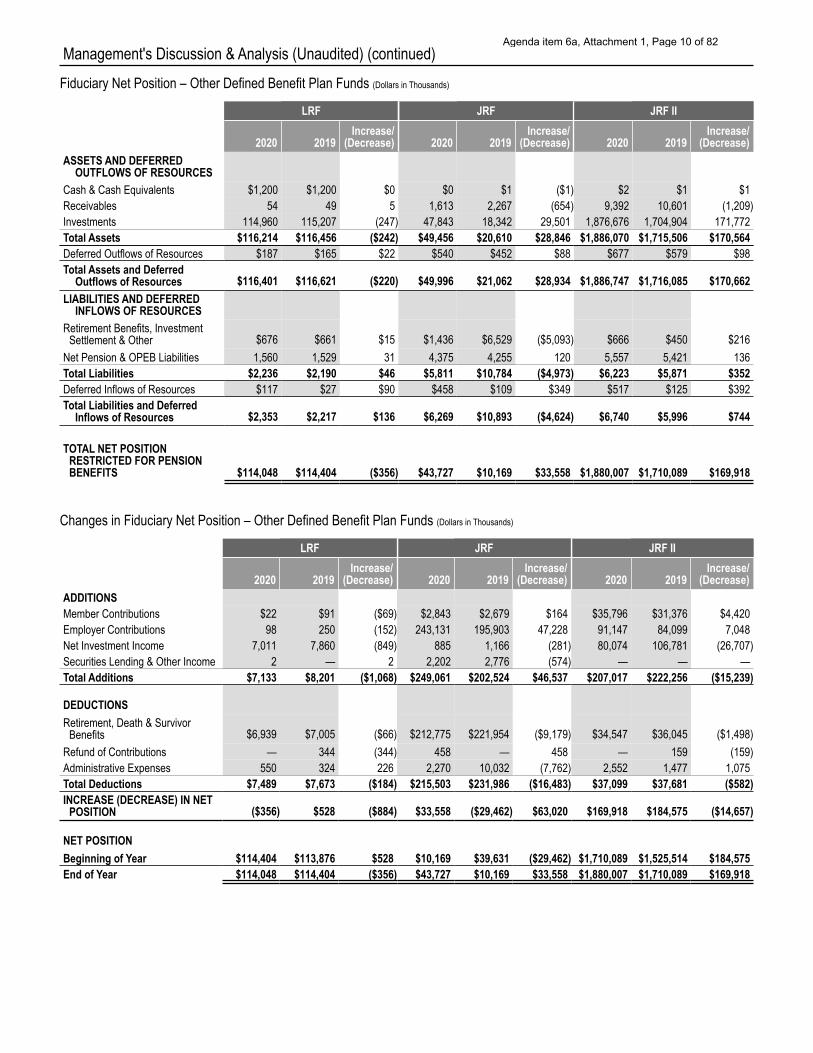
Management's Discussion & Analysis (Unaudited) (continued) Fiduciary Net Position – Other Defined Benefit Plan Funds (Dollars in Thousands)
LRF JRF JRF II
ASSETS AND DEFERRED OUTFLOWS OF RESOURCES
2020 2019 Increase/
(Decrease) 2020 2019 Increase/
(Decrease) 2020 2019 Increase/
(Decrease)
Cash & Cash Equivalents $1,200 $1,200 $0 $0 $1 ($1) $2 $1 $1 Receivables 54 49 5 1,613 2,267 (654) 9,392 10,601 (1,209) Investments 114,960 115,207 (247) 47,843 18,342 29,501 1,876,676 1,704,904 171,772 Total Assets $116,214 $116,456 ($242) $49,456 $20,610 $28,846 $1,886,070 $1,715,506 $170,564 Deferred Outflows of Resources $187 $165 $22 $540 $452 $88 $677 $579 $98 Total Assets and Deferred
Outflows of Resources $116,401 $116,621 ($220) $49,996 $21,062 $28,934 $1,886,747 $1,716,085 $170,662 LIABILITIES AND DEFERRED
INFLOWS OF RESOURCES Retirement Benefits, Investment Settlement & Other $676 $661 $15 $1,436 $6,529 ($5,093) $666 $450 $216
Net Pension & OPEB Liabilities 1,560 1,529 31 4,375 4,255 120 5,557 5,421 136 Total Liabilities Deferred Inflows of Resources
$2,236 $117
$2,190 $27
$46 $90
$5,811 $458
$10,784 $109
($4,973) $349
$6,223 $517
$5,871 $125
$352 $392
Total Liabilities and Deferred Inflows of Resources $2,353 $2,217 $136 $6,269 $10,893 ($4,624) $6,740 $5,996 $744
TOTAL NET POSITION RESTRICTED FOR PENSION BENEFITS $114,048 $114,404 ($356) $43,727 $10,169 $33,558 $1,880,007 $1,710,089 $169,918
Changes in Fiduciary Net Position – Other Defined Benefit Plan Funds (Dollars in Thousands)
LRF JRF JRF II
ADDITIONS 2020 2019
Increase/ (Decrease) 2020 2019
Increase/ (Decrease) 2020 2019
Increase/ (Decrease)
Member Contributions $22 $91 ($69) $2,843 $2,679 $164 $35,796 $31,376 $4,420 Employer Contributions 98 250 (152) 243,131 195,903 47,228 91,147 84,099 7,048 Net Investment Income 7,011 7,860 (849) 885 1,166 (281) 80,074 106,781 (26,707) Securities Lending & Other Income 2 — 2 2,202 2,776 (574) — — — Total Additions $7,133 $8,201 ($1,068) $249,061 $202,524 $46,537 $207,017 $222,256 ($15,239)
DEDUCTIONS Retirement, Death & Survivor Benefits $6,939 $7,005 ($66) $212,775 $221,954 ($9,179) $34,547 $36,045 ($1,498)
Refund of Contributions — 344 (344) 458 — 458 — 159 (159) Administrative Expenses 550 324 226 2,270 10,032 (7,762) 2,552 1,477 1,075 Total Deductions $7,489 $7,673 ($184) $215,503 $231,986 ($16,483) $37,099 $37,681 ($582) INCREASE (DECREASE) IN NET POSITION ($356) $528 ($884) $33,558 ($29,462) $63,020 $169,918 $184,575 ($14,657)
NET POSITION Beginning of Year $114,404 $113,876 $528 $10,169 $39,631 ($29,462) $1,710,089 $1,525,514 $184,575 End of Year $114,048 $114,404 ($356) $43,727 $10,169 $33,558 $1,880,007 $1,710,089 $169,918
Agenda item 6a, Attachment 1, Page 10 of 82
Management's Discussion & Analysis (Unaudited) (continued)
ASSET LIABILITY MANAGEMENT – DEFINED BENEFIT PLANS
The Asset Liability Management (ALM) process is an integrated review of pension assets and liabilities to inform decisions designed to achieve a sound and sustainable fund. CalPERS continues to expand its review of assets and liabilities so that financial risks to the System can be better understood, communicated, and managed.
To establish appropriate levels of risk, ALM is focused on investment and actuarial policies and key decision factors that are intended to drive an optimum asset allocation while stabilizing employer rates and the volatility of those rates from year to year. ALM is designed to improve the sustainability and soundness of the PERF, and the goal is to achieve 100 percent funding at an acceptable level of risk. Reducing the risk in the funding of the System will involve tradeoffs between short-term and long-term priorities.
In December 2017, the Board voted on the asset allocation of the PERF’s investment portfolio for the next four years. The Board examined four potential portfolios and their impact on the PERF. Each portfolio represented different distributions of assets based on varying rates of expected return and risk of volatility. The Board selected the portfolio with expected volatility of 11.4 percent and an expected return of 7.0 percent, which aligns with the December 2016 decision to lower the discount rate to 7.0 percent over three years.
In February 2018, the Board approved modifications to the amortization policy that shorten the period over which actuarial gains and losses are amortized from 30 to 20 years and amortize unfunded liability with level dollar payments rather than increasing payments. The effective date of the policy changes was June 30, 2019, and the changes apply only to unfunded accrued liability bases created on and after this date.
In June 2020, CalPERS’ investment staff presented updates on capital market assumptions and economic assumptions to the Board. The capital market assumptions update compared the 10-year 2020 expected returns to 2017 for the PERF and 2018 for the affiliates. The economic assumptions presented an economic overview based on the unprecedented impact caused by COVID-19. Topics addressed were U.S. unemployment, U.S. GDP, U.S. & Global responses, and the economic uncertainty forecasted. Last, the Board received a presentation regarding next step planning and preparation for the ALM cycle set to begin in 2021.
In order to better manage risks arising from terminating agencies, CalPERS has enhanced its oversight of contracting public agencies’ financial health through its development of a standardized review criteria. These improvements include streamlining the collection and termination process to reduce
the time frame, accelerating notifications to the Board and members, and adopting a risk oversight process to improve early detection of financial hardship issues. These processes and monitoring improvements support Fund Sustainability and Risk Management Goals of the CalPERS 2017-22 Strategic Plan, which aims to strengthen the long-term sustainability of the pension funds.
FUNDING ANALYSIS – DEFINED BENEFIT PLANS The Board has made several important decisions in the recent past which impact the current funding of pension benefits at CalPERS. In February 2018, the Board voted to shorten the period over which actuarial gains and losses are amortized from 30 to 20 years. Over time, these policies are designed to improve funding levels and help reduce overall funding level risk.
The JRF is funded on a pay-as-you-go basis, where short- term investments, contributions received during the year, and a State General Fund augmentation are used to provide funding for benefit payments. This funding method is generally more expensive in the long term, as the plan does not have investment returns generated by a funded plan. Without the State General Fund augmentation, the JRF will not be able to pay the accumulated benefit payments due in Fiscal Year 2020-21.
As of June 30, 2019, the funded status of the PERF was 70.2 percent. This percentage was determined by dividing the total assets in the PERF by the sum of liabilities for all plans reported under the PERF. CalPERS calculated the PERF funded status value using a 7.0 percent discount rate. As of June 30, 2019, the funded status of the JRF II was 99.4 percent. CalPERS calculated JRF II funded status value using a 6.5 percent discount rate. As of June 30, 2019, the funded status of the LRF was 116.8 percent. CalPERS calculated LRF funded status value using a 5.0 percent discount rate. All these funded statuses were calculated based on the market value of assets used in actuarial valuations that set funding requirements for employers.
Under GASB 67, there is a difference between the assumptions and components used to determine the net pension liabilities that must be reported in financial statements and the actuarial accrued liabilities and actuarial value of assets used to determine pension contributions established as part of funding valuations. The Actuarial Section included in this report provides actuarial information that was derived for purposes of establishing the funding requirements of employers for which CalPERS administers retirement benefits.
The GASB 67 financial reporting discount rate for the PERF remained at 7.15 percent. Assets used for GASB 67 financial reporting purposes are slightly greater than assets used for funding requirements, as the former include amounts for
Agenda item 6a, Attachment 1, Page 11 of 82
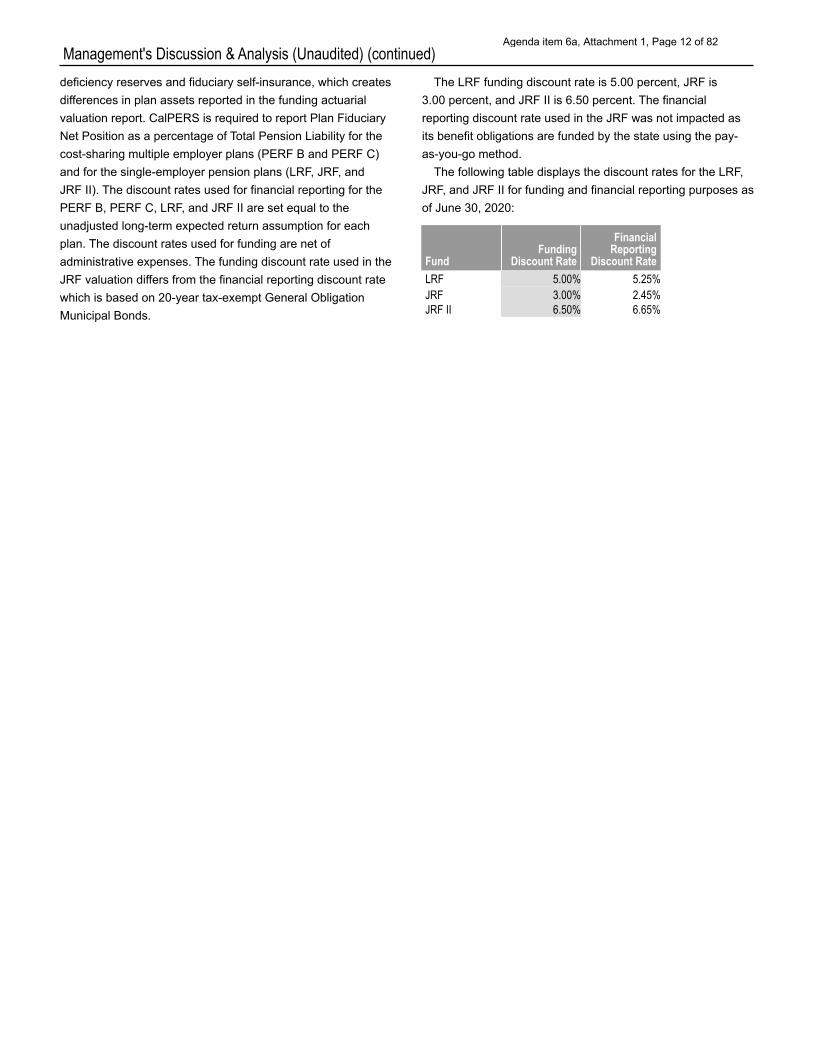
Management's Discussion & Analysis (Unaudited) (continued) deficiency reserves and fiduciary self-insurance, which creates differences in plan assets reported in the funding actuarial valuation report. CalPERS is required to report Plan Fiduciary Net Position as a percentage of Total Pension Liability for the cost-sharing multiple employer plans (PERF B and PERF C) and for the single-employer pension plans (LRF, JRF, and JRF II). The discount rates used for financial reporting for the PERF B, PERF C, LRF, and JRF II are set equal to the unadjusted long-term expected return assumption for each plan. The discount rates used for funding are net of administrative expenses. The funding discount rate used in the JRF valuation differs from the financial reporting discount rate which is based on 20-year tax-exempt General Obligation Municipal Bonds.
The LRF funding discount rate is 5.00 percent, JRF is 3.00 percent, and JRF II is 6.50 percent. The financial reporting discount rate used in the JRF was not impacted as its benefit obligations are funded by the state using the pay- as-you-go method.
The following table displays the discount rates for the LRF, JRF, and JRF II for funding and financial reporting purposes as of June 30, 2020:
Fund Funding
Discount Rate
Financial Reporting
Discount Rate LRF 5.00% 5.25% JRF 3.00% 2.45% JRF II 6.50% 6.65%
Agenda item 6a, Attachment 1, Page 12 of 82
Management's Discussion & Analysis (Unaudited) (continued)
DEFINED CONTRIBUTION PLANS
PUBLIC EMPLOYEES’ DEFERRED COMPENSATION FUND (DCF) The DCF is a fund into which CalPERS deposits contributions by employees of public agencies and school districts within the State of California that have elected to contract for a deferred compensation plan. To help administer the program, CalPERS contracts with a third-party adminstrator (TPA). In January 2020, the Board approved the renewal of a five-year contract through December 2025 with Voya Financial, LLC (Voya). As the TPA, Voya provides full recordkeeping, plan administration services, and new business development in support of the DCF.
The net position of the DCF increased by $95.2 million or 5.6 percent from the beginning balance of $1.7 billion to $1.8 billion. Investment balances increased by $96.3 million or 5.8 percent from Fiscal Year 2018-19 to Fiscal Year 2019-20, due to the investment of net inflows from contributions and return on investment exceeding participant withdrawal outflows. There was a slight decrease of $0.9 million or 4.9 percent in receivables due to less outstanding contributions at year-end. Total liabilities also decreased by $0.5 million or 7.0 percent, mainly due to lower amounts of outstanding distributions and TPA and external investment management fees payables, offset by a $0.1 million or 2.8 percent increase in total net pension and OPEB liabilities.
Member contributions in the fund decreased $101.0 million or 40.2 percent compared with the prior year primarily due to a new public agency transferring into the fund with a $130.1 million balance in July 2018, partially offset by increased contributions as a result of an increase in members from 30,733 in Fiscal Year 2018-19 to 31,821 in Fiscal Year 2019-20.
Total additions decreased $121.7 million primarily due to the $130.1 million transfer in the prior year, combined with slightly less favorable investment returns in Fiscal Year 2019-20 compared with Fiscal Year 2018-19.
Total deductions in the DCF decreased by $27.6 million or 17.2 percent. This was primarily due to a decrease of $28.6 million in participant withdrawals from the plan from $156.8 million in Fiscal Year 2018-19 to $128.2 million in Fiscal Year 2019-20. Administrative expenses for CalPERS personnel increased $1.0 million or 24.2 percent, primarily due to an increase in the state’s pension and OPEB expenses resulting from increased net pension and OPEB liabilities.
SUPPLEMENTAL CONTRIBUTIONS PROGRAM FUND (SCPF) Established on January 1, 2000, the SCPF is a member- funded program that provides supplemental retirement benefits to State of California employees who are CalPERS members. To help administer the program, CalPERS contracts with a TPA. In January 2020, the Board approved the renewal of a five-year contract through December 2025 with Voya. As the TPA, Voya provides full recordkeeping, plan administration services, and new business development in support of the SCPF.
The net position of the SCPF decreased $0.6 million or 0.5 percent from the beginning balance of $114.1 million to $113.4 million, primarily due to participant withdrawals exceeding contributions and investment income by $0.4 million. Total assets decreased by $0.7 million or 0.6 percent mainly due to a decrease in investments, and total liabilities also decreased by less than $0.1 million or 5.1 percent due to lower amounts of outstanding distributions and TPA and external investment management fees payables.
While positive returns were achieved in both current and prior years, Fiscal Year 2019-20 was slightly less favorable. Net investment income increased by $0.1 million, from $5.4 million in Fiscal Year 2018-19 to $5.5 million in Fiscal Year 2019-20 due to higher volume of investments sold.
Total additions decreased $0.1 million primarily due to decreased fee revenue from participants as a result of a decrease in members from 6,897 in Fiscal Year 2018-19 to 6,661 in Fiscal Year 2019-20.
The primary deductions in the SCPF reflect withdrawals made by participants. Participant withdrawals decreased $1.6 million, from $7.7 million as of Fiscal Year 2018-19 to $6.1 million as of Fiscal Year 2019-20. Administrative expenses for CalPERS personnel increased $0.04 million or 15.5 percent, primarily due to an increase in the state’s pension and OPEB expenses as a result of increased net pension and OPEB liabilities. Net pension liability increased primarily as a result of lower contributions and unfavorable difference between expected and actual experience. Net OPEB liability also increased due to a decrease in the blended discount rate.
Agenda item 6a, Attachment 1, Page 13 of 82
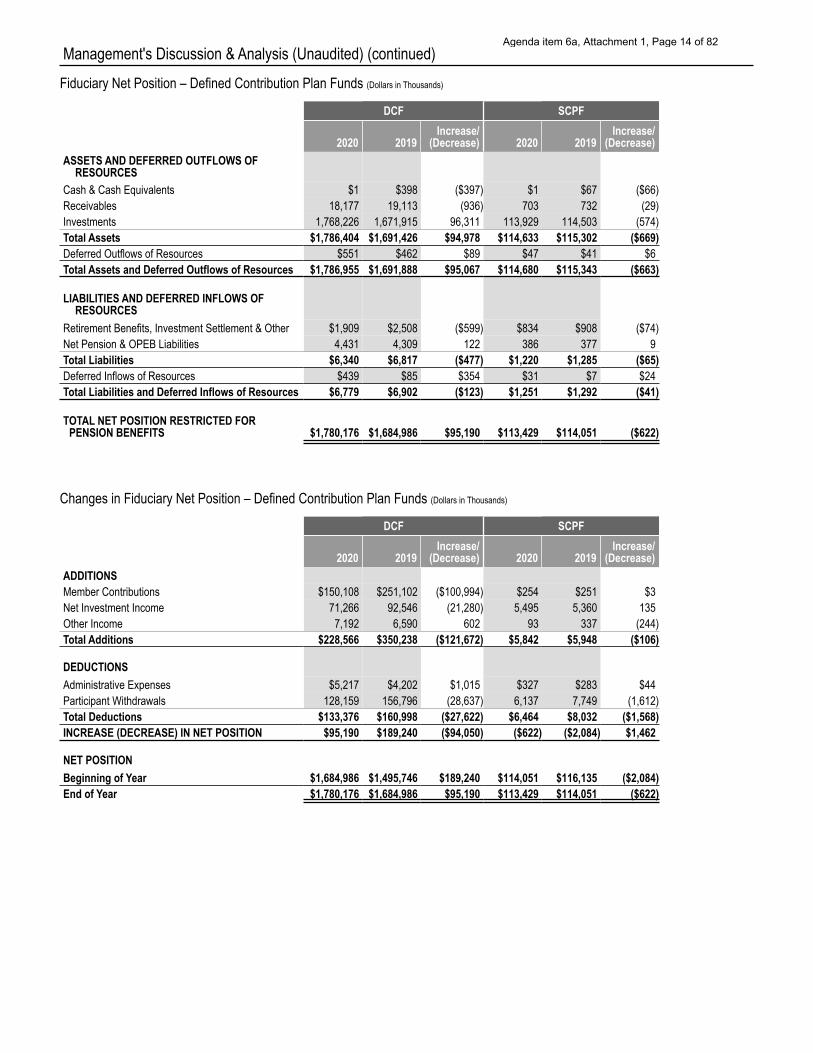
Management's Discussion & Analysis (Unaudited) (continued) Fiduciary Net Position – Defined Contribution Plan Funds (Dollars in Thousands)
DCF SCPF
ASSETS AND DEFERRED OUTFLOWS OF RESOURCES
2020 2019 Increase/
(Decrease) 2020 2019 Increase/
(Decrease)
Cash & Cash Equivalents $1 $398 ($397) $1 $67 ($66) Receivables 18,177 19,113 (936) 703 732 (29) Investments 1,768,226 1,671,915 96,311 113,929 114,503 (574) Total Assets $1,786,404 $1,691,426 $94,978 $114,633 $115,302 ($669) Deferred Outflows of Resources $551 $462 $89 $47 $41 $6 Total Assets and Deferred Outflows of Resources $1,786,955 $1,691,888 $95,067 $114,680 $115,343 ($663)
LIABILITIES AND DEFERRED INFLOWS OF RESOURCES
Retirement Benefits, Investment Settlement & Other $1,909 $2,508 ($599) $834 $908 ($74) Net Pension & OPEB Liabilities 4,431 4,309 122 386 377 9 Total Liabilities $6,340 $6,817 ($477) $1,220 $1,285 ($65) Deferred Inflows of Resources $439 $85 $354 $31 $7 $24 Total Liabilities and Deferred Inflows of Resources $6,779 $6,902 ($123) $1,251 $1,292 ($41)
TOTAL NET POSITION RESTRICTED FOR PENSION BENEFITS $1,780,176 $1,684,986 $95,190 $113,429 $114,051 ($622)
Changes in Fiduciary Net Position – Defined Contribution Plan Funds (Dollars in Thousands)
DCF SCPF
ADDITIONS 2020 2019
Increase/ (Decrease) 2020 2019
Increase/ (Decrease)
Member Contributions $150,108 $251,102 ($100,994) $254 $251 $3 Net Investment Income 71,266 92,546 (21,280) 5,495 5,360 135 Other Income 7,192 6,590 602 93 337 (244) Total Additions $228,566 $350,238 ($121,672) $5,842 $5,948 ($106)
DEDUCTIONS Administrative Expenses $5,217 $4,202 $1,015 $327 $283 $44 Participant Withdrawals 128,159 156,796 (28,637) 6,137 7,749 (1,612) Total Deductions $133,376 $160,998 ($27,622) $6,464 $8,032 ($1,568) INCREASE (DECREASE) IN NET POSITION $95,190 $189,240 ($94,050) ($622) ($2,084) $1,462
NET POSITION Beginning of Year $1,684,986 $1,495,746 $189,240 $114,051 $116,135 ($2,084) End of Year $1,780,176 $1,684,986 $95,190 $113,429 $114,051 ($622)
Agenda item 6a, Attachment 1, Page 14 of 82
Management's Discussion & Analysis (Unaudited) (continued)
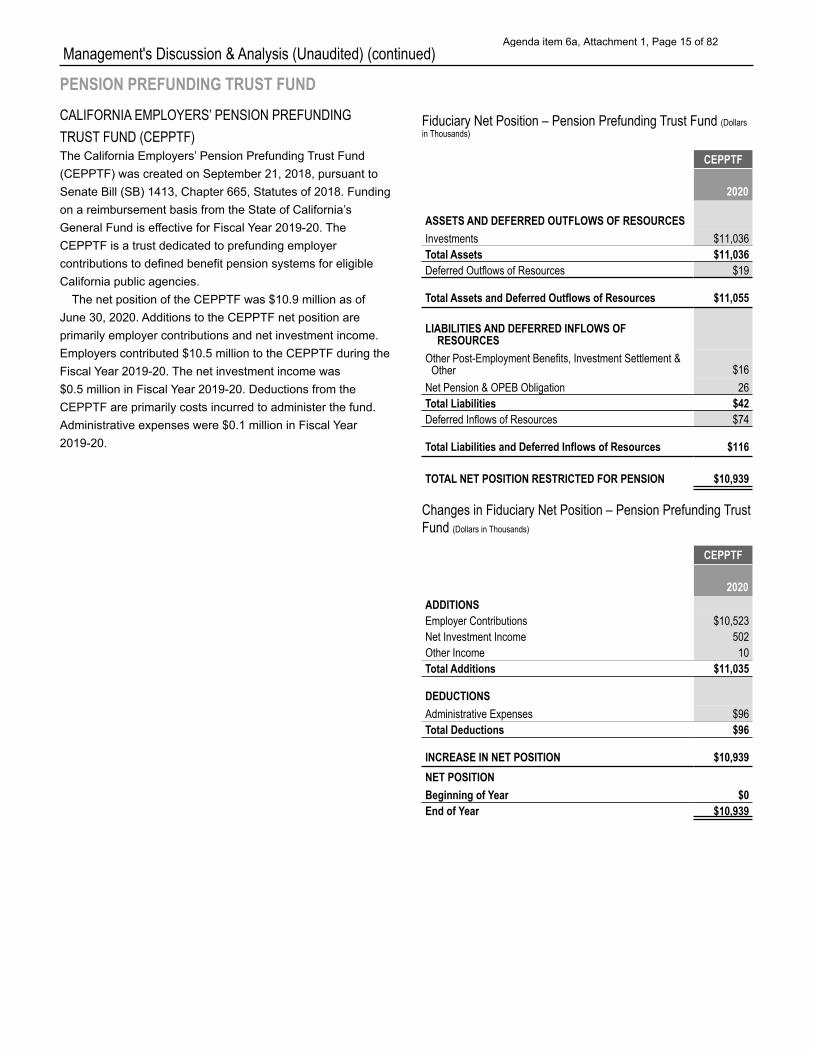
PENSION PREFUNDING TRUST FUND CALIFORNIA EMPLOYERS’ PENSION PREFUNDING TRUST FUND (CEPPTF) The California Employers’ Pension Prefunding Trust Fund (CEPPTF) was created on September 21, 2018, pursuant to Senate Bill (SB) 1413, Chapter 665, Statutes of 2018. Funding on a reimbursement basis from the State of California’s General Fund is effective for Fiscal Year 2019-20. The CEPPTF is a trust dedicated to prefunding employer contributions to defined benefit pension systems for eligible California public agencies.
The net position of the CEPPTF was $10.9 million as of June 30, 2020. Additions to the CEPPTF net position are primarily employer contributions and net investment income. Employers contributed $10.5 million to the CEPPTF during the Fiscal Year 2019-20. The net investment income was $0.5 million in Fiscal Year 2019-20. Deductions from the CEPPTF are primarily costs incurred to administer the fund. Administrative expenses were $0.1 million in Fiscal Year 2019-20.
Fiduciary Net Position – Pension Prefunding Trust Fund (Dollars in Thousands)
CEPPTF
2020
ASSETS AND DEFERRED OUTFLOWS OF RESOURCES Investments $11,036 Total Assets $11,036 Deferred Outflows of Resources $19
Total Assets and Deferred Outflows of Resources $11,055
LIABILITIES AND DEFERRED INFLOWS OF RESOURCES
Other Post-Employment Benefits, Investment Settlement & Other $16
Net Pension & OPEB Obligation 26 Total Liabilities $42 Deferred Inflows of Resources $74
Total Liabilities and Deferred Inflows of Resources $116
TOTAL NET POSITION RESTRICTED FOR PENSION $10,939
Changes in Fiduciary Net Position – Pension Prefunding Trust Fund (Dollars in Thousands)
CEPPTF
2020 ADDITIONS Employer Contributions $10,523 Net Investment Income 502 Other Income 10 Total Additions $11,035
DEDUCTIONS Administrative Expenses $96 Total Deductions $96
INCREASE IN NET POSITION $10,939 NET POSITION Beginning of Year $0 End of Year $10,939
Agenda item 6a, Attachment 1, Page 15 of 82
Management's Discussion & Analysis (Unaudited) (continued)
OTHER POST-EMPLOYMENT BENEFIT TRUST FUND CALIFORNIA EMPLOYERS’ RETIREE BENEFIT TRUST FUND (CERBTF) The CERBTF is a trust for employers to pre-fund health, dental, and other non-pension post-employment benefits. CalPERS contracts with a TPA, Northeast Retirement Services (NRS), to perform recordkeeping for individual CERBTF employer accounts.
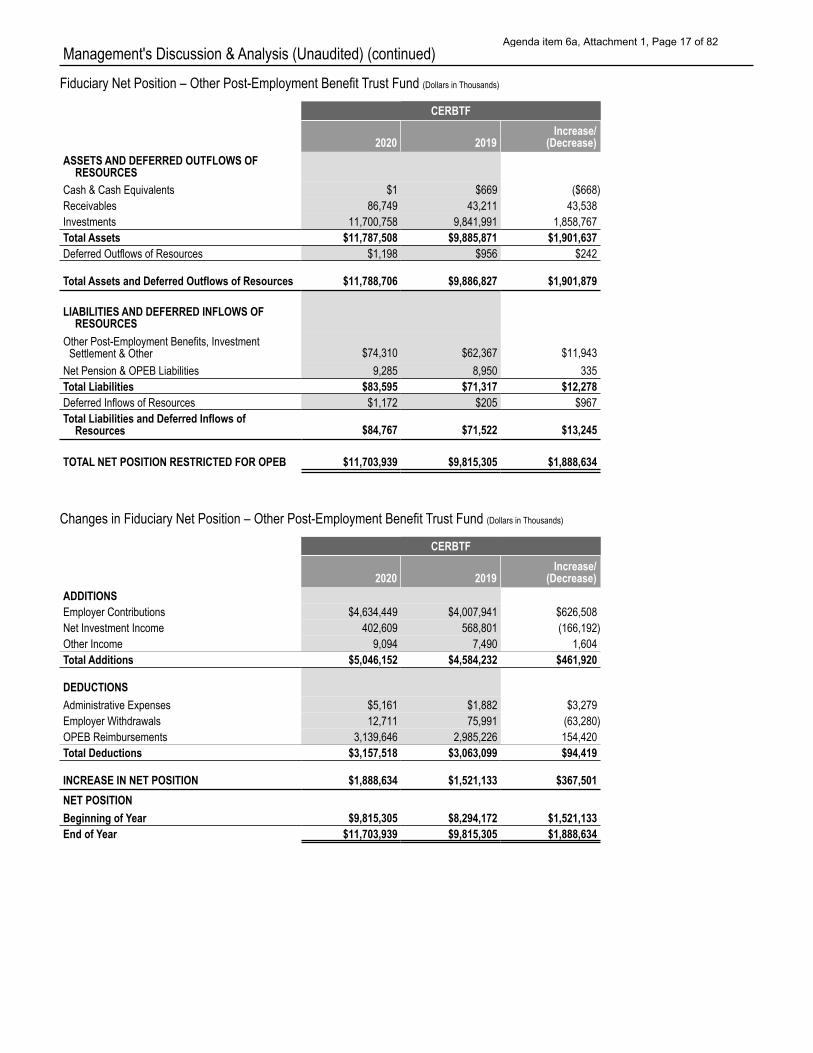
Net position restricted for OPEB benefits on June 30, 2020, increased $1.9 billion or 19.2 percent from the prior year, primarily due to continued employer contributions in Fiscal Year 2019-20, combined with continued positive investment returns. Receivables increased $43.5 million or 100.8 percent, primarily due to higher outstanding employer contributions pending at year-end. Investments at fair value increased $1.9 billion or 18.9 percent due to continued positive return on investments and the growth of assets under management from employer contributions.
Total liabilities increased $12.3 million or 17.2 percent, primarily due to increased member distributions payable. Additionally, total net pension and OPEB liabilities increased by $0.3 million or 3.7 percent. Net pension liability increased primarily as a result of lower contributions and an unfavorable difference between expected and actual experience. Net OPEB liability also increased due to a decrease in the blended discount rate.
Additions to the CERBTF net position restricted for OPEB benefits are primarily made up of employer contributions (directly to the trust and outside the trust) and net investment income. Employer contributions increased $626.5 million or 15.6 percent, primarily due to higher contributions from existing participating employers. During Fiscal Year 2019-20, the fund experienced net investment income of $402.6 million, a decrease of $166.2 million from a net investment return of $568.8 million in Fiscal Year 2018-19. Additionally, the CERBTF recognized a MWRR of 4.0 percent in Fiscal Year 2019-20, compared with 6.5 percent in Fiscal Year 2018-19.
Deductions from the CERBTF net position restricted for OPEB benefits were primarily made up of OPEB reimbursements to employers (directly from the trust and outside the trust), which increased $154.4 million or 5.2 percent, due to increased volume of reimbursement requests among existing participating employers. Employer withdrawals decreased by $63.3 million or 83.3 percent, due to a lower amount of balance transfers out of the plan. The amounts reported for contributions and reimbursements made directly by employers to health care providers outside the trust amounted to $3.0 billion for Fiscal Year 2019-20 compared with $2.9 billion in Fiscal Year 2018-19. Administrative expenses for CalPERS personnel increased $3.3 million primarily due to an increase in the state’s pension and OPEB expenses as a result of increased net pension and OPEB liabilities.
Agenda item 6a, Attachment 1, Page 16 of 82
Management's Discussion & Analysis (Unaudited) (continued) Fiduciary Net Position – Other Post-Employment Benefit Trust Fund (Dollars in Thousands)
CERBTF
ASSETS AND DEFERRED OUTFLOWS OF RESOURCES
2020 2019 Increase/
(Decrease)
Cash & Cash Equivalents $1 $669 ($668) Receivables 86,749 43,211 43,538 Investments 11,700,758 9,841,991 1,858,767 Total Assets $11,787,508 $9,885,871 $1,901,637 Deferred Outflows of Resources $1,198 $956 $242
Total Assets and Deferred Outflows of Resources $11,788,706 $9,886,827 $1,901,879
LIABILITIES AND DEFERRED INFLOWS OF RESOURCES
Other Post-Employment Benefits, Investment Settlement & Other $74,310 $62,367 $11,943
Net Pension & OPEB Liabilities 9,285 8,950 335 Total Liabilities $83,595 $71,317 $12,278 Deferred Inflows of Resources $1,172 $205 $967 Total Liabilities and Deferred Inflows of
Resources $84,767 $71,522 $13,245
TOTAL NET POSITION RESTRICTED FOR OPEB $11,703,939 $9,815,305 $1,888,634
Changes in Fiduciary Net Position – Other Post-Employment Benefit Trust Fund (Dollars in Thousands)
CERBTF
ADDITIONS 2020 2019
Increase/ (Decrease)
Employer Contributions $4,634,449 $4,007,941 $626,508 Net Investment Income 402,609 568,801 (166,192) Other Income 9,094 7,490 1,604 Total Additions $5,046,152 $4,584,232 $461,920
DEDUCTIONS Administrative Expenses $5,161 $1,882 $3,279 Employer Withdrawals 12,711 75,991 (63,280) OPEB Reimbursements 3,139,646 2,985,226 154,420 Total Deductions $3,157,518 $3,063,099 $94,419
INCREASE IN NET POSITION $1,888,634 $1,521,133 $367,501 NET POSITION Beginning of Year $9,815,305 $8,294,172 $1,521,133 End of Year $11,703,939 $9,815,305 $1,888,634
Agenda item 6a, Attachment 1, Page 17 of 82
Management's Discussion & Analysis (Unaudited) (continued)
CUSTODIAL FUNDS
REPLACEMENT BENEFIT FUND (RBF) The RBF is a qualified excess benefit arrangement pursuant to Internal Revenue Code (IRC) section 415(m) and provides for the replacement of the portion of retirement allowance that exceeds IRC section 415(b) dollar limits. Employers are invoiced by CalPERS for amounts payable to their former employees, and CalPERS subsequently pays the replacement benefit to retirees. Participants of the RBF cover the administrative costs to maintain the fund.
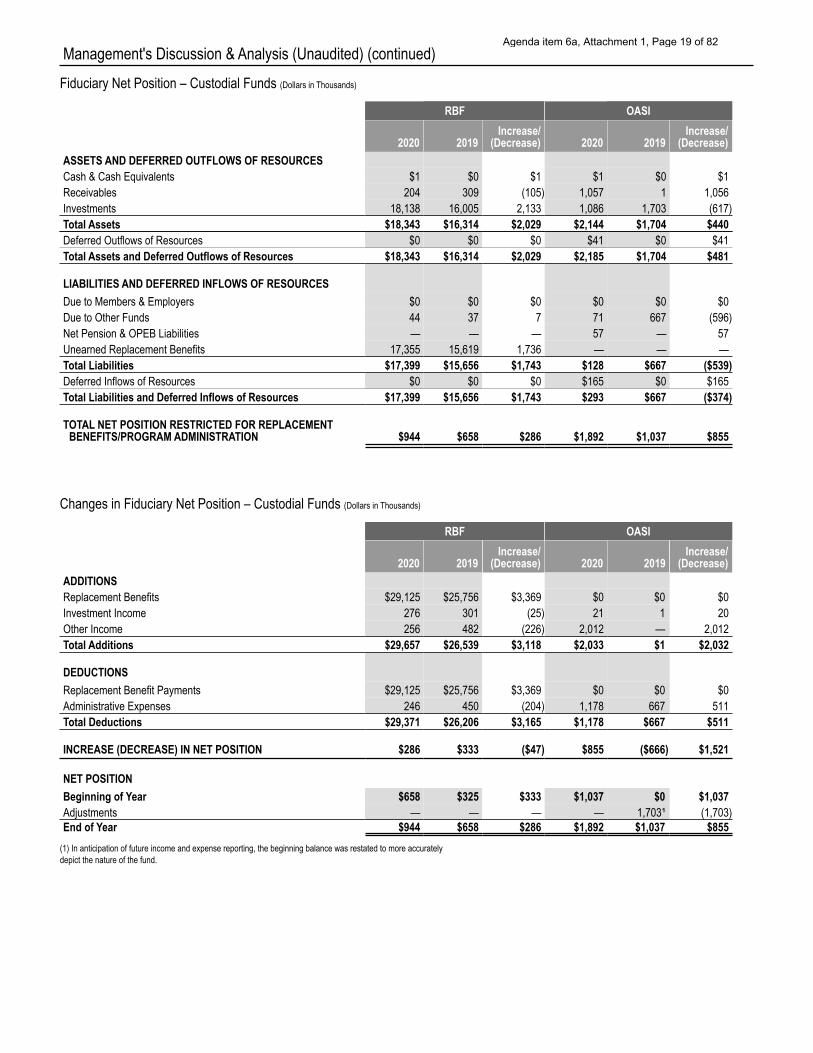
The net position of the RBF increased by $0.3 million or 43.5 percent, primarily due to an increase in the number of retirees receiving benefits. As a result, employer contributions increased $3.4 million or 13.1 percent, primarily due to more retirees participating in the plan.
Additions to the fund include replacement benefits, investment income and other income. Other income decreased $226 thousand or 46.9 percent, primarily due to a temporary cancellation of the administrative fees beginning January 1, 2020.
Deductions from the RBF include benefit payments, which increased $3.4 million or 13.1 percent due to an increase in the number of retirees receiving benefits from 1,383 as of June 30, 2019, to 1,496 as of June 30, 2020.
OLD AGE AND SURVIVORS’ INSURANCE REVOLVING FUND (OASI) The OASI was established to consolidate the collection and payment of employee and employer contributions for California public agencies under the provisions of the federal Social Security regulations.
The Board serves as the State Social Security Administrator (SSSA). Between 1955 and 1986, the SSSA was responsible for collecting Social Security and Medicare taxes from public employers. Effective January 1, 1987, with the enactment of the Omnibus Budget Reconciliation Act of 1986, the responsibility of collecting taxes moved from CalPERS to the Internal Revenue Service and the SSSA has been operating since 1987 using the interest that was earned on the OASI. The OASI funds have diminished, requiring additional funding to pay for the costs of administering the SSSA program. CalPERS started charging participating agencies a specified fee to pay for these costs in Fiscal Year 2019-20.
The net position of the OASI increased by $0.9 million or 82.4 percent, primarily due to the collection of fees from the participating agencies. Total assets increased $0.4 million or 25.8 percent in Fiscal Year 2019-20 due to an increased number of fee receivables. Total liabilities decreased in Fiscal Year 2019-20 by $0.5 million or 80.8 percent due to a lower outstanding liability for administrative expenses than in the prior fiscal year.
Additions to the fund include investment income and fees that amounted to $2.0 million for the fiscal year. Deductions from the OASI are primarily costs incurred to administer the fund. Administrative expenses for CalPERS personnel increased $0.5 million or 76.6 percent in Fiscal Year 2019-20 due to an increased involvement in the fund.
Agenda item 6a, Attachment 1, Page 18 of 82
Management's Discussion & Analysis (Unaudited) (continued) Fiduciary Net Position – Custodial Funds (Dollars in Thousands)
RBF OASI
ASSETS AND DEFERRED OUTFLOWS OF RESOURCES 2020 2019
Increase/ (Decrease) 2020 2019
Increase/ (Decrease)
Cash & Cash Equivalents $1 $0 $1 $1 $0 $1 Receivables 204 309 (105) 1,057 1 1,056 Investments 18,138 16,005 2,133 1,086 1,703 (617) Total Assets $18,343 $16,314 $2,029 $2,144 $1,704 $440 Deferred Outflows of Resources $0 $0 $0 $41 $0 $41 Total Assets and Deferred Outflows of Resources $18,343 $16,314 $2,029 $2,185 $1,704 $481
LIABILITIES AND DEFERRED INFLOWS OF RESOURCES Due to Members & Employers $0 $0 $0 $0 $0 $0 Due to Other Funds 44 37 7 71 667 (596) Net Pension & OPEB Liabilities — — — 57 — 57 Unearned Replacement Benefits 17,355 15,619 1,736 — — — Total Liabilities $17,399 $15,656 $1,743 $128 $667 ($539) Deferred Inflows of Resources $0 $0 $0 $165 $0 $165 Total Liabilities and Deferred Inflows of Resources $17,399 $15,656 $1,743 $293 $667 ($374)
TOTAL NET POSITION RESTRICTED FOR REPLACEMENT BENEFITS/PROGRAM ADMINISTRATION $944 $658 $286 $1,892 $1,037 $855
Changes in Fiduciary Net Position – Custodial Funds (Dollars in Thousands)
RBF OASI
ADDITIONS 2020 2019
Increase/ (Decrease) 2020 2019
Increase/ (Decrease)
Replacement Benefits $29,125 $25,756 $3,369 $0 $0 $0 Investment Income 276 301 (25) 21 1 20 Other Income 256 482 (226) 2,012 — 2,012 Total Additions $29,657 $26,539 $3,118 $2,033 $1 $2,032
DEDUCTIONS Replacement Benefit Payments $29,125 $25,756 $3,369 $0 $0 $0 Administrative Expenses 246 450 (204) 1,178 667 511 Total Deductions $29,371 $26,206 $3,165 $1,178 $667 $511
INCREASE (DECREASE) IN NET POSITION $286 $333 ($47) $855 ($666) $1,521
NET POSITION Beginning of Year $658 $325 $333 $1,037 $0 $1,037 Adjustments — — — — 1,703¹ (1,703) End of Year $944 $658 $286 $1,892 $1,037 $855
(1) In anticipation of future income and expense reporting, the beginning balance was restated to more accurately depict the nature of the fund.
Agenda item 6a, Attachment 1, Page 19 of 82
Management's Discussion & Analysis (Unaudited) (continued)
ENTERPRISE FUNDS
PUBLIC EMPLOYEES’ HEALTH CARE FUND (HCF) The HCF accounts for the activities of the CalPERS self- funded health plans (PERS Choice, PERSCare, and PERS Select), and flex-funded health plans (Anthem Blue Cross, Blue Shield of California, Health Net, Sharp, UnitedHealthcare, and Western Health Advantage).
The net position of the HCF in Fiscal Year 2019-20 decreased by $49.9 million or 13.3 percent from the beginning net position of $375.4 million to $325.5 million.
Total assets decreased by $33.3 million or 2.5 percent. Cash and cash equivalents decreased by $94.4 million or 25.4 percent as the fund continues to liquidate its short-term investments to cover claim expenses in excess of the premiums revenue. Total liabilities increased $10.2 million or 1.0 percent primarily due to an increase in estimated insurance claims due.
Revenues include premiums collected from members and employers, federal subsidies, and investment income (non- operating revenue). Premiums collected increased by $25.4 million or 0.7 percent, primarily due to an increase in premium rates. Investment income increased by $2.0 million or 3.8 percent due to improved performance in the fixed income market.
Expenses are comprised of claims, investment fees, and costs incurred to oversee the plans. Claim expenses decreased by $68.2 million, or 1.9 percent due to a decrease in medical claims. Administrative expenses for CalPERS personnel increased by $32.3 million or 10.8 percent, primarily due to an increase in the state’s pension and OPEB expenses resulting from increased net pension and OPEB liabilities.
PUBLIC EMPLOYEES’ CONTINGENCY RESERVE FUND (CRF) The CRF was established to fund administrative costs related to the CalPERS health care programs and to provide a contingency reserve for potential increases in future health care premium rates and health care benefit costs.
The net position of the CRF in Fiscal Year 2019-20 was negative $54.2 million, a decrease of $5.9 million or 12.3 percent from the beginning net position of negative $48.3 million primarily due to an increase in pension and OPEB expenses.
Cash and cash equivalents increased by $84.8 million or 13.2 percent primarily due to timing as there was an increase in outstanding payables to health carriers in Fiscal Year 2019-20 compared to the prior year. Total receivables decreased by $5.6 million or 20.6 percent primarily due to a decrease in direct pay premiums due from health carriers combined with a decrease in outstanding interest receivables. Total liabilities increased by $80.5 million or 11.1 percent primarily due to more premiums pending to be remitted to health carriers as of June 30, 2020. Net pension and OPEB liabilities increased by $2.2 million or 3.0 percent. Net pension liability increased primarily as a result of lower contributions and unfavorable differences between expected and actual experience. Net OPEB liability also increased due to a decrease in the blended discount rate.
Revenues include administrative fees collected and investment income. Administrative fees are determined as a percentage of total active and retired health premiums. These fees increased by $3.4 million or 15.4 percent primarily due to an increase in the administrative fee rate from 0.23 percent in Fiscal Year 2018-19 to 0.27 percent in Fiscal Year 2019-20. Investment income increased by $0.2 million or 3.6 percent due to an increase in short-term investments.
Expenses are comprised of investment fees and costs incurred to administer the CRF. Administrative expenses for CalPERS personnel increased by $19.1 million or 101.4 percent, primarily due to an increase in the state’s pension and OPEB expenses resulting from increased net pension and OPEB liabilities.
Agenda item 6a, Attachment 1, Page 20 of 82
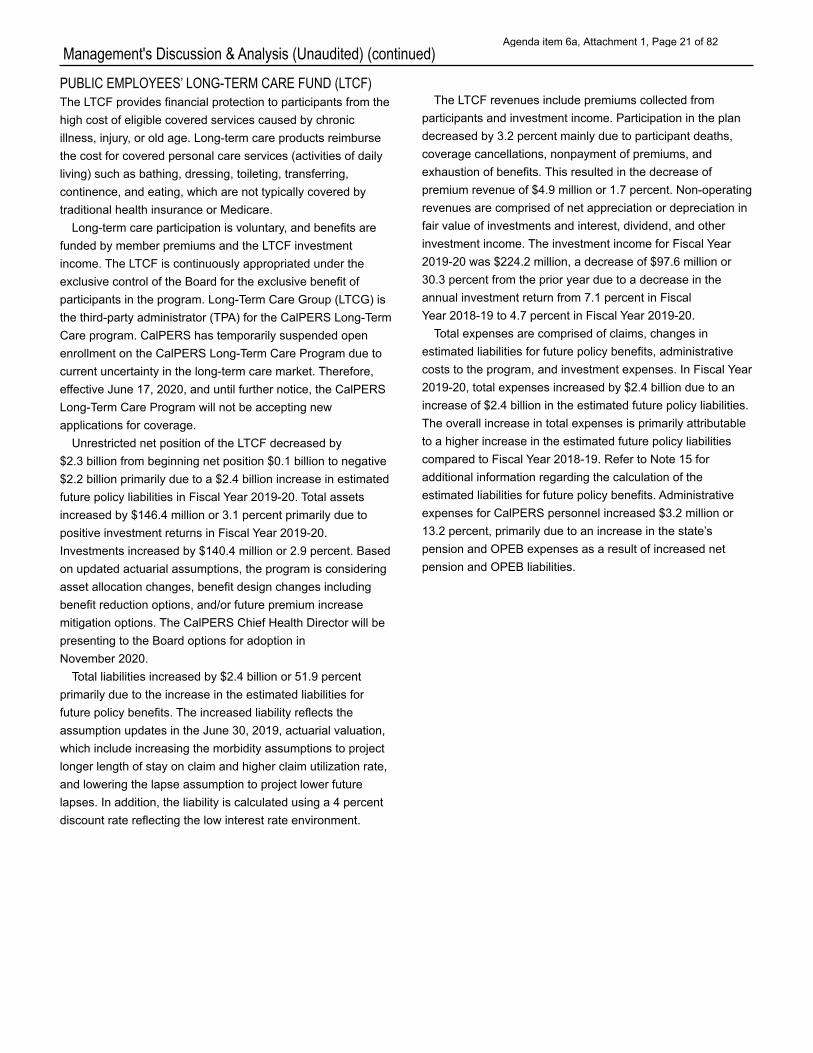
Management's Discussion & Analysis (Unaudited) (continued) PUBLIC EMPLOYEES’ LONG-TERM CARE FUND (LTCF) The LTCF provides financial protection to participants from the high cost of eligible covered services caused by chronic illness, injury, or old age. Long-term care products reimburse the cost for covered personal care services (activities of daily living) such as bathing, dressing, toileting, transferring, continence, and eating, which are not typically covered by traditional health insurance or Medicare.
Long-term care participation is voluntary, and benefits are funded by member premiums and the LTCF investment income. The LTCF is continuously appropriated under the exclusive control of the Board for the exclusive benefit of participants in the program. Long-Term Care Group (LTCG) is the third-party administrator (TPA) for the CalPERS Long-Term Care program. CalPERS has temporarily suspended open enrollment on the CalPERS Long-Term Care Program due to current uncertainty in the long-term care market. Therefore, effective June 17, 2020, and until further notice, the CalPERS Long-Term Care Program will not be accepting new applications for coverage.
Unrestricted net position of the LTCF decreased by $2.3 billion from beginning net position $0.1 billion to negative $2.2 billion primarily due to a $2.4 billion increase in estimated future policy liabilities in Fiscal Year 2019-20. Total assets increased by $146.4 million or 3.1 percent primarily due to positive investment returns in Fiscal Year 2019-20. Investments increased by $140.4 million or 2.9 percent. Based on updated actuarial assumptions, the program is considering asset allocation changes, benefit design changes including benefit reduction options, and/or future premium increase mitigation options. The CalPERS Chief Health Director will be presenting to the Board options for adoption in November 2020.
Total liabilities increased by $2.4 billion or 51.9 percent primarily due to the increase in the estimated liabilities for future policy benefits. The increased liability reflects the assumption updates in the June 30, 2019, actuarial valuation, which include increasing the morbidity assumptions to project longer length of stay on claim and higher claim utilization rate, and lowering the lapse assumption to project lower future lapses. In addition, the liability is calculated using a 4 percent discount rate reflecting the low interest rate environment.
The LTCF revenues include premiums collected from participants and investment income. Participation in the plan decreased by 3.2 percent mainly due to participant deaths, coverage cancellations, nonpayment of premiums, and exhaustion of benefits. This resulted in the decrease of premium revenue of $4.9 million or 1.7 percent. Non-operating revenues are comprised of net appreciation or depreciation in fair value of investments and interest, dividend, and other investment income. The investment income for Fiscal Year 2019-20 was $224.2 million, a decrease of $97.6 million or 30.3 percent from the prior year due to a decrease in the annual investment return from 7.1 percent in Fiscal Year 2018-19 to 4.7 percent in Fiscal Year 2019-20.
Total expenses are comprised of claims, changes in estimated liabilities for future policy benefits, administrative costs to the program, and investment expenses. In Fiscal Year 2019-20, total expenses increased by $2.4 billion due to an increase of $2.4 billion in the estimated future policy liabilities. The overall increase in total expenses is primarily attributable to a higher increase in the estimated future policy liabilities compared to Fiscal Year 2018-19. Refer to Note 15 for additional information regarding the calculation of the estimated liabilities for future policy benefits. Administrative expenses for CalPERS personnel increased $3.2 million or 13.2 percent, primarily due to an increase in the state’s pension and OPEB expenses as a result of increased net pension and OPEB liabilities.
Agenda item 6a, Attachment 1, Page 21 of 82
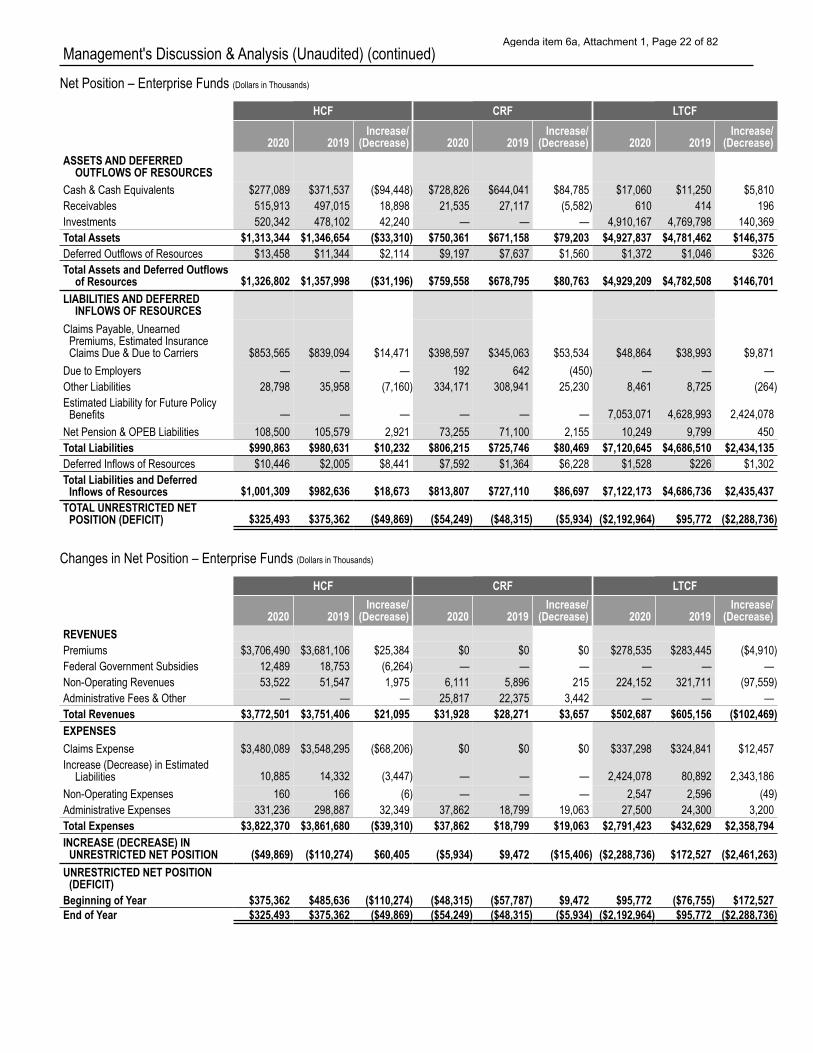
Management's Discussion & Analysis (Unaudited) (continued) Net Position – Enterprise Funds (Dollars in Thousands)
HCF CRF LTCF
ASSETS AND DEFERRED OUTFLOWS OF RESOURCES
2020 2019 Increase/
(Decrease) 2020 2019 Increase/
(Decrease) 2020 2019 Increase/
(Decrease)
Cash & Cash Equivalents $277,089 $371,537 ($94,448) $728,826 $644,041 $84,785 $17,060 $11,250 $5,810 Receivables 515,913 497,015 18,898 21,535 27,117 (5,582) 610 414 196 Investments 520,342 478,102 42,240 — — — 4,910,167 4,769,798 140,369 Total Assets $1,313,344 $1,346,654 ($33,310) $750,361 $671,158 $79,203 $4,927,837 $4,781,462 $146,375 Deferred Outflows of Resources $13,458 $11,344 $2,114 $9,197 $7,637 $1,560 $1,372 $1,046 $326 Total Assets and Deferred Outflows
of Resources $1,326,802 $1,357,998 ($31,196) $759,558 $678,795 $80,763 $4,929,209 $4,782,508 $146,701 LIABILITIES AND DEFERRED
INFLOWS OF RESOURCES Claims Payable, Unearned Premiums, Estimated Insurance Claims Due & Due to Carriers $853,565 $839,094 $14,471 $398,597 $345,063 $53,534 $48,864 $38,993 $9,871
Due to Employers — — — 192 642 (450) — — — Other Liabilities 28,798 35,958 (7,160) 334,171 308,941 25,230 8,461 8,725 (264) Estimated Liability for Future Policy Benefits — — — — — — 7,053,071 4,628,993 2,424,078
Net Pension & OPEB Liabilities 108,500 105,579 2,921 73,255 71,100 2,155 10,249 9,799 450 Total Liabilities $990,863 $980,631 $10,232 $806,215 $725,746 $80,469 $7,120,645 $4,686,510 $2,434,135 Deferred Inflows of Resources $10,446 $2,005 $8,441 $7,592 $1,364 $6,228 $1,528 $226 $1,302 Total Liabilities and Deferred Inflows of Resources $1,001,309 $982,636 $18,673 $813,807 $727,110 $86,697 $7,122,173 $4,686,736 $2,435,437
TOTAL UNRESTRICTED NET POSITION (DEFICIT) $325,493 $375,362 ($49,869) ($54,249) ($48,315) ($5,934) ($2,192,964) $95,772 ($2,288,736)
Changes in Net Position – Enterprise Funds (Dollars in Thousands)
HCF CRF LTCF
REVENUES 2020 2019
Increase/ (Decrease) 2020 2019
Increase/ (Decrease) 2020 2019
Increase/ (Decrease)
Premiums $3,706,490 $3,681,106 $25,384 $0 $0 $0 $278,535 $283,445 ($4,910) Federal Government Subsidies 12,489 18,753 (6,264) — — — — — — Non-Operating Revenues 53,522 51,547 1,975 6,111 5,896 215 224,152 321,711 (97,559) Administrative Fees & Other — — — 25,817 22,375 3,442 — — — Total Revenues $3,772,501 $3,751,406 $21,095 $31,928 $28,271 $3,657 $502,687 $605,156 ($102,469) EXPENSES Claims Expense $3,480,089 $3,548,295 ($68,206) $0 $0 $0 $337,298 $324,841 $12,457 Increase (Decrease) in Estimated
Liabilities 10,885 14,332 (3,447) — — — 2,424,078 80,892 2,343,186 Non-Operating Expenses 160 166 (6) — — — 2,547 2,596 (49) Administrative Expenses 331,236 298,887 32,349 37,862 18,799 19,063 27,500 24,300 3,200 Total Expenses $3,822,370 $3,861,680 ($39,310) $37,862 $18,799 $19,063 $2,791,423 $432,629 $2,358,794 INCREASE (DECREASE) IN UNRESTRICTED NET POSITION ($49,869) ($110,274) $60,405 ($5,934) $9,472 ($15,406) ($2,288,736) $172,527 ($2,461,263)
UNRESTRICTED NET POSITION (DEFICIT)
Beginning of Year $375,362 $485,636 ($110,274) ($48,315) ($57,787) $9,472 $95,772 ($76,755) $172,527 End of Year $325,493 $375,362 ($49,869) ($54,249) ($48,315) ($5,934) ($2,192,964) $95,772 ($2,288,736)
Agenda item 6a, Attachment 1, Page 22 of 82

Management's Discussion & Analysis (Unaudited) (continued)
REQUESTS FOR INFORMATION
This financial report is designed to provide a general overview of CalPERS finances. Address questions concerning any of the information provided in this report or requests for additional financial information to the CalPERS Financial Office, P.O. Box 942703, Sacramento, CA, 94229-2703, or call 888 CalPERS (or 888-225-7377).
Agenda item 6a, Attachment 1, Page 23 of 82
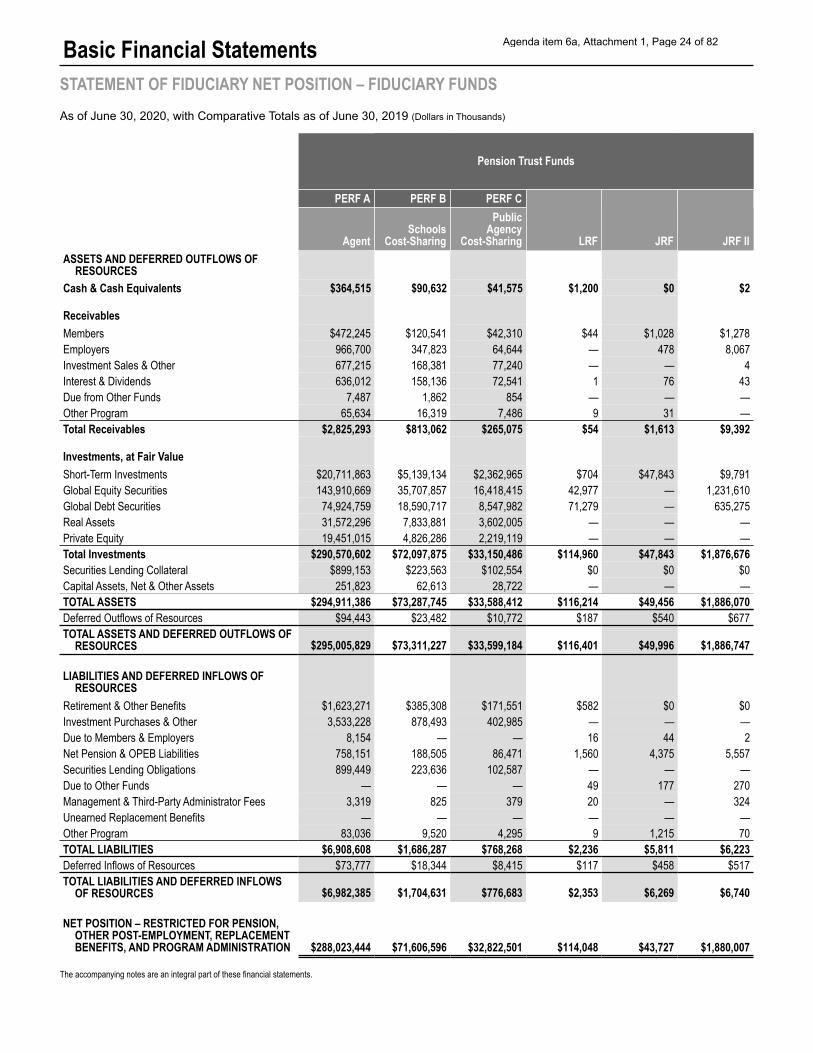
Basic Financial Statements STATEMENT OF FIDUCIARY NET POSITION – FIDUCIARY FUNDS As of June 30, 2020, with Comparative Totals as of June 30, 2019 (Dollars in Thousands)
Pension Trust Funds
PERF A PERF B PERF C
LRF JRF JRF IIAgent Schools
Cost-Sharing
Public Agency
Cost-Sharing ASSETS AND DEFERRED OUTFLOWS OF
RESOURCES Cash & Cash Equivalents $364,515 $90,632 $41,575 $1,200 $0 $2
Receivables Members Employers 966,700 347,823 64,644 — 478 8,067 Investment Sales & Other 677,215 168,381 77,240 — — 4 Interest & Dividends 636,012 158,136 72,541 1 76 43 Due from Other Funds 7,487 1,862 854 — — — Other Program 65,634 16,319 7,486 9 31 — Total Receivables $2,825,293 $813,062 $265,075 $54 $1,613 $9,392
Investments, at Fair Value Short-Term Investments $20,711,863 $5,139,134 $2,362,965 $704 $47,843 $9,791 Global Equity Securities 143,910,669 35,707,857 16,418,415 42,977 — 1,231,610 Global Debt Securities 74,924,759 18,590,717 8,547,982 71,279 — 635,275 Real Assets 31,572,296 7,833,881 3,602,005 — — — Private Equity 19,451,015 4,826,286 2,219,119 — — — Total Investments $290,570,602 $72,097,875 $33,150,486 $114,960 $47,843 $1,876,676 Securities Lending Collateral $899,153 $223,563 $102,554 $0 $0 $0 Capital Assets, Net & Other Assets 251,823 62,613 28,722 — — — TOTAL ASSETS $294,911,386 $73,287,745 $33,588,412 $116,214 $49,456 $1,886,070 Deferred Outflows of Resources $94,443 $23,482 $10,772 $187 $540 $677 TOTAL ASSETS AND DEFERRED OUTFLOWS OF
RESOURCES $295,005,829 $73,311,227 $33,599,184 $116,401 $49,996 $1,886,747
LIABILITIES AND DEFERRED INFLOWS OF RESOURCES
Retirement & Other Benefits $1,623,271 $385,308 $171,551 $582 $0 $0 Investment Purchases & Other 3,533,228 878,493 402,985 — — — Due to Members & Employers 8,154 — — 16 44 2 Net Pension & OPEB Liabilities 758,151 188,505 86,471 1,560 4,375 5,557 Securities Lending Obligations 899,449 223,636 102,587 — — — Due to Other Funds — — — 49 177 270 Management & Third-Party Administrator Fees 3,319 825 379 20 — 324 Unearned Replacement Benefits — — — — — — Other Program 83,036 9,520 4,295 9 1,215 70 TOTAL LIABILITIES $6,908,608 $1,686,287 $768,268 $2,236 $5,811 $6,223 Deferred Inflows of Resources $73,777 $18,344 $8,415 $117 $458 $517 TOTAL LIABILITIES AND DEFERRED INFLOWS
OF RESOURCES $6,982,385 $1,704,631 $776,683 $2,353 $6,269 $6,740
NET POSITION – RESTRICTED FOR PENSION, OTHER POST-EMPLOYMENT, REPLACEMENT BENEFITS, AND PROGRAM ADMINISTRATION $288,023,444 $71,606,596 $32,822,501 $114,048 $43,727 $1,880,007
$472,245 $120,541 $42,310 $44 $1,028 $1,278
The accompanying notes are an integral part of these financial statements.
Agenda item 6a, Attachment 1, Page 24 of 82
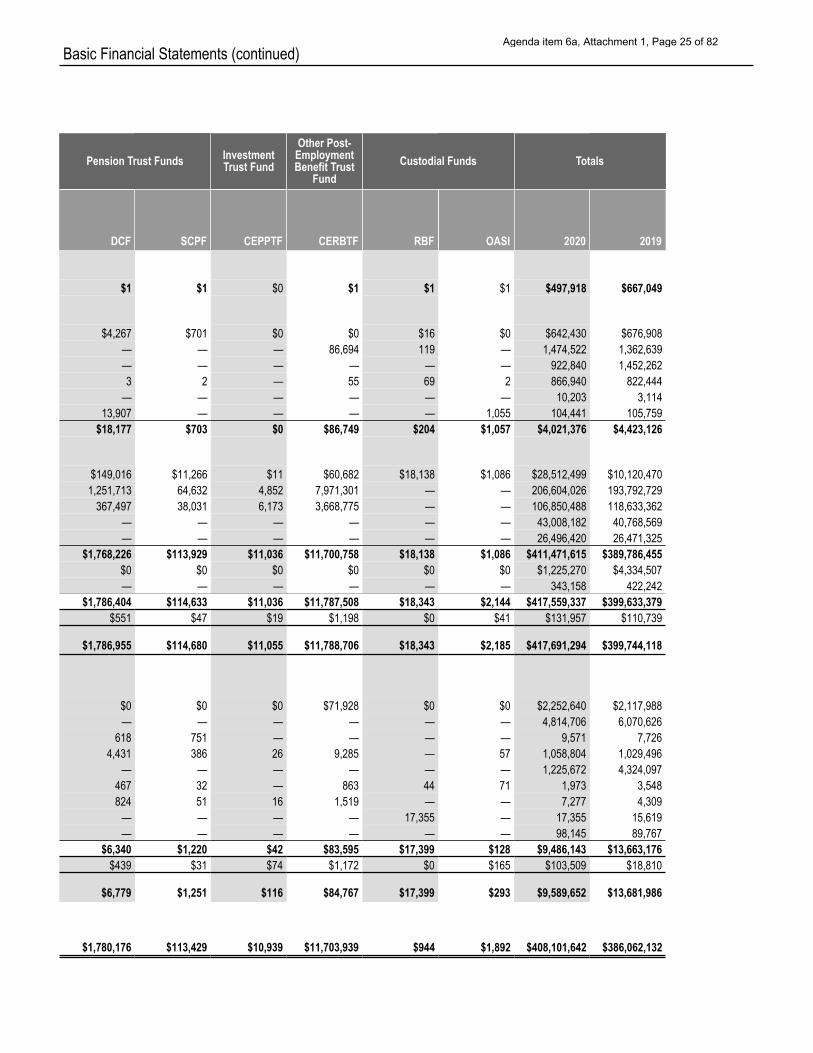
Basic Financial Statements (continued)
Pension Trust Funds Investment Trust Fund
Other Post- Employment Benefit Trust
Fund Custodial Funds Totals
DCF SCPF CEPPTF CERBTF RBF OASI 2020 2019
$1 $1 $0 $1 $1 $1 $497,918 $667,049
$4,267 $701 $0 $0 $16 $0 $642,430 $676,908 — — — 86,694 119 — 1,474,522 1,362,639 — — — — — — 922,840 1,452,262 3 2 — 55 69 2 866,940 822,444
— — — — — — 10,203 3,114 13,907 — — — — 1,055 104,441 105,759
$18,177 $703 $0 $86,749 $204 $1,057 $4,021,376 $4,423,126
$149,016 $11,266 $11 $60,682 $18,138 $1,086 $28,512,499 $10,120,470 1,251,713 64,632 4,852 7,971,301 — — 206,604,026 193,792,729
367,497 38,031 6,173 3,668,775 — — 106,850,488 118,633,362 — — — — — — 43,008,182 40,768,569 — — — — — — 26,496,420 26,471,325
$1,768,226 $113,929 $11,036 $11,700,758 $18,138 $1,086 $411,471,615 $389,786,455 $0 $0 $0 $0 $0 $0 $1,225,270 $4,334,507 — — — — — — 343,158 422,242
$1,786,404 $114,633 $11,036 $11,787,508 $18,343 $2,144 $417,559,337 $399,633,379 $551 $47 $19 $1,198 $0 $41 $131,957 $110,739
$1,786,955 $114,680 $11,055 $11,788,706 $18,343 $2,185 $417,691,294 $399,744,118
$0 $0 $0 $71,928 $0 $0 $2,252,640 $2,117,988 — — — — — — 4,814,706 6,070,626
618 751 — — — — 9,571 7,726 4,431 386 26 9,285 — 57 1,058,804 1,029,496
— — — — — — 1,225,672 4,324,097 467 32 — 863 44 71 1,973 3,548 824 51 16 1,519 — — 7,277 4,309
— — — — 17,355 — 17,355 15,619 — — — — — — 98,145 89,767
$6,340 $439
$6,779
$1,220 $31
$1,251
$42 $74
$116
$83,595 $1,172
$84,767
$17,399 $0
$17,399
$128 $165
$293
$9,486,143 $103,509
$9,589,652
$13,663,176 $18,810
$13,681,986
$1,780,176 $113,429 $10,939 $11,703,939 $944 $1,892 $408,101,642 $386,062,132
Agenda item 6a, Attachment 1, Page 25 of 82
Basic Financial Statements (continued)
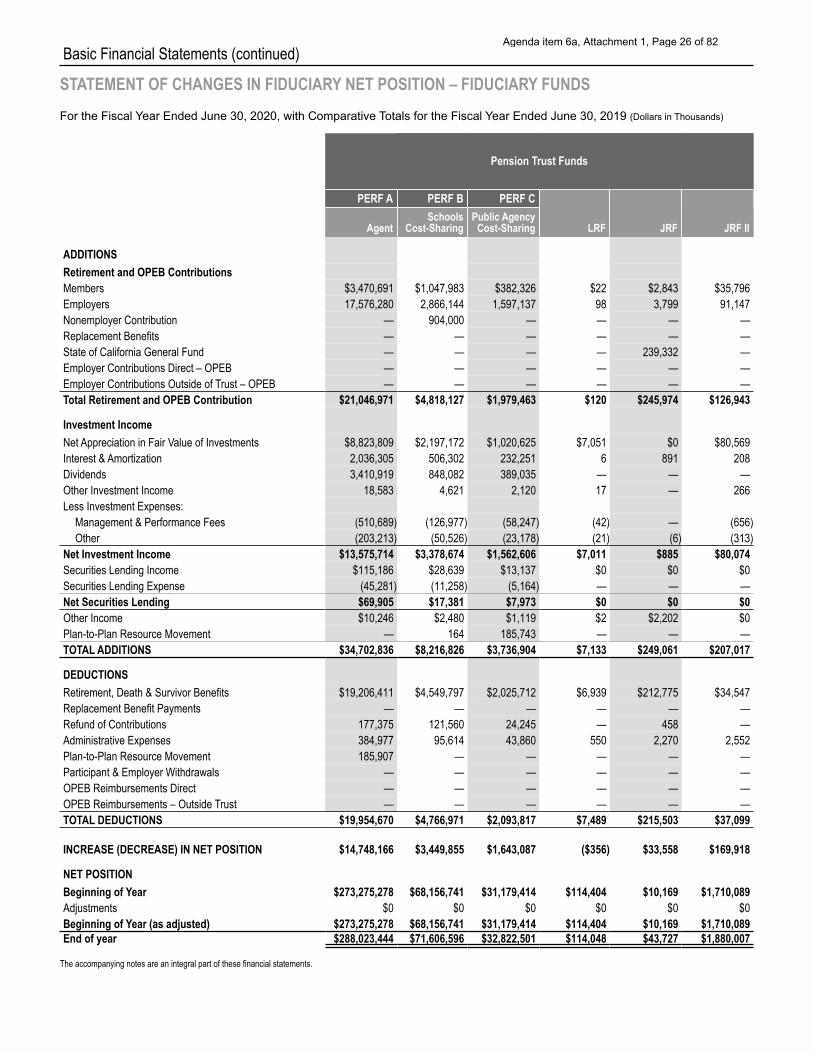
STATEMENT OF CHANGES IN FIDUCIARY NET POSITION – FIDUCIARY FUNDS For the Fiscal Year Ended June 30, 2020, with Comparative Totals for the Fiscal Year Ended June 30, 2019 (Dollars in Thousands)
Pension Trust Funds
PERF A PERF B PERF C
ADDITIONS Retirement and OPEB Contributions
LRF JRF JRF IIAgent Schools
Cost-Sharing Public Agency Cost-Sharing
Members $3,470,691 $1,047,983 $382,326 $22 $2,843 $35,796 Employers 17,576,280 2,866,144 1,597,137 98 3,799 91,147 Nonemployer Contribution — 904,000 — — — — Replacement Benefits — — — — — — State of California General Fund — — — — 239,332 — Employer Contributions Direct – OPEB — — — — — — Employer Contributions Outside of Trust – OPEB — — — — — — Total Retirement and OPEB Contribution
Investment Income Net Appreciation in Fair Value of Investments Interest & Amortization 2,036,305 506,302 232,251 6 891 208 Dividends 3,410,919 848,082 389,035 — — — Other Investment Income 18,583 4,621 2,120 17 — 266 Less Investment Expenses:
Management & Performance Fees Other (203,213) (50,526) (23,178) (21) (6) (313)
Net Investment Income $13,575,714 $3,378,674 $1,562,606 $7,011 $885 $80,074 Securities Lending Income $115,186 $28,639 $13,137 $0 $0 $0 Securities Lending Expense (45,281) (11,258) (5,164) — — — Net Securities Lending $69,905 $17,381 $7,973 $0 $0 $0
$21,046,971 $4,818,127 $1,979,463 $120 $245,974 $126,943
$8,823,809 $2,197,172 $1,020,625 $7,051 $0 $80,569
(510,689) (126,977) (58,247) (42) — (656)
Other Income Plan-to-Plan Resource Movement
$10,246 —
$2,480 164
$1,119 185,743
$2 —
$2,202 —
$0 —
TOTAL ADDITIONS $34,702,836 $8,216,826 $3,736,904 $7,133 $249,061 $207,017
Replacement Benefit Payments — — — — — — Refund of Contributions 177,375 121,560 24,245 — 458 — Administrative Expenses 384,977 95,614 43,860 550 2,270 2,552 Plan-to-Plan Resource Movement 185,907 — — — — — Participant & Employer Withdrawals — — — — — — OPEB Reimbursements Direct — — — — — — OPEB Reimbursements – Outside Trust — — — — — — TOTAL DEDUCTIONS $19,954,670 $4,766,971 $2,093,817 $7,489 $215,503 $37,099
DEDUCTIONS Retirement, Death & Survivor Benefits $19,206,411 $4,549,797 $2,025,712 $6,939 $212,775 $34,547
INCREASE (DECREASE) IN NET POSITION $14,748,166 $3,449,855 $1,643,087 ($356) $33,558 $169,918
NET POSITION Beginning of Year $273,275,278 $68,156,741 $31,179,414 $114,404 $10,169 $1,710,089 Adjustments $0 $0 $0 $0 $0 $0 Beginning of Year (as adjusted) $273,275,278 $68,156,741 $31,179,414 $114,404 $10,169 $1,710,089 End of year $288,023,444 $71,606,596 $32,822,501 $114,048 $43,727 $1,880,007
The accompanying notes are an integral part of these financial statements.
Agenda item 6a, Attachment 1, Page 26 of 82
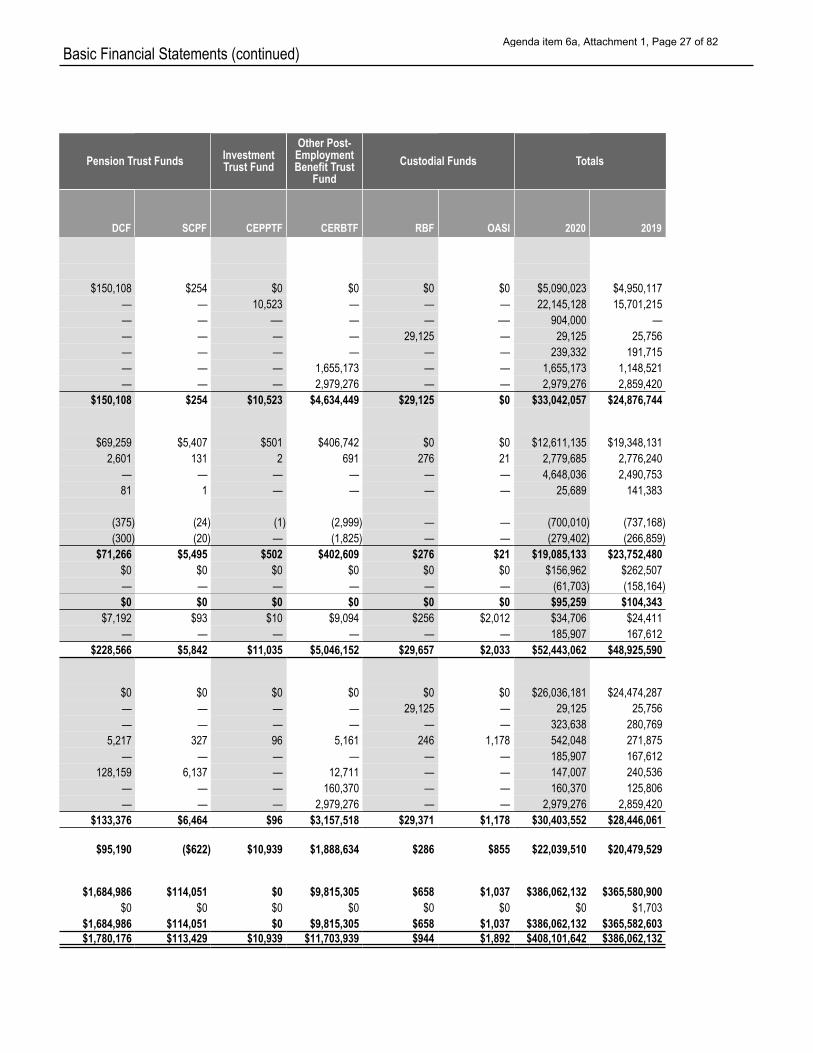
Basic Financial Statements (continued)
Pension Trust Funds Investment Trust Fund
Other Post- Employment Benefit Trust
Fund Custodial Funds Totals
DCF SCPF CEPPTF CERBTF RBF OASI 2020 2019
$150,108 $254 $0 $0 $0 $0 $5,090,023 $4,950,117 — — 10,523 — — — 22,145,128 15,701,215 — — — — — — 904,000 — — — — — 29,125 — 29,125 25,756 — — — — — — 239,332 191,715 — — — 1,655,173 — — 1,655,173 1,148,521 — — — 2,979,276 — — 2,979,276 2,859,420
$150,108 $254 $10,523 $4,634,449 $29,125 $0 $33,042,057 $24,876,744
$69,259 $5,407 $501 $406,742 $0 $0 $12,611,135 $19,348,131 2,601 131 2 691 276 21 2,779,685 2,776,240
— — — — — — 4,648,036 2,490,753 81 1 — — — — 25,689 141,383
(375) (24) (1) (2,999) — — (700,010) (737,168) (300) (20) — (1,825) — — (279,402) (266,859)
$71,266 $5,495 $502 $402,609 $276 $21 $19,085,133 $23,752,480 $0 $0 $0 $0 $0 $0 $156,962 $262,507 — — — — — — (61,703) (158,164) $0 $0 $0 $0 $0 $0 $95,259 $104,343
$7,192 $93 $10 $9,094 $256 $2,012 $34,706 $24,411 — — — — — — 185,907 167,612
$228,566 $5,842 $11,035 $5,046,152 $29,657 $2,033 $52,443,062 $48,925,590
$0 $0 $0 $0 $0 $0 $26,036,181 $24,474,287 — —
5,217 —
128,159 — —
$133,376
— —
327 —
6,137 — —
$6,464
— — 96 — — — —
$96
— —
5,161 —
12,711 160,370
2,979,276 $3,157,518
29,125 —
246 — — — —
$29,371
— —
1,178 — — — —
$1,178
29,125 323,638 542,048 185,907 147,007 160,370
2,979,276 $30,403,552
25,756 280,769 271,875 167,612 240,536 125,806
2,859,420 $28,446,061
$95,190 ($622) $10,939 $1,888,634 $286 $855 $22,039,510 $20,479,529
$1,684,986 $0
$1,684,986 $1,780,176
$114,051 $0
$114,051 $113,429
$0 $0 $0
$10,939
$9,815,305 $0
$9,815,305 $11,703,939
$658 $0
$658 $944
$1,037 $0
$1,037 $1,892
$386,062,132 $0
$386,062,132 $408,101,642
$365,580,900 $1,703
$365,582,603 $386,062,132
Agenda item 6a, Attachment 1, Page 27 of 82
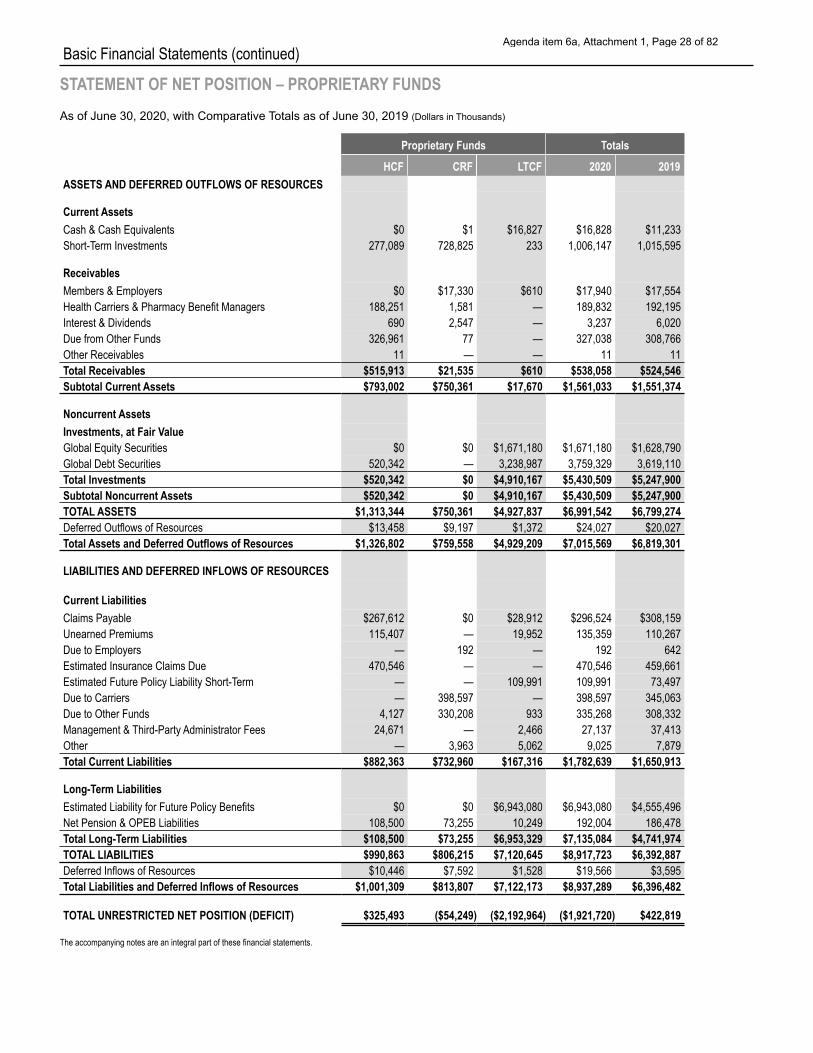
Basic Financial Statements (continued)
STATEMENT OF NET POSITION – PROPRIETARY FUNDS As of June 30, 2020, with Comparative Totals as of June 30, 2019 (Dollars in Thousands)
Proprietary Funds Totals
ASSETS AND DEFERRED OUTFLOWS OF RESOURCES
Current Assets
HCF CRF LTCF 2020 2019
Cash & Cash Equivalents $0 $1 $16,827 $16,828 $11,233 Short-Term Investments
Receivables Members & Employers $0 $17,330 $610 $17,940 $17,554 Health Carriers & Pharmacy Benefit Managers 188,251 1,581 — 189,832 192,195 Interest & Dividends 690 2,547 — 3,237 6,020 Due from Other Funds 326,961 77 — 327,038 308,766 Other Receivables 11 — — 11 11
277,089 728,825 233 1,006,147 1,015,595
Total Receivables $515,913 $21,535 $610 $538,058 $524,546 Subtotal Current Assets $793,002 $750,361 $17,670 $1,561,033 $1,551,374
Noncurrent Assets Investments, at Fair Value Global Equity Securities $0 $0 $1,671,180 $1,671,180 $1,628,790 Global Debt Securities 520,342 — 3,238,987 3,759,329 3,619,110 Total Investments $520,342 $0 $4,910,167 $5,430,509 $5,247,900 Subtotal Noncurrent Assets $520,342 $0 $4,910,167 $5,430,509 $5,247,900 TOTAL ASSETS $1,313,344 $750,361 $4,927,837 $6,991,542 $6,799,274 Deferred Outflows of Resources $13,458 $9,197 $1,372 $24,027 $20,027 Total Assets and Deferred Outflows of Resources $1,326,802 $759,558 $4,929,209 $7,015,569 $6,819,301
LIABILITIES AND DEFERRED INFLOWS OF RESOURCES
Current Liabilities Claims Payable $267,612 $0 $28,912 $296,524 $308,159 Unearned Premiums 115,407 — 19,952 135,359 110,267 Due to Employers — 192 — 192 642 Estimated Insurance Claims Due 470,546 — — 470,546 459,661 Estimated Future Policy Liability Short-Term — — 109,991 109,991 73,497 Due to Carriers — 398,597 — 398,597 345,063 Due to Other Funds 4,127 330,208 933 335,268 308,332 Management & Third-Party Administrator Fees 24,671 — 2,466 27,137 37,413 Other — 3,963 5,062 9,025 7,879 Total Current Liabilities $882,363 $732,960 $167,316 $1,782,639 $1,650,913
Long-Term Liabilities Estimated Liability for Future Policy Benefits $0 $0 $6,943,080 $6,943,080 $4,555,496 Net Pension & OPEB Liabilities 108,500 73,255 10,249 192,004 186,478 Total Long-Term Liabilities $108,500 $73,255 $6,953,329 $7,135,084 $4,741,974 TOTAL LIABILITIES $990,863 $806,215 $7,120,645 $8,917,723 $6,392,887 Deferred Inflows of Resources $10,446 $7,592 $1,528 $19,566 $3,595 Total Liabilities and Deferred Inflows of Resources $1,001,309 $813,807 $7,122,173 $8,937,289 $6,396,482
TOTAL UNRESTRICTED NET POSITION (DEFICIT) $325,493 ($54,249) ($2,192,964) ($1,921,720) $422,819
The accompanying notes are an integral part of these financial statements.
Agenda item 6a, Attachment 1, Page 28 of 82
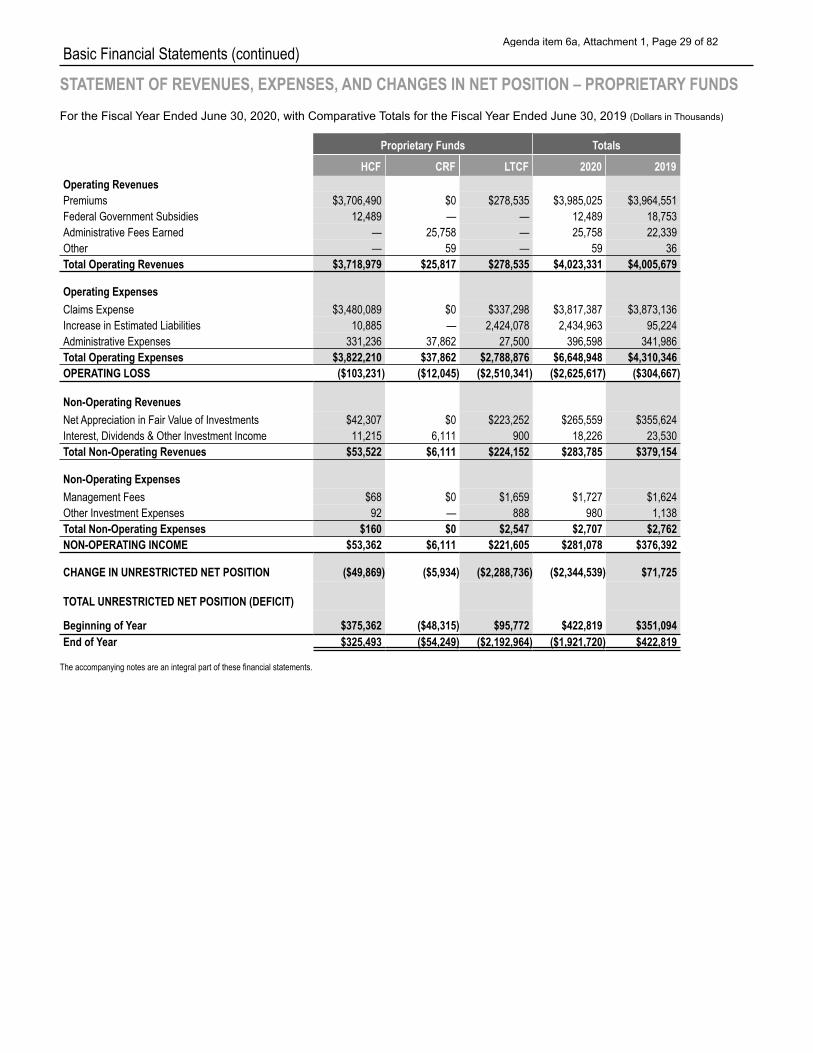
Basic Financial Statements (continued)
STATEMENT OF REVENUES, EXPENSES, AND CHANGES IN NET POSITION – PROPRIETARY FUNDS For the Fiscal Year Ended June 30, 2020, with Comparative Totals for the Fiscal Year Ended June 30, 2019 (Dollars in Thousands)
Proprietary Funds Totals
HCF CRF LTCF 2020 2019 Operating Revenues Premiums $3,706,490 $0 $278,535 $3,985,025 $3,964,551 Federal Government Subsidies 12,489 — — 12,489 18,753 Administrative Fees Earned — 25,758 — 25,758 22,339 Other — 59 — 59 36 Total Operating Revenues $3,718,979 $25,817 $278,535 $4,023,331 $4,005,679
Operating Expenses Claims Expense $3,480,089 $0 $337,298 $3,817,387 $3,873,136 Increase in Estimated Liabilities 10,885 — 2,424,078 2,434,963 95,224 Administrative Expenses 331,236 37,862 27,500 396,598 341,986 Total Operating Expenses $3,822,210 $37,862 $2,788,876 $6,648,948 $4,310,346 OPERATING LOSS ($103,231) ($12,045) ($2,510,341) ($2,625,617) ($304,667)
Non-Operating Revenues Net Appreciation in Fair Value of Investments $42,307 $0 $223,252 $265,559 $355,624 Interest, Dividends & Other Investment Income 11,215 6,111 900 18,226 23,530 Total Non-Operating Revenues $53,522 $6,111 $224,152 $283,785 $379,154
Non-Operating Expenses Management Fees $68 $0 $1,659 $1,727 $1,624 Other Investment Expenses 92 — 888 980 1,138 Total Non-Operating Expenses $160 $0 $2,547 $2,707 $2,762 NON-OPERATING INCOME $53,362 $6,111 $221,605 $281,078 $376,392
CHANGE IN UNRESTRICTED NET POSITION ($49,869) ($5,934) ($2,288,736) ($2,344,539) $71,725
TOTAL UNRESTRICTED NET POSITION (DEFICIT)
Beginning of Year $375,362 ($48,315) $95,772 $422,819 $351,094 End of Year $325,493 ($54,249) ($2,192,964) ($1,921,720) $422,819
The accompanying notes are an integral part of these financial statements.
Agenda item 6a, Attachment 1, Page 29 of 82
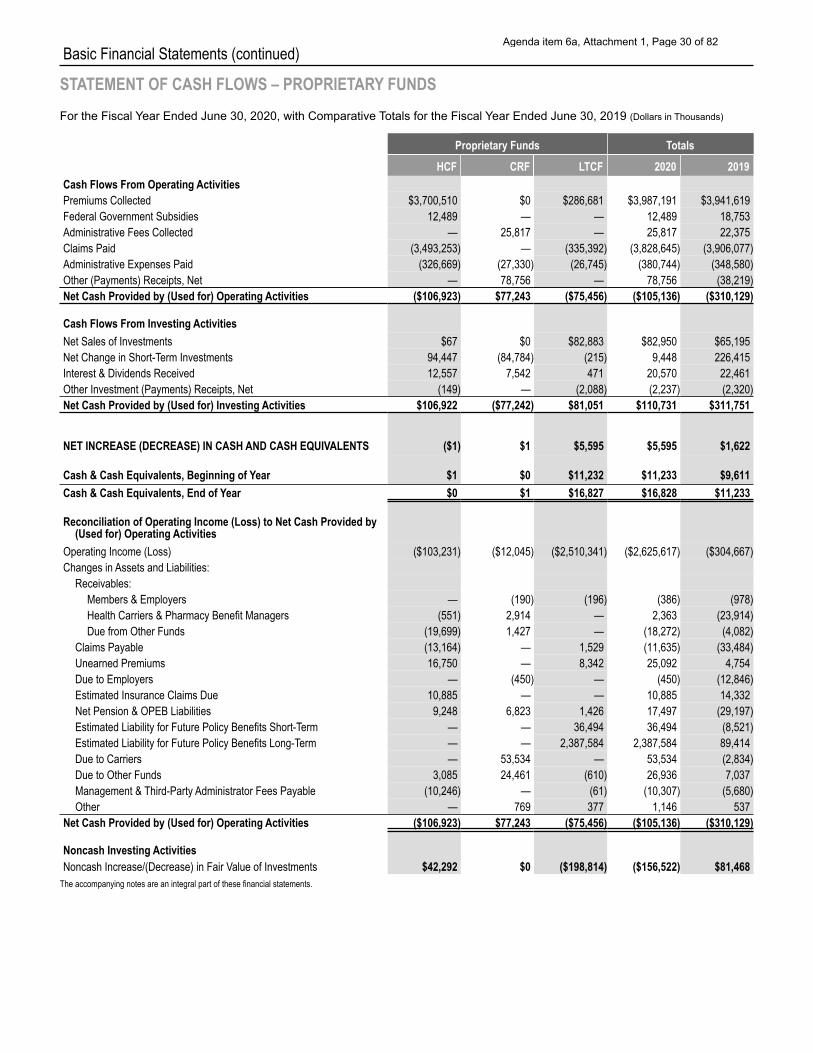
Basic Financial Statements (continued)
STATEMENT OF CASH FLOWS – PROPRIETARY FUNDS For the Fiscal Year Ended June 30, 2020, with Comparative Totals for the Fiscal Year Ended June 30, 2019 (Dollars in Thousands)
Proprietary Funds Totals
HCF CRF LTCF 2020 2019 Cash Flows From Operating Activities Premiums Collected $3,700,510 $0 $286,681 $3,987,191 $3,941,619 Federal Government Subsidies 12,489 — — 12,489 18,753 Administrative Fees Collected — 25,817 — 25,817 22,375 Claims Paid (3,493,253) — (335,392) (3,828,645) (3,906,077) Administrative Expenses Paid (326,669) (27,330) (26,745) (380,744) (348,580) Other (Payments) Receipts, Net — 78,756 — 78,756 (38,219) Net Cash Provided by (Used for) Operating Activities ($106,923) $77,243 ($75,456) ($105,136) ($310,129)
Cash Flows From Investing Activities Net Sales of Investments $67 $0 $82,883 $82,950 $65,195 Net Change in Short-Term Investments 94,447 (84,784) (215) 9,448 226,415 Interest & Dividends Received 12,557 7,542 471 20,570 22,461 Other Investment (Payments) Receipts, Net (149) — (2,088) (2,237) (2,320) Net Cash Provided by (Used for) Investing Activities $106,922 ($77,242) $81,051 $110,731 $311,751
NET INCREASE (DECREASE) IN CASH AND CASH EQUIVALENTS ($1) $1 $5,595 $5,595 $1,622
Cash & Cash Equivalents, Beginning of Year $1 $0 $11,232 $11,233 $9,611 Cash & Cash Equivalents, End of Year
Reconciliation of Operating Income (Loss) to Net Cash Provided by (Used for) Operating Activities
Operating Income (Loss) ($103,231) ($12,045) ($2,510,341) ($2,625,617) ($304,667) Changes in Assets and Liabilities:
Receivables: Members & Employers — (190) (196) (386) (978) Health Carriers & Pharmacy Benefit Managers (551) 2,914 — 2,363 (23,914) Due from Other Funds (19,699) 1,427 — (18,272) (4,082)
Claims Payable (13,164) — 1,529 (11,635) (33,484) Unearned Premiums 16,750 — 8,342 25,092 4,754 Due to Employers — (450) — (450) (12,846) Estimated Insurance Claims Due 10,885 — — 10,885 14,332 Net Pension & OPEB Liabilities 9,248 6,823 1,426 17,497 (29,197) Estimated Liability for Future Policy Benefits Short-Term — — 36,494 36,494 (8,521) Estimated Liability for Future Policy Benefits Long-Term — — 2,387,584 2,387,584 89,414 Due to Carriers — 53,534 — 53,534 (2,834) Due to Other Funds 3,085 24,461 (610) 26,936 7,037 Management & Third-Party Administrator Fees Payable (10,246) — (61) (10,307) (5,680) Other — 769 377 1,146 537
$0 $1 $16,827 $16,828 $11,233
Net Cash Provided by (Used for) Operating Activities
$42,292 ($198,814) $81,468
($106,923) $77,243 ($75,456) ($105,136) ($310,129)
Noncash Investing Activities Noncash Increase/(Decrease) in Fair Value of Investments $0 ($156,522)
The accompanying notes are an integral part of these financial statements.
Agenda item 6a, Attachment 1, Page 30 of 82
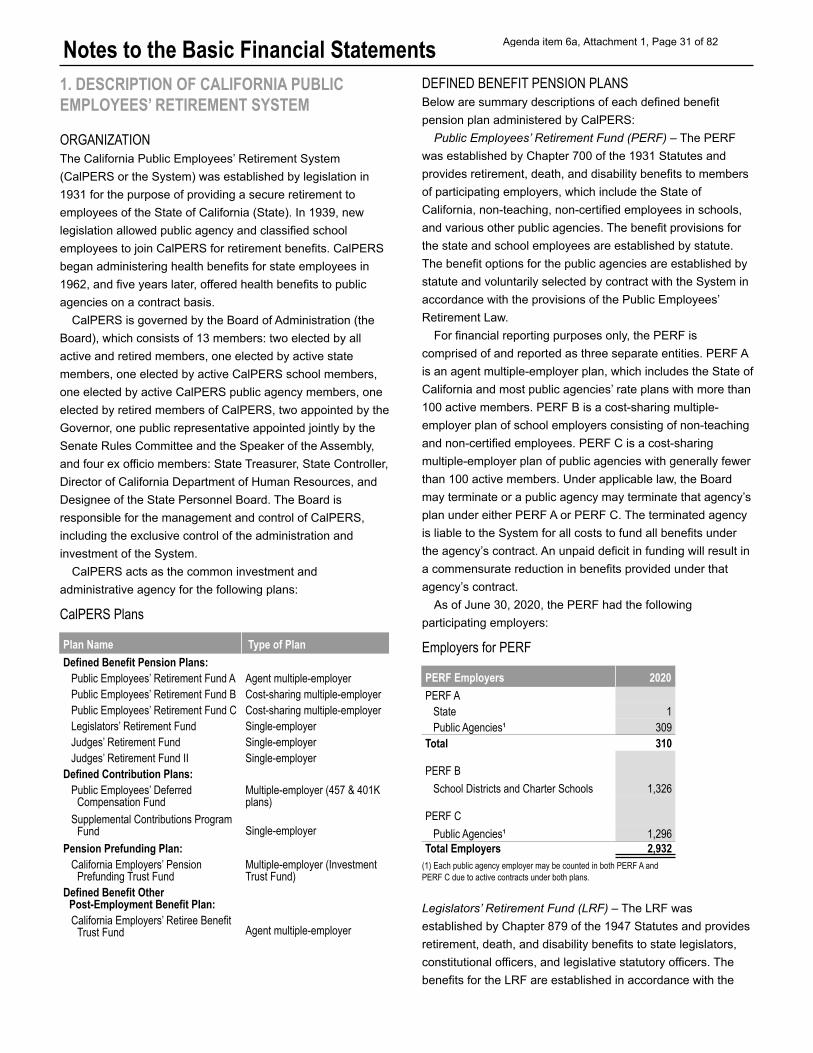
Notes to the Basic Financial Statements 1. DESCRIPTION OF CALIFORNIA PUBLIC EMPLOYEES’ RETIREMENT SYSTEM
ORGANIZATION The California Public Employees’ Retirement System (CalPERS or the System) was established by legislation in 1931 for the purpose of providing a secure retirement to employees of the State of California (State). In 1939, new legislation allowed public agency and classified school employees to join CalPERS for retirement benefits. CalPERS began administering health benefits for state employees in 1962, and five years later, offered health benefits to public agencies on a contract basis.
CalPERS is governed by the Board of Administration (the Board), which consists of 13 members: two elected by all active and retired members, one elected by active state members, one elected by active CalPERS school members, one elected by active CalPERS public agency members, one elected by retired members of CalPERS, two appointed by the Governor, one public representative appointed jointly by the Senate Rules Committee and the Speaker of the Assembly, and four ex officio members: State Treasurer, State Controller, Director of California Department of Human Resources, and Designee of the State Personnel Board. The Board is responsible for the management and control of CalPERS, including the exclusive control of the administration and investment of the System.
CalPERS acts as the common investment and administrative agency for the following plans:
CalPERS Plans
Plan Name Type of Plan Defined Benefit Pension Plans:
Public Employees’ Retirement Fund A Agent multiple-employer Public Employees’ Retirement Fund B Cost-sharing multiple-employer Public Employees’ Retirement Fund C Cost-sharing multiple-employer Legislators’ Retirement Fund Single-employer Judges’ Retirement Fund Single-employer Judges’ Retirement Fund II Single-employer
Defined Contribution Plans: Public Employees’ Deferred Compensation Fund
Multiple-employer (457 & 401K plans)
Supplemental Contributions Program Fund Single-employer
Pension Prefunding Plan: California Employers’ Pension Prefunding Trust Fund
Multiple-employer (Investment Trust Fund)
Defined Benefit Other Post-Employment Benefit Plan: California Employers’ Retiree Benefit Trust Fund Agent multiple-employer
DEFINED BENEFIT PENSION PLANS Below are summary descriptions of each defined benefit pension plan administered by CalPERS:
Public Employees’ Retirement Fund (PERF) – The PERF was established by Chapter 700 of the 1931 Statutes and provides retirement, death, and disability benefits to members of participating employers, which include the State of California, non-teaching, non-certified employees in schools, and various other public agencies. The benefit provisions for the state and school employees are established by statute. The benefit options for the public agencies are established by statute and voluntarily selected by contract with the System in accordance with the provisions of the Public Employees’ Retirement Law.
For financial reporting purposes only, the PERF is comprised of and reported as three separate entities. PERF A is an agent multiple-employer plan, which includes the State of California and most public agencies’ rate plans with more than 100 active members. PERF B is a cost-sharing multiple- employer plan of school employers consisting of non-teaching and non-certified employees. PERF C is a cost-sharing multiple-employer plan of public agencies with generally fewer than 100 active members. Under applicable law, the Board may terminate or a public agency may terminate that agency’s plan under either PERF A or PERF C. The terminated agency is liable to the System for all costs to fund all benefits under the agency’s contract. An unpaid deficit in funding will result in a commensurate reduction in benefits provided under that agency’s contract.
As of June 30, 2020, the PERF had the following participating employers:
Employers for PERF
PERF Employers 2020 PERF A
State Public Agencies¹
Total
1 309 310
PERF B School Districts and Charter Schools 1,326
PERF C Public Agencies¹
Total Employers 1,296 2,932
(1) Each public agency employer may be counted in both PERF A and PERF C due to active contracts under both plans.
Legislators’ Retirement Fund (LRF) – The LRF was established by Chapter 879 of the 1947 Statutes and provides retirement, death, and disability benefits to state legislators, constitutional officers, and legislative statutory officers. The benefits for the LRF are established in accordance with the
Agenda item 6a, Attachment 1, Page 31 of 82
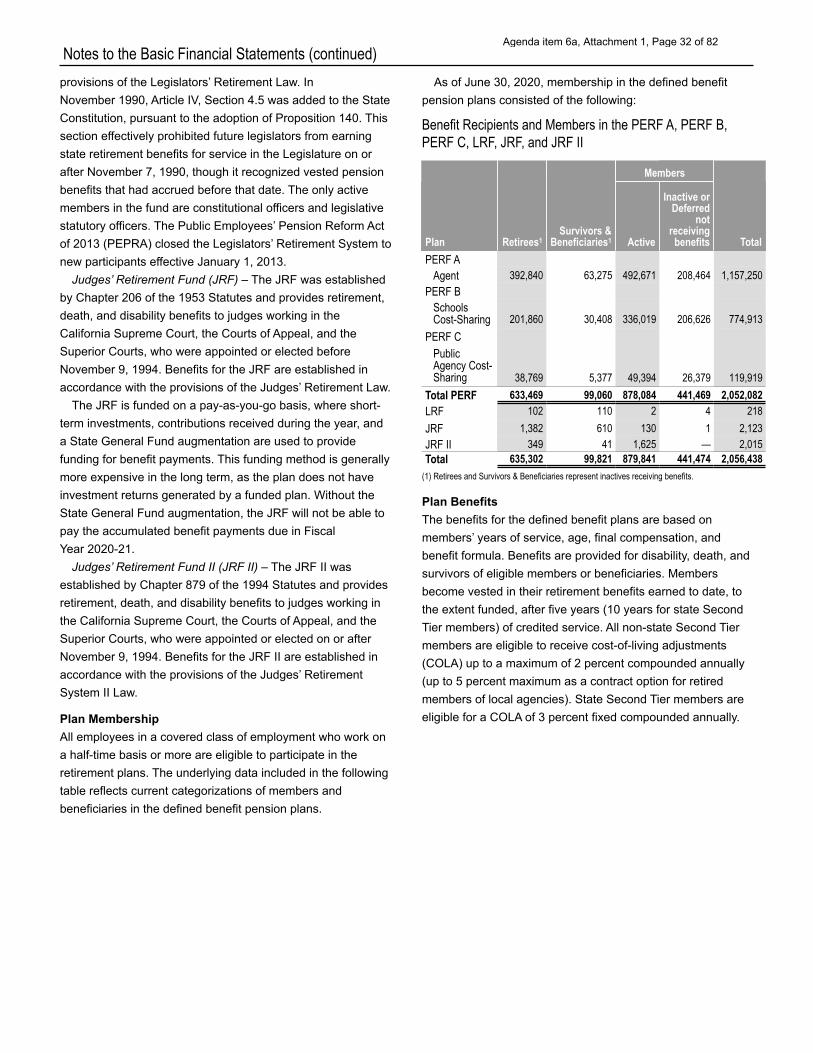
Notes to the Basic Financial Statements (continued) provisions of the Legislators’ Retirement Law. In November 1990, Article IV, Section 4.5 was added to the State Constitution, pursuant to the adoption of Proposition 140. This section effectively prohibited future legislators from earning state retirement benefits for service in the Legislature on or after November 7, 1990, though it recognized vested pension benefits that had accrued before that date. The only active members in the fund are constitutional officers and legislative statutory officers. The Public Employees’ Pension Reform Act of 2013 (PEPRA) closed the Legislators’ Retirement System to new participants effective January 1, 2013.
Judges’ Retirement Fund (JRF) – The JRF was established by Chapter 206 of the 1953 Statutes and provides retirement, death, and disability benefits to judges working in the California Supreme Court, the Courts of Appeal, and the Superior Courts, who were appointed or elected before November 9, 1994. Benefits for the JRF are established in accordance with the provisions of the Judges’ Retirement Law.
The JRF is funded on a pay-as-you-go basis, where short- term investments, contributions received during the year, and a State General Fund augmentation are used to provide funding for benefit payments. This funding method is generally more expensive in the long term, as the plan does not have investment returns generated by a funded plan. Without the State General Fund augmentation, the JRF will not be able to pay the accumulated benefit payments due in Fiscal Year 2020-21.
Judges’ Retirement Fund II (JRF II) – The JRF II was established by Chapter 879 of the 1994 Statutes and provides retirement, death, and disability benefits to judges working in the California Supreme Court, the Courts of Appeal, and the Superior Courts, who were appointed or elected on or after November 9, 1994. Benefits for the JRF II are established in accordance with the provisions of the Judges’ Retirement System II Law.
Plan Membership All employees in a covered class of employment who work on a half-time basis or more are eligible to participate in the retirement plans. The underlying data included in the following table reflects current categorizations of members and beneficiaries in the defined benefit pension plans.
As of June 30, 2020, membership in the defined benefit pension plans consisted of the following:
Benefit Recipients and Members in the PERF A, PERF B, PERF C, LRF, JRF, and JRF II
Plan Retirees1 Survivors &
Beneficiaries1
Members
Total Active
Inactive or Deferred
not receiving benefits
PERF A Agent 392,840 63,275 492,671 208,464 1,157,250
PERF B Schools Cost-Sharing 201,860 30,408 336,019 206,626 774,913
PERF C Public Agency Cost- Sharing 38,769 5,377 49,394 26,379 119,919
Total PERF 633,469 99,060 878,084 441,469 2,052,082 LRF 102 110 2 4 218 JRF 1,382 610 130 1 2,123 JRF II 349 41 1,625 — 2,015 Total 635,302 99,821 879,841 441,474 2,056,438
(1) Retirees and Survivors & Beneficiaries represent inactives receiving benefits.
Plan Benefits The benefits for the defined benefit plans are based on members’ years of service, age, final compensation, and benefit formula. Benefits are provided for disability, death, and survivors of eligible members or beneficiaries. Members become vested in their retirement benefits earned to date, to the extent funded, after five years (10 years for state Second Tier members) of credited service. All non-state Second Tier members are eligible to receive cost-of-living adjustments (COLA) up to a maximum of 2 percent compounded annually (up to 5 percent maximum as a contract option for retired members of local agencies). State Second Tier members are eligible for a COLA of 3 percent fixed compounded annually.
Agenda item 6a, Attachment 1, Page 32 of 82
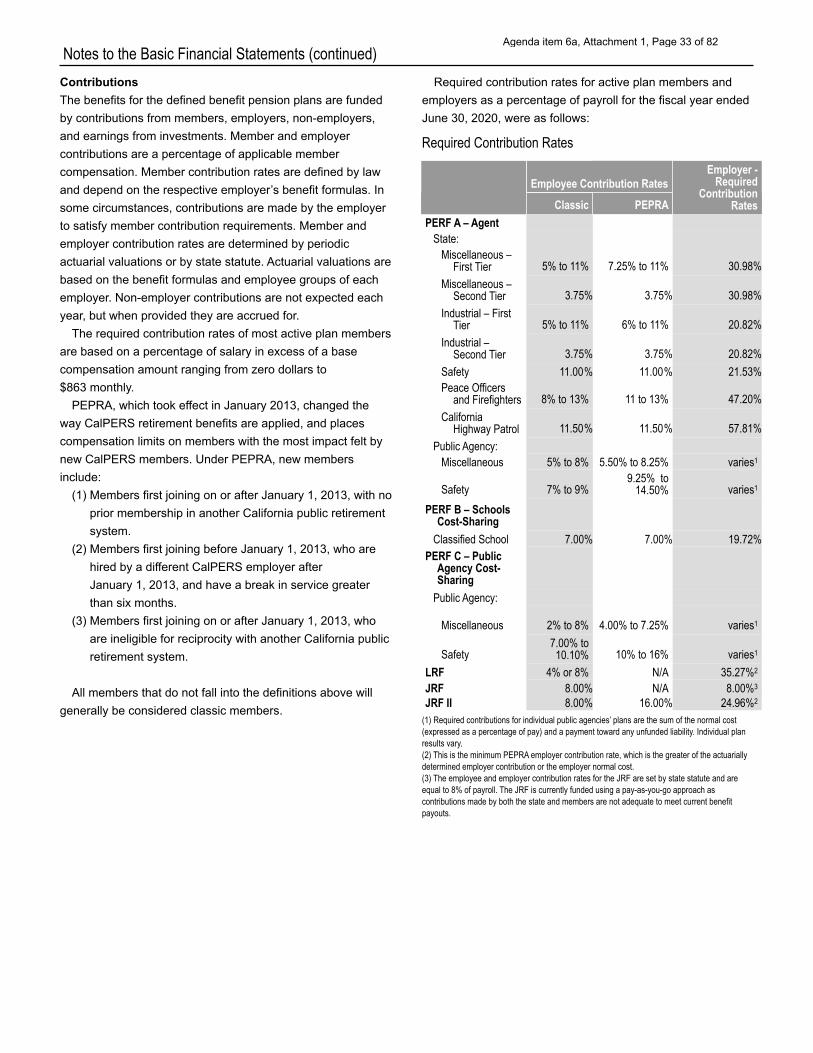
Notes to the Basic Financial Statements (continued) Contributions The benefits for the defined benefit pension plans are funded by contributions from members, employers, non-employers, and earnings from investments. Member and employer contributions are a percentage of applicable member compensation. Member contribution rates are defined by law and depend on the respective employer’s benefit formulas. In some circumstances, contributions are made by the employer to satisfy member contribution requirements. Member and employer contribution rates are determined by periodic actuarial valuations or by state statute. Actuarial valuations are based on the benefit formulas and employee groups of each employer. Non-employer contributions are not expected each year, but when provided they are accrued for.
The required contribution rates of most active plan members are based on a percentage of salary in excess of a base compensation amount ranging from zero dollars to $863 monthly.
PEPRA, which took effect in January 2013, changed the way CalPERS retirement benefits are applied, and places compensation limits on members with the most impact felt by new CalPERS members. Under PEPRA, new members include:
(1) Members first joining on or after January 1, 2013, with no prior membership in another California public retirement system.
(2) Members first joining before January 1, 2013, who are hired by a different CalPERS employer after January 1, 2013, and have a break in service greater than six months.
(3) Members first joining on or after January 1, 2013, who are ineligible for reciprocity with another California public retirement system.
All members that do not fall into the definitions above will generally be considered classic members.
Required contribution rates for active plan members and employers as a percentage of payroll for the fiscal year ended June 30, 2020, were as follows:
Required Contribution Rates
Employee Contribution Rates Employer -
Required Contribution
RatesClassic PEPRA PERF A – Agent
State: Miscellaneous –
First Tier 5% to 11% 7.25% to 11% 30.98% Miscellaneous –
Second Tier 3.75% 3.75% 30.98% Industrial – First
Tier 5% to 11% 6% to 11% 20.82% Industrial –
Second Tier 3.75% 3.75% 20.82% Safety 11.00% 11.00% 21.53% Peace Officers
and Firefighters 8% to 13% 11 to 13% 47.20% California
Highway Patrol 11.50% 11.50% 57.81% Public Agency:
Miscellaneous 5% to 8% 5.50% to 8.25% varies1
9.25% to Safety 7% to 9% 14.50% varies1
PERF B – Schools Cost-Sharing
Classified School 7.00% 7.00% 19.72% PERF C – Public
Agency Cost- Sharing
Public Agency:
Miscellaneous 2% to 8% 4.00% to 7.25% varies1
7.00% to Safety 10.10% 10% to 16% varies1
LRF 4% or 8% N/A 35.27%2
JRF 8.00% N/A 8.00%3
JRF II 8.00% 16.00% 24.96%2
(1) Required contributions for individual public agencies’ plans are the sum of the normal cost (expressed as a percentage of pay) and a payment toward any unfunded liability. Individual plan results vary. (2) This is the minimum PEPRA employer contribution rate, which is the greater of the actuarially determined employer contribution or the employer normal cost. (3) The employee and employer contribution rates for the JRF are set by state statute and are equal to 8% of payroll. The JRF is currently funded using a pay-as-you-go approach as contributions made by both the state and members are not adequate to meet current benefit payouts.
Agenda item 6a, Attachment 1, Page 33 of 82
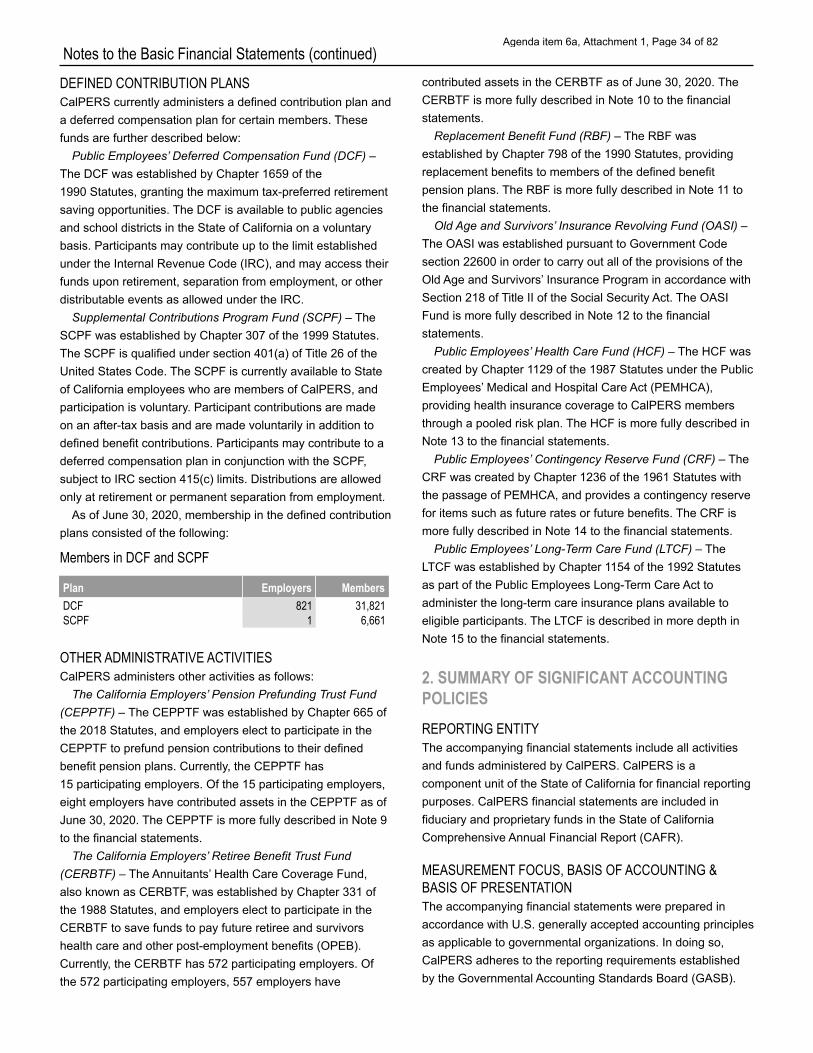
Notes to the Basic Financial Statements (continued) DEFINED CONTRIBUTION PLANS CalPERS currently administers a defined contribution plan and a deferred compensation plan for certain members. These funds are further described below:
Public Employees’ Deferred Compensation Fund (DCF) – The DCF was established by Chapter 1659 of the 1990 Statutes, granting the maximum tax-preferred retirement saving opportunities. The DCF is available to public agencies and school districts in the State of California on a voluntary basis. Participants may contribute up to the limit established under the Internal Revenue Code (IRC), and may access their funds upon retirement, separation from employment, or other distributable events as allowed under the IRC.
Supplemental Contributions Program Fund (SCPF) – The SCPF was established by Chapter 307 of the 1999 Statutes. The SCPF is qualified under section 401(a) of Title 26 of the United States Code. The SCPF is currently available to State of California employees who are members of CalPERS, and participation is voluntary. Participant contributions are made on an after-tax basis and are made voluntarily in addition to defined benefit contributions. Participants may contribute to a deferred compensation plan in conjunction with the SCPF, subject to IRC section 415(c) limits. Distributions are allowed only at retirement or permanent separation from employment.
As of June 30, 2020, membership in the defined contribution plans consisted of the following:
Members in DCF and SCPF
Plan Employers Members DCF 821 31,821 SCPF 1 6,661
OTHER ADMINISTRATIVE ACTIVITIES CalPERS administers other activities as follows:
The California Employers’ Pension Prefunding Trust Fund (CEPPTF) – The CEPPTF was established by Chapter 665 of the 2018 Statutes, and employers elect to participate in the CEPPTF to prefund pension contributions to their defined benefit pension plans. Currently, the CEPPTF has 15 participating employers. Of the 15 participating employers, eight employers have contributed assets in the CEPPTF as of June 30, 2020. The CEPPTF is more fully described in Note 9 to the financial statements.
The California Employers’ Retiree Benefit Trust Fund (CERBTF) – The Annuitants’ Health Care Coverage Fund, also known as CERBTF, was established by Chapter 331 of the 1988 Statutes, and employers elect to participate in the CERBTF to save funds to pay future retiree and survivors health care and other post-employment benefits (OPEB). Currently, the CERBTF has 572 participating employers. Of the 572 participating employers, 557 employers have
contributed assets in the CERBTF as of June 30, 2020. The CERBTF is more fully described in Note 10 to the financial statements.
Replacement Benefit Fund (RBF) – The RBF was established by Chapter 798 of the 1990 Statutes, providing replacement benefits to members of the defined benefit pension plans. The RBF is more fully described in Note 11 to the financial statements.
Old Age and Survivors’ Insurance Revolving Fund (OASI) – The OASI was established pursuant to Government Code section 22600 in order to carry out all of the provisions of the Old Age and Survivors’ Insurance Program in accordance with Section 218 of Title II of the Social Security Act. The OASI Fund is more fully described in Note 12 to the financial statements.
Public Employees’ Health Care Fund (HCF) – The HCF was created by Chapter 1129 of the 1987 Statutes under the Public Employees’ Medical and Hospital Care Act (PEMHCA), providing health insurance coverage to CalPERS members through a pooled risk plan. The HCF is more fully described in Note 13 to the financial statements.
Public Employees’ Contingency Reserve Fund (CRF) – The CRF was created by Chapter 1236 of the 1961 Statutes with the passage of PEMHCA, and provides a contingency reserve for items such as future rates or future benefits. The CRF is more fully described in Note 14 to the financial statements.
Public Employees’ Long-Term Care Fund (LTCF) – The LTCF was established by Chapter 1154 of the 1992 Statutes as part of the Public Employees Long-Term Care Act to administer the long-term care insurance plans available to eligible participants. The LTCF is described in more depth in Note 15 to the financial statements.
2. SUMMARY OF SIGNIFICANT ACCOUNTING POLICIES REPORTING ENTITY The accompanying financial statements include all activities and funds administered by CalPERS. CalPERS is a component unit of the State of California for financial reporting purposes. CalPERS financial statements are included in fiduciary and proprietary funds in the State of California Comprehensive Annual Financial Report (CAFR).
MEASUREMENT FOCUS, BASIS OF ACCOUNTING & BASIS OF PRESENTATION The accompanying financial statements were prepared in accordance with U.S. generally accepted accounting principles as applicable to governmental organizations. In doing so, CalPERS adheres to the reporting requirements established by the Governmental Accounting Standards Board (GASB).
Agenda item 6a, Attachment 1, Page 34 of 82
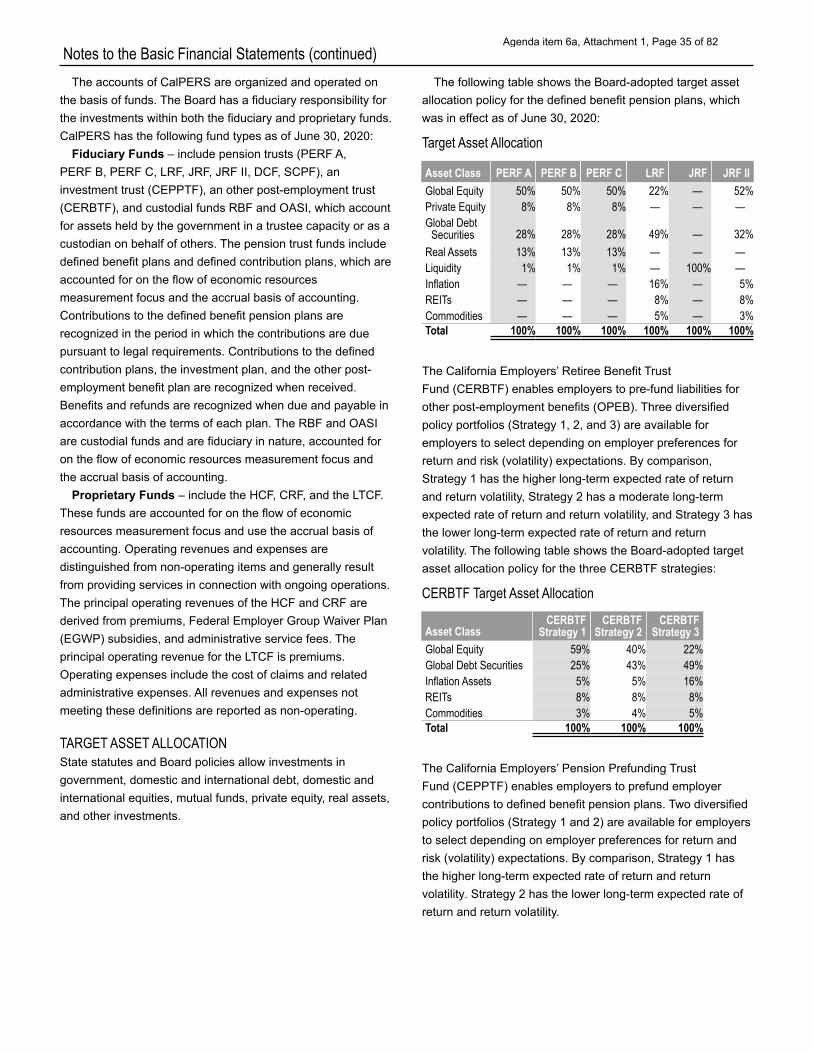
Notes to the Basic Financial Statements (continued) The accounts of CalPERS are organized and operated on
the basis of funds. The Board has a fiduciary responsibility for the investments within both the fiduciary and proprietary funds. CalPERS has the following fund types as of June 30, 2020:
Fiduciary Funds – include pension trusts (PERF A, PERF B, PERF C, LRF, JRF, JRF II, DCF, SCPF), an investment trust (CEPPTF), an other post-employment trust (CERBTF), and custodial funds RBF and OASI, which account for assets held by the government in a trustee capacity or as a custodian on behalf of others. The pension trust funds include defined benefit plans and defined contribution plans, which are accounted for on the flow of economic resources measurement focus and the accrual basis of accounting. Contributions to the defined benefit pension plans are recognized in the period in which the contributions are due pursuant to legal requirements. Contributions to the defined contribution plans, the investment plan, and the other post- employment benefit plan are recognized when received. Benefits and refunds are recognized when due and payable in accordance with the terms of each plan. The RBF and OASI are custodial funds and are fiduciary in nature, accounted for on the flow of economic resources measurement focus and the accrual basis of accounting.
Proprietary Funds – include the HCF, CRF, and the LTCF. These funds are accounted for on the flow of economic resources measurement focus and use the accrual basis of accounting. Operating revenues and expenses are distinguished from non-operating items and generally result from providing services in connection with ongoing operations. The principal operating revenues of the HCF and CRF are derived from premiums, Federal Employer Group Waiver Plan (EGWP) subsidies, and administrative service fees. The principal operating revenue for the LTCF is premiums. Operating expenses include the cost of claims and related administrative expenses. All revenues and expenses not meeting these definitions are reported as non-operating.
TARGET ASSET ALLOCATION State statutes and Board policies allow investments in government, domestic and international debt, domestic and international equities, mutual funds, private equity, real assets, and other investments.
The following table shows the Board-adopted target asset allocation policy for the defined benefit pension plans, which was in effect as of June 30, 2020:
Target Asset Allocation
Asset Class PERF A PERF B PERF C LRF JRF JRF II Global Equity 50% 50% 50% 22% — 52% Private Equity 8% 8% 8% — — — Global Debt Securities 28% 28% 28% 49% — 32%
Real Assets 13% 13% 13% — — — Liquidity 1% 1% 1% — 100% — Inflation — — — 16% — 5% REITs — — — 8% — 8% Commodities — — — 5% — 3% Total 100% 100% 100% 100% 100% 100%
The California Employers’ Retiree Benefit Trust Fund (CERBTF) enables employers to pre-fund liabilities for other post-employment benefits (OPEB). Three diversified policy portfolios (Strategy 1, 2, and 3) are available for employers to select depending on employer preferences for return and risk (volatility) expectations. By comparison, Strategy 1 has the higher long-term expected rate of return and return volatility, Strategy 2 has a moderate long-term expected rate of return and return volatility, and Strategy 3 has the lower long-term expected rate of return and return volatility. The following table shows the Board-adopted target asset allocation policy for the three CERBTF strategies:
CERBTF Target Asset Allocation
Asset Class CERBTF
Strategy 1 CERBTF
Strategy 2 CERBTF
Strategy 3 Global Equity 59% 40% 22% Global Debt Securities 25% 43% 49% Inflation Assets 5% 5% 16% REITs 8% 8% 8% Commodities 3% 4% 5% Total 100% 100% 100%
The California Employers’ Pension Prefunding Trust Fund (CEPPTF) enables employers to prefund employer contributions to defined benefit pension plans. Two diversified policy portfolios (Strategy 1 and 2) are available for employers to select depending on employer preferences for return and risk (volatility) expectations. By comparison, Strategy 1 has the higher long-term expected rate of return and return volatility. Strategy 2 has the lower long-term expected rate of return and return volatility.
Agenda item 6a, Attachment 1, Page 35 of 82
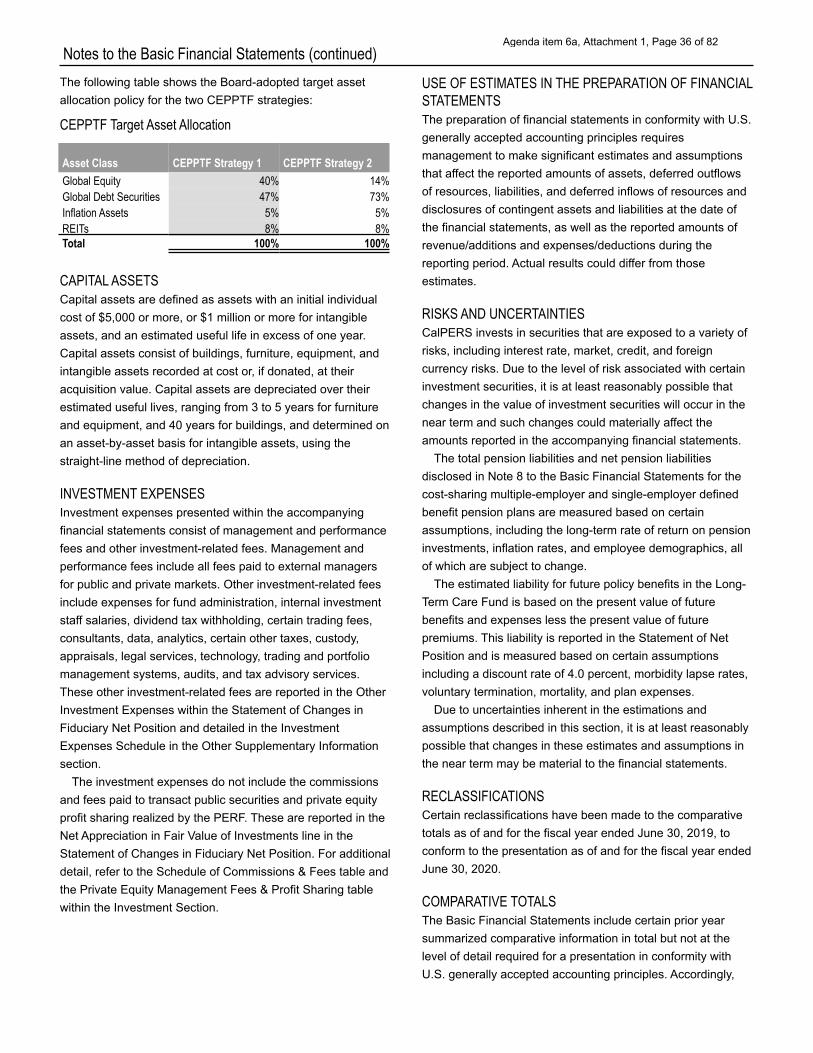
Notes to the Basic Financial Statements (continued) The following table shows the Board-adopted target asset allocation policy for the two CEPPTF strategies:
CEPPTF Target Asset Allocation
Asset Class CEPPTF Strategy 1 CEPPTF Strategy 2 Global Equity 40% 14% Global Debt Securities 47% 73% Inflation Assets 5% 5% REITs 8% 8% Total 100% 100%
CAPITAL ASSETS Capital assets are defined as assets with an initial individual cost of $5,000 or more, or $1 million or more for intangible assets, and an estimated useful life in excess of one year. Capital assets consist of buildings, furniture, equipment, and intangible assets recorded at cost or, if donated, at their acquisition value. Capital assets are depreciated over their estimated useful lives, ranging from 3 to 5 years for furniture and equipment, and 40 years for buildings, and determined on an asset-by-asset basis for intangible assets, using the straight-line method of depreciation.
INVESTMENT EXPENSES Investment expenses presented within the accompanying financial statements consist of management and performance fees and other investment-related fees. Management and performance fees include all fees paid to external managers for public and private markets. Other investment-related fees include expenses for fund administration, internal investment staff salaries, dividend tax withholding, certain trading fees, consultants, data, analytics, certain other taxes, custody, appraisals, legal services, technology, trading and portfolio management systems, audits, and tax advisory services. These other investment-related fees are reported in the Other Investment Expenses within the Statement of Changes in Fiduciary Net Position and detailed in the Investment Expenses Schedule in the Other Supplementary Information section.
The investment expenses do not include the commissions and fees paid to transact public securities and private equity profit sharing realized by the PERF. These are reported in the Net Appreciation in Fair Value of Investments line in the Statement of Changes in Fiduciary Net Position. For additional detail, refer to the Schedule of Commissions & Fees table and the Private Equity Management Fees & Profit Sharing table within the Investment Section.
USE OF ESTIMATES IN THE PREPARATION OF FINANCIAL STATEMENTS The preparation of financial statements in conformity with U.S. generally accepted accounting principles requires management to make significant estimates and assumptions that affect the reported amounts of assets, deferred outflows of resources, liabilities, and deferred inflows of resources and disclosures of contingent assets and liabilities at the date of the financial statements, as well as the reported amounts of revenue/additions and expenses/deductions during the reporting period. Actual results could differ from those estimates.
RISKS AND UNCERTAINTIES CalPERS invests in securities that are exposed to a variety of risks, including interest rate, market, credit, and foreign currency risks. Due to the level of risk associated with certain investment securities, it is at least reasonably possible that changes in the value of investment securities will occur in the near term and such changes could materially affect the amounts reported in the accompanying financial statements.
The total pension liabilities and net pension liabilities disclosed in Note 8 to the Basic Financial Statements for the cost-sharing multiple-employer and single-employer defined benefit pension plans are measured based on certain assumptions, including the long-term rate of return on pension investments, inflation rates, and employee demographics, all of which are subject to change.
The estimated liability for future policy benefits in the Long- Term Care Fund is based on the present value of future benefits and expenses less the present value of future premiums. This liability is reported in the Statement of Net Position and is measured based on certain assumptions including a discount rate of 4.0 percent, morbidity lapse rates, voluntary termination, mortality, and plan expenses.
Due to uncertainties inherent in the estimations and assumptions described in this section, it is at least reasonably possible that changes in these estimates and assumptions in the near term may be material to the financial statements.
RECLASSIFICATIONS Certain reclassifications have been made to the comparative totals as of and for the fiscal year ended June 30, 2019, to conform to the presentation as of and for the fiscal year ended June 30, 2020.
COMPARATIVE TOTALS The Basic Financial Statements include certain prior year summarized comparative information in total but not at the level of detail required for a presentation in conformity with U.S. generally accepted accounting principles. Accordingly,
Agenda item 6a, Attachment 1, Page 36 of 82
Notes to the Basic Financial Statements (continued) such information should be read in conjunction with CalPERS financial statements for the fiscal year ended June 30, 2019, from which the summarized information was derived. The Fiscal Year 2018-19 beginning of the year net position of the OASI was restated as a result of it being reported separately to more accurately depict the custodial nature of the fund.
TERMINATION OF PENSION PLANS Public agency participation in the System may be terminated either due to a transfer of a public agency’s plan to another qualified system as permitted by law, a public agency terminating its plan, or an involuntary termination by the Board. In the event that a public agency elects to transfer its plan, the assets of the plan and the related liability for benefits accrued are transferred to the other system. In the event that a public agency elects to terminate its plan or there is an involuntary termination of a plan by the Board, sufficient assets to cover the related liability for benefits accrued are retained by the PERF. Excess assets above those required, if any, are returned to the employer, while the employer is billed for any deficiency in required assets.
EMPLOYER SHARE OF POST-EMPLOYMENT BENEFITS As of June 30, 2020, CalPERS has adjusted its proportionate share of the state’s net pension and OPEB liabilities totaling approximately $592 million and $659 million, respectively. CalPERS recorded these post-employment liabilities along with the corresponding amount of deferred inflows and outflows of resources and related post-employment benefit expense for all affected funds. CalPERS is not providing additional disclosures as it has concluded that presenting such employer related pension and post-employment obligations disclosures would be misleading to the users of CalPERS financial statements where the focus is on plans, not individual employer pension and post-employment obligations. Refer to the State of California CAFR for additional information on CalPERS pension and OPEB liabilities.
INTERFUND BALANCES The Basic Financial Statements include amounts Due from Other Funds and Due to Other Funds. The principal purposes for these interfund balances include administration expense reimbursements due from other CalPERS funds to the PERF; incoming health premiums in transit and due from the CRF and due to the HCF; and member transfers in transit and due to and due from one pension plan to another. The balance of Health premiums due from CRF to HCF was $327 million at June 30, 2020. All interfund balances are expected to be repaid within one year from the date of these financial statements. This interfund activity occurs on a routine basis
and is consistent with the activities of the fund making the transfer.
3. CASH AND CASH EQUIVALENTS
Cash and cash equivalents of approximately $0.5 billion at June 30, 2020, represent amounts held in the CalPERS general operating accounts with the State Treasury and the master custodian, State Street Bank and Trust Company. The underlying investments at the State Treasurer’s Office are not individually identifiable by fund, as CalPERS monies are pooled with the monies of other state agencies and invested.
4. INVESTMENTS SHORT-TERM INVESTMENTS Short-term investments consist of U.S. Treasury and government-sponsored securities, money market funds, commercial paper, certificates of deposit, repurchase agreements, asset-backed securities, notes, bonds issued by U.S. corporations, and other allowable instruments that meet short-term maturity or average life, diversification, and credit quality restrictions.
INVESTMENTS AT FAIR VALUE GASB Statement No. 72, Fair Value Measurement and Application (GASB 72) requires investments measured at fair value to be categorized under a fair value hierarchy. CalPERS determines fair value of its investments based upon both observable and unobservable inputs. The System categorizes its fair value measurements within the fair value hierarchy as follows:
• Level 1 – quoted prices (unadjusted) for identical assets or liabilities in active markets that a government can access at the measurement date.
• Level 2 – inputs (other than quoted prices included within Level 1) that are observable for an asset or liability, either directly or indirectly. These inputs can include quoted prices for similar assets or liabilities in active or inactive markets, or market-corroborated inputs.
• Level 3 – unobservable inputs for an asset or liability, which generally results in a government using the best information available and may include the government’s own data.
The remaining investments not categorized under the fair value hierarchy are shown at net asset value (NAV). NAV is used as a practical expedient to estimate the fair value of CalPERS interest therein, unless it is probable that all or a portion of the investment will be sold for an amount different from NAV. As of June 30, 2020, CalPERS had no specific plans or intentions to sell investments at amounts different from NAV.
Agenda item 6a, Attachment 1, Page 37 of 82
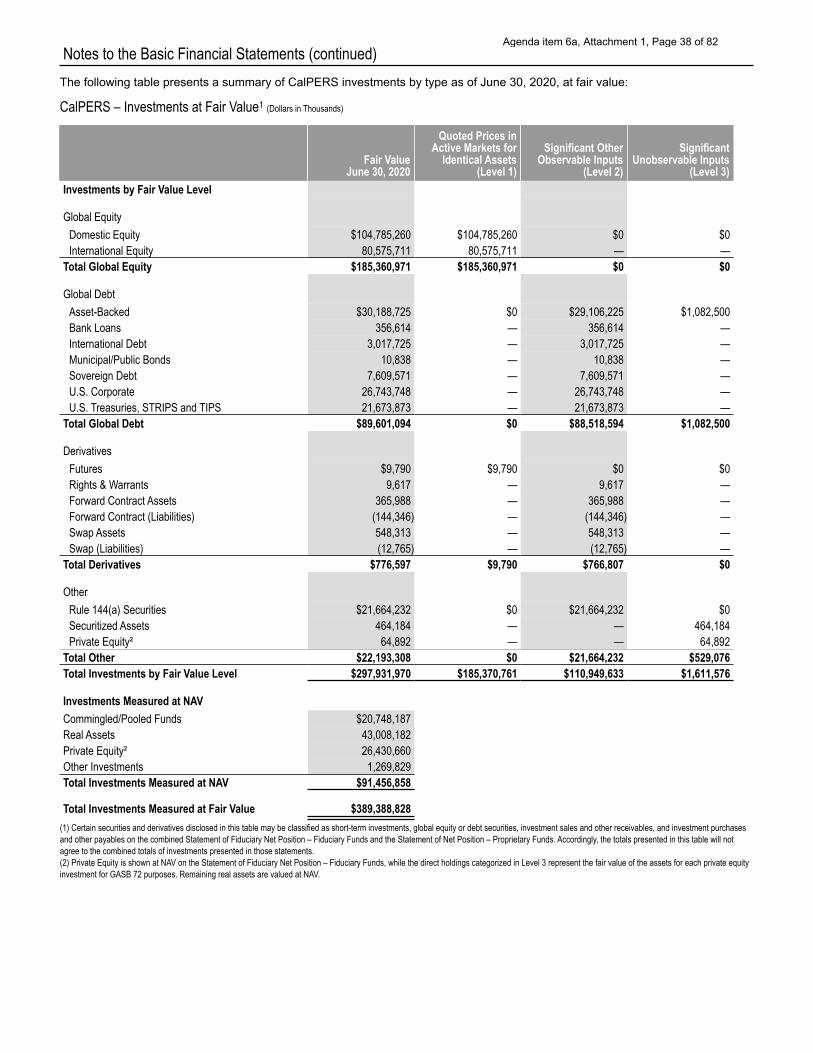
Notes to the Basic Financial Statements (continued) The following table presents a summary of CalPERS investments by type as of June 30, 2020, at fair value:
CalPERS – Investments at Fair Value1 (Dollars in Thousands)
Fair Value June 30, 2020
Quoted Prices in Active Markets for
Identical Assets (Level 1)
Significant Other Observable Inputs
(Level 2)
Significant Unobservable Inputs
(Level 3) Investments by Fair Value Level
Global Equity Domestic Equity $104,785,260 $104,785,260 $0 $0 International Equity 80,575,711 80,575,711 — —
Total Global Equity
Global Debt Asset-Backed $30,188,725 $0 $29,106,225 $1,082,500 Bank Loans 356,614 — 356,614 — International Debt 3,017,725 — 3,017,725 — Municipal/Public Bonds 10,838 — 10,838 — Sovereign Debt 7,609,571 — 7,609,571 — U.S. Corporate 26,743,748 — 26,743,748 — U.S. Treasuries, STRIPS and TIPS 21,673,873 — 21,673,873 —
$185,360,971 $185,360,971 $0 $0
Total Global Debt
Derivatives Futures $9,790 $9,790 $0 $0 Rights & Warrants 9,617 — 9,617 — Forward Contract Assets 365,988 — 365,988 — Forward Contract (Liabilities) (144,346) — (144,346) — Swap Assets 548,313 — 548,313 — Swap (Liabilities) (12,765) — (12,765) —
Total Derivatives
Other Rule 144(a) Securities $21,664,232 $0 $21,664,232 $0 Securitized Assets 464,184 — — 464,184 Private Equity² 64,892 — — 64,892
Total Other $22,193,308 $0 $21,664,232 $529,076
$89,601,094 $0 $88,518,594 $1,082,500
$776,597 $9,790 $766,807 $0
Total Investments by Fair Value Level $297,931,970 $185,370,761 $110,949,633 $1,611,576
Investments Measured at NAV Commingled/Pooled Funds $20,748,187 Real Assets 43,008,182 Private Equity² 26,430,660 Other Investments 1,269,829 Total Investments Measured at NAV $91,456,858
Total Investments Measured at Fair Value $389,388,828 (1) Certain securities and derivatives disclosed in this table may be classified as short-term investments, global equity or debt securities, investment sales and other receivables, and investment purchases and other payables on the combined Statement of Fiduciary Net Position – Fiduciary Funds and the Statement of Net Position – Proprietary Funds. Accordingly, the totals presented in this table will not agree to the combined totals of investments presented in those statements. (2) Private Equity is shown at NAV on the Statement of Fiduciary Net Position – Fiduciary Funds, while the direct holdings categorized in Level 3 represent the fair value of the assets for each private equity investment for GASB 72 purposes. Remaining real assets are valued at NAV.
Agenda item 6a, Attachment 1, Page 38 of 82
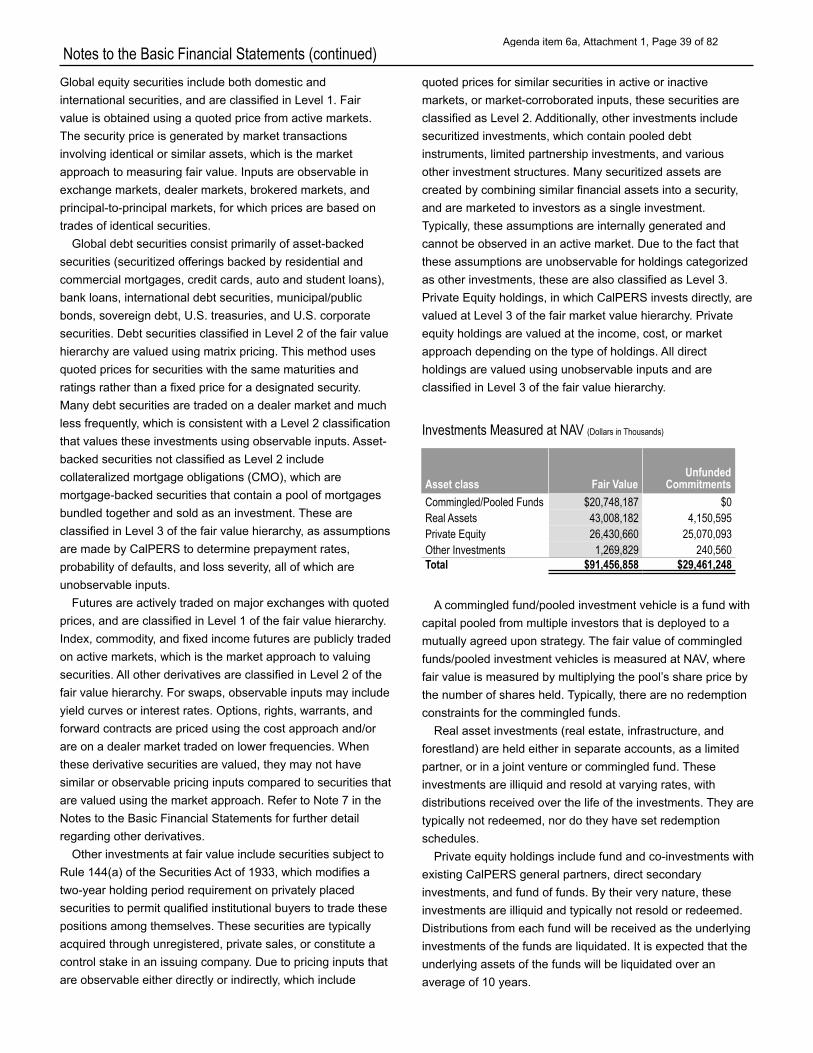
Notes to the Basic Financial Statements (continued) Global equity securities include both domestic and international securities, and are classified in Level 1. Fair value is obtained using a quoted price from active markets. The security price is generated by market transactions involving identical or similar assets, which is the market approach to measuring fair value. Inputs are observable in exchange markets, dealer markets, brokered markets, and principal-to-principal markets, for which prices are based on trades of identical securities.
Global debt securities consist primarily of asset-backed securities (securitized offerings backed by residential and commercial mortgages, credit cards, auto and student loans), bank loans, international debt securities, municipal/public bonds, sovereign debt, U.S. treasuries, and U.S. corporate securities. Debt securities classified in Level 2 of the fair value hierarchy are valued using matrix pricing. This method uses quoted prices for securities with the same maturities and ratings rather than a fixed price for a designated security. Many debt securities are traded on a dealer market and much less frequently, which is consistent with a Level 2 classification that values these investments using observable inputs. Asset- backed securities not classified as Level 2 include collateralized mortgage obligations (CMO), which are mortgage-backed securities that contain a pool of mortgages bundled together and sold as an investment. These are classified in Level 3 of the fair value hierarchy, as assumptions are made by CalPERS to determine prepayment rates, probability of defaults, and loss severity, all of which are unobservable inputs.
Futures are actively traded on major exchanges with quoted prices, and are classified in Level 1 of the fair value hierarchy. Index, commodity, and fixed income futures are publicly traded on active markets, which is the market approach to valuing securities. All other derivatives are classified in Level 2 of the fair value hierarchy. For swaps, observable inputs may include yield curves or interest rates. Options, rights, warrants, and forward contracts are priced using the cost approach and/or are on a dealer market traded on lower frequencies. When these derivative securities are valued, they may not have similar or observable pricing inputs compared to securities that are valued using the market approach. Refer to Note 7 in the Notes to the Basic Financial Statements for further detail regarding other derivatives.
Other investments at fair value include securities subject to Rule 144(a) of the Securities Act of 1933, which modifies a two-year holding period requirement on privately placed securities to permit qualified institutional buyers to trade these positions among themselves. These securities are typically acquired through unregistered, private sales, or constitute a control stake in an issuing company. Due to pricing inputs that are observable either directly or indirectly, which include
quoted prices for similar securities in active or inactive markets, or market-corroborated inputs, these securities are classified as Level 2. Additionally, other investments include securitized investments, which contain pooled debt instruments, limited partnership investments, and various other investment structures. Many securitized assets are created by combining similar financial assets into a security, and are marketed to investors as a single investment. Typically, these assumptions are internally generated and cannot be observed in an active market. Due to the fact that these assumptions are unobservable for holdings categorized as other investments, these are also classified as Level 3. Private Equity holdings, in which CalPERS invests directly, are valued at Level 3 of the fair market value hierarchy. Private equity holdings are valued at the income, cost, or market approach depending on the type of holdings. All direct holdings are valued using unobservable inputs and are classified in Level 3 of the fair value hierarchy.
Investments Measured at NAV (Dollars in Thousands)
Asset class Fair Value Unfunded
Commitments Commingled/Pooled Funds $20,748,187 $0 Real Assets 43,008,182 4,150,595 Private Equity 26,430,660 25,070,093 Other Investments 1,269,829 240,560 Total $91,456,858 $29,461,248
A commingled fund/pooled investment vehicle is a fund with capital pooled from multiple investors that is deployed to a mutually agreed upon strategy. The fair value of commingled funds/pooled investment vehicles is measured at NAV, where fair value is measured by multiplying the pool’s share price by the number of shares held. Typically, there are no redemption constraints for the commingled funds.
Real asset investments (real estate, infrastructure, and forestland) are held either in separate accounts, as a limited partner, or in a joint venture or commingled fund. These investments are illiquid and resold at varying rates, with distributions received over the life of the investments. They are typically not redeemed, nor do they have set redemption schedules.
Private equity holdings include fund and co-investments with existing CalPERS general partners, direct secondary investments, and fund of funds. By their very nature, these investments are illiquid and typically not resold or redeemed. Distributions from each fund will be received as the underlying investments of the funds are liquidated. It is expected that the underlying assets of the funds will be liquidated over an average of 10 years.
Agenda item 6a, Attachment 1, Page 39 of 82
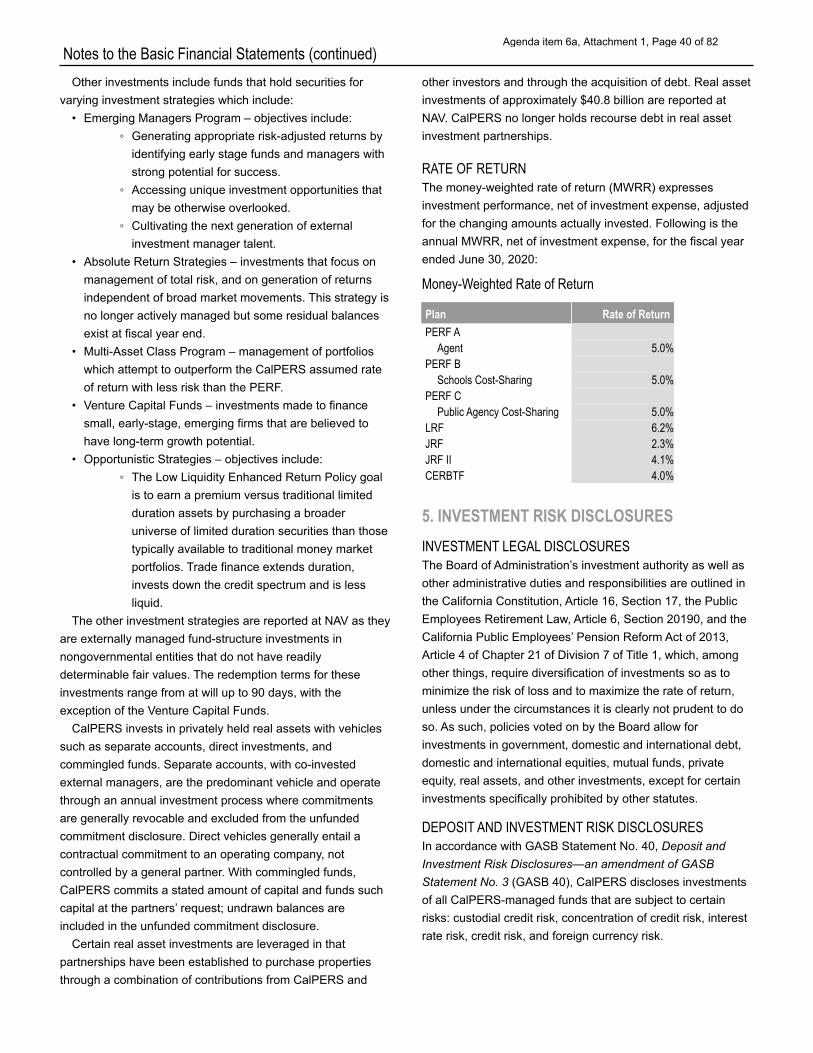
Notes to the Basic Financial Statements (continued) Other investments include funds that hold securities for
varying investment strategies which include: • Emerging Managers Program – objectives include:
◦ Generating appropriate risk-adjusted returns by identifying early stage funds and managers with strong potential for success.
◦ Accessing unique investment opportunities that may be otherwise overlooked.
◦ Cultivating the next generation of external investment manager talent.
• Absolute Return Strategies – investments that focus on management of total risk, and on generation of returns independent of broad market movements. This strategy is no longer actively managed but some residual balances exist at fiscal year end.
• Multi-Asset Class Program – management of portfolios which attempt to outperform the CalPERS assumed rate of return with less risk than the PERF.
• Venture Capital Funds – investments made to finance small, early-stage, emerging firms that are believed to have long-term growth potential.
• Opportunistic Strategies – objectives include: ◦ The Low Liquidity Enhanced Return Policy goal
is to earn a premium versus traditional limited duration assets by purchasing a broader universe of limited duration securities than those typically available to traditional money market portfolios. Trade finance extends duration, invests down the credit spectrum and is less liquid.
The other investment strategies are reported at NAV as they are externally managed fund-structure investments in nongovernmental entities that do not have readily determinable fair values. The redemption terms for these investments range from at will up to 90 days, with the exception of the Venture Capital Funds.
CalPERS invests in privately held real assets with vehicles such as separate accounts, direct investments, and commingled funds. Separate accounts, with co-invested external managers, are the predominant vehicle and operate through an annual investment process where commitments are generally revocable and excluded from the unfunded commitment disclosure. Direct vehicles generally entail a contractual commitment to an operating company, not controlled by a general partner. With commingled funds, CalPERS commits a stated amount of capital and funds such capital at the partners’ request; undrawn balances are included in the unfunded commitment disclosure.
Certain real asset investments are leveraged in that partnerships have been established to purchase properties through a combination of contributions from CalPERS and
other investors and through the acquisition of debt. Real asset investments of approximately $40.8 billion are reported at NAV. CalPERS no longer holds recourse debt in real asset investment partnerships.
RATE OF RETURN The money-weighted rate of return (MWRR) expresses investment performance, net of investment expense, adjusted for the changing amounts actually invested. Following is the annual MWRR, net of investment expense, for the fiscal year ended June 30, 2020:
Money-Weighted Rate of Return
Plan Rate of Return PERF A
Agent 5.0% PERF B
Schools Cost-Sharing 5.0% PERF C
Public Agency Cost-Sharing 5.0% LRF 6.2% JRF 2.3% JRF II 4.1% CERBTF 4.0%
5. INVESTMENT RISK DISCLOSURES INVESTMENT LEGAL DISCLOSURES The Board of Administration’s investment authority as well as other administrative duties and responsibilities are outlined in the California Constitution, Article 16, Section 17, the Public Employees Retirement Law, Article 6, Section 20190, and the California Public Employees’ Pension Reform Act of 2013, Article 4 of Chapter 21 of Division 7 of Title 1, which, among other things, require diversification of investments so as to minimize the risk of loss and to maximize the rate of return, unless under the circumstances it is clearly not prudent to do so. As such, policies voted on by the Board allow for investments in government, domestic and international debt, domestic and international equities, mutual funds, private equity, real assets, and other investments, except for certain investments specifically prohibited by other statutes.
DEPOSIT AND INVESTMENT RISK DISCLOSURES In accordance with GASB Statement No. 40, Deposit and Investment Risk Disclosures—an amendment of GASB Statement No. 3 (GASB 40), CalPERS discloses investments of all CalPERS-managed funds that are subject to certain risks: custodial credit risk, concentration of credit risk, interest rate risk, credit risk, and foreign currency risk.
Agenda item 6a, Attachment 1, Page 40 of 82
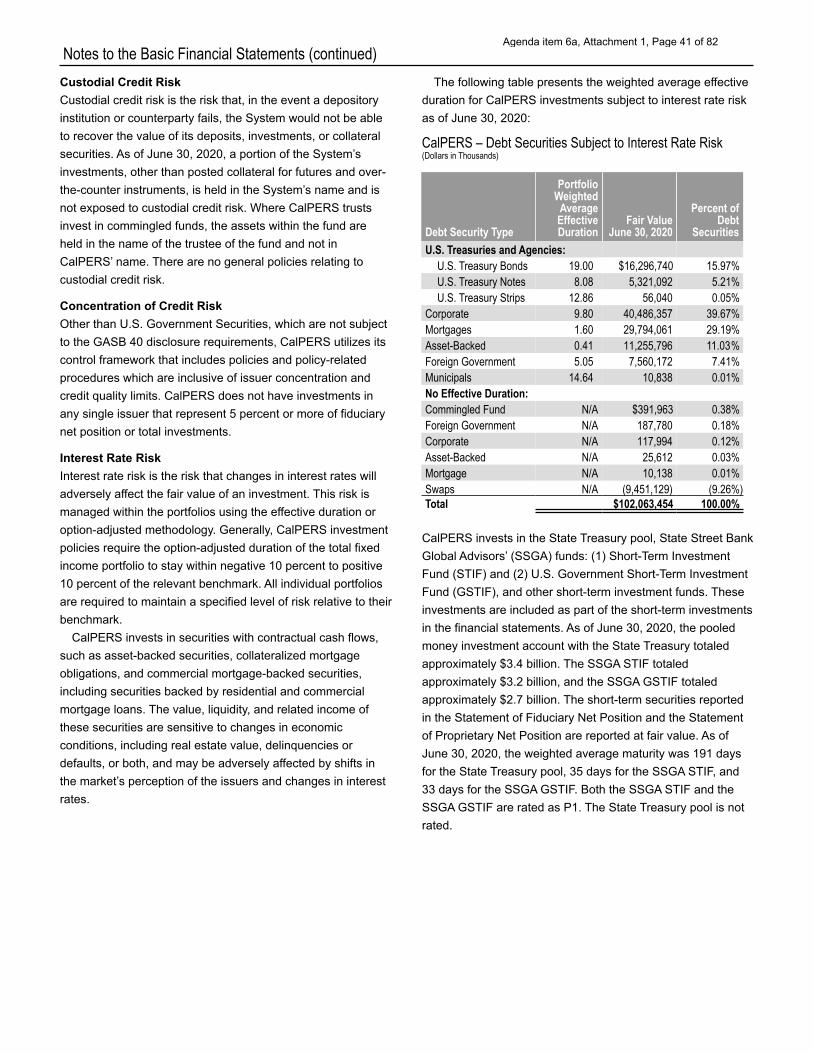
Notes to the Basic Financial Statements (continued) Custodial Credit Risk Custodial credit risk is the risk that, in the event a depository institution or counterparty fails, the System would not be able to recover the value of its deposits, investments, or collateral securities. As of June 30, 2020, a portion of the System’s investments, other than posted collateral for futures and over- the-counter instruments, is held in the System’s name and is not exposed to custodial credit risk. Where CalPERS trusts invest in commingled funds, the assets within the fund are held in the name of the trustee of the fund and not in CalPERS’ name. There are no general policies relating to custodial credit risk.
Concentration of Credit Risk Other than U.S. Government Securities, which are not subject to the GASB 40 disclosure requirements, CalPERS utilizes its control framework that includes policies and policy-related procedures which are inclusive of issuer concentration and credit quality limits. CalPERS does not have investments in any single issuer that represent 5 percent or more of fiduciary net position or total investments.
Interest Rate Risk Interest rate risk is the risk that changes in interest rates will adversely affect the fair value of an investment. This risk is managed within the portfolios using the effective duration or option-adjusted methodology. Generally, CalPERS investment policies require the option-adjusted duration of the total fixed income portfolio to stay within negative 10 percent to positive 10 percent of the relevant benchmark. All individual portfolios are required to maintain a specified level of risk relative to their benchmark.
CalPERS invests in securities with contractual cash flows, such as asset-backed securities, collateralized mortgage obligations, and commercial mortgage-backed securities, including securities backed by residential and commercial mortgage loans. The value, liquidity, and related income of these securities are sensitive to changes in economic conditions, including real estate value, delinquencies or defaults, or both, and may be adversely affected by shifts in the market’s perception of the issuers and changes in interest rates.
The following table presents the weighted average effective duration for CalPERS investments subject to interest rate risk as of June 30, 2020:
CalPERS – Debt Securities Subject to Interest Rate Risk (Dollars in Thousands)
Debt Security Type
Portfolio Weighted Average Effective Duration
Fair Value June 30, 2020
Percent of Debt
Securities U.S. Treasuries and Agencies:
U.S. Treasury Bonds 19.00 $16,296,740 15.97% U.S. Treasury Notes 8.08 5,321,092 5.21% U.S. Treasury Strips 12.86 56,040 0.05%
Corporate 9.80 40,486,357 39.67% Mortgages 1.60 29,794,061 29.19% Asset-Backed 0.41 11,255,796 11.03% Foreign Government 5.05 7,560,172 7.41% Municipals 14.64 10,838 0.01% No Effective Duration: Commingled Fund N/A $391,963 0.38% Foreign Government N/A 187,780 0.18% Corporate N/A 117,994 0.12% Asset-Backed N/A 25,612 0.03% Mortgage N/A 10,138 0.01% Swaps N/A (9,451,129) (9.26%) Total $102,063,454 100.00%
CalPERS invests in the State Treasury pool, State Street Bank Global Advisors’ (SSGA) funds: (1) Short-Term Investment Fund (STIF) and (2) U.S. Government Short-Term Investment Fund (GSTIF), and other short-term investment funds. These investments are included as part of the short-term investments in the financial statements. As of June 30, 2020, the pooled money investment account with the State Treasury totaled approximately $3.4 billion. The SSGA STIF totaled approximately $3.2 billion, and the SSGA GSTIF totaled approximately $2.7 billion. The short-term securities reported in the Statement of Fiduciary Net Position and the Statement of Proprietary Net Position are reported at fair value. As of June 30, 2020, the weighted average maturity was 191 days for the State Treasury pool, 35 days for the SSGA STIF, and 33 days for the SSGA GSTIF. Both the SSGA STIF and the SSGA GSTIF are rated as P1. The State Treasury pool is not rated.
Agenda item 6a, Attachment 1, Page 41 of 82
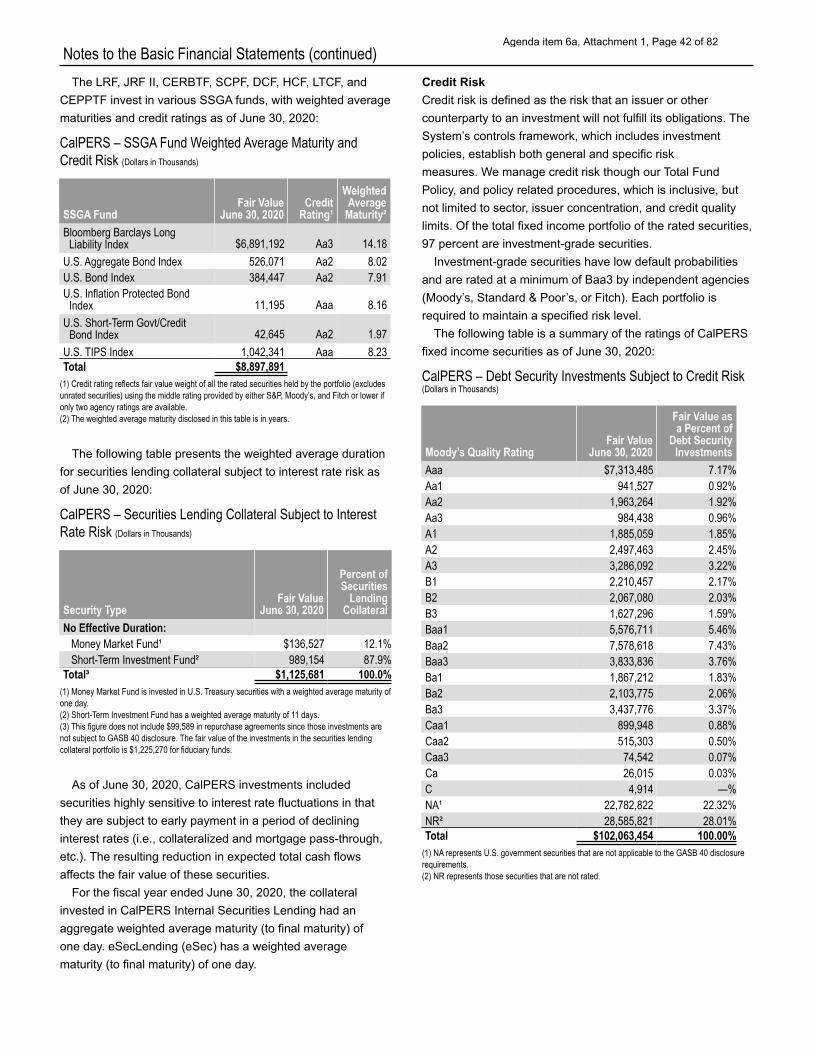
Notes to the Basic Financial Statements (continued) The LRF, JRF II, CERBTF, SCPF, DCF, HCF, LTCF, and
CEPPTF invest in various SSGA funds, with weighted average maturities and credit ratings as of June 30, 2020:
CalPERS – SSGA Fund Weighted Average Maturity and Credit Risk (Dollars in Thousands)
SSGA Fund Fair Value
June 30, 2020 Credit
Rating¹
Weighted Average
Maturity² Bloomberg Barclays Long Liability Index $6,891,192 Aa3 14.18
U.S. Aggregate Bond Index 526,071 Aa2 8.02 U.S. Bond Index 384,447 Aa2 7.91 U.S. Inflation Protected Bond Index 11,195 Aaa 8.16
U.S. Short-Term Govt/Credit Bond Index 42,645 Aa2 1.97
U.S. TIPS Index 1,042,341 Aaa 8.23 Total $8,897,891
(1) Credit rating reflects fair value weight of all the rated securities held by the portfolio (excludes unrated securities) using the middle rating provided by either S&P, Moody’s, and Fitch or lower if only two agency ratings are available. (2) The weighted average maturity disclosed in this table is in years.
The following table presents the weighted average duration for securities lending collateral subject to interest rate risk as of June 30, 2020:
CalPERS – Securities Lending Collateral Subject to Interest Rate Risk (Dollars in Thousands)
Security Type Fair Value
June 30, 2020
Percent of Securities
Lending Collateral
No Effective Duration: Money Market Fund¹ $136,527 12.1% Short-Term Investment Fund² 989,154 87.9%
Total³ $1,125,681 100.0% (1) Money Market Fund is invested in U.S. Treasury securities with a weighted average maturity of one day. (2) Short-Term Investment Fund has a weighted average maturity of 11 days. (3) This figure does not include $99,589 in repurchase agreements since those investments are not subject to GASB 40 disclosure. The fair value of the investments in the securities lending collateral portfolio is $1,225,270 for fiduciary funds.
As of June 30, 2020, CalPERS investments included securities highly sensitive to interest rate fluctuations in that they are subject to early payment in a period of declining interest rates (i.e., collateralized and mortgage pass-through, etc.). The resulting reduction in expected total cash flows affects the fair value of these securities.
For the fiscal year ended June 30, 2020, the collateral invested in CalPERS Internal Securities Lending had an aggregate weighted average maturity (to final maturity) of one day. eSecLending (eSec) has a weighted average maturity (to final maturity) of one day.
Credit Risk Credit risk is defined as the risk that an issuer or other counterparty to an investment will not fulfill its obligations. The System’s controls framework, which includes investment policies, establish both general and specific risk measures. We manage credit risk though our Total Fund Policy, and policy related procedures, which is inclusive, but not limited to sector, issuer concentration, and credit quality limits. Of the total fixed income portfolio of the rated securities, 97 percent are investment-grade securities.
Investment-grade securities have low default probabilities and are rated at a minimum of Baa3 by independent agencies (Moody’s, Standard & Poor’s, or Fitch). Each portfolio is required to maintain a specified risk level.
The following table is a summary of the ratings of CalPERS fixed income securities as of June 30, 2020:
CalPERS – Debt Security Investments Subject to Credit Risk (Dollars in Thousands)
Moody’s Quality Rating Fair Value
June 30, 2020
Fair Value as a Percent of
Debt Security Investments
Aaa $7,313,485 7.17% Aa1 941,527 0.92% Aa2 1,963,264 1.92% Aa3 984,438 0.96% A1 1,885,059 1.85% A2 2,497,463 2.45% A3 3,286,092 3.22% B1 2,210,457 2.17% B2 2,067,080 2.03% B3 1,627,296 1.59% Baa1 5,576,711 5.46% Baa2 7,578,618 7.43% Baa3 3,833,836 3.76% Ba1 1,867,212 1.83% Ba2 2,103,775 2.06% Ba3 3,437,776 3.37% Caa1 899,948 0.88% Caa2 515,303 0.50% Caa3 74,542 0.07% Ca 26,015 0.03% C 4,914 —% NA¹ 22,782,822 22.32% NR² 28,585,821 28.01% Total $102,063,454 100.00%
(1) NA represents U.S. government securities that are not applicable to the GASB 40 disclosure requirements. (2) NR represents those securities that are not rated.
Agenda item 6a, Attachment 1, Page 42 of 82

Notes to the Basic Financial Statements (continued) The following table is a summary of the ratings of the
securities lending collateral subject to credit risk:
CalPERS – Securities Lending Collateral Subject to Credit Risk (Dollars in Thousands)
Moody’s Quality Rating Fair Value Fair Value as a Percent of
Securities Lending Collateral NR1,2 $1,125,681 100.0% Total³ $1,125,681 100.0%
(1) NR represents those securities that are not rated. (2) This figure includes $136,527 invested in a money market fund and $989,154 invested in short-term investments. (3) This figure does not include $99,589 in repurchase agreements since they are not subject to GASB 40 disclosure. The fair value of the investments in the securities lending collateral portfolio is $1,225,270 for fiduciary funds.
Agenda item 6a, Attachment 1, Page 43 of 82
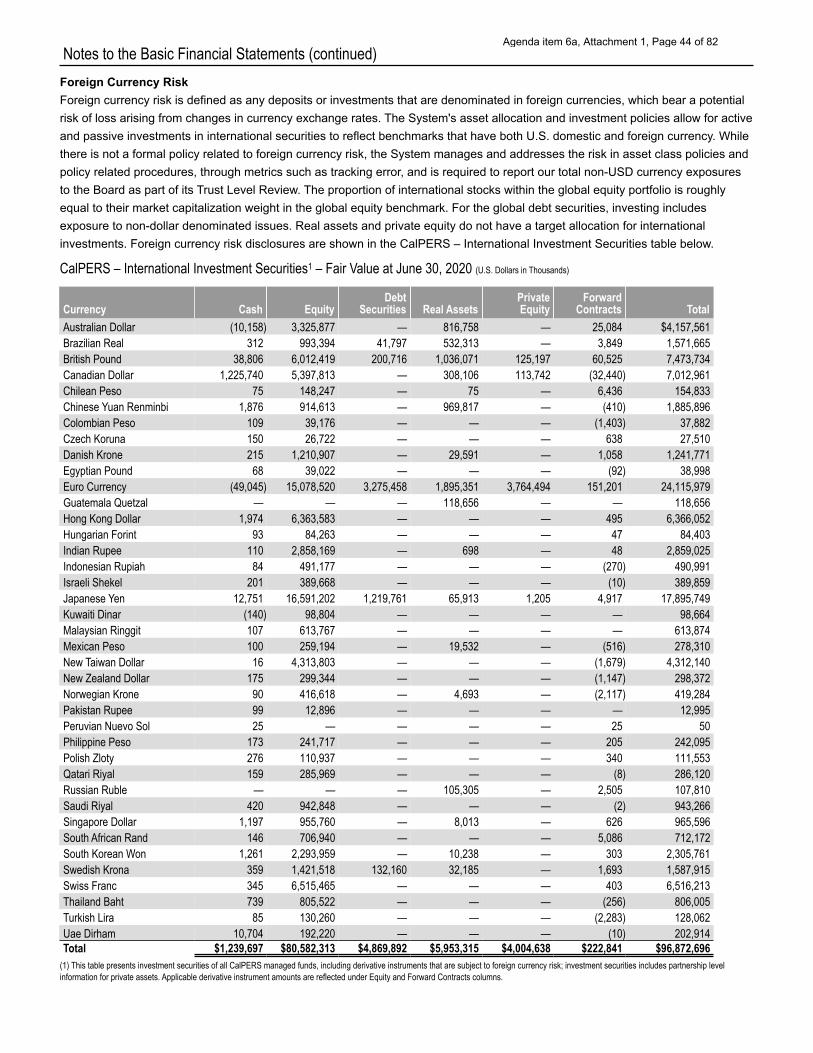
Notes to the Basic Financial Statements (continued) Foreign Currency Risk Foreign currency risk is defined as any deposits or investments that are denominated in foreign currencies, which bear a potential risk of loss arising from changes in currency exchange rates. The System's asset allocation and investment policies allow for active and passive investments in international securities to reflect benchmarks that have both U.S. domestic and foreign currency. While there is not a formal policy related to foreign currency risk, the System manages and addresses the risk in asset class policies and policy related procedures, through metrics such as tracking error, and is required to report our total non-USD currency exposures to the Board as part of its Trust Level Review. The proportion of international stocks within the global equity portfolio is roughly equal to their market capitalization weight in the global equity benchmark. For the global debt securities, investing includes exposure to non-dollar denominated issues. Real assets and private equity do not have a target allocation for international investments. Foreign currency risk disclosures are shown in the CalPERS – International Investment Securities table below.
CalPERS – International Investment Securities1 – Fair Value at June 30, 2020 (U.S. Dollars in Thousands)
Currency Cash Equity Debt
Securities Real Assets Private Equity
Forward Contracts Total
Australian Dollar (10,158) 3,325,877 — 816,758 — 25,084 $4,157,561 Brazilian Real 312 993,394 41,797 532,313 — 3,849 1,571,665 British Pound 38,806 6,012,419 200,716 1,036,071 125,197 60,525 7,473,734 Canadian Dollar 1,225,740 5,397,813 — 308,106 113,742 (32,440) 7,012,961 Chilean Peso 75 148,247 — 75 — 6,436 154,833 Chinese Yuan Renminbi 1,876 914,613 — 969,817 — (410) 1,885,896 Colombian Peso 109 39,176 — — — (1,403) 37,882 Czech Koruna 150 26,722 — — — 638 27,510 Danish Krone 215 1,210,907 — 29,591 — 1,058 1,241,771 Egyptian Pound 68 39,022 — — — (92) 38,998 Euro Currency (49,045) 15,078,520 3,275,458 1,895,351 3,764,494 151,201 24,115,979 Guatemala Quetzal — — — 118,656 — — 118,656 Hong Kong Dollar 1,974 6,363,583 — — — 495 6,366,052 Hungarian Forint 93 84,263 — — — 47 84,403 Indian Rupee 110 2,858,169 — 698 — 48 2,859,025 Indonesian Rupiah 84 491,177 — — — (270) 490,991 Israeli Shekel 201 389,668 — — — (10) 389,859 Japanese Yen 12,751 16,591,202 1,219,761 65,913 1,205 4,917 17,895,749 Kuwaiti Dinar (140) 98,804 — — — — 98,664 Malaysian Ringgit 107 613,767 — — — — 613,874 Mexican Peso 100 259,194 — 19,532 — (516) 278,310 New Taiwan Dollar 16 4,313,803 — — — (1,679) 4,312,140 New Zealand Dollar 175 299,344 — — — (1,147) 298,372 Norwegian Krone 90 416,618 — 4,693 — (2,117) 419,284 Pakistan Rupee 99 12,896 — — — — 12,995 Peruvian Nuevo Sol 25 — — — — 25 50 Philippine Peso 173 241,717 — — — 205 242,095 Polish Zloty 276 110,937 — — — 340 111,553 Qatari Riyal 159 285,969 — — — (8) 286,120 Russian Ruble — — — 105,305 — 2,505 107,810 Saudi Riyal 420 942,848 — — — (2) 943,266 Singapore Dollar 1,197 955,760 — 8,013 — 626 965,596 South African Rand 146 706,940 — — — 5,086 712,172 South Korean Won 1,261 2,293,959 — 10,238 — 303 2,305,761 Swedish Krona 359 1,421,518 132,160 32,185 — 1,693 1,587,915 Swiss Franc 345 6,515,465 — — — 403 6,516,213 Thailand Baht 739 805,522 — — — (256) 806,005 Turkish Lira 85 130,260 — — — (2,283) 128,062 Uae Dirham 10,704 192,220 — — — (10) 202,914 Total $1,239,697 $80,582,313 $4,869,892 $5,953,315 $4,004,638 $222,841 $96,872,696
(1) This table presents investment securities of all CalPERS managed funds, including derivative instruments that are subject to foreign currency risk; investment securities includes partnership level information for private assets. Applicable derivative instrument amounts are reflected under Equity and Forward Contracts columns.
Agenda item 6a, Attachment 1, Page 44 of 82
Notes to the Basic Financial Statements (continued)
6. SECURITIES LENDING
The State Constitution and Board policy permits CalPERS to enter into securities lending transactions, which are collateralized loans of securities to broker-dealers and other entities with a simultaneous agreement to return collateral for the same securities in the future.
CalPERS has contracted with eSecLending, LLC (eSec) and State Street Bank & Trust (SSB) as securities lending agents to loan domestic and international equity and debt securities. CalPERS receives both cash and noncash (i.e., securities) collateral. Domestic and international securities are collateralized at a minimum of 102 percent and 105 percent, respectively, of the loaned securities’ fair value. CalPERS cannot seize the collateral without borrower default; the collateral is therefore not reported in CalPERS financial statements in accordance with GASB Statement No. 28, Accounting and Financial Reporting for Securities Lending Transactions (GASB 28). Management believes CalPERS has minimized credit risk exposure to borrowers by requiring the borrower to provide collateralization greater than 100 percent of the fair value of the securities loaned. The securities loaned are priced daily by third-party sources, and margins are delivered/received daily to maintain over-collateralized levels. Securities on loan can be recalled or returned by CalPERS or the borrower at any time. Since loans are terminable at will, loan durations do not generally match the duration of the investments made with the cash collateral. CalPERS may enter into term loan agreements, which are evaluated on an individual basis. On June 30, 2020, the fair value of the securities on loan was approximately $28.9 billion. The securities on loan remain on CalPERS’ Statement of Fiduciary Net Position in their respective investment categories. At June 30, 2020, cash collateral received totaling $1.2 billion is reported as securities lending obligation, and the fair value of reinvested cash collateral totaling $1.2 billion is reported as securities lending collateral on the Statement of Fiduciary Net Position. The changes in fair value of the reinvested cash collateral are reported as net appreciation/depreciation in fair value of investments on the Statement of Changes in Fiduciary Net Position.
Because the domestic and international debt and equity securities in the internally managed investment pools are also used in the securities lending program, in accordance with GASB 28, the securities lending collateral, obligation, and the related income and costs are allocated to the pool owners (respective reporting funds) based on the funds’ pro rata share of the pools’ investments.
CalPERS securities lending reinvestment collateral guidelines prescribe that cash collateral received needs to be invested in short-term, high-credit-quality securities. Currently, eSecLending and CalPERS manage the collateral.
7. DERIVATIVES
CalPERS holds investments in swaps, options, futures, rights, and warrants and enters into forward foreign currency exchange contracts. The fair value of futures is determined using the market approach based upon quoted market prices. The fair value of options, rights, warrants, and swaps is determined using the cost approach, because these are traded with lower frequencies. The fair value of derivative investments that are exchange-traded, such as options, rights, and warrants, are priced using the exchange they are traded on. Non-exchange-traded investments, such as swaps, are determined by an external pricing service using various proprietary methods. The fair value of international currency forwards represents the unrealized gain or loss on the related contracts, which is calculated as the difference between the contract exchange rate and the exchange rate at the end of the reporting period.
Futures contracts are marked to market at the end of each trading day, and the settlement of gains or losses occurs on the following business day through the movement of variation margins. Over-the-counter derivatives, such as swaps, generally reset monthly and the settlement of gains or losses occurs the following business day. Currency forward contracts roll quarterly, updating the contract exchange rate.
With all over-the-counter derivatives, such as swaps and currency forwards, CalPERS is exposed to counterparty risk. CalPERS investment managers seek to control this risk through counterparty credit evaluations and approvals, counterparty credit limits, posting collateral exposure, and monitoring procedures, in addition to adherence to the standard International Swaps and Derivatives Association and Credit Support Annex agreements with all counterparties.
At June 30, 2020, the aggregate fair value of investment derivatives in an asset position subject to counterparty credit risk was approximately $914.3 million. The aggregate amount of cash collateral held by CalPERS on behalf of over-the- counter derivatives was approximately $597.6 million.
Agenda item 6a, Attachment 1, Page 45 of 82
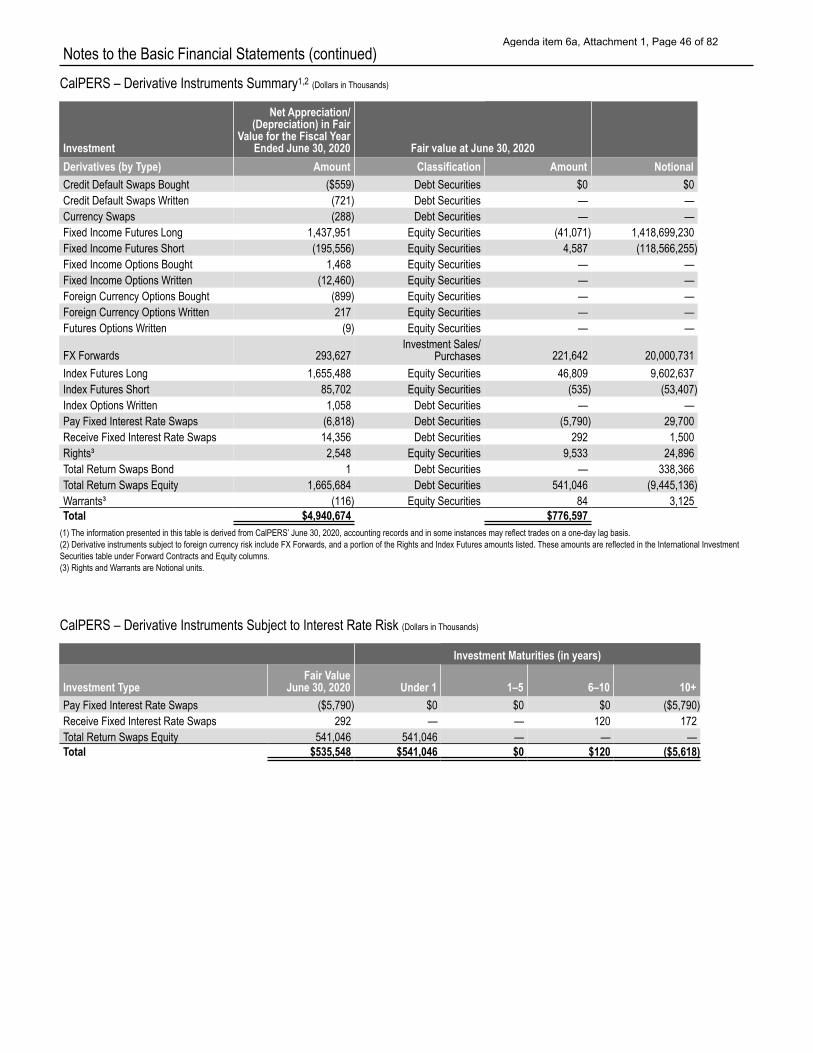
Notes to the Basic Financial Statements (continued) CalPERS – Derivative Instruments Summary1,2 (Dollars in Thousands)
Investment
Net Appreciation/ (Depreciation) in Fair
Value for the Fiscal Year Ended June 30, 2020 Fair value at June 30, 2020
Derivatives (by Type) Amount Classification Amount Notional Credit Default Swaps Bought ($559) Debt Securities $0 $0 Credit Default Swaps Written (721) Debt Securities — — Currency Swaps (288) Debt Securities — — Fixed Income Futures Long 1,437,951 Equity Securities (41,071) 1,418,699,230 Fixed Income Futures Short (195,556) Equity Securities 4,587 (118,566,255) Fixed Income Options Bought 1,468 Equity Securities — — Fixed Income Options Written (12,460) Equity Securities — — Foreign Currency Options Bought (899) Equity Securities — — Foreign Currency Options Written 217 Equity Securities — — Futures Options Written (9) Equity Securities — —
Investment Sales/ FX Forwards 293,627 Purchases 221,642 20,000,731 Index Futures Long 1,655,488 Equity Securities 46,809 9,602,637 Index Futures Short 85,702 Equity Securities (535) (53,407) Index Options Written 1,058 Debt Securities — — Pay Fixed Interest Rate Swaps (6,818) Debt Securities (5,790) 29,700 Receive Fixed Interest Rate Swaps 14,356 Debt Securities 292 1,500 Rights³ 2,548 Equity Securities 9,533 24,896 Total Return Swaps Bond 1 Debt Securities — 338,366 Total Return Swaps Equity 1,665,684 Debt Securities 541,046 (9,445,136) Warrants³ (116) Equity Securities 84 3,125 Total $4,940,674 $776,597
(1) The information presented in this table is derived from CalPERS’ June 30, 2020, accounting records and in some instances may reflect trades on a one-day lag basis. (2) Derivative instruments subject to foreign currency risk include FX Forwards, and a portion of the Rights and Index Futures amounts listed. These amounts are reflected in the International Investment Securities table under Forward Contracts and Equity columns. (3) Rights and Warrants are Notional units.
CalPERS – Derivative Instruments Subject to Interest Rate Risk (Dollars in Thousands)
Investment Maturities (in years)
Investment Type Fair Value
June 30, 2020 Under 1 1–5 6–10 10+ Pay Fixed Interest Rate Swaps ($5,790) $0 $0 $0 ($5,790) Receive Fixed Interest Rate Swaps 292 — — 120 172 Total Return Swaps Equity 541,046 541,046 — — — Total $535,548 $541,046 $0 $120 ($5,618)
Agenda item 6a, Attachment 1, Page 46 of 82
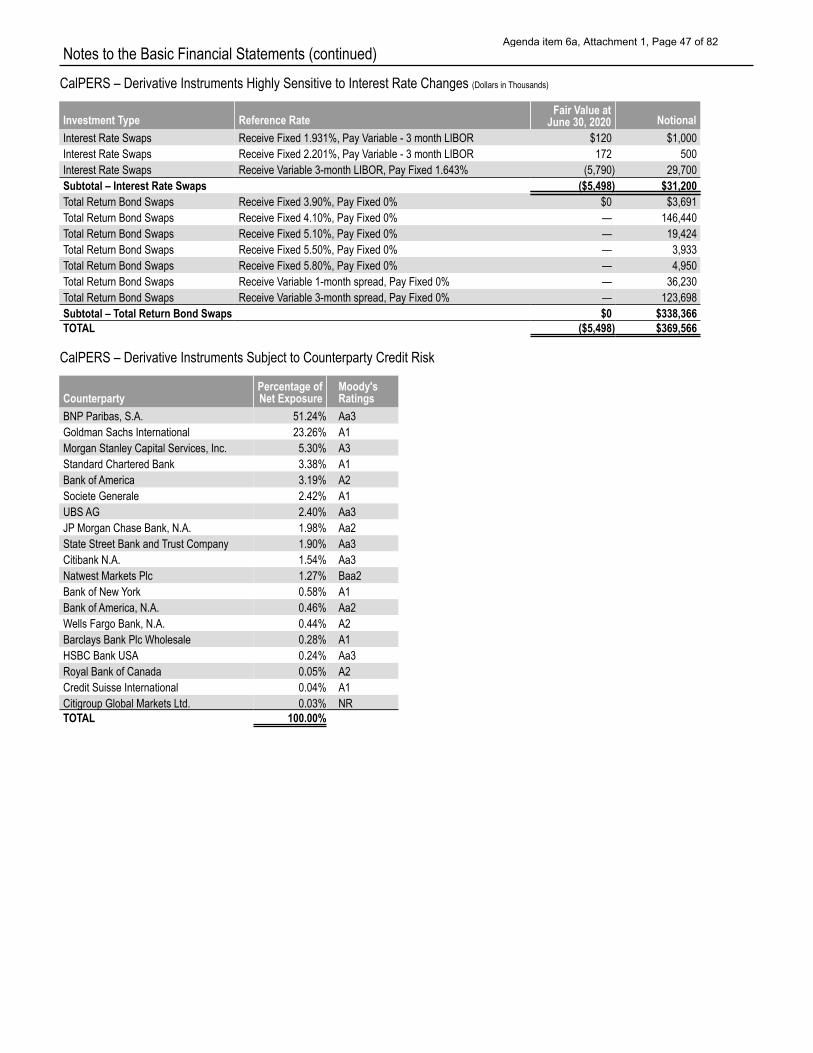
Notes to the Basic Financial Statements (continued) CalPERS – Derivative Instruments Highly Sensitive to Interest Rate Changes (Dollars in Thousands)
Investment Type Reference Rate Fair Value at
June 30, 2020 Notional Interest Rate Swaps Receive Fixed 1.931%, Pay Variable - 3 month LIBOR $120 $1,000 Interest Rate Swaps Receive Fixed 2.201%, Pay Variable - 3 month LIBOR 172 500 Interest Rate Swaps Receive Variable 3-month LIBOR, Pay Fixed 1.643% (5,790) 29,700 Subtotal – Interest Rate Swaps ($5,498) $31,200 Total Return Bond Swaps Receive Fixed 3.90%, Pay Fixed 0% $0 $3,691 Total Return Bond Swaps Receive Fixed 4.10%, Pay Fixed 0% — 146,440 Total Return Bond Swaps Receive Fixed 5.10%, Pay Fixed 0% — 19,424 Total Return Bond Swaps Receive Fixed 5.50%, Pay Fixed 0% — 3,933 Total Return Bond Swaps Receive Fixed 5.80%, Pay Fixed 0% — 4,950 Total Return Bond Swaps Receive Variable 1-month spread, Pay Fixed 0% — 36,230 Total Return Bond Swaps Receive Variable 3-month spread, Pay Fixed 0% — 123,698 Subtotal – Total Return Bond Swaps $0 $338,366 TOTAL ($5,498) $369,566
CalPERS – Derivative Instruments Subject to Counterparty Credit Risk
Counterparty Percentage of Net Exposure
Moody's Ratings
BNP Paribas, S.A. 51.24% Aa3 Goldman Sachs International 23.26% A1 Morgan Stanley Capital Services, Inc. 5.30% A3 Standard Chartered Bank 3.38% A1 Bank of America 3.19% A2 Societe Generale 2.42% A1 UBS AG 2.40% Aa3 JP Morgan Chase Bank, N.A. 1.98% Aa2 State Street Bank and Trust Company 1.90% Aa3 Citibank N.A. 1.54% Aa3 Natwest Markets Plc 1.27% Baa2 Bank of New York 0.58% A1 Bank of America, N.A. 0.46% Aa2 Wells Fargo Bank, N.A. 0.44% A2 Barclays Bank Plc Wholesale 0.28% A1 HSBC Bank USA 0.24% Aa3 Royal Bank of Canada 0.05% A2 Credit Suisse International 0.04% A1 Citigroup Global Markets Ltd. 0.03% NR TOTAL 100.00%
Agenda item 6a, Attachment 1, Page 47 of 82
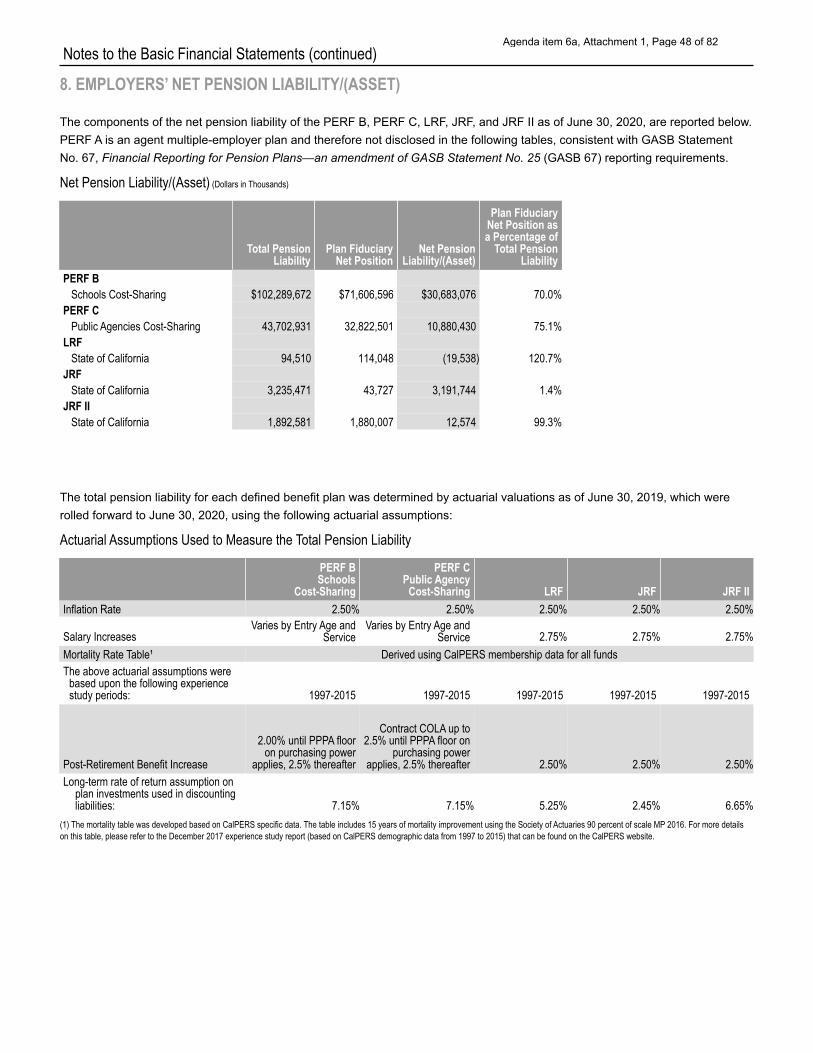
Notes to the Basic Financial Statements (continued)
8. EMPLOYERS’ NET PENSION LIABILITY/(ASSET)
The components of the net pension liability of the PERF B, PERF C, LRF, JRF, and JRF II as of June 30, 2020, are reported below. PERF A is an agent multiple-employer plan and therefore not disclosed in the following tables, consistent with GASB Statement No. 67, Financial Reporting for Pension Plans—an amendment of GASB Statement No. 25 (GASB 67) reporting requirements.
Net Pension Liability/(Asset) (Dollars in Thousands)
Total Pension Liability
Plan Fiduciary Net Position
Net Pension Liability/(Asset)
Plan Fiduciary Net Position as a Percentage of
Total Pension Liability
PERF B Schools Cost-Sharing $102,289,672 $71,606,596 $30,683,076 70.0%
PERF C Public Agencies Cost-Sharing 43,702,931 32,822,501 10,880,430 75.1%
LRF State of California 94,510 114,048 (19,538) 120.7%
JRF State of California 3,235,471 43,727 3,191,744 1.4%
JRF II State of California 1,892,581 1,880,007 12,574 99.3%
The total pension liability for each defined benefit plan was determined by actuarial valuations as of June 30, 2019, which were rolled forward to June 30, 2020, using the following actuarial assumptions:
Actuarial Assumptions Used to Measure the Total Pension Liability
PERF B Schools
Cost-Sharing
PERF C Public Agency Cost-Sharing LRF JRF JRF II
Inflation Rate 2.50% 2.50% 2.50% 2.50% 2.50%
Salary Increases Varies by Entry Age and
Service Varies by Entry Age and
Service 2.75% 2.75% 2.75% Mortality Rate Table¹ Derived using CalPERS membership data for all funds The above actuarial assumptions were based upon the following experience study periods: 1997-2015 1997-2015 1997-2015 1997-2015 1997-2015
Contract COLA up to 2.00% until PPPA floor 2.5% until PPPA floor on
on purchasing power purchasing power Post-Retirement Benefit Increase applies, 2.5% thereafter applies, 2.5% thereafter 2.50% 2.50% 2.50% Long-term rate of return assumption on
plan investments used in discounting liabilities: 7.15% 7.15% 5.25% 2.45% 6.65%
(1) The mortality table was developed based on CalPERS specific data. The table includes 15 years of mortality improvement using the Society of Actuaries 90 percent of scale MP 2016. For more details on this table, please refer to the December 2017 experience study report (based on CalPERS demographic data from 1997 to 2015) that can be found on the CalPERS website.
Agenda item 6a, Attachment 1, Page 48 of 82
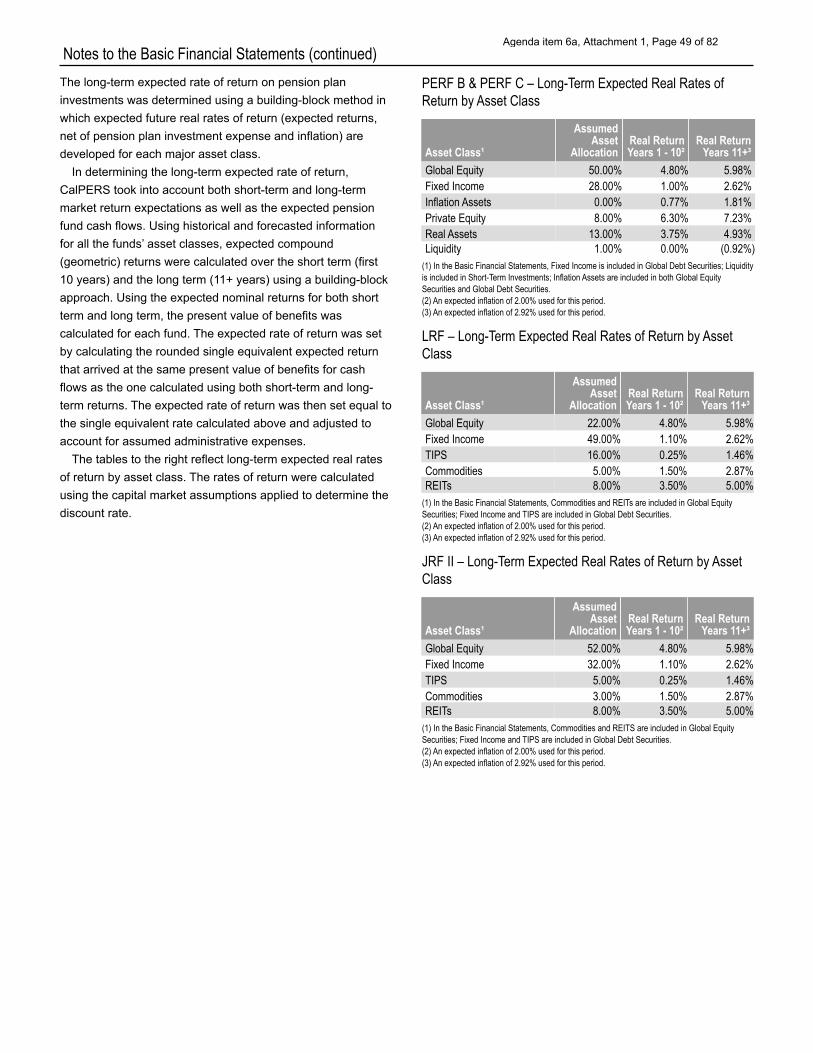
Notes to the Basic Financial Statements (continued) The long-term expected rate of return on pension plan investments was determined using a building-block method in which expected future real rates of return (expected returns, net of pension plan investment expense and inflation) are developed for each major asset class.
In determining the long-term expected rate of return, CalPERS took into account both short-term and long-term market return expectations as well as the expected pension fund cash flows. Using historical and forecasted information for all the funds’ asset classes, expected compound (geometric) returns were calculated over the short term (first 10 years) and the long term (11+ years) using a building-block approach. Using the expected nominal returns for both short term and long term, the present value of benefits was calculated for each fund. The expected rate of return was set by calculating the rounded single equivalent expected return that arrived at the same present value of benefits for cash flows as the one calculated using both short-term and long- term returns. The expected rate of return was then set equal to the single equivalent rate calculated above and adjusted to account for assumed administrative expenses.
The tables to the right reflect long-term expected real rates of return by asset class. The rates of return were calculated using the capital market assumptions applied to determine the discount rate.
PERF B & PERF C – Long-Term Expected Real Rates of Return by Asset Class
Asset Class¹
Assumed Asset
Allocation Real Return Years 1 - 10²
Real Return Years 11+³
Global Equity 50.00% 4.80% 5.98% Fixed Income 28.00% 1.00% 2.62% Inflation Assets 0.00% 0.77% 1.81% Private Equity 8.00% 6.30% 7.23% Real Assets 13.00% 3.75% 4.93% Liquidity 1.00% 0.00% (0.92%)
(1) In the Basic Financial Statements, Fixed Income is included in Global Debt Securities; Liquidity is included in Short-Term Investments; Inflation Assets are included in both Global Equity Securities and Global Debt Securities. (2) An expected inflation of 2.00% used for this period. (3) An expected inflation of 2.92% used for this period.
LRF – Long-Term Expected Real Rates of Return by Asset Class
Asset Class¹
Assumed Asset
Allocation Real Return Years 1 - 10²
Real Return Years 11+³
Global Equity 22.00% 4.80% 5.98% Fixed Income 49.00% 1.10% 2.62% TIPS 16.00% 0.25% 1.46% Commodities 5.00% 1.50% 2.87% REITs 8.00% 3.50% 5.00%
(1) In the Basic Financial Statements, Commodities and REITs are included in Global Equity Securities; Fixed Income and TIPS are included in Global Debt Securities. (2) An expected inflation of 2.00% used for this period. (3) An expected inflation of 2.92% used for this period.
JRF II – Long-Term Expected Real Rates of Return by Asset Class
Asset Class¹
Assumed Asset
Allocation Real Return Years 1 - 10²
Real Return Years 11+³
Global Equity 52.00% 4.80% 5.98% Fixed Income 32.00% 1.10% 2.62% TIPS 5.00% 0.25% 1.46% Commodities 3.00% 1.50% 2.87% REITs 8.00% 3.50% 5.00%
(1) In the Basic Financial Statements, Commodities and REITS are included in Global Equity Securities; Fixed Income and TIPS are included in Global Debt Securities. (2) An expected inflation of 2.00% used for this period. (3) An expected inflation of 2.92% used for this period.
Agenda item 6a, Attachment 1, Page 49 of 82
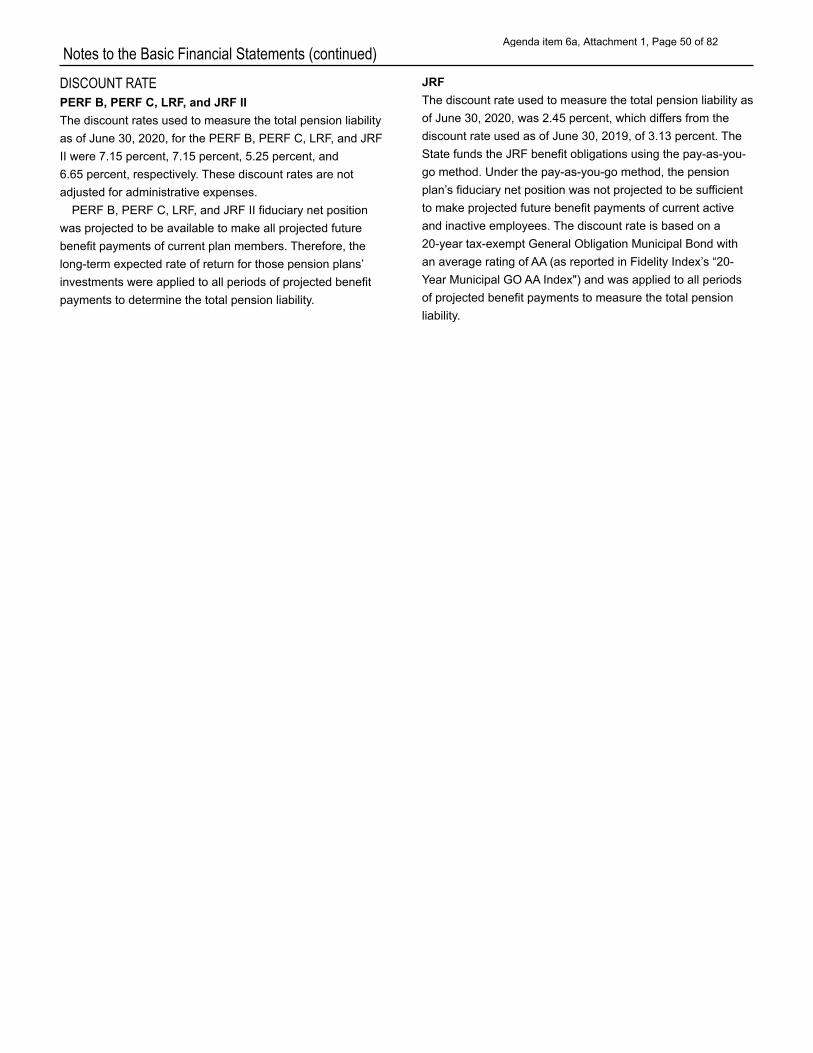
Notes to the Basic Financial Statements (continued) DISCOUNT RATE PERF B, PERF C, LRF, and JRF II The discount rates used to measure the total pension liability as of June 30, 2020, for the PERF B, PERF C, LRF, and JRF II were 7.15 percent, 7.15 percent, 5.25 percent, and 6.65 percent, respectively. These discount rates are not adjusted for administrative expenses.
PERF B, PERF C, LRF, and JRF II fiduciary net position was projected to be available to make all projected future benefit payments of current plan members. Therefore, the long-term expected rate of return for those pension plans’ investments were applied to all periods of projected benefit payments to determine the total pension liability.
JRF The discount rate used to measure the total pension liability as of June 30, 2020, was 2.45 percent, which differs from the discount rate used as of June 30, 2019, of 3.13 percent. The State funds the JRF benefit obligations using the pay-as-you- go method. Under the pay-as-you-go method, the pension plan’s fiduciary net position was not projected to be sufficient to make projected future benefit payments of current active and inactive employees. The discount rate is based on a 20-year tax-exempt General Obligation Municipal Bond with an average rating of AA (as reported in Fidelity Index’s “20- Year Municipal GO AA Index") and was applied to all periods of projected benefit payments to measure the total pension liability.
Agenda item 6a, Attachment 1, Page 50 of 82
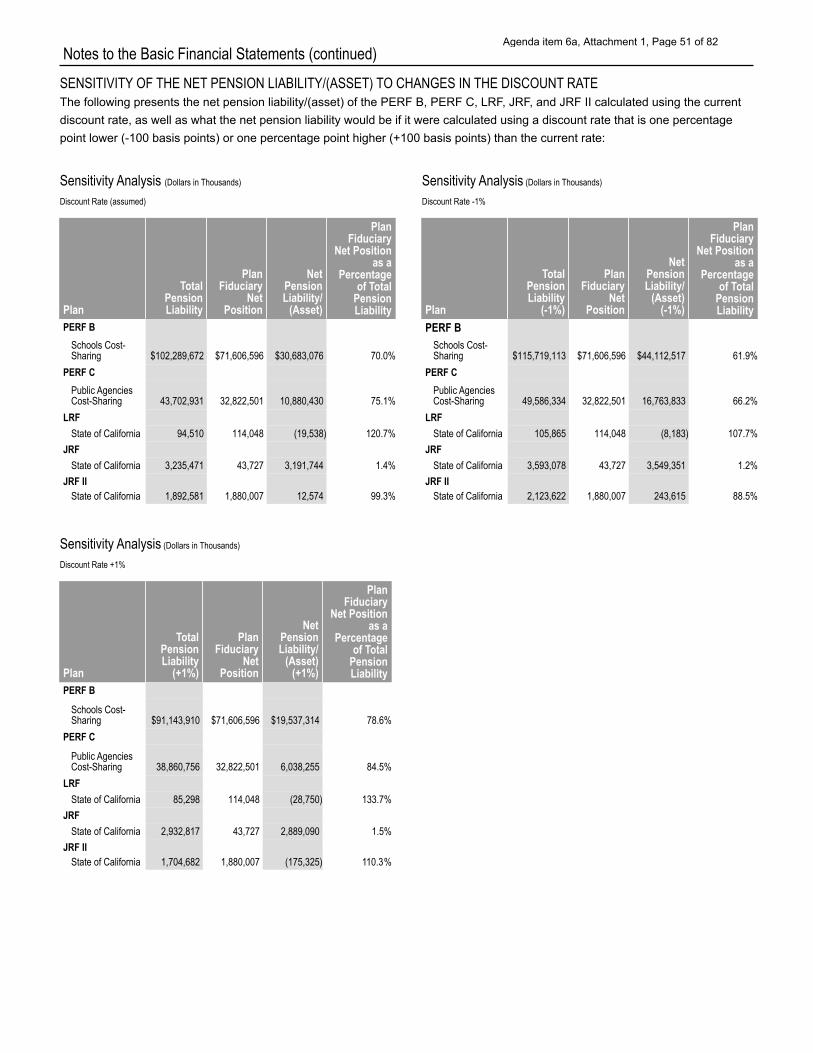
Notes to the Basic Financial Statements (continued) SENSITIVITY OF THE NET PENSION LIABILITY/(ASSET) TO CHANGES IN THE DISCOUNT RATE The following presents the net pension liability/(asset) of the PERF B, PERF C, LRF, JRF, and JRF II calculated using the current discount rate, as well as what the net pension liability would be if it were calculated using a discount rate that is one percentage point lower (-100 basis points) or one percentage point higher (+100 basis points) than the current rate:
Sensitivity Analysis (Dollars in Thousands) Sensitivity Analysis (Dollars in Thousands)
Discount Rate (assumed) Discount Rate -1%
Plan
Total Pension Liability
(-1%)
Plan Fiduciary
Net Position
Net Pension Liability/
(Asset) (-1%)
Plan Fiduciary
Net Position as a
Percentage of Total
Pension LiabilityPlan
Total Pension Liability
Plan Fiduciary
Net Position
Net Pension Liability/
(Asset)
Plan Fiduciary
Net Position as a
Percentage of Total
Pension Liability
PERF B PERF B Schools Cost- Schools Cost- Sharing $102,289,672 $71,606,596 $30,683,076 70.0% Sharing $115,719,113 $71,606,596 $44,112,517 61.9%
PERF C PERF C Public Agencies Public Agencies Cost-Sharing 43,702,931 32,822,501 10,880,430 75.1% Cost-Sharing 49,586,334 32,822,501 16,763,833 66.2%
LRF LRF State of California 94,510 114,048 (19,538) 120.7% State of California 105,865 114,048 (8,183) 107.7%
JRF JRF State of California 3,235,471 43,727 3,191,744 1.4% State of California 3,593,078 43,727 3,549,351 1.2%
JRF II 1,892,581
JRF II State of California 1,880,007 12,574 99.3% State of California 2,123,622 1,880,007 243,615 88.5%
Sensitivity Analysis (Dollars in Thousands)
Discount Rate +1%
Plan
Total Pension Liability
(+1%)
Plan Fiduciary
Net Position
Net Pension Liability/
(Asset) (+1%)
Plan Fiduciary
Net Position as a
Percentage of Total
Pension Liability
PERF B
Schools Cost- Sharing $91,143,910 $71,606,596 $19,537,314 78.6%
PERF C
Public Agencies Cost-Sharing 38,860,756 32,822,501 6,038,255 84.5%
LRF State of California 85,298 114,048 (28,750) 133.7%
JRF State of California 2,932,817 43,727 2,889,090 1.5%
JRF II State of California 1,704,682 1,880,007 (175,325) 110.3%
Agenda item 6a, Attachment 1, Page 51 of 82
Notes to the Basic Financial Statements (continued)
9. CALIFORNIA EMPLOYERS’ PENSION PREFUNDING TRUST FUND The CEPPTF was established by Chapter 665 of the 2018 Statutes and initially funded in 2019. At June 30, 2020, 15 employers had elected to participate in the fund. Of the 15 participating employers, nine employers have contributed assets in the CEPPTF as of June 30, 2020. The purpose of the fund is to receive contributions from participating employers and establish separate employer prefunding accounts to pay for future contributions to their defined benefit pension plans. Contributions are voluntarily determined by the employer’s own funding schedule, and there are no long-term contracts for contributions to the trust. As such, contributions to the CEPPTF are elective and not required. The CEPPTF is an investment trust fund as defined in GASB Statement No. 84, Fiduciary Activities, with pooled administrative and investment functions.
Participating employers may receive disbursements from the fund not to exceed the actual contributions made to their pension plans during the fiscal year. If the employer’s participation in the fund terminates, all assets in the employer’s prefunding account shall remain in the fund except as otherwise provided. Allowable termination disbursements are to a trustee or as a trustee transfer of assets upon satisfactorily demonstrating to the Board one of the following: (1) the transfer will satisfy applicable requirements of the Internal Revenue Code (IRC), other law and accounting standards, and the Board’s fiduciary duties, or (2) the employer substantiates to the Board that in conformance with applicable requirements of the IRC, other laws and accounting standards, and the Board’s fiduciary duties that all of the employer’s obligations for the payment of defined benefit pension plan benefits and reasonable administrative costs have been satisfied.
The CEPPTF costs include direct administrative and investment costs as well as indirect costs that are allocated through the Board-approved annual budget and cost-allocation process. CalPERS contracts with a third-party service provider, Northeast Retirement Services (NRS), to perform recordkeeping for individual CEPPTF employer accounts.
The total Fiscal Year 2019-20 employer contributions from participating employers were $10.5 million and there were no disbursements.
The CEPPTF mirrors the investment policies of the System as a whole. These policies are adopted by the CalPERS Investment Committee, which sets forth the System’s overarching investment beliefs, purposes, and objectives with respect to all investment programs. Additionally, the CEPPTF has separate, Board-approved asset allocation policies in place for the two investment options offered by the fund. Each
strategy seeks to offer employers investment alternatives dependent upon expected levels of return and volatility.
10. OTHER POST-EMPLOYMENT BENEFIT TRUST FUND The CERBTF (also known as Annuitants’ Health Care Coverage Fund) was established by Chapter 331 of the 1988 Statutes and initially funded in 2007. At June 30, 2020, 572 employers had elected to participate in the fund. Of the 572 participating employers, 557 employers have contributed assets in the CERBTF as of June 30, 2020. The purpose of the fund is to receive contributions from participating employers and establish separate employer prefunding accounts to pay for health care or other post-employment benefits in accordance with the terms of the participating employers’ plans. Contributions are voluntarily determined by the employer’s own funding schedule, and there are no long- term contracts for contributions to the plan. As such, contributions to the CERBTF are elective and not required. The CERBTF is an agent multiple-employer plan as defined in GASB Statement No. 74, Financial Reporting for Postemployment Benefit Plans Other Than Pension Plans (GASB 74), with pooled administrative and investment functions.
Participating employers may receive disbursements from the fund not to exceed the annual premium and other costs of eligible post-employment benefits. If the employer’s participation in the fund terminates, all assets in the employer’s prefunding account shall remain in the fund except as otherwise provided. Allowable termination disbursements are to a trustee or as a trustee transfer of assets upon satisfactorily demonstrating to the Board one of the following: (1) the transfer will satisfy applicable requirements of the IRC, other law and accounting standards, and the Board’s fiduciary duties, or (2) the employer substantiates to the Board that in conformance with applicable requirements of the IRC, other laws and accounting standards, and the Board’s fiduciary duties that all of the employer’s obligations for the payment of post-employment benefits have been satisfied.
As of June 30, 2020, there were 497,011 active plan members, 308,931 inactive plan members currently receiving benefit payments, and 11,511 inactive plan members entitled to but not yet receiving benefit payments.
The CERBTF costs include direct administrative and investment costs as well as indirect costs that are allocated through the Board-approved annual budget and cost-allocation process. CalPERS contracts with a third-party service provider, NRS, to perform recordkeeping for individual CERBTF employer accounts.
Agenda item 6a, Attachment 1, Page 52 of 82
Notes to the Basic Financial Statements (continued) The total Fiscal Year 2019-20 actual OPEB employer
contributions from participating employers representing 589 OPEB plans were $4.6 billion. In compliance with GASB 74, this amount includes the $1.6 billion in contributions made to the CERBTF, plus an additional $3.0 billion in retiree health care premiums paid by employers directly to health care providers.
The CERBTF mirrors the investment policies of the System as a whole. These policies are adopted by the CalPERS Investment Committee, which sets forth the System’s overarching investment beliefs, purposes, and objectives with respect to all investment programs. Additionally, the CERBTF has separate, Board-approved asset allocation policies in place for the three investment options offered by the fund. Each strategy seeks to offer employers investment alternatives dependent upon expected levels of return and volatility. Overall, the CERBTF recognized an annual money- weighted rate of return of 4.0 percent for Fiscal Year 2019-20.
11. REPLACEMENT BENEFIT FUND (RBF) The RBF was established as a custodial fund by Chapter 798 of the 1990 Statutes. Initially established in 1998, it provides benefits to retirees of the PERF whose retirement allowance exceeds the IRC section 415(b) limits. IRC section 415(b) imposes a dollar limit on the annual retirement benefits an individual may receive from a qualified defined benefit pension plan.
The RBF is funded on a pay-as-you-go basis. That is, the employer is invoiced for amounts payable to its former employees on a calendar year basis and upon receipt of payment by the employers, CalPERS remits the replacement benefits to the retirees on a monthly basis. Employer contributions must be in amounts equivalent to the benefits not paid from the PERF as a result of the limitations of IRC section 415(b) and if applicable, employer Federal Insurance Contributions Act taxes. CalPERS is responsible for calculating the applicable dollar limit under IRC section 415(b) and notifying the employer. At June 30, 2020, there were 1,496 participants receiving replacement benefits.
Government Code section 7522.43 provides that a public retirement system may only continue to administer a plan of replacement benefits for employees first hired prior to January 1, 2013. Section 7522.43 prohibits any employer from offering a plan of replacement benefits for employees hired on or after January 1, 2013.
12. OLD AGE AND SURVIVORS’ INSURANCE REVOLVING FUND (OASI) The Old Age and Survivors’ Insurance Revolving Fund (OASI) was established to consolidate the collection and payment of employee and employer contributions for California public agencies under the provisions of the federal Social Security regulations.
The Board of Administration serves as the State Social Security Administrator (SSSA). Between 1955 and 1986 the SSSA was responsible for collecting Social Security and Medicare taxes from public employers. Effective January 1, 1987, with the enactment of the Omnibus Budget Reconciliation Act of 1986, the responsibility of collecting taxes moved from CalPERS to the Internal Revenue Service and the OASI has been operating since 1987 using the interest that was earned on the OASI. The OASI funds diminished requiring additional funding to pay for the costs of administering the SSSA program. On July 1, 2019, CalPERS began charging participating agencies a specified fee to pay for these costs. In Fiscal Year 2020-21 CalPERS will continue assessing fees to cover costs, and continue administering the program.
13. PUBLIC EMPLOYEES’ HEALTH CARE FUND (HCF)
The HCF was established under the PEMHCA as of July 1, 1988. Health plan offerings include self-funded plans, PERS Choice, PERSCare, and PERS Select. Effective January 1, 2014, flex-funded plans, Anthem Blue Cross, Blue Shield of California, Health Net, Sharp, UnitedHealthcare, and effective January 1, 2018, Western Health Advantage were added. Health plans are available to entities that contract for health insurance coverage under PEMHCA based on ZIP codes, as prescribed by state law. Having members in large risk pools spreads the catastrophic claims over a larger base and minimizes administrative expenses. The self-funded plans retain all risk of loss of allowable health claims while, effective January 1, 2019, the flex-funded plans retain no risk of loss when capitated and fee-for-service expenses come higher than agreed with the contractor. Members are not subject to a supplemental assessment in the event of deficiencies. Health insurance premium rates are set by the Board based on a trend analysis of the historic cost, utilization, demographics, and administrative expenses of the HCF to provide for the claims incurred and the actuarially determined required level of reserves. The health plans rely on operating cash flows and investment income to fund health benefit payments. During Fiscal Year 2019-20 the Board approved aggregate increases
Agenda item 6a, Attachment 1, Page 53 of 82
Notes to the Basic Financial Statements (continued) in member premiums to continue to provide for benefits of the health plans.
Public agencies participating in the health plans are required to make monthly premium payments based on rates established annually by CalPERS. Employers’ shares of premiums are determined by the public agency through benefit negotiations, subject to minimum share of premium levels established through PEMHCA. Public agency employee members pay the difference between the premium rate and the employers’ share of premium.
At June 30, 2020, 100 percent of the HCF’s investments in global debt securities are in the SSGA U.S. Aggregate Bond Index Fund with further details in Note 4.
The HCF establishes claim liabilities based on estimates of the ultimate costs of claims (including future claim adjustment expenses) that have been reported but not settled, and of claims that have been “Incurred But Not Reported” (IBNR). The estimated claims liability was calculated by health plan partners as of June 30, 2020, using a variety of actuarial and statistical techniques, and adjusted for actual experience to produce current estimates that reflect recent settlements, claim frequency, and other economic and social factors. Adjustments to claims liabilities are charged or credited to expense in the periods in which they are made. The estimated claims liability of $470.5 million is carried at its face amount, and no interest discount is assumed. The IBNR portion of $401.4 million represents an estimate for claims that have been incurred prior to June 30, 2020, but have not been reported to the HCF. The total of the estimated claims liabilities at the end of the Fiscal Year 2019-20 is $738.1 million. The year-end amount also includes $267.6 million of known claims, which is reported as claims payable liability in the Statement of Net Position.
ANTICIPATED INVESTMENT INCOME AND REINSURANCE Anticipated investment income is included in the annual premium requirement for HCF members. Also, the HCF has not entered into any reinsurance or excess insurance agreements. CalPERS has entered into agreements with flex- funded health plan partners that limit the HCF’s risk to a maximum aggregate monthly cost per member.
The following schedule represents changes in the aggregate estimated claims liabilities for the fiscal years ended June 30, 2020, and June 30, 2019.
Changes in the Aggregate Estimated Claims Liabilities of the HCF (Dollars in Thousands)
Year Ended June 30 2020 2019 Total Estimated Claims at Beginning of Fiscal Year $740,437 $764,066
Total Incurred Claims and Claim Adjustment Expenses 3,490,974 3,562,627
Total Payments (3,493,253) (3,586,256) Total Estimated Claims at End of Fiscal Year $738,158 $740,437
14. PUBLIC EMPLOYEES’ CONTINGENCY RESERVE FUND (CRF) The CRF was established in 1962, with the passage of PEMHCA, to fund administrative expenses related to the PEMHCA program, and as a contingency reserve for such items as increases in future rates or in future benefits. PEMHCA was expanded to include local public agency employees on a contract basis in 1967. The CRF is reimbursed by the State and contracting public agencies for expenses incurred for administering the program.
PEMHCA establishes eligibility rules for the following: • Retirees and beneficiaries receiving health care benefits, • Terminated plan members entitled to but not yet receiving
benefits, and • Active plan members.
Amounts charged to employers toward the CRF administrative expenses is determined as a percentage of gross health insurance premiums paid by the employer and employees. The percentage of the insurance premiums paid for the fiscal year ended June 30, 2020, was 0.27 percent. Administrative rates are reviewed annually and are adjusted, if needed, to cover budgeted administrative expenses.
Health insurance premiums are initially received in the CRF and then remitted to health insurance carriers, apart from premium dollars designated for self-funded and flex-funded health plans, which are transferred to the HCF. As of June 30, 2020, there were 1,155 public agencies and schools participating in health insurance coverage under PEMHCA.
15. PUBLIC EMPLOYEES’ LONG-TERM CARE FUND (LTCF) The LTCF began offering self-insured Long-Term Care (LTC) plans in 1995 through the LTC program. The LTC program provides LTC coverage to enrolled participants under the
Agenda item 6a, Attachment 1, Page 54 of 82
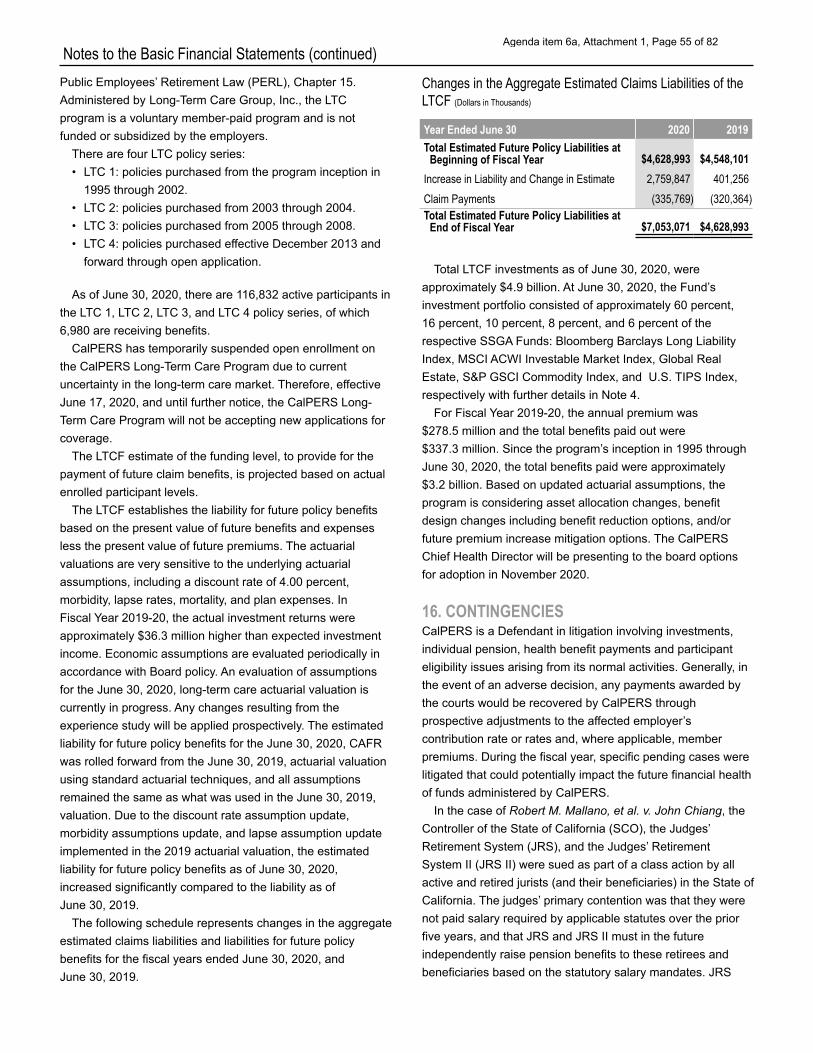
Notes to the Basic Financial Statements (continued) Public Employees’ Retirement Law (PERL), Chapter 15. Administered by Long-Term Care Group, Inc., the LTC program is a voluntary member-paid program and is not funded or subsidized by the employers.
There are four LTC policy series: • LTC 1: policies purchased from the program inception in
1995 through 2002. • LTC 2: policies purchased from 2003 through 2004. • LTC 3: policies purchased from 2005 through 2008. • LTC 4: policies purchased effective December 2013 and
forward through open application.
As of June 30, 2020, there are 116,832 active participants in the LTC 1, LTC 2, LTC 3, and LTC 4 policy series, of which 6,980 are receiving benefits.
CalPERS has temporarily suspended open enrollment on the CalPERS Long-Term Care Program due to current uncertainty in the long-term care market. Therefore, effective June 17, 2020, and until further notice, the CalPERS Long- Term Care Program will not be accepting new applications for coverage.
The LTCF estimate of the funding level, to provide for the payment of future claim benefits, is projected based on actual enrolled participant levels.
The LTCF establishes the liability for future policy benefits based on the present value of future benefits and expenses less the present value of future premiums. The actuarial valuations are very sensitive to the underlying actuarial assumptions, including a discount rate of 4.00 percent, morbidity, lapse rates, mortality, and plan expenses. In Fiscal Year 2019-20, the actual investment returns were approximately $36.3 million higher than expected investment income. Economic assumptions are evaluated periodically in accordance with Board policy. An evaluation of assumptions for the June 30, 2020, long-term care actuarial valuation is currently in progress. Any changes resulting from the experience study will be applied prospectively. The estimated liability for future policy benefits for the June 30, 2020, CAFR was rolled forward from the June 30, 2019, actuarial valuation using standard actuarial techniques, and all assumptions remained the same as what was used in the June 30, 2019, valuation. Due to the discount rate assumption update, morbidity assumptions update, and lapse assumption update implemented in the 2019 actuarial valuation, the estimated liability for future policy benefits as of June 30, 2020, increased significantly compared to the liability as of June 30, 2019.
The following schedule represents changes in the aggregate estimated claims liabilities and liabilities for future policy benefits for the fiscal years ended June 30, 2020, and June 30, 2019.
Changes in the Aggregate Estimated Claims Liabilities of the LTCF (Dollars in Thousands)
Year Ended June 30 2020 2019 Total Estimated Future Policy Liabilities at Beginning of Fiscal Year $4,628,993 $4,548,101
Increase in Liability and Change in Estimate 2,759,847 401,256 Claim Payments (335,769) (320,364) Total Estimated Future Policy Liabilities at End of Fiscal Year $7,053,071 $4,628,993
Total LTCF investments as of June 30, 2020, were approximately $4.9 billion. At June 30, 2020, the Fund’s investment portfolio consisted of approximately 60 percent, 16 percent, 10 percent, 8 percent, and 6 percent of the respective SSGA Funds: Bloomberg Barclays Long Liability Index, MSCI ACWI Investable Market Index, Global Real Estate, S&P GSCI Commodity Index, and U.S. TIPS Index, respectively with further details in Note 4.
For Fiscal Year 2019-20, the annual premium was $278.5 million and the total benefits paid out were $337.3 million. Since the program’s inception in 1995 through June 30, 2020, the total benefits paid were approximately $3.2 billion. Based on updated actuarial assumptions, the program is considering asset allocation changes, benefit design changes including benefit reduction options, and/or future premium increase mitigation options. The CalPERS Chief Health Director will be presenting to the board options for adoption in November 2020.
16. CONTINGENCIES CalPERS is a Defendant in litigation involving investments, individual pension, health benefit payments and participant eligibility issues arising from its normal activities. Generally, in the event of an adverse decision, any payments awarded by the courts would be recovered by CalPERS through prospective adjustments to the affected employer’s contribution rate or rates and, where applicable, member premiums. During the fiscal year, specific pending cases were litigated that could potentially impact the future financial health of funds administered by CalPERS.
In the case of Robert M. Mallano, et al. v. John Chiang, the Controller of the State of California (SCO), the Judges’ Retirement System (JRS), and the Judges’ Retirement System II (JRS II) were sued as part of a class action by all active and retired jurists (and their beneficiaries) in the State of California. The judges’ primary contention was that they were not paid salary required by applicable statutes over the prior five years, and that JRS and JRS II must in the future independently raise pension benefits to these retirees and beneficiaries based on the statutory salary mandates. JRS
Agenda item 6a, Attachment 1, Page 55 of 82
Notes to the Basic Financial Statements (continued) and JRS II in turn contended that they did not have statutory authority to increase benefits until the active judges have received an actual pay increase and JRS and JRS II have received a copy of an official Pay Letter from California Department of Human Resources to SCO authorizing an increase. JRS has been included in this suit because retired JRS judges receive increases to their retirement benefits when active judges receive salary increases. For JRS II, salary increases impact final compensation at retirement.
A Statement of Decision was issued on December 16, 2015, entering declaratory judgment in favor of the Plaintiff class and against JRS, JRS II, and SCO. The court found that, since Fiscal Year 2008-09, SCO, JRS, and JRS II had failed to pay constitutionally and statutorily mandated salary increases to active judges, as well as increased benefits to judicial retirees, as required by statute. The judges and their beneficiaries were awarded the unpaid salary increases and benefits payable to judicial retirees and their beneficiaries together with 10% per annum interest, owing from the dates on which such sums vested until such increases and benefits are paid. Final Judgment was issued on March 10, 2016.
JRS, JRS II, and SCO filed an appeal on May 5, 2016. On April 5, 2017, the Court of Appeal issued its unpublished Decision affirming the judgment of the Superior Court and the attorney fee award. Plaintiffs filed a Motion to Enforce Judgment in the Superior Court, which was heard on July 27, 2017. At that hearing, the Superior Court granted the motion and ordered that retroactive damages be paid by the Defendants in amounts consistent with the court’s interpretation of the salary provisions in Government Code section 68203.
Defendants implemented the court’s Order on a prospective basis shortly after the July 28, 2017 Order was issued. Then, on September 19, 2017, Defendants filed a Notice of Appeal from Post-Remittitur Order Entered July 28, 2017. The appeal was taken from paragraph 1 of the Order, directing "Defendants pay to Plaintiff and the class members the difference between what Defendants actually paid Plaintiff and class members and the amounts that should have been paid, as specified in the judgment, together with the pre and post judgment interest at the rate of 10% per annum from the date on which the additional payment should have been paid to the actual date of payment." The grounds for this appeal were that the Order directs retroactive monetary relief to the Plaintiff class for past alleged wrongs, by ordering Defendants to pay prior salary increases. In so doing, Defendants argue that the trial court has disregarded the ruling of the Court of Appeal, which expressly held that, "the judgment includes no monetary damages award."
On June 26, 2018, an unpublished Decision was issued, denying the appeal: “The order enforcing the judgment,
including the provision for ‘pre and post judgment interest thereon at the rate of 10% per annum from the date on which the additional payment should have been paid to the actual date of payment’ is affirmed.” On August 3, 2018, the Controller, JRS and JRS II (State Defendants) filed a Petition for Review in the California Supreme Court. On October 26, 2018, the court denied the State’s Petition for Review. Since then, JRS and JRS II have been working with SCO and the Department of Finance (DOF) to administer payment of the damages that were awarded in the case. In Fiscal Year 2019-20, JRS paid $25,140 in damages, bringing their total payout to $19,118,499. CalPERS’ Financial Reporting and Accounting Services Division (FRAS) requested a general fund transfer pursuant to Chapter 23 of the budget bill, which has earmarked $41 million to cover the Mallano damages payable by JRS. In Fiscal Year 2019-20, JRS II paid damages totaling $809,085 from the JRS II Fund. All damages have currently been distributed and the court has declared the case closed.
Sanchez, Elma, et al. v. CalPERS (presently identified by the court as the Wedding case) is a class action lawsuit originally brought by members of the CalPERS Long-Term Care Plan against CalPERS and eight individual CalPERS Board members. Plaintiffs claim that CalPERS breached its contract with the long-term care purchasers by allegedly promising that long-term care premiums would never increase during the lifetime of the purchaser, but then increased the premiums, and failed to continue the Inflation Prevention Benefit without an increase in premiums. Plaintiffs assert damages in the amount of approximately $2.5 billion.
The operative Complaint originally alleged a cause of action for breach of fiduciary duty against both CalPERS and the Board Defendants and four causes of action against CalPERS for breach of contract, breach of the implied covenant of good faith and fair dealing, rescission, and declaratory relief. Plaintiffs sought to certify a class consisting of California citizens who purchased LTC 1 and LTC 2 policies issued from 1995 to 2004 with lifetime coverage and built-in inflation protection, lifetime policies without inflation protection, as well as three-year and six-year policies with inflation protection.
CalPERS and the Board Defendants denied that CalPERS breached the contract by imposing the premium increase and that the policies were intentionally or negligently underpriced and asserted that the long-term care coverage was a new product with little actuarial data when the program started in 1995, making it difficult to accurately price. Premium increases were imposed across the entire long-term care industry as actuarial and claims data became available. CalPERS asserted that it timely informed policyholders about the need to impose premium increases and has managed the program
Agenda item 6a, Attachment 1, Page 56 of 82
Notes to the Basic Financial Statements (continued) and the Long-Term Care Trust Fund prudently and properly. CalPERS has also asserted other legal defenses.
On January 18, 2016, the court granted Plaintiffs’ Motion for Class Certification. Two claims were certified for class treatment against CalPERS: (1) the breach of contract claim; and (2) Plaintiffs’ breach of fiduciary duty claim, on the "duty of care" theory only. None of Plaintiffs’ claims against the individual Board members were certified for class treatment. The CalPERS Defendants filed a Motion for Summary Judgment/Adjudication that was argued on June 8, 2017. The court granted summary judgment as to the claims against the individual Board Defendants. The court also granted summary judgment for CalPERS as to the certified breach of fiduciary duty and rescission claims but denied summary judgment as to the certified breach of contract claim and the uncertified declaratory relief claim.
After a two-day court trial in early June 2019 on contract interpretation issues, the court issued a “Draft Proposed Statement of Decision.” In this ruling, the court held in favor of Plaintiffs on the interpretation of the “Inflation-Protection” clause in the policy contract, finding that CalPERS could not increase premiums as a result of rising liabilities from the Inflation Protection benefit’s automatic five percent annual increase in the maximum allowable monthly benefit. In other words, the court tentatively ruled that CalPERS cannot increase premiums on policies with the inflation protection benefit unless such an increase is driven by cost factors other than the cost of the escalation of daily/monthly limits on Inflation-Protection benefits over time. The court’s ruling also urged the parties to attempt to settle the case by petitioning other branches of State government for a monetary infusion. The court said, “[T]his case can only settle if CalPERS and the State find a way to make peace with the class and its counsel. While the Long-Term Care plan was indisputably authorized by the Legislature in 1995 on the theory that it would be self- sustaining and not a drag on the General Fund or public employers, there is a very serious risk that a money judgment for a rather large amount of money will be issued in due course in this case. The [CalPERS long-term care] plan currently has some substantial reserves (needed in the actuaries’ view to pay foreseeable future claims) which could pay a money judgment in the near term but doing so would then set the plan up for insolvency some time in the near future…An inability of this CalPERS plan to pay just claims will create an obvious default by an arm of the State in the fulfillment of its contract obligations. This, in turn, could seriously impair the credit rating of the State. If this case is not settled in the near term, a very large money judgment against CalPERS appears to be the most likely outcome. For this reason, the best path forward, in this experienced jurist’s view, is for the parties to try to strike a deal which requires a one-
time appropriation by the Legislature to resolve the pending suit while also providing a judicially-approved road map so that the plan is self-sustaining thereafter.” To provide time for this discussion to occur, the court initially continued the jury trial date to the end of October 2019, and recently continued it again until March 29, 2021. On March 11, 2020, Plaintiffs filed a Motion for Leave to File a Third Amended Complaint. Two of the proposed amendments were to add language to the caption stating that CalPERS is “an agency of the State of California” and to add language to the paragraph concerning CalPERS in the “Parties” section stating that CalPERS is “a state agency within the Executive Branch of the State of California” and “[a]t all times mentioned herein, CalPERS was a state agency acting by and on behalf of the State of California.” The purpose for these amendments is to strengthen Plaintiffs’ assertions that the State of California itself will have to respond to any judgment against the Long- Term Care (LTC) Plan. The motion was granted by the court.
The parties have engaged in several mediation sessions, with no resolution. On July 1, 2020, the court granted Plaintiffs leave to file a Third Amended Complaint, which would relabel the Defendant as, “California Public Employees’ Retirement System, an agency of the State of California.” Plaintiffs filed their Third Amended Complaint on August 26, 2020. On July 27, 2020, the court issued its final Statement of Decision regarding contract interpretation issues and statute of limitations defense.
Heinz, et al. v. CalPERS, Anthem et al. is a putative class action lawsuit filed against CalPERS in June 2017. The Complaint alleges breach of contract, breach of fiduciary duties, misrepresentation, and a variety of other claims. The class is described as "people who were enrolled in Preferred Provider Organization health insurance offered and/or administered by CalPERS and Anthem Blue Cross." The primary allegation is that CalPERS and Anthem engaged in a common policy of improperly and artificially reducing the "allowable amount" for "out-of-network" non-emergency medical services.
On May 7, 2018, the court issued a ruling that Plaintiff must proceed with his Petition for Writ of Administrative Mandamus, and that all other causes of action were stayed in their entirety pending the outcome of the writ. On January 25, 2019, the court denied Plaintiff’s Petition for Writ of Administrative Mandamus finding that there was no evidence that CalPERS and Anthem improperly reduced the “allowable amount” for “out-of-network” non-emergency medical services. As a result of this ruling, CalPERS demurred to the remaining causes of action. The court sustained CalPERS’ demurrer and entered judgment in favor of CalPERS, ending Plaintiff’s lawsuit. On August 19, 2019, Plaintiff filed a Notice of Appeal indicating his intention to appeal the Superior Court’s decision. The parties
Agenda item 6a, Attachment 1, Page 57 of 82
Notes to the Basic Financial Statements (continued) are in the process of briefing the appeal and a decision is not expected until March 2021, at the earliest.
A second lawsuit related to CalPERS’ administration of health benefits is County of Monterey dba Natividad Medical Center v. CalPERS, Anthem et al. CalPERS was served with this Complaint on August 10, 2017. The dispute in this case arises out of a "Facility Agreement" between Natividad Medical Center ("NMC") and Anthem effective August 1, 2012, pursuant to which NMC agreed to provide certain healthcare services to Anthem members for certain agreed-upon reimbursements. The Facility Agreement governs not only claims for Anthem insureds, but also services for and claims by members of "Other Payors" for whom Anthem provides claim processing services for its Managed Care Network, such as CalPERS. No reimbursement rates for "trauma services" were established in the 2012 Agreement because NMC was not yet providing such services and these rates were to be negotiated at a later date, when NMC had set up its trauma care services. However, the parties have been unable to agree upon trauma rates since 2012. As a result, the Complaint alleges that Anthem has been instructing its Other Payors, including CalPERS, to pay NMC’s trauma services claims at the "emergency services" rate. With regard to CalPERS’ plan members’ treatment for trauma, NMC alleges it has been underpaid by $2.8 million. CalPERS filed a demurrer to Natividad’s Second Amended Complaint, which was sustained without leave to amend, essentially dismissing the action against CalPERS. On or about June 26, 2018, Natividad filed a Notice of Appeal. On February 5, 2020, the Court of Appeal upheld the decision of the Superior Court to dismiss the action as to CalPERS. Since all relevant appeal periods have passed, this case is now closed.
The amount of potential loss or range of loss on these cases is not estimable at this time due to the many unknowns and complexities of litigation.
Economic Conditions During the calendar year 2020, World Health Organization announced a global health emergency from a new strain of coronavirus (COVID-19) that has resulted in a global pandemic outbreak. This pandemic has adversely affected global economic activity and greatly contributed to uncertainty and instability in the global financial markets. CalPERS investment portfolio was exposed to the volatility of the financial markets during the last half of Fiscal Year 2019-20 but was also well positioned to take advantage of new investment opportunities that were present during this time. While negative market conditions could have an impact on CalPERS’ ability to earn the actuarial assumed rate of return and negatively impact the receipt of contributions and premiums due from public agencies and participants,
CalPERS cannot predict the impact of the COVID-19 pandemic. Although CalPERS cannot estimate the length or gravity of the impact of the COVID-19 outbreak at this time, management continues to closely monitor the situation, to assess further possible adverse implications that may occur to operations, investments, public agencies and participants, and to take actions to mitigate resulting consequences.
On March 27, 2020, President Trump signed into law the “Coronavirus Aid, Relief, and Economic Security (CARES) Act.” The CARES Act, among other things, includes several relief provisions available to tax-qualified retirement plans and their participants. CalPERS has assessed the applicability of such funds and has not acted to take part in applying for and receiving any such relief funds. Management is continuing to monitor applicability of any new funding or programs that may become available.
17. FUTURE ACCOUNTING PRONOUNCEMENT The objective of GASB Statement No. 87, Leases (GASB 87), is to improve accounting and financial reporting for leases by governments. GASB 87 requires recognition of certain lease assets and liabilities for leases that were previously classified as operating leases and recognized as inflows or outflows of resources based on the payment provisions of the contract. It establishes a single model for lease accounting based on the foundational principle that leases are financings of the right to use an underlying asset. The effective date for GASB 87 has been delayed to reporting periods beginning after December 31, 2020 due to the COVID-19 virus. CalPERS has determined GASB 87 will not have a material impact on the future financial statements.
Agenda item 6a, Attachment 1, Page 58 of 82
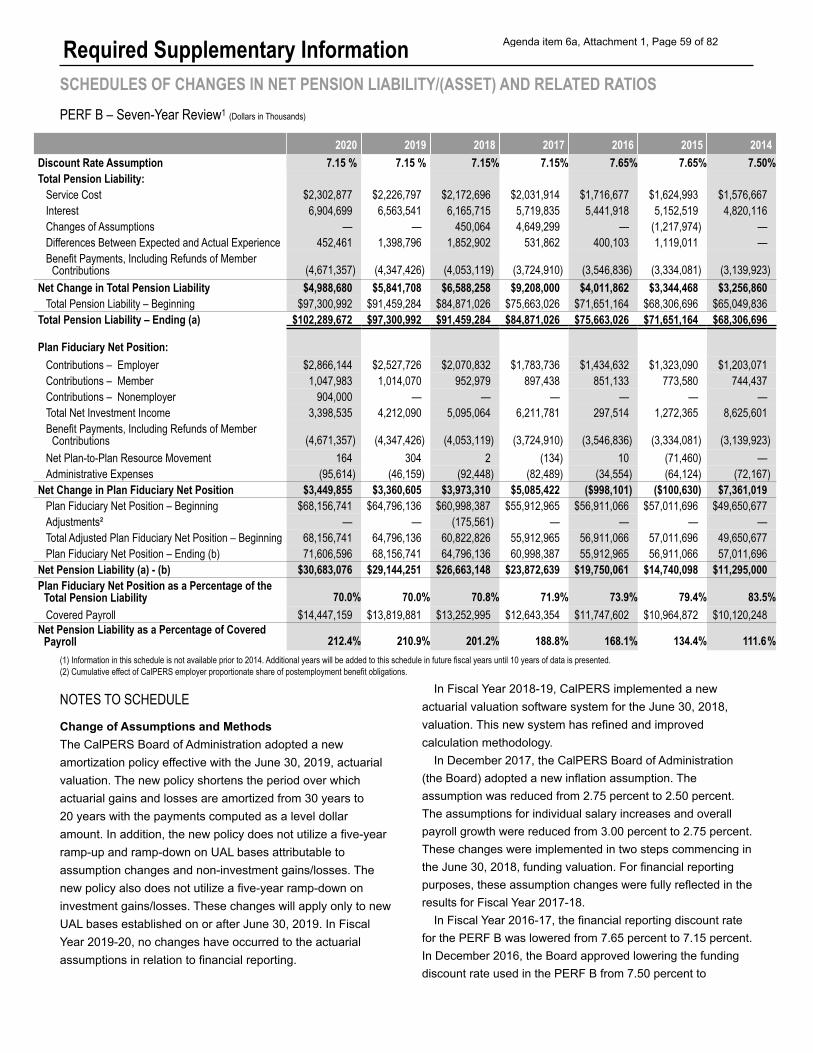
Required Supplementary Information SCHEDULES OF CHANGES IN NET PENSION LIABILITY/(ASSET) AND RELATED RATIOS PERF B – Seven-Year Review1 (Dollars in Thousands)
2020 2019 2018 2017 2016 2015 2014 Discount Rate Assumption Total Pension Liability:
Service Cost $2,302,877 $2,226,797 $2,172,696 $2,031,914 $1,716,677 $1,624,993 $1,576,667 Interest 6,904,699 6,563,541 6,165,715 5,719,835 5,441,918 5,152,519 4,820,116 Changes of Assumptions — — 450,064 4,649,299 — (1,217,974) — Differences Between Expected and Actual Experience 452,461 1,398,796 1,852,902 531,862 400,103 1,119,011 — Benefit Payments, Including Refunds of Member Contributions (4,671,357) (4,347,426) (4,053,119) (3,724,910) (3,546,836) (3,334,081) (3,139,923)
7.15 % 7.15 % 7.15% 7.15% 7.65% 7.65% 7.50%
Net Change in Total Pension Liability $4,988,680 $5,841,708 $6,588,258 $9,208,000 $4,011,862 $3,344,468 $3,256,860 Total Pension Liability – Beginning $97,300,992 $91,459,284 $84,871,026 $75,663,026 $71,651,164 $68,306,696 $65,049,836
Total Pension Liability – Ending (a)
Plan Fiduciary Net Position: Contributions – Employer $2,866,144 $2,527,726 $2,070,832 $1,783,736 $1,434,632 $1,323,090 $1,203,071 Contributions – Member 1,047,983 1,014,070 952,979 897,438 851,133 773,580 744,437 Contributions – Nonemployer 904,000 — — — — — — Total Net Investment Income 3,398,535 4,212,090 5,095,064 6,211,781 297,514 1,272,365 8,625,601 Benefit Payments, Including Refunds of Member Contributions (4,671,357) (4,347,426) (4,053,119) (3,724,910) (3,546,836) (3,334,081) (3,139,923)
Net Plan-to-Plan Resource Movement 164 304 2 (134) 10 (71,460) — Administrative Expenses (95,614) (46,159) (92,448) (82,489) (34,554) (64,124) (72,167)
Net Change in Plan Fiduciary Net Position $3,449,855 $3,360,605 $3,973,310 $5,085,422 ($998,101) ($100,630) $7,361,019 Plan Fiduciary Net Position – Beginning $68,156,741 $64,796,136 $60,998,387 $55,912,965 $56,911,066 $57,011,696 $49,650,677 Adjustments² — — (175,561) — — — — Total Adjusted Plan Fiduciary Net Position – Beginning 68,156,741 64,796,136 60,822,826 55,912,965 56,911,066 57,011,696 49,650,677 Plan Fiduciary Net Position – Ending (b) 71,606,596 68,156,741 64,796,136 60,998,387 55,912,965 56,911,066 57,011,696
Net Pension Liability (a) - (b) $30,683,076 $29,144,251 $26,663,148 $23,872,639 $19,750,061 $14,740,098 $11,295,000 Plan Fiduciary Net Position as a Percentage of the Total Pension Liability 70.0% 70.0% 70.8% 71.9% 73.9% 79.4% 83.5% Covered Payroll $14,447,159 $13,819,881 $13,252,995 $12,643,354 $11,747,602 $10,964,872 $10,120,248
Net Pension Liability as a Percentage of Covered Payroll 212.4% 210.9% 201.2% 188.8% 168.1% 134.4% 111.6%
(1) Information in this schedule is not available prior to 2014. Additional years will be added to this schedule in future fiscal years until 10 years of data is presented. (2) Cumulative effect of CalPERS employer proportionate share of postemployment benefit obligations.
In Fiscal Year 2018-19, CalPERS implemented a new NOTES TO SCHEDULE actuarial valuation software system for the June 30, 2018, Change of Assumptions and Methods valuation. This new system has refined and improved The CalPERS Board of Administration adopted a new calculation methodology. amortization policy effective with the June 30, 2019, actuarial In December 2017, the CalPERS Board of Administration
valuation. The new policy shortens the period over which (the Board) adopted a new inflation assumption. The
actuarial gains and losses are amortized from 30 years to assumption was reduced from 2.75 percent to 2.50 percent.
20 years with the payments computed as a level dollar The assumptions for individual salary increases and overall
amount. In addition, the new policy does not utilize a five-year payroll growth were reduced from 3.00 percent to 2.75 percent.
ramp-up and ramp-down on UAL bases attributable to These changes were implemented in two steps commencing in the June 30, 2018, funding valuation. For financial reportingassumption changes and non-investment gains/losses. The purposes, these assumption changes were fully reflected in thenew policy also does not utilize a five-year ramp-down on results for Fiscal Year 2017-18. investment gains/losses. These changes will apply only to new
In Fiscal Year 2016-17, the financial reporting discount rate UAL bases established on or after June 30, 2019. In Fiscal for the PERF B was lowered from 7.65 percent to 7.15 percent.Year 2019-20, no changes have occurred to the actuarial In December 2016, the Board approved lowering the fundingassumptions in relation to financial reporting. discount rate used in the PERF B from 7.50 percent to
$102,289,672 $97,300,992 $91,459,284 $84,871,026 $75,663,026 $71,651,164 $68,306,696
Agenda item 6a, Attachment 1, Page 59 of 82
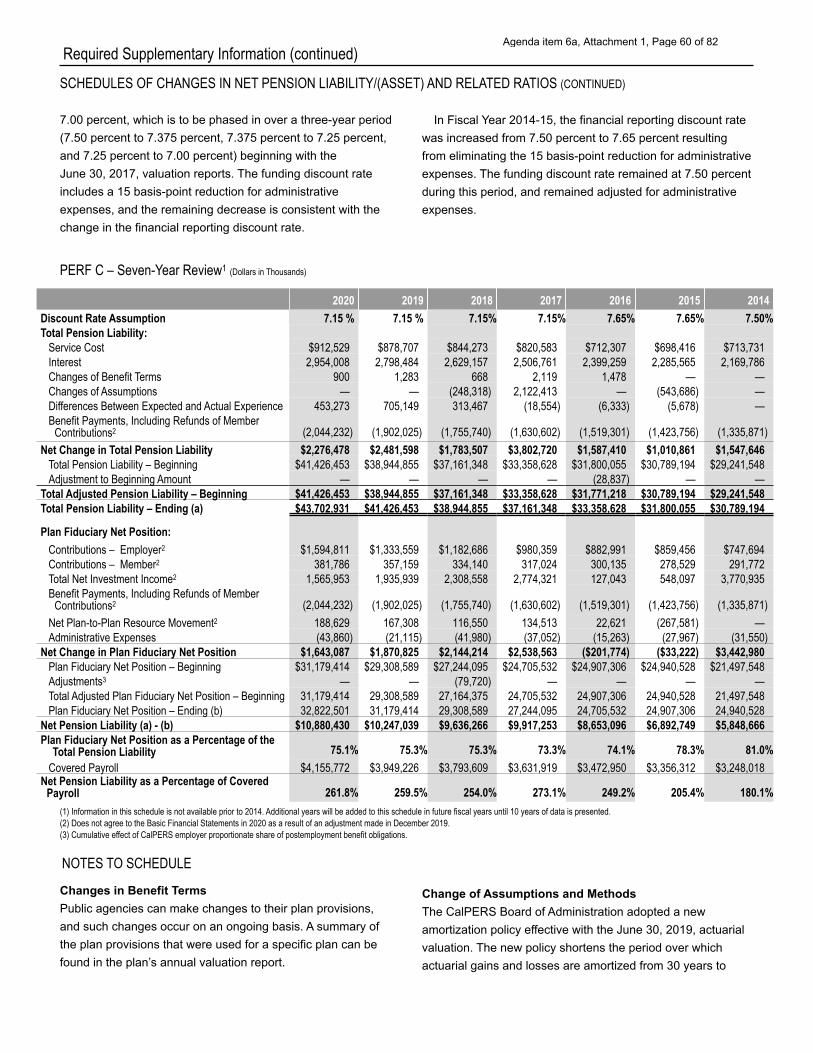
Required Supplementary Information (continued) SCHEDULES OF CHANGES IN NET PENSION LIABILITY/(ASSET) AND RELATED RATIOS (CONTINUED)
7.00 percent, which is to be phased in over a three-year period (7.50 percent to 7.375 percent, 7.375 percent to 7.25 percent, and 7.25 percent to 7.00 percent) beginning with the June 30, 2017, valuation reports. The funding discount rate includes a 15 basis-point reduction for administrative expenses, and the remaining decrease is consistent with the change in the financial reporting discount rate.
PERF C – Seven-Year Review1 (Dollars in Thousands)
In Fiscal Year 2014-15, the financial reporting discount rate was increased from 7.50 percent to 7.65 percent resulting from eliminating the 15 basis-point reduction for administrative expenses. The funding discount rate remained at 7.50 percent during this period, and remained adjusted for administrative expenses.
2020 2019 2018 2017 2016 2015 2014 Discount Rate Assumption Total Pension Liability:
Service Cost $912,529 $878,707 $844,273 $820,583 $712,307 $698,416 $713,731 Interest 2,954,008 2,798,484 2,629,157 2,506,761 2,399,259 2,285,565 2,169,786 Changes of Benefit Terms 900 1,283 668 2,119 1,478 — — Changes of Assumptions — — (248,318) 2,122,413 — (543,686) — Differences Between Expected and Actual Experience 453,273 705,149 313,467 (18,554) (6,333) (5,678) — Benefit Payments, Including Refunds of Member Contributions2 (2,044,232) (1,902,025) (1,755,740) (1,630,602) (1,519,301) (1,423,756) (1,335,871)
7.15 % 7.15 % 7.15% 7.15% 7.65% 7.65% 7.50%
Net Change in Total Pension Liability $2,276,478 $2,481,598 $1,783,507 $3,802,720 $1,587,410 $1,010,861 $1,547,646 Total Pension Liability – Beginning $41,426,453 $38,944,855 $37,161,348 $33,358,628 $31,800,055 $30,789,194 $29,241,548 Adjustment to Beginning Amount — — — — (28,837) — —
Total Adjusted Pension Liability – Beginning $41,426,453 $38,944,855 $37,161,348 $33,358,628 $31,771,218 $30,789,194 $29,241,548 Total Pension Liability – Ending (a)
Plan Fiduciary Net Position: Contributions – Employer2 $1,594,811 $1,333,559 $1,182,686 $980,359 $882,991 $859,456 $747,694 Contributions – Member2 381,786 357,159 334,140 317,024 300,135 278,529 291,772 Total Net Investment Income2 1,565,953 1,935,939 2,308,558 2,774,321 127,043 548,097 3,770,935 Benefit Payments, Including Refunds of Member Contributions2 (2,044,232) (1,902,025) (1,755,740) (1,630,602) (1,519,301) (1,423,756) (1,335,871)
Net Plan-to-Plan Resource Movement2 188,629 167,308 116,550 134,513 22,621 (267,581) — Administrative Expenses (43,860) (21,115) (41,980) (37,052) (15,263) (27,967) (31,550)
Net Change in Plan Fiduciary Net Position $1,643,087 $1,870,825 $2,144,214 $2,538,563 ($201,774) ($33,222) $3,442,980 Plan Fiduciary Net Position – Beginning $31,179,414 $29,308,589 $27,244,095 $24,705,532 $24,907,306 $24,940,528 $21,497,548 Adjustments3 — — (79,720) — — — — Total Adjusted Plan Fiduciary Net Position – Beginning 31,179,414 29,308,589 27,164,375 24,705,532 24,907,306 24,940,528 21,497,548 Plan Fiduciary Net Position – Ending (b) 32,822,501 31,179,414 29,308,589 27,244,095 24,705,532 24,907,306 24,940,528
Net Pension Liability (a) - (b) $10,880,430 $10,247,039 $9,636,266 $9,917,253 $8,653,096 $6,892,749 $5,848,666 Plan Fiduciary Net Position as a Percentage of the
Total Pension Liability 75.1% 75.3% 75.3% 73.3% 74.1% 78.3% 81.0% Covered Payroll $4,155,772 $3,949,226 $3,793,609 $3,631,919 $3,472,950 $3,356,312 $3,248,018
Net Pension Liability as a Percentage of Covered Payroll 261.8% 259.5% 254.0% 273.1% 249.2% 205.4% 180.1%
(1) Information in this schedule is not available prior to 2014. Additional years will be added to this schedule in future fiscal years until 10 years of data is presented. (2) Does not agree to the Basic Financial Statements in 2020 as a result of an adjustment made in December 2019. (3) Cumulative effect of CalPERS employer proportionate share of postemployment benefit obligations.
NOTES TO SCHEDULE
Changes in Benefit Terms Change of Assumptions and Methods Public agencies can make changes to their plan provisions, The CalPERS Board of Administration adopted a new and such changes occur on an ongoing basis. A summary of amortization policy effective with the June 30, 2019, actuarial the plan provisions that were used for a specific plan can be valuation. The new policy shortens the period over which found in the plan’s annual valuation report. actuarial gains and losses are amortized from 30 years to
$43,702,931 $41,426,453 $38,944,855 $37,161,348 $33,358,628 $31,800,055 $30,789,194
Agenda item 6a, Attachment 1, Page 60 of 82
Required Supplementary Information (continued) SCHEDULES OF CHANGES IN NET PENSION LIABILITY/(ASSET) AND RELATED RATIOS (CONTINUED)
20 years with the payments computed as a level dollar amount. In addition, the new policy does not utilize a five-year ramp-up and ramp-down on UAL bases attributable to assumption changes and non-investment gains/losses. The new policy also does not utilize a five-year ramp-down on investment gains/losses. These changes will apply only to new UAL bases established on or after June 30, 2019. In Fiscal Year 2019-20, no changes have occurred to the actuarial assumptions in relation to financial reporting.
In Fiscal Year 2018-19, CalPERS implemented a new actuarial valuation software system for the June 30, 2018, valuation. This new system has refined and improved calculation methodology.
In December 2017, the Board adopted new mortality assumptions for plans participating in the PERF. The new mortality table was developed from the December 2017 experience study and includes 15 years of projected ongoing mortality improvement using 90 percent of scale MP 2016 published by the Society of Actuaries. The inflation assumption was reduced from 2.75 percent to 2.50 percent. The assumptions for individual salary increases and overall payroll growth were reduced from 3.00 percent to 2.75 percent. These changes will be implemented in two steps commencing in the June 30, 2017 funding valuation. For financial reporting purposes, these assumption changes are fully reflected in the results for Fiscal Year 2017-18.
In Fiscal Year 2016-17, the financial reporting discount rate for the PERF C was lowered from 7.65 percent to 7.15 percent. In December 2016, the Board approved lowering the funding discount rate used in the PERF C from 7.50 percent to 7.00 percent, which is to be phased in over a three-year period (7.50 percent to 7.375 percent, 7.375 percent to 7.25 percent, and 7.25 percent to 7.00 percent) beginning with the June 30, 2016, valuation reports. The funding discount rate includes a 15 basis-point reduction for administrative expenses, and the remaining decrease is consistent with the change in the financial reporting discount rate.
In Fiscal Year 2014-15, the financial reporting discount rate was increased from 7.50 percent to 7.65 percent resulting from eliminating the 15 basis-point reduction for administrative expenses. The funding discount rate remained at 7.50 percent during this period, and remained adjusted for administrative expenses.
Agenda item 6a, Attachment 1, Page 61 of 82
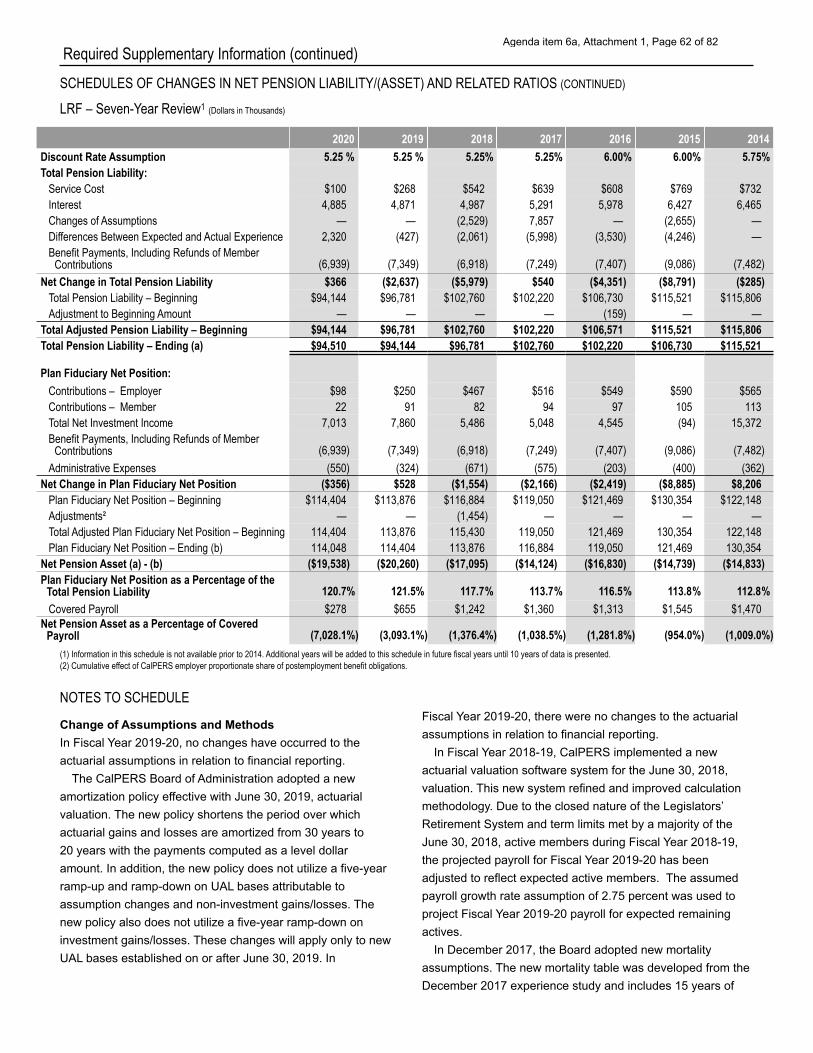
Required Supplementary Information (continued) SCHEDULES OF CHANGES IN NET PENSION LIABILITY/(ASSET) AND RELATED RATIOS (CONTINUED)
LRF – Seven-Year Review1 (Dollars in Thousands)
2020 2019 2018 2017 2016 2015 2014 Discount Rate Assumption Total Pension Liability:
Service Cost $100 $268 $542 $639 $608 $769 $732 Interest 4,885 4,871 4,987 5,291 5,978 6,427 6,465 Changes of Assumptions — — (2,529) 7,857 — (2,655) — Differences Between Expected and Actual Experience 2,320 (427) (2,061) (5,998) (3,530) (4,246) — Benefit Payments, Including Refunds of Member Contributions (6,939) (7,349) (6,918) (7,249) (7,407) (9,086) (7,482)
5.25 % 5.25 % 5.25% 5.25% 6.00% 6.00% 5.75%
Net Change in Total Pension Liability $366 ($2,637) ($5,979) $540 ($4,351) ($8,791) ($285) Total Pension Liability – Beginning $94,144 $96,781 $102,760 $102,220 $106,730 $115,521 $115,806 Adjustment to Beginning Amount — — — — (159) — —
Total Adjusted Pension Liability – Beginning $94,144 $96,781 $102,760 $102,220 $106,571 $115,521 $115,806 Total Pension Liability – Ending (a)
Plan Fiduciary Net Position: Contributions – Employer $98 $250 $467 $516 $549 $590 $565 Contributions – Member 22 91 82 94 97 105 113 Total Net Investment Income 7,013 7,860 5,486 5,048 4,545 (94) 15,372 Benefit Payments, Including Refunds of Member Contributions (6,939) (7,349) (6,918) (7,249) (7,407) (9,086) (7,482)
Administrative Expenses (550) (324) (671) (575) (203) (400) (362) Net Change in Plan Fiduciary Net Position ($356) $528 ($1,554) ($2,166) ($2,419) ($8,885) $8,206
Plan Fiduciary Net Position – Beginning $114,404 $113,876 $116,884 $119,050 $121,469 $130,354 $122,148 Adjustments² — — (1,454) — — — — Total Adjusted Plan Fiduciary Net Position – Beginning 114,404 113,876 115,430 119,050 121,469 130,354 122,148 Plan Fiduciary Net Position – Ending (b) 114,048 114,404 113,876 116,884 119,050 121,469 130,354
Net Pension Asset (a) - (b) ($19,538) ($20,260) ($17,095) ($14,124) ($16,830) ($14,739) ($14,833) Plan Fiduciary Net Position as a Percentage of the Total Pension Liability 120.7% 121.5% 117.7% 113.7% 116.5% 113.8% 112.8% Covered Payroll $278 $655 $1,242 $1,360 $1,313 $1,545 $1,470
Net Pension Asset as a Percentage of Covered Payroll (7,028.1%) (3,093.1%) (1,376.4%) (1,038.5%) (1,281.8%) (954.0%) (1,009.0%)
(1) Information in this schedule is not available prior to 2014. Additional years will be added to this schedule in future fiscal years until 10 years of data is presented. (2) Cumulative effect of CalPERS employer proportionate share of postemployment benefit obligations.
NOTES TO SCHEDULE Fiscal Year 2019-20, there were no changes to the actuarial
Change of Assumptions and Methods assumptions in relation to financial reporting.
In Fiscal Year 2019-20, no changes have occurred to the In Fiscal Year 2018-19, CalPERS implemented a new
actuarial assumptions in relation to financial reporting. actuarial valuation software system for the June 30, 2018,
The CalPERS Board of Administration adopted a new valuation. This new system refined and improved calculation
amortization policy effective with June 30, 2019, actuarial methodology. Due to the closed nature of the Legislators’
valuation. The new policy shortens the period over which Retirement System and term limits met by a majority of the
actuarial gains and losses are amortized from 30 years to June 30, 2018, active members during Fiscal Year 2018-19,
20 years with the payments computed as a level dollar the projected payroll for Fiscal Year 2019-20 has been
amount. In addition, the new policy does not utilize a five-year adjusted to reflect expected active members. The assumed
ramp-up and ramp-down on UAL bases attributable to payroll growth rate assumption of 2.75 percent was used to
assumption changes and non-investment gains/losses. The project Fiscal Year 2019-20 payroll for expected remaining
new policy also does not utilize a five-year ramp-down on actives.
investment gains/losses. These changes will apply only to new In December 2017, the Board adopted new mortality
UAL bases established on or after June 30, 2019. In assumptions. The new mortality table was developed from the December 2017 experience study and includes 15 years of
$94,510 $94,144 $96,781 $102,760 $102,220 $106,730 $115,521
Agenda item 6a, Attachment 1, Page 62 of 82
Required Supplementary Information (continued) projected ongoing mortality improvement using 90 percent of scale MP 2016 published by the Society of Actuaries. The inflation assumption was reduced from 2.75 percent to 2.50 percent. The assumptions for individual salary increases and overall payroll growth were reduced from 3.00 percent to 2.75 percent.
In Fiscal Year 2016-17, the financial reporting discount rate for the Legislators' Retirement Fund (LRF) was lowered from 6.00 percent to 5.25 percent. In April 2017, the Board approved lowering the funding discount rate used in the LRF from 5.75 percent to 5.00 percent beginning with the June 30, 2016, valuation reports. The funding discount rate includes a 25 basis-point reduction for administrative expenses, and the remaining decrease is consistent with the change in the financial reporting discount rate.
In Fiscal Year 2014-15, the financial reporting discount rate was increased from 5.75 percent to 6.00 percent resulting from eliminating the 25 basis-point reduction for administrative expenses. The funding discount rate remained at 5.75 percent during this period, and remained adjusted for administrative expenses.
Agenda item 6a, Attachment 1, Page 63 of 82
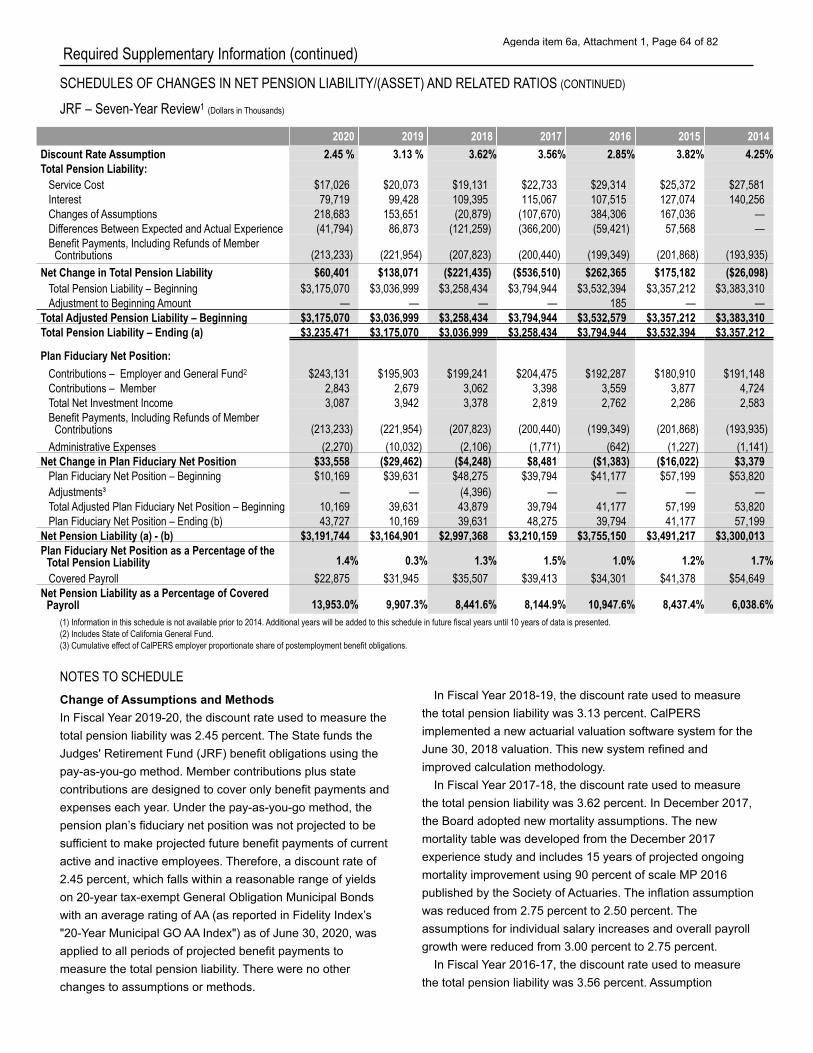
Required Supplementary Information (continued) SCHEDULES OF CHANGES IN NET PENSION LIABILITY/(ASSET) AND RELATED RATIOS (CONTINUED)
JRF – Seven-Year Review1 (Dollars in Thousands)
2020 2019 2018 2017 2016 2015 2014 Discount Rate Assumption Total Pension Liability:
Service Cost $17,026 $20,073 $19,131 $22,733 $29,314 $25,372 $27,581 Interest 79,719 99,428 109,395 115,067 107,515 127,074 140,256 Changes of Assumptions 218,683 153,651 (20,879) (107,670) 384,306 167,036 — Differences Between Expected and Actual Experience (41,794) 86,873 (121,259) (366,200) (59,421) 57,568 — Benefit Payments, Including Refunds of Member Contributions (213,233) (221,954) (207,823) (200,440) (199,349) (201,868) (193,935)
2.45 % 3.13 % 3.62% 3.56% 2.85% 3.82% 4.25%
Net Change in Total Pension Liability $60,401 $138,071 ($221,435) ($536,510) $262,365 $175,182 ($26,098) Total Pension Liability – Beginning $3,175,070 $3,036,999 $3,258,434 $3,794,944 $3,532,394 $3,357,212 $3,383,310 Adjustment to Beginning Amount — — — — 185 — —
Total Adjusted Pension Liability – Beginning $3,175,070 $3,036,999 $3,258,434 $3,794,944 $3,532,579 $3,357,212 $3,383,310 Total Pension Liability – Ending (a)
Plan Fiduciary Net Position: Contributions – Employer and General Fund2 $243,131 $195,903 $199,241 $204,475 $192,287 $180,910 $191,148 Contributions – Member 2,843 2,679 3,062 3,398 3,559 3,877 4,724 Total Net Investment Income 3,087 3,942 3,378 2,819 2,762 2,286 2,583 Benefit Payments, Including Refunds of Member Contributions (213,233) (221,954) (207,823) (200,440) (199,349) (201,868) (193,935)
Administrative Expenses (2,270) (10,032) (2,106) (1,771) (642) (1,227) (1,141) Net Change in Plan Fiduciary Net Position $33,558 ($29,462) ($4,248) $8,481 ($1,383) ($16,022) $3,379
Plan Fiduciary Net Position – Beginning $10,169 $39,631 $48,275 $39,794 $41,177 $57,199 $53,820 Adjustments³ — — (4,396) — — — — Total Adjusted Plan Fiduciary Net Position – Beginning 10,169 39,631 43,879 39,794 41,177 57,199 53,820 Plan Fiduciary Net Position – Ending (b) 43,727 10,169 39,631 48,275 39,794 41,177 57,199
Net Pension Liability (a) - (b) $3,191,744 $3,164,901 $2,997,368 $3,210,159 $3,755,150 $3,491,217 $3,300,013 Plan Fiduciary Net Position as a Percentage of the Total Pension Liability 1.4% 0.3% 1.3% 1.5% 1.0% 1.2% 1.7% Covered Payroll $22,875 $31,945 $35,507 $39,413 $34,301 $41,378 $54,649
Net Pension Liability as a Percentage of Covered Payroll 13,953.0% 9,907.3% 8,441.6% 8,144.9% 10,947.6% 8,437.4% 6,038.6%
(1) Information in this schedule is not available prior to 2014. Additional years will be added to this schedule in future fiscal years until 10 years of data is presented. (2) Includes State of California General Fund. (3) Cumulative effect of CalPERS employer proportionate share of postemployment benefit obligations.
NOTES TO SCHEDULE In Fiscal Year 2018-19, the discount rate used to measure Change of Assumptions and Methods
the total pension liability was 3.13 percent. CalPERSIn Fiscal Year 2019-20, the discount rate used to measure the implemented a new actuarial valuation software system for thetotal pension liability was 2.45 percent. The State funds the June 30, 2018 valuation. This new system refined and Judges' Retirement Fund (JRF) benefit obligations using the improved calculation methodology. pay-as-you-go method. Member contributions plus state
In Fiscal Year 2017-18, the discount rate used to measure contributions are designed to cover only benefit payments and the total pension liability was 3.62 percent. In December 2017,expenses each year. Under the pay-as-you-go method, the the Board adopted new mortality assumptions. The new pension plan’s fiduciary net position was not projected to be mortality table was developed from the December 2017sufficient to make projected future benefit payments of current experience study and includes 15 years of projected ongoingactive and inactive employees. Therefore, a discount rate of mortality improvement using 90 percent of scale MP 2016 2.45 percent, which falls within a reasonable range of yields published by the Society of Actuaries. The inflation assumption on 20-year tax-exempt General Obligation Municipal Bonds was reduced from 2.75 percent to 2.50 percent. The with an average rating of AA (as reported in Fidelity Index’s assumptions for individual salary increases and overall payroll"20-Year Municipal GO AA Index") as of June 30, 2020, was growth were reduced from 3.00 percent to 2.75 percent.applied to all periods of projected benefit payments to
In Fiscal Year 2016-17, the discount rate used to measure measure the total pension liability. There were no other the total pension liability was 3.56 percent. Assumption changes to assumptions or methods.
$3,235,471 $3,175,070 $3,036,999 $3,258,434 $3,794,944 $3,532,394 $3,357,212
Agenda item 6a, Attachment 1, Page 64 of 82
Required Supplementary Information (continued) changes were made in the JRF June 30, 2016, valuation including a lowering of the rates of retirement to reflect that fewer actual retirements over the past six years than were assumed. In addition, pre-retirement termination and disability rates were removed due to low expected future terminations and disability retirements for this group.
In Fiscal Year 2015-16, the discount rate used to measure the total pension liability was 2.85 percent.
In Fiscal Year 2014-15, the discount rate used to measure the total pension liability was 3.82 percent. Changes to actuarial methods were made in the June 30, 2014, valuation including an increase in maximum benefit allowable for active members to 75 percent of pay from 65 percent of pay; the benefit payable for a termination changed from being equal to a retirement benefit to one equal to a percent (generally 3.75 percent) times years of service; and the allocated service for the nonmember spouse for Qualified Domestic Relations Order changed to full service for the member in order to determine both eligibility and the benefit multiplier.
In Fiscal Year 2013-14, the discount rate used to measure the total pension liability was 4.25 percent. Changes to actuarial assumptions were made in the June 30, 2013, valuation. In February 2014, the Board adopted new mortality assumptions. The new mortality table was developed from the February 2014 Experience Study and includes 20 years of projected ongoing mortality improvement using the Scale BB table published by the Society of Actuaries.
Agenda item 6a, Attachment 1, Page 65 of 82
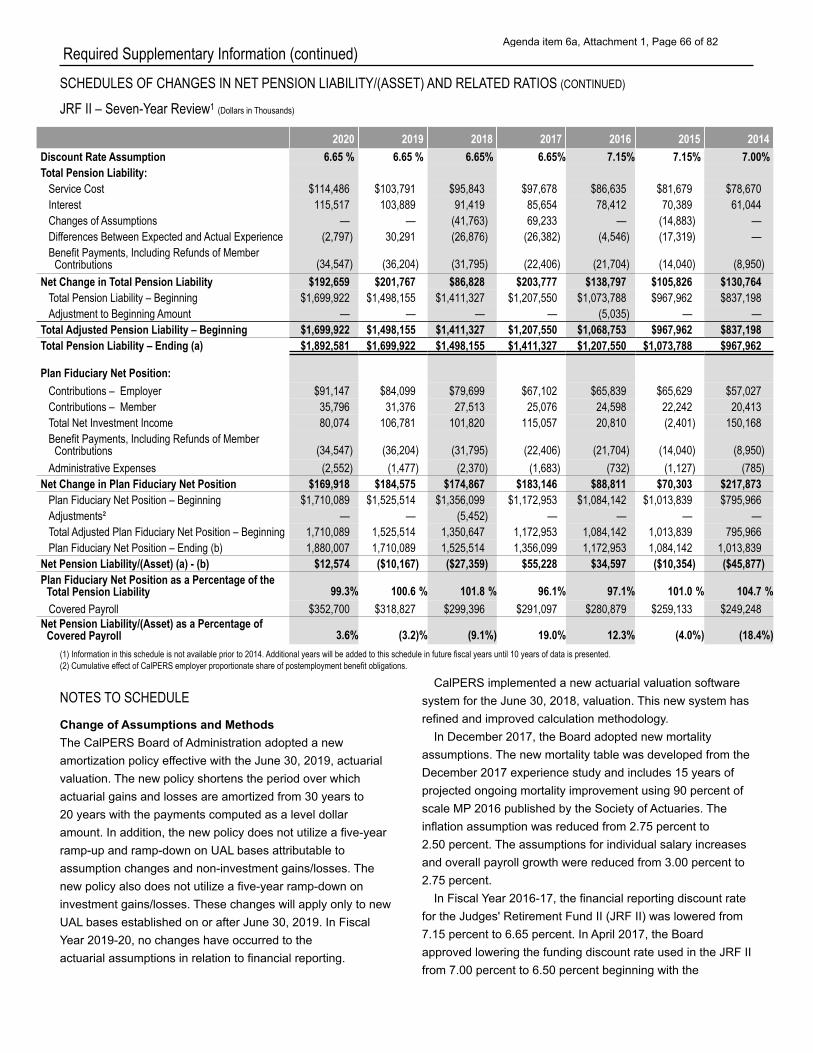
Required Supplementary Information (continued) SCHEDULES OF CHANGES IN NET PENSION LIABILITY/(ASSET) AND RELATED RATIOS (CONTINUED)
JRF II – Seven-Year Review1 (Dollars in Thousands)
2020 2019 2018 2017 2016 2015 2014 Discount Rate Assumption Total Pension Liability:
Service Cost $114,486 $103,791 $95,843 $97,678 $86,635 $81,679 $78,670 Interest 115,517 103,889 91,419 85,654 78,412 70,389 61,044 Changes of Assumptions — — (41,763) 69,233 — (14,883) — Differences Between Expected and Actual Experience (2,797) 30,291 (26,876) (26,382) (4,546) (17,319) — Benefit Payments, Including Refunds of Member Contributions (34,547) (36,204) (31,795) (22,406) (21,704) (14,040) (8,950)
6.65 % 6.65 % 6.65% 6.65% 7.15% 7.15% 7.00%
Net Change in Total Pension Liability $192,659 $201,767 $86,828 $203,777 $138,797 $105,826 $130,764 Total Pension Liability – Beginning $1,699,922 $1,498,155 $1,411,327 $1,207,550 $1,073,788 $967,962 $837,198 Adjustment to Beginning Amount — — — — (5,035) — —
Total Adjusted Pension Liability – Beginning $1,699,922 $1,498,155 $1,411,327 $1,207,550 $1,068,753 $967,962 $837,198 Total Pension Liability – Ending (a)
Plan Fiduciary Net Position: Contributions – Employer $91,147 $84,099 $79,699 $67,102 $65,839 $65,629 $57,027 Contributions – Member 35,796 31,376 27,513 25,076 24,598 22,242 20,413 Total Net Investment Income 80,074 106,781 101,820 115,057 20,810 (2,401) 150,168 Benefit Payments, Including Refunds of Member Contributions (34,547) (36,204) (31,795) (22,406) (21,704) (14,040) (8,950)
Administrative Expenses (2,552) (1,477) (2,370) (1,683) (732) (1,127) (785) Net Change in Plan Fiduciary Net Position $169,918 $184,575 $174,867 $183,146 $88,811 $70,303 $217,873
Plan Fiduciary Net Position – Beginning $1,710,089 $1,525,514 $1,356,099 $1,172,953 $1,084,142 $1,013,839 $795,966 Adjustments² — — (5,452) — — — — Total Adjusted Plan Fiduciary Net Position – Beginning 1,710,089 1,525,514 1,350,647 1,172,953 1,084,142 1,013,839 795,966 Plan Fiduciary Net Position – Ending (b) 1,880,007 1,710,089 1,525,514 1,356,099 1,172,953 1,084,142 1,013,839
Net Pension Liability/(Asset) (a) - (b) $12,574 ($10,167) ($27,359) $55,228 $34,597 ($10,354) ($45,877) Plan Fiduciary Net Position as a Percentage of the Total Pension Liability 99.3% 100.6 % 101.8 % 96.1% 97.1% 101.0 % 104.7 % Covered Payroll $352,700 $318,827 $299,396 $291,097 $280,879 $259,133 $249,248
Net Pension Liability/(Asset) as a Percentage of Covered Payroll 3.6% (3.2)% (9.1%) 19.0% 12.3% (4.0%) (18.4%)
(1) Information in this schedule is not available prior to 2014. Additional years will be added to this schedule in future fiscal years until 10 years of data is presented. (2) Cumulative effect of CalPERS employer proportionate share of postemployment benefit obligations.
CalPERS implemented a new actuarial valuation software NOTES TO SCHEDULE system for the June 30, 2018, valuation. This new system has
refined and improved calculation methodology. Change of Assumptions and Methods In December 2017, the Board adopted new mortalityThe CalPERS Board of Administration adopted a new
assumptions. The new mortality table was developed from the amortization policy effective with the June 30, 2019, actuarial December 2017 experience study and includes 15 years ofvaluation. The new policy shortens the period over which projected ongoing mortality improvement using 90 percent ofactuarial gains and losses are amortized from 30 years to scale MP 2016 published by the Society of Actuaries. The 20 years with the payments computed as a level dollar inflation assumption was reduced from 2.75 percent toamount. In addition, the new policy does not utilize a five-year 2.50 percent. The assumptions for individual salary increases ramp-up and ramp-down on UAL bases attributable to and overall payroll growth were reduced from 3.00 percent toassumption changes and non-investment gains/losses. The 2.75 percent. new policy also does not utilize a five-year ramp-down on
In Fiscal Year 2016-17, the financial reporting discount rate investment gains/losses. These changes will apply only to new for the Judges' Retirement Fund II (JRF II) was lowered fromUAL bases established on or after June 30, 2019. In Fiscal 7.15 percent to 6.65 percent. In April 2017, the Board Year 2019-20, no changes have occurred to the approved lowering the funding discount rate used in the JRF IIactuarial assumptions in relation to financial reporting. from 7.00 percent to 6.50 percent beginning with the
$1,892,581 $1,699,922 $1,498,155 $1,411,327 $1,207,550 $1,073,788 $967,962
Agenda item 6a, Attachment 1, Page 66 of 82

Required Supplementary Information (continued) June 30, 2016, valuation reports. The funding discount rate includes a 15 basis-point reduction for administrative expenses, and the remaining decrease is consistent with the change in the financial reporting discount rate.
In Fiscal Year 2014-15, the financial reporting discount rate was increased from 7.00 percent to 7.15 percent resulting from eliminating the 15 basis-point reduction for administrative expenses. The funding discount rate remained at 7.00 percent during this period, and remained adjusted for administrative expenses.
Agenda item 6a, Attachment 1, Page 67 of 82
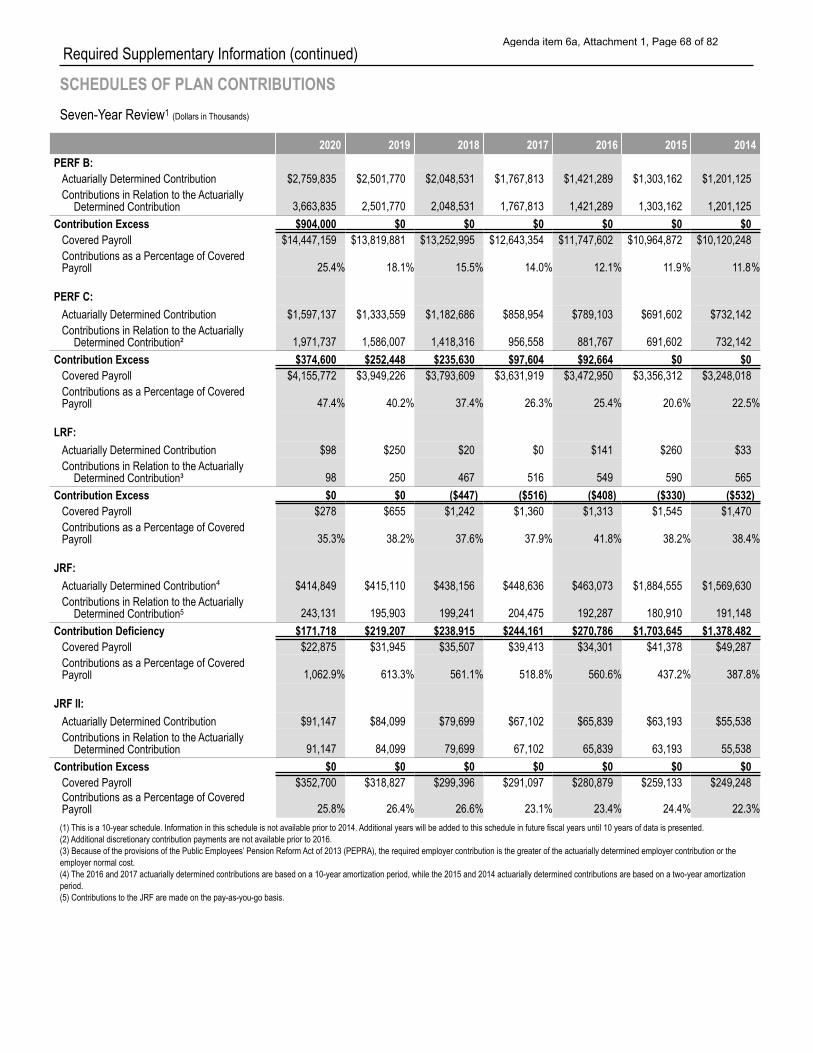
Required Supplementary Information (continued)
SCHEDULES OF PLAN CONTRIBUTIONS Seven-Year Review1 (Dollars in Thousands)
2020 2019 2018 2017 2016 2015 2014 PERF B:
Actuarially Determined Contribution $2,759,835 $2,501,770 $2,048,531 $1,767,813 $1,421,289 $1,303,162 $1,201,125 Contributions in Relation to the Actuarially
Determined Contribution 3,663,835 2,501,770 2,048,531 1,767,813 1,421,289 1,303,162 1,201,125 Contribution Excess $904,000 $0 $0 $0 $0 $0 $0
Covered Payroll $14,447,159 $13,819,881 $13,252,995 $12,643,354 $11,747,602 $10,964,872 $10,120,248 Contributions as a Percentage of Covered Payroll 25.4% 18.1% 15.5% 14.0% 12.1% 11.9% 11.8%
PERF C: Actuarially Determined Contribution $1,597,137 $1,333,559 $1,182,686 $858,954 $789,103 $691,602 $732,142 Contributions in Relation to the Actuarially
Determined Contribution² 1,971,737 1,586,007 1,418,316 956,558 881,767 691,602 732,142 Contribution Excess $374,600 $252,448 $235,630 $97,604 $92,664 $0 $0
Covered Payroll $4,155,772 $3,949,226 $3,793,609 $3,631,919 $3,472,950 $3,356,312 $3,248,018 Contributions as a Percentage of Covered Payroll 47.4% 40.2% 37.4% 26.3% 25.4% 20.6% 22.5%
LRF: Actuarially Determined Contribution $98 $250 $20 $0 $141 $260 $33 Contributions in Relation to the Actuarially
Determined Contribution³ 98 250 467 516 549 590 565 Contribution Excess $0 $0 ($447) ($516) ($408) ($330) ($532)
Covered Payroll $278 $655 $1,242 $1,360 $1,313 $1,545 $1,470 Contributions as a Percentage of Covered Payroll 35.3% 38.2% 37.6% 37.9% 41.8% 38.2% 38.4%
JRF: Actuarially Determined Contribution⁴ $414,849 $415,110 $438,156 $448,636 $463,073 $1,884,555 $1,569,630 Contributions in Relation to the Actuarially
Determined Contribution5 243,131 195,903 199,241 204,475 192,287 180,910 191,148 Contribution Deficiency $171,718 $219,207 $238,915 $244,161 $270,786 $1,703,645 $1,378,482
Covered Payroll $22,875 $31,945 $35,507 $39,413 $34,301 $41,378 $49,287 Contributions as a Percentage of Covered Payroll 1,062.9% 613.3% 561.1% 518.8% 560.6% 437.2% 387.8%
JRF II: Actuarially Determined Contribution $91,147 $84,099 $79,699 $67,102 $65,839 $63,193 $55,538 Contributions in Relation to the Actuarially
Determined Contribution 91,147 84,099 79,699 67,102 65,839 63,193 55,538 Contribution Excess $0 $0 $0 $0 $0 $0 $0
Covered Payroll $352,700 $318,827 $299,396 $291,097 $280,879 $259,133 $249,248 Contributions as a Percentage of Covered Payroll 25.8% 26.4% 26.6% 23.1% 23.4% 24.4% 22.3% (1) This is a 10-year schedule. Information in this schedule is not available prior to 2014. Additional years will be added to this schedule in future fiscal years until 10 years of data is presented. (2) Additional discretionary contribution payments are not available prior to 2016. (3) Because of the provisions of the Public Employees’ Pension Reform Act of 2013 (PEPRA), the required employer contribution is the greater of the actuarially determined employer contribution or the employer normal cost. (4) The 2016 and 2017 actuarially determined contributions are based on a 10-year amortization period, while the 2015 and 2014 actuarially determined contributions are based on a two-year amortization period. (5) Contributions to the JRF are made on the pay-as-you-go basis.
Agenda item 6a, Attachment 1, Page 68 of 82
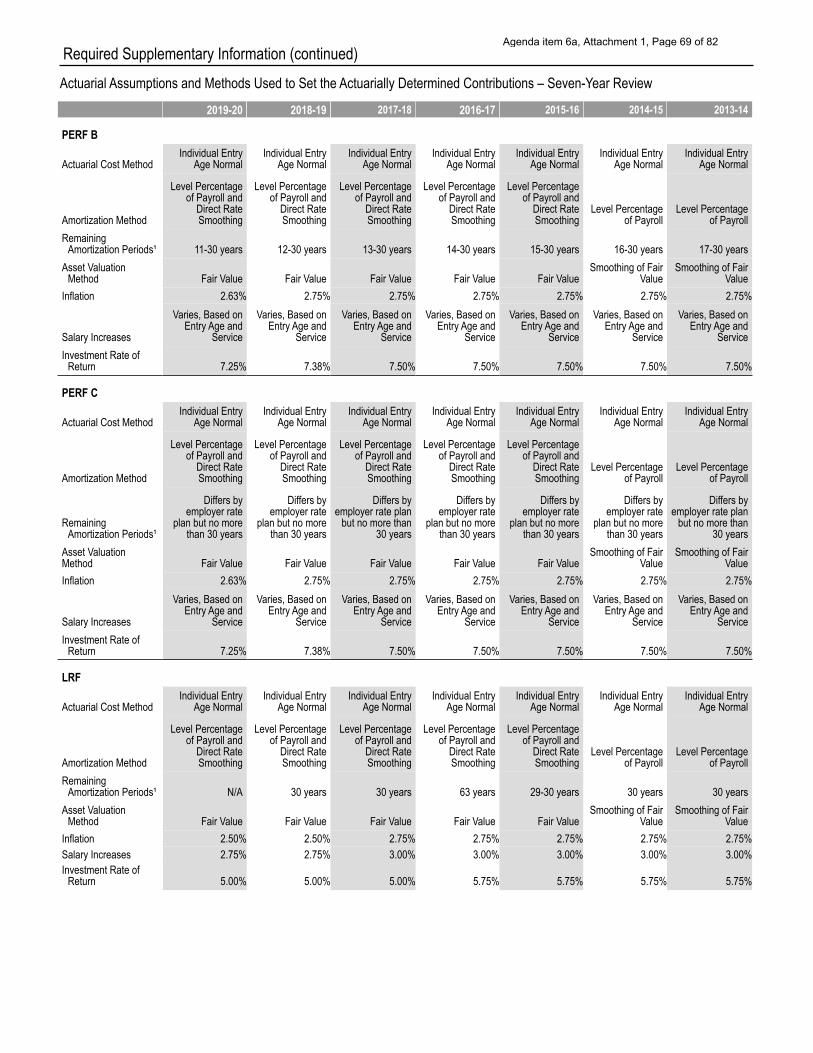
Required Supplementary Information (continued) Actuarial Assumptions and Methods Used to Set the Actuarially Determined Contributions – Seven-Year Review
2019-20 2018-19 2017-18 2016-17 2015-16 2014-15 2013-14
PERF B
Actuarial Cost Method Individual Entry
Age Normal Individual Entry
Age Normal Individual Entry
Age Normal Individual Entry
Age Normal Individual Entry
Age Normal Individual Entry
Age Normal Individual Entry
Age Normal
Amortization Method
Level Percentage of Payroll and
Direct Rate Smoothing
Level Percentage of Payroll and
Direct Rate Smoothing
Level Percentage of Payroll and
Direct Rate Smoothing
Level Percentage of Payroll and
Direct Rate Smoothing
Level Percentage of Payroll and
Direct Rate Smoothing
Level Percentage of Payroll
Level Percentage
Remaining Amortization Periods¹ 11-30 years 12-30 years 13-30 years 14-30 years 15-30 years 16-30 years 17-30 years
Asset Valuation Method Fair Value Fair Value
Smoothing of Fair Value
Smoothing of Fair
Inflation 2.63% 2.75% 2.75% 2.75% 2.75% 2.75% 2.75%
Salary Increases
Varies, Based on Entry Age and
Varies, Based on Entry Age and
Service
Varies, Based on Entry Age and
Varies, Based on Entry Age and
Service
Varies, Based on Entry Age and
Varies, Based on Entry Age and
Service
Varies, Based on Entry Age and
Investment Rate of Return 7.25% 7.38% 7.50% 7.50% 7.50% 7.50% 7.50%
PERF C
Actuarial Cost Method Individual Entry
Age Normal Individual Entry
Age Normal Individual Entry
Age Normal Individual Entry
Age Normal Individual Entry
Age Normal Individual Entry
Age Normal Individual Entry
Age Normal
Amortization Method
Level Percentage of Payroll and
Direct Rate Smoothing
Level Percentage of Payroll and
Direct Rate Smoothing
Level Percentage of Payroll and
Direct Rate Smoothing
Level Percentage of Payroll and
Direct Rate Smoothing
Level Percentage of Payroll and
Direct Rate Smoothing
Level Percentage of Payroll
Level Percentage
Remaining Amortization Periods¹
employer rate plan but no more
than 30 years
Differs by employer rate
plan but no more than 30 years
employer rate plan but no more than
Differs by employer rate
plan but no more than 30 years
employer rate plan but no more
than 30 years
Differs by employer rate
plan but no more than 30 years
employer rate plan but no more than
Asset Valuation Method Fair Value Fair Value
Smoothing of Fair Value
Smoothing of Fair
Inflation 2.63% 2.75% 2.75% 2.75% 2.75% 2.75% 2.75%
Salary Increases
Varies, Based on Entry Age and
Varies, Based on Entry Age and
Service
Varies, Based on Entry Age and
Varies, Based on Entry Age and
Service
Varies, Based on Entry Age and
Varies, Based on Entry Age and
Service
Varies, Based on Entry Age and
Investment Rate of Return 7.25% 7.38% 7.50% 7.50% 7.50% 7.50% 7.50%
Fair Value
Service
Fair Value
Service
Fair Value
Service
of Payroll
Value
Service
Differs by Differs byDiffers by
of Payroll
Differs by
30 years
Fair Value Value Fair Value
30 years
Fair Value
Service ServiceServiceService
LRF
Actuarial Cost Method Individual Entry
Age Normal Individual Entry
Age Normal Individual Entry
Age Normal Individual Entry
Age Normal Individual Entry
Age Normal Individual Entry
Age Normal Individual Entry
Age Normal
Amortization Method
Level Percentage of Payroll and
Direct Rate Smoothing
Level Percentage of Payroll and
Direct Rate Smoothing
Level Percentage of Payroll and
Direct Rate Smoothing
Level Percentage of Payroll and
Direct Rate Smoothing
Level Percentage of Payroll and
Direct Rate Smoothing
Level Percentage of Payroll
Level Percentage
Remaining Amortization Periods¹ 30 years 63 years 29-30 years 30 years
Asset Valuation Method Fair Value Fair Value
Smoothing of Fair Value
Smoothing of Fair
Inflation 2.50% 2.50% 2.75% 2.75% 2.75% 2.75% 2.75% Salary Increases 2.75% 2.75% 3.00% 3.00% 3.00% 3.00% 3.00% Investment Rate of
Return 5.00% 5.00% 5.00% 5.75% 5.75% 5.75% 5.75%
Fair Value Value
N/A
Fair Value
30 years
Fair Value
of Payroll
30 years
Agenda item 6a, Attachment 1, Page 69 of 82
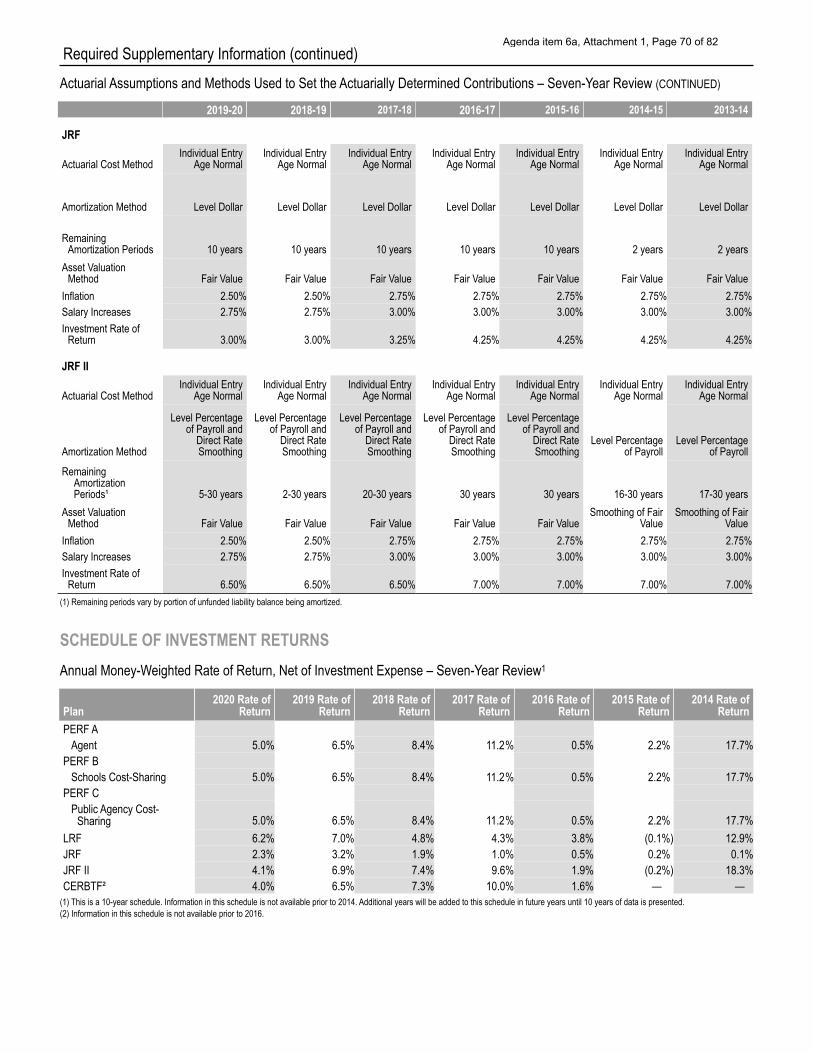
Required Supplementary Information (continued) Actuarial Assumptions and Methods Used to Set the Actuarially Determined Contributions – Seven-Year Review (CONTINUED)
2019-20 2018-19 2017-18 2016-17 2015-16 2014-15 2013-14
JRF
Actuarial Cost Method Individual Entry
Age Normal Individual Entry
Age Normal Individual Entry
Age Normal Individual Entry
Age Normal Individual Entry
Age Normal Individual Entry
Age Normal Individual Entry
Age Normal
Amortization Method Level Dollar Level Dollar Level Dollar Level Dollar Level Dollar Level Dollar Level Dollar
Remaining Amortization Periods 10 years 10 years 2 years
Asset Valuation Method Fair Value Fair Value Fair Value
Inflation 2.50% 2.50% 2.75% 2.75% 2.75% 2.75% 2.75% Salary Increases 2.75% 2.75% 3.00% 3.00% 3.00% 3.00% 3.00% Investment Rate of
Return 3.00% 3.00% 3.25% 4.25% 4.25% 4.25% 4.25%
JRF II
Actuarial Cost Method Individual Entry
Age Normal Individual Entry
Age Normal Individual Entry
Age Normal Individual Entry
Age Normal Individual Entry
Age Normal Individual Entry
Age Normal Individual Entry
Age Normal
Amortization Method
Level Percentage of Payroll and
Direct Rate Smoothing
Level Percentage of Payroll and
Direct Rate Smoothing
Level Percentage of Payroll and
Direct Rate Smoothing
Level Percentage of Payroll and
Direct Rate Smoothing
Level Percentage of Payroll and
Direct Rate Smoothing
Level Percentage of Payroll
Level Percentage
Remaining Amortization Periods¹ 5-30 years 2-30 years 20-30 years 30 years 16-30 years 17-30 years
Asset Valuation Method Fair Value Fair Value
Smoothing of Fair Value
Smoothing of Fair
Inflation 2.50% 2.50% 2.75% 2.75% 2.75% 2.75% 2.75% Salary Increases 2.75% 2.75% 3.00% 3.00% 3.00% 3.00% 3.00% Investment Rate of
Return 6.50% 6.50% 6.50% 7.00% 7.00% 7.00% 7.00%
10 years
Fair Value
2 years
Fair Value
10 years
Fair Value
10 years
Fair Value
of Payroll
Fair Value Value Fair Value
30 years
Fair Value
(1) Remaining periods vary by portion of unfunded liability balance being amortized.
SCHEDULE OF INVESTMENT RETURNS Annual Money-Weighted Rate of Return, Net of Investment Expense – Seven-Year Review1
Plan 2020 Rate of
Return 2019 Rate of
Return 2018 Rate of
Return 2017 Rate of
Return 2016 Rate of
Return 2015 Rate of
Return 2014 Rate of
Return PERF A
Agent 5.0% 6.5% 8.4% 11.2% 0.5% 2.2% 17.7% PERF B
Schools Cost-Sharing 5.0% 6.5% 8.4% 11.2% 0.5% 2.2% 17.7%
Public Agency Cost- Sharing
LRF JRF
5.0% 6.2% 2.3%
6.5% 7.0% 3.2%
8.4% 4.8% 1.9%
11.2% 4.3% 1.0%
0.5% 3.8% 0.5%
2.2% (0.1%) 0.2%
17.7% 12.9% 0.1%
JRF II CERBTF²
4.1% 4.0%
6.9% 6.5%
7.4% 7.3%
9.6% 10.0%
1.9% 1.6%
(0.2%) —
18.3% —
(1) This is a 10-year schedule. Information in this schedule is not available prior to 2014. Additional years will be added to this schedule in future years until 10 years of data is presented. (2) Information in this schedule is not available prior to 2016.
PERF C
Agenda item 6a, Attachment 1, Page 70 of 82
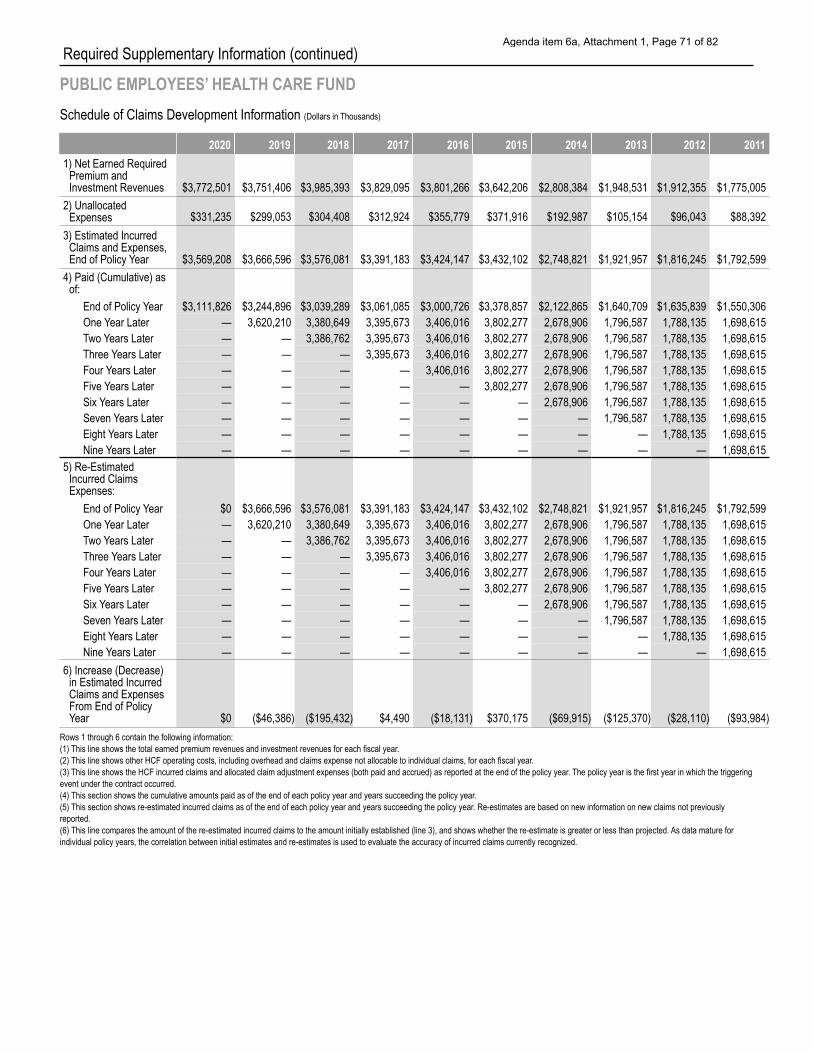
Required Supplementary Information (continued)
PUBLIC EMPLOYEES’ HEALTH CARE FUND Schedule of Claims Development Information (Dollars in Thousands)
2020 2019 2018 2017 2016 2015 2014 2013 2012 2011 1) Net Earned Required Premium and Investment Revenues $3,772,501 $3,751,406 $3,985,393 $3,829,095 $3,801,266 $3,642,206 $2,808,384 $1,948,531 $1,912,355 $1,775,005
2) Unallocated Expenses $331,235 $299,053 $304,408 $312,924 $355,779 $371,916 $192,987 $105,154 $96,043 $88,392
3) Estimated Incurred Claims and Expenses, End of Policy Year $3,569,208 $3,666,596 $3,576,081 $3,391,183 $3,424,147 $3,432,102 $2,748,821 $1,921,957 $1,816,245 $1,792,599
4) Paid (Cumulative) as of:
End of Policy Year $3,111,826 $3,244,896 $3,039,289 $3,061,085 $3,000,726 $3,378,857 $2,122,865 $1,640,709 $1,635,839 $1,550,306 One Year Later — 3,620,210 3,380,649 3,395,673 3,406,016 3,802,277 2,678,906 1,796,587 1,788,135 1,698,615 Two Years Later — — 3,386,762 3,395,673 3,406,016 3,802,277 2,678,906 1,796,587 1,788,135 1,698,615 Three Years Later — — — 3,395,673 3,406,016 3,802,277 2,678,906 1,796,587 1,788,135 1,698,615 Four Years Later — — — — 3,406,016 3,802,277 2,678,906 1,796,587 1,788,135 1,698,615 Five Years Later — — — — — 3,802,277 2,678,906 1,796,587 1,788,135 1,698,615 Six Years Later — — — — — — 2,678,906 1,796,587 1,788,135 1,698,615 Seven Years Later — — — — — — — 1,796,587 1,788,135 1,698,615 Eight Years Later — — — — — — — — 1,788,135 1,698,615 Nine Years Later — — — — — — — — — 1,698,615
5) Re-Estimated Incurred Claims Expenses:
End of Policy Year $0 $3,666,596 $3,576,081 $3,391,183 $3,424,147 $3,432,102 $2,748,821 $1,921,957 $1,816,245 $1,792,599 One Year Later — 3,620,210 3,380,649 3,395,673 3,406,016 3,802,277 2,678,906 1,796,587 1,788,135 1,698,615 Two Years Later — — 3,386,762 3,395,673 3,406,016 3,802,277 2,678,906 1,796,587 1,788,135 1,698,615 Three Years Later — — — 3,395,673 3,406,016 3,802,277 2,678,906 1,796,587 1,788,135 1,698,615 Four Years Later — — — — 3,406,016 3,802,277 2,678,906 1,796,587 1,788,135 1,698,615 Five Years Later — — — — — 3,802,277 2,678,906 1,796,587 1,788,135 1,698,615 Six Years Later — — — — — — 2,678,906 1,796,587 1,788,135 1,698,615 Seven Years Later — — — — — — — 1,796,587 1,788,135 1,698,615 Eight Years Later — — — — — — — — 1,788,135 1,698,615 Nine Years Later — — — — — — — — — 1,698,615
6) Increase (Decrease) in Estimated Incurred Claims and Expenses From End of Policy Year $0 ($46,386) ($195,432) $4,490 ($18,131) $370,175 ($69,915) ($125,370) ($28,110) ($93,984)
Rows 1 through 6 contain the following information: (1) This line shows the total earned premium revenues and investment revenues for each fiscal year. (2) This line shows other HCF operating costs, including overhead and claims expense not allocable to individual claims, for each fiscal year. (3) This line shows the HCF incurred claims and allocated claim adjustment expenses (both paid and accrued) as reported at the end of the policy year. The policy year is the first year in which the triggering event under the contract occurred. (4) This section shows the cumulative amounts paid as of the end of each policy year and years succeeding the policy year. (5) This section shows re-estimated incurred claims as of the end of each policy year and years succeeding the policy year. Re-estimates are based on new information on new claims not previously reported. (6) This line compares the amount of the re-estimated incurred claims to the amount initially established (line 3), and shows whether the re-estimate is greater or less than projected. As data mature for individual policy years, the correlation between initial estimates and re-estimates is used to evaluate the accuracy of incurred claims currently recognized.
Agenda item 6a, Attachment 1, Page 71 of 82
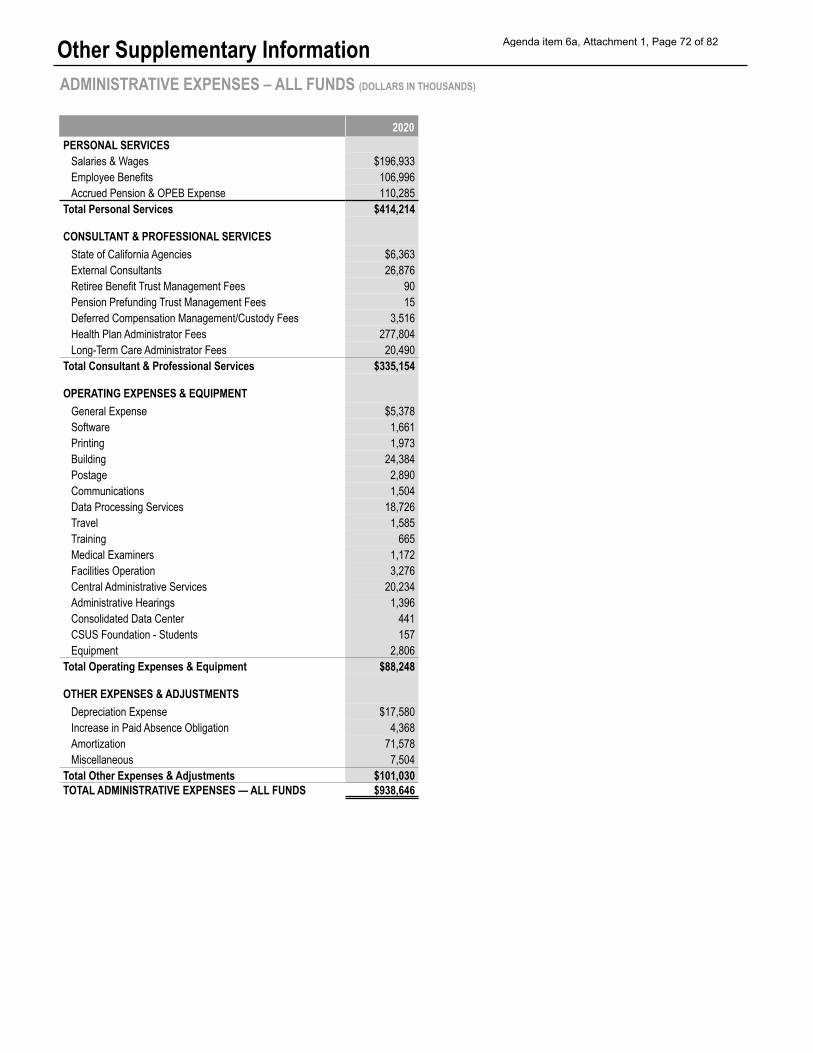
Other Supplementary Information ADMINISTRATIVE EXPENSES – ALL FUNDS (DOLLARS IN THOUSANDS)
2020 PERSONAL SERVICES
Salaries & Wages $196,933 Employee Benefits 106,996 Accrued Pension & OPEB Expense 110,285
Total Personal Services
CONSULTANT & PROFESSIONAL SERVICES State of California Agencies $6,363 External Consultants 26,876 Retiree Benefit Trust Management Fees 90 Pension Prefunding Trust Management Fees 15 Deferred Compensation Management/Custody Fees 3,516 Health Plan Administrator Fees 277,804 Long-Term Care Administrator Fees 20,490
Total Consultant & Professional Services
OPERATING EXPENSES & EQUIPMENT General Expense $5,378 Software 1,661 Printing 1,973 Building 24,384 Postage 2,890 Communications 1,504 Data Processing Services 18,726 Travel 1,585 Training 665 Medical Examiners 1,172 Facilities Operation 3,276 Central Administrative Services 20,234 Administrative Hearings 1,396 Consolidated Data Center 441 CSUS Foundation - Students 157 Equipment 2,806
Total Operating Expenses & Equipment $88,248
OTHER EXPENSES & ADJUSTMENTS Depreciation Expense $17,580 Increase in Paid Absence Obligation 4,368 Amortization 71,578 Miscellaneous 7,504
$414,214
$335,154
Total Other Expenses & Adjustments $101,030 TOTAL ADMINISTRATIVE EXPENSES — ALL FUNDS $938,646
Agenda item 6a, Attachment 1, Page 72 of 82
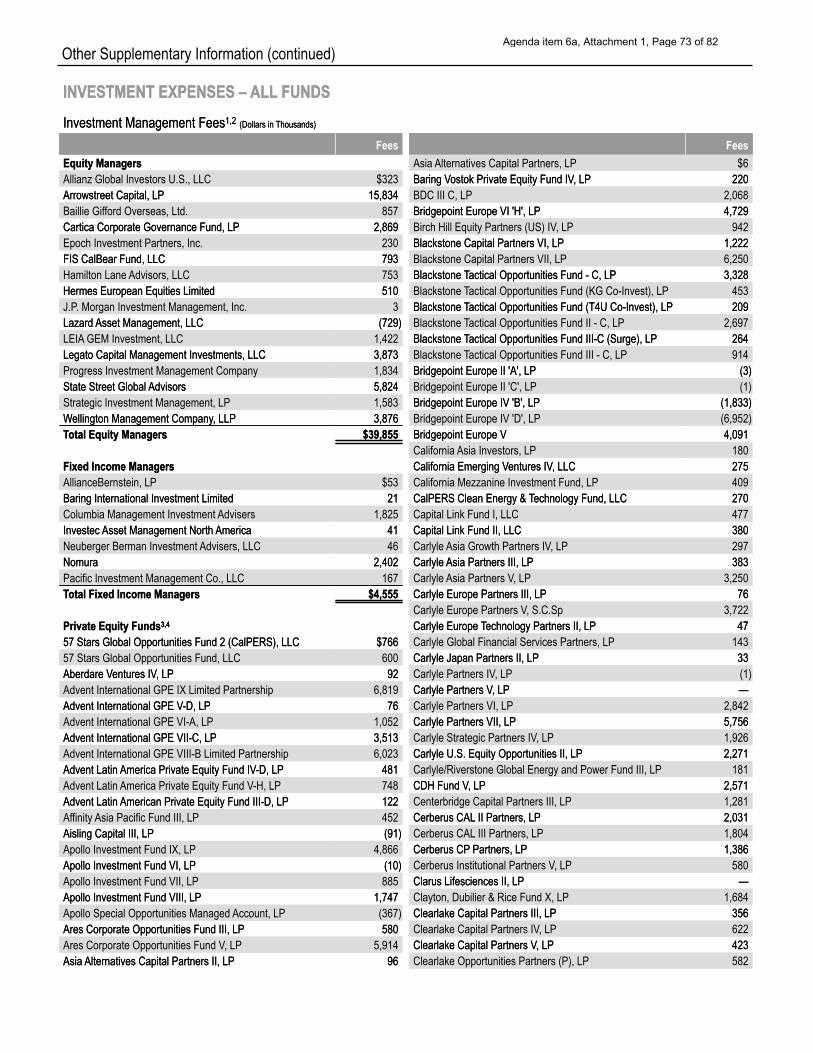
Fees
Allianz Global Investors U.S., LLC $323
Baillie Gifford Overseas, Ltd. 857
Epoch Investment Partners, Inc. 230
Hamilton Lane Advisors, LLC 753
J.P. Morgan Investment Management, Inc. 3
LEIA GEM Investment, LLC 1,422
Progress Investment Management Company 1,834
Strategic Investment Management, LP 1,583
AllianceBernstein, LP $53
Columbia Management Investment Advisers 1,825
Neuberger Berman Investment Advisers, LLC 46
Pacific Investment Management Co., LLC 167
57 Stars Global Opportunities Fund, LLC 600
Advent International GPE IX Limited Partnership 6,819
Advent International GPE VI-A, LP 1,052
Advent International GPE VIII-B Limited Partnership 6,023
Advent Latin America Private Equity Fund V-H, LP 748
Affinity Asia Pacific Fund III, LP 452
Apollo Investment Fund IX, LP 4,866
Apollo Investment Fund VII, LP 885
Apollo Special Opportunities Managed Account, LP (367)
Ares Corporate Opportunities Fund V, LP 5,914
Fees Asia Alternatives Capital Partners, LP $6
BDC III C, LP 2,068
Birch Hill Equity Partners (US) IV, LP 942
Blackstone Capital Partners VII, LP 6,250
Blackstone Tactical Opportunities Fund (KG Co-Invest), LP 453
Blackstone Tactical Opportunities Fund II - C, LP 2,697
Blackstone Tactical Opportunities Fund III - C, LP 914
Bridgepoint Europe II 'C', LP (1)
Bridgepoint Europe IV 'D', LP (6,952)
California Asia Investors, LP 180
California Mezzanine Investment Fund, LP 409
Capital Link Fund I, LLC 477
Carlyle Asia Growth Partners IV, LP 297
Carlyle Asia Partners V, LP 3,250
Carlyle Europe Partners V, S.C.Sp 3,722
Carlyle Global Financial Services Partners, LP 143
Carlyle Partners IV, LP (1)
Carlyle Partners VI, LP 2,842
Carlyle Strategic Partners IV, LP 1,926
Carlyle/Riverstone Global Energy and Power Fund III, LP 181
Centerbridge Capital Partners III, LP 1,281
Cerberus CAL III Partners, LP 1,804
Cerberus Institutional Partners V, LP 580
Clayton, Dubilier & Rice Fund X, LP 1,684
Clearlake Capital Partners IV, LP 622
Clearlake Opportunities Partners (P), LP 582
Other Supplementary Information (continued)
INVESTMENT EXPENSES –INVESTMENT EXPENSES – ALLALL FUNDSFUNDS Investment Management FeesInvestment Management Fees1,21,2 (Dollars in(Dollars in Thousands)Thousands)
Equity ManagersEquity Managers Allianz Global Investors U.S., LLC $323 Arrowstreet Capital, LPArrowstreet Capital, LP 15,83415,834 Baillie Gifford Overseas, Ltd. 857 Cartica Corporate Governance Fund, LPCartica Corporate Governance Fund, LP 2,8692,869 Epoch Investment Partners, Inc. 230 FIS CalBear Fund, LLCFIS CalBear Fund, LLC 793793 Hamilton Lane Advisors, LLC 753 Hermes European Equities LimitedHermes European Equities Limited 510510 J.P. Morgan Investment Management, Inc. 3 LazardLazard Asset Management, LLCAsset Management, LLC (729)(729) LEIA GEM Investment, LLC 1,422 Legato Capital Management Investments, LLCLegato Capital Management Investments, LLC 3,8733,873 Progress Investment Management Company 1,834 State Street GlobalState Street Global AdvisorsAdvisors 5,8245,824 Strategic Investment Management, LP 1,583 WWellington Management Companyellington Management Company, LLP, LLP 3,8763,876 TTotal Equity Managersotal Equity Managers $39,855$39,855
Fixed Income ManagersFixed Income Managers AllianceBernstein, LP $53 Baring International Investment LimitedBaring International Investment Limited 2121 Columbia Management Investment Advisers 1,825 InvestecInvestec Asset Management NorthAsset Management North AmericaAmerica 4141 Neuberger Berman Investment Advisers, LLC 46 NomuraNomura 2,4022,402
Fees
Pacific Investment Management Co., LLC 167 TTotal Fixed Income Managersotal Fixed Income Managers $4,555$4,555
Private Equity FundsPrivate Equity Funds3,43,4
57 Stars Global Opportunities Fund 2 (CalPERS), LLC57 Stars Global Opportunities Fund 2 (CalPERS), LLC $766$766 57 Stars Global Opportunities Fund, LLC 600 Aberdare VAberdare Ventures IVentures IV, LP, LP 9292 Advent International GPE IX Limited Partnership 6,819 Advent International GPE VAdvent International GPE V-D, LP-D, LP 7676 Advent International GPE VI-A, LP 1,052 Advent International GPE VII-C, LPAdvent International GPE VII-C, LP 3,5133,513 Advent International GPE VIII-B Limited Partnership 6,023 Advent LatinAdvent Latin America Private Equity Fund IVAmerica Private Equity Fund IV-D, LP-D, LP 481481 Advent Latin America Private Equity Fund V-H, LP 748 Advent LatinAdvent Latin American Private Equity Fund III-D, LPAmerican Private Equity Fund III-D, LP 122122 Affinity Asia Pacific Fund III, LP 452 Aisling Capital III, LPAisling Capital III, LP (91)(91) Apollo Investment Fund IX, LP 4,866 Apollo Investment Fund VI, LPApollo Investment Fund VI, LP (10)(10) Apollo Investment Fund VII, LP 885 Apollo Investment Fund VIII, LPApollo Investment Fund VIII, LP 1,7471,747 Apollo Special Opportunities Managed Account, LP (367) Ares Corporate Opportunities Fund III, LPAres Corporate Opportunities Fund III, LP 580580 Ares Corporate Opportunities Fund V, LP 5,914 AsiaAsia Alternatives Capital Partners II, LPAlternatives Capital Partners II, LP 9696
Fees Asia Alternatives Capital Partners, LP $6 Baring VBaring Vostok Private Equity Fund IVostok Private Equity Fund IV, LP, LP 220220 BDC III C, LP 2,068 Bridgepoint Europe VI 'H', LPBridgepoint Europe VI 'H', LP 4,7294,729 Birch Hill Equity Partners (US) IV, LP 942 Blackstone Capital Partners VI, LPBlackstone Capital Partners VI, LP 1,2221,222 Blackstone Capital Partners VII, LP 6,250 BlackstoneBlackstone TTactical Opportunities Fund - C, LPactical Opportunities Fund - C, LP 3,3283,328 Blackstone Tactical Opportunities Fund (KG Co-Invest), LP 453 BlackstoneBlackstone TTactical Opportunities Fund (T4U Co-Invest), LPactical Opportunities Fund (T4U Co-Invest), LP 209209 Blackstone Tactical Opportunities Fund II - C, LP 2,697 BlackstoneBlackstone TTactical Opportunities Fund III-C (Surge), LPactical Opportunities Fund III-C (Surge), LP 264264 Blackstone Tactical Opportunities Fund III - C, LP 914 Bridgepoint Europe II 'A', LPBridgepoint Europe II 'A', LP (3)(3) Bridgepoint Europe II 'C', LP (1) Bridgepoint Europe IV 'B', LPBridgepoint Europe IV 'B', LP (1,833)(1,833) Bridgepoint Europe IV 'D', LP (6,952) Bridgepoint Europe VBridgepoint Europe V 4,0914,091 California Asia Investors, LP 180 California Emerging VCalifornia Emerging Ventures IVentures IV, LLC, LLC 275275 California Mezzanine Investment Fund, LP 409 CalPERS Clean Energy &CalPERS Clean Energy & TTechnology Fund, LLCechnology Fund, LLC 270270 Capital Link Fund I, LLC 477 Capital Link Fund II, LLCCapital Link Fund II, LLC 380380 Carlyle Asia Growth Partners IV, LP 297 CarlyleCarlyle Asia Partners III, LPAsia Partners III, LP 383383 Carlyle Asia Partners V, LP 3,250 Carlyle Europe Partners III, LPCarlyle Europe Partners III, LP 7676 Carlyle Europe Partners V, S.C.Sp 3,722 Carlyle EuropeCarlyle Europe TTechnology Partners II, LPechnology Partners II, LP 4747 Carlyle Global Financial Services Partners, LP 143 Carlyle Japan Partners II, LPCarlyle Japan Partners II, LP 3333 Carlyle Partners IV, LP (1) Carlyle Partners VCarlyle Partners V, LP, LP —— Carlyle Partners VI, LP 2,842 Carlyle Partners VII, LPCarlyle Partners VII, LP 5,7565,756 Carlyle Strategic Partners IV, LP 1,926 Carlyle U.S. Equity Opportunities II, LPCarlyle U.S. Equity Opportunities II, LP 2,2712,271 Carlyle/Riverstone Global Energy and Power Fund III, LP 181 CDH Fund VCDH Fund V, LP, LP 2,5712,571 Centerbridge Capital Partners III, LP 1,281 Cerberus CALCerberus CAL II Partners, LPII Partners, LP 2,0312,031 Cerberus CAL III Partners, LP 1,804 Cerberus CPCerberus CP Partners, LPPartners, LP 1,3861,386 Cerberus Institutional Partners V, LP 580 Clarus Lifesciences II, LPClarus Lifesciences II, LP —— Clayton, Dubilier & Rice Fund X, LP 1,684 Clearlake Capital Partners III, LPClearlake Capital Partners III, LP 356356 Clearlake Capital Partners IV, LP 622 Clearlake Capital Partners VClearlake Capital Partners V, LP, LP 423423 Clearlake Opportunities Partners (P), LP 582
Agenda item 6a, Attachment 1, Page 73 of 82
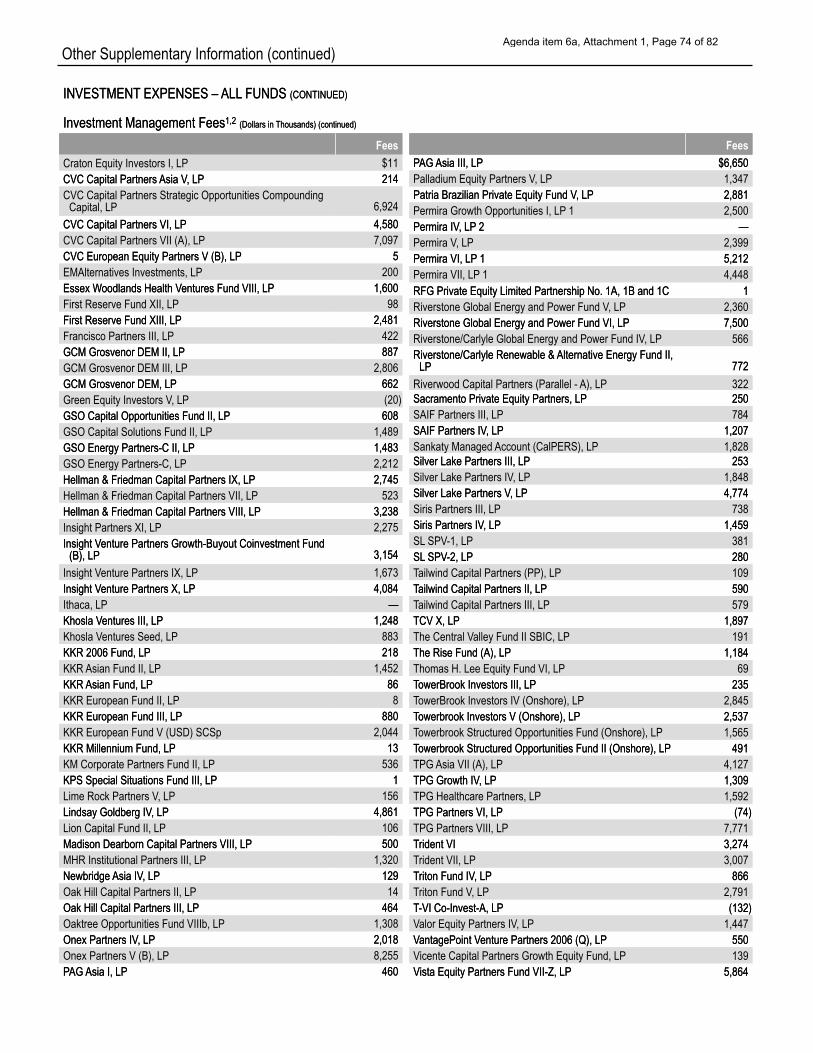
Fees
Craton Equity Investors I, LP $11
CVC Capital Partners Strategic Opportunities Compounding Capital, LP 6,924
CVC Capital Partners VII (A), LP 7,097
EMAlternatives Investments, LP 200
First Reserve Fund XII, LP 98
Francisco Partners III, LP 422
GCM Grosvenor DEM III, LP 2,806
Green Equity Investors V, LP (20)
GSO Capital Solutions Fund II, LP 1,489
GSO Energy Partners-C, LP 2,212
Hellman & Friedman Capital Partners VII, LP 523
Insight Partners XI, LP 2,275
Insight Venture Partners IX, LP 1,673
Ithaca, LP
Khosla Ventures Seed, LP 883
KKR Asian Fund II, LP 1,452
KKR European Fund II, LP 8
KKR European Fund V (USD) SCSp 2,044
KM Corporate Partners Fund II, LP 536
Lime Rock Partners V, LP 156
Lion Capital Fund II, LP 106
MHR Institutional Partners III, LP 1,320
Oak Hill Capital Partners II, LP 14
Oaktree Opportunities Fund VIIIb, LP 1,308
Onex Partners V (B), LP 8,255
Fees
Palladium Equity Partners V, LP 1,347
Permira Growth Opportunities I, LP 1 2,500
Permira V, LP 2,399
Permira VII, LP 1 4,448
Riverstone Global Energy and Power Fund V, LP 2,360
Riverstone/Carlyle Global Energy and Power Fund IV, LP 566
Riverwood Capital Partners (Parallel - A), LP 322
SAIF Partners III, LP 784
Sankaty Managed Account (CalPERS), LP 1,828
Silver Lake Partners IV, LP 1,848
Siris Partners III, LP 738
SL SPV-1, LP 381
Tailwind Capital Partners (PP), LP 109
Tailwind Capital Partners III, LP 579
The Central Valley Fund II SBIC, LP 191
Thomas H. Lee Equity Fund VI, LP 69
TowerBrook Investors IV (Onshore), LP 2,845
Towerbrook Structured Opportunities Fund (Onshore), LP 1,565
TPG Asia VII (A), LP 4,127
TPG Healthcare Partners, LP 1,592
TPG Partners VIII, LP 7,771
Trident VII, LP 3,007
Triton Fund V, LP 2,791
Valor Equity Partners IV, LP 1,447
Vicente Capital Partners Growth Equity Fund, LP 139
Other Supplementary Information (continued)
INVESTMENTINVESTMENT EXPENSES –EXPENSES – ALLALL FUNDSFUNDS (CONTINUED)(CONTINUED)
Investment Management FeesInvestment Management Fees1,21,2 (Dollars in(Dollars in Thousands) (continued)Thousands) (continued)
Fees Fees Craton Equity Investors I, LP CVC Capital PartnersCVC Capital Partners Asia VAsia V, LP, LP CVC Capital Partners Strategic Opportunities Compounding Capital, LP
CVC Capital Partners VI, LPCVC Capital Partners VI, LP CVC Capital Partners VII (A), LP CVC European Equity Partners V (B), LPCVC European Equity Partners V (B), LP EMAlternatives Investments, LP Essex WEssex Woodlands Health Voodlands Health Ventures Fund VIII, LPentures Fund VIII, LP First Reserve Fund XII, LP First Reserve Fund XIII, LPFirst Reserve Fund XIII, LP Francisco Partners III, LP GCM Grosvenor DEM II, LPGCM Grosvenor DEM II, LP GCM Grosvenor DEM III, LP GCM Grosvenor DEM, LPGCM Grosvenor DEM, LP Green Equity Investors V, LP GSO Capital Opportunities Fund II, LPGSO Capital Opportunities Fund II, LP GSO Capital Solutions Fund II, LP GSO Energy Partners-C II, LPGSO Energy Partners-C II, LP GSO Energy Partners-C, LP Hellman & Friedman Capital Partners IX, LPHellman & Friedman Capital Partners IX, LP Hellman & Friedman Capital Partners VII, LP Hellman & Friedman Capital Partners VIII, LPHellman & Friedman Capital Partners VIII, LP Insight Partners XI, LP Insight VInsight Venture Partners Growth-Buyout Coinvestment Fundenture Partners Growth-Buyout Coinvestment Fund
(B), LP(B), LP Insight Venture Partners IX, LP Insight VInsight Venture Partners X, LPenture Partners X, LP Ithaca, LP Khosla VKhosla Ventures III, LPentures III, LP Khosla Ventures Seed, LP KKR 2006 Fund, LPKKR 2006 Fund, LP KKR Asian Fund II, LP KKRKKR Asian Fund, LPAsian Fund, LP KKR European Fund II, LP KKR European Fund III, LPKKR European Fund III, LP KKR European Fund V (USD) SCSp KKR Millennium Fund, LPKKR Millennium Fund, LP KM Corporate Partners Fund II, LP KPS Special Situations Fund III, LPKPS Special Situations Fund III, LP Lime Rock Partners V, LP Lindsay Goldberg IVLindsay Goldberg IV, LP, LP Lion Capital Fund II, LP Madison Dearborn Capital Partners VIII, LPMadison Dearborn Capital Partners VIII, LP MHR Institutional Partners III, LP NewbridgeNewbridge Asia IVAsia IV, LP, LP Oak Hill Capital Partners II, LP Oak Hill Capital Partners III, LPOak Hill Capital Partners III, LP Oaktree Opportunities Fund VIIIb, LP Onex Partners IVOnex Partners IV, LP, LP Onex Partners V (B), LP PPAGAG Asia I, LPAsia I, LP
$11 214214
6,924 4,5804,580 7,097
55 200
1,6001,600 98
2,4812,481 422 887887
2,806 662662 (20) 608608
1,489 1,4831,483 2,212 2,7452,745
523 3,2383,238 2,275
3,1543,154 1,673 4,0844,084
—— 1,2481,248
883 218218
1,452 8686 8
880880 2,044
1313 536
11 156
4,8614,861 106 500500
1,320 129129 14
464464 1,308 2,0182,018 8,255
460460
PPAGAG Asia III, LPAsia III, LP $6,650$6,650 Palladium Equity Partners V, LP 1,347 Patria Brazilian Private Equity Fund VPatria Brazilian Private Equity Fund V, LP, LP 2,8812,881 Permira Growth Opportunities I, LP 1 2,500 Permira IVPermira IV, LP, LP 22 —— Permira V, LP 2,399 Permira VI, LPPermira VI, LP 11 5,2125,212 Permira VII, LP 1 4,448 RFG Private Equity Limited Partnership No. 1A, 1B and 1CRFG Private Equity Limited Partnership No. 1A, 1B and 1C 11 Riverstone Global Energy and Power Fund V, LP 2,360 Riverstone Global Energy and Power Fund VI, LPRiverstone Global Energy and Power Fund VI, LP 7,5007,500 Riverstone/Carlyle Global Energy and Power Fund IV, LP 566 Riverstone/Carlyle Renewable &Riverstone/Carlyle Renewable & Alternative Energy Fund II,Alternative Energy Fund II, LPLP 772772
Riverwood Capital Partners (Parallel - A), LP 322 Sacramento Private Equity Partners, LPSacramento Private Equity Partners, LP 250250 SAIF Partners III, LP 784 SAIF Partners IVSAIF Partners IV, LP, LP 1,2071,207 Sankaty Managed Account (CalPERS), LP 1,828 Silver Lake Partners III, LPSilver Lake Partners III, LP 253253 Silver Lake Partners IV, LP 1,848 Silver Lake Partners VSilver Lake Partners V, LP, LP 4,7744,774 Siris Partners III, LP 738 Siris Partners IVSiris Partners IV, LP, LP 1,4591,459 SL SPV-1, LP 381 SLSL SPVSPV-2, LP-2, LP 280280 Tailwind Capital Partners (PP), LP 109 TTailwind Capital Partners II, LPailwind Capital Partners II, LP 590590 Tailwind Capital Partners III, LP 579 TCV X, LPTCV X, LP 1,8971,897 The Central Valley Fund II SBIC, LP 191 The Rise Fund (A), LPThe Rise Fund (A), LP 1,1841,184 Thomas H. Lee Equity Fund VI, LP 69 TTowerBrook Investors III, LPowerBrook Investors III, LP 235235 TowerBrook Investors IV (Onshore), LP 2,845 TTowerbrook Investors V (Onshore), LPowerbrook Investors V (Onshore), LP 2,5372,537 Towerbrook Structured Opportunities Fund (Onshore), LP 1,565 TTowerbrook Structured Opportunities Fund II (Onshore), LPowerbrook Structured Opportunities Fund II (Onshore), LP 491491 TPG Asia VII (A), LP 4,127 TPG Growth IVTPG Growth IV, LP, LP 1,3091,309 TPG Healthcare Partners, LP 1,592 TPG Partners VI, LPTPG Partners VI, LP (74)(74) TPG Partners VIII, LP 7,771 TTrident VIrident VI 3,2743,274 Trident VII, LP 3,007 TTriton Fund IVriton Fund IV, LP, LP 866866 Triton Fund V, LP 2,791 TT-VI Co-Invest-A, LP-VI Co-Invest-A, LP (132)(132) Valor Equity Partners IV, LP 1,447 VVantagePoint VantagePoint Venture Partners 2006 (Q), LPenture Partners 2006 (Q), LP 550550 Vicente Capital Partners Growth Equity Fund, LP 139 VVista Equity Partners Fund VII-Z, LPista Equity Partners Fund VII-Z, LP 5,8645,864
Agenda item 6a, Attachment 1, Page 74 of 82
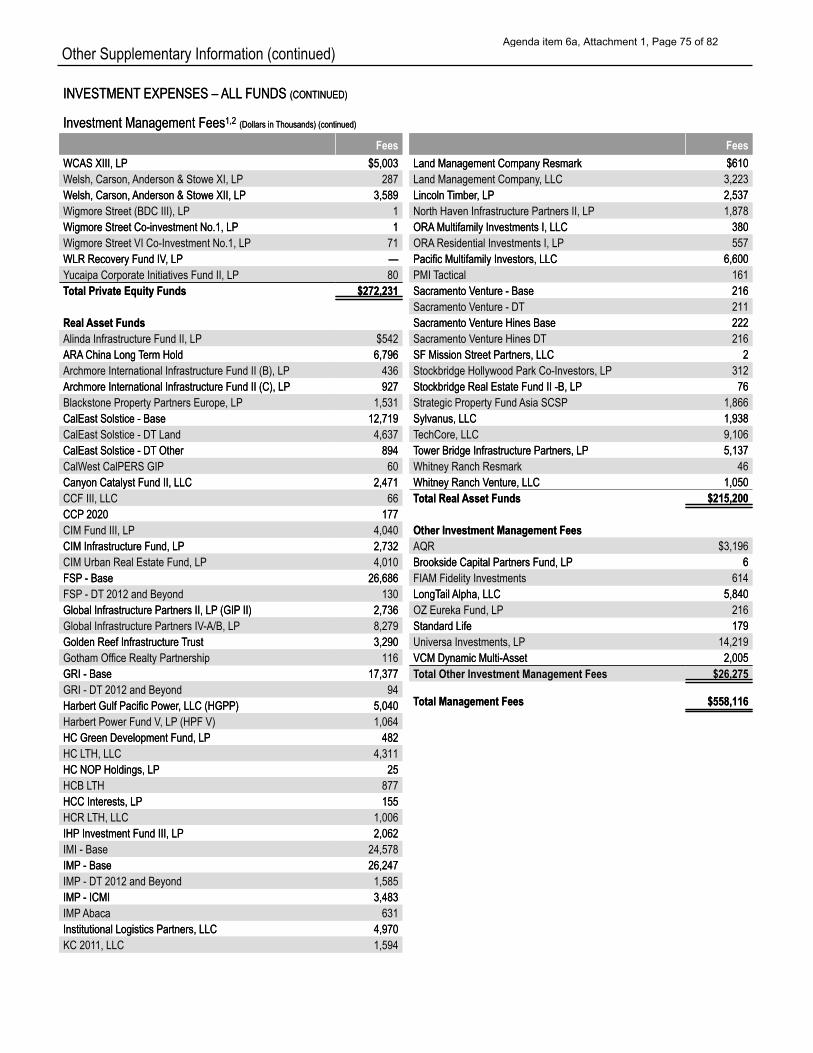
Fees
Welsh, Carson, Anderson & Stowe XI, LP 287
Wigmore Street (BDC III), LP 1
Wigmore Street VI Co-Investment No.1, LP 71
Yucaipa Corporate Initiatives Fund II, LP 80
Alinda Infrastructure Fund II, LP $542
Archmore International Infrastructure Fund II (B), LP 436
Blackstone Property Partners Europe, LP 1,531
CalEast Solstice - DT Land 4,637
CalWest CalPERS GIP 60
CCF III, LLC 66
CIM Fund III, LP 4,040
CIM Urban Real Estate Fund, LP 4,010
FSP - DT 2012 and Beyond 130
Global Infrastructure Partners IV-A/B, LP 8,279
Gotham Office Realty Partnership 116
GRI - DT 2012 and Beyond 94
Harbert Power Fund V, LP (HPF V) 1,064
HC LTH, LLC 4,311
HCB LTH 877
HCR LTH, LLC 1,006
IMI - Base 24,578
IMP - DT 2012 and Beyond 1,585
IMP Abaca 631
KC 2011, LLC 1,594
Fees
Land Management Company, LLC 3,223
North Haven Infrastructure Partners II, LP 1,878
ORA Residential Investments I, LP 557
PMI Tactical 161
Sacramento Venture - DT 211
Sacramento Venture Hines DT 216
Stockbridge Hollywood Park Co-Investors, LP 312
Strategic Property Fund Asia SCSP 1,866
TechCore, LLC 9,106
Whitney Ranch Resmark 46
AQR $3,196
FIAM Fidelity Investments 614
OZ Eureka Fund, LP 216
Universa Investments, LP 14,219
Total Other Investment Management Fees $26,275
Other Supplementary Information (continued)
INVESTMENTINVESTMENT EXPENSES –EXPENSES – ALLALL FUNDSFUNDS (CONTINUED)(CONTINUED)
Investment Management FeesInvestment Management Fees1,21,2 (Dollars in(Dollars in Thousands) (continued)Thousands) (continued)
Fees WCAS XIII, LPWCAS XIII, LP $5,003$5,003 Welsh, Carson, Anderson & Stowe XI, LP 287 WWelsh, Carson,elsh, Carson, Anderson & Stowe XII, LPAnderson & Stowe XII, LP 3,5893,589 Wigmore Street (BDC III), LP 1 Wigmore Street Co-investment No.1, LPWigmore Street Co-investment No.1, LP 11 Wigmore Street VI Co-Investment No.1, LP 71 WLR Recovery Fund IVWLR Recovery Fund IV, LP, LP —— Yucaipa Corporate Initiatives Fund II, LP 80 TTotal Private Equity Fundsotal Private Equity Funds $272,231$272,231
RealReal Asset FundsAsset Funds Alinda Infrastructure Fund II, LP $542 ARAARA China LongChina Long TTerm Holderm Hold 6,7966,796 Archmore International Infrastructure Fund II (B), LP 436 Archmore International Infrastructure Fund II (C), LPArchmore International Infrastructure Fund II (C), LP 927927 Blackstone Property Partners Europe, LP 1,531 CalEast Solstice - BaseCalEast Solstice - Base 12,71912,719 CalEast Solstice - DT Land 4,637 CalEast Solstice - DTCalEast Solstice - DT OtherOther 894894 CalWest CalPERS GIP 60 Canyon Catalyst Fund II, LLCCanyon Catalyst Fund II, LLC 2,4712,471 CCF III, LLC 66 CCPCCP 20202020 177177 CIM Fund III, LP 4,040 CIM Infrastructure Fund, LPCIM Infrastructure Fund, LP 2,7322,732 CIM Urban Real Estate Fund, LP 4,010 FSPFSP - Base- Base 26,68626,686 FSP - DT 2012 and Beyond 130 Global Infrastructure Partners II, LPGlobal Infrastructure Partners II, LP (GIP(GIP II)II) 2,7362,736 Global Infrastructure Partners IV-A/B, LP 8,279 Golden Reef InfrastructureGolden Reef Infrastructure TTrustrust 3,2903,290 Gotham Office Realty Partnership 116 GRI - BaseGRI - Base 17,37717,377 GRI - DT 2012 and Beyond 94 Harbert Gulf Pacific PowerHarbert Gulf Pacific Power, LLC (HGPP), LLC (HGPP) 5,0405,040 Harbert Power Fund V, LP (HPF V) 1,064 HC Green Development Fund, LPHC Green Development Fund, LP 482482 HC LTH, LLC 4,311 HC NOPHC NOP Holdings, LPHoldings, LP 2525 HCB LTH 877 HCC Interests, LPHCC Interests, LP 155155 HCR LTH, LLC 1,006 IHPIHP Investment Fund III, LPInvestment Fund III, LP 2,0622,062 IMI - Base 24,578 IMPIMP - Base- Base 26,24726,247 IMP - DT 2012 and Beyond 1,585 IMPIMP - ICMI- ICMI 3,4833,483 IMP Abaca 631 Institutional Logistics Partners, LLCInstitutional Logistics Partners, LLC 4,9704,970 KC 2011, LLC 1,594
Fees Land Management Company ResmarkLand Management Company Resmark Land Management Company, LLC LincolnLincoln TTimberimber, LP, LP North Haven Infrastructure Partners II, LP ORAORA Multifamily Investments I, LLCMultifamily Investments I, LLC ORA Residential Investments I, LP Pacific Multifamily Investors, LLCPacific Multifamily Investors, LLC PMI Tactical Sacramento VSacramento Venture - Baseenture - Base Sacramento Venture - DT Sacramento VSacramento Venture Hines Baseenture Hines Base Sacramento Venture Hines DT SF Mission Street Partners, LLCSF Mission Street Partners, LLC Stockbridge Hollywood Park Co-Investors, LP Stockbridge Real Estate Fund II -B, LPStockbridge Real Estate Fund II -B, LP Strategic Property Fund Asia SCSP Sylvanus, LLCSylvanus, LLC TechCore, LLC TTower Bridge Infrastructure Partners, LPower Bridge Infrastructure Partners, LP Whitney Ranch Resmark Whitney Ranch VWhitney Ranch Venture, LLCenture, LLC TTotal Realotal Real Asset FundsAsset Funds
Other Investment Management FeesOther Investment Management Fees AQR Brookside Capital Partners Fund, LPBrookside Capital Partners Fund, LP FIAM Fidelity Investments LongTLongTailail Alpha, LLCAlpha, LLC OZ Eureka Fund, LP Standard LifeStandard Life Universa Investments, LP VCM Dynamic Multi-AssetVCM Dynamic Multi-Asset
$610$610 3,223 2,5372,537 1,878
380380 557
6,6006,600 161 216216 211 222222 216
22 312 7676
1,866 1,9381,938 9,106 5,1375,137
46 1,0501,050
$215,200$215,200
$3,196 66
614 5,8405,840
216 179179
14,219 2,0052,005
Total Other Investment Management Fees $26,275
TTotal Management Feesotal Management Fees $558,116$558,116
Agenda item 6a, Attachment 1, Page 75 of 82
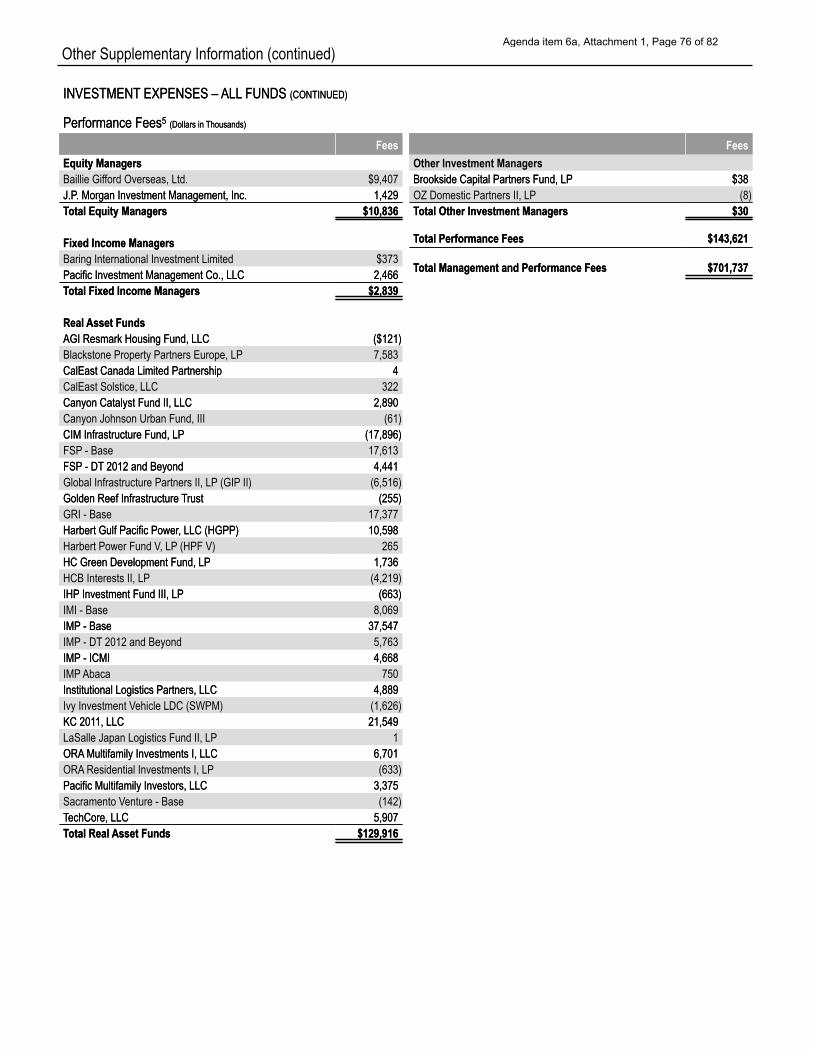
Fees
Baillie Gifford Overseas, Ltd. $9,407
Baring International Investment Limited $373
Blackstone Property Partners Europe, LP 7,583
CalEast Solstice, LLC 322
Canyon Johnson Urban Fund, III (61)
FSP - Base 17,613
Global Infrastructure Partners II, LP (GIP II) (6,516)
GRI - Base 17,377
Harbert Power Fund V, LP (HPF V) 265
HCB Interests II, LP (4,219)
IMI - Base 8,069
IMP - DT 2012 and Beyond 5,763
IMP Abaca 750
Ivy Investment Vehicle LDC (SWPM) (1,626)
LaSalle Japan Logistics Fund II, LP 1
ORA Residential Investments I, LP (633)
Sacramento Venture - Base (142)
Fees Other Investment Managers
OZ Domestic Partners II, LP (8)
Other Supplementary Information (continued)
INVESTMENTINVESTMENT EXPENSES –EXPENSES – ALLALL FUNDSFUNDS (CONTINUED)(CONTINUED)
Performance FeesPerformance Fees55 (Dollars in(Dollars in Thousands)Thousands)
Equity ManagersEquity Managers Baillie Gifford Overseas, Ltd. $9,407 J.PJ.P. Morgan Investment Management, Inc.. Morgan Investment Management, Inc. 1,4291,429 TTotal Equity Managersotal Equity Managers $10,836$10,836
Fixed Income ManagersFixed Income Managers Baring International Investment Limited $373 Pacific Investment Management Co., LLCPacific Investment Management Co., LLC 2,4662,466 TTotal Fixed Income Managersotal Fixed Income Managers $2,839$2,839
RealReal Asset FundsAsset Funds AGI Resmark Housing Fund, LLCAGI Resmark Housing Fund, LLC ($121)($121) Blackstone Property Partners Europe, LP 7,583 CalEast Canada Limited PartnershipCalEast Canada Limited Partnership 44 CalEast Solstice, LLC 322 Canyon Catalyst Fund II, LLCCanyon Catalyst Fund II, LLC 2,8902,890 Canyon Johnson Urban Fund, III (61) CIM Infrastructure Fund, LPCIM Infrastructure Fund, LP (17,896)(17,896) FSP - Base 17,613 FSPFSP - DT- DT 2012 and Beyond2012 and Beyond 4,4414,441 Global Infrastructure Partners II, LP (GIP II) (6,516) Golden Reef InfrastructureGolden Reef Infrastructure TTrustrust (255)(255) GRI - Base 17,377 Harbert Gulf Pacific PowerHarbert Gulf Pacific Power, LLC (HGPP), LLC (HGPP) 10,59810,598 Harbert Power Fund V, LP (HPF V) 265 HC Green Development Fund, LPHC Green Development Fund, LP 1,7361,736 HCB Interests II, LP (4,219) IHPIHP Investment Fund III, LPInvestment Fund III, LP (663)(663) IMI - Base 8,069 IMPIMP - Base- Base 37,54737,547 IMP - DT 2012 and Beyond 5,763 IMPIMP - ICMI- ICMI 4,6684,668 IMP Abaca 750 Institutional Logistics Partners, LLCInstitutional Logistics Partners, LLC 4,8894,889 Ivy Investment Vehicle LDC (SWPM) (1,626) KC 201KC 2011, LLC1, LLC 21,54921,549 LaSalle Japan Logistics Fund II, LP 1 ORAORA Multifamily Investments I, LLCMultifamily Investments I, LLC 6,7016,701 ORA Residential Investments I, LP (633) Pacific Multifamily Investors, LLCPacific Multifamily Investors, LLC 3,3753,375 Sacramento Venture - Base (142) TTechCore, LLCechCore, LLC 5,9075,907
Fees
TTotal Realotal Real Asset FundsAsset Funds $129,916$129,916
Fees Other Investment Managers Brookside Capital Partners Fund, LPBrookside Capital Partners Fund, LP $38$38 OZ Domestic Partners II, LP (8) TTotal Other Investment Managersotal Other Investment Managers $30$30
TTotal Performance Feesotal Performance Fees $143,621$143,621
TTotal Management and Performance Feesotal Management and Performance Fees $701,737$701,737
Agenda item 6a, Attachment 1, Page 76 of 82
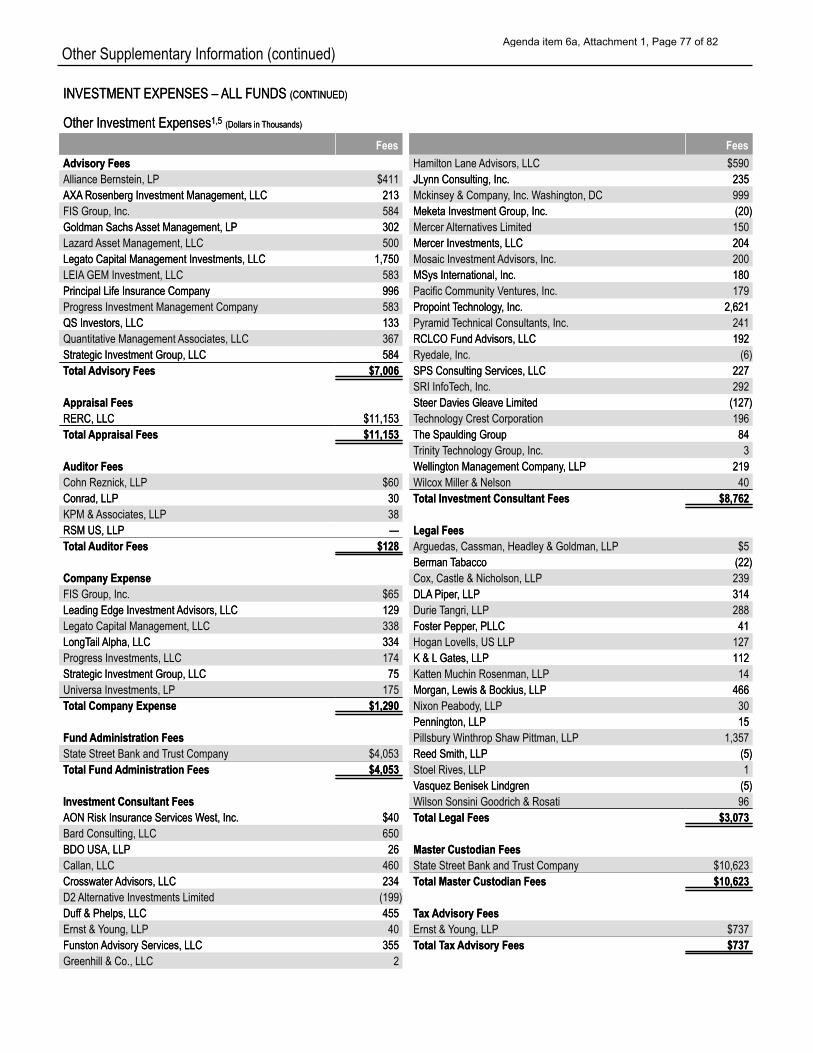
Fees
Alliance Bernstein, LP $411
FIS Group, Inc. 584
Lazard Asset Management, LLC 500
LEIA GEM Investment, LLC 583
Progress Investment Management Company 583
Quantitative Management Associates, LLC 367
Cohn Reznick, LLP $60
KPM & Associates, LLP 38
FIS Group, Inc. $65
Legato Capital Management, LLC 338
Progress Investments, LLC 174
Universa Investments, LP 175
State Street Bank and Trust Company $4,053
Bard Consulting, LLC 650
Callan, LLC 460
D2 Alternative Investments Limited (199)
Ernst & Young, LLP 40
Greenhill & Co., LLC 2
Fees Hamilton Lane Advisors, LLC $590
Mckinsey & Company, Inc. Washington, DC 999
Mercer Alternatives Limited 150
Mosaic Investment Advisors, Inc. 200
Pacific Community Ventures, Inc. 179
Pyramid Technical Consultants, Inc. 241
Ryedale, Inc. (6)
SRI InfoTech, Inc. 292
Technology Crest Corporation 196
Trinity Technology Group, Inc. 3
Wilcox Miller & Nelson 40
Arguedas, Cassman, Headley & Goldman, LLP $5
Cox, Castle & Nicholson, LLP 239
Durie Tangri, LLP 288
Hogan Lovells, US LLP 127
Katten Muchin Rosenman, LLP 14
Nixon Peabody, LLP 30
Pillsbury Winthrop Shaw Pittman, LLP 1,357
Stoel Rives, LLP 1
Wilson Sonsini Goodrich & Rosati 96
State Street Bank and Trust Company $10,623
Ernst & Young, LLP $737
Other Supplementary Information (continued)
INVESTMENTINVESTMENT EXPENSES –EXPENSES – ALLALL FUNDSFUNDS (CONTINUED)(CONTINUED)
Other Investment ExpensesOther Investment Expenses1,51,5 (Dollars in(Dollars in Thousands)Thousands)
Fees Advisory FeesAdvisory Fees Alliance Bernstein, LP $411 AXAAXA Rosenberg Investment Management, LLCRosenberg Investment Management, LLC 213213 FIS Group, Inc. 584 Goldman SachsGoldman Sachs Asset Management, LPAsset Management, LP 302302 Lazard Asset Management, LLC 500 Legato Capital Management Investments, LLCLegato Capital Management Investments, LLC 1,7501,750 LEIA GEM Investment, LLC 583 Principal Life Insurance CompanyPrincipal Life Insurance Company 996996 Progress Investment Management Company 583 QS Investors, LLCQS Investors, LLC 133133 Quantitative Management Associates, LLC 367 Strategic Investment Group, LLCStrategic Investment Group, LLC 584584 TTotalotal Advisory FeesAdvisory Fees $7,006$7,006
Appraisal FeesAppraisal Fees RERC, LLCRERC, LLC $11,153$11,153 TTotalotal Appraisal FeesAppraisal Fees $11,153$11,153
Auditor FeesAuditor Fees Cohn Reznick, LLP $60 Conrad, LLPConrad, LLP 3030 KPM & Associates, LLP 38 RSM US, LLPRSM US, LLP —— TTotalotal Auditor FeesAuditor Fees $128$128
Company ExpenseCompany Expense FIS Group, Inc. $65 Leading Edge InvestmentLeading Edge Investment Advisors, LLCAdvisors, LLC 129129 Legato Capital Management, LLC 338 LongTLongTailail Alpha, LLCAlpha, LLC 334334 Progress Investments, LLC 174 Strategic Investment Group, LLCStrategic Investment Group, LLC 7575 Universa Investments, LP 175 TTotal Company Expenseotal Company Expense $1,290$1,290
FundFund Administration FeesAdministration Fees State Street Bank and Trust Company $4,053 TTotal Fundotal Fund Administration FeesAdministration Fees $4,053$4,053
Investment Consultant FeesInvestment Consultant Fees AON Risk Insurance Services WAON Risk Insurance Services West, Inc.est, Inc. $40$40 Bard Consulting, LLC 650 BDO USA, LLPBDO USA, LLP 2626 Callan, LLC 460 CrosswaterCrosswater Advisors, LLCAdvisors, LLC 234234 D2 Alternative Investments Limited (199) DufDuff & Phelps, LLCf & Phelps, LLC 455455 Ernst & Young, LLP 40 FunstonFunston Advisory Services, LLCAdvisory Services, LLC 355355 Greenhill & Co., LLC 2
Fees Hamilton Lane Advisors, LLC $590 JLJLynn Consulting, Inc.ynn Consulting, Inc. 235235 Mckinsey & Company, Inc. Washington, DC 999 Meketa Investment Group, Inc.Meketa Investment Group, Inc. (20)(20) Mercer Alternatives Limited 150 Mercer Investments, LLCMercer Investments, LLC 204204 Mosaic Investment Advisors, Inc. 200 MSys International, Inc.MSys International, Inc. 180180 Pacific Community Ventures, Inc. 179 PropointPropoint TTechnologyechnology, Inc., Inc. 2,6212,621 Pyramid Technical Consultants, Inc. 241 RCLCO FundRCLCO Fund Advisors, LLCAdvisors, LLC 192192 Ryedale, Inc. (6) SPS Consulting Services, LLCSPS Consulting Services, LLC 227227 SRI InfoTech, Inc. 292 Steer Davies Gleave LimitedSteer Davies Gleave Limited (127)(127) Technology Crest Corporation 196 The Spaulding GroupThe Spaulding Group 8484 Trinity Technology Group, Inc. 3 WWellington Management Companyellington Management Company, LLP, LLP 219219 Wilcox Miller & Nelson 40 TTotal Investment Consultant Feesotal Investment Consultant Fees $8,762$8,762
Legal FeesLegal Fees Arguedas, Cassman, Headley & Goldman, LLP $5 BermanBerman TTabaccoabacco (22)(22) Cox, Castle & Nicholson, LLP 239 DLADLA PiperPiper, LLP, LLP 314314 Durie Tangri, LLP 288 Foster PepperFoster Pepper, PLLC, PLLC 4141 Hogan Lovells, US LLP 127 K & LK & L Gates, LLPGates, LLP 112112 Katten Muchin Rosenman, LLP 14 Morgan, Lewis & Bockius, LLPMorgan, Lewis & Bockius, LLP 466466 Nixon Peabody, LLP 30 Pennington, LLPPennington, LLP 1515 Pillsbury Winthrop Shaw Pittman, LLP 1,357 Reed Smith, LLPReed Smith, LLP (5(5)) Stoel Rives, LLP 1 VVasquez Benisek Lindgrenasquez Benisek Lindgren (5(5)) Wilson Sonsini Goodrich & Rosati 96 TTotal Legal Feesotal Legal Fees $3,073$3,073
Master Custodian FeesMaster Custodian Fees State Street Bank and Trust Company $10,623 TTotal Master Custodian Feesotal Master Custodian Fees $10,623$10,623
TTaxax Advisory FeesAdvisory Fees Ernst & Young, LLP $737 TTotal Total Taxax Advisory FeesAdvisory Fees $737$737
Agenda item 6a, Attachment 1, Page 77 of 82
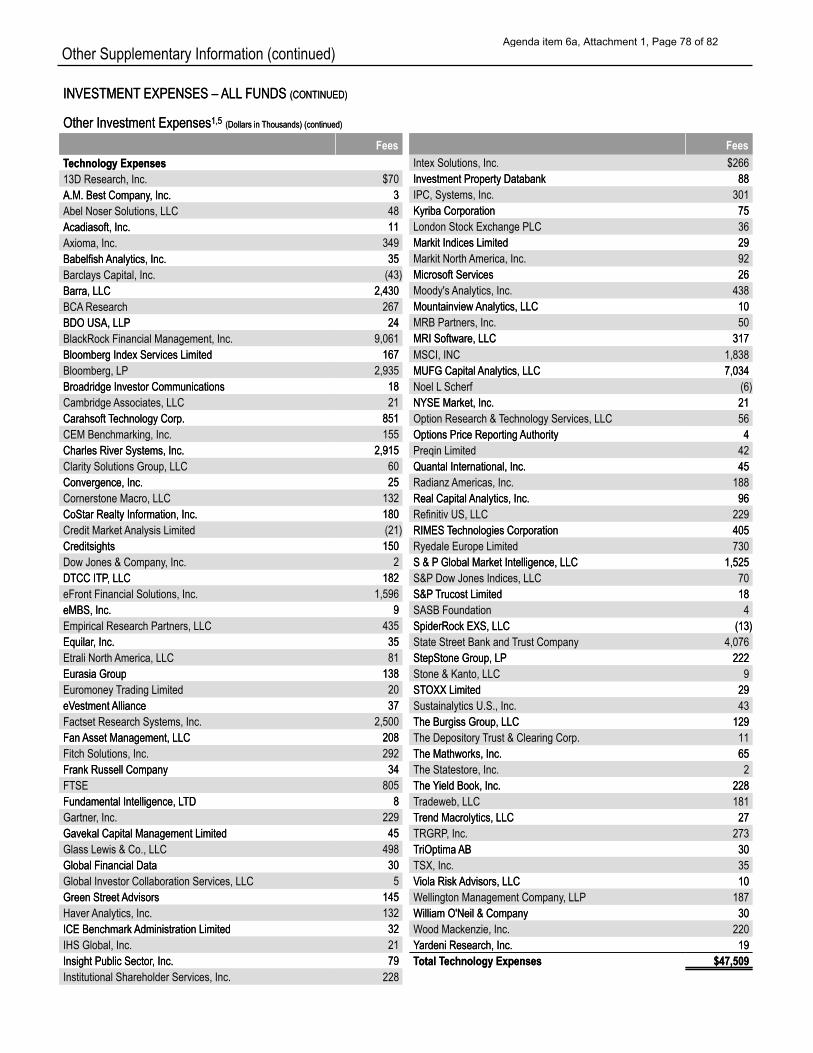
Fees
13D Research, Inc. $70
Abel Noser Solutions, LLC 48
Axioma, Inc. 349
Barclays Capital, Inc. (43)
BCA Research 267
BlackRock Financial Management, Inc. 9,061
Bloomberg, LP 2,935
Cambridge Associates, LLC 21
CEM Benchmarking, Inc. 155
Clarity Solutions Group, LLC 60
Cornerstone Macro, LLC 132
Credit Market Analysis Limited (21)
Dow Jones & Company, Inc. 2
eFront Financial Solutions, Inc. 1,596
Empirical Research Partners, LLC 435
Etrali North America, LLC 81
Euromoney Trading Limited 20
Factset Research Systems, Inc. 2,500
Fitch Solutions, Inc. 292
FTSE 805
Gartner, Inc. 229
Glass Lewis & Co., LLC 498
Global Investor Collaboration Services, LLC 5
Haver Analytics, Inc. 132
IHS Global, Inc. 21
Institutional Shareholder Services, Inc. 228
Fees Intex Solutions, Inc. $266
IPC, Systems, Inc. 301
London Stock Exchange PLC 36
Markit North America, Inc. 92
Moody's Analytics, Inc. 438
MRB Partners, Inc. 50
MSCI, INC 1,838
Noel L Scherf (6)
Option Research & Technology Services, LLC 56
Preqin Limited 42
Radianz Americas, Inc. 188
Refinitiv US, LLC 229
Ryedale Europe Limited 730
S&P Dow Jones Indices, LLC 70
SASB Foundation 4
State Street Bank and Trust Company 4,076
Stone & Kanto, LLC 9
Sustainalytics U.S., Inc. 43
The Depository Trust & Clearing Corp. 11
The Statestore, Inc. 2
Tradeweb, LLC 181
TRGRP, Inc. 273
TSX, Inc. 35
Wellington Management Company, LLP 187
Wood Mackenzie, Inc. 220
Other Supplementary Information (continued)
INVESTMENTINVESTMENT EXPENSES –EXPENSES – ALLALL FUNDSFUNDS (CONTINUED)(CONTINUED)
Other Investment ExpensesOther Investment Expenses1,51,5 (Dollars in(Dollars in Thousands) (continued)Thousands) (continued)
Fees Fees TTechnology Expensesechnology Expenses 13D Research, Inc. A.M. Best CompanyA.M. Best Company, Inc., Inc. Abel Noser Solutions, LLC Acadiasoft, Inc.Acadiasoft, Inc. Axioma, Inc. BabelfishBabelfish Analytics, Inc.Analytics, Inc. Barclays Capital, Inc. Barra, LLCBarra, LLC BCA Research BDO USA, LLPBDO USA, LLP BlackRock Financial Management, Inc. Bloomberg Index Services LimitedBloomberg Index Services Limited Bloomberg, LP Broadridge Investor CommunicationsBroadridge Investor Communications Cambridge Associates, LLC CarahsoftCarahsoft TTechnology Corp.echnology Corp. CEM Benchmarking, Inc. Charles River Systems, Inc.Charles River Systems, Inc. Clarity Solutions Group, LLC Convergence, Inc.Convergence, Inc. Cornerstone Macro, LLC CoStar Realty Information, Inc.CoStar Realty Information, Inc. Credit Market Analysis Limited CreditsightsCreditsights Dow Jones & Company, Inc. DTCC ITPDTCC ITP, LLC, LLC eFront Financial Solutions, Inc. eMBS, Inc.eMBS, Inc. Empirical Research Partners, LLC EquilarEquilar, Inc., Inc. Etrali North America, LLC Eurasia GroupEurasia Group Euromoney Trading Limited eVeVestmentestment AllianceAlliance Factset Research Systems, Inc. FanFan Asset Management, LLCAsset Management, LLC Fitch Solutions, Inc. Frank Russell CompanyFrank Russell Company FTSE Fundamental Intelligence, LFundamental Intelligence, LTDTD Gartner, Inc. Gavekal Capital Management LimitedGavekal Capital Management Limited Glass Lewis & Co., LLC Global Financial DataGlobal Financial Data Global Investor Collaboration Services, LLC Green StreetGreen Street AdvisorsAdvisors Haver Analytics, Inc. ICE BenchmarkICE Benchmark Administration LimitedAdministration Limited IHS Global, Inc. Insight Public SectorInsight Public Sector, Inc., Inc.
$70 33
48 1111
349 3535
(43) 2,4302,430
267 2424
9,061 167167
2,935 1818 21
851851 155
2,9152,915 60 2525
132 180180 (21) 150150
2 182182
1,596 99
435 3535 81
138138 20 3737
2,500 208208 292 3434
805 88
229 4545
498 3030 5
145145 132 3232 21 7979
Intex Solutions, Inc. $266 Investment Property DatabankInvestment Property Databank 8888 IPC, Systems, Inc. 301 Kyriba CorporationKyriba Corporation 7575 London Stock Exchange PLC 36 Markit Indices LimitedMarkit Indices Limited 2929 Markit North America, Inc. 92 Microsoft ServicesMicrosoft Services 2626 Moody's Analytics, Inc. 438 MountainviewMountainview Analytics, LLCAnalytics, LLC 1010 MRB Partners, Inc. 50 MRI Software, LLCMRI Software, LLC 317317 MSCI, INC 1,838 MUFG CapitalMUFG Capital Analytics, LLCAnalytics, LLC 7,0347,034 Noel L Scherf (6) NYSE Market, Inc.NYSE Market, Inc. 2121 Option Research & Technology Services, LLC 56 Options Price ReportingOptions Price Reporting AuthorityAuthority 44 Preqin Limited 42 Quantal International, Inc.Quantal International, Inc. 4545 Radianz Americas, Inc. 188 Real CapitalReal Capital Analytics, Inc.Analytics, Inc. 9696 Refinitiv US, LLC 229 RIMESRIMES TTechnologies Corporationechnologies Corporation 405405 Ryedale Europe Limited 730 S & PS & P Global Market Intelligence, LLCGlobal Market Intelligence, LLC 1,5251,525 S&P Dow Jones Indices, LLC 70 S&PS&P TTrucost Limitedrucost Limited 1818 SASB Foundation 4 SpiderRock EXS, LLCSpiderRock EXS, LLC (13)(13) State Street Bank and Trust Company 4,076 StepStone Group, LPStepStone Group, LP 222222 Stone & Kanto, LLC 9 STSTOXX LimitedOXX Limited 2929 Sustainalytics U.S., Inc. 43 The Burgiss Group, LLCThe Burgiss Group, LLC 129129 The Depository Trust & Clearing Corp. 11 The Mathworks, Inc.The Mathworks, Inc. 6565 The Statestore, Inc. 2 TheThe YYield Book, Inc.ield Book, Inc. 228228 Tradeweb, LLC 181 TTrend Macrolytics, LLCrend Macrolytics, LLC 2727 TRGRP, Inc. 273 TTriOptimariOptima ABAB 3030 TSX, Inc. 35 VViola Riskiola Risk Advisors, LLCAdvisors, LLC 1010 Wellington Management Company, LLP 187 William O'Neil & CompanyWilliam O'Neil & Company 3030 Wood Mackenzie, Inc. 220 YYardeni Research, Inc.ardeni Research, Inc. 1919 TTotal Total Technology Expensesechnology Expenses $47,509$47,509
Institutional Shareholder Services, Inc. 228
Agenda item 6a, Attachment 1, Page 78 of 82
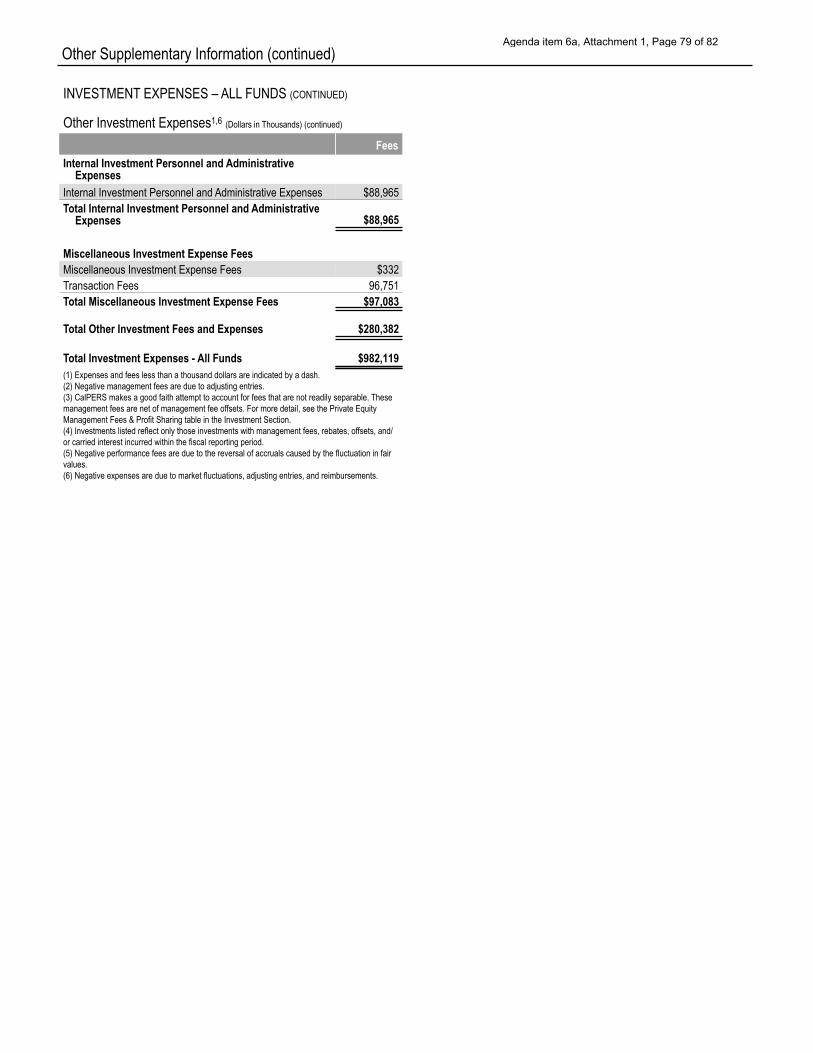
Other Supplementary Information (continued)
INVESTMENT EXPENSES – ALL FUNDS (CONTINUED)
Other Investment Expenses1,6 (Dollars in Thousands) (continued)
Fees Internal Investment Personnel and Administrative
Expenses Internal Investment Personnel and Administrative Expenses Total Internal Investment Personnel and Administrative
Expenses
$88,965
$88,965
Miscellaneous Investment Expense Fees Miscellaneous Investment Expense Fees Transaction Fees
$332 96,751
Total Miscellaneous Investment Expense Fees
Total Other Investment Fees and Expenses
Total Investment Expenses - All Funds (1) Expenses and fees less than a thousand dollars are indicated by a dash. (2) Negative management fees are due to adjusting entries.
$97,083
$280,382
$982,119
(3) CalPERS makes a good faith attempt to account for fees that are not readily separable. These management fees are net of management fee offsets. For more detail, see the Private Equity Management Fees & Profit Sharing table in the Investment Section. (4) Investments listed reflect only those investments with management fees, rebates, offsets, and/ or carried interest incurred within the fiscal reporting period. (5) Negative performance fees are due to the reversal of accruals caused by the fluctuation in fair values. (6) Negative expenses are due to market fluctuations, adjusting entries, and reimbursements.
Agenda item 6a, Attachment 1, Page 79 of 82
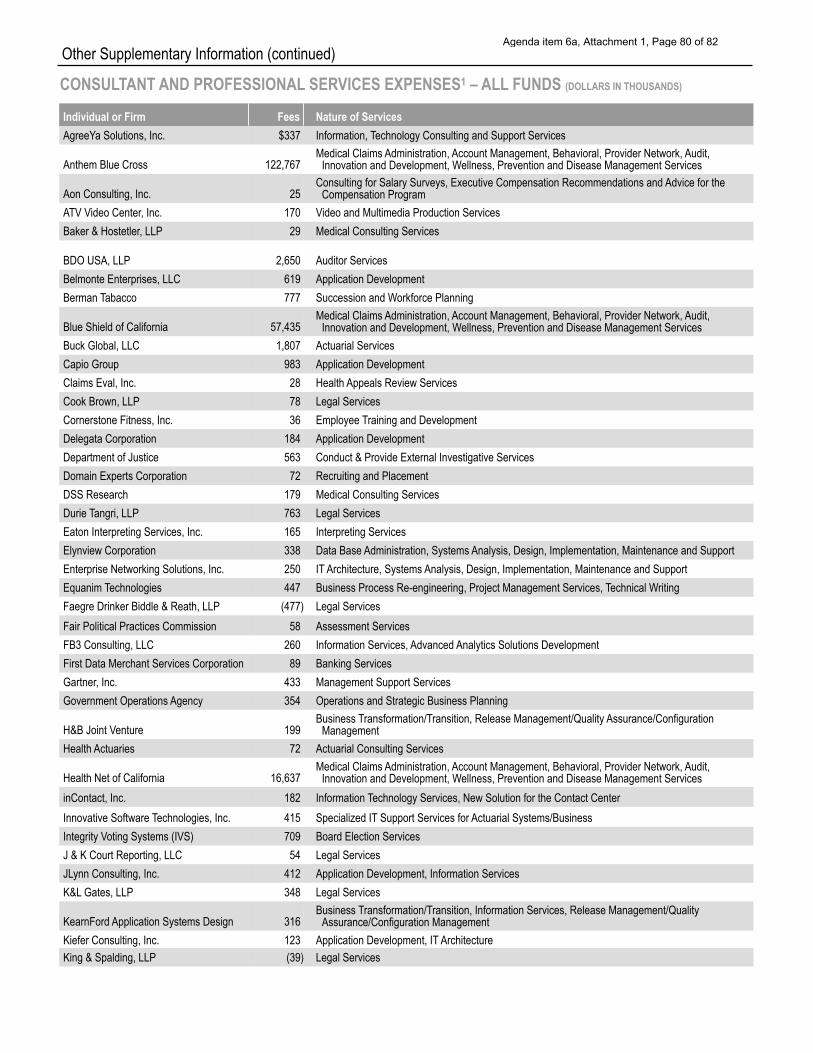
Other Supplementary Information (continued)
CONSULTANT AND PROFESSIONAL SERVICES EXPENSES1 – ALL FUNDS (DOLLARS IN THOUSANDS)
Individual or Firm Fees Nature of Services AgreeYa Solutions, Inc. $337 Information, Technology Consulting and Support Services
Medical Claims Administration, Account Management, Behavioral, Provider Network, Audit, Anthem Blue Cross 122,767 Innovation and Development, Wellness, Prevention and Disease Management Services
Consulting for Salary Surveys, Executive Compensation Recommendations and Advice for the Aon Consulting, Inc. 25 Compensation Program ATV Video Center, Inc. 170 Video and Multimedia Production Services Baker & Hostetler, LLP 29 Medical Consulting Services
BDO USA, LLP 2,650 Auditor Services Belmonte Enterprises, LLC 619 Application Development Berman Tabacco 777 Succession and Workforce Planning
Medical Claims Administration, Account Management, Behavioral, Provider Network, Audit, Blue Shield of California 57,435 Innovation and Development, Wellness, Prevention and Disease Management Services Buck Global, LLC 1,807 Actuarial Services Capio Group 983 Application Development Claims Eval, Inc. 28 Health Appeals Review Services Cook Brown, LLP 78 Legal Services Cornerstone Fitness, Inc. 36 Employee Training and Development Delegata Corporation 184 Application Development Department of Justice 563 Conduct & Provide External Investigative Services Domain Experts Corporation 72 Recruiting and Placement DSS Research 179 Medical Consulting Services Durie Tangri, LLP 763 Legal Services Eaton Interpreting Services, Inc. 165 Interpreting Services Elynview Corporation 338 Data Base Administration, Systems Analysis, Design, Implementation, Maintenance and Support Enterprise Networking Solutions, Inc. 250 IT Architecture, Systems Analysis, Design, Implementation, Maintenance and Support Equanim Technologies 447 Business Process Re-engineering, Project Management Services, Technical Writing Faegre Drinker Biddle & Reath, LLP (477) Legal Services Fair Political Practices Commission 58 Assessment Services FB3 Consulting, LLC 260 Information Services, Advanced Analytics Solutions Development First Data Merchant Services Corporation 89 Banking Services Gartner, Inc. 433 Management Support Services Government Operations Agency 354 Operations and Strategic Business Planning
Business Transformation/Transition, Release Management/Quality Assurance/Configuration H&B Joint Venture 199 Management Health Actuaries 72 Actuarial Consulting Services
Medical Claims Administration, Account Management, Behavioral, Provider Network, Audit, Health Net of California 16,637 Innovation and Development, Wellness, Prevention and Disease Management Services inContact, Inc. 182 Information Technology Services, New Solution for the Contact Center Innovative Software Technologies, Inc. 415 Specialized IT Support Services for Actuarial Systems/Business Integrity Voting Systems (IVS) 709 Board Election Services J & K Court Reporting, LLC 54 Legal Services JLynn Consulting, Inc. 412 Application Development, Information Services K&L Gates, LLP 348 Legal Services
Business Transformation/Transition, Information Services, Release Management/Quality KearnFord Application Systems Design 316 Assurance/Configuration Management Kiefer Consulting, Inc. 123 Application Development, IT Architecture King & Spalding, LLP (39) Legal Services
Agenda item 6a, Attachment 1, Page 80 of 82
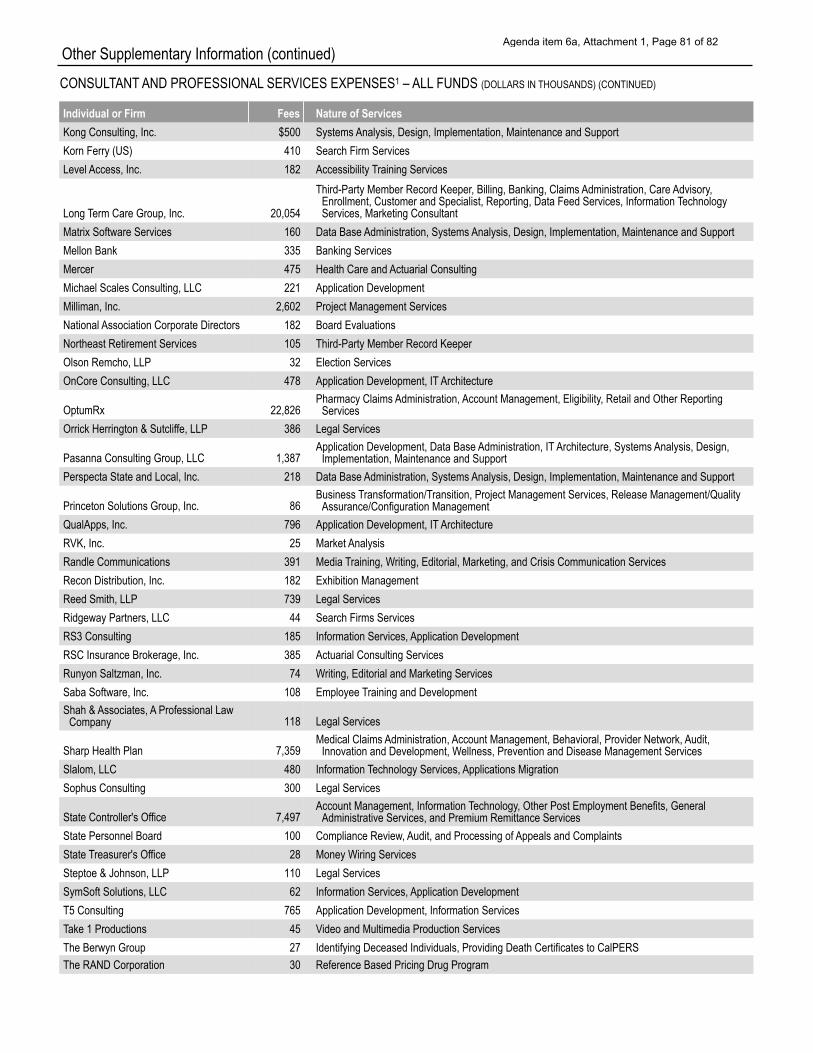
Other Supplementary Information (continued) CONSULTANT AND PROFESSIONAL SERVICES EXPENSES1 – ALL FUNDS (DOLLARS IN THOUSANDS) (CONTINUED)
Individual or Firm Fees Nature of Services Kong Consulting, Inc. $500 Systems Analysis, Design, Implementation, Maintenance and Support Korn Ferry (US) 410 Search Firm Services Level Access, Inc. 182 Accessibility Training Services
Third-Party Member Record Keeper, Billing, Banking, Claims Administration, Care Advisory, Enrollment, Customer and Specialist, Reporting, Data Feed Services, Information Technology
Long Term Care Group, Inc. 20,054 Services, Marketing Consultant Matrix Software Services 160 Data Base Administration, Systems Analysis, Design, Implementation, Maintenance and Support Mellon Bank 335 Banking Services Mercer 475 Health Care and Actuarial Consulting Michael Scales Consulting, LLC 221 Application Development Milliman, Inc. 2,602 Project Management Services National Association Corporate Directors 182 Board Evaluations Northeast Retirement Services 105 Third-Party Member Record Keeper Olson Remcho, LLP 32 Election Services OnCore Consulting, LLC 478 Application Development, IT Architecture
Pharmacy Claims Administration, Account Management, Eligibility, Retail and Other Reporting OptumRx 22,826 Services Orrick Herrington & Sutcliffe, LLP 386 Legal Services
Application Development, Data Base Administration, IT Architecture, Systems Analysis, Design, Pasanna Consulting Group, LLC 1,387 Implementation, Maintenance and Support Perspecta State and Local, Inc. 218 Data Base Administration, Systems Analysis, Design, Implementation, Maintenance and Support
Business Transformation/Transition, Project Management Services, Release Management/Quality Princeton Solutions Group, Inc. 86 Assurance/Configuration Management QualApps, Inc. 796 Application Development, IT Architecture RVK, Inc. 25 Market Analysis Randle Communications 391 Media Training, Writing, Editorial, Marketing, and Crisis Communication Services Recon Distribution, Inc. 182 Exhibition Management Reed Smith, LLP 739 Legal Services Ridgeway Partners, LLC 44 Search Firms Services RS3 Consulting 185 Information Services, Application Development RSC Insurance Brokerage, Inc. 385 Actuarial Consulting Services Runyon Saltzman, Inc. 74 Writing, Editorial and Marketing Services Saba Software, Inc. 108 Employee Training and Development Shah & Associates, A Professional Law Company 118 Legal Services
Medical Claims Administration, Account Management, Behavioral, Provider Network, Audit, Sharp Health Plan 7,359 Innovation and Development, Wellness, Prevention and Disease Management Services Slalom, LLC 480 Information Technology Services, Applications Migration Sophus Consulting 300 Legal Services
Account Management, Information Technology, Other Post Employment Benefits, General State Controller's Office 7,497 Administrative Services, and Premium Remittance Services State Personnel Board 100 Compliance Review, Audit, and Processing of Appeals and Complaints State Treasurer's Office 28 Money Wiring Services Steptoe & Johnson, LLP 110 Legal Services SymSoft Solutions, LLC 62 Information Services, Application Development T5 Consulting 765 Application Development, Information Services Take 1 Productions 45 Video and Multimedia Production Services The Berwyn Group 27 Identifying Deceased Individuals, Providing Death Certificates to CalPERS The RAND Corporation 30 Reference Based Pricing Drug Program
Agenda item 6a, Attachment 1, Page 81 of 82
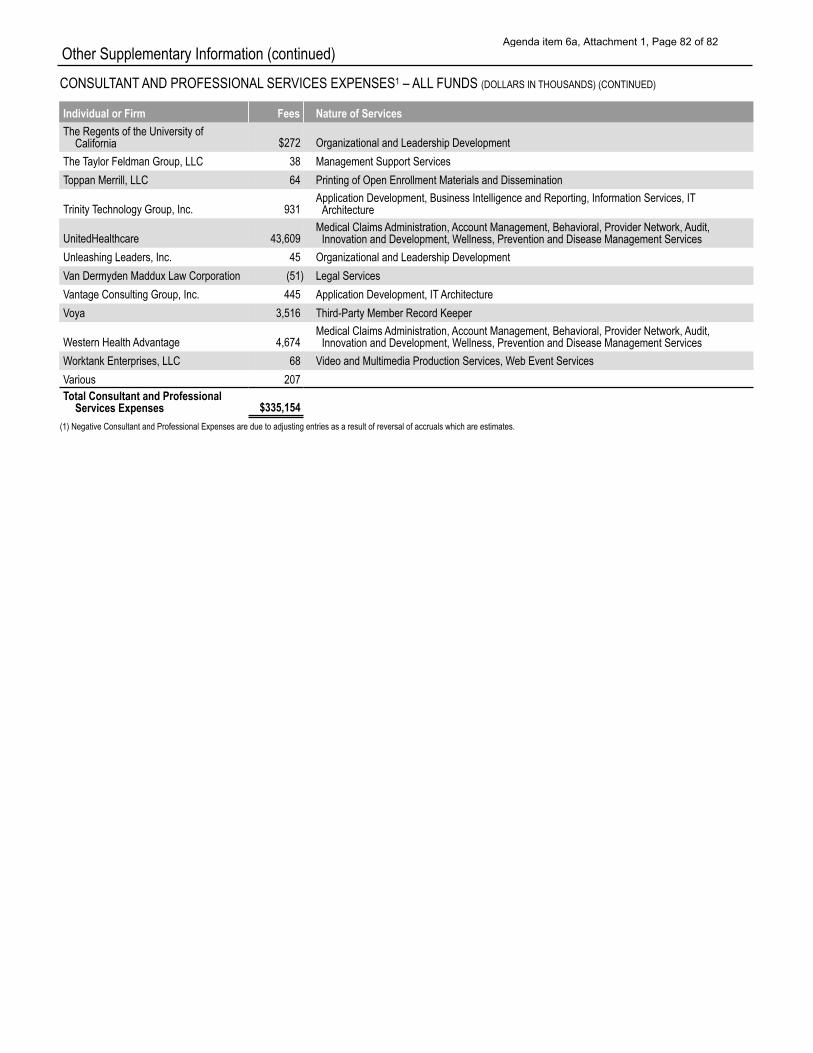
Other Supplementary Information (continued) CONSULTANT AND PROFESSIONAL SERVICES EXPENSES1 – ALL FUNDS (DOLLARS IN THOUSANDS) (CONTINUED)
Individual or Firm Fees Nature of Services The Regents of the University of
California $272 Organizational and Leadership Development The Taylor Feldman Group, LLC 38 Management Support Services Toppan Merrill, LLC 64 Printing of Open Enrollment Materials and Dissemination
Trinity Technology Group, Inc. 931 Application Development, Business Intelligence and Reporting, Information Services, IT Architecture
UnitedHealthcare 43,609 Medical Claims Administration, Account Management, Behavioral, Provider Network, Audit, Innovation and Development, Wellness, Prevention and Disease Management Services
Unleashing Leaders, Inc. 45 Organizational and Leadership Development Van Dermyden Maddux Law Corporation (51) Legal Services Vantage Consulting Group, Inc. 445 Application Development, IT Architecture Voya 3,516 Third-Party Member Record Keeper
Western Health Advantage 4,674 Medical Claims Administration, Account Management, Behavioral, Provider Network, Audit, Innovation and Development, Wellness, Prevention and Disease Management Services
Worktank Enterprises, LLC 68 Video and Multimedia Production Services, Web Event Services Various 207 Total Consultant and Professional
Services Expenses $335,154 (1) Negative Consultant and Professional Expenses are due to adjusting entries as a result of reversal of accruals which are estimates.
Agenda item 6a, Attachment 1, Page 82 of 82