Embed Size (px)
Citation preview
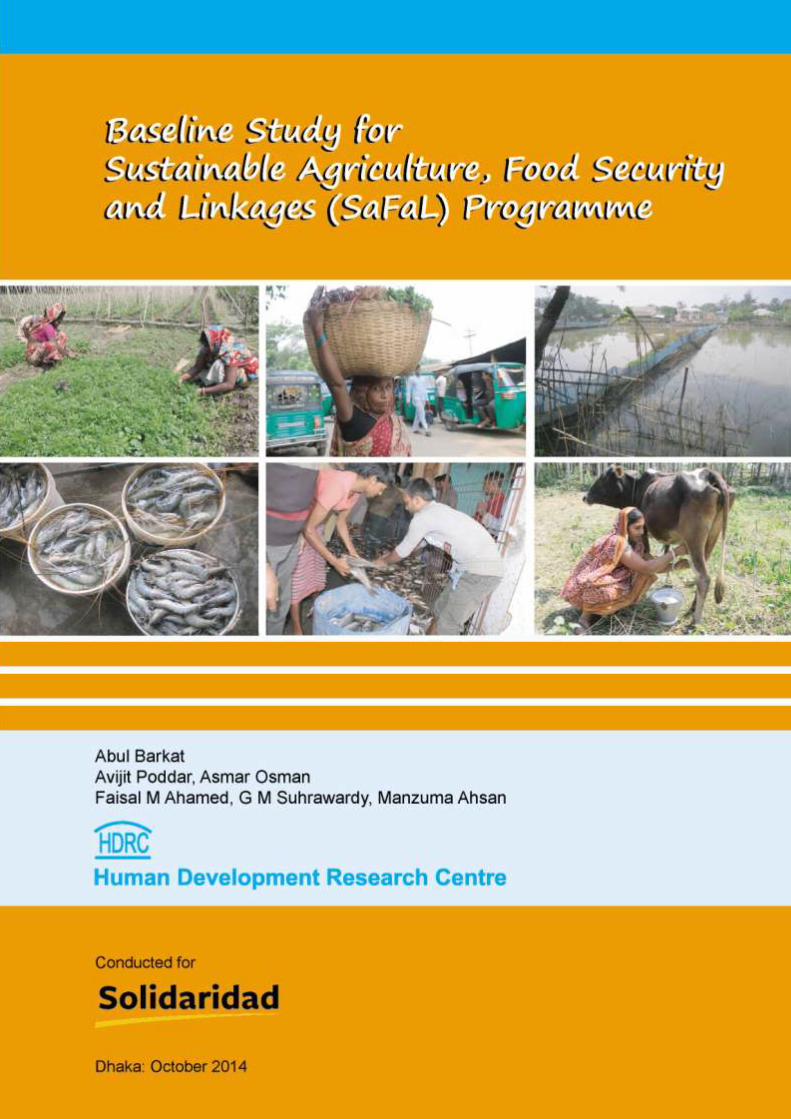
Baseline Study for
Sustainable Agriculture, Food Security
and Linkages (SaFaL) Programme
Prepared by
Abul Barkat1
Avijit Poddar2, Asmar Osman
3
Faisal M Ahamed4, G M Suhrawardy
5, Manzuma Ahsan
6
www.hdrc-bd.com
Conducted for
Dhaka: October 2014
1 Professor, Department of Economics, University of Dhaka; Chief Advisor (Hon.), HDRC & Study Team Leader
2 Director- Research, HDRC 3 Consultant, HDRC 4 Research Associate, HDRC 5 Jr. Consultant, HDRC 6 Sr. Research Associate, HDRC
ACKNOWLEDGEMENTS
Solidaridad Network Asia, in partnership with national and international stakeholders, and
the Embassy of the Kingdom of the Netherlands in Bangladesh, has started implementing the
Sustainable Agriculture, Food Security and Linkages (SaFaL) programme in the south-west
of Bangladesh. SaFaL is working towards the intensification of agricultural production in the
sub-sectors of aquaculture, dairy and horticulture. SaFaL has estimated targets against
indicators to be achieved over the project period. In order to create a benchmark, a baseline
survey is necessary to come up with baseline values for each of the targets set. Solidaridad
Network Asia awarded Human Development Research Centre (HDRC) for having carried out
the baseline Survey. The accompanying report is the outcome.
The successful administration of the Baseline Study would not have been possible without
the commitment and dedication of all those who were involved in this process.
The enthusiasm of Selim Reza Hasan (Country Manager-Bangladesh, Solidaridad Network
Asia) towards the study is highly appreciated by us. Among SaFaL team members, we are
thankful to Muhammad Shakil Anwar (Program & Partnership Manager) for his positive
support towards the study; we are particularly grateful to Md. Abir Ahmed, Monitoring and
Evaluation Specialist) for his stimulating inputs, and unstinted support at all stages of this
study; we also thank Indu Bhushan Roy (Programme Coordinator), Biplob Kumar Saha
(Monitoring and Evaluation Officer), and Meshba Uddin Ahmed (Monitoring and Evaluation
Officer) for their support.
We are indebted to all the staff members of Solidaridad who reviewed the draft report and put
their valuable comments and suggestions on that; those comments and suggestions were
highly useful in finalizing this report.
We are grateful to all the staff members of Uttaran and Jagorani Chakra Foundation for
their excellent support during our field data and information collection.
Data collection was complex. However, our field team was so trained and committed that
they finally did overcome all odds, and completed their tasks successfully. In this regard, we
are grateful to them for the commendable work done with utmost sincerity.
The in-house staff members of HDRC worked untiringly at all the stages. We thank all those
lovely and uncomplaining souls at HDRC. We are indebted to ASM Obaidur Rahman
(Systems Analyst, HDRC) for his all out efforts. We are grateful to Md. Mahfuz Ali for
editing the report. We are thankful to Ali Ahmed (Sr. Research Associate, HDRC) for his
hard work. We also thank Md. Ismail Hossain (Lecturer, Department of Sociology, Kumudini
Govt. College, Tangail) for his inputs towards the study.
Above all, we will remain ever grateful to the respondents of the survey, without whose
profound support, the implementation of the study would have been impossible.
Prof. Abul Barkat, PhD Dhaka: October 2014
Study Team Leader
&
Chief Advisor (Hon.), HDRC
Abbreviations
AIS Agricultural Information Service
BADC Bangladesh Agricultural Development Corporation
BARC Bangladesh Agricultural Research Council
BARI Bangladesh Agricultural Research Institute
BFDC Bangladesh Fisheries Development Corporation
BFRI Bangladesh Fisheries Research Institute
BINA Bangladesh Institute of Nuclear Agriculture
BJRI Bangladesh Jute Research Institute
BMDA Barind Multipurpose Development Authority
BRRI Bangladesh Rice Research Institute
BSRI Bangladesh Sugarcane Research Institute
CBO Community Based Organization
CDB Cotton Development Board
DAE Department of Agricultural Extension
DAM Department of Agricultural Marketing
DAP Diammonium Phosphate
DCI Data Collection Instrument
DLS Department of Livestock Service
DoF Department of Fisheries
FGD Focus Group Discussion
GDP Gross Domestic Product
GoB Government of Bangladesh
GR Green Revolution
HDRC Human Development Research Centre
HH Household
HYV High Yielding Variety
KG Kilo Gram
MOA Ministry of Agriculture
MOP Murite of Potash
NGO Non-Government Organization
PG Producer Group
PL Post Larva
PRA Participatory Rural Appraisal
PSF Pond Sand Filter
RA Randomly Assigned
SaFaL Sustainable Agriculture, Food Security and Linkages
SCA Seed Certification Agency
SRDI Soil Resources Development Institute
SAAO Sub-Assistant Agricultural Officer
TSP Tripple Super Phosphate
UNO Upazila Nirbahee Officer
CONTENTS
Sl. No. Title Page #
Acknowledgement
Abbreviations
Executive Summary ............................................................................................................................. i-v
CHAPTER 1: BACKGROUND, OBJECTIVES, AND METHODOLOGY ............................................... 1
1.1 Background: SaFaL Programme at a Glance ................................................................................... 1
1.2 Objectives of the Baseline Study ..................................................................................................... 1
1.3 Methodology: At a Glance ............................................................................................................... 4
1.3.1 Sampling: Strategies and design ...................................................................................................... 4
CHAPTER 2: BACKGROUND CHARACTERISTICS OF THE PRODUCER GROUP MEMBERS
AND SAMPLE HOUSEHOLDS .................................................................................................... 6
2.1 Background Characteristics of the Producer Group Members ........................................................ 6
2.1.1 Male-Female Composition ............................................................................................................... 6
2.1.2 Age Composition ............................................................................................................................. 6
2.1.3 Educational Status ............................................................................................................................ 6
2.1.4 Occupational Profile ........................................................................................................................ 6
2.2 Household Background Characteristics .......................................................................................... 7
2.2.1 Household Size ............................................................................................................................... 8
2.2.2 Sex Ratio ............................................................................................................................... 8
2.2.3 Age Composition ............................................................................................................................. 8
2.2.4 Educational Status ............................................................................................................................ 8
2.3 Annual Income of Surveyed Households......................................................................................... 8
CHAPTER 3: HOUSEHOLD ASSET OWNERSHIP ................................................................................ 9
3.1 Land-Ownership, Use, and Possession Status ................................................................................. 9
3.1.1 Land-Ownership Status .................................................................................................................... 9
3.1.2 Land Use and Possession Status ...................................................................................................... 9
3.2 Housing Pattern ............................................................................................................................. 11
3.3 Status of Livestock Ownership ...................................................................................................... 11
3.4 Household Water, Sanitation and Electrification Status ............................................................... 11
CHAPTER 4: AQUACULTURE SUB-SECTOR ...................................................................................... 12
4.1 Aquaculture: An Overall Scenario ................................................................................................. 12
4.2 Aquaculture Production ................................................................................................................ 13
4.3 Tasks Performed by the Farmers ................................................................................................... 14
4.4 Inputs Used for Aquaculture .......................................................................................................... 15
4.5 Expenditure Pattern for Aquaculture ............................................................................................. 16
4.6 Involvement of Women in Aquaculture......................................................................................... 16
4.7 Income from Aquaculture .............................................................................................................. 17
4.8 Selling of Aquaculture Products by the Farmers .......................................................................... 17
4.9 Backward and Forward Market Actors in Aquaculture ................................................................. 19
4.9.1 Backward Market ........................................................................................................................... 19
4.9.2 Forward Market ............................................................................................................................ 21
4.10. Public Services for Aquaculture .................................................................................................... 22
4.10.1 Public Services for Aquaculture .................................................................................................... 22
4.10.2 Service Receiving Status by the Aquaculture Farmers ................................................................. 24
CHAPTER 5: DAIRY SUB-SECTOR ....................................................................................................... 27
5.1 Ownership of Animals (as on survey day) ..................................................................................... 27
5.2 Cow Rearing ............................................................................................................................. 27
5.3 Milk Production ............................................................................................................................. 27
5.4 Inputs Used for Milking Cow ........................................................................................................ 28
5.5 Management of Milking Cow ....................................................................................................... 28
5.6 Milk Collection and Preservation ................................................................................................. 29
5.7 Household Awareness on Milk Production .................................................................................. 29
Sl. No. Title Page #
5.8 Expenditure Pattern for Milk Production ....................................................................................... 29
5.9 Income from Milk Production ...................................................................................................... 29
5.10 Household’s Women’s Involvement in Dairy Farm Management ............................................... 29
5.11 Constraints in Accessing Input and Selling Output ...................................................................... 30
5.12 Dairy Households’ Participation in Milk Market ......................................................................... 30
5.13 Backward and Forward Market for Dairy Sector .......................................................................... 31
5.14 Services for Dairy .......................................................................................................................... 35
5.14.1 Public Services for Dairy ............................................................................................................... 35
5.14.2 Service Receiving Status by the Dairy Groups .............................................................................. 36
CHAPTER 6: HORTICULTURE SUB-SECTOR ..................................................................................... 39
6.1 Vegetable Cultivation: an Overall Scenario................................................................................... 39
6.1.1 Vegetable Production ..................................................................................................................... 40
6.1.2 Vegetable Production Process ........................................................................................................ 42
6.1.3 Inputs Used for Vegetable Production ........................................................................................... 43
6.1.4 Expenditure Pattern for Vegetable Production .............................................................................. 45
6.1.5 Involvement of Women in Vegetable Production .......................................................................... 45
6.1.6 Income from Vegetable production ............................................................................................... 46
6.1.7 Selling Vegetables ........................................................................................................................ 46
6.2 Fruit cultivation: An Overall Scenario ........................................................................................... 48
6.2.1 Fruit Production ............................................................................................................................. 48
6.2.2 Tasks Performed by the Farmers ................................................................................................... 49
6.2.3 Inputs Used for Fruit Growing ....................................................................................................... 49
6.2.4 Selling Fruits ............................................................................................................................. 50
6.3 Backward and Forward Market Actors in Horticulture ................................................................. 50
6.3.1 Backward Market ........................................................................................................................... 51
6.3.2 Forward Market ............................................................................................................................. 53
6.4 Services for Horticulture ................................................................................................................ 55
6.4.1 Public Services for the Horticulture ............................................................................................... 55
6.4.2 Service Receiving Status by the Horticulture Farmers (focusing vegetable cultivation) .............. 58
CHAPTER 7: CROP PRODUCTION ....................................................................................................... 60
7.1 Crop Cultivation: An Overall Scenario .......................................................................................... 60
7.2 Land Usage for Crop Production .................................................................................................. 61
7.3 Crop Production ............................................................................................................................ 61
7.4 Crop Consumption and Wastage .................................................................................................. 61
7.5 Crop Sale ............................................................................................................................. 62
7.6 Income from Crop Production ...................................................................................................... 62
7.7 Expenditure for Crop Production ................................................................................................... 62
CHAPTER 8: CROPPING INTENSITY .................................................................................................... 63
8.1 Cropping Intensity: Background .................................................................................................... 63
8.2 Cropping Intensity Scenario: Findings from the Baseline Survey ................................................. 63
CHAPTER 9: SOIL QUALITY, TESTING AND CULTIVATION IN SALINE-INFILTRATED
LAND ............................................................................................................................. 65
9.1 Soil Quality ............................................................................................................................. 65
9.1.1 Knowledge about Soil Quality ....................................................................................................... 65
9.1.2 Source of Knowledge on Soil Quality .......................................................................................... 65
9.2 Soil Testing ............................................................................................................................. 65
9.3 Cultivation in Saline-Infiltrated Land ............................................................................................ 66
9.3.1 Reporting about Cultivation on Saline-Infiltrated Land ................................................................ 66
9.3.2 Knowledge about Salt-tolerant Variety.......................................................................................... 66
9.3.3 Source of Knowledge on Salt-Tolerant Varieties .......................................................................... 67
9.3.4 Use of Salt-tolerant Variety ........................................................................................................... 67
Sl. No. Title Page #
CHAPTER 10: HOUSEHOLD SAVINGS AND CREDIT STATUS ....................................................... 68
10.1 Household Savings ........................................................................................................................ 68
10.2 Household Credit .......................................................................................................................... 68
10.2.1 Sources of Credit .......................................................................................................................... 69
10.2.2 Access to Credit ............................................................................................................................ 69
10.2.3 Use of Credit ............................................................................................................................. 70
10.2.4 Demand for Credit ........................................................................................................................ 70
CHAPTER 11: DISASTER AND COPING STRATEGIES ...................................................................... 71
11.1 Recent Disaster Status.................................................................................................................... 71
11.2 Loss Due to Disaster ..................................................................................................................... 71
11.3 Crisis Coping Strategy ................................................................................................................... 72
11.4 Precautionary Measures to Combat Climate Change .................................................................... 72
CHAPTER 12: HOUSEHOLD FOOD CONSUMPTION ......................................................................... 73
12.1 Food Consumption Pattern ........................................................................................................... 73
12.2 Calorie Intake Scenario .................................................................................................................. 73
12.3 Source of Consumed Food ............................................................................................................ 74
12.4 Food Consumption Pattern among children under 5 years of age ................................................ 74
12.5 Food Consumption Pattern among Lactating Mother .................................................................... 74
12.6 Food Consumption Pattern among Pregnant Women .................................................................... 74
12.7 Food Taking Status of the Households ......................................................................................... 74
CHAPTER 13: HYGIENE AND NUTRITION ......................................................................................... 76
13.1 Hygiene: Knowledge, Sources and Practice among Women ......................................................... 76
13.1.1 Knowledge on Hygiene among Women ........................................................................................ 76
13.1.2 Sources of Knowledge on Hygiene among Women ...................................................................... 77
13.1.3 Practice of Hygiene among Women .............................................................................................. 78
13.2 Nutrition: Knowledge, Sources and Practice among Women ........................................................ 79
13.2.1 Knowledge on Nutrition among Women ....................................................................................... 79
13.2.2 Sources of Knowledge on Nutrition among Women ...................................................................... 80
13.2.3 Practice of Nutrition among Women ............................................................................................. 80
13.3 Hygiene and Nutrition Issues among School Going Children ....................................................... 81
13.3.1 Hygiene: Knowledge and Practice among School Going Children ............................................... 82
13.3.2 Nutrition: Knowledge and Practice among School going Children ............................................... 84
CHAPTER 14: WOMEN’S ROLE IN HOUSEHOLD DECISION MAKING ......................................... 87
14.1 Business Operation Aspect ............................................................................................................ 87
14.2 Farming Aspects ........................................................................................................................... 87
14.3 Financial Control Aspect ............................................................................................................... 87
14.4 Social Life Aspects ....................................................................................................................... 89
14.5 Household Level Decision Making Aspects .................................................................................. 89
CHAPTER 15: ROLE OF LANDLESS GROUPS IN AGRICULTURE .................................................. 90
15.1 Background of the Landless Groups .............................................................................................. 90
15.2 Role of landless groups in farming activities ................................................................................. 91
15.3 Role of Landless Groups in Selling Farm Products ....................................................................... 95
15.4 Training of the Landless Groups in Farming Activities................................................................. 97
15.5 Accessibility to Loans among the Landless Groups ...................................................................... 98
References ............................................................................................................................. 99
List of Figures and Map
Figure 2.1: Male-female composition among the PG members by sub-sector (%) ................................ 6
Figure 2.2: Household size ..................................................................................................................... 8
Figure 2.3: Sex ratio ............................................................................................................................... 8
Figure 2.4: Annual average net income of the surveyed households (in Taka) ...................................... 8
Figure 3.1: Household Typology by Land Ownership ........................................................................... 9
Sl. No. Title Page #
Figure 4.1: Percentage of households culturing different type of fish (multiple responses) ................. 12
Figure 4.2: Fish productivity (ton per hectare) by type of fish ............................................................. 13
Figure 4.3: Percentage of households by tasks performed during fish culture .................................... 15
Figure 4.4: Average wage rate for aquaculture related work by male-female (Tk/day) ...................... 17
Figure 4.5: Problems in selling aquaculture products (multiple responses) ......................................... 18
Figure 4.6: Backward market of aquaculture ........................................................................................ 19
Figure 4.7: Forward market of aquaculture .......................................................................................... 21
Figure 4.8: Percentage distribution of service recipients by type of services ..................................... 24
Figure 4.9: Percentage distribution of reported service providers by the respondents ....................... 25
Figure 4.10: Average score given for service receiving on aquaculture (on a scale of 1 to 10;
1= Most dissatisfied; 10= Highly satisfied) ....................................................................... 26
Figure 5.1: Value chain map of Dairy milk products ........................................................................... 34
Figure 5.2: Average score given for service receiving on vegetable production (on a scale of 1 to
10; 1= Most dissatisfied; 10= Highly satisfied) ................................................................ 38
Figure 6.1: Percentage of households cultivating different type of vegetable (multiple responses) .... 39
Figure 6.2: Percentage of households cultivate vegetable in gher ....................................................... 39
Figure 6.3: Vegetable production (in ton/hectare) ................................................................................ 40
Figure 6.4: Percentage of consumption, wastage, and selling of vegetables (compared to total
production) ......................................................................................................................... 41
Figure 6.5: Percentage of households by tasks performed for vegetable cultivation (multiple
responses) .......................................................................................................................... 43
Figure 6.6: Average wage rate for vegetable production related work by sex (Tk/day) ....................... 46
Figure 6.7: Percentage distribution of vegetable selling point (multiple responses) ........................ 46
Figure 6.8: Percentage distribution of vegetable buyers (multiple responses) .................................... 47
Figure 6.9: Problems in selling vegetables (multiple responses) ......................................................... 47
Figure 6.10: Percentage of Consumption, Wastage, and Selling of fruits (compared to total
production) ........................................................................................................................ 49
Figure 6.11: Backward market of Horticulture ....................................................................................... 53
Figure 6.12: Forward market of Horticulture .......................................................................................... 55
Figure 6.13: Average score given for service receiving on vegetable production (on a scale of 1 to
10; 1= Most dissatisfied; 10= Highly satisfied) ................................................................ 59
Figure 7.1: Households cultivating different type of crops ................................................................... 60
Figure 7.2: Household average land usage (in decimal) for different type of crops production ........... 61
Figure 7.3: Expenditure for crop production ........................................................................................ 62
Figure 8.1: Cropping intensity ............................................................................................................. 63
Figure 9.1: Knowledge about soil quality (%) ...................................................................................... 65
Figure 9.2: Respondents' reporting about ever cultivation on land which has salinity problem (%) .... 66
Figure 9.3: Respondents knowledge about salt-tolerant varieties (%) ................................................. 67
Figure 11.1: Percentage distribution of effects of disasters on household resources and livelihoods .... 71
Figure 11.2: Percentage distribution of coping Strategy against natural disaster (%) ............................ 72
Figure 12.1: Percentage distribution of households by calorie intake .................................................... 73
Figure 13.1: Percentage distribution of women reporting about knowledge on various hygiene
indicators ........................................................................................................................... 77
Figure 13.2: Percentage distribution of women reporting about the source of knowledge on hygiene
issues ............................................................................................................................. 77
Figure 13.3: Percentage distribution of women reporting about practices on various hygiene
indicators ............................................................................................................................ 79
Figure 13.4: Percentage distribution of women reporting about knowledge on various nutrition
indicators ............................................................................................................................ 80
Figure 13.5: Percentage distribution of women reporting about the source of knowledge on hygiene
issues ............................................................................................................................. 80
Sl. No. Title Page #
Figure 13.6: Percentage distribution of women reporting about practice on various nutrition
indicators ........................................................................................................................... 81
Figure 15.1: ‘Collection system’ procedure among milk sellers of Narail Sadar (Narail) .................... 96
Map 1.1: Intervention unions under SaFaL programme ..................................................................... 2
List of Tables
Table 1.1: The Projects Upazilas: At a Glance ...................................................................................... 3
Table 1.2: Information on study respondents and participants .............................................................. 5
Table 3.1: Land possession status of households (% of households owning and operating different
category of land) ................................................................................................................. 10
Table 3.2: Average land ownership and operating size (in decimal) of households .......................... 10
Table 4.1: Combination of culture of SaFaL focused species among households (in percentage) ..... 12
Table 4.2: Status of tasks and doable reported by Upazila Fisheries Officers .................................... 23
Table 5.1: Milk production related scenario ........................................................................................ 28
Table 5.2: Status of tasks and suggested doable reported by the Upazila Livestock Officers ............. 35
Table 5.3: Status of tasks and suggested doable reported by the Veterinary Surgeons ....................... 36
Table 6.1: Status of tasks and doable suggested by the Upazila Agriculture Officers ........................ 56
Table 10.1: Percentage distribution of reported household savings ...................................................... 68
Table 14.1: Percentage of women involvement in household’s decision making process .................... 88
Table 15.1: Activity preferences among the landless groups of Lohagora (Narail) based on
Bengali months ................................................................................................................... 94
List of Boxes
Box 1.1: Selection of control area and households Participants ......................................................... 4
Box 2.1: Background Characteristics of the Focus Group Discussion Participants ............................ 7
Box 2.2: Status of households’ involvement in type of activity ......................................................... 7
Box 4.1: FGD findings regarding inputs for aquaculture .................................................................. 16
Box 4.2: Mandates of the Department of Fisheries (DoF) ................................................................ 23
Box 4.3: Services for the aquaculture farmers .................................................................................. 24
Box 5.1: Problems in Accessing Dairy inputs stated by the FGD participants ................................. 30
Box 5.2: Services for dairy activities ................................................................................................ 36
Box 6.1: Findings from FGDs with Horticulture PG members ........................................................ 45
Box 6.2: Services for the horticulture farmers (focusing vegetable cultivation) .............................. 58
Box 8.1: Cropping intensity decreases by increase of plot size ........................................................ 64
Box 10.1: Constraints in Accessing Credit (exposed from FGDs) ..................................................... 69
Box 10.2: Credit agencies in the intervention area (explored from the KIIs) ..................................... 69
Box 10.3: Recovery rate (explored from the KIIs) ............................................................................. 69
Box 15.1: Types of activities in which the milk seller (dairy or milk production) among the
landless groups are involved .............................................................................................. 93
Box 15.2: ‘Unit system’ procedure among milk sellers of Narail Sadar (Narail) ............................... 96
Annexure
Annex 1: Data Tables ............................................................................................................... 100-161
Annex 2: SaFaL Upazila Tables and Brief Analysis ................................................................. 162-175
Annex 3: Data Collection Instruments ..................................................................................... 176-253
Executive Summary
Solidaridad Network Asia in partnership with national and international stakeholders, and the
Embassy of the Kingdom of the Netherlands in Bangladesh have started implementing the
Sustainable Agriculture, Food Security and Linkages (SaFaL) programme in the south-west
of Bangladesh. SaFaL works towards intensification of agricultural production in the sub-
sectors of aquaculture, dairy, and horticulture. A number of 56,938 farm households are
brought under interventions. SaFaL has formed Producer Groups (PG) with members of each
of the three sub-sectors. One group consists of around 50 households. One potential member
of each of the target households has become member of the PG. A 37% PG members are
female. SaFaL is working in 69 unions (including part of a Paurasava of Narail Sadar) under
13 upazilas from 5 districts in Bangladesh (i.e., Khulna, Bagerhat, Satkhira, Jessore, and
Narail). The objective of this study is to provide baseline data so that assessment as well as
dynamic analysis can be made in future. The design is “Pre-test-Post-test Intervention-
Control group Design.” Sample size of households is adequate to represent intervention and
control groups; as well as three sub-sectors (i.e., aquaculture, dairy, and horticulture).
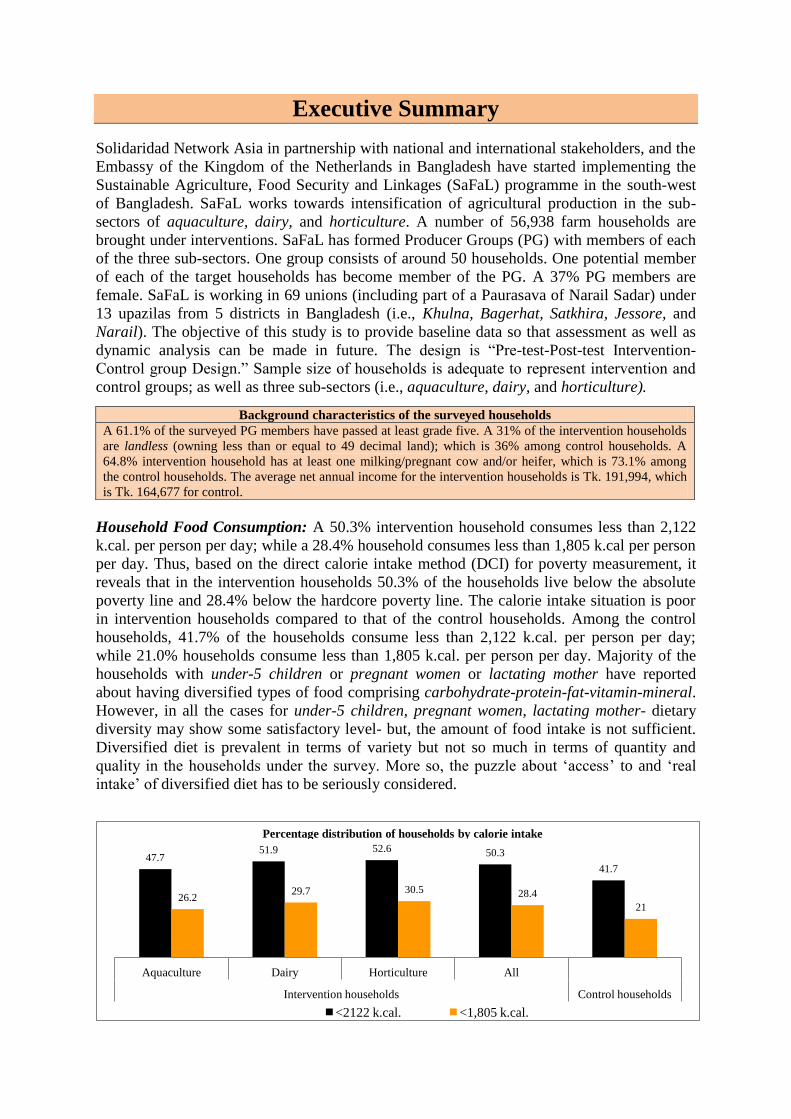
Household Food Consumption: A 50.3% intervention household consumes less than 2,122
k.cal. per person per day; while a 28.4% household consumes less than 1,805 k.cal per person
per day. Thus, based on the direct calorie intake method (DCI) for poverty measurement, it
reveals that in the intervention households 50.3% of the households live below the absolute
poverty line and 28.4% below the hardcore poverty line. The calorie intake situation is poor
in intervention households compared to that of the control households. Among the control
households, 41.7% of the households consume less than 2,122 k.cal. per person per day;
while 21.0% households consume less than 1,805 k.cal. per person per day. Majority of the
households with under-5 children or pregnant women or lactating mother have reported
about having diversified types of food comprising carbohydrate-protein-fat-vitamin-mineral.
However, in all the cases for under-5 children, pregnant women, lactating mother- dietary
diversity may show some satisfactory level- but, the amount of food intake is not sufficient.
Diversified diet is prevalent in terms of variety but not so much in terms of quantity and
quality in the households under the survey. More so, the puzzle about ‘access’ to and ‘real
intake’ of diversified diet has to be seriously considered.
Background characteristics of the surveyed households
A 61.1% of the surveyed PG members have passed at least grade five. A 31% of the intervention households
are landless (owning less than or equal to 49 decimal land); which is 36% among control households. A
64.8% intervention household has at least one milking/pregnant cow and/or heifer, which is 73.1% among
the control households. The average net annual income for the intervention households is Tk. 191,994, which
is Tk. 164,677 for control.
47.7 51.9 52.6 50.3
41.7
26.2 29.7 30.5 28.4
21
Aquaculture Dairy Horticulture All
Intervention households Control households
<2122 k.cal. <1,805 k.cal.
Percentage distribution of households by calorie intake
HDRC
Baseline Study for Sustainable Agriculture, Food Security and Linkages (SaFaL) Programme
ii
Household Savings and Credit Status: About half of the households (52.2% of intervention
and 48.5% of control) did not have any savings at the day of interview. Percentage of
households having savings in samiti (NGOs and cooperatives combinedly) remains relatively
high among both intervention and control households (25.3% and 35.4% respectively). The
average amount of household savings among intervention group is Tk. 14,594 which is Tk.
12,944 for control group. A 45.5% intervention household has access to credit, which is
54.5% among control households. A 23% household among intervention group has access to
formal credit market, which is 15.7% in the control group.
Disaster and Coping Strategies: During the last five years, 53.6% intervention households
were affected by natural disasters; which was 19.1% among control households. Heavy rain
is the predominant disaster for the intervention households, while it is cyclone for the control
group. Flood remains as the second natural evil for the intervention households. Agricultural
losses are more severe in the intervention households than that in the control. Borrowings
from relatives and friends is the leading disaster coping strategy for the intervention
households.
Women’s Role in Household Decision Making: In terms of taking decisions on business
operation aspect, the majority women take decisions jointly with their husbands (50.7% in
intervention and 48.1% in control households). Only a 5% woman can take such decision
alone, which is slightly higher among the women in control households (10.5%). Women
have almost no role in deciding about purchasing lands, irrespective of intervention and
control households (respectively 2.8% and 3.8%). Other indicators depict an identical pattern.
Hygiene and Nutrition: The knowledge and practice level of hygiene and nutrition issues
among women shows significant gaps. A 58.3% women in the intervention households
opined that vegetables should be washed before cutting; while only 18% women reportedly
practiced it. A 75% woman among intervention households opined that, newborn babies
should be exclusively breastfed up to six months; while reported practice level is 55.2%.
Other indicators show a similar pattern of wide gaps between knowledge and practice level.
Soil Quality, Soil Testing and Cultivation in Saline-Infiltrated Land: Only 29.2%
intervention households have some knowledge about soil quality; which is 20.4% among
control. Almost no farmers (both among intervention and control households) have arranged
soil-testing on their plots. Around one-fourth households (26.5% among intervention and
26.2% control households) have reported ever cultivating the land which had salinity
problems. Only 5.6% intervention households have knowledge about salt-tolerant varieties;
which is 9.3% among control households. The use rate of salt-tolerant varieties is
insignificant.
Cropping Intensity: The cropping intensity, both among the intervention and control groups,
is less than the national average. The cropping intensity is 105% among the intervention
group; which is 117.3% among control. While, according to National official statistics (2013)
cropping intensity is 191% in Bangladesh.
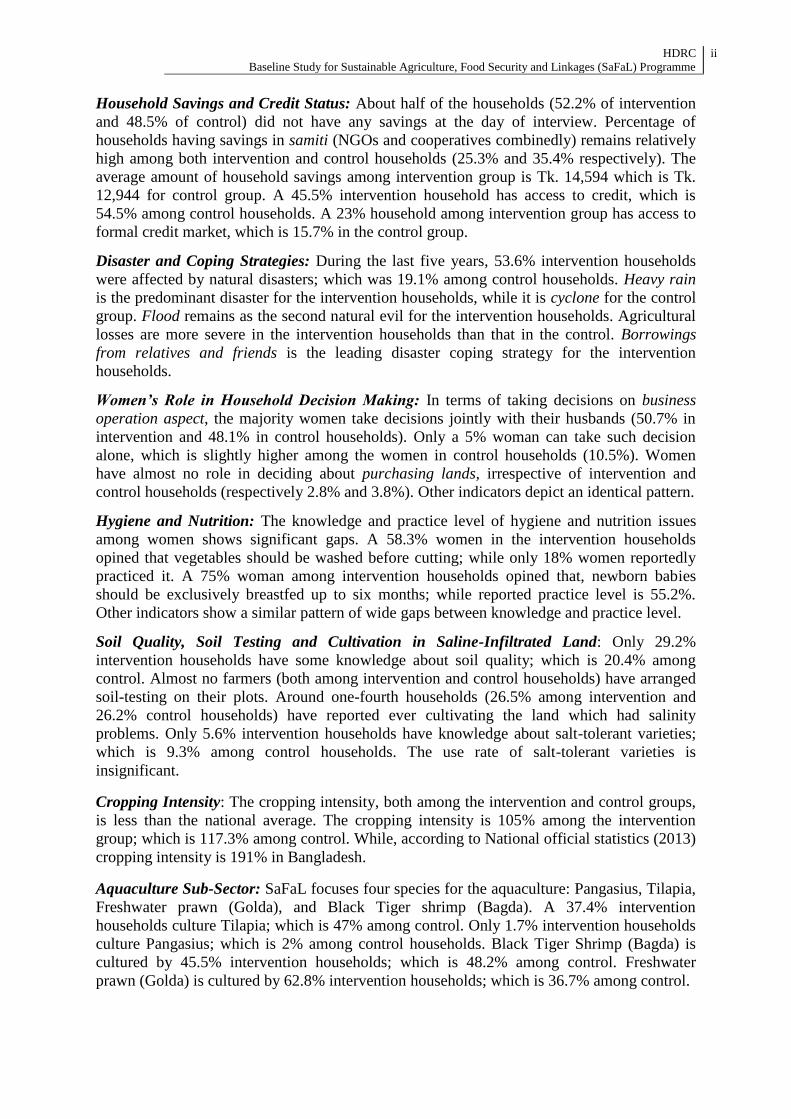
Aquaculture Sub-Sector: SaFaL focuses four species for the aquaculture: Pangasius, Tilapia,
Freshwater prawn (Golda), and Black Tiger shrimp (Bagda). A 37.4% intervention
households culture Tilapia; which is 47% among control. Only 1.7% intervention households
culture Pangasius; which is 2% among control households. Black Tiger Shrimp (Bagda) is
cultured by 45.5% intervention households; which is 48.2% among control. Freshwater
prawn (Golda) is cultured by 62.8% intervention households; which is 36.7% among control.
HDRC
Baseline Study for Sustainable Agriculture, Food Security and Linkages (SaFaL) Programme
iii
A 31.3% intervention households culture Tilapia, Golda, and Bagda at the same time; which
rate is also the same for the combination of Golda and Bagda.
A 0.30 ton of Black Tiger Shrimp (Bagda) is produced per hectare by the intervention
households, which is 0.25 ton per hectare among the control households. A 0.20 ton of
Freshwater Prawn (Golda) is produced per hectare by the intervention households, which is
0.22 ton per hectare among the control households. Tilapia, Pangasius, and Carp
productivity among the intervention households is 3.06 ton per hectare; which is 4.27 ton per
hectare among control households. On average, an intervention household produces 0.67 ton
of aquaculture products in each hectare, which is 0.81 ton for control households. The
proportion of wastage to the total production of aquaculture products from the time of
harvesting to selling is not significant.
Almost not a single household takes any measures or steps before preserving and/or selling
fish. The supply-chain actors reported use of harmful medicines and/or substances mostly by
the forward market actors; not by the producers.
A 54.5% intervention household cannot collect quality fingerlings/post larva; and, 38.1% do
not feed fish regularly. Almost no farmer buys/collects inputs for aquaculture in a group.
Women’s participation in aquaculture is low at only 10% of total involvement in terms of
person-days. The average daily wage rate for female day-laborer involved in aquaculture is
much less than that of the male workers, irrespective of intervention and control groups (Tk.
115 for female versus Tk. 200 for male).
A 33.7% intervention household sell aquaculture products to upazila/zila level market;
followed by union level market (24.3%), farm gate (22.7%), and local market (17.2%). A
36.3% of the intervention households have reported that they do not get reasonable price for
their aquaculture products. Almost no farmer sells aquaculture products collectively.
The average net annual income among Aquaculture PG group is Tk. 238,743, of which
69.9% comes from aquaculture.
The Upazila Fisheries Officer provides public services with shortage of logistics and trained
human resources. There is lack of a formal coordination mechanism with other relevant
stakeholders (e.g., NGOs), as well as with the private sector actors. A 50.1% aquaculture PG
member does not receive any of the relevant services from anywhere while doing
aquaculture.
46.2
2
48.2
36.7
72.1
43.8
42.2
53.4
16.7
37.4
1.7
45.5
62.8
67.5
23.4
37.4
55.4
25.1
Tilapia
Pangasius
Black Tiger Shrimp (Bagda)
Freshwater prawn (Galda)
Rui
Mrigal
Catla
Carp
Others
Percentage of households culturing different type of fish
(multiple responses)
Intervention households Control households
HDRC
Baseline Study for Sustainable Agriculture, Food Security and Linkages (SaFaL) Programme
iv
Dairy Sub-Sector: At the day of household survey, it was found that a 64.8% intervention
household had at least one milking/pregnant cow and/or a heifer, which was 73.1% among
the control households. Among the Dairy PG, this same was 96.8%.
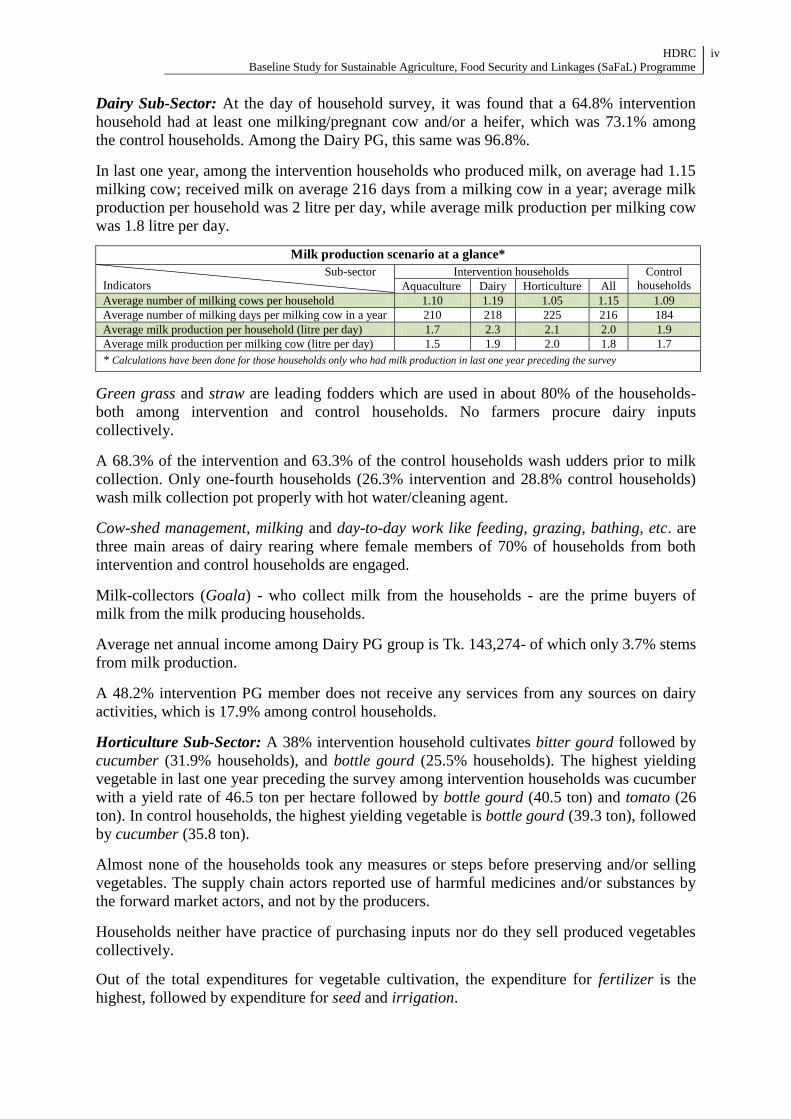
In last one year, among the intervention households who produced milk, on average had 1.15
milking cow; received milk on average 216 days from a milking cow in a year; average milk
production per household was 2 litre per day, while average milk production per milking cow
was 1.8 litre per day.
Milk production scenario at a glance*
Sub-sector
Indicators
Intervention households Control
households Aquaculture Dairy Horticulture All
Average number of milking cows per household 1.10 1.19 1.05 1.15 1.09
Average number of milking days per milking cow in a year 210 218 225 216 184
Average milk production per household (litre per day) 1.7 2.3 2.1 2.0 1.9
Average milk production per milking cow (litre per day) 1.5 1.9 2.0 1.8 1.7
* Calculations have been done for those households only who had milk production in last one year preceding the survey
Green grass and straw are leading fodders which are used in about 80% of the households-
both among intervention and control households. No farmers procure dairy inputs
collectively.
A 68.3% of the intervention and 63.3% of the control households wash udders prior to milk
collection. Only one-fourth households (26.3% intervention and 28.8% control households)
wash milk collection pot properly with hot water/cleaning agent.
Cow-shed management, milking and day-to-day work like feeding, grazing, bathing, etc. are
three main areas of dairy rearing where female members of 70% of households from both
intervention and control households are engaged.
Milk-collectors (Goala) - who collect milk from the households - are the prime buyers of
milk from the milk producing households.
Average net annual income among Dairy PG group is Tk. 143,274- of which only 3.7% stems
from milk production.
A 48.2% intervention PG member does not receive any services from any sources on dairy
activities, which is 17.9% among control households.
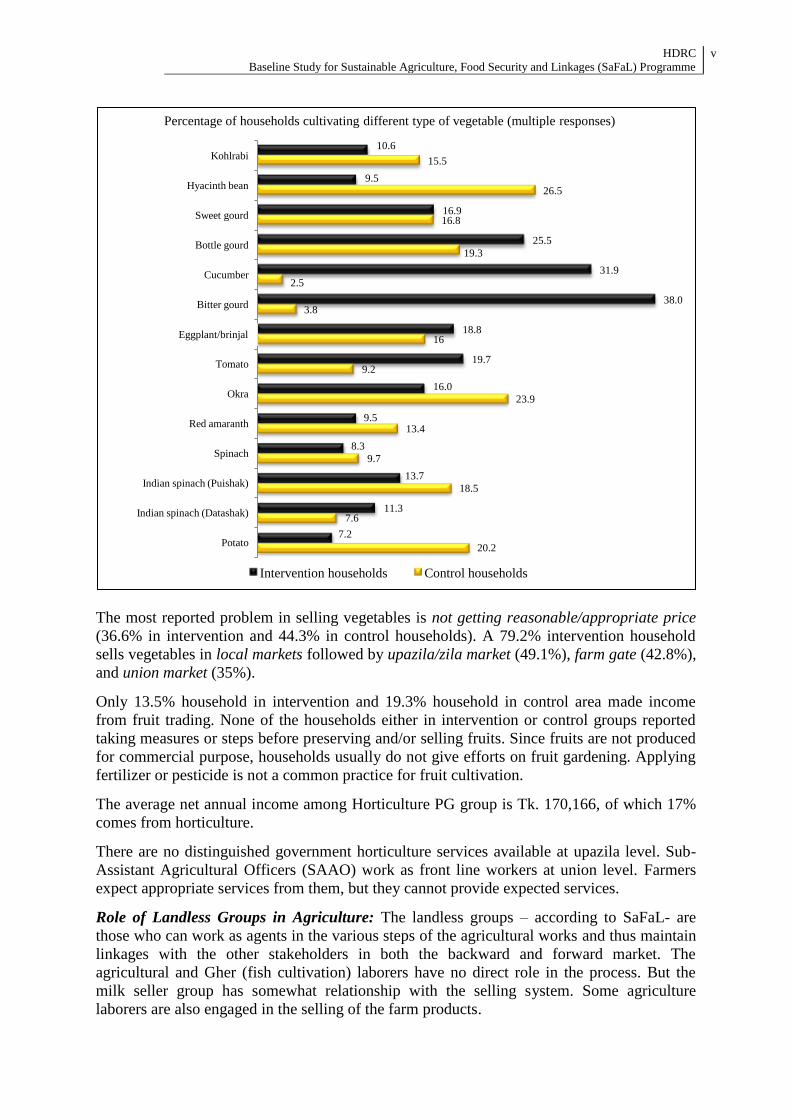
Horticulture Sub-Sector: A 38% intervention household cultivates bitter gourd followed by
cucumber (31.9% households), and bottle gourd (25.5% households). The highest yielding
vegetable in last one year preceding the survey among intervention households was cucumber
with a yield rate of 46.5 ton per hectare followed by bottle gourd (40.5 ton) and tomato (26
ton). In control households, the highest yielding vegetable is bottle gourd (39.3 ton), followed
by cucumber (35.8 ton).
Almost none of the households took any measures or steps before preserving and/or selling
vegetables. The supply chain actors reported use of harmful medicines and/or substances by
the forward market actors, and not by the producers.
Households neither have practice of purchasing inputs nor do they sell produced vegetables
collectively.
Out of the total expenditures for vegetable cultivation, the expenditure for fertilizer is the
highest, followed by expenditure for seed and irrigation.
HDRC
Baseline Study for Sustainable Agriculture, Food Security and Linkages (SaFaL) Programme
v
10.6
9.5
16.9
25.5
31.9
38.0
18.8
19.7
16.0
9.5
8.3
13.7
11.3
7.2
15.5
26.5
16.8
19.3
2.5
3.8
16
9.2
23.9
13.4
9.7
18.5
7.6
20.2
Kohlrabi
Hyacinth bean
Sweet gourd
Bottle gourd
Cucumber
Bitter gourd
Eggplant
Tomato
Okra
Red amaranth
Spinach
Indian spinach (Puishak)
Indian spinach (Datashak)
Potato
Intervention households Control households
Percentage of households cultivating different type of vegetable (multiple responses)
Eggplant/brinjal
The most reported problem in selling vegetables is not getting reasonable/appropriate price
(36.6% in intervention and 44.3% in control households). A 79.2% intervention household
sells vegetables in local markets followed by upazila/zila market (49.1%), farm gate (42.8%),
and union market (35%).
Only 13.5% household in intervention and 19.3% household in control area made income
from fruit trading. None of the households either in intervention or control groups reported
taking measures or steps before preserving and/or selling fruits. Since fruits are not produced
for commercial purpose, households usually do not give efforts on fruit gardening. Applying
fertilizer or pesticide is not a common practice for fruit cultivation.
The average net annual income among Horticulture PG group is Tk. 170,166, of which 17%
comes from horticulture.
There are no distinguished government horticulture services available at upazila level. Sub-
Assistant Agricultural Officers (SAAO) work as front line workers at union level. Farmers
expect appropriate services from them, but they cannot provide expected services.
Role of Landless Groups in Agriculture: The landless groups – according to SaFaL- are
those who can work as agents in the various steps of the agricultural works and thus maintain
linkages with the other stakeholders in both the backward and forward market. The
agricultural and Gher (fish cultivation) laborers have no direct role in the process. But the
milk seller group has somewhat relationship with the selling system. Some agriculture
laborers are also engaged in the selling of the farm products.