Embed Size (px)
Citation preview

Baseline emission projections for the EU-27
Results from the EC4MACS project and
work plan for the TSAP revision
Markus AmannInternational Institute for Applied Systems Analysis (IIASA)
2nd meeting of the DG-ENV SEG Stakeholder Group
Brussels, January 19-20, 2012

The EC4MACS baseline emission projection
PRIMES REF 2010 + CAPRI 2010 scenarios
• EC4MACS employs recent EU-wide consistent activity projections (i.e., PRIMES 2010, CAPRI)
• EC4MACS assumes compliance with EU climate and renewable targets (i.e., PRIMES 2010), and current air pollution control legislation
• -13% GHGs in 2020, -17% GHGs in 2030 relative to 2005
• NH3 would increase by ~7%
• Other air pollutants decrease, even after 2020
• In 2020, the baseline would meet TSAP targets for PM, ozone and acidification, but not for eutrophication
0%
20%
40%
60%
80%
100%
120%
2005 2010 2015 2020 2025 2030
Emis
sion
s re
lativ
e to
200
5
SO2NOxPM2.5NH3VOCAll GHGs

0
1
2
3
4
5
6
7
8
9
10
2005 2010 2015 2020 2025 2030
Mt V
OC
PRIMES 2010
National scenarios0.0
0.5
1.0
1.5
2.0
2.5
3.0
3.5
4.0
4.5
2005 2010 2015 2020 2025 2030
Mt N
H3
PRIMES 2010
National scenarios0
0.2
0.4
0.6
0.8
1
1.2
1.4
1.6
1.8
2005 2010 2015 2020 2025 2030
Mt P
M2.
5
PRIMES 2010
National scenarios0
1
2
3
4
5
6
7
8
9
2005 2010 2015 2020 2025 2030
Mt S
O2
PRIMES 2009
PRIMES 2010
PRIMES -25% GHG
National scenarios0
2
4
6
8
10
12
14
2005 2010 2015 2020 2025 2030
Mt N
Ox
PRIMES 2009
PRIMES 2010
PRIMES -25% GHG
National scenarios
Uncertainties of baseline emission projections:
Comparison with national scenarios provided in 2010 to CLRTAP
Main reason for differences:• Assumptions on activity projections• Assumed efficiency of emission controls• Changes in official emission inventories
SO2 NOx
NH3
VOCPM2.5

0
1
2
3
4
5
6
7
8
9
2005 2010 2015 2020 2025 2030
Mt S
O2
PRIMES 2009
PRIMES 2010
PRIMES -25% GHG
National scenarios0
2
4
6
8
10
12
14
2005 2010 2015 2020 2025 2030
Mt N
Ox
PRIMES 2009
PRIMES 2010
PRIMES -25% GHG
National scenarios
Different assumptions on climate and energy policies
result in different SO2 and NOx emissions
• National scenarios with higher SO2 and NOx assume also higher GHG emissions (+4% in 2020 relative to 2005)
• PRIMES 2010 CLE: -13% GHGs rel. to 2005, compliant with EU E&C package
• PRIMES -25% CLE: -18% GHGs in 2020, even lower SO2 and NOx
0
1000
2000
3000
4000
5000
6000
2005 2010 2015 2020 2025 2030
Mt C
O2e
q
PRIMES 2010PRIMES -25% GHGNational scenarios
GHGs SO2 NOx

National activity scenarios build on different assumptionsGDP and oil price assumptions of the national scenarios provided to IIASA for the Gothenburg negotiations
The national activity scenarios provided to IIASA in 2010 employ internationally inconsistent assumptions on
• economic growth,
• oil prices,
• carbon prices/climate policies
• import/export of electricity,
• etc..
These differences will influence baseline emissions and the cost-effective allocation of further emission control measures across countries
0%
50%
100%
150%
200%
250%
AU
ST
BELG
BU
LG
CYPR
CZ
RE
DEN
M
ES
TO
FIN
L
FRA
N
GER
M
GR
EE
HU
NG
IREL
ITA
L
LATV
LITH
LUX
E
MA
LT
NETH
NO
R
PO
LA
PO
RT
RO
MA
SK
RE
SLO
V
SPA
I
SW
ED
SW
IT
UN
KI
GD
P2
02
0 r
ela
tive t
o 2
00
5
National PRIMES2009
0
20
40
60
80
100
120
CZ DK FI GR IE IT NL NO PT ES SE CH UK
Oil p
rice a
ssu
med
for
20
20
(U
S-$
/b
arr
el)
Assumed GDP development to 2020
World oil prices assumed for 2020 in the national scenarios

Different assumptions on agricultural activities
result in different NH3 emissions
• EC4MACS sensitivity analysis for ‘healthy diet’:– Original assumption:
-75% meat consumption, no change in milk demand
– Coupled milk-meat production and feedback from lower meat prices lead to:
• -25% chicken• -75% pigs• -10% cattle• Total meat consumption: -33%
• Emission changes in 2030 (relative to baseline):– -17% NH3
– -9% CH4
– -6% N2O• Larger emission reductions would require
changes in milk consumption0.0
0.5
1.0
1.5
2.0
2.5
3.0
3.5
4.0
4.5
Baseline 2030 Healthy diet
Mt N
H3
Pigs and chickenCattleOther animalsOther sources

Sensitivity analysis for transport emissions
Implications of hypothetical non-delivery of Euro-5 and Euro-6
EC4MACS sensitivity analyses for implementation failure of Euro 5/6:
In 2020, • (observed) real-life Euro-5 emission
factors would increase total NOx by 16% compared to EC4MACS baseline,
• failure of Euro-6 could increase total NOx emissions by up to 50%.
Some countries assume failure of Euro-6 in their Gothenburg pledges
For comparison, a 50% lower diesel fraction of passenger cars would reduce total NOx emissions by 2-7 %.
0 2 4 6 8 10 12
2005
EC4MACS Baseline 2020,Euro5/V and 6/VI as foreseen
2020 with real-lifeEuro-5/V emission factors,
Euro-6/VI as foreseen
2020 with Euro-6/VIas real-life Euro-5/V
Mt NOx
All other NOx sources Other road transport
Diesel heavy duty trucks Diesel light duty trucks
Diesel passenger

Uncertainties from emission inventories
Difference in 2005 emissions reported by MS in 2012 (CION) and 2011 (EMEP)
-50%
-40%
-30%
-20%
-10%
0%
10%
20%
30%
40%
50%Au
stria
Belg
ium
Bulg
aria
Cypr
us
Czec
h Re
p.
Den
mar
k
Esto
nia
Finl
and
Fran
ce
Ger
man
y
Gre
ece
Hun
gary
Irela
nd
Italy
Latv
ia
Lith
uani
a
Luxe
mbo
urg
Mal
ta
Net
herla
nds
Pola
nd
Port
ugal
Rom
ania
Slov
akia
Slov
enia
Spai
n
Swed
en UK
Diff
eren
ce e
mis
sion
s rep
orte
d fo
r 200
5 in
201
2 co
mpa
red
to th
e to
the
2011
repo
rts
to E
MEP
SO2
NOx
PM2.5
NH3
VOC

The way forward to reduce discrepancies between national
and EU-wide estimates: Bilateral consultations on baselines
• February:– Report and on-line access to Final EC4MACS baseline emission scenario
• March-September: – Bilateral consultations with MS experts on GAINS emission calculations
(but not on energy scenarios!) to improve the EC4MACS Final Assessment – For appointments: contact IIASA– Submission of national energy/agricultural scenarios to IIASA for implementation
in GAINS. GAINS data templates with PRIMES data will be provided by IIASA.
• March-September:– New PRIMES 2012 baseline, with consultations of DG-ENER/PRIMES with
MS energy experts
• June: – Draft TSAP baseline (including first MS comments) presented to ESG– Further feedbacks to IIASA up to September
• December 2012: – Final TSAP baseline(s)

0%
10%
20%
30%
40%
50%
60%
70%
80%
90%
100%
2020 2030 2020 2030 2020 2030 2020 2030 2020 2030
Emis
sion
s rel
ative
to 2
005
Residual emissions Additional scope from healthy diet
Scope for additional climate measures Scope for additional technical measures
Change in EC4MACS baseline relative to 2005
Scope for further emission reductions
Maximum Control Efforts scenario
SO2 NOx PM2.5 NH3 VOC

Forthcoming reports under the Service contract
to explore sectorial emission reduction potentials
Reports:1. Draft emission baseline up to 2030 and Maximum Control Efforts scenario2. Comparison of NEC assumptions in 2000 with actual developments, reasons for
differences3. Contribution to EU air quality from non-EU countries4. Further emission reduction potentials from small emission sources5. Further emission reduction potentials from agricultural sources6. Further emission reduction potentials from ships7. Further emission reduction potentials from road traffic8. Compliance with air quality limit values (downscaling methodology – see next talk)
Time table:• June:
– Presentation of draft reports to SEG• September:
– Deadline for feedbacks• December:
– Final version of reports– Incorporation into the Final TSAP baseline
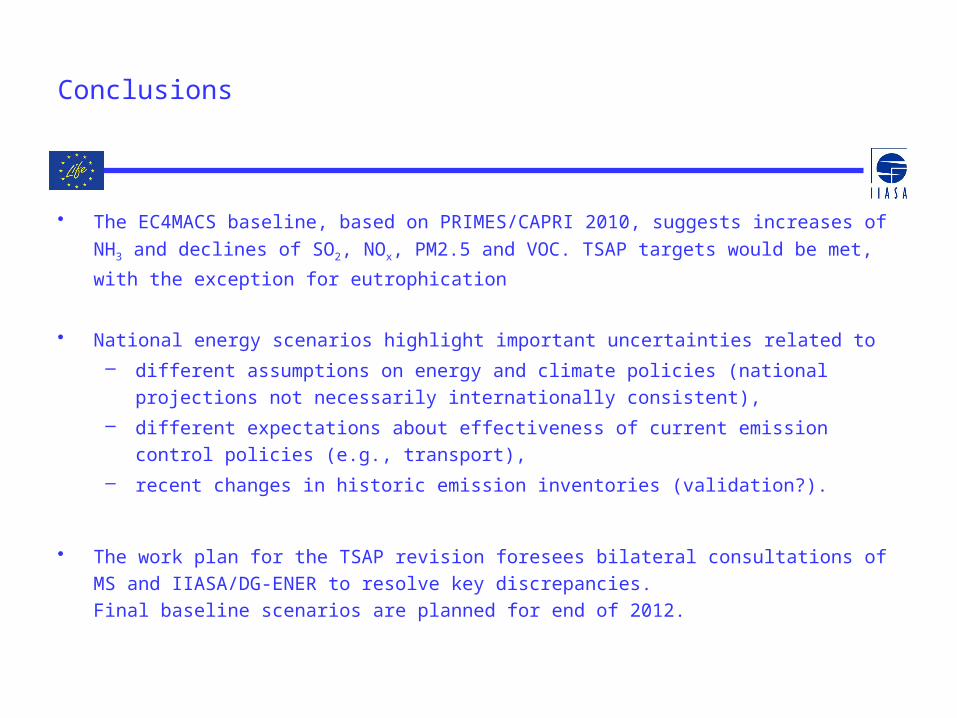
Conclusions
• The EC4MACS baseline, based on PRIMES/CAPRI 2010, suggests increases of NH3 and
declines of SO2, NOx, PM2.5 and VOC. TSAP targets would be met, with the exception
for eutrophication
• National energy scenarios highlight important uncertainties related to
– different assumptions on energy and climate policies (national projections not necessarily internationally consistent),
– different expectations about effectiveness of current emission control policies (e.g., transport),
– recent changes in historic emission inventories (validation?).
• The work plan for the TSAP revision foresees bilateral consultations of MS and IIASA/DG-ENER to resolve key discrepancies. Final baseline scenarios are planned for end of 2012.