Embed Size (px)
Citation preview
BASE RESOURCES LIMITED
ABN 88 125 546 910
Interim Financial Report
For the six month period ended 31 December 2016

2
TABLE OF CONTENTS
Results for Announcement to Market 3
Corporate Directory 4
Directors' Report 5
Lead Auditor's Independence Declaration 10
Consolidated Condensed Statement of Profit or Loss and Other Comprehensive Income 12
Consolidated Condensed Statement of Financial Position 13
Consolidated Condensed Statement of Changes in Equity 14
Consolidated Condensed Statement of Cash Flows 15
Notes to the Financial Statements 16
Directors' Declaration 22
Independent Auditor's Report 23

APPENDIX 4D
RESULTS FOR ANNOUNCEMENT TO THE MARKET
3
Provided below are the Results for Announcement to the Market in accordance with Australian Securities
Exchange (‘ASX’) Listing Rule 4.2A.3 and Appendix 4D for Base Resources Limited and its controlled entities for
the half-year ended 31 December 2016 (the ‘reporting period’ or 'half-year') compared with the half-year
ended 31 December 2015 (‘the comparative period').
Consolidated results Movement
$000s
$000s
Sales revenue up $8,925 to $90,646
Net profit/(loss) before tax up $15,051 to $3,832
Net profit/(loss) after tax attributable to members of Base Resources Limited up $15,098 to $3,832
Net tangible asset backing Unit 31 December 2016 31 December 2015
Net tangible assets $000s $227,568 $218,296
Shares on issue number 742,231,956 563,902,771
Net tangible asset per share $/share $0.31 $0.39
In accordance with Chapter 19 of the ASX listing rules, net tangible assets per share represent total assets less
intangible assets less liabilities ranking ahead of, or equally with, ordinary share capital, divided by the number
of ordinary shares on issue at the end of the financial year. Capitalised exploration and evaluation assets have
been treated as intangible assets and therefore excluded from the calculation of net tangible assets.
Dividends
No interim dividend has been declared.
Details of entities over which control was gained or lost during the period
None.
Independent auditor’s review report
The Financial Statements upon which this Appendix 4D is based have been reviewed and the Independent
Auditor’s Review Report to the members of Base Resources Limited is included in the attached Interim
Financial Report.
Commentary
Commentary on the results for the reporting period is contained within the financial statements that
accompany this announcement. It is recommended that the half-year report be read in conjunction with the
Company’s Annual Financial Report for the year ended 30 June 2016 and any public announcements made by
Base Resources during and after the half-year year ended 31 December 2016 in accordance with the
continuous disclosure obligations under the Corporations Act 2001 and ASX Listing Rules.

CORPORATE DIRECTORY
4
DIRECTORS
Mr Keith Spence, Non-Executive Chairman
Mr Tim Carstens, Managing Director
Mr Colin Bwye, Executive Director
Mr Samuel Willis, Non-Executive Director
Mr Michael Anderson, Non-Executive Director
Mr Malcolm Macpherson, Non-Executive Director
Mr Michael Stirzaker, Non-Executive Director
COMPANY SECRETARY
Mr Chadwick Poletti
PRINCIPAL PLACE OF BUSINESS AND REGISTERED OFFICE
Level 1
50 Kings Park Road
West Perth, WA 6005
CONTACT DETAILS
Website: www.baseresources.com.au
Email: [email protected]
Phone: + 61 (8) 9413 7400
Fax: + 61 (8) 9322 8912
SOLICITORS
Ashurst Australia
Brookfield Place Tower II
Level 10 & 11, 123 St Georges Terrace
Perth WA 6000
AUDITORS
KPMG
235 St Georges Terrace
Perth WA 6000
SHARE REGISTRY
ASX:
Computershare Investor Services Pty Ltd
Level 2, 45 St Georges Terrace
Perth WA 6000
Enquiries:
(within Australia): 1300 850 505
(outside Australia): +61 (3) 9415 4000
Website: www.computershare.com.au
AIM:
Computershare Investor Services PLC
The Pavilions
Bridgwater Road
Bristol BS99 6ZZ
Enquiries: +44 (0) 870 702 0003
Website: www.computershare.co.uk
NOMINATED ADVISOR
RFC Ambrian Limited
QV1 Building
250 St Georges Terrace
Perth WA 6000
BROKER
RFC Ambrian Limited
Condor House
10 St Paul’s Churchyard
London EC4M 8AL

DIRECTORS REPORT
5
Your directors submit the interim financial report of the Group, being the Company, Base Resources Limited,
and its controlled entities for the half-year ended 31 December 2016.
Directors
The names of the directors in office at any time during or since the end of the half-year are:
Mr Keith Spence
Mr Tim Carstens
Mr Colin Bwye
Mr Samuel Willis
Mr Michael Anderson
Mr Malcolm Macpherson
Mr Michael Stirzaker
Directors have been in office since the start of the financial year to the date of this report.
Company Secretary
Mr Chadwick Poletti held the position of company secretary during the half-year.
Principal Activities and Significant Changes in Nature of Activities
The principal activity of the Group is the operation of the 100% owned Kwale Mineral Sands Operation (“Kwale
Operation”) in Kenya. There were no significant changes in the nature of the Group’s principal activities during
the period.
Operating Results
The profit for the Group for the half-year after providing for income tax amounted to $3,832,295 (2015:
$11,266,168 loss).
Dividends Paid or Recommended
There were no dividends paid or declared for payment during the period ended 31 December 2016.
Review of Operations
Base Resources operates the 100% owned Kwale Mineral Sands Mine (“Kwale Operation”) in Kenya, which
commenced production in late 2013. The Kwale Operation is located 10 kilometres inland from the Kenyan
coast and 50 kilometres south of Mombasa, the principal port facility for East Africa.
The Kwale Operation is designed to process ore to recover three separate products – rutile, ilmenite and zircon.
Ore is received at the wet concentrator plant (“WCP”) from the mining units via a slurry pipeline. The WCP
removes slimes, concentrates the valuable heavy minerals (rutile, ilmenite and zircon) with a number of gravity
separation steps using spiral concentrators and rejects most of the non-valuable, lighter gangue minerals to
produce a heavy mineral concentrate (“HMC”). The HMC, containing approximately 90% heavy minerals, is then
processed in the mineral separation plant (“MSP”). The MSP cleans and separates the rutile, ilmenite and zircon
minerals into finished products for sale.
In the six months to 31 December 2016 (“reporting period”), mining volumes were higher than the six months
to 30 June 2016 (“prior period”), due to the successful commissioning of a 400 tonnes per hour (“tph”)
Hydraulic Mining Unit (“HMU”). The HMU exceeded its design throughput to achieve an average mining rate of
411tph in the reporting period, for total ore tonnes mined of 816,000 tonnes. Combined with the existing
dozer trap mining unit (“DMU”), which mines higher grade ore while the HMU mines the thinner, lower grade
perimeter blocks, a total of 5.4 million tonnes (“Mt”) of ore was mined in the reporting period (4.8Mt in the

DIRECTORS REPORT
6
prior period) which resulted in a lower blended average ore grade of 6.56% heavy mineral (“HM”) in
comparison with the prior period’s 9.41%.
Summary Physical Data Six months to
Dec 2016
Six months to
Jun 2016
Six months to
Dec 2015
Ore mined (tonnes) 5,374,507 4,773,898 4,428,656
Heavy mineral (HM) % 6.56% 9.41% 7.12%
WCP Heavy mineral concentrate produced (tonnes) 316,451 436,240 298,191
MSP Heavy mineral concentrate consumed (tonnes) 384,925 362,468 346,975
MSP feed rate (tph) 92 85 83
Production (tonnes)
Ilmenite 238,803 230,100 225,770
Rutile 45,328 42,960 42,694
Zircon 17,641 17,336 14,053
Zircon low grade 4,710 - -
Sales (tonnes)
Ilmenite 236,488 246,896 233,642
Rutile 42,796 46,955 38,581
Zircon 17,957 19,145 13,917
Zircon low grade 3,397 - -
Historically, tailings pump constraints in the WCP have limited mining operations’ ability to significantly increase
throughput when mining low grade ore. However, recent changes to the tailings pump impellers have delivered
a significant increase in their performance and allowed the higher mining volumes and WCP throughput. The
higher throughput rates and lower ore grades have had an impact on the WCP recoveries and the required
re-optimisation and de-bottlenecking is underway.
As a result of the lower feed grade and lower WCP recoveries, overall WCP production of HMC was lower than
the prior period. The HMC stockpile, built up in prior periods to accommodate the planned mining sequence
and ore grade, was drawn down by 68,474 tonnes as MSP throughput increased to above design levels
following completion of a number of upgrade projects.
MSP optimisation during the reporting period continued to focus on increasing throughput, achieving an
average feed rate of 92tph (85tph in the prior period) whilst maintaining a high availability of 95% (96% in the
prior period). The higher throughput rates have had a minor impact on product recoveries and the required re-
optimisation and de-bottlenecking continues, aimed at improving recoveries and also to ensure maximum value
is achieved by balancing primary final product production and zircon concentrate production (for sale).
Rutile production increased to 44,756 tonnes in the reporting period, compared to 42,960 tonnes in the prior
period. Lower average recoveries of 96% (100% in the prior period) were offset by the higher MSP throughput
and the proportionally higher rutile content of low grade ore mined during the reporting period.
Ilmenite production continued at above design capacity, achieving production of 235,627 tonnes (230,100
tonnes in the prior period), primarily due to the increased MSP feed rate. The higher feed rates were partially
offset by the proportionally lower ilmenite content of low grade ore and lower average ilmenite recoveries of
100% (102% in prior period).

DIRECTORS REPORT
7
Zircon production for the reporting period of 17,641 tonnes, marginally higher than the prior period’s
17,336 tonnes, with the improved MSP feed rates offset by lower average zircon recoveries of 73% (78% in the
prior period). The lower recoveries were the direct result of circuit optimisation modifications undertaken
during the reporting period, necessitated by the higher MSP feed rate, and some electrical voltage instability
that resulted in repeated stoppages in the wet zircon circuit, which was resolved at the end of the reporting
period.
In addition to primary zircon, during the reporting period, Kwale Operations produced of a lower grade zircon
product (“zircon low grade”) from the re-processing of zircon tails into a zircon rich concentrate, which has
historically realised 70-80% of the value of each contained tonne of zircon. Reported zircon low grade
represents the volume of zircon contained in the concentrate. To date, zircon low grade has been produced
from the re-processing of run-of-production and stockpiled zircon circuit tails and this is anticipated to continue
for the remainder of the financial year. The production of zircon low grade has more than offset the lower
primary zircon recoveries in the reporting period.
Bulk loading operations at the Group’s Likoni Port facility continue to run smoothly, dispatching more than
280,000 tonnes of ilmenite, rutile and zircon low grade during the reporting period. Containerised shipments of
rutile and zircon through the Mombasa Port proceeded according to plan.
With no serious injuries occurring during the period under review, Kwale Operations lost time injury (“LTI”)
frequency rate remains at zero. Base Resources employees and contractors have now worked 8.2 million man-
hours LTI free, with the last LTI recorded in February 2014.
The TiO2 pigment industry continued to strengthen through the reporting period resulting in price improvement
and ongoing strong demand for TiO2 feedstock. This is encouraging and a departure from the traditional
seasonal slow-down in the lead up to the end of the calendar year. Global pigment producers announced a
series of price increases over the course of calendar 2016, with a number of major producers recently
announcing a further price increase effective from 1 January 2017.
TiO2 feedstock consumption continued to increase throughout the reporting period on the back of firming
pigment production and ongoing re-stocking activity within the downstream supply-chain. This led to a very
strong sales period for Base Resources’ ilmenite and rutile. Prices for Base Resources’ ilmenite have increased
by over 100% between May and December 2016. The Company continues to secure forward sales and has
contracted all ilmenite production through to February 2017, securing further price increases for these sales.
There have been recent reports of political disruption to ilmenite exports from Tamil Nadu in India and
suppressed ilmenite production in China’s main ilmenite producing region, the Sichuan province, due to
increased environmental inspections. These events, together with the ongoing strength in pigment demand,
are expected to result in further improvements in ilmenite prices through 2017.
Despite the improvement in demand, an overhang of high grade TiO2 feedstock (including rutile) supply from
the first half of 2016 calendar year restrained rutile price growth through the reporting period. However,
higher than expected offtake by major consumers has resulted in supply and demand being more balanced by
the end of the reporting period. Base Resources’ expectation is for rutile prices to start trending upwards
during 2017.
Demand for zircon continued to be solid with minimal stocks being held throughout the reporting period.
Zircon prices saw a modest improvement through the latter half of the reporting period and further marginal
improvements are being secured for sales in the March 2017 quarter. Provided supply management continues,
ongoing gradual upward momentum in zircon prices is expected to occur through 2017.
DIRECTORS REPORT
8
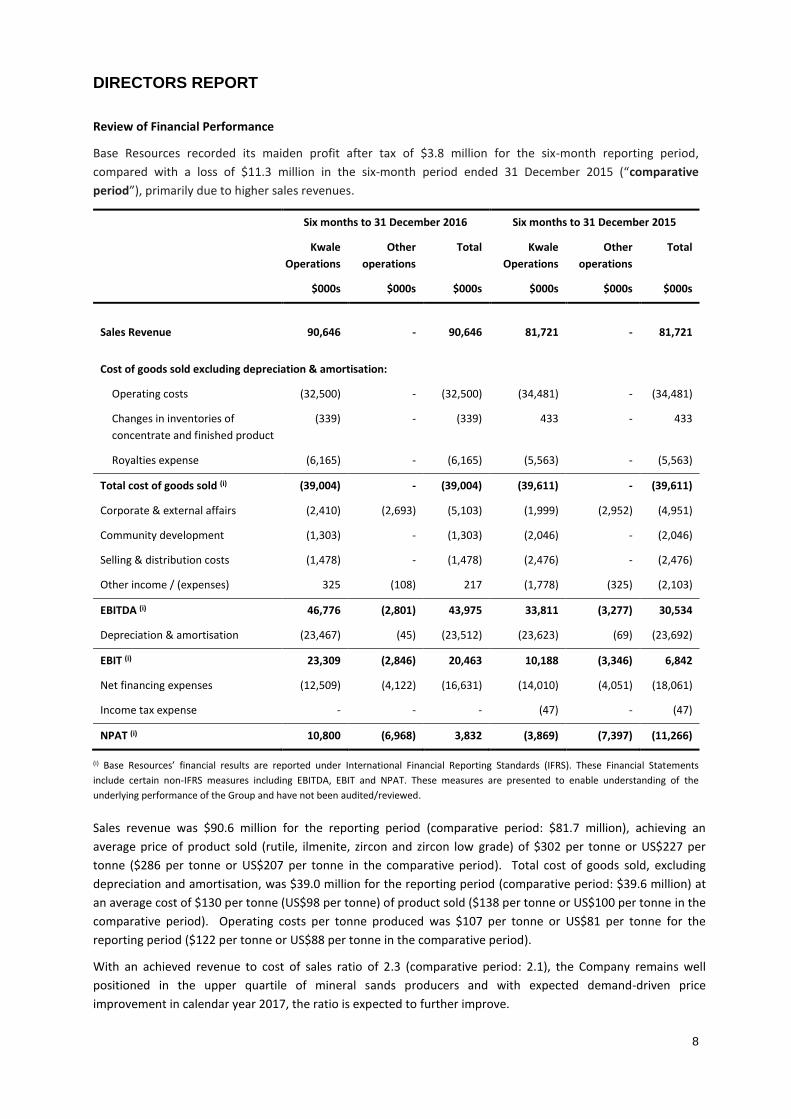
Review of Financial Performance
Base Resources recorded its maiden profit after tax of $3.8 million for the six-month reporting period,
compared with a loss of $11.3 million in the six-month period ended 31 December 2015 (“comparative
period”), primarily due to higher sales revenues.
Six months to 31 December 2016 Six months to 31 December 2015
Kwale
Operations
Other
operations
Total Kwale
Operations
Other
operations
Total
$000s $000s $000s $000s $000s $000s
Sales Revenue 90,646 - 90,646 81,721 - 81,721
Cost of goods sold excluding depreciation & amortisation:
Operating costs (32,500) - (32,500) (34,481) - (34,481)
Changes in inventories of
concentrate and finished product
(339) - (339) 433 - 433
Royalties expense (6,165) - (6,165) (5,563) - (5,563)
Total cost of goods sold (i) (39,004) - (39,004) (39,611) - (39,611)
Corporate & external affairs (2,410) (2,693) (5,103) (1,999) (2,952) (4,951)
Community development (1,303) - (1,303) (2,046) - (2,046)
Selling & distribution costs (1,478) - (1,478) (2,476) - (2,476)
Other income / (expenses) 325 (108) 217 (1,778) (325) (2,103)
EBITDA (i) 46,776 (2,801) 43,975 33,811 (3,277) 30,534
Depreciation & amortisation (23,467) (45) (23,512) (23,623) (69) (23,692)
EBIT (i) 23,309 (2,846) 20,463 10,188 (3,346) 6,842
Net financing expenses (12,509) (4,122) (16,631) (14,010) (4,051) (18,061)
Income tax expense - - - (47) - (47)
NPAT (i) 10,800 (6,968) 3,832 (3,869) (7,397) (11,266)
(i) Base Resources’ financial results are reported under International Financial Reporting Standards (IFRS). These Financial Statements
include certain non-IFRS measures including EBITDA, EBIT and NPAT. These measures are presented to enable understanding of the
underlying performance of the Group and have not been audited/reviewed.
Sales revenue was $90.6 million for the reporting period (comparative period: $81.7 million), achieving an
average price of product sold (rutile, ilmenite, zircon and zircon low grade) of $302 per tonne or US$227 per
tonne ($286 per tonne or US$207 per tonne in the comparative period). Total cost of goods sold, excluding
depreciation and amortisation, was $39.0 million for the reporting period (comparative period: $39.6 million) at
an average cost of $130 per tonne (US$98 per tonne) of product sold ($138 per tonne or US$100 per tonne in the
comparative period). Operating costs per tonne produced was $107 per tonne or US$81 per tonne for the
reporting period ($122 per tonne or US$88 per tonne in the comparative period).
With an achieved revenue to cost of sales ratio of 2.3 (comparative period: 2.1), the Company remains well
positioned in the upper quartile of mineral sands producers and with expected demand-driven price
improvement in calendar year 2017, the ratio is expected to further improve.

DIRECTORS REPORT
9
Improved sales volumes, commodity prices and a continued focus on cost management has delivered a Kwale
Operations EBITDA for the reporting period of $46.8 million ($33.8 million in the comparative period) and a
Group EBITDA of $44.0 million ($30.5 million in the comparative period).
A net profit after tax of $10.8 million was recorded by Kwale Operations (loss of $3.9 million in the comparative
period) and $3.8 million for the Group (comparative period: loss of $11.3 million). Earnings per share for the
Group was 0.52 cents per share (comparative period: loss per share 2.0 cents).
Cash flow from operations was $45.1 million for the reporting period ($26.8 million in the comparative period),
slightly higher than Group EBITDA due to working capital movements.
Surplus cash generated by Kwale Operations may be distributed (a “Cash Sweep”), in equal parts, as early
repayment of the Kwale Operations Debt Facility (“Kwale Facility”) and to the Australian parent entity, Base
Resources Limited (“BRL”), on six-monthly intervals as permitted by the terms of the Kwale Facility. In July 2016,
a Cash Sweep of US$10.8 million was distributed from the Kwale Operation. Half of the Cash Sweep (US$5.4
million) went towards mandatory repayment of the Kwale Facility, with the other half distributed up to BRL.
During the reporting period, US$20.6 million of the Kwale Facility was paid down through a combination of
scheduled debt repayments and Cash Sweeps, reducing the outstanding Kwale Facility debt to US$159.9 million.
Prior to final maturity, under the terms of the Taurus Debt Facility (“Taurus Facility”) held by BRL, repayments
are only required to be made from the proceeds of Kwale Operations Cash Sweeps received by BRL. Of the
US$5.4 million Cash Sweep received by BRL in July 2016, a mandatory 50% (US$2.7 million) was applied towards
repayment of the Taurus Facility, thereby reducing the outstanding debt to US$17.3 million.
In October 2016, BRL extended the maturity date of the Taurus Facility from 31 December 2016 to 30 September
2017. The extension of the Taurus Facility final maturity date removed the need to secure external funding to
repay the balance that would otherwise have been due on 31 December 2016. As part of the extension, the
mandatory proportion of Kwale Operations Cash Sweeps to be applied towards progressive repayment of the
Taurus Facility increased from 50% to 75%. All other terms of the Taurus Facility remained unchanged, including
the interest rate of 10% on the outstanding balance.
Total debt outstanding at 31 December 2016 was $246.0 million (US$177.2 million) compared with $270.3
million (US$200.5 million) at 30 June 2016. Aside from the movements discussed above, the increase in the
Australian dollar value of debt has been driven by the fluctuations in the US dollar exchange rates.
The Company’s net debt position at 31 December 2016 was $179.7 million (US$129.5 million) compared with
$204.2 million (US$151.5 million) at 30 June 2016.
After Balance Date Events
Subsequent to period end, in January 2017, in accordance with the terms of the Kwale Facility, a further Cash
Sweep of US$14.6 million was distributed from Kwale Operations. Half of the Cash Sweep (US$7.3 million) went
towards mandatory repayment of the Kwale Facility, with the other half distributed up to BRL. The outstanding
balance of the Kwale Facility debt after this repayment was $211.9 million (US$152.6 million).
In accordance with the terms of the Taurus Facility extension, a mandatory 75% of the US$7.3 million Cash
Sweep received by BRL went towards progressive repayment of the Taurus Facility, reducing outstanding debt
to $16.4 million (US$11.8 million), with the balance available to BRL for general corporate funding.
Total outstanding debt following the above repayments was $228.3 million (US$164.4 million).
DIRECTORS REPORT
10
Rounding
The Group is of a kind referred to in ASIC Class Instrument 2016/191 and in accordance with that Class Order,
amounts in the interim financial report and directors’ report have been rounded to the nearest thousand dollars,
unless otherwise stated.
Auditor’s Declaration
The lead auditor’s independence declaration under section 307C of the Corporations Act 2001 is set out on page
11 for the half-year ended 31 December 2016.
This report is signed in accordance with a resolution of the Board of Directors.
Keith Spence
Director
Dated this 27th day of February 2017

11
Lead Auditor’s Independence Declaration under Section 307C of the Corporations Act 2001
To: the directors of Base Resources Limited
I declare that, to the best of my knowledge and belief, in relation to the review for the half-year ended 31
December 2016 there have been:
(i) no contraventions of the auditor independence requirements as set out in the Corporations Act
2001 in relation to the review; and
(ii) no contraventions of any applicable code of professional conduct in relation to the review.
KPMG
R Gambitta Partner
Perth
27 February 2017

CONSOLIDATED CONDENSED STATEMENT OF PROFIT OR LOSS AND OTHER COMPREHENSIVE INCOME
FOR THE SIX MONTHS ENDED 31 DECEMBER 2016
12
6 months to
31 December 2016
6 months to
31 December 2015
Note $000s $000s
Sales revenue 90,646 81,721
Cost of sales 2 (62,471) (63,234)
Profit from operations 28,175 18,487
Corporate and external affairs (5,148) (5,020)
Community development costs (1,303) (2,046)
Selling and distribution costs (1,478) (2,476)
Other income / (expenses) 217 (2,103)
Profit before financing income and income tax 20,643 6,842
Financing costs 3 (16,631) (18,061)
Profit / (loss) before income tax 3,832 (11,219)
Income tax expense - (47)
Net profit / (loss) after tax for the period 3,832 (11,266)
Other comprehensive income
Items that may be reclassified subsequently to profit or loss:
Foreign currency translation differences - foreign operations 6,239 8,833
Total other comprehensive income for the period 6,239 8,833
Total comprehensive income / (loss) for the period 10,071 (2,433)
Net Earnings / (loss) per share Cents Cents
Basic earnings / (loss) per share (cents per share) 0.52 (2.00)
Diluted earnings / (loss) per share (cents per share) 0.48 (2.00)
The accompanying notes form part of these condensed consolidated interim financial statements.

CONSOLIDATED CONDENSED STATEMENT OF FINANCIAL POSITION
AS AT 31 DECEMBER 2016
13
31 December 2016 30 June 2016
Note $000s $000s
Current assets
Cash and cash equivalents 40,433 36,295
Restricted cash 25,823 29,761
Trade and other receivables 4 43,463 43,544
Inventories 5 28,575 27,962
Other current assets 6,638 5,826
Total current assets 144,932 143,388
Non-current assets
Capitalised exploration and evaluation 1,947 1,487
Property, plant and equipment 6 379,170 390,304
Total non-current assets 381,117 391,791
Total assets 526,049 535,179
Current liabilities
Trade and other payables 25,295 24,953
Borrowings 7 67,503 61,816
Provisions 1,208 1,173
Deferred revenue 1,157 1,123
Other liabilities 993 887
Total current liabilities 96,156 89,952
Non-current liabilities
Borrowings 7 167,742 196,291
Provisions 30,033 28,973
Deferred revenue 2,603 3,089
Total non-current liabilities 200,378 228,353
Total liabilities 296,534 318,305
Net assets 229,515 216,874
Equity
Issued capital 8 225,298 223,548
Reserves 60,168 54,780
Accumulated losses (55,951) (61,454)
Total equity 229,515 216,874
The accompanying notes form part of these condensed consolidated interim financial statements.
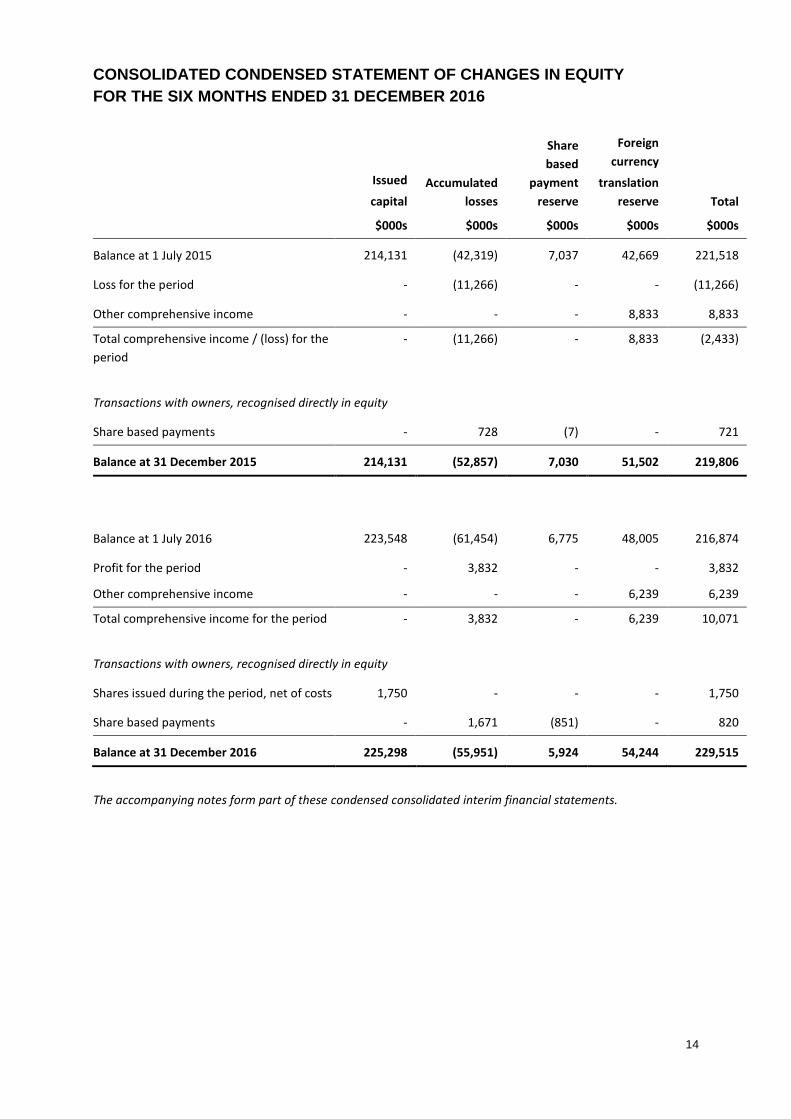
CONSOLIDATED CONDENSED STATEMENT OF CHANGES IN EQUITY
FOR THE SIX MONTHS ENDED 31 DECEMBER 2016
14
Issued
capital
Accumulated
losses
Share
based
payment
reserve
Foreign
currency
translation
reserve Total
$000s $000s $000s $000s $000s
Balance at 1 July 2015 214,131 (42,319) 7,037 42,669 221,518
Loss for the period - (11,266) - - (11,266)
Other comprehensive income - - - 8,833 8,833
Total comprehensive income / (loss) for the
period
- (11,266) - 8,833 (2,433)
Transactions with owners, recognised directly in equity
Share based payments - 728 (7) - 721
Balance at 31 December 2015 214,131 (52,857) 7,030 51,502 219,806
Balance at 1 July 2016 223,548 (61,454) 6,775 48,005 216,874
Profit for the period - 3,832 - - 3,832
Other comprehensive income - - - 6,239 6,239
Total comprehensive income for the period - 3,832 - 6,239 10,071
Transactions with owners, recognised directly in equity
Shares issued during the period, net of costs 1,750 - - - 1,750
Share based payments - 1,671 (851) - 820
Balance at 31 December 2016 225,298 (55,951) 5,924 54,244 229,515
The accompanying notes form part of these condensed consolidated interim financial statements.

CONSOLIDATED CONDENSED STATEMENT OF CASH FLOWS
FOR THE SIX MONTHS ENDED 31 DECEMBER 2016
15
6 months to
31 December 2016
6 months to
31 December 2015
Note $000s $000s
Cash flows from operating activities
Receipts from customers 91,447 76,217
Payments in the course of operations (46,340) (49,365)
Other (28) (95)
Net cash from operating activities 45,079 26,757
Cash flows from investing activities
Purchase of property, plant and equipment (2,849) (3,117)
Other (135) (323)
Net cash used in investing activities (2,984) (3,440)
Cash flows from financing activities
Repayment of borrowings (32,383) (19,209)
Transfers from / (to) restricted cash 4,830 (17,379)
Payments for debt service costs and re-scheduling fees (11,205) (17,533)
Net cash used in financing activities (38,758) (54,121)
Net increase / (decrease) in cash held 3,337 (30,804)
Cash at beginning of period 36,295 40,906
Effect of exchange fluctuations on cash held 801 2,344
Cash at end of period 40,433 12,446
The accompanying notes form part of these condensed consolidated interim financial statements.
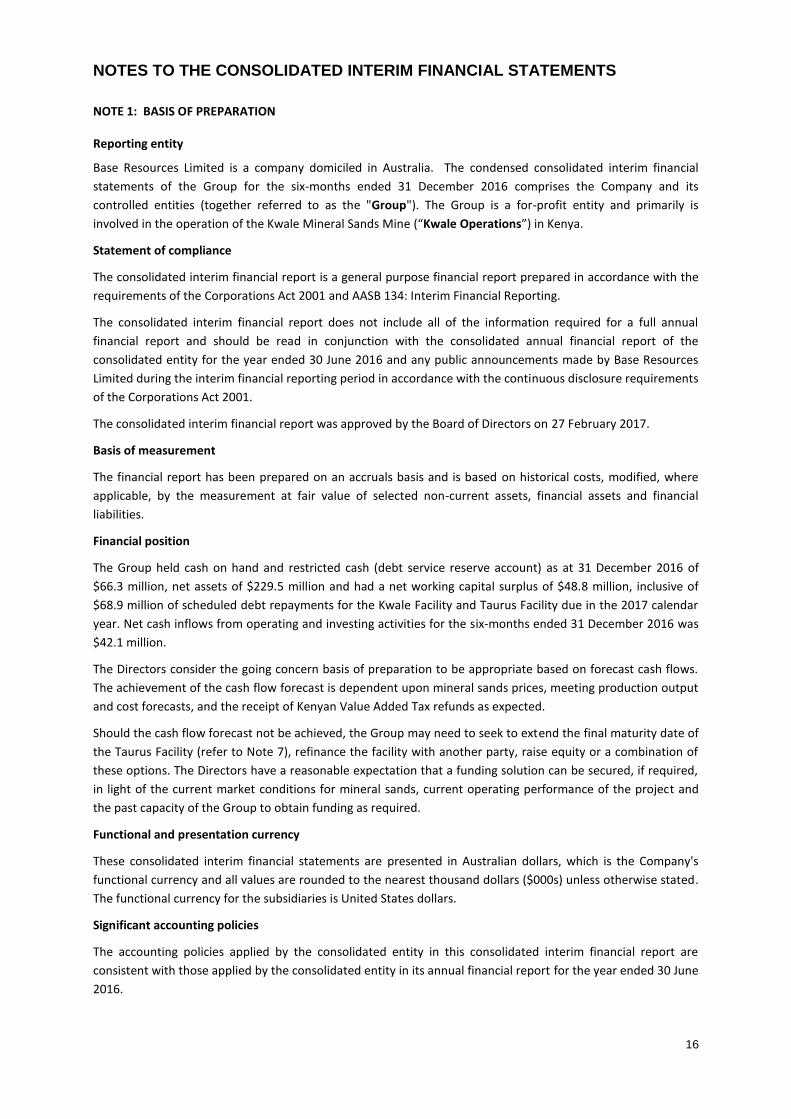
NOTES TO THE CONSOLIDATED INTERIM FINANCIAL STATEMENTS
16
NOTE 1: BASIS OF PREPARATION
Reporting entity
Base Resources Limited is a company domiciled in Australia. The condensed consolidated interim financial
statements of the Group for the six-months ended 31 December 2016 comprises the Company and its
controlled entities (together referred to as the "Group"). The Group is a for-profit entity and primarily is
involved in the operation of the Kwale Mineral Sands Mine (“Kwale Operations”) in Kenya.
Statement of compliance
The consolidated interim financial report is a general purpose financial report prepared in accordance with the
requirements of the Corporations Act 2001 and AASB 134: Interim Financial Reporting.
The consolidated interim financial report does not include all of the information required for a full annual
financial report and should be read in conjunction with the consolidated annual financial report of the
consolidated entity for the year ended 30 June 2016 and any public announcements made by Base Resources
Limited during the interim financial reporting period in accordance with the continuous disclosure requirements
of the Corporations Act 2001.
The consolidated interim financial report was approved by the Board of Directors on 27 February 2017.
Basis of measurement
The financial report has been prepared on an accruals basis and is based on historical costs, modified, where
applicable, by the measurement at fair value of selected non-current assets, financial assets and financial
liabilities.
Financial position
The Group held cash on hand and restricted cash (debt service reserve account) as at 31 December 2016 of
$66.3 million, net assets of $229.5 million and had a net working capital surplus of $48.8 million, inclusive of
$68.9 million of scheduled debt repayments for the Kwale Facility and Taurus Facility due in the 2017 calendar
year. Net cash inflows from operating and investing activities for the six-months ended 31 December 2016 was
$42.1 million.
The Directors consider the going concern basis of preparation to be appropriate based on forecast cash flows.
The achievement of the cash flow forecast is dependent upon mineral sands prices, meeting production output
and cost forecasts, and the receipt of Kenyan Value Added Tax refunds as expected.
Should the cash flow forecast not be achieved, the Group may need to seek to extend the final maturity date of
the Taurus Facility (refer to Note 7), refinance the facility with another party, raise equity or a combination of
these options. The Directors have a reasonable expectation that a funding solution can be secured, if required,
in light of the current market conditions for mineral sands, current operating performance of the project and
the past capacity of the Group to obtain funding as required.
Functional and presentation currency
These consolidated interim financial statements are presented in Australian dollars, which is the Company's
functional currency and all values are rounded to the nearest thousand dollars ($000s) unless otherwise stated.
The functional currency for the subsidiaries is United States dollars.
Significant accounting policies
The accounting policies applied by the consolidated entity in this consolidated interim financial report are
consistent with those applied by the consolidated entity in its annual financial report for the year ended 30 June
2016.

NOTES TO THE CONSOLIDATED INTERIM FINANCIAL STATEMENTS
17
Critical accounting estimates and judgements
The directors make estimates and judgements in the preparation of the financial report that affect the
application of accounting policies and the reported amounts of assets, liabilities, income and expenses based on
historical knowledge and best available current information. Estimates assume a reasonable expectation of
future events and are based on current trends and economic data, obtained both externally and within the
Group. Actual results may differ from these estimates. Estimates and underlying assumptions are reviewed on
an ongoing basis. Revisions to accounting estimates are recognised in the period in which the estimates are
revised and in any future periods affected.
In preparing this consolidated interim financial report, the significant judgements made by management in
applying the Group’s accounting policies and the key sources of estimation uncertainty were consistent with
those that applied to the consolidated financial statements for the year ended 30 June 2016.
NOTE 2: COST OF SALES
6 months to
31 Dec 16
6 months to
31 Dec 15
$000s $000s
Operating costs 32,500 34,481
Changes in inventories of concentrate and finished goods 339 (433)
Royalties expense 6,165 5,563
Depreciation and amortisation 23,467 23,623
62,471 63,234
NOTE 3: FINANCING COSTS
6 months to
31 Dec 16
6 months to
31 Dec 15
$000s $000s
Loss on foreign exchange transactions 1,116 821
Interest income (116) (32)
Interest expense, inclusive of withholding tax 10,229 11,946
Unwinding of discount on provision for rehabilitation 282 388
Amortisation of capitalised borrowing costs 3,544 3,333
Financing expenses 1,576 1,605
16,631 18,061
NOTE 4: TRADE AND OTHER RECEIVABLES
31 Dec 16 30 Jun 16
$000s $000s
Trade receivables 18,064 18,246
VAT receivables 25,374 25,198
Other receivables 25 100
43,463 43,544

NOTES TO THE CONSOLIDATED INTERIM FINANCIAL STATEMENTS
18
NOTE 5: INVENTORIES
31 Dec 16 30 Jun 16
$000s $000s
Current
Heavy mineral concentrate and other intermediate stockpiles – at cost 6,433 9,054
Finished goods stockpiles – at cost 9,701 6,982
Stores and consumables – at cost 12,441 11,926
28,575 27,962
NOTE 6: PROPERTY, PLANT AND EQUIPMENT
Plant &
equipment
Mine
property and
development
Buildings Capital
work in
progress
Total
As at 31 December 2016 $000s $000s $000s $000s $000s
At cost 299,926 205,442 8,854 1,701 518,076
Accumulated depreciation (84,632) (49,900) (2,221) - (136,753)
Closing carrying amount 215,294 155,542 6,633 1,701 379,170
Reconciliation of carrying amounts:
Balance at 1 July 2016 221,730 159,677 6,748 2,149 390,304
Additions 205 2,445 - 922 3,572
Transfers 1,435 - - (1,435) -
Decrease in mine rehabilitation asset - (651) - - (651)
Depreciation expense (14,717) (9,449) (317) - (24,483)
Effects of movement in foreign exchange 6,641 3,520 202 65 10,428
Balance at 31 December 2016 215,294 155,542 6,633 1,701 379,170
As at 30 June 2016 $000s $000s $000s $000s $000s
At cost 289,626 199,259 8,596 2,149 499,630
Accumulated depreciation (67,896) (39,582) (1,848) - (109,326)
Closing carrying amount 221,730 159,677 6,748 2,149 390,304
Reconciliation of carrying amounts:
Balance at 1 July 2015 239,058 173,832 6,606 1,487 420,983
Additions 638 117 490 1,872 3,117
Transfers 1,198 - 22 (1,220) -
Disposals (46) - - - (46)
Reduction in mine rehabilitation asset - (829) - - (829)
Depreciation expense (14,260) (8,943) (313) - (23,516)
Effects of movement in foreign exchange 12,030 6,408 333 76 18,847
Balance at 31 December 2015 238,618 170,585 7,138 2,215 418,556
NOTES TO THE CONSOLIDATED INTERIM FINANCIAL STATEMENTS
19
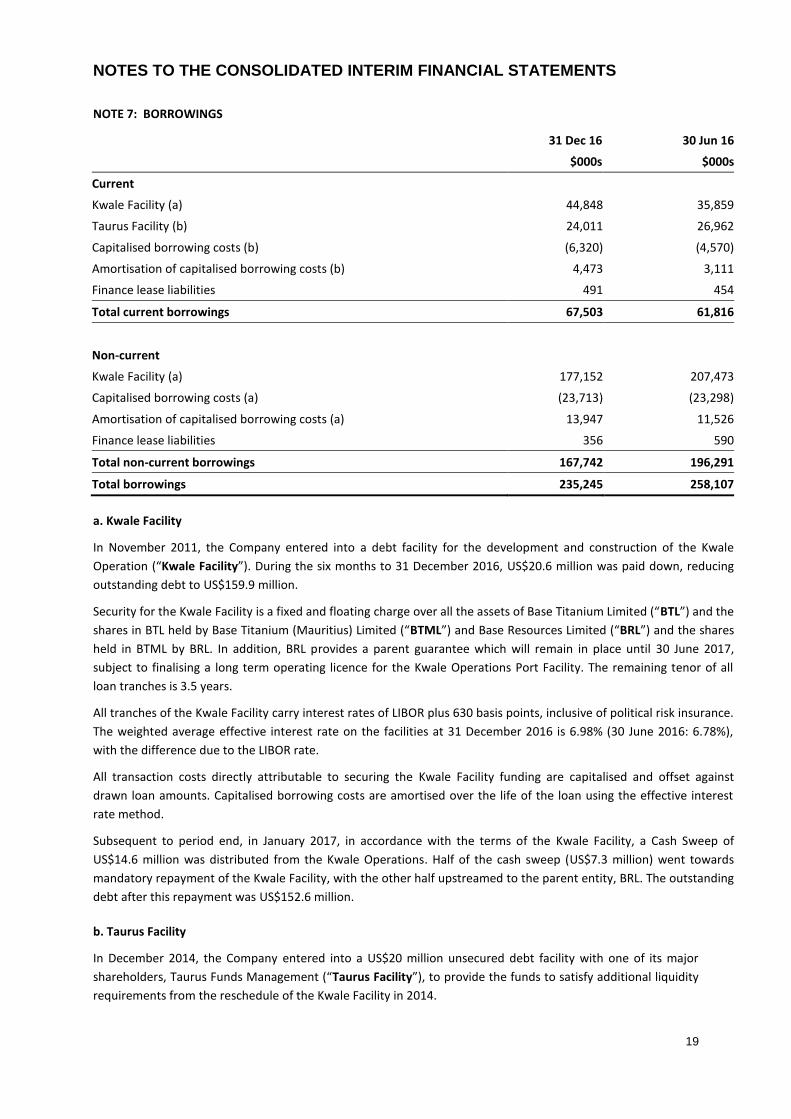
NOTE 7: BORROWINGS
31 Dec 16 30 Jun 16
$000s $000s
Current
Kwale Facility (a) 44,848 35,859
Taurus Facility (b) 24,011 26,962
Capitalised borrowing costs (b) (6,320) (4,570)
Amortisation of capitalised borrowing costs (b) 4,473 3,111
Finance lease liabilities 491 454
Total current borrowings 67,503 61,816
Non-current
Kwale Facility (a) 177,152 207,473
Capitalised borrowing costs (a) (23,713) (23,298)
Amortisation of capitalised borrowing costs (a) 13,947 11,526
Finance lease liabilities 356 590
Total non-current borrowings 167,742 196,291
Total borrowings 235,245 258,107
a. Kwale Facility
In November 2011, the Company entered into a debt facility for the development and construction of the Kwale
Operation (“Kwale Facility”). During the six months to 31 December 2016, US$20.6 million was paid down, reducing
outstanding debt to US$159.9 million.
Security for the Kwale Facility is a fixed and floating charge over all the assets of Base Titanium Limited (“BTL”) and the
shares in BTL held by Base Titanium (Mauritius) Limited (“BTML”) and Base Resources Limited (“BRL”) and the shares
held in BTML by BRL. In addition, BRL provides a parent guarantee which will remain in place until 30 June 2017,
subject to finalising a long term operating licence for the Kwale Operations Port Facility. The remaining tenor of all
loan tranches is 3.5 years.
All tranches of the Kwale Facility carry interest rates of LIBOR plus 630 basis points, inclusive of political risk insurance.
The weighted average effective interest rate on the facilities at 31 December 2016 is 6.98% (30 June 2016: 6.78%),
with the difference due to the LIBOR rate.
All transaction costs directly attributable to securing the Kwale Facility funding are capitalised and offset against
drawn loan amounts. Capitalised borrowing costs are amortised over the life of the loan using the effective interest
rate method.
Subsequent to period end, in January 2017, in accordance with the terms of the Kwale Facility, a Cash Sweep of
US$14.6 million was distributed from the Kwale Operations. Half of the cash sweep (US$7.3 million) went towards
mandatory repayment of the Kwale Facility, with the other half upstreamed to the parent entity, BRL. The outstanding
debt after this repayment was US$152.6 million.
b. Taurus Facility
In December 2014, the Company entered into a US$20 million unsecured debt facility with one of its major
shareholders, Taurus Funds Management (“Taurus Facility”), to provide the funds to satisfy additional liquidity
requirements from the reschedule of the Kwale Facility in 2014.

NOTES TO THE CONSOLIDATED INTERIM FINANCIAL STATEMENTS
20
Prior to final maturity, under the terms of the Taurus Facility, repayments are only required to be made from
the proceeds of Kwale Operations Cash Sweeps received by BRL. These Cash Sweeps, when permitted, occur
six-monthly with the first having taken place in July 2016 for US$5.4 million. A mandatory 50% of the Cash
Sweep was applied towards repayment of the Taurus facility, reducing the outstanding debt at 31 December
2016 to US$17.3 million.
In October 2016, the Company extended the final maturity date of the Taurus Facility from 31 December 2016
to 30 September 2017. The extension removed the need to secure external funding to repay the balance that
would otherwise have been due on 31 December 2016. As part of the extension, the mandatory proportion of
Kwale Operations Cash Sweeps to be applied towards progressive repayment of the Taurus Facility increased
from 50% to 75%. All other terms of the Taurus Facility remained unchanged, including the interest rate of 10%
on the outstanding balance. As consideration for the extension, the Company issued Taurus 10 million fully
paid ordinary shares.
All transaction costs directly attributable to securing the Taurus Facility are capitalised and offset against drawn
loan amounts. Capitalised borrowing costs are amortised over the life of the loan using the effective interest
rate method.
Subsequent to period end, in January 2017, a mandatory 75% of the US$7.3 million Kwale Operations Cash
Sweep received by BRL went towards repayment of the Taurus Facility, reducing the outstanding debt to
US$11.8 million.
NOTE 8: ISSUED CAPITAL
31 Dec 16 30 Jun 16
$000s $000s
Ordinary share capital:
Issued and fully paid 225,298 223,548
Date Number $000s
1 July 2015 563,902,771 214,131
Renounceable entitlement offer 168,329,185 10,100
Share issue costs - (683)
30 June 2016 732,231,956 223,548
1 July 2016 732,231,956 223,548
Shares issued as consideration for Taurus Facility extension (note 7) 10,000,000 1,750
31 December 2016 742,231,956 225,298
All issued shares are fully paid. The Group does not have authorised capital or par value in respect of its issued shares.
The holders of ordinary shares are entitled to receive dividends as declared from time to time and are entitled to one
vote per share at meetings of the Company.
NOTES TO THE CONSOLIDATED INTERIM FINANCIAL STATEMENTS
21
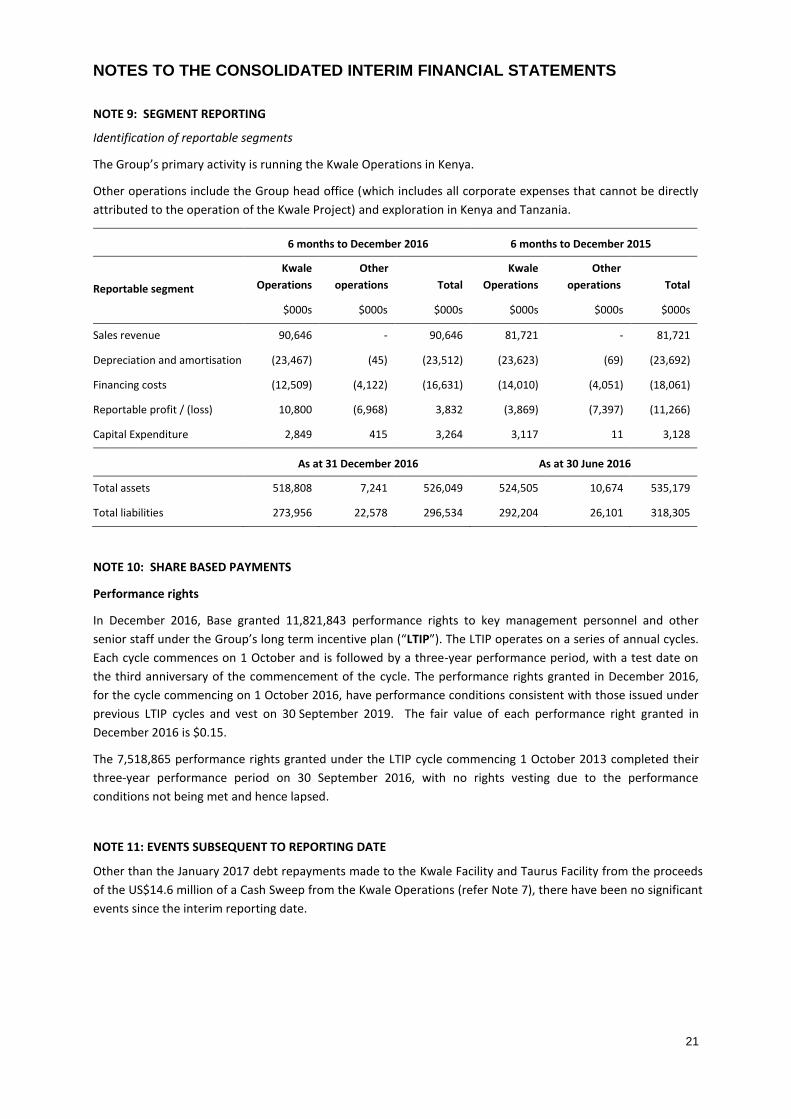
NOTE 9: SEGMENT REPORTING
Identification of reportable segments
The Group’s primary activity is running the Kwale Operations in Kenya.
Other operations include the Group head office (which includes all corporate expenses that cannot be directly
attributed to the operation of the Kwale Project) and exploration in Kenya and Tanzania.
6 months to December 2016 6 months to December 2015
Reportable segment
Kwale
Operations
Other
operations Total
Kwale
Operations
Other
operations Total
$000s $000s $000s $000s $000s $000s
Sales revenue 90,646 - 90,646 81,721 - 81,721
Depreciation and amortisation (23,467) (45) (23,512) (23,623) (69) (23,692)
Financing costs (12,509) (4,122) (16,631) (14,010) (4,051) (18,061)
Reportable profit / (loss) 10,800 (6,968) 3,832 (3,869) (7,397) (11,266)
Capital Expenditure 2,849 415 3,264 3,117 11 3,128
As at 31 December 2016 As at 30 June 2016
Total assets 518,808 7,241 526,049 524,505 10,674 535,179
Total liabilities 273,956 22,578 296,534 292,204 26,101 318,305
NOTE 10: SHARE BASED PAYMENTS
Performance rights
In December 2016, Base granted 11,821,843 performance rights to key management personnel and other
senior staff under the Group’s long term incentive plan (“LTIP”). The LTIP operates on a series of annual cycles.
Each cycle commences on 1 October and is followed by a three-year performance period, with a test date on
the third anniversary of the commencement of the cycle. The performance rights granted in December 2016,
for the cycle commencing on 1 October 2016, have performance conditions consistent with those issued under
previous LTIP cycles and vest on 30 September 2019. The fair value of each performance right granted in
December 2016 is $0.15.
The 7,518,865 performance rights granted under the LTIP cycle commencing 1 October 2013 completed their
three-year performance period on 30 September 2016, with no rights vesting due to the performance
conditions not being met and hence lapsed.
NOTE 11: EVENTS SUBSEQUENT TO REPORTING DATE
Other than the January 2017 debt repayments made to the Kwale Facility and Taurus Facility from the proceeds
of the US$14.6 million of a Cash Sweep from the Kwale Operations (refer Note 7), there have been no significant
events since the interim reporting date.

DIRECTORS’ DECLARATION
22
The directors of the Company declare that:
1. The interim financial statements and notes, as set out on pages 11 to 21, are in accordance with the
Corporations Act 2001 including:
a. giving a true and fair view of the Group’s financial position as at 31 December 2016 and of its
performance for the six month period ended on that date; and
b. complying with Australian Accounting Standard AASB 134 Interim Financial Reporting and the
Corporations Regulations 2001; and
2. In the directors’ opinion, there are reasonable grounds to believe that the Group will be able to pay its
debts as and when they become due and payable.
This declaration is made in accordance with a resolution of the Board of Directors.
Keith Spence
Director
Dated this 27th day of February 2017

23
Independent auditor’s review report to the members of Base Resources Limited
Report on the financial report
We have reviewed the accompanying interim financial report of Base Resource Limited, which comprises the
consolidated condensed statement of financial position as at 31 December 2016, consolidated condensed
statement or profit or loss and other comprehensive income, consolidated condensed statement of changes in
equity and consolidated condensed statement of cash flows for the half-year ended on that date, notes 1 to 11
comprising a summary of significant accounting policies and other explanatory information and the directors’
declaration of the Group comprising the company and the entities it controlled at the half-year’s end or from
time to time during the half-year.
Responsibility of the Directors for the interim financial report
The directors of the company are responsible for the preparation of the interim financial report that gives a
true and fair view in accordance with Australian Accounting Standards and the Corporations Act 2001 and for
such internal control as the directors determine is necessary to enable the preparation of the interim financial
report that is free from material misstatement, whether due to fraud or error.
Auditor’s responsibility for the review of the half-year financial report
Our responsibility is to express a conclusion on the interim financial report based on our review. We conducted
our review in accordance with Auditing Standard on Review Engagements ASRE 2410 Review of a Financial
Report Performed by the Independent Auditor of the Entity, in order to state whether, on the basis of the
procedures described, we have become aware of any matter that makes us believe that the interim financial
report is not in accordance with the Corporations Act 2001 including: giving a true and fair view of the Group’s
financial position as at 31 December 2016 and its performance for the half-year ended on that date; and
complying with Australian Accounting Standard AASB 134 Interim Financial Reporting and the Corporations
Regulations 2001. As auditor of base Resources Limited, ASRE 2410 requires that we comply with the ethical
requirements relevant to the audit of the annual financial report.
A review of an interim financial report consists of making enquiries, primarily of persons responsible for
financial and accounting matters, and applying analytical and other review procedures. A review is substantially
less in scope than an audit conducted in accordance with Australian Auditing Standards and consequently does
not enable us to obtain assurance that we would become aware of all significant matters that might be
identified in an audit. Accordingly, we do not express an audit opinion.
Independence
In conducting our review, we have complied with the independence requirements of the Corporations Act 2001.

24
Conclusion
Based on our review, which is not an audit, we have not become aware of any matter that makes us believe
that the interim financial report of Base Resources Limited is not in accordance with the Corporations Act 2001,
including:
(a) giving a true and fair view of the Group’s financial position as at 31 December 2016 and of its performance
for the half-year ended on that date; and
(b) complying with Australian Accounting Standard AASB 134 Interim Financial Reporting and the Corporations
Regulations 2001.
KPMG
R Gambitta
Partner
Perth
27 February 2017