Embed Size (px)
Citation preview
Barriers to women entrepreneurship. Different methods,different results?
Ana Tur-Porcar1 • Alicia Mas-Tur1 • Jose Antonio Belso2
� Springer Science+Business Media Dordrecht 2016
Abstract Building on research by Akehurst et al. (Serv Ind J 32:2489–2505, 2012), this
study analysed internal and external factors in women entrepreneurship and linked these
factors to the barriers that women face when starting businesses. To do so, two contrasting
statistical techniques were used: PLS and QCA. After analysing results from each of these
techniques, we observed that family duties and difficulties in obtaining financing (both
internal and external) were the main factors related to barriers faced by women
entrepreneurs.
Keywords Women entrepreneurship � Barriers � Partial least squares (PLS) � Qualitative
comparative analysis (QCA)
1 Introduction
Recent decades have seen the development of a broad range of ideas, debates and pro-
posals that analyse gender relationships as a means of understanding the economic, social,
political and institutional reality (Eddleston and Powell 2008). Such approaches combine
to form a new focus in the social sciences. Although this new focus fails to constitute a
comprehensive theory, it implies profound changes by rejecting conventional paradigms on
account of their bias in the concepts, categories and analytical framework they use (Ogbor
2000).
These criticisms of the hitherto dominant research approach have led to a surge in
studies into women’s business activity driven by the development in feminist economics.
Other milestones include events such as the 1997 OECD Conference on Women
& Ana [email protected]
1 Universitat de Valencia, Valencia, Spain
2 Universidad Miguel Hernandez, Elche, Spain
123
Qual QuantDOI 10.1007/s11135-016-0343-0

Entrepreneurs in SMEs in Paris, which brought together a great number of women
entrepreneurs from around the world and succeeded in attracting attention towards the
potential, opportunities and barriers related to women’s business activity (Iannello 1993).
The current research is built on the model proposed by Akehurst et al. (2012) who
analysed external and internal factors related to women entrepreneurs. Akehurst et al.
studied the external factors of business expansion and financing. Among the internal
factors were demographic characteristics of age, marital status, motherhood (whether the
woman has small children and how many), and the importance and influence of the family.
Using a series of regressions, Akehurst et al. observed these independent variables to be
related to motivation, barriers and success of women entrepreneurs. The present study built
on the model proposed by Akehurst et al. by focusing on the principal barriers faced by
women entrepreneurs (infrastructure/training and education barriers and gender barriers)
(Akehurst et al. 2012).
The aim of this study was twofold: first, to use different statistical techniques (PLS and
QCA) to test the results obtained by Akehurst et al. (2012), and second, to observe the
difference in results yielded by these two techniques.
To achieve these objectives, the article has the following structure. The next section
reviews the most recent theories on women entrepreneurship, and the education and
training/infrastructure barriers and gender barriers faced by women. In the third section,
the two methods (PLS and QCA) are compared theoretically to lay the foundation for
practical comparison in the fourth section to observe differences between results. The final
section presents the study’s conclusions.
2 Factors related to barriers to women entrepreneurship
As previously mentioned, this study explored factors related to the two types of barriers to
women entrepreneurship: external (business expansion and financing) and internal (de-
mographic characteristics of age, marital status, motherhood—small children and number
of small children—and importance and influence of the family).
Regarding business expansion, numerous authors have concluded that the majority of
women prefer to create businesses that are small in terms of both revenue and employment
(Carter and Rosa 1998; Cowling and Taylor 2001; Akehurst et al. 2012). This choice owes
to two main causes: (1) women experience greater difficulty than men do in securing
resources to finance their businesses and (2) women tend to have a greater lack of specific
knowledge than men do to skilfully perform their business activities. As we can see, both
reasons relate to discrimination against women in the labour market. Nevertheless, other
studies (Herron and Robinson 1993; Rey-Martı et al. 2015) have demonstrated that busi-
ness expansion also depends on business owners’ motivation and on attitude and intention
with respect to the future of the business. Along these lines, other studies (Fischer et al.
1993; Rosa et al. 1996; Du Rietz and Henrekson 2000) have reported that business size is
also related to women business owners’ motivations and attitudes towards expansion,
which differ from those of male business owners. Thus, although gender differences in
propensity for risk are not always present, women’s propensity for risk generally seems
lower than men’s (Akehurst et al. 2012).
Building on this theoretical framework, we formulated and tested the following
proposition: Business expansion is a barrier for woman entrepreneurs (H1).
A. Tur-Porcar et al.
123

Access to financing is a challenge faced by many women because of the additional
challenges they must overcome to secure resources (Hertz 2011). When starting busi-
nesses, women usually finance their ventures using funds from the family economy. Thus,
the state of the family economy is important for women entrepreneurs. Nevertheless, as
numerous studies have shown, a lack of capital in the early stages can negatively affect
businesses in the long term. Researchers have demonstrated that less initial capital influ-
ences the business owner’s capacity to achieve bank financing (Storey 1994). Likewise,
other studies have shown that the percentage of women business owners who use their
savings to fund business operations falls after the first year, whereas the percentage of
women business owners who use bank loans increases after the first year (Welsh et al.
2014).
Another key aspect of financing is the fact that access to capital is a critical issue for the
survival of SMEs. Without sufficient financial resources, business owners cannot develop
new products and services, commit to expansion plans, create jobs, or perform a host of
other actions. Along these lines, certain authors have concluded that the ease of access to
financing is related to whether the business is created and run by a woman. Several studies
have demonstrated that women have to secure financing under less favourable conditions
than men do (Pellegrino and Reece 1982; Coleman 2000). Similarly, other authors have
concluded that women entrepreneurs encounter greater difficulties than men do in
accessing the financial resources necessary to start a business activity and that women
encounter problems of credibility when dealing with financial institutions (Orhan 2001;
Verheul and Thurik 2001).
In accordance with this theoretical and empirical basis, we formulated and tested the
following proposition: The difficulty in accessing financing is a barrier for woman
entrepreneurs (H2).
We now examine demographic characteristics of women such as age, marital status,
having small children and the number of small children. There does not seem to be a direct
relationship between age and an increase in business difficulties, as reported by Bates
(2002) and Lerner and Almor (2002). Most women entrepreneurs begin their business
projects aged between 36 and 45, although many women also start businesses aged
between 26 and 35. The fact that the majority of women are 36 or older could be influenced
by their status as mothers (i.e., whether they have children and how many children they
have) (Yilmaz and Oraman 2012).
In contrast, scholars have reported a relationship between women business owners’
marital status and their business activity (DeMartino and Barbato 2003; Hinz 2004).
Women seek a balance between work needs and the needs of raising a family (Morris et al.
2006). Results indicate that having a family does not hinder business creation among
women (Ronsen 2014). As Carter and Rosa (1998) reported, however, women business
owners are more successful when they do not seek to mix family with business.
With respect to children, the literature is ambiguous: some authors have reported a
relationship between business activity and having young children (Carter and Rosa 1998),
whereas other authors have reported that children negatively influence job creation and
therefore the expansion of women’s businesses Brush (1992), Brush et al. (2003); Kevane
and Wydick 2001).
Based on this conceptual framework, we formulated and tested the following propo-
sition: Women entrepreneurs’ demographic characteristics are a barrier for them (H3).
The influence of the family can also affect business creation by women. Support from
the family towards women is a key factor in business success (Steier et al. 2009). Family
support positively affects business performance. Conversely, family problems negatively
Barriers to women entrepreneurship. Different methods…
123

affect business performance. Bruce (1999) reported that the probability that a woman
becomes a business owner if her husband also owns a business is twice the probability if
the husband does not own a business. Similarly, Hisrich and Brush (1983) observed that
nearly 50 % of women entrepreneurs’ fathers own businesses.
Consistent with this theoretical framework, we formulated and tested the following
proposition: Women business owners’ family ties influence the barriers they face (H4).
3 Methodology: PLS & QCA
This research employed two methodologies: one quantitative, namely partial least squares
(PLS), and the other qualitative, namely qualitative comparative analysis (QCA) in its
fuzzy-set form (fsQCA).
3.1 Partial least squares—PLS
Partial least squares (PLS) is an extension of principle component analysis (PCA) (Wold
et al. 1983). Both methods follow the principal known as soft modelling, which means
analysis of models based on empirical data rather than theoretical or logical constructions,
as is the case in hard modelling (Sundbom 1992). Therefore, PLS can be used to clarify
complex patterns in the data.
The aim of PCA is to find inherent structure in a dataset. All variables in the datasets are
processed simultaneously and are then ordered to find variables with the highest loading.
The variables that supply little information are dropped. These new information-carrying
components are called principle components (Henningsson et al. 2001).
PLS is a statistical data analysis method built on multivariate regression. PLS uses the
projection of latent variables to reduce strongly correlated dimensional data into a much
smaller dataset that can thus be interpreted (Bang et al. 2002). This method’s objective is to
predict the dependent variable (Cepeda and Roldan 2004). The original PLS algorithm was
developed as a linear regression method using an internal linear relation in the latent space
(Bang et al. 2002). According to Chin et al. (2003), PLS is the most suitable method to
perform predictive studies.
According to Bang et al. (1998), PLS is a multivariate linear regression algorithm that
can handle correlated inputs and limited data. The algorithm reduces the dimension of the
input variables (input matrix, X) into the lower-dimension response variables (output
matrix, Y) via projections in the directions (input and output of weight w weight c) that
maximize the covariance between the input and output variables.
This projection method is decomposed into variables of high collinearity and unidi-
mensional variables. A small number of principle components is calculated. The main
difference with other methods is that this process is carried out for both matrix X and
matrix Y, and the relationship between these two datasets is maximized. Testing is carried
out using cross-validation (goodness of prediction, or value Q2). The value Q2 is a measure
of the model’s predictive capability. A value greater than 0.1 implies significant predictive
power in the model. The R2 values explain the variance or ‘‘goodness of fit’’ of the model.
Adding more components to a model can increase the explained variance (Henningsson
et al. 2001).
The PLS method is used in a variety of areas where multivariate data emerge both in
theoretical research and in reality (Bang et al. 1998). This method was designed to reflect
A. Tur-Porcar et al.
123
the theoretical and empirical conditions of social sciences and behaviour, where it is
common to encounter situations with little theoretical grounding and scarce information
(Wold 1979).
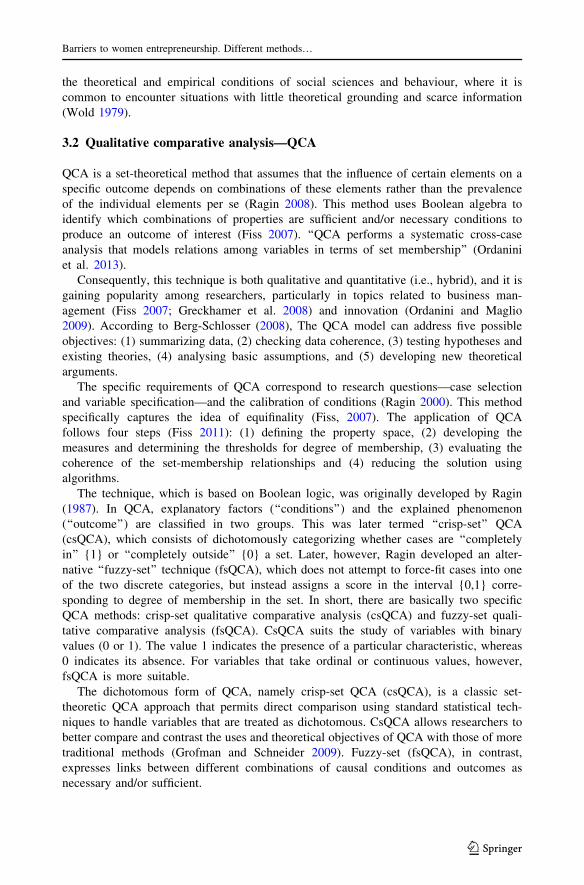
3.2 Qualitative comparative analysis—QCA
QCA is a set-theoretical method that assumes that the influence of certain elements on a
specific outcome depends on combinations of these elements rather than the prevalence
of the individual elements per se (Ragin 2008). This method uses Boolean algebra to
identify which combinations of properties are sufficient and/or necessary conditions to
produce an outcome of interest (Fiss 2007). ‘‘QCA performs a systematic cross-case
analysis that models relations among variables in terms of set membership’’ (Ordanini
et al. 2013).
Consequently, this technique is both qualitative and quantitative (i.e., hybrid), and it is
gaining popularity among researchers, particularly in topics related to business man-
agement (Fiss 2007; Greckhamer et al. 2008) and innovation (Ordanini and Maglio
2009). According to Berg-Schlosser (2008), The QCA model can address five possible
objectives: (1) summarizing data, (2) checking data coherence, (3) testing hypotheses and
existing theories, (4) analysing basic assumptions, and (5) developing new theoretical
arguments.
The specific requirements of QCA correspond to research questions—case selection
and variable specification—and the calibration of conditions (Ragin 2000). This method
specifically captures the idea of equifinality (Fiss, 2007). The application of QCA
follows four steps (Fiss 2011): (1) defining the property space, (2) developing the
measures and determining the thresholds for degree of membership, (3) evaluating the
coherence of the set-membership relationships and (4) reducing the solution using
algorithms.
The technique, which is based on Boolean logic, was originally developed by Ragin
(1987). In QCA, explanatory factors (‘‘conditions’’) and the explained phenomenon
(‘‘outcome’’) are classified in two groups. This was later termed ‘‘crisp-set’’ QCA
(csQCA), which consists of dichotomously categorizing whether cases are ‘‘completely
in’’ {1} or ‘‘completely outside’’ {0} a set. Later, however, Ragin developed an alter-
native ‘‘fuzzy-set’’ technique (fsQCA), which does not attempt to force-fit cases into one
of the two discrete categories, but instead assigns a score in the interval {0,1} corre-
sponding to degree of membership in the set. In short, there are basically two specific
QCA methods: crisp-set qualitative comparative analysis (csQCA) and fuzzy-set quali-
tative comparative analysis (fsQCA). CsQCA suits the study of variables with binary
values (0 or 1). The value 1 indicates the presence of a particular characteristic, whereas
0 indicates its absence. For variables that take ordinal or continuous values, however,
fsQCA is more suitable.
The dichotomous form of QCA, namely crisp-set QCA (csQCA), is a classic set-
theoretic QCA approach that permits direct comparison using standard statistical tech-
niques to handle variables that are treated as dichotomous. CsQCA allows researchers to
better compare and contrast the uses and theoretical objectives of QCA with those of more
traditional methods (Grofman and Schneider 2009). Fuzzy-set (fsQCA), in contrast,
expresses links between different combinations of causal conditions and outcomes as
necessary and/or sufficient.
Barriers to women entrepreneurship. Different methods…
123
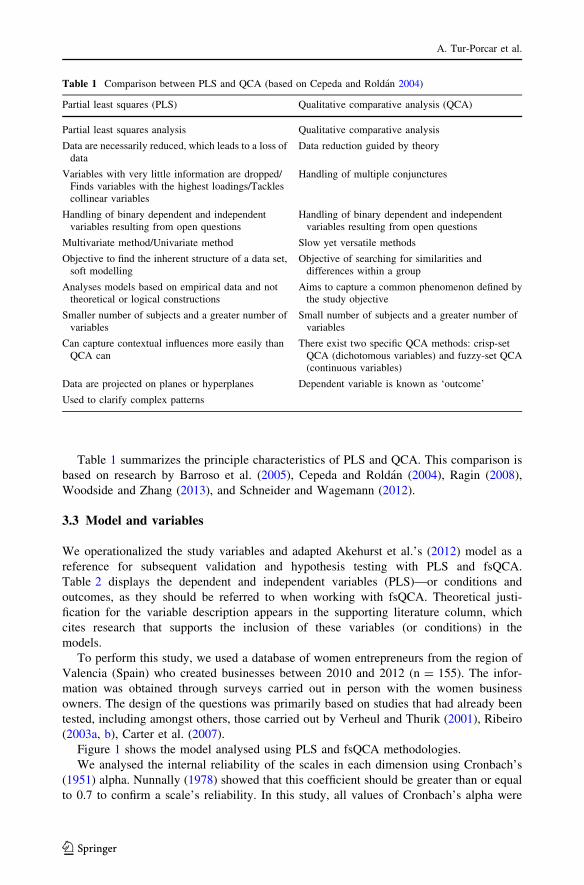
Table 1 summarizes the principle characteristics of PLS and QCA. This comparison is
based on research by Barroso et al. (2005), Cepeda and Roldan (2004), Ragin (2008),
Woodside and Zhang (2013), and Schneider and Wagemann (2012).
3.3 Model and variables
We operationalized the study variables and adapted Akehurst et al.’s (2012) model as a
reference for subsequent validation and hypothesis testing with PLS and fsQCA.
Table 2 displays the dependent and independent variables (PLS)—or conditions and
outcomes, as they should be referred to when working with fsQCA. Theoretical justi-
fication for the variable description appears in the supporting literature column, which
cites research that supports the inclusion of these variables (or conditions) in the
models.
To perform this study, we used a database of women entrepreneurs from the region of
Valencia (Spain) who created businesses between 2010 and 2012 (n = 155). The infor-
mation was obtained through surveys carried out in person with the women business
owners. The design of the questions was primarily based on studies that had already been
tested, including amongst others, those carried out by Verheul and Thurik (2001), Ribeiro
(2003a, b), Carter et al. (2007).
Figure 1 shows the model analysed using PLS and fsQCA methodologies.
We analysed the internal reliability of the scales in each dimension using Cronbach’s
(1951) alpha. Nunnally (1978) showed that this coefficient should be greater than or equal
to 0.7 to confirm a scale’s reliability. In this study, all values of Cronbach’s alpha were
Table 1 Comparison between PLS and QCA (based on Cepeda and Roldan 2004)
Partial least squares (PLS) Qualitative comparative analysis (QCA)
Partial least squares analysis Qualitative comparative analysis
Data are necessarily reduced, which leads to a loss ofdata
Data reduction guided by theory
Variables with very little information are dropped/Finds variables with the highest loadings/Tacklescollinear variables
Handling of multiple conjunctures
Handling of binary dependent and independentvariables resulting from open questions
Handling of binary dependent and independentvariables resulting from open questions
Multivariate method/Univariate method Slow yet versatile methods
Objective to find the inherent structure of a data set,soft modelling
Objective of searching for similarities anddifferences within a group
Analyses models based on empirical data and nottheoretical or logical constructions
Aims to capture a common phenomenon defined bythe study objective
Smaller number of subjects and a greater number ofvariables
Small number of subjects and a greater number ofvariables
Can capture contextual influences more easily thanQCA can
There exist two specific QCA methods: crisp-setQCA (dichotomous variables) and fuzzy-set QCA(continuous variables)
Data are projected on planes or hyperplanes Dependent variable is known as ‘outcome’
Used to clarify complex patterns
A. Tur-Porcar et al.
123

Table 2 Variable definitions
Label Variable Description Supporting literature
EXP Businessexpansion
Business size the entrepreneur hoped toachieve in the near future (within3 years)
Hisrich and Brush (1983), Carterand Rosa (1998), Herron andRobinson (1993), Fischer et al.(1993), Rosa et al. (1996), DuRietz and Henrekson (2000),Cowling and Taylor (2001),Akehurst et al. (2012)
IF Internal financing Access to financing from own resourcesor from loans from family and friends
Pellegrino and Reece (1982),Storey (1994), Coleman (2000),Orhan (2001), Verheul andThurik (2001), Hertz (2011),Welsh et al. (2014)
EF Externalfinancing
Access to bank financing, venture capital,public aids or subsidies and commercialloans
AGE Age Age when the business was created Bates (2002), Lerner and Almor(2002), Yilmaz and Oraman(2012), Martı et al. (2014)
CHIL Family/children Number of children when the businesswas created
Carter and Rosa (1998), Brush(1992, 2003), Kevane andWydick (2001), DeMartino andBarbato (2003), Hinz (2004),Morris et al. (2006), Ronsen(2014)
STA Marital status Marital status when the business wascreated
Carter and Rosa (1998), Brush(1992, 2003), Kevane andWydick (2001), DeMartino andBarbato (2003), Hinz (2004),Morris et al. (2006), Ronsen(2014)
FAM/FRI
Family support Support received from the familyenvironment when the business wascreated
Hisrich and Brush (1983), Bruce(1999), Steier et al. (2009)
GEN Gender barriers Set of three questions from thequestionnaire: women encountergreater difficulty than men do to createbusinesses; women receive less supportfrom society than men do to createbusinesses; gender discrimination
Hisrich and Brush (1983), Carterand Rosa (1998), Cooper(1993), Herron and Robinson(1993), Fischer et al. (1993),Rosa et al. (1996), Du Rietz andHenrekson (2000), Cowling andTaylor (2001), Orhan (2001),Verheul and Thurik (2001),DeMartino and Barbato (2003),Hinz (2004), Morris et al.(2006), Hertz (2011), Akehurstet al. (2012), Huarng et al.(2012), Welsh et al. (2014),Rey-Martı et al. (2015), Ronsen(2014)
INFR Training andeducation/infrastructurebarriers
Set of six questions from thequestionnaire: lack of advice andinformation about the business activity;deficient transport and communication;lack of business training; problems tobalance business activities with familyduties; lack of contact with businessinstitutions; lack of business rolemodels
Barriers to women entrepreneurship. Different methods…
123

greater than 0.78. Next, as per Akehurst et al.’s (2012) study, we performed factor analysis
to identify principle factors and thus reduce dimensions in the model.
In the following paragraph, we will do a PLS analysis and a QCA analysis to test the
results that were obtained using regression analysis.
4 Results
4.1 Partial least squares (PLS)
4.1.1 Results
Using SIMCA – T ? by Umetrics (2008), we obtained the following results. First, the
variance in the dependent variable in both models (infrastructure/training and education
barriers and gender barriers) was 90 %, with a very similar predictive power. Independent
variables were almost completely explained (90 %).
Figure 2 shows the variables (x’s and y’s) in the PLS components. The closer the
x variables are to the y variables, the greater the positive effect of these variables. If the
x variables appear in a different quadrant from the y variables, then they are negatively
related (in the corresponding component). Therefore, in this study, all variables were
positively related, except external financing.
Fig. 1 Theoretical model
A. Tur-Porcar et al.
123
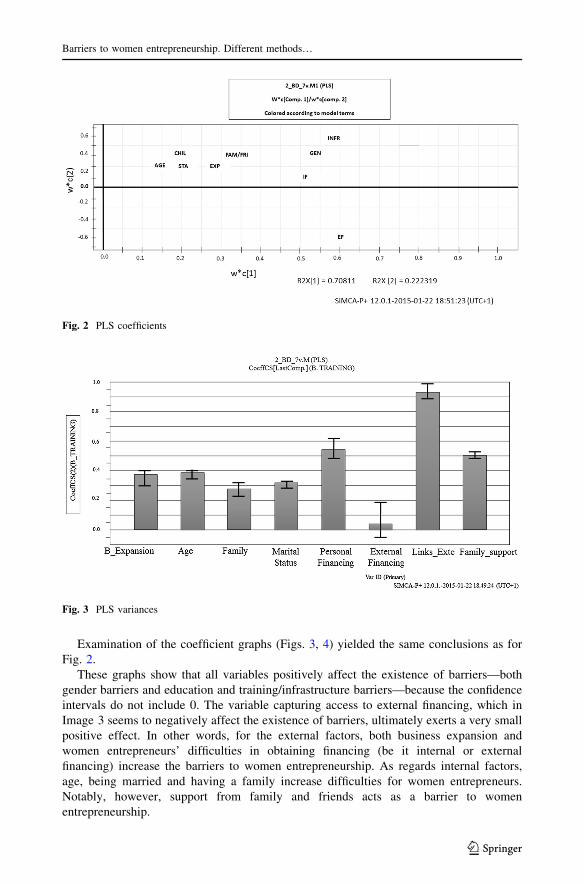
Examination of the coefficient graphs (Figs. 3, 4) yielded the same conclusions as for
Fig. 2.
These graphs show that all variables positively affect the existence of barriers—both
gender barriers and education and training/infrastructure barriers—because the confidence
intervals do not include 0. The variable capturing access to external financing, which in
Image 3 seems to negatively affect the existence of barriers, ultimately exerts a very small
positive effect. In other words, for the external factors, both business expansion and
women entrepreneurs’ difficulties in obtaining financing (be it internal or external
financing) increase the barriers to women entrepreneurship. As regards internal factors,
age, being married and having a family increase difficulties for women entrepreneurs.
Notably, however, support from family and friends acts as a barrier to women
entrepreneurship.
Fig. 3 PLS variances
Fig. 2 PLS coefficients
Barriers to women entrepreneurship. Different methods…
123

4.2 Fuzzy-set qualitative comparative analysis (fsQCA)
4.2.1 Calibration
Following Ragin’s (2008) recommendations, the first step when working with fsQCA was
to calibrate the data. Calibration in fsQCA consists of establishing levels to represent
degrees of membership to the group. Specifically, the degree of membership ranges from 0
to 1, with 0 representing non-membership and 1 representing complete membership (Ragin
2008). In this research, we used fsQCA 2.5 software (Ragin and Davey 2014) to perform
the direct calibration method, as proposed by Ragin (2008). This method requires users to
establish the thresholds for non-membership (0), maximum ambiguity/crossover point
(0.5) and total membership (1).
To establish these three thresholds, we followed the recommendations proposed by
Ragin (2008), Rihoux and Ragin (2009), Crilly et al. (2012), Schneider and Wagemann
(2012), Woodside and Zhang (2013).
Table 3 shows the thresholds established for each condition and for the outcomes. Owing
to the nature of the conditions FAM and STA, we established the calibration as 0 (full non-
membership) or 1 (full membership). In addition, the variable FAM was subdivided into two
variables to allow us to perform the analysis correctly, giving rise to the variable FAM (family
support) and the variable FRI (support from friends and acquaintances).
4.2.2 Results of fsQCA
First, we performed an analysis of necessary conditions for the outcomes of training and
education/infrastructure barriers and gender barriers. To imply that a condition is neces-
sary, consistency must be greater than 0.9 (Ragin 2008; Schneider et al. 2010).
First, Table 4 shows that having children (0.98) is the only condition with a consistency
greater than 0.90 for both training barriers and gender barriers. Second, demographic
characteristics (age ? family ? marital status), with a consistency of 0.98 for both types
of barriers, constitute a necessary condition. Third, the conditions of financing (inter-
nal ? external) yield values of 0.92 and 0.93 for the training and gender barriers,
respectively, and are also found to be barriers to women entrepreneurs.
Fig. 4 PLS variances
A. Tur-Porcar et al.
123

Next, we performed the analysis of sufficient conditions. To obtain causal conditions
sufficient to produce the outcome, we computed the truth table with 256 (28) combinations,
establishing a consistency cut-off of 0.800167 and 0.804062 for training and gender bar-
riers, respectively.
Table 3 Fuzzy-set scores
Variables 0.05 (full non-membership) 0.5 (crossover point) 0.95 (full membership)
EXP 1.5 3.5 4.5
AGE 1.5 3.5 4.5
IF 1 7.1 14.80
EF 0.7 8.1 13.2
FAM 1.5 2.5 4.5
FRI 6 8.1 10
INFR 9.36 17.1 26
GEN 5.0 9.1 13.64
0 (full non-membership) 1 (full membership)
CHIL No children Has children
STA Not in a stable relationship In a stable relationship
Table 4 Necessary conditions
Conditions INFR GEN
Consistency Coverage Consistency Coverage
EXP 0.629910 0.741536 0.624407 0.738563
*EXP 0.727553 0.644624 0.737783 0.656805
AGE 0.793631 0.619470 0.799497 0.627026
*AGE 0.554012 0.794887 0.543843 0.784018
CHIL 0.986111 0.502071 0.986177 0.504500
*CHIL 0.013889 0.990000 0.013823 0.990000
STA 0.626824 0.502022 0.634460 0.510562
*STA 0.373176 0.511538 0.365540 0.503462
FAM 0.877946 0.574814 0.890115 0.585561
*FAM 0.335017 0.743231 0.329936 0.735450
IF 0.701880 0.642481 0.675789 0.621549
*IF 0.496352 0.560431 0.536163 0.608269
EF 0.798260 0.584609 0.823234 0.605774
*EF 0.347643 0.567438 0.321977 0.528051
FRI 0.676347 0.628553 0.671740 0.627249
*FRI 0.575898 0.638414 0.571628 0.636703
AGE ? CHIL ? STA 0.986111 0.502071 0.986177 0.504500
IF ? EF 0.929153 0.584864 0.936750 0.592458
‘‘*’’ indicates absence of the condition and ‘‘?’’ indicates OR
Barriers to women entrepreneurship. Different methods…
123
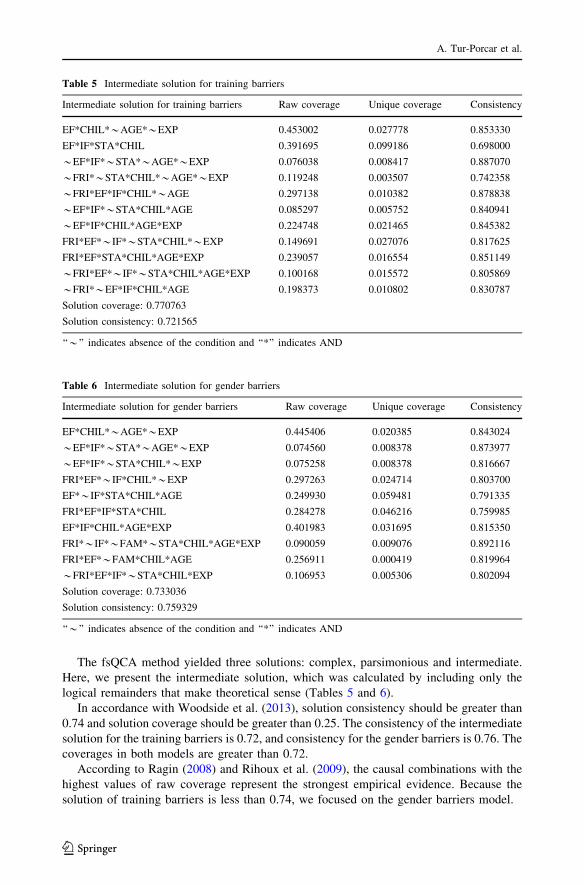
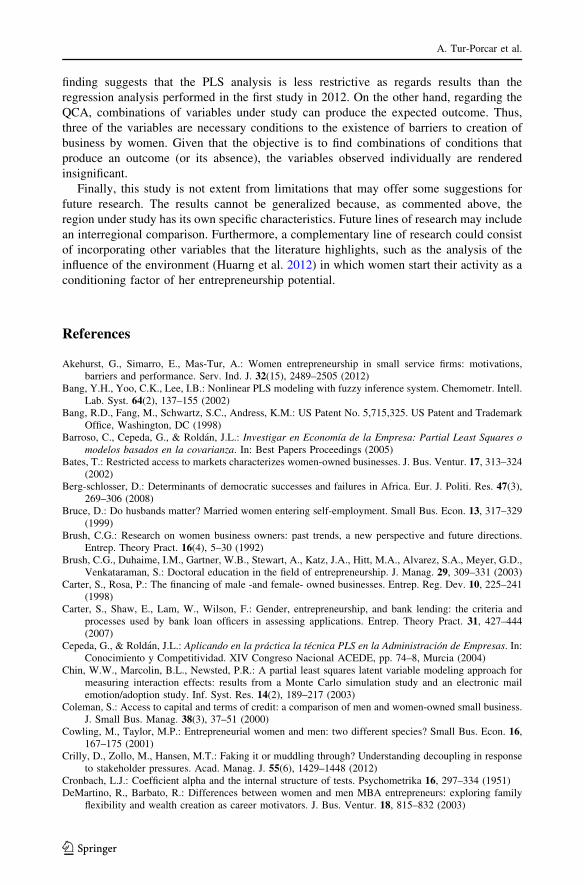
The fsQCA method yielded three solutions: complex, parsimonious and intermediate.
Here, we present the intermediate solution, which was calculated by including only the
logical remainders that make theoretical sense (Tables 5 and 6).
In accordance with Woodside et al. (2013), solution consistency should be greater than
0.74 and solution coverage should be greater than 0.25. The consistency of the intermediate
solution for the training barriers is 0.72, and consistency for the gender barriers is 0.76. The
coverages in both models are greater than 0.72.
According to Ragin (2008) and Rihoux et al. (2009), the causal combinations with the
highest values of raw coverage represent the strongest empirical evidence. Because the
solution of training barriers is less than 0.74, we focused on the gender barriers model.
Table 5 Intermediate solution for training barriers
Intermediate solution for training barriers Raw coverage Unique coverage Consistency
EF*CHIL**AGE**EXP 0.453002 0.027778 0.853330
EF*IF*STA*CHIL 0.391695 0.099186 0.698000
*EF*IF**STA**AGE**EXP 0.076038 0.008417 0.887070
*FRI**STA*CHIL**AGE**EXP 0.119248 0.003507 0.742358
*FRI*EF*IF*CHIL**AGE 0.297138 0.010382 0.878838
*EF*IF**STA*CHIL*AGE 0.085297 0.005752 0.840941
*EF*IF*CHIL*AGE*EXP 0.224748 0.021465 0.845382
FRI*EF**IF**STA*CHIL**EXP 0.149691 0.027076 0.817625
FRI*EF*STA*CHIL*AGE*EXP 0.239057 0.016554 0.851149
*FRI*EF**IF**STA*CHIL*AGE*EXP 0.100168 0.015572 0.805869
*FRI**EF*IF*CHIL*AGE 0.198373 0.010802 0.830787
Solution coverage: 0.770763
Solution consistency: 0.721565
‘‘*’’ indicates absence of the condition and ‘‘*’’ indicates AND
Table 6 Intermediate solution for gender barriers
Intermediate solution for gender barriers Raw coverage Unique coverage Consistency
EF*CHIL**AGE**EXP 0.445406 0.020385 0.843024
*EF*IF**STA**AGE**EXP 0.074560 0.008378 0.873977
*EF*IF**STA*CHIL**EXP 0.075258 0.008378 0.816667
FRI*EF**IF*CHIL**EXP 0.297263 0.024714 0.803700
EF**IF*STA*CHIL*AGE 0.249930 0.059481 0.791335
FRI*EF*IF*STA*CHIL 0.284278 0.046216 0.759985
EF*IF*CHIL*AGE*EXP 0.401983 0.031695 0.815350
FRI**IF**FAM**STA*CHIL*AGE*EXP 0.090059 0.009076 0.892116
FRI*EF**FAM*CHIL*AGE 0.256911 0.000419 0.819964
*FRI*EF*IF**STA*CHIL*EXP 0.106953 0.005306 0.802094
Solution coverage: 0.733036
Solution consistency: 0.759329
‘‘*’’ indicates absence of the condition and ‘‘*’’ indicates AND
A. Tur-Porcar et al.
123

The causal conditions with the greatest raw coverages—thereby representing the
strongest empirical evidence—are as follows:
A. EF*CHIL**AGE**EXP
B. EF*IF*CHIL*AGE*EXP
The consistency of the solutions is 0.84 and 0.81, respectively, so both values are
greater than 0.75 and therefore meet Ragin’s (2008) criterion.
The causal recipe (A) shows that difficulties in securing external financing facing young
women entrepreneurs with children and a lack of expectations to expand contributes to
gender barriers.
The causal recipe (B) shows that difficulties in obtaining financing (whether internal or
external) together with having children in older female entrepreneurs contributes to gender
barriers.
5 Conclusions
This study had two objectives. The first objective was to extend the literature on barriers
faced by women entrepreneurs, and the second objective was to observe differences
between results of the same analysis conducted using two statistical methodologies: one
quantitative (PLS) and one qualitative (QCA).
All hypotheses were validated using PLS. Notably, however, in hypothesis 3, support
from family and friends also presents a barrier to the creation of businesses by women. In
this regard, some authors have established that women with greater independence achieve
better results in their business activities. Given our results, it seems reasonable to think that
women entrepreneurs are forced to achieve their business objectives with complete
autonomy.
Regarding the fsQCA methodology, demographic characteristics of age, marital status
and having small children are strongly related to the existence of both types of barriers. In
addition, the combination of all three (age ? marital status ? children) is a necessary
condition for the existence of gender barriers and education and training/infrastructure
barriers. Furthermore, access to financing (i.e. internal or external) is also related to dif-
ficulties for women entrepreneurs. Finally, business expansion is not a necessary condition,
but the combination of this characteristic with other conditions does form part of the
gender barriers. Therefore, two of the hypotheses (H1 and H4) remain unconfirmed for
education and training/infrastructure barriers, and H4 remains unconfirmed for gender
barriers. The fsQCA method thus failed to find a relationship between the conditions
studied and the barriers to women entrepreneurship.
Among the main conclusions in Akehurst et al. (2012) article we can find the following.
Firstly, regarding financing, financial support to women affects the motivations and
obstacles of her entrepreneurial venture. Secondly, as regards demographic factors, being
single has a positive influence on ambition to becoming entrepreneur. Similarly, the age at
which women found a firm affects both innate entrepreneurial attitude of the woman
entrepreneur as well as the obstacles that she has to face and the success of the firm.
Thirdly, female entrepreneurs that own bigger firms and firms that were founded with
family loans have a higher success rate.
After performing the PLS analysis, we observe how almost all variables in the study are
related to entrepreneurship barriers that women face upon creating their own business. This
Barriers to women entrepreneurship. Different methods…
123
finding suggests that the PLS analysis is less restrictive as regards results than the
regression analysis performed in the first study in 2012. On the other hand, regarding the
QCA, combinations of variables under study can produce the expected outcome. Thus,
three of the variables are necessary conditions to the existence of barriers to creation of
business by women. Given that the objective is to find combinations of conditions that
produce an outcome (or its absence), the variables observed individually are rendered
insignificant.
Finally, this study is not extent from limitations that may offer some suggestions for
future research. The results cannot be generalized because, as commented above, the
region under study has its own specific characteristics. Future lines of research may include
an interregional comparison. Furthermore, a complementary line of research could consist
of incorporating other variables that the literature highlights, such as the analysis of the
influence of the environment (Huarng et al. 2012) in which women start their activity as a
conditioning factor of her entrepreneurship potential.
References
Akehurst, G., Simarro, E., Mas-Tur, A.: Women entrepreneurship in small service firms: motivations,barriers and performance. Serv. Ind. J. 32(15), 2489–2505 (2012)
Bang, Y.H., Yoo, C.K., Lee, I.B.: Nonlinear PLS modeling with fuzzy inference system. Chemometr. Intell.Lab. Syst. 64(2), 137–155 (2002)
Bang, R.D., Fang, M., Schwartz, S.C., Andress, K.M.: US Patent No. 5,715,325. US Patent and TrademarkOffice, Washington, DC (1998)
Barroso, C., Cepeda, G., & Roldan, J.L.: Investigar en Economıa de la Empresa: Partial Least Squares omodelos basados en la covarianza. In: Best Papers Proceedings (2005)
Bates, T.: Restricted access to markets characterizes women-owned businesses. J. Bus. Ventur. 17, 313–324(2002)
Berg-schlosser, D.: Determinants of democratic successes and failures in Africa. Eur. J. Politi. Res. 47(3),269–306 (2008)
Bruce, D.: Do husbands matter? Married women entering self-employment. Small Bus. Econ. 13, 317–329(1999)
Brush, C.G.: Research on women business owners: past trends, a new perspective and future directions.Entrep. Theory Pract. 16(4), 5–30 (1992)
Brush, C.G., Duhaime, I.M., Gartner, W.B., Stewart, A., Katz, J.A., Hitt, M.A., Alvarez, S.A., Meyer, G.D.,Venkataraman, S.: Doctoral education in the field of entrepreneurship. J. Manag. 29, 309–331 (2003)
Carter, S., Rosa, P.: The financing of male -and female- owned businesses. Entrep. Reg. Dev. 10, 225–241(1998)
Carter, S., Shaw, E., Lam, W., Wilson, F.: Gender, entrepreneurship, and bank lending: the criteria andprocesses used by bank loan officers in assessing applications. Entrep. Theory Pract. 31, 427–444(2007)
Cepeda, G., & Roldan, J.L.: Aplicando en la practica la tecnica PLS en la Administracion de Empresas. In:Conocimiento y Competitividad. XIV Congreso Nacional ACEDE, pp. 74–8, Murcia (2004)
Chin, W.W., Marcolin, B.L., Newsted, P.R.: A partial least squares latent variable modeling approach formeasuring interaction effects: results from a Monte Carlo simulation study and an electronic mailemotion/adoption study. Inf. Syst. Res. 14(2), 189–217 (2003)
Coleman, S.: Access to capital and terms of credit: a comparison of men and women-owned small business.J. Small Bus. Manag. 38(3), 37–51 (2000)
Cowling, M., Taylor, M.P.: Entrepreneurial women and men: two different species? Small Bus. Econ. 16,167–175 (2001)
Crilly, D., Zollo, M., Hansen, M.T.: Faking it or muddling through? Understanding decoupling in responseto stakeholder pressures. Acad. Manag. J. 55(6), 1429–1448 (2012)
Cronbach, L.J.: Coefficient alpha and the internal structure of tests. Psychometrika 16, 297–334 (1951)DeMartino, R., Barbato, R.: Differences between women and men MBA entrepreneurs: exploring family
flexibility and wealth creation as career motivators. J. Bus. Ventur. 18, 815–832 (2003)
A. Tur-Porcar et al.
123

Du Rietz, A., Henrekson, M.: Testing the female underperformance hypothesis. Small Bus. Econ. 14, 1–10(2000)
Eddleston, K.A., Powell, G.N.: The role of gender identity in explaining sex differences in business owners’career satisfier preferences. J. Bus. Ventur. 23(2), 244–256 (2008)
Fischer, E., Reuber, R., Dyke, L.: A theoretical overview and extension of research on sex, gender andentrepreneurship. J. Bus. Ventur. 8, 151–168 (1993)
Fiss, P.C.: A set-theoretic approach to organizational configurations. Acad. Manag. Rev. 32(4), 1180–1198(2007)
Fiss, Peer C.: Building better causal theories: a fuzzy set approach to typologies in organization research.Acad. Manag. J. 54(2), 393–420 (2011)
Greckhamer, T., Misangyi, V.F., Elms, H., Lacey, R.: Using QCA in strategic management research: anexamination of combinations of industry, corporate, and business unit effects. Organ. Res. Methods11(4), 695–726 (2008)
Grofman, B., Schneider, C.Q.: An introduction to crisp set QCA, with a comparison to binary logisticregression. Political Res. Q. 62, 662–672 (2009)
Henningsson, M., Sundbom, E., Armelius, B.-A., Erdberg, P.: PLS model building: a multivariate approachto personality test data. Scand. J. Psychol. 42, 399–409 (2001)
Hertz, N.: Women and Banks Are Female Customers Facing Discrimination. IRRP 2011. Institute for PublicPolicy Research, London (2011)
Herron, L., Robinson, R.: A structural model of the effects of entrepreneurial characteristics on ventureperformance. J. Bus. Ventur. 8, 281–294 (1993)
Hinz, C.: Women beyond the pale: marital ‘‘misfits and outcasts’’ among Japanese women entrepreneurs.Womens Stud. 33, 453–479 (2004)
Hisrich, R.D., Brush, C.G.: The Woman Entrepreneur: Implications of Family, Educational, and Occupa-tional Experience. Frontiers of Entrepreneurship Research, pp. 255–270. Babson College, Wellesley(1983)
Huarng, K.H., Mas-Tur, A., Yu, T.H.K.: Factors affecting the success of women entrepreneurs. Int. Entrep.Manag. J. 8(4), 487–497 (2012)
Ianello, K.P.: Decisions Without Hierarchy: Feminist Interventions in Organization Theory and Practice.Routledge, New York (1993)
Kevane, M., Wydick, B.: Microenterprise lending to female entrepreneurs: sacrificing economic growth forpoverty alleviation? World Dev. 29, 1225–1236 (2001)
Lerner, M., Almor, T.: Relationships among strategic capabilities and the performance of women-ownedsmall ventures. J. Small Bus. Manag. 40, 109–125 (2002)
Morris, M.H., Miyasaki, N.N., Watters, C., Coombes, S.M.: The dilemma of growth: understanding venturesize choices of women entrepreneurs. J. Small Bus. Manag. 44(2), 221–244 (2006)
Nunnally, J.: Psychometric Methods. McGraw, New York (1978)Pellegrino, E.T., Reece, B.L.: Perceived formative and operational problems encountered by female
entrepreneurs in retail and service firms. J. Small Bus. Manag. 20(2), 15–24 (1982)Ogbor, J.O.: Mythicizing and reification in entrepreneurial discourse: ideology-critique of entrepreneurial
studies. J. Manag. Stud. 37(5), 605–635 (2000)Ordanini, A., Maglio, P.P.: Market orientation, internal process, and external network: a qualitative com-
parative analysis of decisional alternatives in new service development. Decis. Sci. 40(3), 601–625(2009)
Ordanini, A., Parasuraman, A., Rubera, G.: When the recipe is more important than the ingredients aqualitative comparative analysis (QCA) of service innovation configurations. J. Serv. Res. 17,1094670513513337 (2013)
Orhan, M.: Women business owners in France: the issue of financing discrimination. J. Small Bus. Manag.39, 95–102 (2001)
Ragin, C.C.: The Comparative Method: Moving Beyond Qualitative and Quantitative Strategies. Universityof California Press, Berkeley (1987)
Ragin, Charles C.: Fuzzy-Set Social Science. University of Chicago Press, Chicago (2000)Ragin, C.C.: Redesigning Social Inquiry: Fuzzy Sets and Beyond. University of Chicago Press, Chicago
(2008)Ragin, C.C., Davey, S.: fs/QCA [Computer Programme], version 2.5. University of California, Irvine, CA
(2014)Rey-Martı, A., Porcar, A.T., Mas-Tur, A.: Linking female entrepreneurs’ motivation to business survival.
J. Bus. Res. 68(4), 810–814 (2015)Ribeiro, D.: Modeling the enterprising character of European firms. Eur. Bus. Rev. 15(1), 29–37 (2003a)
Barriers to women entrepreneurship. Different methods…
123

Ribeiro, D.: Performance of innovative SME’s. Revista Europea de Direccion y Economıa de la Empresa12(3), 119–132 (2003b)
Rihoux, B., Ragin, C.C.: Configurational Comparative Methods: Qualitative Comparative Analysis (QCA)and Related Techniques. Sage, Los Angeles (2009)
Ronsen, M.: Children and family: a barrier or an incentive to female self-employment in Norway? Int.Labour Rev. 153(2), 337–349 (2014)
Rosa, P., Carter, S., Hamilton, D.: Gender as a determinant of small business performance: insights from aBritish study. Small Bus. Econ. 8, 463–478 (1996)
Schneider, C.Q., Wagemann, C.: Set-Theoretic Methods for the Social Sciences. A Guide to QualitativeComparative Analysis. Cambridge University Press, Cambridge (2012)
Schneider, M.R., Schulze-Bentrop, C., Paunescu, M.: Mapping the institutional capital of high-tech firms: afuzzy-set analysis of capitalist variety and export performance. J. Int. Bus. Stud. 41(2), 246–266 (2010)
Steier, L.P., Chua, J.H., Chrisman, J.J.: Embeddedness perspectives of economic action within family firms.Entrep. Theory Pract. 33(6), 1157–1167 (2009)
Storey, D.: New firm growth and bank financing. Small Bus. Econ. 6, 139–150 (1994)Sundbom, E.: Borderline Psychopathology and the Defense Mechanism Test. PhD Dissertation, Umea
University, Umea (1992)Umetrics, A. B. (2008). User guide to SIMCA-P?12Verheul, I., Thurik, R.: Start-up capital: does gender matter? Small Bus. Manag. 16, 329–345 (2001)Welsh, D.H., Memili, E., Kaciak, E., Ochi, M.: Japanese women entrepreneurs: implications for family
firms. J. Small Bus. Manag. 52(2), 286–305 (2014)Wold, H.: Model Construction and Evaluation when Theoretical Knowledge Is Scarce: An Example of the
Use of Partial Least Squares. Cahiers du Departement DEconometrie. Faculte des Sciences Econo-miques et Sociales, Universite de Geneve, Geneve (1979)
Wold, S., Albano, C., Dunn, W.J., Esbensen, K., Hellberg, S., Johansson, E., et al.: Pattern recognition:finding and using regularities in multivariate data. In: Martens, H., Russworm, H. (eds.) Food Researchand Data Analysis. Applied Science Publishers, London (1983)
Woodside, A.G., Zhang, M.: Cultural diversity and marketing transactions: are market integration, largecommunity size, and world religions necessary for fairness in ephemeral exchanges? Psychol. Mark.30(3), 263–276 (2013)
Yilmaz, E., Oraman, Y.: Women entrepreneurs: their problems and entrepreneurial ideas. Afr. J. Bus.Manag. 6(26), 7896–7904 (2012)
A. Tur-Porcar et al.
123