Embed Size (px)
Citation preview

Barr Pharmaceuticals, Inc.
Our Emphasis on Women’s Healthcare
Annual Report 2006
0614 Barr 06 AR-cov 9/6/06 3:32 PM Page 1
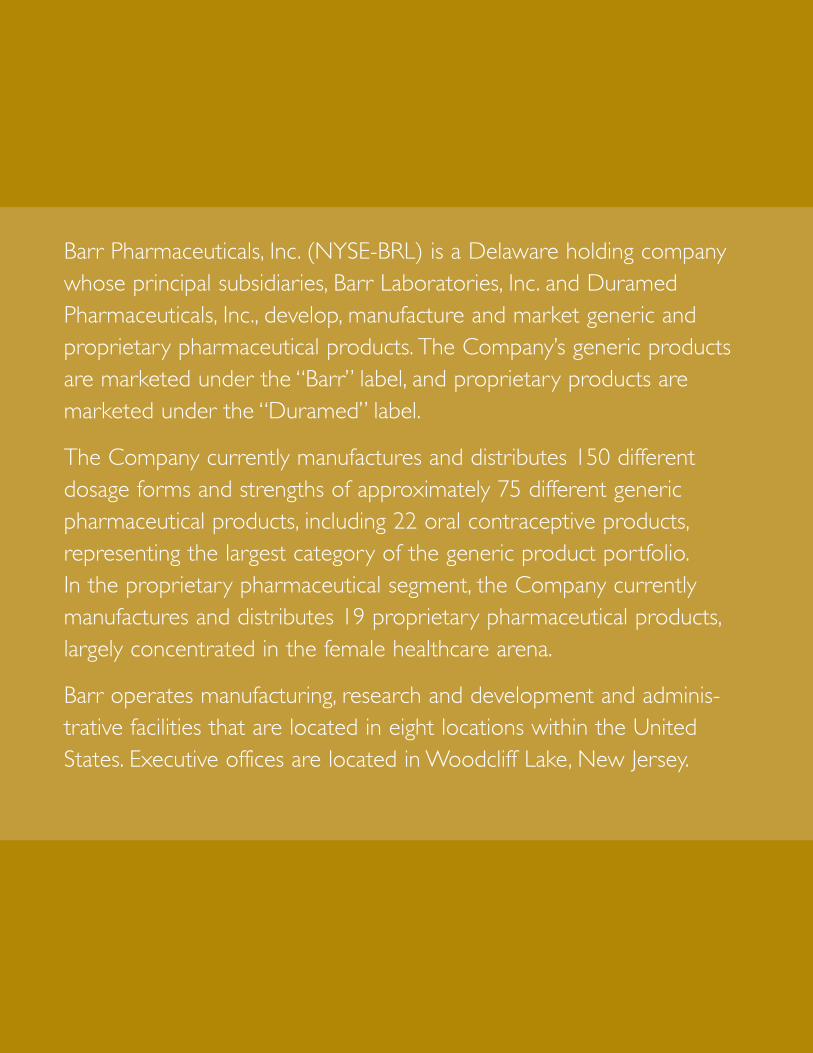
Barr Pharmaceuticals, Inc. (NYSE-BRL) is a Delaware holding companywhose principal subsidiaries, Barr Laboratories, Inc. and DuramedPharmaceuticals, Inc., develop, manufacture and market generic andproprietary pharmaceutical products. The Company’s generic productsare marketed under the “Barr” label, and proprietary products are marketed under the “Duramed” label.
The Company currently manufactures and distributes 150 differentdosage forms and strengths of approximately 75 different generic pharmaceutical products, including 22 oral contraceptive products,representing the largest category of the generic product portfolio.In the proprietary pharmaceutical segment, the Company currentlymanufactures and distributes 19 proprietary pharmaceutical products,largely concentrated in the female healthcare arena.
Barr operates manufacturing, research and development and adminis-trative facilities that are located in eight locations within the UnitedStates. Executive offices are located in Woodcliff Lake, New Jersey.
0614 Barr 06 AR-cov 9/6/06 4:09 PM Page 2
Year Ended June 30,
(Numbers in thousands, except per share data and employee data) 2006 2005
Results of Operations
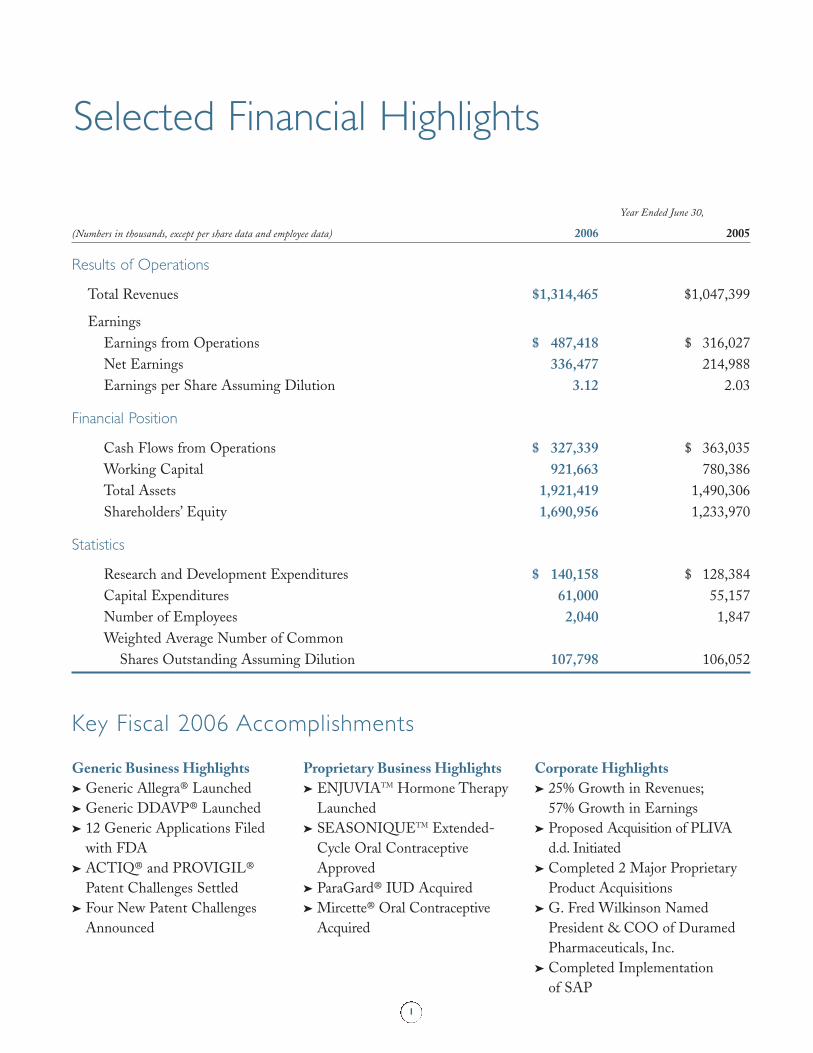
Total Revenues $1,314,465 $1,047,399
Earnings
Earnings from Operations $ 487,418 $ 316,027
Net Earnings 336,477 214,988
Earnings per Share Assuming Dilution 3.12 2.03
Financial Position
Cash Flows from Operations $ 327,339 $ 363,035
Working Capital 921,663 780,386
Total Assets 1,921,419 1,490,306
Shareholders’ Equity 1,690,956 1,233,970
Statistics
Research and Development Expenditures $ 140,158 $ 128,384
Capital Expenditures 61,000 55,157
Number of Employees 2,040 1,847
Weighted Average Number of Common
Shares Outstanding Assuming Dilution 107,798 106,052
1
Selected Financial Highlights
Generic Business Highlights
➤ Generic Allegra® Launched
➤ Generic DDAVP® Launched
➤ 12 Generic Applications Filed
with FDA
➤ ACTIQ® and PROVIGIL®
Patent Challenges Settled
➤ Four New Patent Challenges
Announced
Proprietary Business Highlights
➤ ENJUVIATM Hormone Therapy
Launched
➤ SEASONIQUETM Extended-
Cycle Oral Contraceptive
Approved
➤ ParaGard® IUD Acquired
➤ Mircette® Oral Contraceptive
Acquired
Corporate Highlights
➤ 25% Growth in Revenues;
57% Growth in Earnings
➤ Proposed Acquisition of PLIVA
d.d. Initiated
➤ Completed 2 Major Proprietary
Product Acquisitions
➤ G. Fred Wilkinson Named
President & COO of Duramed
Pharmaceuticals, Inc.
➤ Completed Implementation
of SAP
Key Fiscal 2006 Accomplishments
0614 Barr 06 AR-front 9/7/06 7:51 PM Page 1
2
Fellow Shareholders,
Employees and Friends,
Iam proud to report another very
strong year for our Company. We
saw strong revenue and earnings
growth; generic product portfolio
expansion; the launch of our
ENJUVIATM hormone therapy and
approval of our SEASONIQUETM
extended-cycle oral contraceptive;
and the addition of a new, non-
hormonal contraceptive added to our
portfolio.
We are happy to report signifi-
cant progress in meeting all of our
important corporate goals, and as a result, our
Company is poised for continued expansion and
growth in 2007 and beyond.
2006 Financial Results
Our focus on generic pharmaceuticals with barriers-
to-entry and our commitment to women’s healthcare
in our proprietary products business were the primary
drivers of strong business growth. On a GAAP basis,
we reported fully diluted earnings per share of $3.12,
compared to $2.03 for fiscal 2005. Adjusted earnings
for fiscal 2006 were $3.23 per fully diluted share,
compared to $2.40 per fully diluted share for the prior
year period, excluding unusual or infrequent charges or
benefits, as discussed under “Reconciliation of GAAP
EPS to Adjusted EPS” at the end of this report.
Revenues for the year totaled approximately $1.3 bil-
lion, a 25% increase over fiscal
2005. Net income for fiscal 2006
on a GAAP basis increased 57% to
$336.5 million, compared to $215
million in fiscal 2005. Adjusted
earnings for fiscal 2006 were
$347.9 million, compared to
adjusted earnings of $254.3 million
for the prior year period.
Sales of generic products
increased 12% to $839 million for
the year, compared to sales of
$751 million in fiscal 2005. Sales
of proprietary products increased
18% to $330 million in fiscal 2006,
compared to $279 million last fiscal year. Also during
fiscal 2006, alliance, development and other revenue
totaled $146 million, a significant increase over $17
million in 2005, reflecting royalties earned from our
agreement with Teva Pharmaceutical Industries Ltd. on
the launch of generic Allegra® tablets, as well as royal-
ties and fees earned under agreements related to the
marketing of Niaspan® and Advicor® cholesterol low-
ering products.
Investing in Our Future
Investment in new product development for the fiscal
year was $140 million. This investment was comple-
mented by business development activities that includ-
ed the acquisition of FEI Women’s Health and its
ParaGard® Intrauterine Device (IUD). ParaGard
expands our proprietary contraceptive portfolio into
non-hormonal contraception, a first for our Company.
Chairman’s Letter
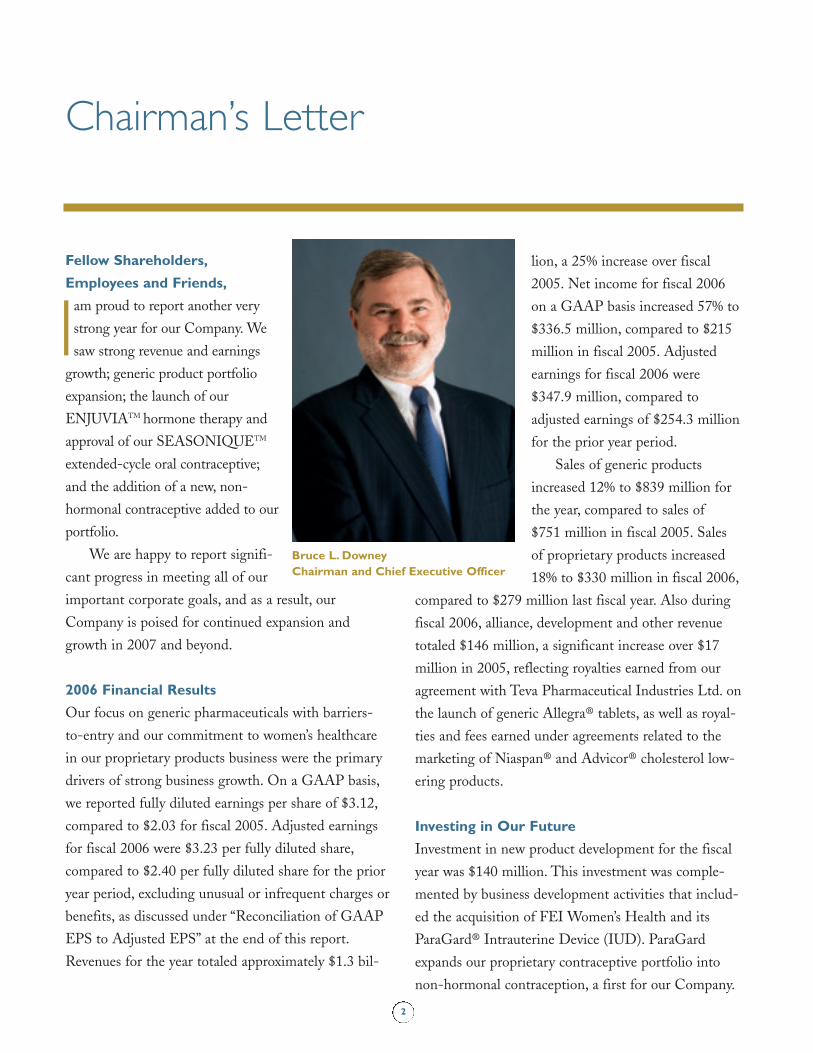
Bruce L. DowneyChairman and Chief Executive Officer
0614 Barr 06 AR-front 9/7/06 12:53 PM Page 2
3
We acquired exclusive
rights to the Mircette® oral
contraceptive from
Organon, making our
Company the supplier of
the brand product and the
only generic product, which
is sold under the Kariva®
tradename. We also entered into agreements to settle
our pending patent infringement disputes to Cephalon’s
ACTIQ® cancer pain management product and its
PROVIGIL® tablets for narcolepsy.
Our commitment to our proprietary business was
evident in the investment in marketing our ENJUVIA
hormone therapy, launched in May 2006, as well as
preparations for the comprehensive marketing launch of
our SEASONIQUE extended-cycle oral contraceptive.
We are also rolling out extensive support to increase
market acceptance of our ParaGard product, where we
believe that the market is largely untapped.
During the fiscal year, we implemented our
$67 million company-wide enterprise resource planning
(ERP) system from SAP. The system is designed to
enable us to manage more efficiently corporate activities
and increasingly diverse product lines; increase the effi-
ciency of the integration of mergers and acquisitions;
and support potential future international operations.
In connection with the ERP system, we have updated
internal controls over financial reporting to accommo-
date modifications to our business processes, take
advantage of enhanced automated controls, and to fully
comply with Sarbanes-Oxley.
Generic Allegra® Launch
One of the most significant developments in our generic
business was our agreement with Teva related to the
launch of generic versions of Aventis Pharmaceuticals’
Allegra Tablets. Under the agreement, we took the regu-
latory steps necessary to permit Teva to obtain final U.S.
Food and Drug Administration (FDA) approval of its
Fexofenadine Hydrochloride Tablets and to sell the
product during our 180 days of exclusivity. Barr receives
a negotiated percentage of the gross profit of Teva’s
product, both during and after the exclusivity period.
Restructured for Enhanced Operations
In mid-fiscal year, I was pleased to announce two impor-
tant management changes that strengthen our Company
and enable our proprietary products business to achieve
maximum efficiency and flexibility.
Paul M. Bisaro
was promoted to
the newly created
position of
President and
Chief Operating
Officer of Barr
Pharmaceuticals,
Inc., where he coordinates activities in both lines of
business. Paul continues to serve as President and Chief
Operating Officer of Barr Laboratories, our generic
business, which provides development, manufacturing
and distribution support to both lines of business.
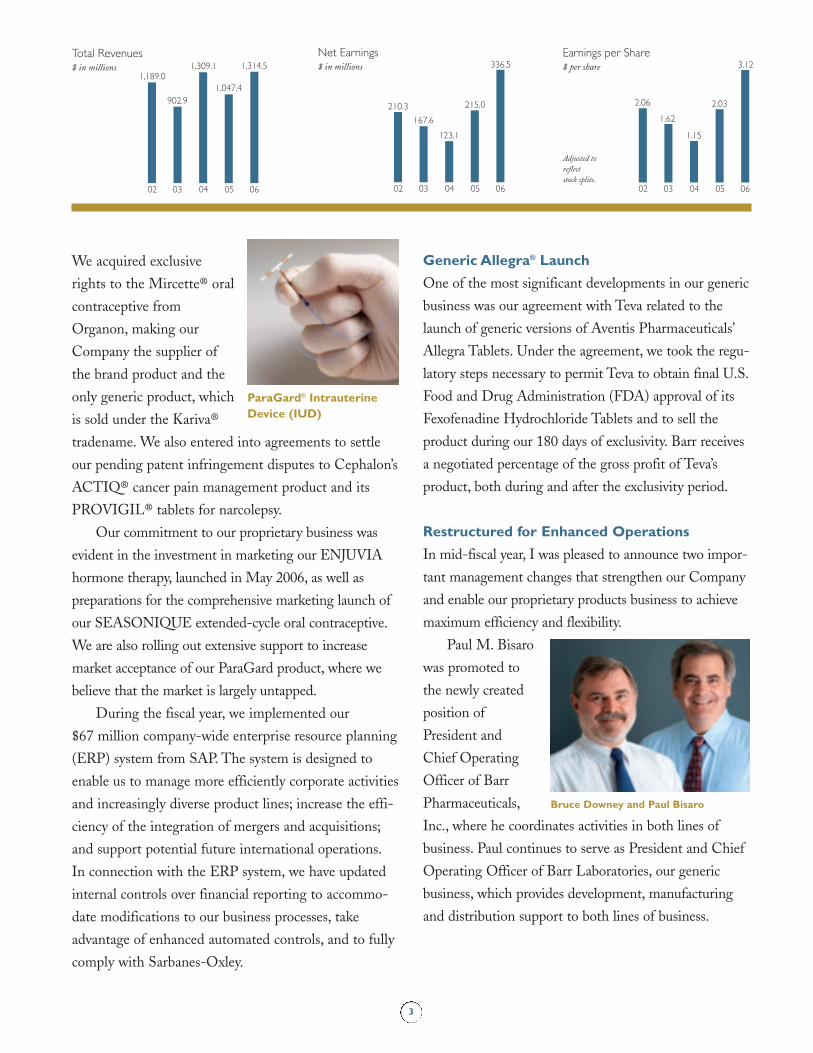
Net Earnings$ in millions
02 03 0504 06
210.3
167.6
123.1
215.0
336.5Total Revenues$ in millions
02 03 0504 06
1,189.0
902.9
1,309.1 1,314.5
1,047.4
Earnings per Share$ per share
02 03 0504 06
2.06
1.62
1.15
2.03
3.12
Adjusted to reflect stock splits.
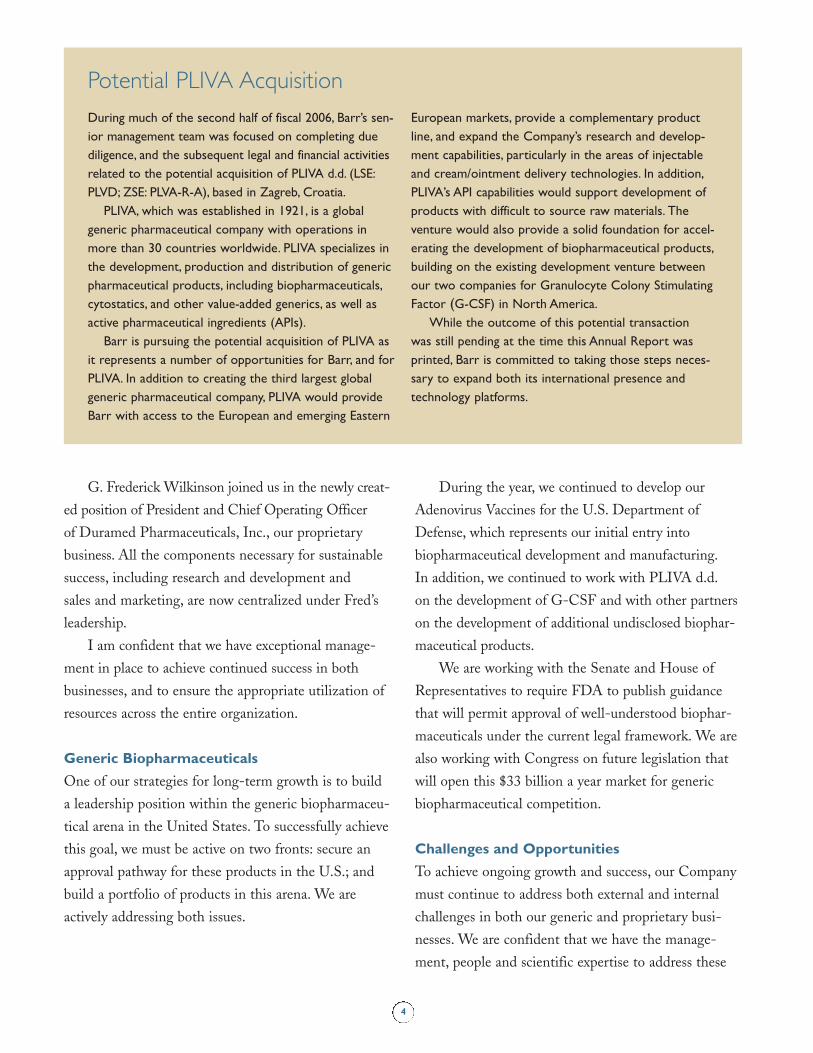
Bruce Downey and Paul Bisaro
ParaGard® IntrauterineDevice (IUD)
0614 Barr 06 AR-front 9/6/06 3:27 PM Page 3
During much of the second half of fiscal 2006, Barr’s sen-
ior management team was focused on completing due
diligence, and the subsequent legal and financial activities
related to the potential acquisition of PLIVA d.d. (LSE:
PLVD; ZSE: PLVA-R-A), based in Zagreb, Croatia.
PLIVA, which was established in 1921, is a global
generic pharmaceutical company with operations in
more than 30 countries worldwide. PLIVA specializes in
the development, production and distribution of generic
pharmaceutical products, including biopharmaceuticals,
cytostatics, and other value-added generics, as well as
active pharmaceutical ingredients (APIs).
Barr is pursuing the potential acquisition of PLIVA as
it represents a number of opportunities for Barr, and for
PLIVA. In addition to creating the third largest global
generic pharmaceutical company, PLIVA would provide
Barr with access to the European and emerging Eastern
European markets, provide a complementary product
line, and expand the Company’s research and develop-
ment capabilities, particularly in the areas of injectable
and cream/ointment delivery technologies. In addition,
PLIVA’s API capabilities would support development of
products with difficult to source raw materials. The
venture would also provide a solid foundation for accel-
erating the development of biopharmaceutical products,
building on the existing development venture between
our two companies for Granulocyte Colony Stimulating
Factor (G-CSF) in North America.
While the outcome of this potential transaction
was still pending at the time this Annual Report was
printed, Barr is committed to taking those steps neces-
sary to expand both its international presence and
technology platforms.
4
G. Frederick Wilkinson joined us in the newly creat-
ed position of President and Chief Operating Officer
of Duramed Pharmaceuticals, Inc., our proprietary
business. All the components necessary for sustainable
success, including research and development and
sales and marketing, are now centralized under Fred’s
leadership.
I am confident that we have exceptional manage-
ment in place to achieve continued success in both
businesses, and to ensure the appropriate utilization of
resources across the entire organization.
Generic Biopharmaceuticals
One of our strategies for long-term growth is to build
a leadership position within the generic biopharmaceu-
tical arena in the United States. To successfully achieve
this goal, we must be active on two fronts: secure an
approval pathway for these products in the U.S.; and
build a portfolio of products in this arena. We are
actively addressing both issues.
During the year, we continued to develop our
Adenovirus Vaccines for the U.S. Department of
Defense, which represents our initial entry into
biopharmaceutical development and manufacturing.
In addition, we continued to work with PLIVA d.d.
on the development of G-CSF and with other partners
on the development of additional undisclosed biophar-
maceutical products.
We are working with the Senate and House of
Representatives to require FDA to publish guidance
that will permit approval of well-understood biophar-
maceuticals under the current legal framework. We are
also working with Congress on future legislation that
will open this $33 billion a year market for generic
biopharmaceutical competition.
Challenges and Opportunities
To achieve ongoing growth and success, our Company
must continue to address both external and internal
challenges in both our generic and proprietary busi-
nesses. We are confident that we have the manage-
ment, people and scientific expertise to address these
Potential PLIVA Acquisition
0614 Barr 06 AR-front 9/6/06 3:27 PM Page 4
issues, and to ensure a steady stream of new product
introductions that will continue to drive growth in
both businesses.
Ensuring a Stream of New Products
We must continue to focus on efficient product devel-
opment in both our generic and proprietary businesses.
In the generic business, we expect that complicated
intellectual property issues, including patents, will
continue to be a significant barrier-to-entry. We have
exceptional talent in this area and will continue to
pursue difficult products. We will also continue to
pursue drug delivery technologies that are outside of
our traditional strengths in solid oral dosages, such as
creams and ointments, patches, nasal sprays and
injectable medicines.
As our proprietary products business expands, we
will continue to explore new areas in women’s health-
care, as well as additional therapeutic categories that
will take us beyond women’s healthcare. We will also
focus our development and pre-clinical activities on
more effectively assessing clinical data that will be
required for approval, and work in close cooperation
with FDA to better anticipate what data we will need
to support proprietary product approvals in the future.
Corporate Governance
As has been the case in previous years, we continued to
expend substantial management and Board attention on
corporate governance requirements to ensure that we
5
remain in compliance with all applicable securities laws
and regulations, accounting standards, stock exchange
requirements, controls and audit practices. At the start
of fiscal 2006, we were among the first wave of compa-
nies to record stock-based compensation as an expense
on our income statement, in accordance with SFAS 123
(R). For fiscal 2006, stock-based compensation expense
totaled approximately $27 million or $0.18 per fully
diluted share. This new accounting guidance was not
factored into prior year expenses and earnings.
Summary
Barr’s generic and proprietary product segments are
sound and growing, with what we believe are signifi-
cant opportunities for continued success in the future.
We believe that we are investing in those areas neces-
sary to ensure our long-term growth. And we believe
that we have the most talented and skilled team in
our industry.
I want to thank our employees for their ingenuity
and hard work in achieving our goals for 2006, and
look forward to their continued commitment in 2007.
I would also like to thank our Board of Directors for
their guidance and oversight, and finally, to thank you,
our shareholders, for your confidence in our strategies
and our ability to deliver on our goals.
Bruce L. Downey
Chairman and CEO
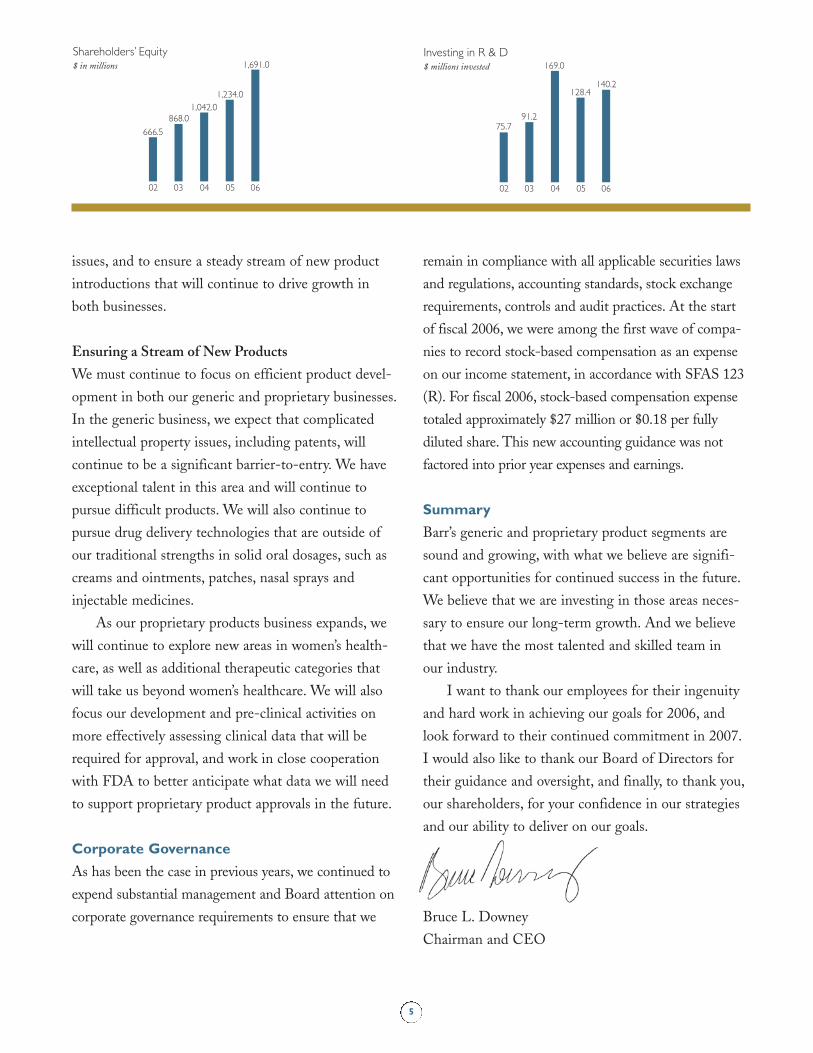
Shareholders’ Equity$ in millions
02 03 0504 06
666.5
868.01,042.0
1,234.0
1,691.0Investing in R & D$ millions invested
02 03 0504 06
75.791.2
169.0
128.4140.2
0614 Barr 06 AR-front 9/7/06 10:43 AM Page 5
Barr’s generic pharmaceutical
business operates under the Barr
Laboratories, Inc. name and manu-
factures and distributes approximately
150 different dosage forms and strengths
of approximately 75 different generic
pharmaceutical products.
Generic oral contraceptives represent
the largest category, with 22 products
marketed in fiscal 2006. This broad family of products
continued to be a primary revenue driver, delivering
$399 million in sales during the year.
Sales growth was also powered by Barr’s launch
of the generic version of DDAVP® (Desmopressin
Acetate) tablets, an antidiuretic, which entered the
market in early fiscal 2006, and by Barr’s position as
the exclusive provider of Didanosine Delayed-Release
Capsules, the generic version of Videx® EC® HIV-1
treatment.
During the fiscal year, Barr filed 12 Abbreviated
New Drug Applications (ANDAs), received 10
approvals and launched 7 generic products. At June 30,
2006, approximately 40 ANDAs, including
tentatively approved applica-
tions, were pending at the
FDA. These applications
represent generic versions of branded
pharmaceutical products that had estimat-
ed annual sales of $11 billion at year end,
based on industry source data.
Generic Allegra® Launch
A very significant approval and launch
within the generic business during fiscal
2006 was undoubtedly the launch of the
generic version of Aventis Pharmaceuticals’ $1.4 billion
a year Allegra allergy medicine. The courts denied an
Aventis motion in January 2006 that would have
forced Barr and Teva to stop marketing generic
Allegra, enabling the companies to continue marketing
the product while litigation of several additional
patents continues.
Generic DDAVP® Launched
At the beginning of the 2006 fiscal year, Barr launched
its generic version of DDAVP tablets. The Company
was the first to file an ANDA for this patent challenge
product, and received 180 days of marketing exclusivity.
DDAVP is used as an antidiuretic
replacement therapy in the manage-
ment of central diabetes insipidus
and for the management of
the temporary polyuria and
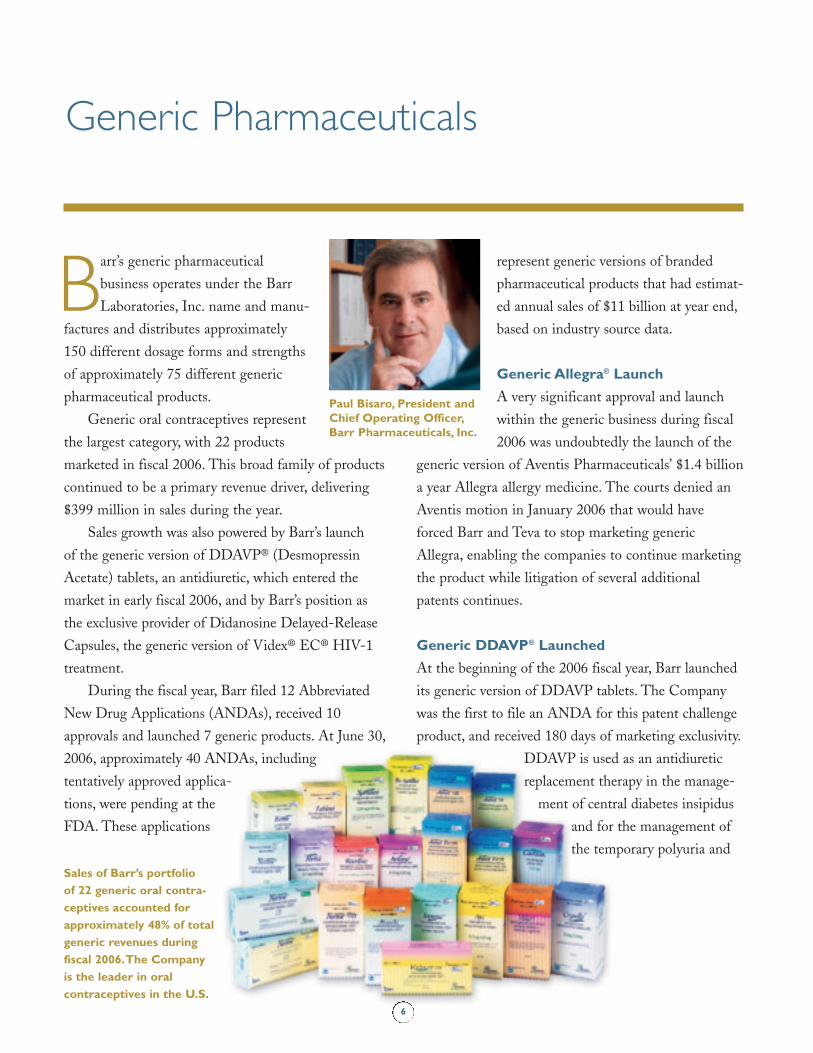
Generic Pharmaceuticals
Paul Bisaro, President andChief Operating Officer,Barr Pharmaceuticals, Inc.
Sales of Barr’s portfolio of 22 generic oral contra-ceptives accounted forapproximately 48% of totalgeneric revenues duringfiscal 2006.The Companyis the leader in oral contraceptives in the U.S.
6
0614 Barr 06 AR-front 9/7/06 4:29 PM Page 6

Generic Oral Contraceptives
Oral contraceptives are the most commonmethod of reversible birth control, used byapproximately 82% of women in the UnitedStates at some time during their reproduc-tive years. Oral contraceptives have a long
history of widespread use in preventingpregnancy. Barr offers women a broadportfolio of generic oral contraceptiveproducts from which to choose.
0614 Barr 06 AR-front 9/6/06 3:28 PM Page 7

Desmopressin
Launched at the beginning of fiscal 2006,Barr’s Desmopressin product, the genericequivalent of Ferring B.V.’s DDAVP® Tablets,is an antidiuretic replacement therapyused in the management of some forms of diabetes, and is used to reduce the
production of urine by the kidneys to treatenuresis (bedwetting). Desmopressin wasthe result of the Company’s portfolio ofpatent challenges, and received 180 days ofmarketing exclusivity.
0614 Barr 06 AR-front 9/6/06 3:28 PM Page 8
9
polydipsia following head trauma or surgery in the
pituitary region. It is also indicated for the management
of primary nocturnal enuresis.
Additional Product Approvals
In December 2005, Barr launched Zonisamide Capsules,
the generic equivalent of Eisai Inc.’s Zonegran®
Capsules. Zonisamide, an adjunctive therapy in the
treatment of partial seizures in adults with epilepsy, had
total annual sales at time of launch of approximately
$175 million.
Leflunomide Tablets, the generic equivalent of
Aventis Pharmaceuticals, Inc.’s Arava® rheumatoid
arthritis product, was launched in September 2005.
Clonazepam Orally Disintegrating tablets, the generic
equivalent of Hoffmann-La Roche’s Klonopin®
Wafers, was launched in August 2005. Clonazepam is
used in the treatment of seizures and panic disorder.
In May 2006, Barr launched the 30 mg capsule
strength of isotretinoin, an acne treatment. This
strength completes the product family, which Barr
markets under the tradename Claravis™.
Patent Challenges
Barr continues to pursue patent challenges and at the
end of fiscal 2006 had a pipeline of 12 disclosed patent
challenges for brand products with total estimated
annual sales of approximately $6.1 billion. The
products are in such therapeutic categories as oral
contraceptives, attention deficit disorder, allergy,
Alzheimer’s, Parkinson’s, osteoporosis and psychother-
apeutic products.
During fiscal 2006, Barr disclosed four new patent
challenges totaling approximately $700 million in annual
sales. Barr confirmed that it was challenging the patents
protecting Boehringer Ingelheim Pharmaceuticals, Inc.’s
Mirapex® (Pramipexole Dihydrochloride) tablets, a
$244 million a year treatment for the signs and symp-
toms of idiopathic Parkinson’s disease. The Company is
challenging Janssen Pharmaceutica Products, L.P.’s
Risperdal® M-Tab® (Risperidone Orally Disintegrating
tablets), a $67 million a year treatment for schizophrenia,
and the short-term treatment of acute manic or mixed
episodes associated with Bipolar I Disorder; as well as
patents protecting Eli Lilly’s $40 million per year
Prozac® WeeklyTM (Fluoxetine Hydrochloride) capsules,
USP 90 mg anti-depressant.
Barr’s challenge of Aventis Pharmaceuticals, Inc.’s
$346 million a year NASACORT® AQ (Triamcinolone
Acetonide) nasal spray, which is used to treat allergic
rhinitis, is the first challenge for Barr of a product
involving the nasal spray delivery technology. Barr is
developing the product with the Perrigo Company,
which will share in the costs and potential benefits.
In February 2006, Barr also reached agreements
related to Cephalon’s ACTIQ® (Oral Transmucosal
Fentanyl Citrate) [C-II] and PROVIGIL® (modafinil)
Tablets [C-IV] products. ACTIQ, which has annual
sales of approximately $569 million, is used to treat
pain associated with cancer. PROVIGIL is used to
treat narcolepsy, and has annual sales of approximately
$676 million.
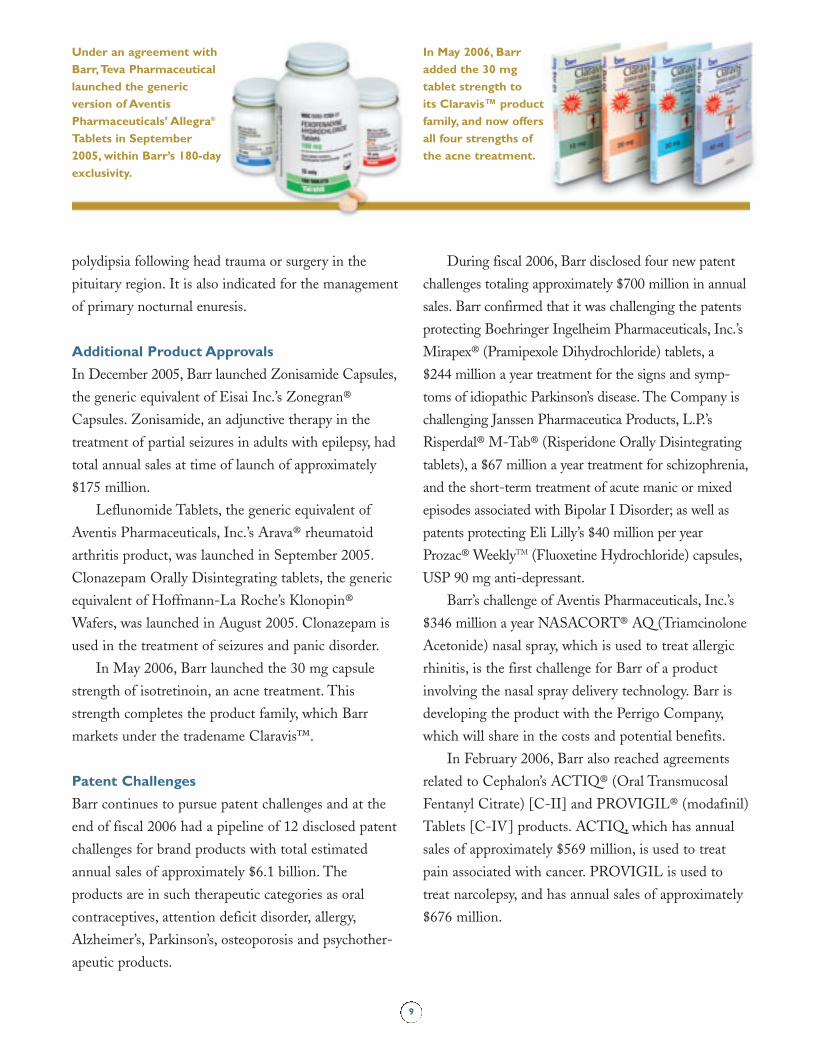
Under an agreement withBarr,Teva Pharmaceuticallaunched the generic version of AventisPharmaceuticals’ Allegra®
Tablets in September2005, within Barr’s 180-dayexclusivity.
In May 2006, Barr added the 30 mg tablet strength to its Claravis™ product family, and now offersall four strengths of the acne treatment.
0614 Barr 06 AR-front 9/7/06 9:07 PM Page 9
10
Duramed Pharmaceuticals, Inc.,
Barr’s proprietary business,
focuses its product development
and marketing activities primarily in
the women’s healthcare category. Since its
formation in 2001, the Company’s propri-
etary products subsidiary has steadily
grown to a $330 million business in fiscal
2006 with over 400 employees, including
its Women’s Healthcare and Specialty
Products Sales Forces. Duramed had 19 products in
its portfolio at fiscal year-end.
Duramed focuses on providing patients with an
array of women’s healthcare products, with particular
emphasis on developing and marketing products that
serve the reproductive and menopausal needs of
women. In addition to oral contraceptives and non-
pharmaceutical contraception, the Company’s product
portfolio includes hormone therapy products and treat-
ments for arthritis, hypertension and the management
of cholesterol levels.
During fiscal 2006, Duramed added four women’s
healthcare products to its portfolio. These include the
SEASONIQUE extended-cycle oral contraceptive;
Mircette oral contraceptive; ENJUVIA hormone
therapy; and, through acquisition, introduced the
ParaGard IUD. In addition to our 250-person Women’s
Healthcare Sales Force, the Company doubled the size
of its Specialty Products Sales Force to approximately
100 employees who are focused on
bringing its products to obstetricians,
gynecologists and other practitioners who
focus primarily on women’s healthcare.
Expanding the Extended-Cycle
Oral Contraceptive Franchise
In May 2006, FDA approved Duramed’s
New Drug Application (NDA) for
SEASONIQUE (levonorgestrel/ethinyl
estradiol tablets 0.15 mg/0.03 mg and ethinyl estradiol
tablets 0.01 mg) extended-cycle oral contraceptive.
SEASONIQUE was launched in July 2006 and full-
scale detailing utilizing both Duramed sales forces began
in September. The sales forces are targeting approximately
40,000 healthcare providers who have been determined to
be among the most productive prescribers of oral contra-
ceptive products in the United States.
Under the SEASONIQUE extended-cycle
regimen, women take active tablets of 0.15 mg of
levonorgestrel/0.03 mg of ethinyl estradiol for 84
consecutive days, followed by seven days of 0.01 mg of
ethinyl estradiol. The regimen, which provides a
continuous low dose of estrogen in place of placebo
pills, is designed to reduce the number of withdrawal
bleeding periods from monthly to four per year. The
clinical data supporting the SEASONIQUE NDA
resulted from one large, pivotal, randomized, open-label,
multi-center trial and one supportive, randomized,
open-label, multi-center trial, both of which ended in
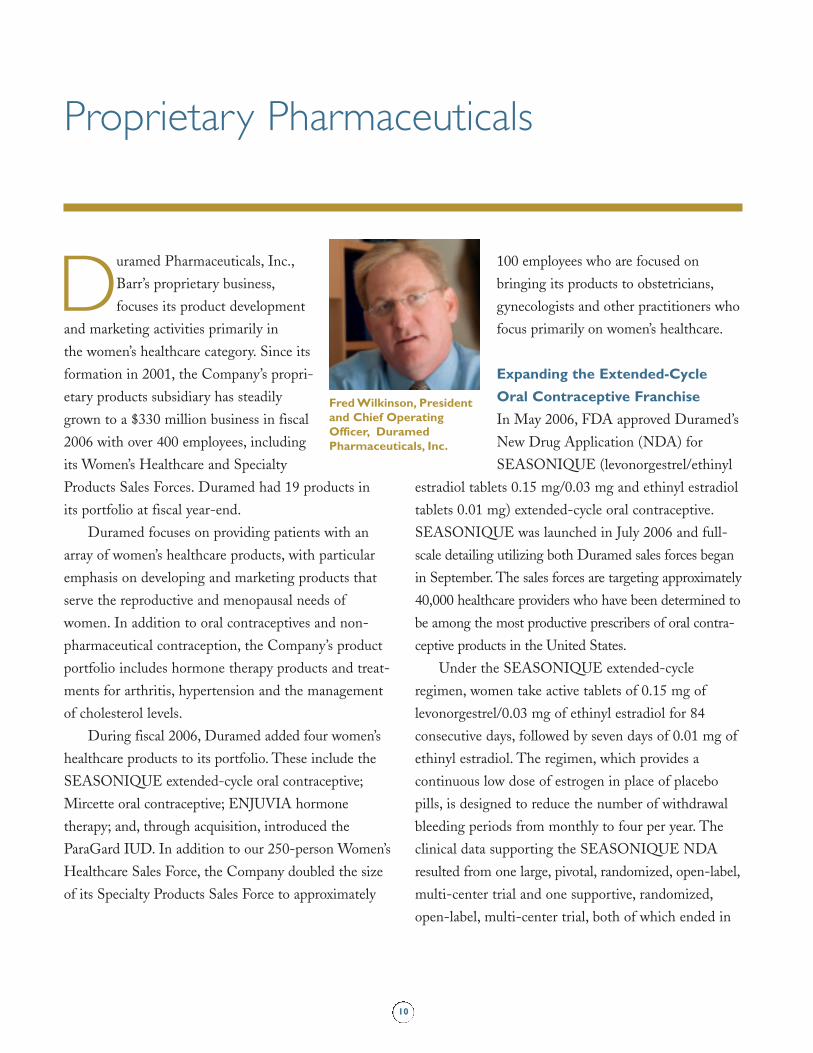
Proprietary Pharmaceuticals
Fred Wilkinson, Presidentand Chief OperatingOfficer, DuramedPharmaceuticals, Inc.
0614 Barr 06 AR-front 9/7/06 7:13 PM Page 10

SEASONIQUETM
Duramed is committed to providingwomen with pharmaceutical products thatoffer them reproductive and hormonaloptions that complement their activelifestyles. During 2006, Duramed becamethe title sponsor of the FUTURES® Tour,the official developmental tour of the
Ladies Professional Golf Association(LPGA).Tour sponsorship enablesDuramed to highlight that commitment,as well as to reinforce its message of the importance of women’s healthcare.Photographed at the Patriot Hills GolfClub, Stony Point, NY.
0614 Barr 06 AR-front 9/6/06 3:29 PM Page 11
12
April 2004. The trials involved approximately 2,500
female patients between the ages of 18-40 at 43 sites
in the United States. Patients were enrolled in the
pivotal trial for the duration of 12 months (four (4)
91-day cycles).
The SEASONIQUE product is being supported
with a fully integrated marketing campaign aimed at
both healthcare providers and patients. The campaign
will include: professional education materials, medical
education initiatives, published data from the
Company’s clinical studies that demonstrate the safety
and efficacy of the extended-cycle concept, and prod-
uct sampling kits that contain extensive information
for patients. Duramed intends to reinforce the detail-
ing activities with medical journal advertising and a
Direct-to-Consumer advertising campaign, including
television, print and web-based advertising.
Duramed created the extended-cycle oral
contraceptive market with the 2003 approval of the
SEASONALE® extended-cycle product. For fiscal
year 2006, SEASONALE product sales were $100
million, with approximately 1.1 million prescriptions
filled, an increase of 30% versus 807,000 prescriptions
filled in fiscal 2005.
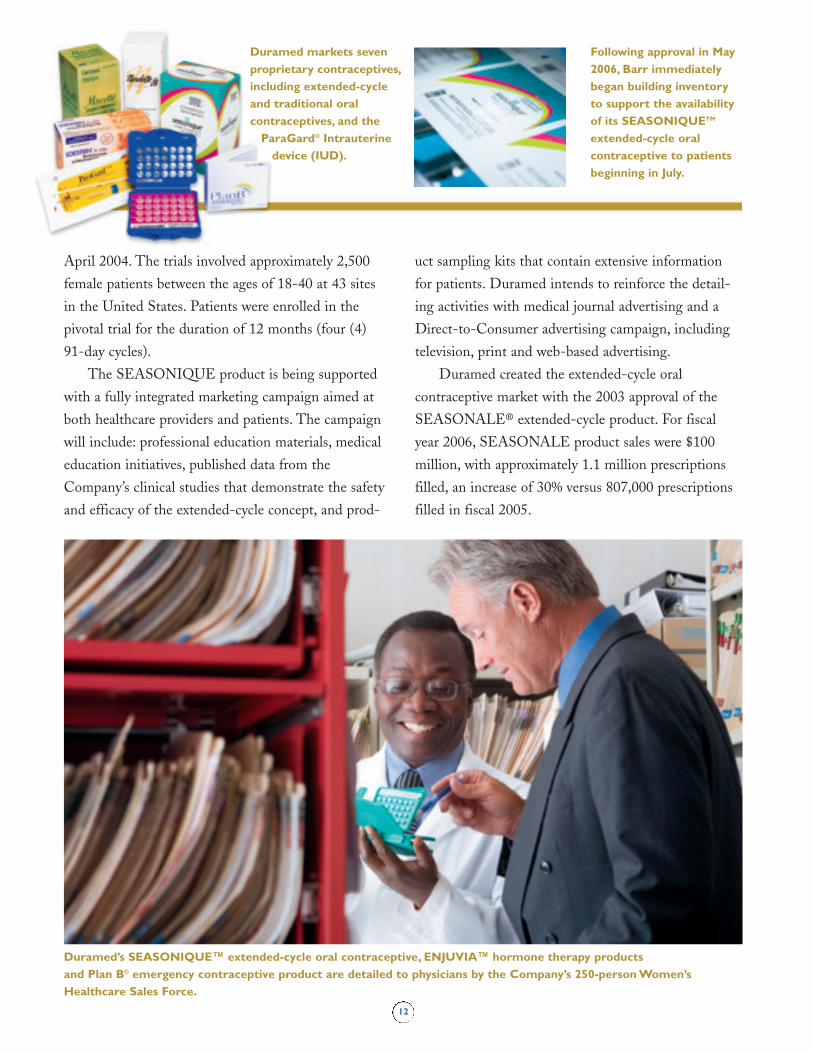
Duramed’s SEASONIQUE™ extended-cycle oral contraceptive, ENJUVIA™ hormone therapy products and Plan B® emergency contraceptive product are detailed to physicians by the Company’s 250-person Women’sHealthcare Sales Force.
Duramed markets sevenproprietary contraceptives,including extended-cycleand traditional oral contraceptives, and the
ParaGard® Intrauterine device (IUD).
Following approval in May2006, Barr immediatelybegan building inventoryto support the availabilityof its SEASONIQUETM
extended-cycle oral contraceptive to patientsbeginning in July.
0614 Barr 06 AR-front 9/6/06 3:29 PM Page 12
13
In June 2004, Watson Pharmaceuticals filed an
ANDA challenging the patent covering SEASONALE,
and received FDA approval in September 2006.
Duramed is committed to its extended-cycle oral
contraceptive portfolio. However, the Company does
not shrink from making tough business decisions when
necessary. In April 2006, Duramed withdrew its NDA
for the Lo SEASONALE® extended-cycle oral
contraceptive after ongoing discussions with the FDA
led to the conclusion that an additional, larger clinical
trial would be necessary to support the application.
Rather than continue to devote additional resources to
Lo SEASONALE, Duramed elected to concentrate
resources on the development of Lo SEASONIQUE™,
and other products.
Under the Lo SEASONIQUE extended-cycle
regimen, women take active tablets of 0.10 mg lev-
onorgestrel/0.02 mg of ethinyl estradiol for 84 consecu-
tive days, followed by seven days of 0.01 mg of ethinyl
estradiol. Lo SEASONIQUE is currently in Phase III
studies, and the clinical data that will support the NDA
filing will result from one large, pivotal, randomized,
open-label, multi-center trial. This trial is expected to
end in the first half of calendar 2007.
ENJUVIATM Launched
During 2006, Duramed built on its historical position
in synthetic hormone replacement products with the
May launch of ENJUVIA (synthetic conjugated estro-
gens, B) tablets. ENJUVIA is a plant-derived formula-
tion that contains a blend of 10 synthetic estrogenic
substances including ∆8,9 – dehydroesterone sulfate
(DHES). The product is approved for the treatment of
moderate-to-severe vasomotor symptoms associated
with menopause.
Duramed initiated physician detailing using its
250-person Women’s Healthcare Sales Force in May
2006, emphasizing the product’s plant-derived formu-
lation and its unique Surelease® cellulose-based polymer
delivery system that is intended to ensure the slow
release of estrogens over several hours. ENJUVIA
competes in the $1.8 billion hormone therapy market
with products such as Wyeth’s Premarin®, a conjugated
equine estrogens product.
Mircette® Extends Oral Contraceptive Franchise
On December 2, 2005, the Company acquired the
exclusive rights to Organon’s Mircette (Desogestrel/
Ethinyl Estradiol) oral contraceptive product. The
agreement terminated the ongoing patent litigation
regarding Barr’s generic version of Mircette, which is
sold under the trade name Kariva®. Duramed
promotes Mircette to female healthcare practitioners
utilizing its Specialty Products Sales Force. Mircette is
available in a 28-tablet regimen that includes five days
of low dose estrogen during what would be the placebo
period of traditional oral contraceptives. Mircette is
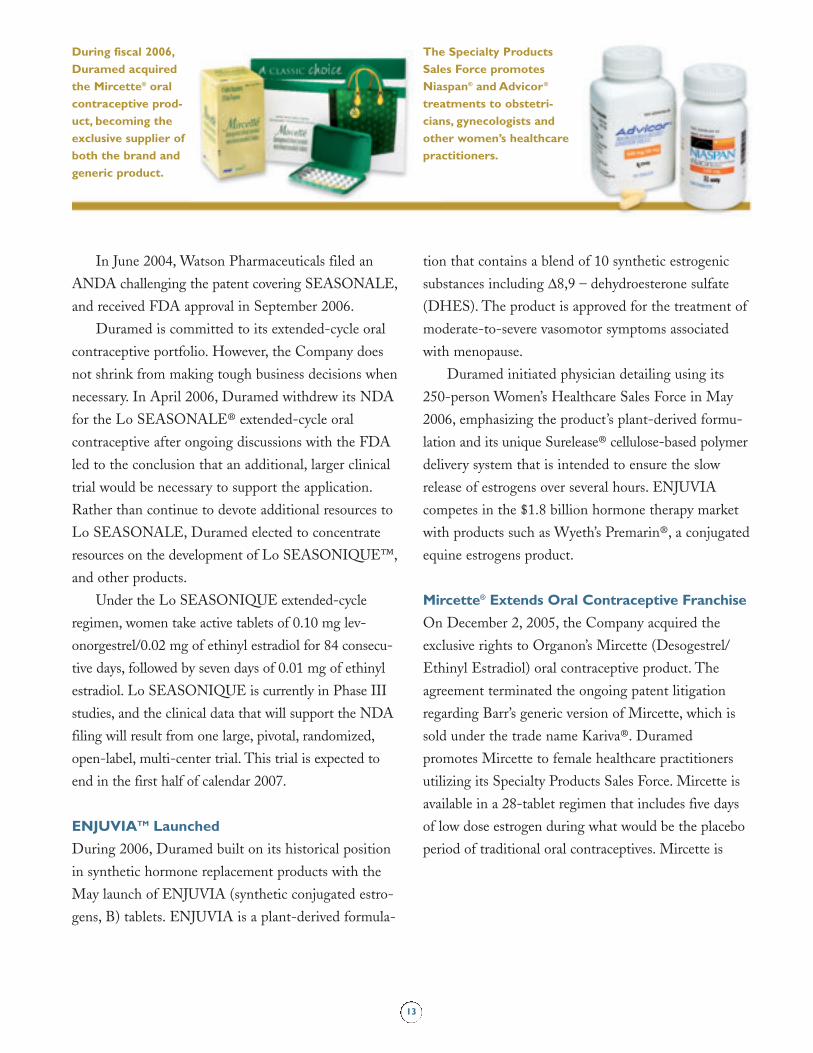
The Specialty ProductsSales Force promotesNiaspan® and Advicor®
treatments to obstetri-cians, gynecologists andother women’s healthcarepractitioners.
During fiscal 2006,Duramed acquired the Mircette® oral contraceptive prod-uct, becoming the exclusive supplier of both the brand and generic product.
0614 Barr 06 AR-front 9/7/06 1:06 PM Page 13
14
similar to SEASONIQUE in its use of low dose estro-
gen during the placebo period, and provides Duramed
with an additional opportunity to discuss these options
with physicians.
ParaGard® IUD Acquired
In November 2005, Duramed acquired FEI Women’s
Health, LLC and the ParaGard T 380A (Intrauterine
Copper Contraceptive) IUD, the first non-hormonal
contraceptive in the Company’s proprietary product
franchise. The ParaGard IUD was approved in 1984
and has been marketed in the United States since 1988
and is the only IUD contraceptive approved for 10
years of continuous use.
Products in Development
Proprietary development activities are focused primarily
on expanding Duramed’s portfolio of women’s healthcare
products including oral contraceptives and treatments
for menopause/perimenopause. In addition, the
Company is also focusing product development in the
categories of endometriosis, labor and delivery and
breast disease. The Company is also actively evaluating
expansion into a second therapeutic category.
Several proprietary products are in various stages
of development and several applications are pending at
the FDA. Duramed is currently conducting Phase III
clinical work on its Bijuva™ (Synthetic Conjugated
Estrogens, A) vaginal cream product which it believes
will support approval of the product for the treatment
of moderate-to-severe symptoms of vulvar and vaginal
atrophy associated with menopause.
Duramed has several products in early stages of
development based on its proprietary, novel, vaginal
ring (VR) drug delivery system, including products
intended to treat endometriosis, fertility, fibroids, labor
and delivery, and urinary incontinence. An Oxybutynin
VR product, being developed for urinary incontinence,
is in Phase IIB development.
At the end of fiscal 2006, Duramed had completed
Phase I studies on the Adenovirus Vaccines Type 4
and 7 that are under development for the United
States Department of Defense (DOD). The Phase III
clinical program is planned to start in the first quarter
of fiscal 2007. In addition to supplying the vaccine to
the armed forces, the Company has the right to develop
and market the product targeting other populations,
such as immunosuppressed patients, and foreign mar-
kets where the same needs exist as with the DOD.
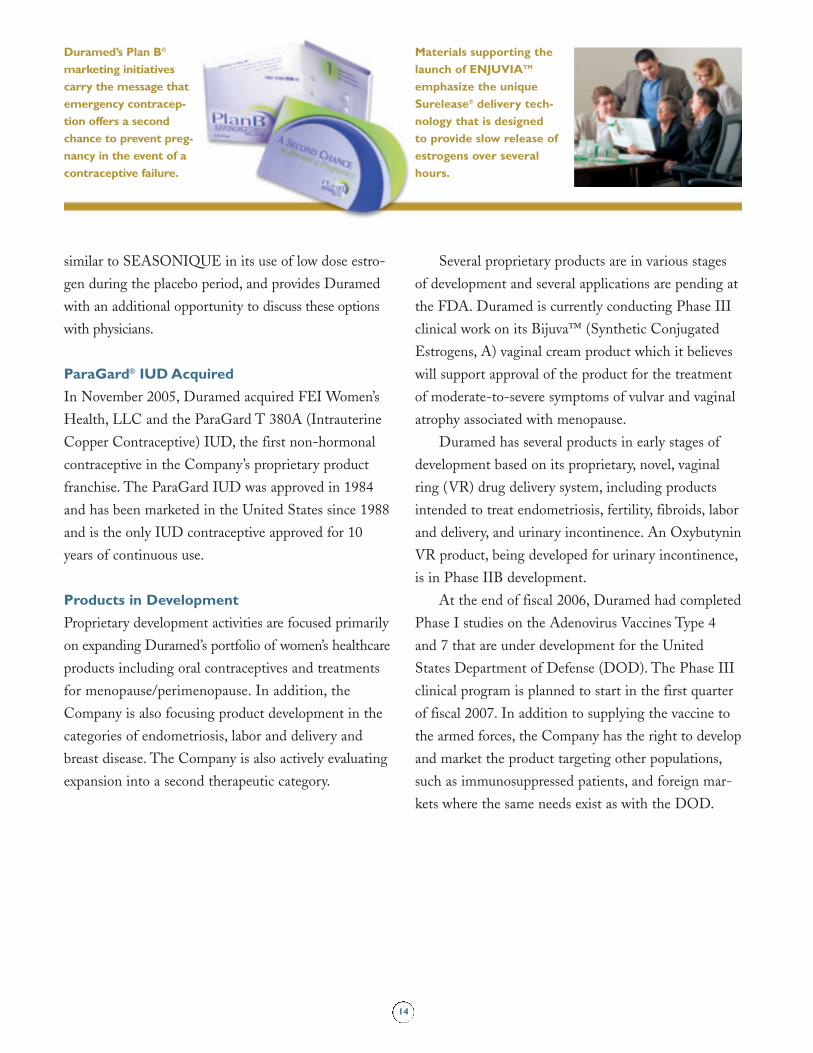
Materials supporting thelaunch of ENJUVIATM
emphasize the uniqueSurelease® delivery tech-nology that is designed to provide slow release ofestrogens over severalhours.
Duramed’s Plan B®
marketing initiatives carry the message thatemergency contracep-tion offers a second chance to prevent preg-nancy in the event of a contraceptive failure.
0614 Barr 06 AR-front 9/7/06 6:43 PM Page 14

ENJUVIATM
Duramed’s ENJUVIA, which competes inthe $1.8 billion hormone therapy category,is used by a number of women and recom-mended by their healthcare providers forthe short-term treatment of moderate-to-severe vasomotor symptoms associatedwith menopause. A plant-derived daily oralestrogen therapy, the ENJUVIA formula-
tion contains a blend of 10 synthetic estro-genic substances including Delta 8,9 –dehydroesterone sulfate (DHES), and isavailable in a variety of dosage strengths.ENJUVIA is detailed to physicians by the250-person Duramed Women’s HealthcareSales Force.
0614 Barr 06 AR-front 9/6/06 3:29 PM Page 15

Improving the Quality of Life –Everywhere
Barr Pharmaceuticals invested more than$140 million in research and developmentin 2006, in recognition that a broad portfo-lio of products in development is critical tothe Company’s long-term success. BarrLaboratories, the generic pharmaceuticalbusiness, manufactures and distributesapproximately 150 different dosage forms
and strengths of approximately 75 differentgeneric pharmaceutical products, including22 oral contraceptive products. DuramedPharmaceuticals, the proprietary pharma-ceutical business, currently manufacturesand/or distributes 19 proprietary pharma-ceutical products, largely concentrated inthe women’s healthcare arena.
0614 Barr 06 AR-front 9/7/06 1:06 PM Page 16
17
Management’s Discussion and Analysis of
Financial Condition and Results of Operations 18
Consolidated Balance Sheets 34
Consolidated Statements of Operations 35
Consolidated Statements of Shareholders’ Equity 36
Consolidated Statements of Cash Flows 37
Notes to the Consolidated Financial Statements 38
Report of Independent Registered Public Accounting Firm 57
Management’s Report on Internal Control Over
Financial Reporting 57
Report of Independent Registered Public Accounting Firm 58
Selected Financial Data 59
Reconciliation of GAAP EPS to Adjusted EPS for the
Fiscal Years Ended June 30, 2006 and 2005 60
Board of Directors 61
Management Team 61
General Shareholders’ Information 61
Financial Review
06 AR Financial pgs 17-33.qxd 9/11/06 11:24 AM Page 17
18
Executive Overview
We are a specialty pharmaceutical company that develops,
markets and sells both generic and proprietary (or branded)
pharmaceutical products. We have a deep, diverse and prof-
itable generic product portfolio, and have recently diversified
our operations by developing and acquiring several proprietary
products. Total product sales for fiscal 2006 totaled approxi-
mately $1.2 billion, an increase of $138.5 million, or 13%
as compared to fiscal 2005. In fiscal 2006, sales of generic
products grew to $838.8 million from $751.4 million in fiscal
2005, and accounted for 72% of our product sales in fiscal
2006. In fiscal 2006, sales of our proprietary products grew to
$329.8 million from $278.8 million in fiscal 2005, accounting
for 28% of our product sales in fiscal 2006. In addition to
revenue from product sales, we recorded alliance, development
of other revenues totaling $145.8 million in fiscal 2006.
These revenues have been derived mainly from profit-sharing
arrangements, co-promotion agreements, standby manufactur-
ing fees and other reimbursements and fees we received from
third parties, including marketing partners.
Generic ProductsFor many years, we have successfully utilized a strategy of
developing the generic versions of branded products that possess
some combination of unique factors that we believe have the
effect of limiting competition for generics. Such factors include
difficult formulation, complex and costly manufacturing require-
ments or limited raw material availability. To date, our strategy
has focused on developing solid oral dosage forms of products.
By targeting products with some combination of these unique
factors, we believe that our generic products will, in general,
be less affected by the intense and rapid pricing pressure often
associated with more commodity-type generic products. As a
result of this focused strategy, we have been able to successfully
identify, develop and market generic products that generally
have few competitors or that are able to enjoy longer periods
of limited competition and thus generate profit margins higher
than those often associated with commodity-type generic
products. The development and launch of our generic oral con-
traceptive products is an example of our generic development
strategy. While we believe there are more tablet and capsule
products that may fit our “barrier-to-entry” criteria, we recog-
nize that it may be difficult to find highly profitable generic
tablet and capsule products that will grow our generics business.
As a result, we have recently expanded our development activi-
ties, both internally and through collaboration with third parties,
to develop non-tablet and non-capsule products such as patches,
sterile ophthalmics and nasal sprays.
Challenging the patents covering certain brand products
continues to be an integral part of our generics business. For
many products, the patent provides the unique barrier that we
seek to identify in our product selection process. We try to be the
first company to initiate a patent challenge because in certain
cases, we may be able to obtain 180 days of exclusivity for selling
the generic version of the product. Upon receiving exclusivity
for a product, we often experience significant revenues and prof-
itability associated with that product for the 180-day exclusivity
period, but at the end of that period experience significant
decreases in our revenues and market share associated with the
product as other generic competitors enter the market. Our
record of successfully resolving patent challenges has made a
recurring contribution to our operating results, but has created
periods of revenue and earnings volatility and will likely do so in
the future. While earnings and cash flow volatility may result
from the launch of products subject to patent challenges, we
remain committed to this part of our business.
Macroeconomic factors continue to favor the use of generic
pharmaceutical products. The aging population, rising health
care costs and the vigilance of health care providers, insurance
companies and others to lower such costs have helped drive an
increase in the substitution of lower-cost generic products for
higher-cost brand products. As evidence of this, the percentage
of overall prescriptions filled with generic products grew from
46.5% in 2000 to 57.3% by 2005, and is predicted to continue
to rise in the future.
Proprietary ProductsTo help diversify our generic product revenue base and to
provide for additional long-term opportunities, we initiated a
program more than five years ago to develop and market propri-
etary pharmaceutical products. We formalized this program
in 2001 by establishing Duramed Research. Today, Duramed is
recognized as a leader in the area of women’s healthcare. Our
women’s healthcare platform is based on a substantial number of
employees dedicated to the development and marketing of our
proprietary products including approximately 350 sales represen-
tatives that promote directly to physicians five of our products
(SEASONIQUETM, ENJUVIATM, Mircette®, ParaGard® and
Plan B®) and two products related to the Co-Promotion
Agreement with Kos Pharmaceuticals (Niaspan® and Advicor®).
Growth in proprietary product sales over the last three fiscal
years has been accomplished through increasing sales of our
internally developed product SEASONALE®, the first and
largest selling extended-cycle oral contraceptive in the United
States. In addition, our proprietary sales have grown through
product acquisitions including our acquisition in November
2005 of ParaGard, the only non-drug loaded IUD on the mar-
ket in the United States, and the acquisition in December 2005
of Mircette, a well established 28-day oral contraceptive.
Management’s Discussion and Analysis of Financial Condition and Results of Operations
06 AR Financial pgs 17-33.qxd 9/11/06 11:24 AM Page 18
19
CompetitionOur successful generic product strategy has attracted new competi-
tors seeking to launch competing generic products as well as to be
“first to file” for potentially lucrative patent challenges. For example,
other generic pharmaceutical companies are developing and mar-
keting competing generic oral contraceptives in order to capture
some of our market share. In addition, there has been an increase in
the number of competitors in the generic industry that are based
outside the U.S., with several of such competitors based in India.
Many of these companies claim to have equivalent technological
capabilities to U.S.-based generic companies but at significant cost
advantages over Barr and other U.S.-based generic competitors.
Also, as a detriment to the value of the patent challenge strategy
of Barr and other leading generic manufacturers, brand pharmaceu-
tical companies continue to partner with certain generic drug
companies to license a so-called “authorized” generic to the generic
drug company. The use of “authorized” generics by certain brand
and generic companies undermines the value of the 180-day exclu-
sivity period enjoyed by the first company to file an Abbreviated
New Drug Application (“ANDA”) containing a Paragraph IV
certification by providing another company with the ability to have
a competing generic product on the market at the same time.
As our proprietary pharmaceutical business continues to grow,
we anticipate that competing generic pharmaceutical companies
will challenge the patents protecting our branded products. For
example one of our competitors has filed a Paragraph IV certifica-
tion challenging the patent on SEASONALE. In May 2006, the
competitor’s ANDA received tentative FDA approval and may be
eligible for final approval following the expiration of our regulatory
exclusivity on September 5, 2006. In addition, larger branded phar-
maceutical companies, such as Wyeth, have sought to enter the
extended-cycle oral contraceptive market and compete against our
SEASONALE/SEASONIQUE franchise.
To address these and other challenges, we continue to (1) invest
aggressively in research and development, (2) develop and launch
new generic and proprietary products, and (3) maintain an
active acquisition and licensing effort to complement our internal
development activities.
Proposed PLIVA AcquisitionOn June 27, 2006, we announced that the Supervisory Board of
PLIVA, a generic pharmaceuticals company with revenues of
approximately $1.2 billion, headquartered in Zagreb, Croatia, had
endorsed our proposal to make a tender offer to PLIVA’s share-
holders to purchase 100% of the shares of PLIVA. On July 28,
2006, in accordance with the law of the Republic of Croatia
governing tender offers, our newly formed European subsidiary,
Barr Laboratories Europe B.V., officially filed our tender offer with
the Croatian Financial Services Supervisory Agency (“HANFA”).
Under the terms of the $2.3 billion cash tender offer, PLIVA
shareholders who tender their shares will receive HRK 743 per
share in cash. In addition, shareholders that are registered as
shareholders at the Central Depository Agency as of August 22,
2006, will receive the dividend of HRK 12 per share, for a total
cash consideration of HRK 755 per share. On August 10, 2006,
HANFA approved for publication our tender offer. If we are
successful in the tender process we expect the acquisition to close
in October or November 2006.
On August 9, 2006, another pharmaceutical company filed
a competing bid with HANFA, though that bid had not been
approved as of the date of this filing.
If we acquire PLIVA, the combined company would be
the third largest global generic pharmaceutical company, based
on the combined revenues of approximately $2.4 billion revenue
for the twelve-month period ended March 31, 2006. We believe
that the combination of Barr and PLIVA will unite the unique
pharmaceutical development and manufacturing strengths of
each partner, the unique markets in which each excels, and the
expertise of a U.S.-based and European-based management team
to create a powerful, global pharmaceutical leader with a broad
portfolio of solid oral dosage form products with the ability to
create a broad portfolio of injectable, cream/ointment, and bio-
pharmaceutical products. In addition, the combined company
will have active pharmaceutical ingredient (API) capabilities.
The combination would also provide a solid foundation for accel-
erating the development of generic biopharmaceutical products,
building upon PLIVA’s biologic research program and the
existing development venture between PLIVA and Barr for
Granulocyte Colony Stimulating Factor (“G-CSF”) in North
America, which we entered into in March 2005.
We intend to finance the purchase price and transaction costs
with a portion of our cash reserves and borrowings under a new
Senior Credit Facility that we entered into on July 21, 2006. The
Senior Credit Facility consists of $2.5 billion of term loans and
a $300 million revolving credit facility.
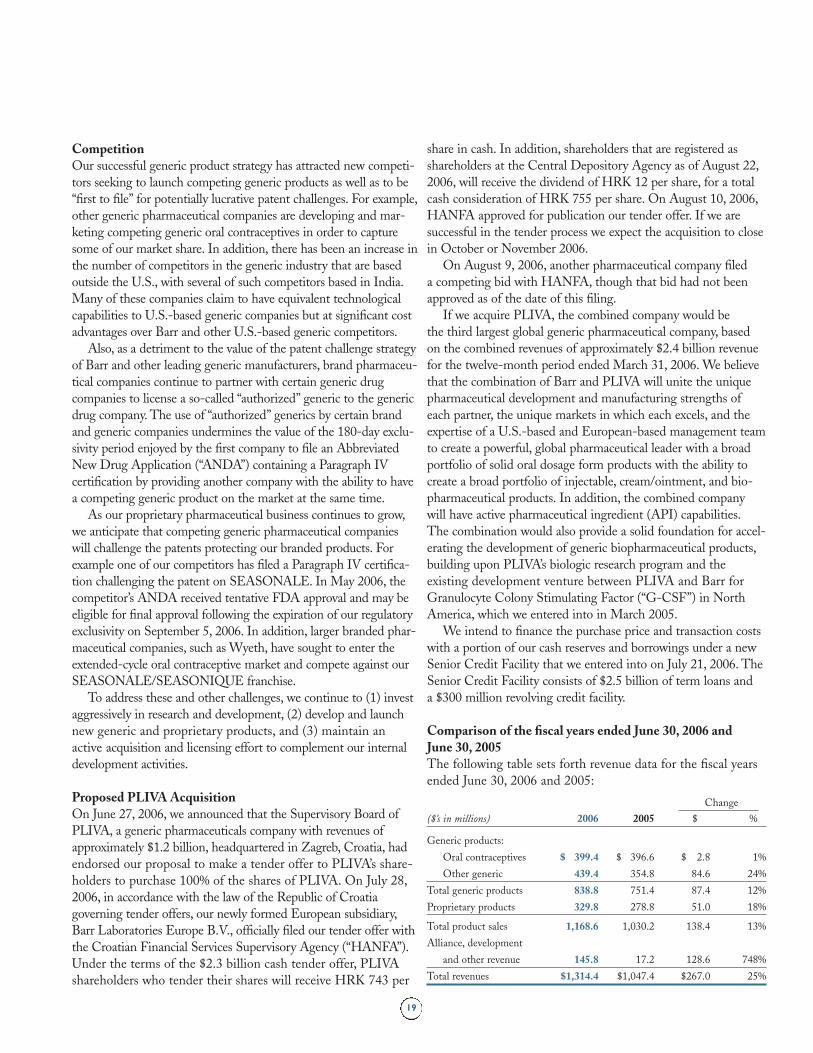
Comparison of the fiscal years ended June 30, 2006 and June 30, 2005The following table sets forth revenue data for the fiscal years
ended June 30, 2006 and 2005:
Change
($’s in millions) 2006 2005 $ %
Generic products:
Oral contraceptives $ 399.4 $ 396.6 $ 2.8 1%
Other generic 439.4 354.8 84.6 24%
Total generic products 838.8 751.4 87.4 12%
Proprietary products 329.8 278.8 51.0 18%
Total product sales 1,168.6 1,030.2 138.4 13%
Alliance, development
and other revenue 145.8 17.2 128.6 748%
Total revenues $1,314.4 $1,047.4 $267.0 25%
06 AR Financial pgs 17-33.qxd 9/11/06 11:24 AM Page 19
20
Product Sales
Product sales for the fiscal year ended June 30, 2006 (“fiscal
2006”) increased 13% over product sales for the fiscal year ended
June 30, 2005 (“fiscal 2005”), resulting from increases in sales of
both generic and proprietary products. Generic sales increased
in large part due to contributions from Desmopressin, which we
launched at the beginning of fiscal 2006, combined with contin-
ued strong sales of two of our generic oral contraceptive prod-
ucts, Tri-Sprintec® and Kariva®. Proprietary sales increased in
part due to contributions of products acquired during fiscal 2006
as well as higher sales of promoted in-line products, including
SEASONALE and Plan B.
Generic ProductsOral Contraceptives
For fiscal 2006, sales of generic oral contraceptives increased
1% to $399.4 million from sales of $396.6 million in fiscal 2005.
Sales in this category benefited from strong performances from
Tri-Sprintec and Kariva. Tri-Sprintec sales increased 20%, driv-
en in part by market-share gains during the second half of fiscal
2006, while sales of Kariva were up 32% due both to an increase
in market share and higher pricing. We believe that Tri-Sprintec’s
market share gains were the result of supply shortages encoun-
tered by one of our competitors, which we understand have been
remedied. Therefore, we expect our Tri-Sprintec market share
to decline over the next twelve months, with a related decrease
in our product sales attributable to Tri-Sprintec.
Somewhat offsetting the strong performances by Tri-Sprintec
and Kariva was the impact of increased pricing pressure from
competition on certain of our other products, including Aviane®
and Apri®, as well as the ongoing decline in consumer demand
for several generic oral contraceptive products that occurs when
brand companies cease promotional activities after a generic is
launched. These factors more than offset continued increases in
the generic substitution rates for nearly all of our generic oral
contraceptive products.
Generic Products – Other
For fiscal 2006, sales of other generic products increased 24%
to $439.4 million from $354.8 million in fiscal 2005, driven
by strong performances from Desmopressin and Didanosine.
We launched Desmopressin in July 2005, and recorded
approximately $107.7 million of sales during fiscal 2006. We
launched Didanosine during the middle of fiscal 2005, and
saw sales increase 47% year-over-year. Desmopressin sales,
which were favorably impacted in the first half of fiscal 2006
by rapid generic substitution, declined sharply in the second
half due to the launch of two competing generic products.
We expect Desmopressin sales to be lower in the next twelve
months as a result of this competition.
These increases were partially offset by lower sales of
Mirtazapine, ClaravisTM and Warfarin Sodium, as well as the
continued decline in both price and demand for certain of
our other generic products. Mirtazapine sales were lower due
to further price declines and a loss of market share. Claravis
sales were lower throughout fiscal 2006 due in large part
to the decline in the overall compound usage and lower prices.
As discussed in previous filings, sales of Claravis and other
isotretinoin products indicated for the treatment of severe acne
have been negatively affected by the implementation effective
January 1, 2006, of iPLEDGE®, an enhanced risk manage-
ment program that is designed to minimize fetal exposure to
isotretinoin that has also led to reduced product use. Sales
of Warfarin Sodium declined due to lower prices, more than
offsetting higher unit volume due primarily to an increase in
our market share.
Proprietary ProductsFor fiscal 2006, proprietary product sales increased 18% to
$329.8 million from $278.8 million in fiscal 2005. This increase
was driven by (1) 14% increase in sales of SEASONALE, (2)
the inclusion of sales of the ParaGard IUD and of the Mircette
oral contraceptive, which we acquired in November 2005 and
December 2005, respectively, (3) the launch of ENJUVIA during
the fourth quarter of 2006, and (4) higher volume and pricing for
our Plan B emergency contraceptive product. Partially offsetting
these increases were lower sales of our Loestrin®/Loestrin® FE
oral contraceptive products and our Cenestin® hormone therapy
product, due in part to customer buying patterns.
SEASONALE sales reached $100 million during fiscal
2006, up 14% from fiscal 2005 sales. Higher prices for
SEASONALE during fiscal 2006 more than offset lower cus-
tomer shipments which were attributable to customer buying
patterns during the fourth quarter of fiscal 2006. During fiscal
2006, consumer demand for SEASONALE grew, as prescrip-
tions increased 30% compared to last year.
In June 2004, we received notification that a competitor had
filed an ANDA containing a paragraph IV certification asserting
that the patent covering SEASONALE is invalid, unenforceable
or would not be infringed by the competitor’s generic product.
In May 2006, the competitor’s ANDA received tentative U.S.
Food and Drug Administration (“FDA”) approval and may be
eligible for final approval following the expiration of our regula-
tory exclusivity on September 5, 2006. In July 2006, we submit-
ted a Citizens Petition, asking the Office of Generic Drugs of
the FDA to make the determination that no ANDA submitted
referencing our New Drug Application (“NDA”) for
SEASONALE be granted final approval unless and until such
ANDA satisfies all statutory and regulatory requirements for
bioequivalence. Our request with the Office of Generic Drugs
06 AR Financial pgs 17-33.qxd 9/11/06 11:24 AM Page 20
21
is pending. The competitor has stated publicly that it expects to
launch a generic version of SEASONALE in the fourth quarter
of calendar 2006. If that launch occurs, SEASONALE sales
will decline significantly.
In July 2004, we submitted the patent covering
SEASONALE for reissue with the Patent and Trademark
Office (“PTO”). In May 2006, we received a Non-Final
Rejection notice from PTO regarding our application for
reissue of the patent. In July 2006, we responded to the issues
raised by the PTO in its Non-Final Rejection. It is unlikely
that the applicable patent could be reissued prior to expiration
of our regulatory exclusivity on SEASONALE. The patent
covering SEASONALE will remain in effect and continue to
be listed in the FDA’s Orange Book while the PTO reviews
the request for re-issuance. If the patent covering SEASONALE
is reissued, it will have the same remaining term as the existing
patent that expires in 2017.
As part of our long-term plans for our extended-cycle
contraceptive franchise, we launched SEASONIQUE in July
2006. SEASONIQUE represents the next generation of our
extended-cycle oral contraceptives. In July 2006, we shipped
SEASONIQUE to our major customers, and in August 2006,
Duramed’s Women’s Healthcare Sales Force began full-scale
detailing to healthcare providers. SEASONIQUE has replaced
SEASONALE in the primary sale position among extended-
cycle oral contraceptives within our Women’s Healthcare
Sales Force.
Alliance, Development and Other Revenue
Alliance, development and other revenue consists mainly of
revenue from profit-sharing arrangements, co-promotion
agreements, standby manufacturing fees and reimbursements
and fees we receive in conjunction with our agreement with
the U.S. Department of Defense for the development of the
Adenovirus vaccine. Alliance, development and other revenue
increased substantially from the prior year primarily due to
(1) our profit-sharing arrangement with Teva on sales of their
generic Allegra® product and (2) royalty payments and other
fees under our agreements with Kos on Niaspan and Advicor.
During fiscal 2006, alliance, development and other revenue
totaled $145.8 million compared to $17.2 million in the prior
year. The substantial increase was driven by our profit sharing
arrangement with Teva, which began in September 2005 and
represented 65% of such revenues in fiscal 2006, and an increase
in royalties under our agreements with Kos, under which we
began earning royalties in the fourth quarter of fiscal 2005.
Teva’s 180-day exclusivity period on generic Allegra ended
on February 28, 2006. By the end of June 2006, there were
two additional competing generic Allegra products on the
market. We are aware of several other companies that have
filed ANDAs with Paragraph IV certifications for generic
Allegra. Competition for generic Allegra has and will continue
to cause Teva’s Allegra revenues to decrease. Accordingly, our
royalties are expected to decline. Additionally, our royalty
percentage decreased following the expiration of the exclusivity
period on February 28, 2006, further reducing the amount
we earn. As a result of these factors, our royalties from our
profit-sharing arrangement with Teva are expected to decrease
substantially over the next twelve months.
Royalties we earn under our co-promotion agreement with
Kos are based on the aggregate sales of Niaspan and Advicor in
a given quarter and calendar year, up to quarterly and annual
maximum amounts. While the annual cap increases each year
during the term of our arrangement, which ends July 2012,
unless extended by either party for an additional year, the royalty
rate will decline for calendar 2007, after which the rate remains
fixed throughout the remaining term of the agreement. Due to
the annual cap for calendar 2006, we expect our royalties earned
during the second half of calendar 2006 to be lower than in the
first half of calendar 2006.
Cost of Sales
Amounts that comprise cost of sales include (1) the cost of
products we purchase from third parties, (2) our manufactur-
ing and packaging costs for products we manufacture,
(3) profit-sharing or royalty payments we make to third
parties, including raw material suppliers, (4) changes to our
inventory reserves, and (5) stock-based compensation expense
of certain departments that is allocated to cost of sales.
Amortization costs arising from the acquisition of product
rights and other intangible assets are included in selling,
general and administrative expense.
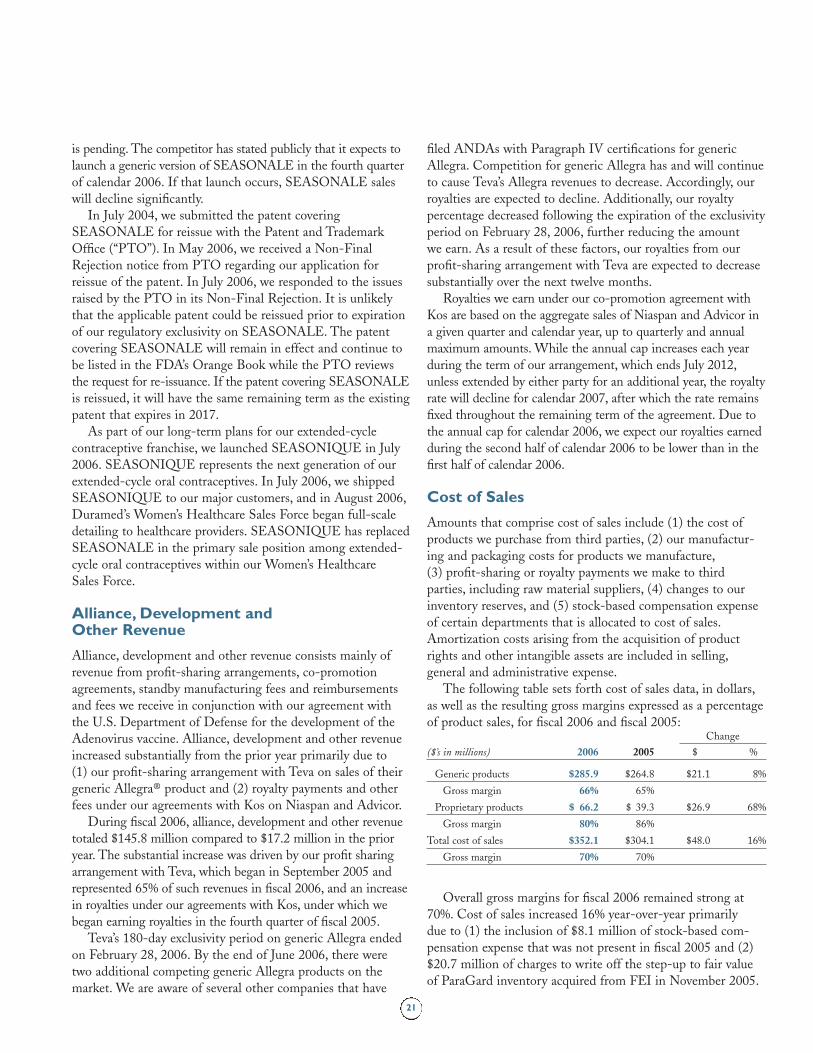
The following table sets forth cost of sales data, in dollars,
as well as the resulting gross margins expressed as a percentage
of product sales, for fiscal 2006 and fiscal 2005:Change
($’s in millions) 2006 2005 $ %
Generic products $285.9 $264.8 $21.1 8%
Gross margin 66% 65%
Proprietary products $ 66.2 $ 39.3 $26.9 68%
Gross margin 80% 86%
Total cost of sales $352.1 $304.1 $48.0 16%
Gross margin 70% 70%
Overall gross margins for fiscal 2006 remained strong at
70%. Cost of sales increased 16% year-over-year primarily
due to (1) the inclusion of $8.1 million of stock-based com-
pensation expense that was not present in fiscal 2005 and (2)
$20.7 million of charges to write off the step-up to fair value
of ParaGard inventory acquired from FEI in November 2005.
06 AR Financial pgs 17-33.qxd 9/11/06 11:24 AM Page 21
22
As of June 30, 2006, the entire amount of the step-up adjustment
had been charged to cost of sales as the units acquired on the date
of acquisition have been sold.
Margins on our generic products increased slightly in fiscal
2006 due to strong sales of Desmopressin and Didanosine,
both of which had higher margins than the average margin of
our other generic products. The margin increase related to
these products was slightly offset by the first-time inclusion of
stock-based compensation expense in cost of sales. We expect
that the margins we realize on Desmopressin will decline in
the future due to the impact of competing products. This
decline may more than offset margins on new generic products
we expect to launch, which could result in lower overall mar-
gins on our generic products over the next twelve months.
Proprietary margins for the year ended June 30, 2006 were
negatively impacted by 6 percentage points due primarily to the
$20.7 million inventory step-up charge described above, and
the inclusion of stock-based compensation expense. We expect
gross margins for proprietary products to be above 80% over the
next few quarters, in part due to the favorable impact resulting
from launches of SEASONIQUE and ENJUVIA somewhat
offset by the expected decline in sales of SEASONALE.
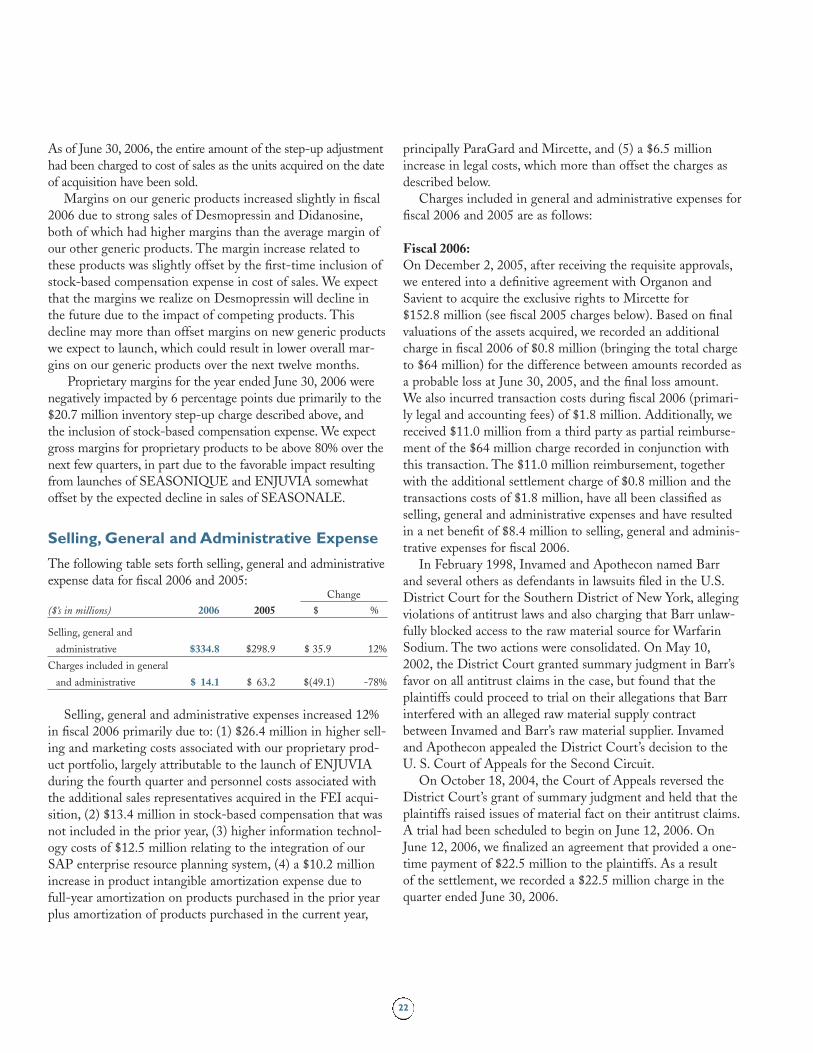
Selling, General and Administrative Expense
The following table sets forth selling, general and administrative
expense data for fiscal 2006 and 2005:Change
($’s in millions) 2006 2005 $ %
Selling, general and
administrative $334.8 $298.9 $ 35.9 12%
Charges included in general
and administrative $ 14.1 $ 63.2 $(49.1) -78%
Selling, general and administrative expenses increased 12%
in fiscal 2006 primarily due to: (1) $26.4 million in higher sell-
ing and marketing costs associated with our proprietary prod-
uct portfolio, largely attributable to the launch of ENJUVIA
during the fourth quarter and personnel costs associated with
the additional sales representatives acquired in the FEI acqui-
sition, (2) $13.4 million in stock-based compensation that was
not included in the prior year, (3) higher information technol-
ogy costs of $12.5 million relating to the integration of our
SAP enterprise resource planning system, (4) a $10.2 million
increase in product intangible amortization expense due to
full-year amortization on products purchased in the prior year
plus amortization of products purchased in the current year,
principally ParaGard and Mircette, and (5) a $6.5 million
increase in legal costs, which more than offset the charges as
described below.
Charges included in general and administrative expenses for
fiscal 2006 and 2005 are as follows:
Fiscal 2006:On December 2, 2005, after receiving the requisite approvals,
we entered into a definitive agreement with Organon and
Savient to acquire the exclusive rights to Mircette for
$152.8 million (see fiscal 2005 charges below). Based on final
valuations of the assets acquired, we recorded an additional
charge in fiscal 2006 of $0.8 million (bringing the total charge
to $64 million) for the difference between amounts recorded as
a probable loss at June 30, 2005, and the final loss amount.
We also incurred transaction costs during fiscal 2006 (primari-
ly legal and accounting fees) of $1.8 million. Additionally, we
received $11.0 million from a third party as partial reimburse-
ment of the $64 million charge recorded in conjunction with
this transaction. The $11.0 million reimbursement, together
with the additional settlement charge of $0.8 million and the
transactions costs of $1.8 million, have all been classified as
selling, general and administrative expenses and have resulted
in a net benefit of $8.4 million to selling, general and adminis-
trative expenses for fiscal 2006.
In February 1998, Invamed and Apothecon named Barr
and several others as defendants in lawsuits filed in the U.S.
District Court for the Southern District of New York, alleging
violations of antitrust laws and also charging that Barr unlaw-
fully blocked access to the raw material source for Warfarin
Sodium. The two actions were consolidated. On May 10,
2002, the District Court granted summary judgment in Barr’s
favor on all antitrust claims in the case, but found that the
plaintiffs could proceed to trial on their allegations that Barr
interfered with an alleged raw material supply contract
between Invamed and Barr’s raw material supplier. Invamed
and Apothecon appealed the District Court’s decision to the
U. S. Court of Appeals for the Second Circuit.
On October 18, 2004, the Court of Appeals reversed the
District Court’s grant of summary judgment and held that the
plaintiffs raised issues of material fact on their antitrust claims.
A trial had been scheduled to begin on June 12, 2006. On
June 12, 2006, we finalized an agreement that provided a one-
time payment of $22.5 million to the plaintiffs. As a result
of the settlement, we recorded a $22.5 million charge in the
quarter ended June 30, 2006.
06 AR Financial pgs 17-33.qxd 9/11/06 11:24 AM Page 22
23
Fiscal 2005:On June 15, 2005, we entered into a non-binding letter of
intent (“LOI”) with Organon (Ireland) Ltd., Organon USA
and Savient Pharmaceuticals, Inc. to acquire the NDA for
Mircette, obtain an exclusive royalty free license to sell
Mircette and Kariva in the United States and dismiss all
pending litigation between the parties in exchange for a pay-
ment by us of up to $155 million. Because the transaction
included, as one of its components, a payment in settlement
of litigation, it was presumed under GAAP to give rise to a
“probable loss,” as defined in Statement of Financial
Accounting Standards No. 5, “Accounting for Contingencies.”
Based on valuations of the assets we acquired and total esti-
mated payments, we had recorded a charge of $63.2 million as
of June 30, 2005 to reflect the proposed litigation settlement.
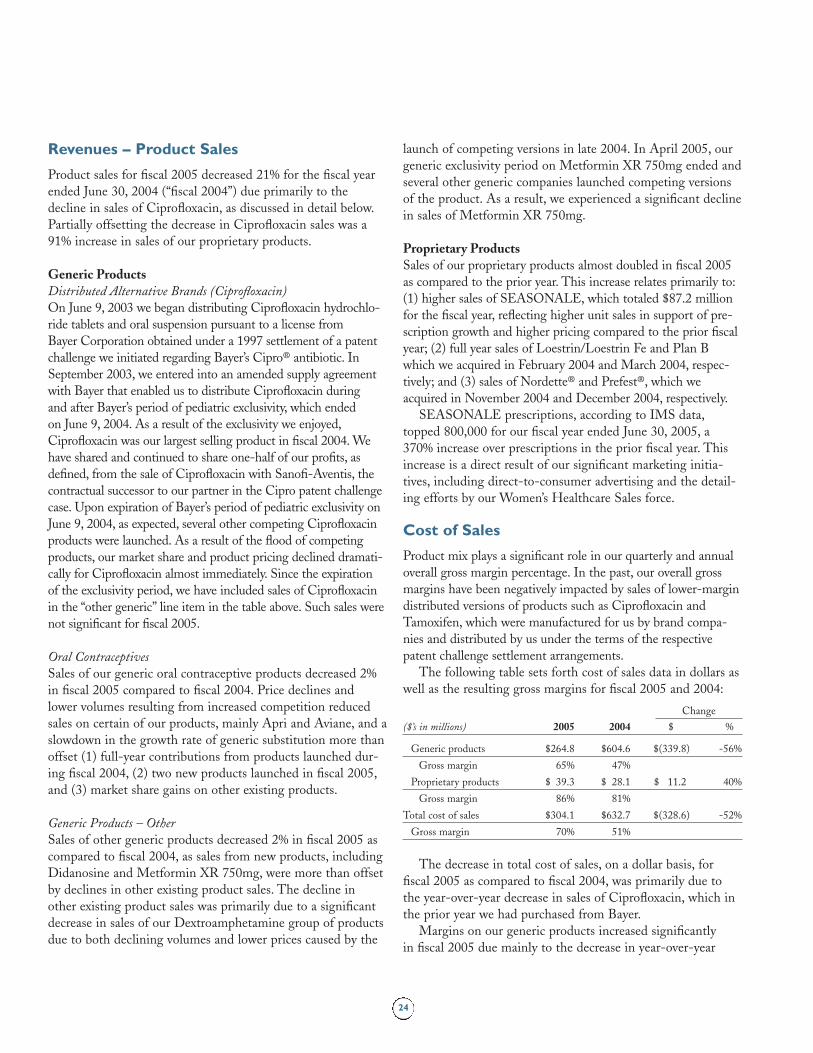
Research and Development
The following table sets forth research and development
expenses for fiscal 2006 and 2005:Change
($’s in millions) 2006 2005 $ %
Research and development $140.2 $128.4 $11.8 9%
The increase in research and development expenses costs
was due to (1) an increase of $9.5 million in costs associated
with clinical trials, (2) the inclusion of $5.6 million of stock-
based compensation that was not similarly included in fiscal
2005, and (3) an increase of $5.6 million in raw material costs.
These increases were offset by a reimbursement of $5.0 million
for previously incurred costs under a third party development
agreement and a $4.0 million decrease in costs associated with
bioequivalent studies supporting our generic product activities.
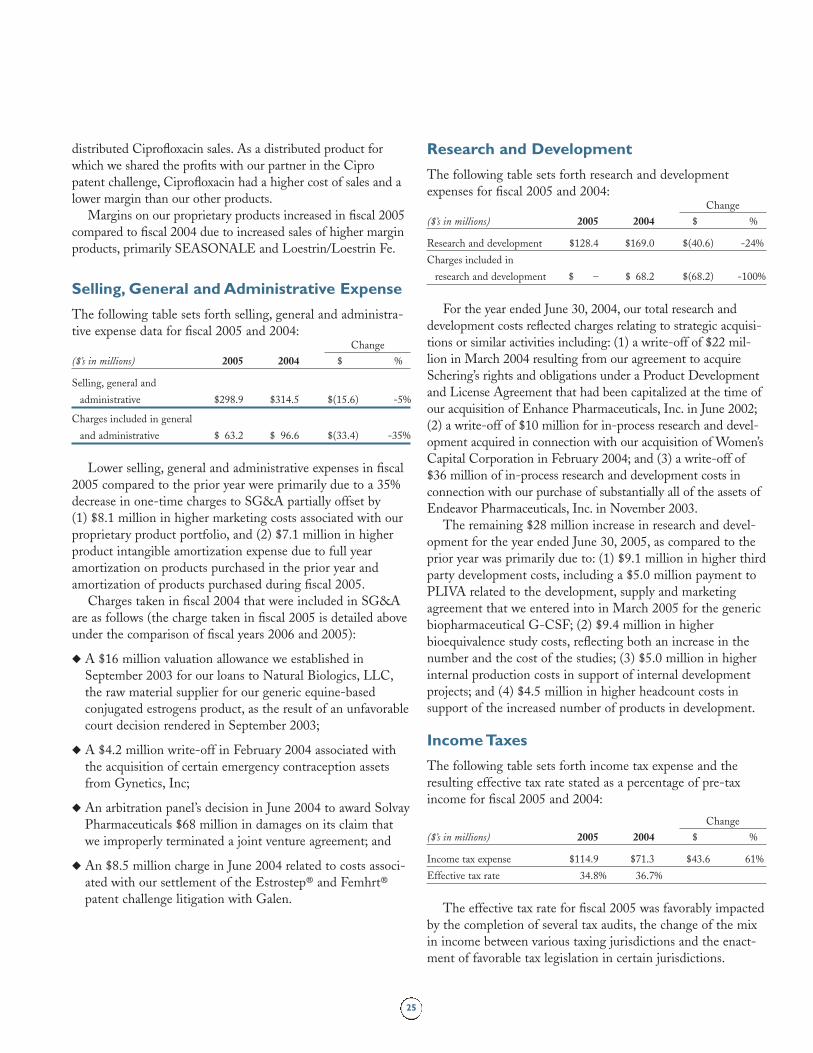
Other Income (expense)
The following table sets forth other income for fiscal 2006
and 2005:Change
($’s in millions) 2006 2005 $ %
Other income (expense) $17.2 $3.9 $13.3 341%
Other income increased to $17.2 million in fiscal 2006 from
$3.9 million in fiscal 2005 primarily as a result of a $10.3 million
gain in the value of our foreign currency option related to the
proposed PLIVA acquisition. This gain was the result of fluctua-
tions and volatility in the exchange rate between the Dollar and
the Euro. We expect additional fluctuations in the value of this
option in the future.
Additionally, we recorded a net gain during fiscal 2006 of
$5.2 million related to our equity investment in two venture
funds, compared to a loss of $0.8 million during fiscal 2005.
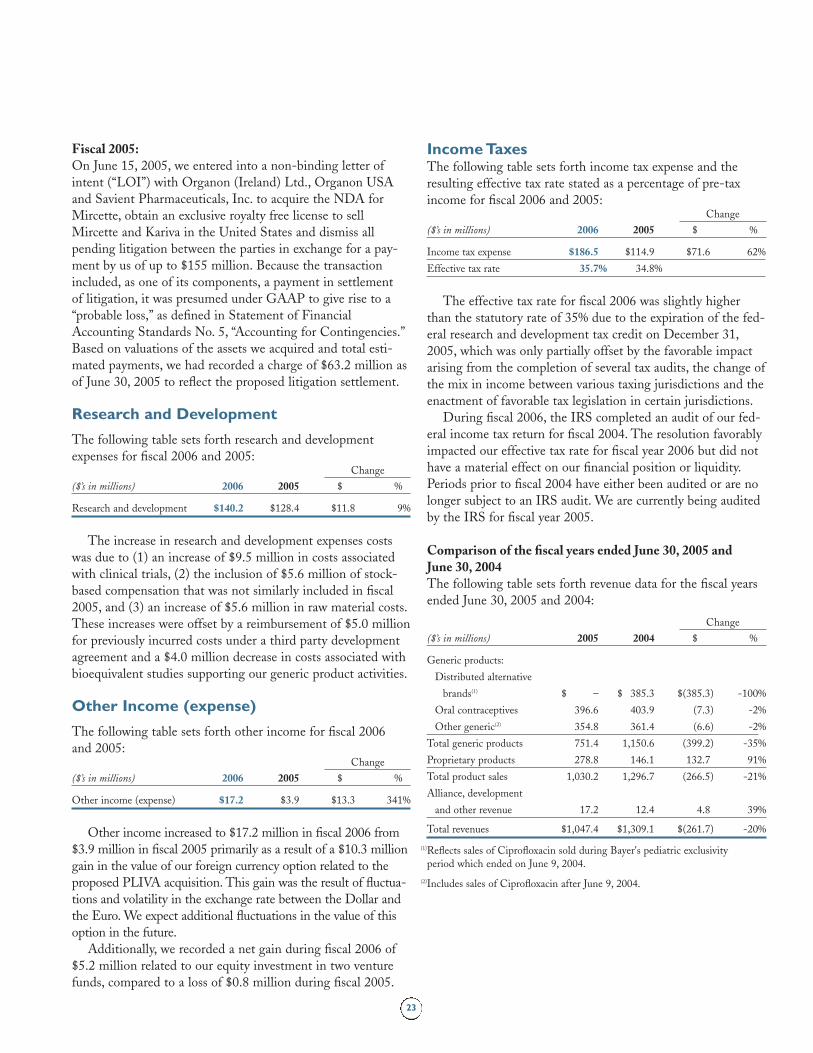
Income Taxes The following table sets forth income tax expense and the
resulting effective tax rate stated as a percentage of pre-tax
income for fiscal 2006 and 2005:Change
($’s in millions) 2006 2005 $ %
Income tax expense $186.5 $114.9 $71.6 62%
Effective tax rate 35.7% 34.8%
The effective tax rate for fiscal 2006 was slightly higher
than the statutory rate of 35% due to the expiration of the fed-
eral research and development tax credit on December 31,
2005, which was only partially offset by the favorable impact
arising from the completion of several tax audits, the change of
the mix in income between various taxing jurisdictions and the
enactment of favorable tax legislation in certain jurisdictions.
During fiscal 2006, the IRS completed an audit of our fed-
eral income tax return for fiscal 2004. The resolution favorably
impacted our effective tax rate for fiscal year 2006 but did not
have a material effect on our financial position or liquidity.
Periods prior to fiscal 2004 have either been audited or are no
longer subject to an IRS audit. We are currently being audited
by the IRS for fiscal year 2005.
Comparison of the fiscal years ended June 30, 2005 and June 30, 2004The following table sets forth revenue data for the fiscal years
ended June 30, 2005 and 2004:
Change
($’s in millions) 2005 2004 $ %
Generic products:
Distributed alternative
brands(1) $ – $ 385.3 $(385.3) -100%
Oral contraceptives 396.6 403.9 (7.3) -2%
Other generic(2) 354.8 361.4 (6.6) -2%
Total generic products 751.4 1,150.6 (399.2) -35%
Proprietary products 278.8 146.1 132.7 91%
Total product sales 1,030.2 1,296.7 (266.5) -21%
Alliance, development
and other revenue 17.2 12.4 4.8 39%
Total revenues $1,047.4 $1,309.1 $(261.7) -20%
(1)Reflects sales of Ciprofloxacin sold during Bayer's pediatric exclusivity
period which ended on June 9, 2004.
(2)Includes sales of Ciprofloxacin after June 9, 2004.
06 AR Financial pgs 17-33.qxd 9/11/06 11:24 AM Page 23
24
Revenues – Product Sales
Product sales for fiscal 2005 decreased 21% for the fiscal year
ended June 30, 2004 (“fiscal 2004”) due primarily to the
decline in sales of Ciprofloxacin, as discussed in detail below.
Partially offsetting the decrease in Ciprofloxacin sales was a
91% increase in sales of our proprietary products.
Generic ProductsDistributed Alternative Brands (Ciprofloxacin)
On June 9, 2003 we began distributing Ciprofloxacin hydrochlo-
ride tablets and oral suspension pursuant to a license from
Bayer Corporation obtained under a 1997 settlement of a patent
challenge we initiated regarding Bayer’s Cipro® antibiotic. In
September 2003, we entered into an amended supply agreement
with Bayer that enabled us to distribute Ciprofloxacin during
and after Bayer’s period of pediatric exclusivity, which ended
on June 9, 2004. As a result of the exclusivity we enjoyed,
Ciprofloxacin was our largest selling product in fiscal 2004. We
have shared and continued to share one-half of our profits, as
defined, from the sale of Ciprofloxacin with Sanofi-Aventis, the
contractual successor to our partner in the Cipro patent challenge
case. Upon expiration of Bayer’s period of pediatric exclusivity on
June 9, 2004, as expected, several other competing Ciprofloxacin
products were launched. As a result of the flood of competing
products, our market share and product pricing declined dramati-
cally for Ciprofloxacin almost immediately. Since the expiration
of the exclusivity period, we have included sales of Ciprofloxacin
in the “other generic” line item in the table above. Such sales were
not significant for fiscal 2005.
Oral Contraceptives
Sales of our generic oral contraceptive products decreased 2%
in fiscal 2005 compared to fiscal 2004. Price declines and
lower volumes resulting from increased competition reduced
sales on certain of our products, mainly Apri and Aviane, and a
slowdown in the growth rate of generic substitution more than
offset (1) full-year contributions from products launched dur-
ing fiscal 2004, (2) two new products launched in fiscal 2005,
and (3) market share gains on other existing products.
Generic Products – Other
Sales of other generic products decreased 2% in fiscal 2005 as
compared to fiscal 2004, as sales from new products, including
Didanosine and Metformin XR 750mg, were more than offset
by declines in other existing product sales. The decline in
other existing product sales was primarily due to a significant
decrease in sales of our Dextroamphetamine group of products
due to both declining volumes and lower prices caused by the
launch of competing versions in late 2004. In April 2005, our
generic exclusivity period on Metformin XR 750mg ended and
several other generic companies launched competing versions
of the product. As a result, we experienced a significant decline
in sales of Metformin XR 750mg.
Proprietary ProductsSales of our proprietary products almost doubled in fiscal 2005
as compared to the prior year. This increase relates primarily to:
(1) higher sales of SEASONALE, which totaled $87.2 million
for the fiscal year, reflecting higher unit sales in support of pre-
scription growth and higher pricing compared to the prior fiscal
year; (2) full year sales of Loestrin/Loestrin Fe and Plan B
which we acquired in February 2004 and March 2004, respec-
tively; and (3) sales of Nordette® and Prefest®, which we
acquired in November 2004 and December 2004, respectively.
SEASONALE prescriptions, according to IMS data,
topped 800,000 for our fiscal year ended June 30, 2005, a
370% increase over prescriptions in the prior fiscal year. This
increase is a direct result of our significant marketing initia-
tives, including direct-to-consumer advertising and the detail-
ing efforts by our Women’s Healthcare Sales force.
Cost of Sales
Product mix plays a significant role in our quarterly and annual
overall gross margin percentage. In the past, our overall gross
margins have been negatively impacted by sales of lower-margin
distributed versions of products such as Ciprofloxacin and
Tamoxifen, which were manufactured for us by brand compa-
nies and distributed by us under the terms of the respective
patent challenge settlement arrangements.
The following table sets forth cost of sales data in dollars as
well as the resulting gross margins for fiscal 2005 and 2004:
Change
($’s in millions) 2005 2004 $ %
Generic products $264.8 $604.6 $(339.8) -56%
Gross margin 65% 47%
Proprietary products $ 39.3 $ 28.1 $ 11.2 40%
Gross margin 86% 81%
Total cost of sales $304.1 $632.7 $(328.6) -52%
Gross margin 70% 51%
The decrease in total cost of sales, on a dollar basis, for
fiscal 2005 as compared to fiscal 2004, was primarily due to
the year-over-year decrease in sales of Ciprofloxacin, which in
the prior year we had purchased from Bayer.
Margins on our generic products increased significantly
in fiscal 2005 due mainly to the decrease in year-over-year
06 AR Financial pgs 17-33.qxd 9/11/06 11:24 AM Page 24
25
distributed Ciprofloxacin sales. As a distributed product for
which we shared the profits with our partner in the Cipro
patent challenge, Ciprofloxacin had a higher cost of sales and a
lower margin than our other products.
Margins on our proprietary products increased in fiscal 2005
compared to fiscal 2004 due to increased sales of higher margin
products, primarily SEASONALE and Loestrin/Loestrin Fe.
Selling, General and Administrative Expense
The following table sets forth selling, general and administra-
tive expense data for fiscal 2005 and 2004:Change
($’s in millions) 2005 2004 $ %
Selling, general and
administrative $298.9 $314.5 $(15.6) -5%
Charges included in general
and administrative $ 63.2 $ 96.6 $(33.4) -35%
Lower selling, general and administrative expenses in fiscal
2005 compared to the prior year were primarily due to a 35%
decrease in one-time charges to SG&A partially offset by
(1) $8.1 million in higher marketing costs associated with our
proprietary product portfolio, and (2) $7.1 million in higher
product intangible amortization expense due to full year
amortization on products purchased in the prior year and
amortization of products purchased during fiscal 2005.
Charges taken in fiscal 2004 that were included in SG&A
are as follows (the charge taken in fiscal 2005 is detailed above
under the comparison of fiscal years 2006 and 2005):
◆ A $16 million valuation allowance we established in
September 2003 for our loans to Natural Biologics, LLC,
the raw material supplier for our generic equine-based
conjugated estrogens product, as the result of an unfavorable
court decision rendered in September 2003;
◆ A $4.2 million write-off in February 2004 associated with
the acquisition of certain emergency contraception assets
from Gynetics, Inc;
◆ An arbitration panel’s decision in June 2004 to award Solvay
Pharmaceuticals $68 million in damages on its claim that
we improperly terminated a joint venture agreement; and
◆ An $8.5 million charge in June 2004 related to costs associ-
ated with our settlement of the Estrostep® and Femhrt®
patent challenge litigation with Galen.
Research and Development
The following table sets forth research and development
expenses for fiscal 2005 and 2004:Change
($’s in millions) 2005 2004 $ %
Research and development $128.4 $169.0 $(40.6) -24%
Charges included in
research and development $ – $ 68.2 $(68.2) -100%
For the year ended June 30, 2004, our total research and
development costs reflected charges relating to strategic acquisi-
tions or similar activities including: (1) a write-off of $22 mil-
lion in March 2004 resulting from our agreement to acquire
Schering’s rights and obligations under a Product Development
and License Agreement that had been capitalized at the time of
our acquisition of Enhance Pharmaceuticals, Inc. in June 2002;
(2) a write-off of $10 million for in-process research and devel-
opment acquired in connection with our acquisition of Women’s
Capital Corporation in February 2004; and (3) a write-off of
$36 million of in-process research and development costs in
connection with our purchase of substantially all of the assets of
Endeavor Pharmaceuticals, Inc. in November 2003.
The remaining $28 million increase in research and devel-
opment for the year ended June 30, 2005, as compared to the
prior year was primarily due to: (1) $9.1 million in higher third
party development costs, including a $5.0 million payment to
PLIVA related to the development, supply and marketing
agreement that we entered into in March 2005 for the generic
biopharmaceutical G-CSF; (2) $9.4 million in higher
bioequivalence study costs, reflecting both an increase in the
number and the cost of the studies; (3) $5.0 million in higher
internal production costs in support of internal development
projects; and (4) $4.5 million in higher headcount costs in
support of the increased number of products in development.
Income Taxes
The following table sets forth income tax expense and the
resulting effective tax rate stated as a percentage of pre-tax
income for fiscal 2005 and 2004:
Change
($’s in millions) 2005 2004 $ %
Income tax expense $114.9 $71.3 $43.6 61%
Effective tax rate 34.8% 36.7%
The effective tax rate for fiscal 2005 was favorably impacted
by the completion of several tax audits, the change of the mix
in income between various taxing jurisdictions and the enact-
ment of favorable tax legislation in certain jurisdictions.
06 AR Financial pgs 17-33.qxd 9/11/06 11:24 AM Page 25
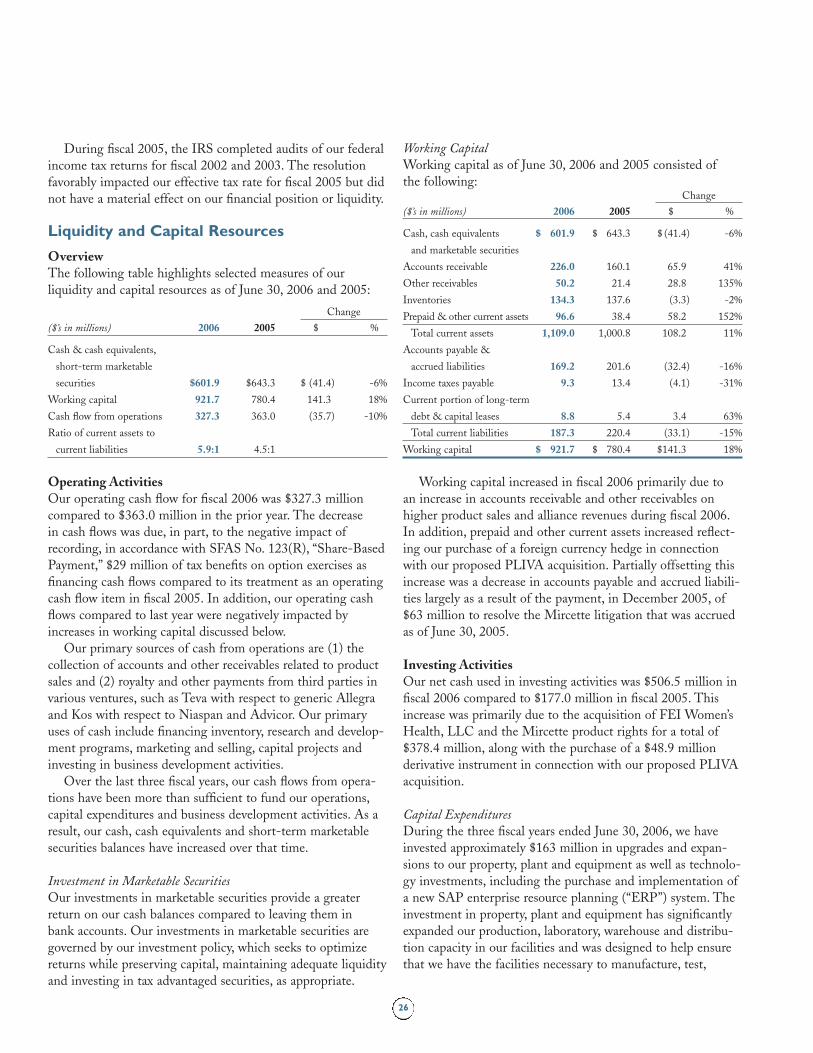
26
Working Capital
Working capital as of June 30, 2006 and 2005 consisted of
the following:Change
($’s in millions) 2006 2005 $ %
Cash, cash equivalents $ 601.9 $ 643.3 $ (41.4) -6%
and marketable securities
Accounts receivable 226.0 160.1 65.9 41%
Other receivables 50.2 21.4 28.8 135%
Inventories 134.3 137.6 (3.3) -2%
Prepaid & other current assets 96.6 38.4 58.2 152%
Total current assets 1,109.0 1,000.8 108.2 11%
Accounts payable &
accrued liabilities 169.2 201.6 (32.4) -16%
Income taxes payable 9.3 13.4 (4.1) -31%
Current portion of long-term
debt & capital leases 8.8 5.4 3.4 63%
Total current liabilities 187.3 220.4 (33.1) -15%
Working capital $ 921.7 $ 780.4 $141.3 18%
Working capital increased in fiscal 2006 primarily due to
an increase in accounts receivable and other receivables on
higher product sales and alliance revenues during fiscal 2006.
In addition, prepaid and other current assets increased reflect-
ing our purchase of a foreign currency hedge in connection
with our proposed PLIVA acquisition. Partially offsetting this
increase was a decrease in accounts payable and accrued liabili-
ties largely as a result of the payment, in December 2005, of
$63 million to resolve the Mircette litigation that was accrued
as of June 30, 2005.
Investing ActivitiesOur net cash used in investing activities was $506.5 million in
fiscal 2006 compared to $177.0 million in fiscal 2005. This
increase was primarily due to the acquisition of FEI Women’s
Health, LLC and the Mircette product rights for a total of
$378.4 million, along with the purchase of a $48.9 million
derivative instrument in connection with our proposed PLIVA
acquisition.
Capital Expenditures
During the three fiscal years ended June 30, 2006, we have
invested approximately $163 million in upgrades and expan-
sions to our property, plant and equipment as well as technolo-
gy investments, including the purchase and implementation of
a new SAP enterprise resource planning (“ERP”) system. The
investment in property, plant and equipment has significantly
expanded our production, laboratory, warehouse and distribu-
tion capacity in our facilities and was designed to help ensure
that we have the facilities necessary to manufacture, test,
During fiscal 2005, the IRS completed audits of our federal
income tax returns for fiscal 2002 and 2003. The resolution
favorably impacted our effective tax rate for fiscal 2005 but did
not have a material effect on our financial position or liquidity.
Liquidity and Capital Resources
OverviewThe following table highlights selected measures of our
liquidity and capital resources as of June 30, 2006 and 2005:
Change
($’s in millions) 2006 2005 $ %
Cash & cash equivalents,
short-term marketable
securities $601.9 $643.3 $ (41.4) -6%
Working capital 921.7 780.4 141.3 18%
Cash flow from operations 327.3 363.0 (35.7) -10%
Ratio of current assets to
current liabilities 5.9:1 4.5:1
Operating ActivitiesOur operating cash flow for fiscal 2006 was $327.3 million
compared to $363.0 million in the prior year. The decrease
in cash flows was due, in part, to the negative impact of
recording, in accordance with SFAS No. 123(R), “Share-Based
Payment,” $29 million of tax benefits on option exercises as
financing cash flows compared to its treatment as an operating
cash flow item in fiscal 2005. In addition, our operating cash
flows compared to last year were negatively impacted by
increases in working capital discussed below.
Our primary sources of cash from operations are (1) the
collection of accounts and other receivables related to product
sales and (2) royalty and other payments from third parties in
various ventures, such as Teva with respect to generic Allegra
and Kos with respect to Niaspan and Advicor. Our primary
uses of cash include financing inventory, research and develop-
ment programs, marketing and selling, capital projects and
investing in business development activities.
Over the last three fiscal years, our cash flows from opera-
tions have been more than sufficient to fund our operations,
capital expenditures and business development activities. As a
result, our cash, cash equivalents and short-term marketable
securities balances have increased over that time.
Investment in Marketable Securities
Our investments in marketable securities provide a greater
return on our cash balances compared to leaving them in
bank accounts. Our investments in marketable securities are
governed by our investment policy, which seeks to optimize
returns while preserving capital, maintaining adequate liquidity
and investing in tax advantaged securities, as appropriate.
06 AR Financial pgs 17-33.qxd 9/11/06 11:24 AM Page 26
27
package and distribute our current and future products. Our
investment in the ERP system will help ensure that we have
a platform to grow our business, including better integration
of acquired businesses, expansion into new drug delivery
systems and the ability to expand internationally.
During fiscal 2006, we invested $61 million in capital proj-
ects and expect that our capital investments will be between
$50 million and $60 million over the next twelve months. Our
estimate reflects continued spending on our facility expansion
programs and investments in information technology projects
including additional investments in support of our new
ERP system.
We believe we can continue funding our capital requirements
using cash provided by operations.
Strategic Transactions
Our investments in strategic acquisitions were $378.4 million in
fiscal 2006 as discussed above and approximately $515 million
for the three years ended June 30, 2006. We continuously evalu-
ate strategic transactions to further improve our business and
long-range prospects and may make additional investments or
acquisitions over the next twelve months, including the pro-
posed acquisition of PLIVA.
Financing ActivitiesNet cash provided by financing activities was $87.8 million in
fiscal 2006 compared to net cash used in financing activities
of $98.7 million in fiscal 2005. The increase compared to the
prior year is primarily due to classifying $29 million of tax
benefits relating to our stock incentives as financing activities
as compared to classifying them as part of operating cash flows
in fiscal 2005, and to the $100 million funding of share repur-
chases under our share repurchase program in fiscal 2005;
there were no such share repurchases under this program in
fiscal 2006.
Share Repurchase Program
In August 2004, our Board of Directors authorized the
repurchase of up to $300 million of our common stock in open
market or in privately negotiated transactions, pursuant to
terms we deem appropriate and at such times as we designate
through the end of December 2005. In November 2005, our
Board of Directors extended the repurchase period through
the end of December 2006. We hold repurchased shares as
treasury shares and may use them for general corporate pur-
poses, including acquisitions and for issuance upon exercise of
outstanding stock options. During fiscal 2005, we repurchased
approximately 2.6 million shares of our common stock for
approximately $100 million. We did not repurchase any shares
in fiscal 2006.
Debt Repayments and Credit Availability
Debt balances decreased by approximately $4 million from
June 30, 2005 to June 30, 2006 reflecting principal repayments.
In February 2005, we made a $12 million payment in com-
plete satisfaction of mortgage notes held by a bank. The notes
were secured by our Cincinnati, Ohio, manufacturing facility.
Principal repayments on existing debt will be $8 million
over the next twelve months.
On July 21, 2006, in anticipation of the funding required
to consummate our tender offer for PLIVA, we entered into
an unsecured Senior Credit Facility (the “Credit Facility”)
pursuant to which lenders will provide us with an aggregate
amount not to exceed $2.8 billion. Of this amount, $2.0 billion
is in the form of a five-year term facility, $500 million is in
the form of a 364-day term facility (combined, the “term facil-
ities”), and $300 million is in the form of a five-year revolving
credit facility. The $2.5 billion of term facilities, which bear
interest at LIBOR plus 75 basis points, may be drawn only in
connection with, if consummated, our proposed PLIVA acqui-
sition. The $300 million revolving credit facility replaces our
prior $175 million revolving credit facility, which we terminat-
ed on July 21, 2006, and may be used for working capital,
capital expenditures and general corporate purposes. The
Credit Facility includes customary covenants for agreements
of this kind, including financial covenants limiting our total
indebtedness on a consolidated basis. In July 2006, a letter
of credit totaling approximately €1.9 was issued on our behalf
under the Credit Facility. The letter of credit, which is being
used to support our tender offer, is subject to fees totaling
0.875% per annum for such time as it remains outstanding.
Proceeds from Equity Transactions
During fiscal 2006, we received proceeds of approximately
$64 million from the exercise of warrants and employee stock
options and share purchases under our employee stock pur-
chase plan. We expect proceeds from future stock option exer-
cises to decline over time, due in part, to our decision to issue
employees stock appreciation rights (“SARs”), rather than
stock options. Upon exercise of a stock option the Company
receives proceeds equal to the grant price per share for each
option exercised. In contrast, the Company will not receive
cash proceeds when a SAR is exercised because the employee
receives a net number of shares. While the Company will
continue to receive proceeds from any remaining options that
are exercised, the amount of such proceeds is difficult to pre-
dict because the proceeds are highly dependent upon our
stock price, which can be volatile.
06 AR Financial pgs 17-33.qxd 9/11/06 11:24 AM Page 27
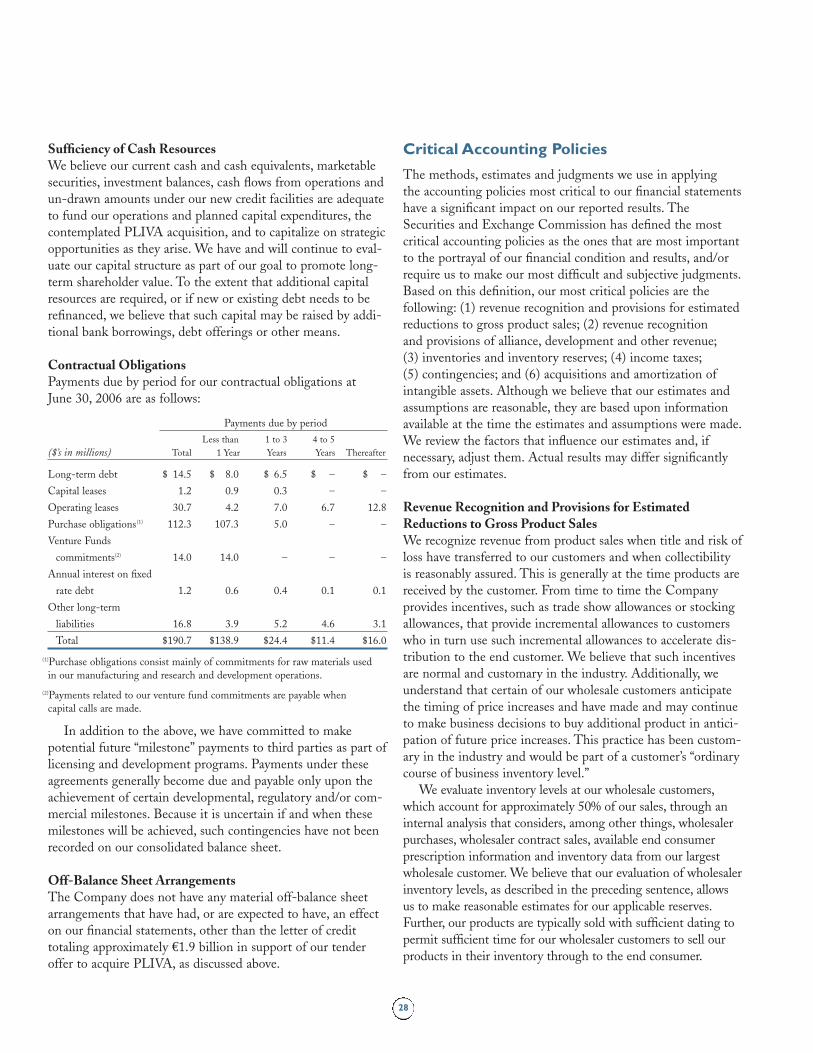
28
Sufficiency of Cash ResourcesWe believe our current cash and cash equivalents, marketable
securities, investment balances, cash flows from operations and
un-drawn amounts under our new credit facilities are adequate
to fund our operations and planned capital expenditures, the
contemplated PLIVA acquisition, and to capitalize on strategic
opportunities as they arise. We have and will continue to eval-
uate our capital structure as part of our goal to promote long-
term shareholder value. To the extent that additional capital
resources are required, or if new or existing debt needs to be
refinanced, we believe that such capital may be raised by addi-
tional bank borrowings, debt offerings or other means.
Contractual Obligations Payments due by period for our contractual obligations at
June 30, 2006 are as follows:
Payments due by period
Less than 1 to 3 4 to 5
($’s in millions) Total 1 Year Years Years Thereafter
Long-term debt $ 14.5 $ 8.0 $ 6.5 $ – $ –
Capital leases 1.2 0.9 0.3 – –
Operating leases 30.7 4.2 7.0 6.7 12.8
Purchase obligations(1) 112.3 107.3 5.0 – –
Venture Funds
commitments(2) 14.0 14.0 – – –
Annual interest on fixed
rate debt 1.2 0.6 0.4 0.1 0.1
Other long-term
liabilities 16.8 3.9 5.2 4.6 3.1
Total $190.7 $138.9 $24.4 $11.4 $16.0
(1)Purchase obligations consist mainly of commitments for raw materials used
in our manufacturing and research and development operations.
(2)Payments related to our venture fund commitments are payable when
capital calls are made.
In addition to the above, we have committed to make
potential future “milestone” payments to third parties as part of
licensing and development programs. Payments under these
agreements generally become due and payable only upon the
achievement of certain developmental, regulatory and/or com-
mercial milestones. Because it is uncertain if and when these
milestones will be achieved, such contingencies have not been
recorded on our consolidated balance sheet.
Off-Balance Sheet ArrangementsThe Company does not have any material off-balance sheet
arrangements that have had, or are expected to have, an effect
on our financial statements, other than the letter of credit
totaling approximately €1.9 billion in support of our tender
offer to acquire PLIVA, as discussed above.
Critical Accounting Policies
The methods, estimates and judgments we use in applying
the accounting policies most critical to our financial statements
have a significant impact on our reported results. The
Securities and Exchange Commission has defined the most
critical accounting policies as the ones that are most important
to the portrayal of our financial condition and results, and/or
require us to make our most difficult and subjective judgments.
Based on this definition, our most critical policies are the
following: (1) revenue recognition and provisions for estimated
reductions to gross product sales; (2) revenue recognition
and provisions of alliance, development and other revenue;
(3) inventories and inventory reserves; (4) income taxes;
(5) contingencies; and (6) acquisitions and amortization of
intangible assets. Although we believe that our estimates and
assumptions are reasonable, they are based upon information
available at the time the estimates and assumptions were made.
We review the factors that influence our estimates and, if
necessary, adjust them. Actual results may differ significantly
from our estimates.
Revenue Recognition and Provisions for EstimatedReductions to Gross Product Sales We recognize revenue from product sales when title and risk of
loss have transferred to our customers and when collectibility
is reasonably assured. This is generally at the time products are
received by the customer. From time to time the Company
provides incentives, such as trade show allowances or stocking
allowances, that provide incremental allowances to customers
who in turn use such incremental allowances to accelerate dis-
tribution to the end customer. We believe that such incentives
are normal and customary in the industry. Additionally, we
understand that certain of our wholesale customers anticipate
the timing of price increases and have made and may continue
to make business decisions to buy additional product in antici-
pation of future price increases. This practice has been custom-
ary in the industry and would be part of a customer’s “ordinary
course of business inventory level.”
We evaluate inventory levels at our wholesale customers,
which account for approximately 50% of our sales, through an
internal analysis that considers, among other things, wholesaler
purchases, wholesaler contract sales, available end consumer
prescription information and inventory data from our largest
wholesale customer. We believe that our evaluation of wholesaler
inventory levels, as described in the preceding sentence, allows
us to make reasonable estimates for our applicable reserves.
Further, our products are typically sold with sufficient dating to
permit sufficient time for our wholesaler customers to sell our
products in their inventory through to the end consumer.
06 AR Financial pgs 17-33.qxd 9/11/06 11:24 AM Page 28
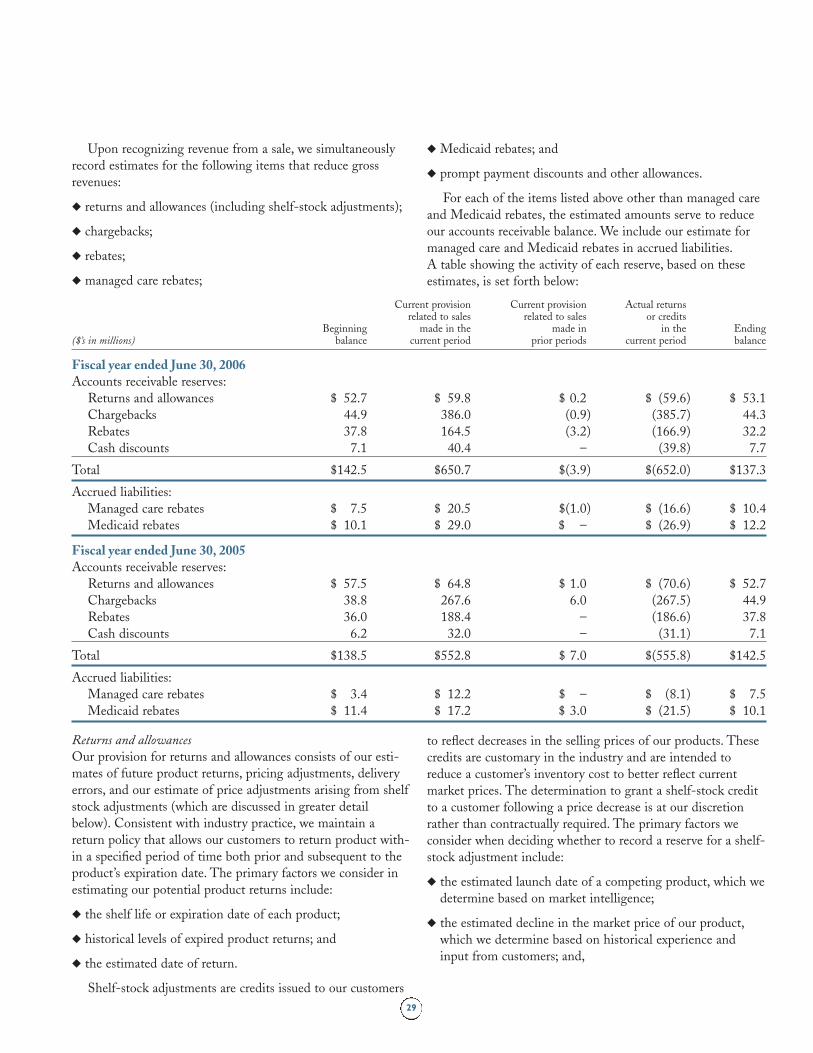
29
Upon recognizing revenue from a sale, we simultaneously
record estimates for the following items that reduce gross
revenues:
◆ returns and allowances (including shelf-stock adjustments);
◆ chargebacks;
◆ rebates;
◆ managed care rebates;
◆ Medicaid rebates; and
◆ prompt payment discounts and other allowances.
For each of the items listed above other than managed care
and Medicaid rebates, the estimated amounts serve to reduce
our accounts receivable balance. We include our estimate for
managed care and Medicaid rebates in accrued liabilities.
A table showing the activity of each reserve, based on these
estimates, is set forth below:
Current provision Current provision Actual returnsrelated to sales related to sales or credits
Beginning made in the made in in the Ending($’s in millions) balance current period prior periods current period balance
Fiscal year ended June 30, 2006Accounts receivable reserves:
Returns and allowances $ 52.7 $ 59.8 $ 0.2 $ (59.6) $ 53.1
Chargebacks 44.9 386.0 (0.9) (385.7) 44.3
Rebates 37.8 164.5 (3.2) (166.9) 32.2
Cash discounts 7.1 40.4 – (39.8) 7.7
Total $142.5 $650.7 $(3.9) $(652.0) $137.3
Accrued liabilities:
Managed care rebates $ 7.5 $ 20.5 $(1.0) $ (16.6) $ 10.4
Medicaid rebates $ 10.1 $ 29.0 $ – $ (26.9) $ 12.2
Fiscal year ended June 30, 2005Accounts receivable reserves:
Returns and allowances $ 57.5 $ 64.8 $ 1.0 $ (70.6) $ 52.7
Chargebacks 38.8 267.6 6.0 (267.5) 44.9
Rebates 36.0 188.4 – (186.6) 37.8
Cash discounts 6.2 32.0 – (31.1) 7.1
Total $138.5 $552.8 $ 7.0 $(555.8) $142.5
Accrued liabilities:
Managed care rebates $ 3.4 $ 12.2 $ – $ (8.1) $ 7.5
Medicaid rebates $ 11.4 $ 17.2 $ 3.0 $ (21.5) $ 10.1
Returns and allowances
Our provision for returns and allowances consists of our esti-
mates of future product returns, pricing adjustments, delivery
errors, and our estimate of price adjustments arising from shelf
stock adjustments (which are discussed in greater detail
below). Consistent with industry practice, we maintain a
return policy that allows our customers to return product with-
in a specified period of time both prior and subsequent to the
product’s expiration date. The primary factors we consider in
estimating our potential product returns include:
◆ the shelf life or expiration date of each product;
◆ historical levels of expired product returns; and
◆ the estimated date of return.
Shelf-stock adjustments are credits issued to our customers
to reflect decreases in the selling prices of our products. These
credits are customary in the industry and are intended to
reduce a customer’s inventory cost to better reflect current
market prices. The determination to grant a shelf-stock credit
to a customer following a price decrease is at our discretion
rather than contractually required. The primary factors we
consider when deciding whether to record a reserve for a shelf-
stock adjustment include:
◆ the estimated launch date of a competing product, which we
determine based on market intelligence;
◆ the estimated decline in the market price of our product,
which we determine based on historical experience and
input from customers; and,
06 AR Financial pgs 17-33.qxd 9/11/06 11:24 AM Page 29
30
◆ the estimated levels of inventory held by our customers at
the time of the anticipated decrease in market price,
which we determine based upon historical experience and
customer input.
Chargebacks
We market and sell products directly to wholesalers, distribu-
tors, warehousing pharmacy chains, mail order pharmacies and
other direct purchasing groups. We also market products indi-
rectly to independent pharmacies, non-warehousing chains,
managed care organizations, and group purchasing organiza-
tions, collectively referred to as “indirect customers.” We enter
into agreements with some indirect customers to establish
contract pricing for certain products. These indirect customers
then independently select a wholesaler from which to purchase
the products at these contracted prices. Alternatively, we may
pre-authorize wholesalers to offer specified contract pricing
to other indirect customers. Under either arrangement, we
provide credit to the wholesaler for any difference between the
contracted price with the indirect customer and the whole-
saler’s invoice price. Such credit is called a chargeback. The
primary factors we consider in developing and evaluating our
provision for chargebacks include:
◆ the average historical chargeback credits; and
◆ an estimate of the inventory held by our wholesalers, based
on internal analysis of a wholesaler’s historical purchases and
contract sales.
Rebates
Our rebate programs can generally be categorized into the
following four types:
◆ direct rebates;
◆ indirect rebates;
◆ managed care rebates; and
◆ Medicaid rebates.
The direct and indirect rebates relate primarily to the
generic segment of our business whereas our managed care
rebates are solely associated with the proprietary segment of
our business. Medicaid rebates apply to both of our segments.
Direct rebates are generally rebates paid to direct purchasing
customers based on a percentage applied to a direct customer’s
purchases from us. Indirect rebates are rebates paid to “indirect
customers” which have purchased Barr products from a whole-
saler under a contract with us. Managed care and Medicaid
rebates are amounts owed based upon contractual agreements
or legal requirements with private sector and public sector
(Medicaid) benefit providers, after the final dispensing of the
product by a pharmacy to a benefit plan participant.
We maintain reserves for our direct rebate programs based
on purchases by our direct purchasing customers. Indirect
rebate reserves are based on actual contract purchases in a peri-
od and an estimate of wholesaler inventory subject to an indi-
rect rebate. Managed care and Medicaid reserves are based on
expected payments, which are driven by patient usage, contract
performance, as well as field inventory that will be subject to a
managed care or Medicaid rebate.
Prompt Pay Discounts
We offer many of our customers 2% prompt pay discounts.
We evaluate the amounts accrued for prompt pay discounts by
analyzing the unpaid invoices in our accounts receivable aging
subject to a prompt pay discount.
Revenue Recognition and Provisions of Alliance,Development and Other Revenue We have agreements with certain pharmaceutical companies
under which we receive payments based on sales or profits
associated with the applicable products. Our two most signifi-
cant of these agreements are those with Teva regarding generic
Allegra and with Kos Pharmaceuticals regarding Niaspan and
Advicor. Revenue from these agreements is recognized at the
time title and risk of loss pass to a third party and is based on
pre-defined formulas contained in our agreements, as adjusted
for our estimates of reserves needed to state our revenues
on a basis consistent with our other revenue recognition policies.
The estimates we make to adjust our revenues are based on
information received from our partner, whether Teva or Kos, as
well as our own internal information. Selling and marketing
expenses we incur under our co-promotion agreement with Kos
are included in selling, general and administrative expenses.
Inventories and Inventory ReservesInventories are stated at the lower of cost or market and
consist of finished goods purchased from third party manufac-
turers and held for distribution, as well as raw materials,
work-in-process and finished goods manufactured by us. We
determine cost on a first-in, first-out basis.
We capitalize the costs associated with certain products prior
to receiving final marketing approval from the FDA for such
products (“pre-launch inventories”). For our generic products,
each ANDA submission is made with the expectation that:
(i) the FDA will approve the marketing of the applicable prod-
uct, (ii) we will validate our process for manufacturing the appli-
cable product within the specifications that have been or will be
approved by the FDA, and (iii) the cost of the inventory will be
recovered from the commercialization of our ANDA product.
Typically, we capitalize inventory related to our proprietary
products based on the same expectations as above, but we do not
begin to capitalize costs until the NDA is filed or in the case of
06 AR Financial pgs 17-33.qxd 9/11/06 11:24 AM Page 30
31
components to a NDA product, the product development
process has progressed to a point where we have determined
that the product has a high probability of regulatory approval.
The accumulation of pre-launch inventory involves risks such as
(i) the FDA may not approve such product(s) for marketing on
a timely basis, if ever, (ii) approvals may require additional or
different testing and/or specifications than what was performed
in the manufacture of such pre-launch inventory, and (iii) in
those instances where the pre-launch inventory is for a product
that is subject to litigation, the litigation may not be resolved or
settled to our satisfaction. If any of these risks were to material-
ize and the launch of such product were significantly delayed,
we may have to write-off all or a portion of such pre-launch
inventory and such amounts could be material. As of June 30,
2006 and 2005, the amount of pre-launch inventory was not
material to our net earnings.
We establish reserves for our inventory, including pre-
launch inventory, to reflect situations in which the cost of the
inventory is not expected to be recovered. We review our
inventory for products that are close to or have reached their
expiration date and therefore are not expected to be sold; for
products where market conditions have changed or are expect-
ed to change; and for products that are not expected to be
saleable based on our quality assurance and control standards.
In addition, for our pre-launch inventory, we take into consid-
eration the substance of communications with the FDA during
the approval process and the views of patent and litigation
counsel. The reserves we establish in these situations are equal
to all or a portion of the cost of the inventory based on the
specific facts and circumstances. In evaluating whether inven-
tory is properly stated at the lower of cost or market, we con-
sider such factors as the amount of product inventory on hand,
estimated time required to sell such inventory, remaining
shelf life and current and expected market conditions, includ-
ing levels of competition. We record provisions for inventory
obsolescence as part of cost of sales.
Inventories are presented net of reserves of $24.7 million at
June 30, 2006 and $13 million at June 30, 2005.
Income Taxes Our effective tax rate is based on pre-tax income, statutory tax
rates and available tax incentives (i.e. credits) and planning
opportunities in the various jurisdictions in which we operate.
We establish reserves when, despite our belief that the tax
return positions are fully supportable, certain positions may be
challenged and may not be upheld on audit. We adjust our
reserves upon the occurrence of a discrete event, such as the
completion of an income tax audit. The effective tax rate
includes the impact of reserve provisions and charges to
reserves that are considered appropriate. This rate is applied
to our quarterly operating results.
Tax regulations require certain items to be included in the
income tax return at different times than the items are reflected
in the financial statements. As a result, the effective tax rate
reflected in the financial statements is different than that report-
ed in the income tax return. Some of the differences are perma-
nent, such as tax-exempt interest income, and some are timing
differences such as depreciation expense. Deferred tax assets
generally represent items that can be used as a tax deduction or
credit in future years for which we have already recorded the tax
benefit in the financial statements. We establish valuation
allowances for our deferred tax assets when the amount of
expected future taxable income is not likely to support the use of
the deduction or credit. Deferred tax liabilities generally repre-
sent tax expense recognized in the financial statements for
which payment has been deferred or expenses for which we have
already taken a deduction on the tax return, but have not yet
recognized as expense in the financial statements.
ContingenciesWe are involved in various patent, product liability, commercial
litigation and claims, government investigations and other
legal proceedings that arise from time to time in the ordinary
course of our business. We assess, in consultation with counsel,
the need to accrue a liability for such contingencies and record
a reserve when we determine that a loss related to a matter is
both probable and reasonably estimable. Because litigation and
other contingencies are inherently unpredictable, our assess-
ment can involve judgments about future events. We record
anticipated recoveries under existing insurance contracts when
collection is reasonably assured.
We utilize a combination of self-insurance and traditional
third-party insurance policies to cover potential product liability
claims on products sold on or after September 30, 2002, and we
have obtained extended reporting periods under previous policies
for claims arising on products sold prior to September 30, 2002.
Acquisitions and Amortization of Intangible Assets We account for acquired businesses using the purchase method
of accounting which requires that the assets acquired and lia-
bilities assumed be recorded at the date of acquisition at their
respective fair values. Our consolidated financial statements
and results of operations reflect an acquired business after the
completion of the acquisition and are not restated. The cost to
acquire a business, including transaction costs, is allocated to
the underlying net assets of the acquired business in propor-
tion to their respective fair values. Any excess of the purchase
price over the estimated fair values of the net assets acquired is
recorded as goodwill. Amounts allocated to acquired in-
process research and development are expensed at the date of
acquisition. Intangible assets are amortized based on sales over
the expected life of the asset. Amortization expense is included
06 AR Financial pgs 17-33.qxd 9/11/06 11:24 AM Page 31
32
in the selling, general and administrative expense line item of
the statement of operations. When we acquire net assets that
do not constitute a business, no goodwill is recognized.
The judgments made in determining the estimated fair
value assigned to each class of assets acquired and liabilities
assumed, as well as asset lives, can materially impact our results
of operations. Accordingly, for significant items, we typically
obtain assistance from third party valuation specialists. Useful
lives are determined based on the expected future period of
benefit of the asset, which considers various characteristics of
the asset, including projected cash flows. We review goodwill
for impairment annually or more frequently if impairment
indicators arise.
As a result of our acquisitions, we have recorded goodwill
of $48 million on our balance sheets as of June 30, 2006, and
$18 million as of June 30, 2005. In addition, as a result of our
acquisition of product rights and related intangibles and certain
product licenses, we have recorded $417 million and $98 million
as other intangible assets, net of accumulated amortization, on
our balance sheets as of June 30, 2006 and 2005, respectively.
Recent Accounting Pronouncements
In December 2004, the Financial Accounting Standards
Board (the “FASB”) issued Statement of Financial Accounting
Standard (“SFAS”) No. 123(R), “Share-Based Payment,”
which revises SFAS No. 123, “Accounting for Stock-Based
Compensation” (“SFAS No. 123”), and supersedes Accounting
Principles Board Opinion No. 25, “Accounting for Stock
Issued to Employees” (“APB No. 25”) and amends SFAS No. 95
“Statement of Cash Flows.” SFAS No. 123(R) requires compa-
nies to recognize in their income statement the grant-date
fair value of stock options and other equity-based compensation
issued to employees and directors. Pro forma disclosure is no
longer an alternative. We adopted SFAS No. 123(R) on July 1,
2005. This Statement requires that compensation expense for
most equity-based awards be recognized over the requisite
service period, usually the vesting period, while compensation
expense for liability-based awards (those usually settled in
cash rather than stock) be re-measured to fair-value at each
balance sheet date until the award is settled.
We use the Black-Scholes formula to estimate the value of
stock-based compensation granted to employees and directors
and expect to continue to use this acceptable option valuation
model in the future. Because SFAS No. 123(R) must be applied
not only to new awards, but also to previously granted awards
that are not fully vested on the effective date, compensation cost
for the unvested portion of some previously granted options
are recognized under SFAS No. 123(R). SFAS No. 123(R) also
requires the benefits of tax deductions in excess of recognized
compensation cost to be reported as a financing cash flow, rather
than as an operating cash flow as currently required.
We elected to utilize the modified prospective transition
method for adopting SFAS 123(R). Under this method, the
provisions of SFAS 123(R) apply to all awards granted or
modified after the date of adoption. In addition, the unrecog-
nized expense of awards not yet vested at the date of adoption,
determined under the original provisions of SFAS 123, shall
be recognized in net earnings in the periods after the date of
adoption. Based on the adoption of the modified prospective
method, the Company recorded a pre-tax stock based compen-
sation expense of approximately $27 million in fiscal 2006.
This amount represents previously issued awards vesting in
fiscal 2006 and 2006 fiscal year awards that were granted.
In March 2005, the FASB published Interpretation No. 47
(“FIN 47”), “Accounting for Conditional Asset Retirement
Obligations,” which clarifies that the term “conditional asset
retirement obligation,” as used in SFAS No. 143, “Accounting
for Asset Retirement Obligations,” refers to a legal obligation
to perform an asset retirement activity in which the timing
and (or) method of settlement are conditional on a future
event that may or may not be within the control of the entity.
The uncertainty about the timing and (or) method of settle-
ment of a conditional asset retirement obligation should be
factored into the measurement of the liability when sufficient
information exists. The interpretation also clarifies when an
entity would have sufficient information to reasonably estimate
the fair value of an asset retirement obligation. The adoption
of this Interpretation during the second quarter of fiscal year
2006 did not have a material effect on our consolidated finan-
cial position, results of operations or cash flows.
In November 2005, the FASB issued FASB Staff Position
(“FSP”) FASB 115-1 and FASB 124-1, “The Meaning of
Other-Than-Temporary Impairment and Its Application to
Certain Investments.” This FSP provides guidance on determin-
ing if an investment is considered to be impaired, if the impair-
ment is other-than-temporary, and the measurement of an
impairment loss. It also includes accounting considerations sub-
sequent to the recognition of an other-than-temporary impair-
ment and requires certain disclosures about unrealized losses
that have not been recognized as other-than-temporary impair-
ments. The guidance in this FSP amends SFAS No. 115,
“Accounting for Certain Investments in Debt and Equity
Securities,” and is effective for reporting periods beginning after
December 15, 2005. The adoption of this FSP did not have a
material impact on our consolidated financial statements.
In July 2006, the FASB issued FASB Interpretation No. 48
(“FIN 48”), “Accounting for Uncertainty in Income Taxes.”
FIN 48 prescribes detailed guidance for the financial statement
recognition, measurement and disclosure of uncertain tax posi-
tions recognized in an enterprise’s financial statements in
accordance with FASB Statement No. 109, “Accounting for
06 AR Financial pgs 17-33.qxd 9/11/06 11:24 AM Page 32
33
Income Taxes.” Tax positions must meet a more-likely-than-not
recognition threshold at the effective date to be recognized upon
the adoption of FIN 48 and in subsequent periods. FIN 48 will
be effective for fiscal years beginning after December 15, 2006,
and the provisions of FIN 48 will be applied to all tax positions
upon initial adoption of the Interpretation. The cumulative
effect of applying the provisions of this Interpretation will be
reported as an adjustment to the opening balance of retained
earnings for that fiscal year. We are currently evaluating the
impact of FIN 48 on our financial statements.
Environmental Matters
We may have obligations for environmental safety and clean-up
under various state, local and federal laws, including the
Comprehensive Environmental Response, Compensation and
Liability Act, commonly known as Superfund. Based on infor-
mation currently available, environmental expenditures have not
had, and are not anticipated to have, any material effect on our
consolidated financial statements.
Effects of Inflation; Seasonality
Inflation has had only a minimal impact on our operations in
recent years. Similarly, our business is generally not affected by
seasonality.
Forward-Looking Statements
The preceding sections contain a number of forward-looking
statements. To the extent that any statements made in this
report contain information that is not historical, these state-
ments are essentially forward-looking. Forward-looking state-
ments can be identified by their use of words such as “expects,”
“plans,” “will,” “may,” “anticipates,” “believes,” “should,” “intends,”
“estimates” and other words of similar meaning. These state-
ments are subject to risks and uncertainties that cannot be
predicted or quantified and, consequently, actual results may
differ materially from those expressed or implied by such for-
ward-looking statements. Such risks and uncertainties include,
in no particular order:
◆ the difficulty in predicting the timing and outcome of legal
proceedings, including patent-related matters such as patent
challenge settlements and patent infringement cases;
◆ the difficulty of predicting the timing of FDA approvals;
◆ court and FDA decisions on exclusivity periods;
◆ the ability of competitors to extend exclusivity periods for
their products;
◆ our ability to complete product development activities in the
timeframes and for the costs we expect;
◆ market and customer acceptance and demand for our
pharmaceutical products;
◆ our dependence on revenues from significant customers;
◆ reimbursement policies of third party payors;
◆ our dependence on revenues from significant products;
◆ the use of estimates in the preparation of our financial
statements;
◆ the impact of competitive products and pricing on products,
including the launch of authorized generics;
◆ the ability to launch new products in the timeframes we
expect;
◆ the availability of raw materials;
◆ the availability of any product we purchase and sell as a
distributor;
◆ the regulatory environment;
◆ our exposure to product liability and other lawsuits and
contingencies;
◆ the cost of insurance and the availability of product liability
insurance coverage;
◆ our timely and successful completion of strategic initiatives,
including integrating companies and products we acquire and
implementing our new enterprise resource planning system;
◆ fluctuations in operating results, including the effects on
such results from spending for research and development,
sales and marketing activities and patent challenge activities;
and
◆ other risks detailed from time-to-time in our filings with the
Securities and Exchange Commission.
We wish to caution each reader of this report to consider
carefully these factors as well as specific factors that may be
discussed with each forward-looking statement in this report or
disclosed in our filings with the SEC, as such factors, in some
cases, could affect our ability to implement our business strate-
gies and may cause actual results to differ materially from those
contemplated by the statements expressed herein. Readers are
urged to carefully review and consider these factors. We under-
take no duty to update the forward-looking statements even
though our situation may change in the future.
06 AR Financial pgs 17-33.qxd 9/11/06 11:24 AM Page 33
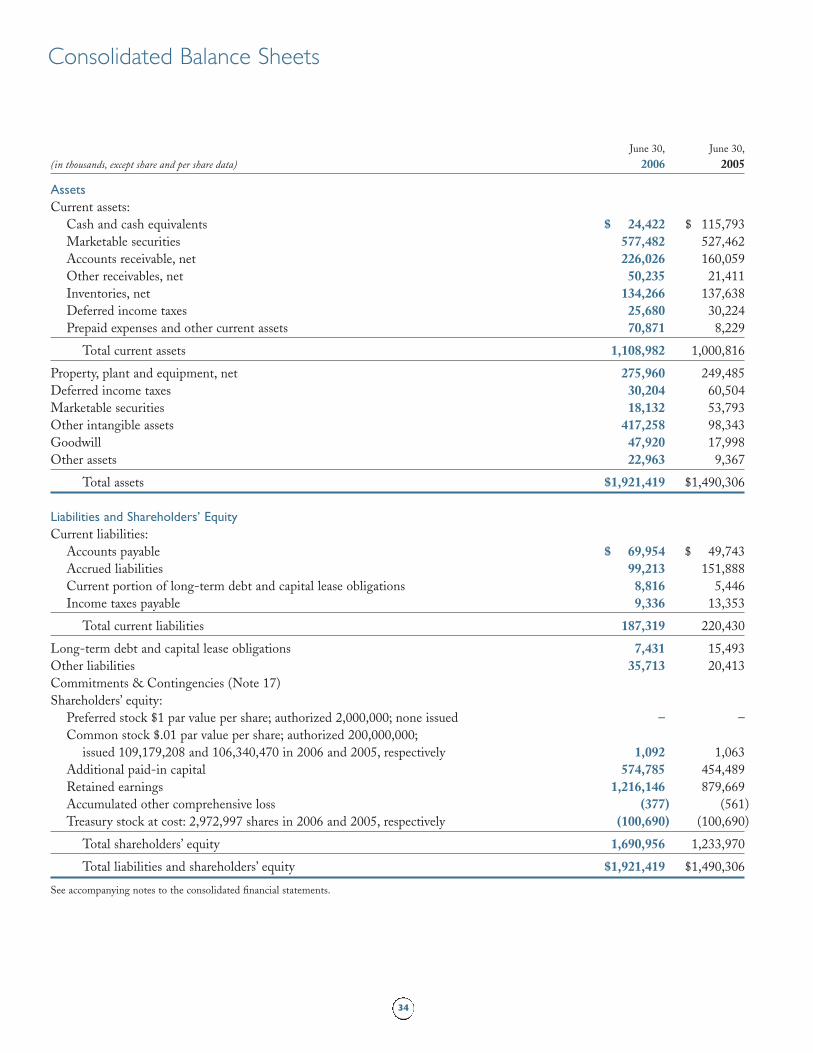
34
June 30, June 30,
(in thousands, except share and per share data) 2006 2005
Assets
Current assets:
Cash and cash equivalents $ 24,422 $ 115,793
Marketable securities 577,482 527,462
Accounts receivable, net 226,026 160,059
Other receivables, net 50,235 21,411
Inventories, net 134,266 137,638
Deferred income taxes 25,680 30,224
Prepaid expenses and other current assets 70,871 8,229
Total current assets 1,108,982 1,000,816
Property, plant and equipment, net 275,960 249,485
Deferred income taxes 30,204 60,504
Marketable securities 18,132 53,793
Other intangible assets 417,258 98,343
Goodwill 47,920 17,998
Other assets 22,963 9,367
Total assets $1,921,419 $1,490,306
Liabilities and Shareholders’ Equity
Current liabilities:
Accounts payable $ 69,954 $ 49,743
Accrued liabilities 99,213 151,888
Current portion of long-term debt and capital lease obligations 8,816 5,446
Income taxes payable 9,336 13,353
Total current liabilities 187,319 220,430
Long-term debt and capital lease obligations 7,431 15,493
Other liabilities 35,713 20,413
Commitments & Contingencies (Note 17)
Shareholders’ equity:
Preferred stock $1 par value per share; authorized 2,000,000; none issued – –
Common stock $.01 par value per share; authorized 200,000,000;
issued 109,179,208 and 106,340,470 in 2006 and 2005, respectively 1,092 1,063
Additional paid-in capital 574,785 454,489
Retained earnings 1,216,146 879,669
Accumulated other comprehensive loss (377) (561)
Treasury stock at cost: 2,972,997 shares in 2006 and 2005, respectively (100,690) (100,690)
Total shareholders’ equity 1,690,956 1,233,970
Total liabilities and shareholders’ equity $1,921,419 $1,490,306
See accompanying notes to the consolidated financial statements.
Consolidated Balance Sheets
06 AR Financial pgs 34-37.qxd 9/11/06 11:22 AM Page 34
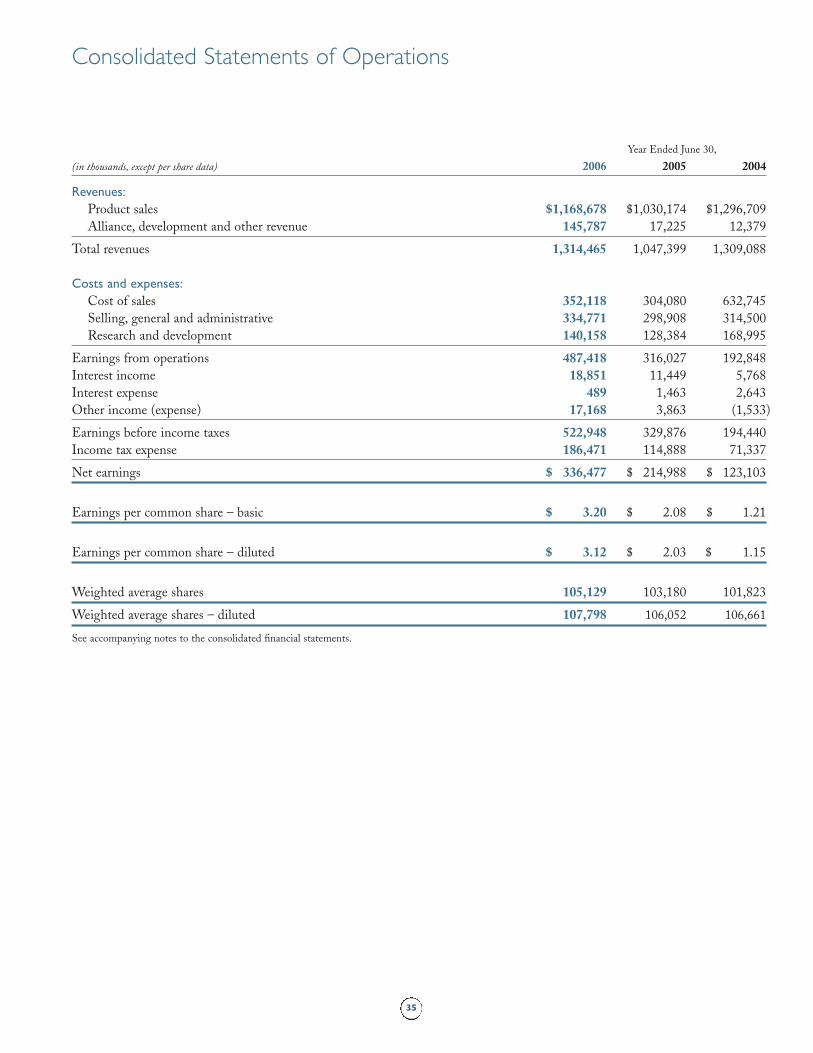
35
Consolidated Statements of Operations
Year Ended June 30,
(in thousands, except per share data) 2006 2005 2004
Revenues:
Product sales $1,168,678 $1,030,174 $1,296,709
Alliance, development and other revenue 145,787 17,225 12,379
Total revenues 1,314,465 1,047,399 1,309,088
Costs and expenses:
Cost of sales 352,118 304,080 632,745
Selling, general and administrative 334,771 298,908 314,500
Research and development 140,158 128,384 168,995
Earnings from operations 487,418 316,027 192,848
Interest income 18,851 11,449 5,768
Interest expense 489 1,463 2,643
Other income (expense) 17,168 3,863 (1,533)
Earnings before income taxes 522,948 329,876 194,440
Income tax expense 186,471 114,888 71,337
Net earnings $ 336,477 $ 214,988 $ 123,103
Earnings per common share – basic $ 3.20 $ 2.08 $ 1.21
Earnings per common share – diluted $ 3.12 $ 2.03 $ 1.15
Weighted average shares 105,129 103,180 101,823
Weighted average shares – diluted 107,798 106,052 106,661
See accompanying notes to the consolidated financial statements.
06 AR Financial pgs 34-37.qxd 9/11/06 11:22 AM Page 35
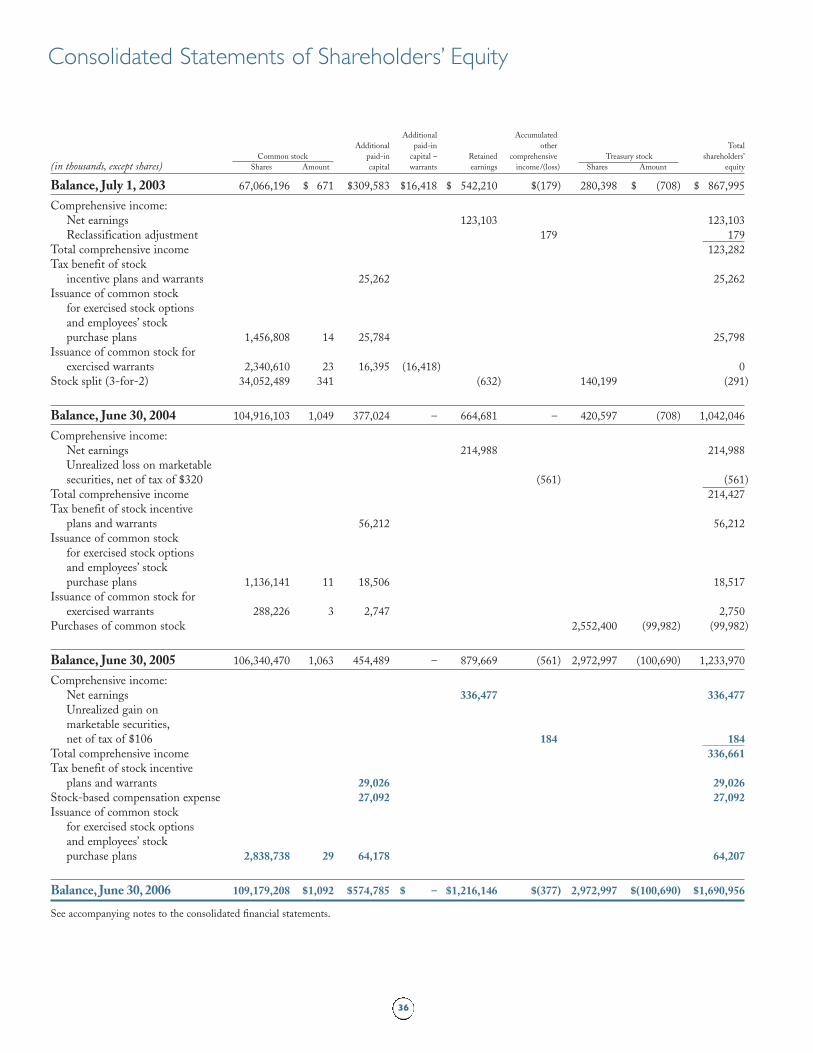
36
Additional Accumulated
Additional paid-in other Total
Common stock paid-in capital – Retained comprehensive Treasury stock shareholders’
(in thousands, except shares) Shares Amount capital warrants earnings income/(loss) Shares Amount equity
Balance, July 1, 2003 67,066,196 $ 671 $309,583 $16,418 $ 542,210 $(179) 280,398 $ (708) $ 867,995
Comprehensive income:Net earnings 123,103 123,103
Reclassification adjustment 179 179
Total comprehensive income 123,282
Tax benefit of stock incentive plans and warrants 25,262 25,262
Issuance of common stock for exercised stock options and employees’ stock purchase plans 1,456,808 14 25,784 25,798
Issuance of common stock forexercised warrants 2,340,610 23 16,395 (16,418) 0
Stock split (3-for-2) 34,052,489 341 (632) 140,199 (291)
Balance, June 30, 2004 104,916,103 1,049 377,024 – 664,681 – 420,597 (708) 1,042,046
Comprehensive income:Net earnings 214,988 214,988
Unrealized loss on marketablesecurities, net of tax of $320 (561) (561)
Total comprehensive income 214,427
Tax benefit of stock incentive plans and warrants 56,212 56,212
Issuance of common stock for exercised stock optionsand employees’ stock purchase plans 1,136,141 11 18,506 18,517
Issuance of common stock for exercised warrants 288,226 3 2,747 2,750
Purchases of common stock 2,552,400 (99,982) (99,982)
Balance, June 30, 2005 106,340,470 1,063 454,489 – 879,669 (561) 2,972,997 (100,690) 1,233,970
Comprehensive income:Net earnings 336,477 336,477
Unrealized gain on marketable securities,net of tax of $106 184 184
Total comprehensive income 336,661
Tax benefit of stock incentive plans and warrants 29,026 29,026
Stock-based compensation expense 27,092 27,092
Issuance of common stock for exercised stock options and employees’ stock purchase plans 2,838,738 29 64,178 64,207
Balance, June 30, 2006 109,179,208 $1,092 $574,785 $ – $1,216,146 $(377) 2,972,997 $(100,690) $1,690,956
See accompanying notes to the consolidated financial statements.
Consolidated Statements of Shareholders’ Equity
06 AR Financial pgs 34-37.qxd 9/11/06 11:22 AM Page 36
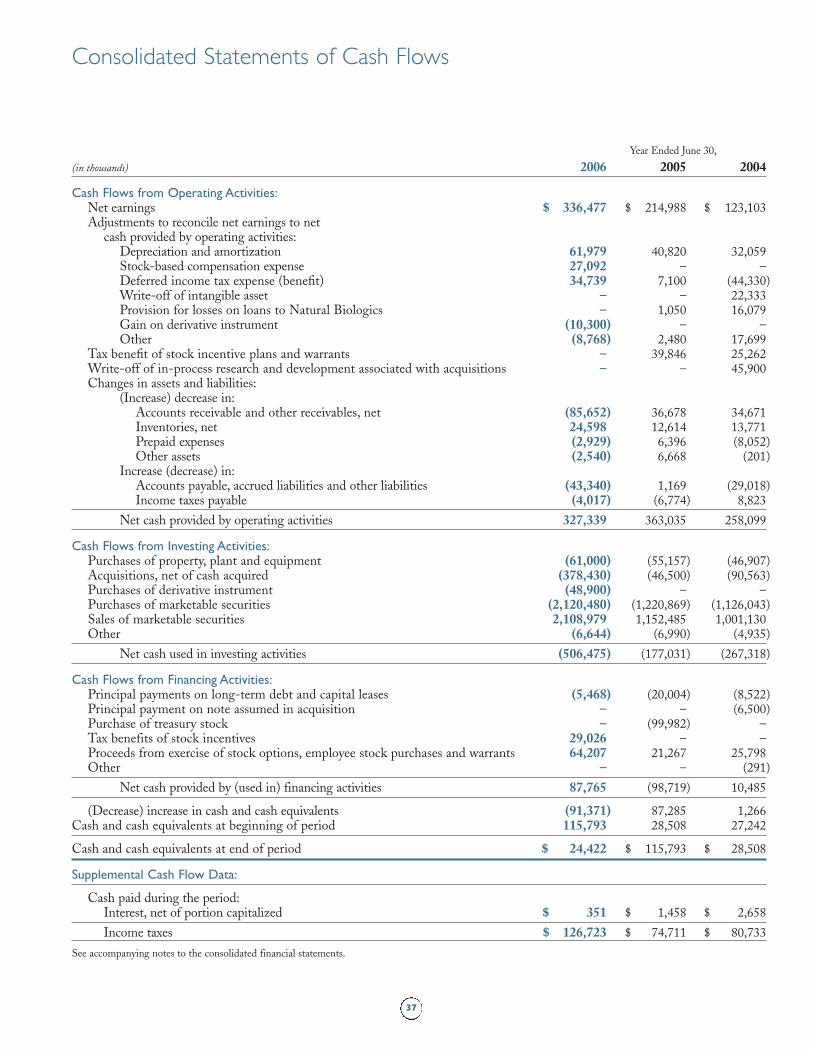
37
Year Ended June 30,
(in thousands) 2006 2005 2004
Cash Flows from Operating Activities:Net earnings $ 336,477 $ 214,988 $ 123,103Adjustments to reconcile net earnings to net
cash provided by operating activities:Depreciation and amortization 61,979 40,820 32,059Stock-based compensation expense 27,092 – –Deferred income tax expense (benefit) 34,739 7,100 (44,330)Write-off of intangible asset – – 22,333Provision for losses on loans to Natural Biologics – 1,050 16,079Gain on derivative instrument (10,300) – –Other (8,768) 2,480 17,699
Tax benefit of stock incentive plans and warrants – 39,846 25,262Write-off of in-process research and development associated with acquisitions – – 45,900Changes in assets and liabilities:
(Increase) decrease in:Accounts receivable and other receivables, net (85,652) 36,678 34,671 Inventories, net 24,598 12,614 13,771Prepaid expenses (2,929) 6,396 (8,052)Other assets (2,540) 6,668 (201)
Increase (decrease) in:Accounts payable, accrued liabilities and other liabilities (43,340) 1,169 (29,018)Income taxes payable (4,017) (6,774) 8,823
Net cash provided by operating activities 327,339 363,035 258,099
Cash Flows from Investing Activities:Purchases of property, plant and equipment (61,000) (55,157) (46,907)Acquisitions, net of cash acquired (378,430) (46,500) (90,563)Purchases of derivative instrument (48,900) – –Purchases of marketable securities (2,120,480) (1,220,869) (1,126,043)Sales of marketable securities 2,108,979 1,152,485 1,001,130Other (6,644) (6,990) (4,935)
Net cash used in investing activities (506,475) (177,031) (267,318)
Cash Flows from Financing Activities:Principal payments on long-term debt and capital leases (5,468) (20,004) (8,522)Principal payment on note assumed in acquisition – – (6,500)Purchase of treasury stock – (99,982) –Tax benefits of stock incentives 29,026 – –Proceeds from exercise of stock options, employee stock purchases and warrants 64,207 21,267 25,798 Other – – (291)
Net cash provided by (used in) financing activities 87,765 (98,719) 10,485
(Decrease) increase in cash and cash equivalents (91,371) 87,285 1,266Cash and cash equivalents at beginning of period 115,793 28,508 27,242
Cash and cash equivalents at end of period $ 24,422 $ 115,793 $ 28,508
Supplemental Cash Flow Data:
Cash paid during the period:Interest, net of portion capitalized $ 351 $ 1,458 $ 2,658
Income taxes $ 126,723 $ 74,711 $ 80,733
See accompanying notes to the consolidated financial statements.
Consolidated Statements of Cash Flows
06 AR Financial pgs 34-37.qxd 9/11/06 11:22 AM Page 37
38
Note 1 Summary of Significant Accounting Policies
(a) Principles of Consolidation and Other MattersBarr Pharmaceuticals, Inc. is a Delaware holding company
whose principal subsidiaries, Barr Laboratories, Inc. and
Duramed Pharmaceuticals, Inc., are engaged in the develop-
ment, manufacture and marketing of generic and proprietary
pharmaceuticals.
The Company’s consolidated financial statements are pre-
pared in accordance with accounting principles generally
accepted in the U.S. The consolidated financial statements
include the accounts of wholly owned subsidiaries, after elimi-
nation of inter-company accounts and transactions. Certain
amounts in the 2004 and 2005 financial statements have been
reclassified to conform to the 2006 presentation.
(b) Use of Estimates in the Preparation of Financial Statements The preparation of financial statements in conformity with
accounting principles generally accepted in the United States
of America requires management to make estimates and use
assumptions that affect the reported amounts of assets and lia-
bilities and disclosure of contingent liabilities at the date of the
financial statements and the reported amounts of revenues and
expenses during the reporting period. These estimates are
often based on judgments, probabilities and assumptions that
management believes are reasonable but that are inherently
uncertain and unpredictable. As a result, actual results could
differ from those estimates. Management periodically evaluates
estimates used in the preparation of the consolidated financial
statements for continued reasonableness. Appropriate adjust-
ments, if any, to the estimates used are made prospectively
based on such periodic evaluations.
(c) Revenue Recognition The Company recognizes product sales revenue when title and
risk of loss have transferred to the customer, when estimated
provisions for product returns, rebates, including Medicaid
rebates, chargebacks and other sales allowances are reasonably
determinable, and when collectibility is reasonably assured.
Accruals for these provisions are presented in the consolidated
financial statements as reductions to revenues. Accounts
receivable are presented net of allowances relating to the above
provisions.
Alliance, development and other revenue includes: reim-
bursements relating to research and development contracts,
licensing fees, royalties earned under co-promotion agreements
and profit splits on certain products. The Company recognizes
revenues under: (1) research and development agreements as it
performs the related research and development; (2) license fees
over the life of the product license; and (3) royalties under co-
promotion agreements and profit splits as described below.
The Company is party to agreements with certain pharma-
ceutical companies under which it receives payments based on
sales or profits associated with the applicable products. The
Company’s most significant of these agreements are with Teva
regarding generic Allegra and with Kos regarding Niaspan and
Advicor. Alliance revenue is earned from these agreements at
the time our third party partners record sales and is based on
pre-defined formulas contained in the agreements, as adjusted
for our estimates of reserves needed to state the Company’s
revenues on a basis consistent with its other revenue recogni-
tion policies. The estimates the Company makes to adjust its
revenues are based on information received from its partner,
whether Teva or Kos, as well as its own internal information.
Of total alliance development and other revenue, approximate-
ly 92% was earned from the alliances with Teva and Kos for
the year ended June 30, 2006. Receivables related to alliance,
development and other revenue are included in “other receiv-
ables, net” in the Consolidated Balance Sheets. Selling and
marketing expenses incurred under the co-promotion agree-
ment with Kos are included in selling, general and administra-
tive expenses.
(d) Sales Returns and Allowances At the time of sale, the Company simultaneously records esti-
mates for various costs, which reduce product sales. These
costs include estimates for price adjustments, product returns,
chargebacks, rebates, including Medicaid rebates, prompt pay-
ment discounts and other sales allowances. In addition, the
Company records allowances for shelf-stock adjustments when
the conditions are appropriate. Estimates for sales allowances
such as product returns, rebates and chargebacks are based on
a variety of factors including actual return experience of that
product or similar products, rebate arrangements for each
product, and estimated sales by our wholesale customers to
other third parties who have contracts with the Company.
Actual experience associated with any of these items may be
different than the Company’s estimates. The Company regu-
larly reviews the factors that influence its estimates and, if nec-
essary, makes adjustments when it believes that actual product
returns, credits and other allowances may differ from estab-
lished reserves.
(e) Stock-Based Compensation The Company adopted Financial Accounting Standards Board
(the “FASB”) Statement of Financial Accounting Standard
(“SFAS”) No. 123 (revised 2004), “Share-Based Payment”
(SFAS 123(R)), effective July 1, 2005. SFAS 123(R) requires
Notes to the Consolidated Financial Statements (in thousands, except for share and per share amounts)
06 AR Financial pgs 38-60.qxd 9/11/06 11:20 AM Page 38
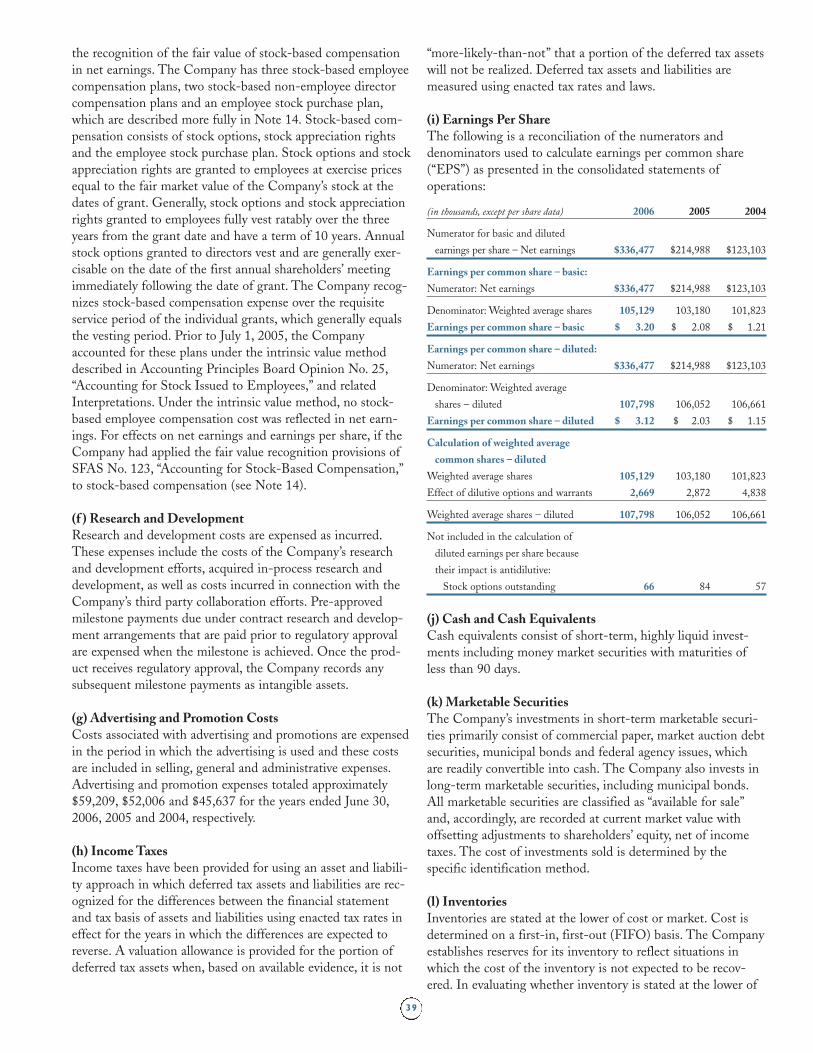
39
“more-likely-than-not” that a portion of the deferred tax assets
will not be realized. Deferred tax assets and liabilities are
measured using enacted tax rates and laws.
(i) Earnings Per Share The following is a reconciliation of the numerators and
denominators used to calculate earnings per common share
(“EPS”) as presented in the consolidated statements of
operations:
(in thousands, except per share data) 2006 2005 2004
Numerator for basic and diluted
earnings per share – Net earnings $336,477 $214,988 $123,103
Earnings per common share – basic:
Numerator: Net earnings $336,477 $214,988 $123,103
Denominator: Weighted average shares 105,129 103,180 101,823
Earnings per common share – basic $ 3.20 $ 2.08 $ 1.21
Earnings per common share – diluted:
Numerator: Net earnings $336,477 $214,988 $123,103
Denominator: Weighted average
shares – diluted 107,798 106,052 106,661
Earnings per common share – diluted $ 3.12 $ 2.03 $ 1.15
Calculation of weighted average
common shares – diluted
Weighted average shares 105,129 103,180 101,823
Effect of dilutive options and warrants 2,669 2,872 4,838
Weighted average shares – diluted 107,798 106,052 106,661
Not included in the calculation of
diluted earnings per share because
their impact is antidilutive:
Stock options outstanding 66 84 57
(j) Cash and Cash Equivalents Cash equivalents consist of short-term, highly liquid invest-
ments including money market securities with maturities of
less than 90 days.
(k) Marketable SecuritiesThe Company’s investments in short-term marketable securi-
ties primarily consist of commercial paper, market auction debt
securities, municipal bonds and federal agency issues, which
are readily convertible into cash. The Company also invests in
long-term marketable securities, including municipal bonds.
All marketable securities are classified as “available for sale”
and, accordingly, are recorded at current market value with
offsetting adjustments to shareholders’ equity, net of income
taxes. The cost of investments sold is determined by the
specific identification method.
(l) Inventories Inventories are stated at the lower of cost or market. Cost is
determined on a first-in, first-out (FIFO) basis. The Company
establishes reserves for its inventory to reflect situations in
which the cost of the inventory is not expected to be recov-
ered. In evaluating whether inventory is stated at the lower of
the recognition of the fair value of stock-based compensation
in net earnings. The Company has three stock-based employee
compensation plans, two stock-based non-employee director
compensation plans and an employee stock purchase plan,
which are described more fully in Note 14. Stock-based com-
pensation consists of stock options, stock appreciation rights
and the employee stock purchase plan. Stock options and stock
appreciation rights are granted to employees at exercise prices
equal to the fair market value of the Company’s stock at the
dates of grant. Generally, stock options and stock appreciation
rights granted to employees fully vest ratably over the three
years from the grant date and have a term of 10 years. Annual
stock options granted to directors vest and are generally exer-
cisable on the date of the first annual shareholders’ meeting
immediately following the date of grant. The Company recog-
nizes stock-based compensation expense over the requisite
service period of the individual grants, which generally equals
the vesting period. Prior to July 1, 2005, the Company
accounted for these plans under the intrinsic value method
described in Accounting Principles Board Opinion No. 25,
“Accounting for Stock Issued to Employees,” and related
Interpretations. Under the intrinsic value method, no stock-
based employee compensation cost was reflected in net earn-
ings. For effects on net earnings and earnings per share, if the
Company had applied the fair value recognition provisions of
SFAS No. 123, “Accounting for Stock-Based Compensation,”
to stock-based compensation (see Note 14).
(f ) Research and Development Research and development costs are expensed as incurred.
These expenses include the costs of the Company’s research
and development efforts, acquired in-process research and
development, as well as costs incurred in connection with the
Company’s third party collaboration efforts. Pre-approved
milestone payments due under contract research and develop-
ment arrangements that are paid prior to regulatory approval
are expensed when the milestone is achieved. Once the prod-
uct receives regulatory approval, the Company records any
subsequent milestone payments as intangible assets.
(g) Advertising and Promotion Costs Costs associated with advertising and promotions are expensed
in the period in which the advertising is used and these costs
are included in selling, general and administrative expenses.
Advertising and promotion expenses totaled approximately
$59,209, $52,006 and $45,637 for the years ended June 30,
2006, 2005 and 2004, respectively.
(h) Income Taxes Income taxes have been provided for using an asset and liabili-
ty approach in which deferred tax assets and liabilities are rec-
ognized for the differences between the financial statement
and tax basis of assets and liabilities using enacted tax rates in
effect for the years in which the differences are expected to
reverse. A valuation allowance is provided for the portion of
deferred tax assets when, based on available evidence, it is not
06 AR Financial pgs 38-60.qxd 9/11/06 11:20 AM Page 39
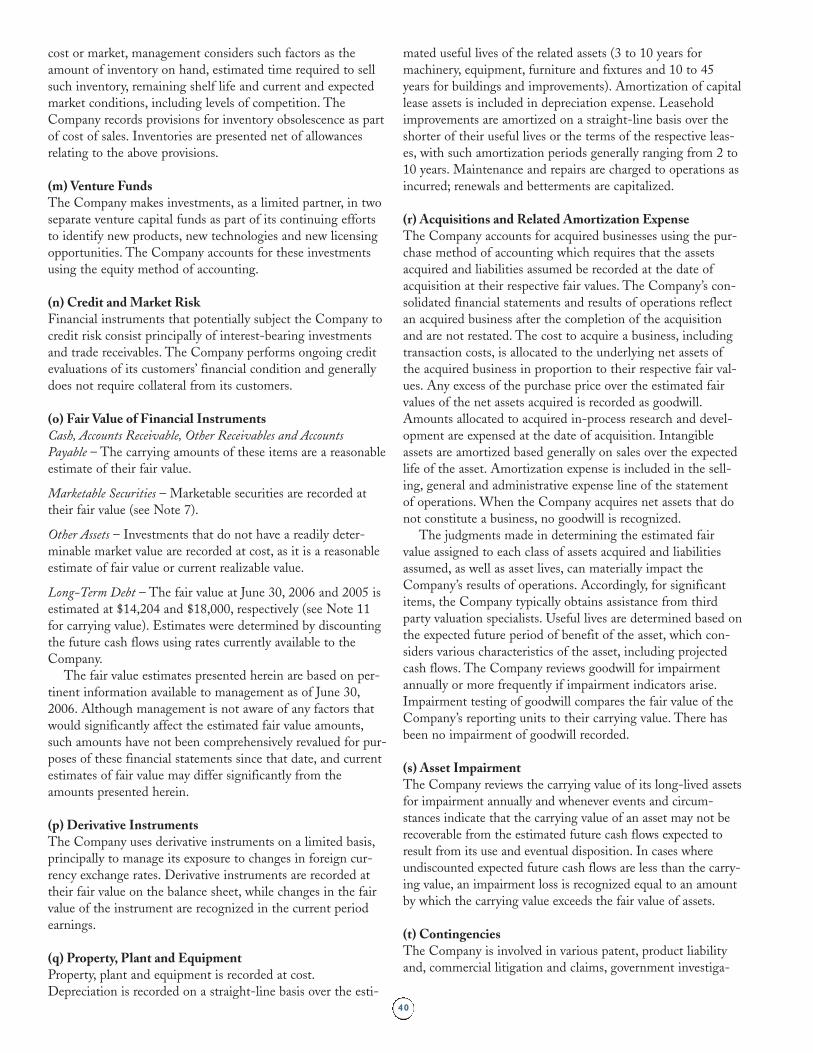
40
mated useful lives of the related assets (3 to 10 years for
machinery, equipment, furniture and fixtures and 10 to 45
years for buildings and improvements). Amortization of capital
lease assets is included in depreciation expense. Leasehold
improvements are amortized on a straight-line basis over the
shorter of their useful lives or the terms of the respective leas-
es, with such amortization periods generally ranging from 2 to
10 years. Maintenance and repairs are charged to operations as
incurred; renewals and betterments are capitalized.
(r) Acquisitions and Related Amortization ExpenseThe Company accounts for acquired businesses using the pur-
chase method of accounting which requires that the assets
acquired and liabilities assumed be recorded at the date of
acquisition at their respective fair values. The Company’s con-
solidated financial statements and results of operations reflect
an acquired business after the completion of the acquisition
and are not restated. The cost to acquire a business, including
transaction costs, is allocated to the underlying net assets of
the acquired business in proportion to their respective fair val-
ues. Any excess of the purchase price over the estimated fair
values of the net assets acquired is recorded as goodwill.
Amounts allocated to acquired in-process research and devel-
opment are expensed at the date of acquisition. Intangible
assets are amortized based generally on sales over the expected
life of the asset. Amortization expense is included in the sell-
ing, general and administrative expense line of the statement
of operations. When the Company acquires net assets that do
not constitute a business, no goodwill is recognized.
The judgments made in determining the estimated fair
value assigned to each class of assets acquired and liabilities
assumed, as well as asset lives, can materially impact the
Company’s results of operations. Accordingly, for significant
items, the Company typically obtains assistance from third
party valuation specialists. Useful lives are determined based on
the expected future period of benefit of the asset, which con-
siders various characteristics of the asset, including projected
cash flows. The Company reviews goodwill for impairment
annually or more frequently if impairment indicators arise.
Impairment testing of goodwill compares the fair value of the
Company’s reporting units to their carrying value. There has
been no impairment of goodwill recorded.
(s) Asset Impairment The Company reviews the carrying value of its long-lived assets
for impairment annually and whenever events and circum-
stances indicate that the carrying value of an asset may not be
recoverable from the estimated future cash flows expected to
result from its use and eventual disposition. In cases where
undiscounted expected future cash flows are less than the carry-
ing value, an impairment loss is recognized equal to an amount
by which the carrying value exceeds the fair value of assets.
(t) Contingencies The Company is involved in various patent, product liability
and, commercial litigation and claims, government investiga-
cost or market, management considers such factors as the
amount of inventory on hand, estimated time required to sell
such inventory, remaining shelf life and current and expected
market conditions, including levels of competition. The
Company records provisions for inventory obsolescence as part
of cost of sales. Inventories are presented net of allowances
relating to the above provisions.
(m) Venture FundsThe Company makes investments, as a limited partner, in two
separate venture capital funds as part of its continuing efforts
to identify new products, new technologies and new licensing
opportunities. The Company accounts for these investments
using the equity method of accounting.
(n) Credit and Market Risk Financial instruments that potentially subject the Company to
credit risk consist principally of interest-bearing investments
and trade receivables. The Company performs ongoing credit
evaluations of its customers’ financial condition and generally
does not require collateral from its customers.
(o) Fair Value of Financial Instruments Cash, Accounts Receivable, Other Receivables and Accounts
Payable – The carrying amounts of these items are a reasonable
estimate of their fair value.
Marketable Securities – Marketable securities are recorded at
their fair value (see Note 7).
Other Assets – Investments that do not have a readily deter-
minable market value are recorded at cost, as it is a reasonable
estimate of fair value or current realizable value.
Long-Term Debt – The fair value at June 30, 2006 and 2005 is
estimated at $14,204 and $18,000, respectively (see Note 11
for carrying value). Estimates were determined by discounting
the future cash flows using rates currently available to the
Company.
The fair value estimates presented herein are based on per-
tinent information available to management as of June 30,
2006. Although management is not aware of any factors that
would significantly affect the estimated fair value amounts,
such amounts have not been comprehensively revalued for pur-
poses of these financial statements since that date, and current
estimates of fair value may differ significantly from the
amounts presented herein.
(p) Derivative InstrumentsThe Company uses derivative instruments on a limited basis,
principally to manage its exposure to changes in foreign cur-
rency exchange rates. Derivative instruments are recorded at
their fair value on the balance sheet, while changes in the fair
value of the instrument are recognized in the current period
earnings.
(q) Property, Plant and Equipment Property, plant and equipment is recorded at cost.
Depreciation is recorded on a straight-line basis over the esti-
06 AR Financial pgs 38-60.qxd 9/11/06 11:20 AM Page 40
41
tions and other legal proceedings that arise from time to time
in the ordinary course of its business (see Note 17). The
Company assesses, in consultation with counsel, the need to
accrue a liability for such contingencies and record a reserve
when it determines that a loss related to a matter is both prob-
able and reasonably estimable. Because litigation and other
contingencies are inherently unpredictable, the Company’s
assessment can involve judgments about future events. The
Company records anticipated recoveries under existing insur-
ance contracts when collection is reasonably assured.
(u) New Accounting Pronouncements In December 2004, the FASB issued SFAS No. 123(R),
“Share-Based Payment,” which revises SFAS No. 123,
“Accounting for Stock-Based Compensation” (“SFAS No.
123”), and supersedes Accounting Principles Board Opinion
No. 25, “Accounting for Stock Issued to Employees” (“APB
No. 25”) and amends SFAS No. 95, “Statement of Cash
Flows.” SFAS No. 123(R) requires companies to recognize in
their income statement the grant-date fair value of stock
options and other equity-based compensation issued to
employees and directors. Pro forma disclosure is no longer an
alternative. The Company adopted SFAS No. 123(R) on July
1, 2005. This Statement requires that compensation expense
for most equity-based awards be recognized over the requisite
service period, usually the vesting period, while compensation
expense for liability-based awards (those usually settled in cash
rather than stock) be re-measured to fair-value at each balance
sheet date until the award is settled.
The Company uses the Black-Scholes formula to estimate
the value of stock-based compensation granted to employees
and directors and expects to continue to use this acceptable
option valuation model in the future. Because SFAS No.
123(R) must be applied not only to new awards, but also to
previously granted awards that are not fully vested on the
effective date, compensation cost for the unvested portion of
some previously granted options is recognized under SFAS
No. 123(R). SFAS No. 123(R) also requires the benefits of tax
deductions in excess of recognized compensation cost to be
reported as a financing cash flow, rather than as an operating
cash flow.
The Company has elected to utilize the modified prospec-
tive transition method for adopting SFAS 123(R). Under this
method, the provisions of SFAS 123(R) apply to all awards
granted or modified after the date of adoption. In addition, the
unrecognized expense of awards not yet vested at the date of
adoption, determined under the original provisions of SFAS
123, are recognized in net earnings in the periods after July 1,
2005. Based on the adoption of the modified prospective
method, the Company recorded a pre-tax stock based compen-
sation expense of approximately $27,000 in fiscal 2006. This
amount represents previously issued awards vesting in fiscal
2006 and 2006 fiscal year awards that have been granted.
In March 2005, the FASB published Interpretation No. 47
(“FIN 47”), “Accounting for Conditional Asset Retirement
Obligations,” which clarifies that the term “conditional asset
retirement obligation,” as used in Statement of SFAS No.
143, “Accounting for Asset Retirement Obligations,” refers to
a legal obligation to perform an asset retirement activity in
which the timing and (or) method of settlement are condi-
tional on a future event that may or may not be within the
control of the entity. The uncertainty about the timing and
(or) method of settlement of a conditional asset retirement
obligation should be factored into the measurement of the lia-
bility when sufficient information exists to reasonably estimate
the fair value of an asset retirement obligation. The adoption
of this Interpretation during the second quarter of fiscal year
2006 did not have a material effect on the Company’s consoli-
dated financial position, results of operations or cash flows.
In November 2005, the FASB issued FASB Staff Position
(“FSP”) FASB 115-1 and FASB 124-1, “The Meaning of
Other-Than-Temporary Impairment and Its Application to
Certain Investments.” This FSP provides guidance on deter-
mining if an investment is considered to be impaired, if the
impairment is other-than-temporary, and the measurement of
an impairment loss. It also includes accounting considerations
subsequent to the recognition of an other-than-temporary
impairment and requires certain disclosures about unrealized
losses that have not been recognized as other-than-temporary
impairments. The guidance in this FSP amends SFAS No.
115, “Accounting for Certain Investments in Debt and Equity
Securities” and is effective for reporting periods beginning
after December 15, 2005. The adoption of this FSP did not
have a material impact on the Company’s consolidated finan-
cial statements.
In July 2006, the FASB issued FASB Interpretation No. 48
(“FIN 48”), “Accounting for Uncertainty in Income Taxes.”
FIN 48 prescribes detailed guidance for the financial statement
recognition, measurement and disclosure of uncertain tax posi-
tions recognized in an enterprise’s financial statements in
accordance with FASB Statement No. 109, “Accounting for
Income Taxes.” Tax positions must meet a more-likely-than-
not recognition threshold at the effective date to be recognized
upon the adoption of FIN 48 and in subsequent periods. FIN
48 will be effective for fiscal years beginning after December
15, 2006, and the provisions of FIN 48 will be applied to all
tax positions upon initial adoption of the Interpretation. The
cumulative effect of applying the provisions of this Interpretation
will be reported as an adjustment to the opening balance of
retained earnings for that fiscal year. The Company is currently
evaluating the impact of FIN 48 on its financial statements.
Note 2 Acquisitions and BusinessCombinations
Fiscal 2006 Acquisitions
FEI Women’s Health, LLC
On November 9, 2005, the Company acquired all of the
outstanding equity interests of FEI Women’s Health,
LLC (“FEI”). FEI is the owner of the ParaGard T 380A
(Intrauterine Copper Contraceptive) IUD, which is approved
for continuous use for the prevention of pregnancy for up
to 10 years.
06 AR Financial pgs 38-60.qxd 9/11/06 11:20 AM Page 41
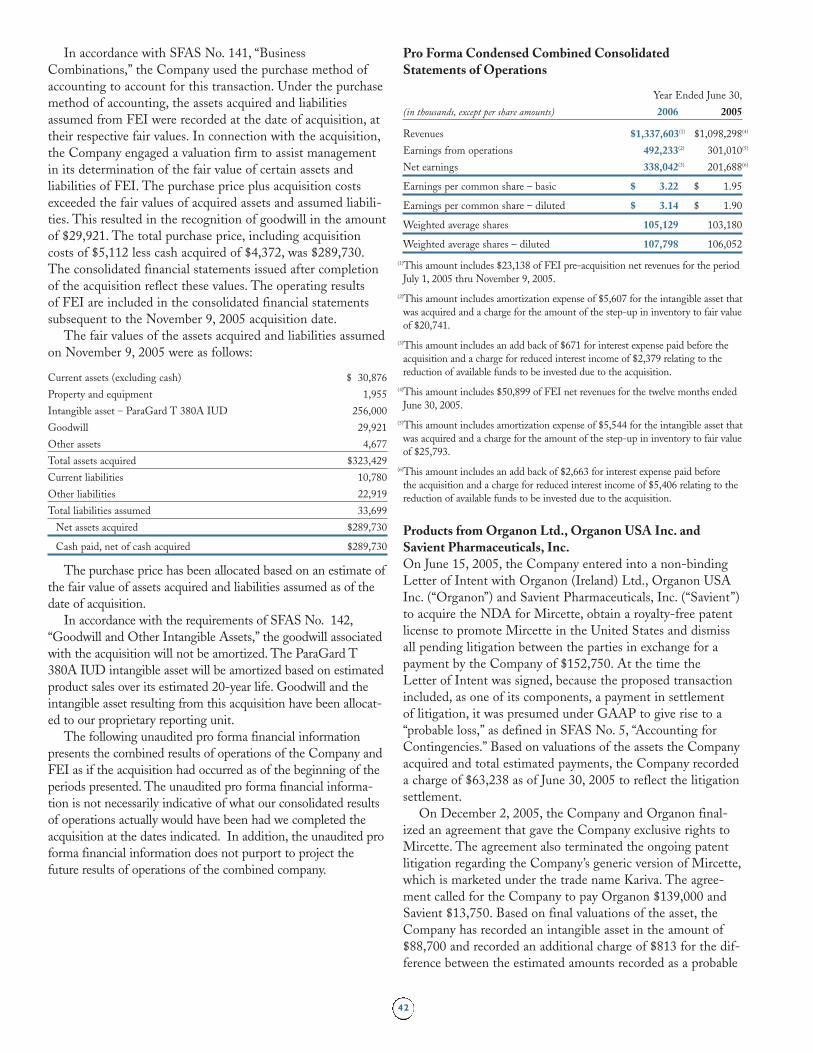
42
In accordance with SFAS No. 141, “Business
Combinations,” the Company used the purchase method of
accounting to account for this transaction. Under the purchase
method of accounting, the assets acquired and liabilities
assumed from FEI were recorded at the date of acquisition, at
their respective fair values. In connection with the acquisition,
the Company engaged a valuation firm to assist management
in its determination of the fair value of certain assets and
liabilities of FEI. The purchase price plus acquisition costs
exceeded the fair values of acquired assets and assumed liabili-
ties. This resulted in the recognition of goodwill in the amount
of $29,921. The total purchase price, including acquisition
costs of $5,112 less cash acquired of $4,372, was $289,730.
The consolidated financial statements issued after completion
of the acquisition reflect these values. The operating results
of FEI are included in the consolidated financial statements
subsequent to the November 9, 2005 acquisition date.
The fair values of the assets acquired and liabilities assumed
on November 9, 2005 were as follows:
Current assets (excluding cash) $ 30,876
Property and equipment 1,955
Intangible asset – ParaGard T 380A IUD 256,000
Goodwill 29,921
Other assets 4,677
Total assets acquired $323,429
Current liabilities 10,780
Other liabilities 22,919
Total liabilities assumed 33,699
Net assets acquired $289,730
Cash paid, net of cash acquired $289,730
The purchase price has been allocated based on an estimate of
the fair value of assets acquired and liabilities assumed as of the
date of acquisition.
In accordance with the requirements of SFAS No. 142,
“Goodwill and Other Intangible Assets,” the goodwill associated
with the acquisition will not be amortized. The ParaGard T
380A IUD intangible asset will be amortized based on estimated
product sales over its estimated 20-year life. Goodwill and the
intangible asset resulting from this acquisition have been allocat-
ed to our proprietary reporting unit.
The following unaudited pro forma financial information
presents the combined results of operations of the Company and
FEI as if the acquisition had occurred as of the beginning of the
periods presented. The unaudited pro forma financial informa-
tion is not necessarily indicative of what our consolidated results
of operations actually would have been had we completed the
acquisition at the dates indicated. In addition, the unaudited pro
forma financial information does not purport to project the
future results of operations of the combined company.
Pro Forma Condensed Combined Consolidated Statements of Operations
Year Ended June 30,
(in thousands, except per share amounts) 2006 2005
Revenues $1,337,603(1) $1,098,298(4)
Earnings from operations 492,233(2) 301,010(5)
Net earnings 338,042(3) 201,688(6)
Earnings per common share – basic $ 3.22 $ 1.95
Earnings per common share – diluted $ 3.14 $ 1.90
Weighted average shares 105,129 103,180
Weighted average shares – diluted 107,798 106,052
(1)This amount includes $23,138 of FEI pre-acquisition net revenues for the period
July 1, 2005 thru November 9, 2005.
(2)This amount includes amortization expense of $5,607 for the intangible asset that
was acquired and a charge for the amount of the step-up in inventory to fair value
of $20,741.
(3)This amount includes an add back of $671 for interest expense paid before the
acquisition and a charge for reduced interest income of $2,379 relating to the
reduction of available funds to be invested due to the acquisition.
(4)This amount includes $50,899 of FEI net revenues for the twelve months ended
June 30, 2005.
(5)This amount includes amortization expense of $5,544 for the intangible asset that
was acquired and a charge for the amount of the step-up in inventory to fair value
of $25,793.
(6)This amount includes an add back of $2,663 for interest expense paid before
the acquisition and a charge for reduced interest income of $5,406 relating to the
reduction of available funds to be invested due to the acquisition.
Products from Organon Ltd., Organon USA Inc. andSavient Pharmaceuticals, Inc.On June 15, 2005, the Company entered into a non-binding
Letter of Intent with Organon (Ireland) Ltd., Organon USA
Inc. (“Organon”) and Savient Pharmaceuticals, Inc. (“Savient”)
to acquire the NDA for Mircette, obtain a royalty-free patent
license to promote Mircette in the United States and dismiss
all pending litigation between the parties in exchange for a
payment by the Company of $152,750. At the time the
Letter of Intent was signed, because the proposed transaction
included, as one of its components, a payment in settlement
of litigation, it was presumed under GAAP to give rise to a
“probable loss,” as defined in SFAS No. 5, “Accounting for
Contingencies.” Based on valuations of the assets the Company
acquired and total estimated payments, the Company recorded
a charge of $63,238 as of June 30, 2005 to reflect the litigation
settlement.
On December 2, 2005, the Company and Organon final-
ized an agreement that gave the Company exclusive rights to
Mircette. The agreement also terminated the ongoing patent
litigation regarding the Company’s generic version of Mircette,
which is marketed under the trade name Kariva. The agree-
ment called for the Company to pay Organon $139,000 and
Savient $13,750. Based on final valuations of the asset, the
Company has recorded an intangible asset in the amount of
$88,700 and recorded an additional charge of $813 for the dif-
ference between the estimated amounts recorded as a probable
06 AR Financial pgs 38-60.qxd 9/11/06 11:20 AM Page 42
43
Certain Assets from Gynétics, Inc.
In February 2004, the Company paid $4,200 to purchase cer-
tain assets from Gynétics, Inc. that were being used to develop,
manufacture, distribute, promote, market, use and sell the
emergency oral contraceptive known as Preven®. The Company
has consolidated its emergency contraception business in the
Plan B product. Accordingly, for the year ended June 30, 2004,
the Company recorded an expense for the $4,200 purchase
price as selling, general and administrative expense.
Products from Galen (Chemicals) Limited
In March 2004, the Company acquired from Galen
(Chemicals) Limited the exclusive rights to manufacture and
market Loestrin products in the United States and Loestrin
and Minestrin® products in Canada for a $45,000 cash pay-
ment. These product rights are recorded as other intangible
assets on the consolidated balance sheets and are being amor-
tized based on estimated product sales over an estimated useful
life of 10 years.
Buy-Out of Royalty Interest from Eastern Virginia Medical School
In September 2004, the Company exercised its option and
paid $19,250 to buy-out the future royalty interests on
SEASONALE, from the former patent holder. This payment
is recorded as other intangible assets on the consolidated bal-
ance sheets and is being amortized based on estimated product
sales over an estimated useful life of 15 years.
Products from King Pharmaceuticals, Inc.
In November 2004 and December 2004, the Company
acquired the exclusive rights in the United States for Prefest
Tablets and Nordette Tablets from King Pharmaceuticals, Inc.
for $15,000 and $12,000, respectively. These product rights are
recorded as other intangible assets on the consolidated balance
sheets and are being amortized based on estimated product
sales over an estimated useful life of 15 years.
Note 3 Derivative Instruments
On June 26, 2006, the Company entered into a currency
option agreement with a bank for the notional amount equal to
€1.8 billion at a cost of $48,900 in order to hedge its foreign
exchange risk related to the proposed acquisition of PLIVA
(see Note 19). As of June 30, 2006, the value of this instrument
increased to $59,200. The instrument is classified on the bal-
ance sheet in prepaid expenses and other current assets. The
increase in the value was recorded as other non-operating
income for the year ended June 30, 2006 (See Note 16). The
item does not meet the criteria required to qualify as a foreign
currency cash flow hedge, as FASB No. 133, “Accounting for
Financial Instruments and Hedging Activities,” specifically
prohibits hedge accounting for an option acquired in connec-
tion with a forecasted or firmly committed business combina-
tion. Accordingly, the Company adjusts its carrying cost to the
fair market value at the end of each period.
loss at June 30, 2005 and the final loss amount. The Company
also incurred approximately $1,800 of additional legal and
accounting costs related to the transaction. Additionally, the
Company was reimbursed $11,000 from a third party for par-
tial reimbursement of the Company’s recorded charge on this
transaction. This reimbursement is reflected as a reduction of
selling, general and administrative expenses.
Fiscal 2005 and 2004 Acquisitions
Urinary Incontinence Product
In June 2002, the Company acquired certain assets and liabili-
ties from Enhance Pharmaceuticals, Inc. including a Product
Development and License Agreement with Schering AG. In
March 2004, Barr and Schering agreed that Barr would
acquire the worldwide rights to the product, which terminated
the Product Development and License Agreement.
Accordingly, during fiscal 2004, the Company wrote-off, as
research and development expense, the remaining $22,333 of
net book value associated with the initial intangible asset for
the product license.
Endeavor Pharmaceuticals, Inc.
On November 20, 2003, the Company completed the acquisi-
tion of substantially all of the assets of Endeavor Pharmaceuticals,
Inc. (“Endeavor”). The total purchase price of $35,600 was
allocated to acquired in-process research and development.
This amount was written-off upon acquisition as research and
development expense because the acquired products had not
received approval from the FDA, were incomplete and had no
alternative future use. The operating results of Endeavor are
included in the consolidated financial statements subsequent to
the November 20, 2003 acquisition date.
Women’s Capital Corporation
In February 2004, the Company acquired 100% of the out-
standing shares of Women’s Capital Corporation (“WCC”), a
privately held company that marketed the prescription version
of Plan B, an emergency oral contraceptive product and had
filed an application with the FDA for an over-the-counter ver-
sion of Plan B. As part of the allocation of the purchase price,
an intangible asset of $2,200 representing the fair value of the
currently marketed prescription version of Plan B was amor-
tized over one year during fiscal 2005 and 2004. An acquired
in-process research and development asset in the amount of
$10,300, representing the estimated fair value of the unap-
proved over-the-counter version of Plan B, was written-off
upon acquisition as research and development expense because
the project was incomplete and had no alternative future use.
The operating results of WCC are included in the consolidat-
ed financial statements subsequent to the February 25, 2004
acquisition date.
06 AR Financial pgs 38-60.qxd 9/11/06 11:20 AM Page 43
44
Note 7 Marketable Securities
The amortized cost and estimated market values of marketable
securities at June 30, 2006 and 2005 are as follows:
Gross Gross
Amortized unrealized unrealized Market
June 30, 2006 cost gains (losses) value
Debt securities $588,421 $ – $(592) $587,829
Equity securities 7,785 – – 7,785
$596,206 $ – $(592) $595,614
June 30, 2005
Debt securities $576,687 $ – $(881) $575,806
Equity securities 5,449 – – 5,449
$582,136 $ – $(881) $581,255
The cost of investments sold is determined by the specific
identification method.
Debt securities at June 30, 2006 with a market value of
$587,829 include $517,267 in commercial paper and market
auction debt securities, which are readily convertible into cash
at par value with interest rate reset or underlying maturity
dates ranging from July 3, 2006 to June 15, 2007, and
$70,562 in municipal and corporate bonds and federal agency
issues with maturity dates ranging from March 15, 2007 to
February 1, 2009.
Equity securities include amounts invested in connection
with the Company’s excess 401(k) and other deferred compen-
sation plans.
Note 8 Goodwill and Other Intangible Assets
Goodwill and other intangible assets consist of the following
at June 30, 2006 and 2005:
June 30,
2006 2005
Goodwill $ 47,920 $ 17,998
Product licenses $ 45,350 $ 45,600
Product rights and related intangibles 415,745 70,796
461,095 116,396
Less: accumulated amortization (43,837) (18,053)
Intangible assets, net $417,258 $ 98,343
As a result of the FEI acquisition during the second quarter
of fiscal 2006, the Company recorded goodwill in the amount
of $29,921 and an intangible asset in the amount of $256,000 in
recognition of the fair value for the ParaGard IUD product
rights acquired (see Note 2). The entire goodwill balance at
June 30, 2006, $47,920, is related to the Company’s proprietary
products segment.
In December 2005, the Company finalized an agreement
that gave the Company exclusive rights to Mircette. The agree-
ment also terminated the ongoing patent litigation regarding the
Company’s generic version of Mircette, which is marketed under
the trade name Kariva. Based on final valuations of the asset, the
Company recorded an intangible asset in the amount of $88,700
(see Note 2).
Note 4 Accounts Receivables, net
The components of accounts receivables are as follows:
June 30,
2006 2005
Trade accounts receivable $357,268 $296,994
Other trade receivables 6,055 5,549
Subtotal 363,323 302,543
Less: allowances 137,297 142,484
Accounts receivable, net $226,026 $160,059
Note 5 Inventories, net
The components of inventory are as follows:
June 30,
2006 2005
Raw materials and supplies $ 86,239 $ 79,120
Work-in-process 22,063 16,405
Finished goods 25,964 42,113
Total inventories, net $134,266 $137,638
Inventories are presented net of reserves of $24,721 and
$13,415 at June 30, 2006 and June 30, 2005, respectively.
During the year ended June 30, 2006, work-in-process and
finished goods amounts included inventory acquired in the
FEI transaction that was stated at fair value. Based on units
sold from the closing date (November 9, 2005) through June
30, 2006, the Company charged cost of sales for $20,741,
which represents the entire amount of the step-up adjustment
of acquired inventory to fair value.
Note 6 Property, Plant and Equipment, net
The major categories of the Company’s property, plant and
equipment are as follows:
June 30,
2006 2005
Land $ 8,317 $ 7,461
Buildings and improvements 140,149 135,737
Machinery and equipment 253,088 189,906
Leasehold improvements 9,345 8,414
Construction in progress 28,723 37,584
439,622 379,102
Less: accumulated
depreciation and amortization 163,662 129,617
Total plant, property and equipment, net $ 275,960 $ 249,485
Depreciation expense was $35,850, $31,591 and $25,678
for the years ended June 30, 2006, 2005 and 2004, respectively.
06 AR Financial pgs 38-60.qxd 9/11/06 11:20 AM Page 44
45
The annual estimated amortization expense for the next five
years on product licenses and product rights and related intangi-
bles is as follows:
Year Ending June 30,
2007 $34,920
2008 32,658
2009 24,772
2010 22,862
2011 21,757
The Company’s product licenses and product rights and
related intangibles have weighted average useful lives of
approximately 10 and 18 years, respectively. Amortization
expense associated with these acquired intangibles is included
in selling, general and administrative expenses and totaled
$25,784 and $13,354 for the years ended June 30, 2006 and
2005, respectively.
Note 9 Solvay Arbitration Award
On March 31, 2002, the Company gave notice of its intention
to terminate, as of June 30, 2002, its relationship with Solvay
Pharmaceuticals, Inc. which covered the joint promotion of the
Company’s Cenestin tablets and Solvay’s Prometrium® capsules.
Solvay disputed the Company’s right to terminate the relation-
ship, claiming it was entitled to substantial damages and initiat-
ed formal arbitration proceedings. The arbitration hearing was
held in January 2004. On June 17, 2004, the arbitration panel
determined that the Company did not properly terminate its
contract with Solvay and awarded Solvay $68,000 in monetary
damages to be paid over sixteen months. The Company has
included these amounts in selling, general and administrative
expenses on its statement of operations and in accrued and other
liabilities on its balance sheet, as applicable.
Note 10 Accrued liabilities
Accrued liabilities consist of the following at June 30, 2006
and 2005:
June 30,
2006 2005
Profit splits due to third parties $22,007 $ 23,158
Payroll, taxes & benefits 21,283 19,184
Medicaid obligations 12,167 10,060
Managed care rebates 10,370 7,460
Legal settlement – 63,238
Other 33,386 28,788
Total accrued liabilities $99,213 $151,888
Note 11 Long-term Debt
A summary of long-term debt is as follows:
June 30,
2006 2005
Senior Unsecured Notes(a) $ 8,000 $12,000
Note Due to WCC Shareholders(b) 6,500 6,500
14,500 18,500
Less: Current installments of long-term debt (8,000) (4,000)
Total long-term debt $ 6,500 $14,500
(a)The Senior Unsecured Notes consists of an $8,000, 7.01% Note due
November 18, 2006. Remaining principal payments under the Note amount to
$8,000 and are expected to be paid in the next twelve months.
The Senior Unsecured Note contains certain covenants including, among
others, a restriction on dividend payments in excess of $10,000 plus 75% of
consolidated net earnings subsequent to June 30, 1997.
(b)In February 2004, the Company acquired all of the outstanding shares of
WCC. In connection with that acquisition, a four-year $6,500 promissory
note was issued to WCC. The note bears interest at 2%. The entire principal
amount and all accrued interest is payable on February 25, 2008.
During fiscal 2006, the Company maintained a five-year
$175,000 revolving credit facility. As of June 30, 2006, there
were no borrowings outstanding under this facility. In July
2006, the Company terminated this revolving credit facility
and replaced it with a five-year $300,000 revolving credit facil-
ity that was entered into as part of the Company’s financing
arrangements to support its proposed PLIVA acquisition (see
Note 19).
Principal maturities of existing long-term debt for the next
five years and thereafter are as follows:
Year Ending June 30,
2007 $ 8,000
2008 6,500
2009 –
2010 –
2011 and thereafter –
Note 12 Related-party Transactions
Dr. Bernard C. Sherman and Jack M. Kay The Company purchases bulk pharmaceutical materials and
sells certain pharmaceutical products and bulk pharmaceutical
materials to companies owned or controlled by Dr. Bernard C.
Sherman. Dr. Sherman was a member of the Company’s Board
of Directors until October 24, 2002, and is the principal stock-
holder of Sherman Delaware, Inc., which owned approximately
5.0% of the Company’s outstanding common stock at June 30,
2006. In addition, Jack M. Kay, a member of the Board of
Directors, is president of Apotex, Inc., one of the companies
owned or controlled by Dr. Sherman.
The Company entered into an agreement with Apotex, Inc.
to share litigation and related costs in connection with the
Company’s Fluoxetine (generic Prozac®) patent challenge.
Under this agreement, certain costs were shown as a reduction
to operating expenses while other costs were included as cost of
06 AR Financial pgs 38-60.qxd 9/11/06 11:20 AM Page 45
46
sales. Separately, the Company receives a royalty on one of its
products marketed and sold by Apotex, Inc. in Canada.
The table below sets forth information regarding transac-
tions with companies owned or controlled by Dr. Sherman.
Year Ended June 30,
2006 2005 2004
Purchases from the Sherman Companies $ 4,931 $ 5,575 $ 2,808
Sales to the Sherman Companies $15,802 $10,149 $ 9,486
Recovery of shared litigation costs
included in operating expenses $ 13 $ 77 $ 1,004
Profit split charged to cost of goods $ 586 $ 1,027 $ 3,680
Royalty revenue $ 557 $ 216 $ 295
One member of the Company’s Board of Directors is a part-
ner at a law firm utilized by the Company for certain patent
and litigation services. Expenses related to these services were
$1,026, $124 and $0 for the years ended June 30, 2006, 2005
and 2004, respectively. As of June 30, 2006 and June 30, 2005,
amounts owed to the law firm totaled approximately $99 and
$124, respectively.
Note 13 Income Taxes
A summary of the components of income tax expense is as
follows:
Year Ended June 30,
2006 2005 2004
Current:
Federal $135,362 $101,355 $101,477
State 16,370 6,482 18,097
$151,732 $107,837 $119,574
Deferred:
Federal $ 30,780 $ 4,441 $(41,348)
State 3,959 2,610 (6,889)
34,739 7,051 (48,237)
Total $186,471 $114,888 $ 71,337
The provision for income taxes differs from amounts
computed by applying the statutory federal income tax rate
to earnings before income taxes due to the following:
Year Ended June 30,
2006 2005 2004
Federal income taxes at statutory rate $183,032 $115,457 $68,054
State income taxes,
net of federal income tax effect 14,099 9,092 6,687
Tax credits (2,778) (6,900) (5,900)
Domestic Manufacturers Deduction
(IRC Section 199) (3,661) – –
Write-off of in-process research
and development – – 3,605
Other, net (4,221) (2,761) (1,109)
Total $186,471 $114,888 $71,337
The temporary differences that give rise to deferred tax assets
and liabilities as of June 30, 2006 and 2005 are as follows:
June 30,
2006 2005
Deferred tax assets:
Net operating loss $ 3,008 $ 3,677
Receivable reserves 16,541 17,833
Inventory 3,820 2,865
Warrants issued 14,844 16,366*
Capital loss carryforward – 2,864
Amortization of intangibles/goodwill 35,593 60,467
Deferred revenue 5,366 7,239
Stock Compensation 6,966 –
Investments 215* 320*
Solvay litigation – 4,003
Other 461 7,108
Total deferred tax assets 86,814 122,742
Deferred tax liabilities:
Plant and equipment (27,857) (24,905)
Other (2,312) (3,452)
Total deferred tax liabilities (30,169) (28,357)
Less valuation allowance (761) (3,657)
Net deferred tax asset $ 55,884 $ 90,728
*changes reflected directly in equity.
At June 30, 2006 and 2005, as a result of certain acquisi-
tions, the Company had cumulative regular net operating loss
carryforwards of approximately $3,008 and $3,677, respectively,
for federal and state income tax purposes, which will expire in
the years 2018 to 2023. There is an annual limitation on the
utilization of the net operating loss carry forward, which is cal-
culated under Internal Revenue Code Section 382.
The Company has established a valuation allowance to
reduce the deferred tax asset recorded for certain tax credits,
capital loss carryforwards, and certain net operating loss carry
forwards. A valuation allowance is recorded because based on
available evidence, it is more-likely-than-not that a deferred tax
asset will not be realized. The valuation allowance reduces the
deferred tax asset to the Company’s best estimate of the net
deferred tax asset that, more-likely-than-not, will be realized.
The valuation allowance will be reduced when and if the
Company determines that the deferred income tax assets are
likely to be realized. Accordingly, during the year ended June
30, 2006, the Company reduced the valuation allowance by
$2,896 due to the expiration of the statute of limitations related
to the carry forward of certain capital losses as well as the asso-
ciated deferred tax asset. During the year ended June 30, 2005,
the Company reduced the valuation allowance by a net of
$1,018 due to the utilization of certain tax capital losses and
the write-off of certain deferred tax assets and related valuation
allowances.
06 AR Financial pgs 38-60.qxd 9/11/06 11:20 AM Page 46
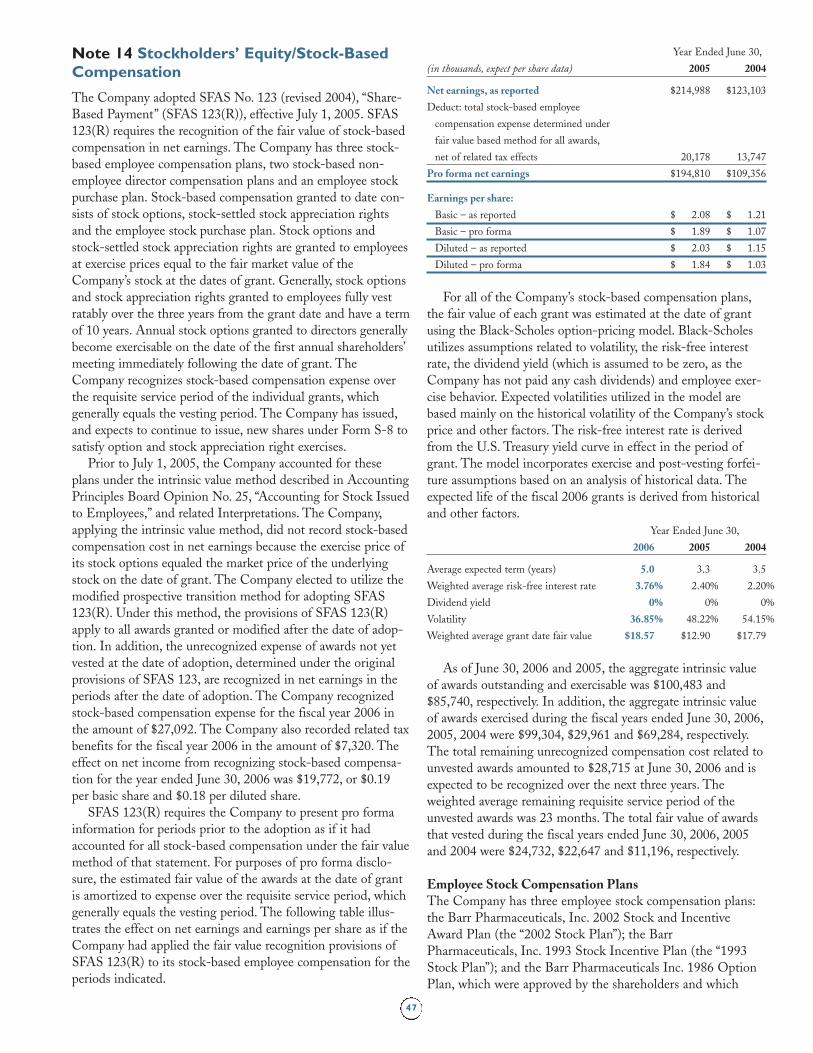
47
Year Ended June 30,
(in thousands, expect per share data) 2005 2004
Net earnings, as reported $214,988 $123,103
Deduct: total stock-based employee
compensation expense determined under
fair value based method for all awards,
net of related tax effects 20,178 13,747
Pro forma net earnings $194,810 $109,356
Earnings per share:
Basic – as reported $ 2.08 $ 1.21
Basic – pro forma $ 1.89 $ 1.07
Diluted – as reported $ 2.03 $ 1.15
Diluted – pro forma $ 1.84 $ 1.03
For all of the Company’s stock-based compensation plans,
the fair value of each grant was estimated at the date of grant
using the Black-Scholes option-pricing model. Black-Scholes
utilizes assumptions related to volatility, the risk-free interest
rate, the dividend yield (which is assumed to be zero, as the
Company has not paid any cash dividends) and employee exer-
cise behavior. Expected volatilities utilized in the model are
based mainly on the historical volatility of the Company’s stock
price and other factors. The risk-free interest rate is derived
from the U.S. Treasury yield curve in effect in the period of
grant. The model incorporates exercise and post-vesting forfei-
ture assumptions based on an analysis of historical data. The
expected life of the fiscal 2006 grants is derived from historical
and other factors.
Year Ended June 30,
2006 2005 2004
Average expected term (years) 5.0 3.3 3.5
Weighted average risk-free interest rate 3.76% 2.40% 2.20%
Dividend yield 0% 0% 0%
Volatility 36.85% 48.22% 54.15%
Weighted average grant date fair value $18.57 $12.90 $17.79
As of June 30, 2006 and 2005, the aggregate intrinsic value
of awards outstanding and exercisable was $100,483 and
$85,740, respectively. In addition, the aggregate intrinsic value
of awards exercised during the fiscal years ended June 30, 2006,
2005, 2004 were $99,304, $29,961 and $69,284, respectively.
The total remaining unrecognized compensation cost related to
unvested awards amounted to $28,715 at June 30, 2006 and is
expected to be recognized over the next three years. The
weighted average remaining requisite service period of the
unvested awards was 23 months. The total fair value of awards
that vested during the fiscal years ended June 30, 2006, 2005
and 2004 were $24,732, $22,647 and $11,196, respectively.
Employee Stock Compensation Plans The Company has three employee stock compensation plans:
the Barr Pharmaceuticals, Inc. 2002 Stock and Incentive
Award Plan (the “2002 Stock Plan”); the Barr
Pharmaceuticals, Inc. 1993 Stock Incentive Plan (the “1993
Stock Plan”); and the Barr Pharmaceuticals Inc. 1986 Option
Plan, which were approved by the shareholders and which
Note 14 Stockholders’ Equity/Stock-BasedCompensation
The Company adopted SFAS No. 123 (revised 2004), “Share-
Based Payment” (SFAS 123(R)), effective July 1, 2005. SFAS
123(R) requires the recognition of the fair value of stock-based
compensation in net earnings. The Company has three stock-
based employee compensation plans, two stock-based non-
employee director compensation plans and an employee stock
purchase plan. Stock-based compensation granted to date con-
sists of stock options, stock-settled stock appreciation rights
and the employee stock purchase plan. Stock options and
stock-settled stock appreciation rights are granted to employees
at exercise prices equal to the fair market value of the
Company’s stock at the dates of grant. Generally, stock options
and stock appreciation rights granted to employees fully vest
ratably over the three years from the grant date and have a term
of 10 years. Annual stock options granted to directors generally
become exercisable on the date of the first annual shareholders’
meeting immediately following the date of grant. The
Company recognizes stock-based compensation expense over
the requisite service period of the individual grants, which
generally equals the vesting period. The Company has issued,
and expects to continue to issue, new shares under Form S-8 to
satisfy option and stock appreciation right exercises.
Prior to July 1, 2005, the Company accounted for these
plans under the intrinsic value method described in Accounting
Principles Board Opinion No. 25, “Accounting for Stock Issued
to Employees,” and related Interpretations. The Company,
applying the intrinsic value method, did not record stock-based
compensation cost in net earnings because the exercise price of
its stock options equaled the market price of the underlying
stock on the date of grant. The Company elected to utilize the
modified prospective transition method for adopting SFAS
123(R). Under this method, the provisions of SFAS 123(R)
apply to all awards granted or modified after the date of adop-
tion. In addition, the unrecognized expense of awards not yet
vested at the date of adoption, determined under the original
provisions of SFAS 123, are recognized in net earnings in the
periods after the date of adoption. The Company recognized
stock-based compensation expense for the fiscal year 2006 in
the amount of $27,092. The Company also recorded related tax
benefits for the fiscal year 2006 in the amount of $7,320. The
effect on net income from recognizing stock-based compensa-
tion for the year ended June 30, 2006 was $19,772, or $0.19
per basic share and $0.18 per diluted share.
SFAS 123(R) requires the Company to present pro forma
information for periods prior to the adoption as if it had
accounted for all stock-based compensation under the fair value
method of that statement. For purposes of pro forma disclo-
sure, the estimated fair value of the awards at the date of grant
is amortized to expense over the requisite service period, which
generally equals the vesting period. The following table illus-
trates the effect on net earnings and earnings per share as if the
Company had applied the fair value recognition provisions of
SFAS 123(R) to its stock-based employee compensation for the
periods indicated.
06 AR Financial pgs 38-60.qxd 9/11/06 11:20 AM Page 47
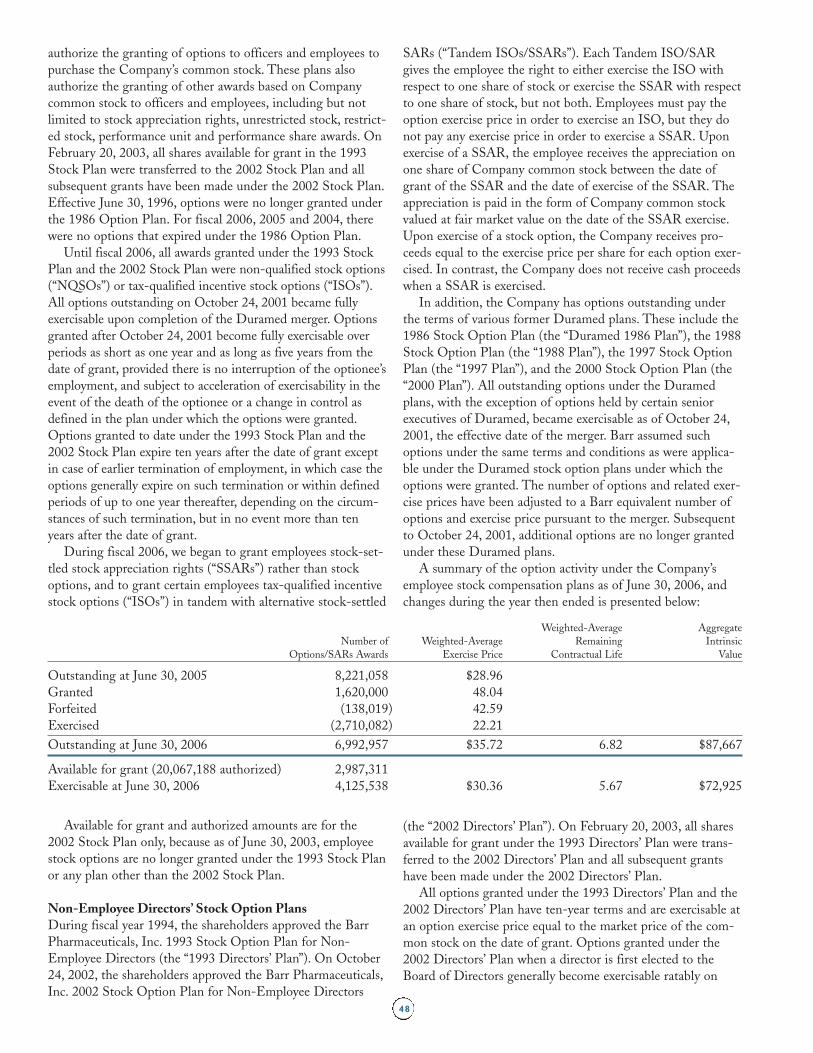
48
authorize the granting of options to officers and employees to
purchase the Company’s common stock. These plans also
authorize the granting of other awards based on Company
common stock to officers and employees, including but not
limited to stock appreciation rights, unrestricted stock, restrict-
ed stock, performance unit and performance share awards. On
February 20, 2003, all shares available for grant in the 1993
Stock Plan were transferred to the 2002 Stock Plan and all
subsequent grants have been made under the 2002 Stock Plan.
Effective June 30, 1996, options were no longer granted under
the 1986 Option Plan. For fiscal 2006, 2005 and 2004, there
were no options that expired under the 1986 Option Plan.
Until fiscal 2006, all awards granted under the 1993 Stock
Plan and the 2002 Stock Plan were non-qualified stock options
(“NQSOs”) or tax-qualified incentive stock options (“ISOs”).
All options outstanding on October 24, 2001 became fully
exercisable upon completion of the Duramed merger. Options
granted after October 24, 2001 become fully exercisable over
periods as short as one year and as long as five years from the
date of grant, provided there is no interruption of the optionee’s
employment, and subject to acceleration of exercisability in the
event of the death of the optionee or a change in control as
defined in the plan under which the options were granted.
Options granted to date under the 1993 Stock Plan and the
2002 Stock Plan expire ten years after the date of grant except
in case of earlier termination of employment, in which case the
options generally expire on such termination or within defined
periods of up to one year thereafter, depending on the circum-
stances of such termination, but in no event more than ten
years after the date of grant.
During fiscal 2006, we began to grant employees stock-set-
tled stock appreciation rights (“SSARs”) rather than stock
options, and to grant certain employees tax-qualified incentive
stock options (“ISOs”) in tandem with alternative stock-settled
SARs (“Tandem ISOs/SSARs”). Each Tandem ISO/SAR
gives the employee the right to either exercise the ISO with
respect to one share of stock or exercise the SSAR with respect
to one share of stock, but not both. Employees must pay the
option exercise price in order to exercise an ISO, but they do
not pay any exercise price in order to exercise a SSAR. Upon
exercise of a SSAR, the employee receives the appreciation on
one share of Company common stock between the date of
grant of the SSAR and the date of exercise of the SSAR. The
appreciation is paid in the form of Company common stock
valued at fair market value on the date of the SSAR exercise.
Upon exercise of a stock option, the Company receives pro-
ceeds equal to the exercise price per share for each option exer-
cised. In contrast, the Company does not receive cash proceeds
when a SSAR is exercised.
In addition, the Company has options outstanding under
the terms of various former Duramed plans. These include the
1986 Stock Option Plan (the “Duramed 1986 Plan”), the 1988
Stock Option Plan (the “1988 Plan”), the 1997 Stock Option
Plan (the “1997 Plan”), and the 2000 Stock Option Plan (the
“2000 Plan”). All outstanding options under the Duramed
plans, with the exception of options held by certain senior
executives of Duramed, became exercisable as of October 24,
2001, the effective date of the merger. Barr assumed such
options under the same terms and conditions as were applica-
ble under the Duramed stock option plans under which the
options were granted. The number of options and related exer-
cise prices have been adjusted to a Barr equivalent number of
options and exercise price pursuant to the merger. Subsequent
to October 24, 2001, additional options are no longer granted
under these Duramed plans.
A summary of the option activity under the Company’s
employee stock compensation plans as of June 30, 2006, and
changes during the year then ended is presented below:
Weighted-Average Aggregate
Number of Weighted-Average Remaining Intrinsic
Options/SARs Awards Exercise Price Contractual Life Value
Outstanding at June 30, 2005 8,221,058 $28.96
Granted 1,620,000 48.04
Forfeited (138,019) 42.59
Exercised (2,710,082) 22.21
Outstanding at June 30, 2006 6,992,957 $35.72 6.82 $87,667
Available for grant (20,067,188 authorized) 2,987,311
Exercisable at June 30, 2006 4,125,538 $30.36 5.67 $72,925
ge
ce
6
04
9
21
72
6
te
ic
Available for grant and authorized amounts are for the
2002 Stock Plan only, because as of June 30, 2003, employee
stock options are no longer granted under the 1993 Stock Plan
or any plan other than the 2002 Stock Plan.
Non-Employee Directors’ Stock Option Plans During fiscal year 1994, the shareholders approved the Barr
Pharmaceuticals, Inc. 1993 Stock Option Plan for Non-
Employee Directors (the “1993 Directors’ Plan”). On October
24, 2002, the shareholders approved the Barr Pharmaceuticals,
Inc. 2002 Stock Option Plan for Non-Employee Directors
(the “2002 Directors’ Plan”). On February 20, 2003, all shares
available for grant under the 1993 Directors’ Plan were trans-
ferred to the 2002 Directors’ Plan and all subsequent grants
have been made under the 2002 Directors’ Plan.
All options granted under the 1993 Directors’ Plan and the
2002 Directors’ Plan have ten-year terms and are exercisable at
an option exercise price equal to the market price of the com-
mon stock on the date of grant. Options granted under the
2002 Directors’ Plan when a director is first elected to the
Board of Directors generally become exercisable ratably on
06 AR Financial pgs 38-60.qxd 9/11/06 11:20 AM Page 48
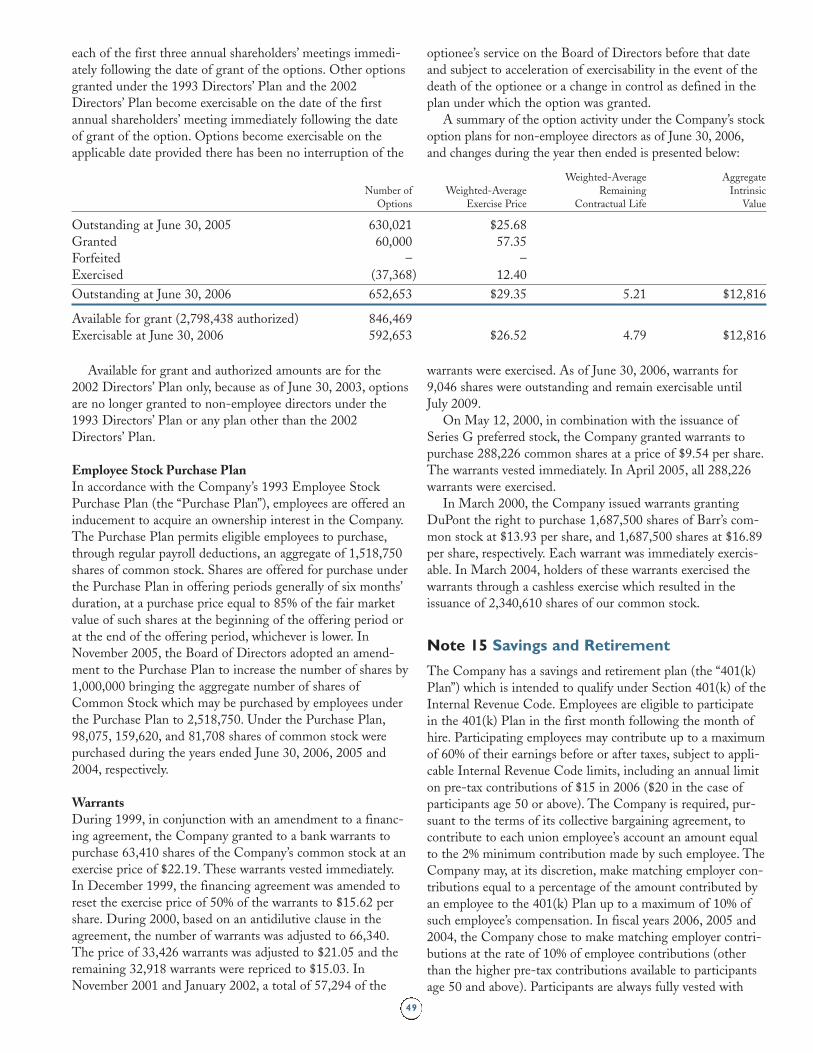
49
each of the first three annual shareholders’ meetings immedi-
ately following the date of grant of the options. Other options
granted under the 1993 Directors’ Plan and the 2002
Directors’ Plan become exercisable on the date of the first
annual shareholders’ meeting immediately following the date
of grant of the option. Options become exercisable on the
applicable date provided there has been no interruption of the
optionee’s service on the Board of Directors before that date
and subject to acceleration of exercisability in the event of the
death of the optionee or a change in control as defined in the
plan under which the option was granted.
A summary of the option activity under the Company’s stock
option plans for non-employee directors as of June 30, 2006,
and changes during the year then ended is presented below:
Weighted-Average Aggregate
Number of Weighted-Average Remaining Intrinsic
Options Exercise Price Contractual Life Value
Outstanding at June 30, 2005 630,021 $25.68
Granted 60,000 57.35
Forfeited – –
Exercised (37,368) 12.40
Outstanding at June 30, 2006 652,653 $29.35 5.21 $12,816
Available for grant (2,798,438 authorized) 846,469
Exercisable at June 30, 2006 592,653 $26.52 4.79 $12,816
Available for grant and authorized amounts are for the
2002 Directors’ Plan only, because as of June 30, 2003, options
are no longer granted to non-employee directors under the
1993 Directors’ Plan or any plan other than the 2002
Directors’ Plan.
Employee Stock Purchase Plan In accordance with the Company’s 1993 Employee Stock
Purchase Plan (the “Purchase Plan”), employees are offered an
inducement to acquire an ownership interest in the Company.
The Purchase Plan permits eligible employees to purchase,
through regular payroll deductions, an aggregate of 1,518,750
shares of common stock. Shares are offered for purchase under
the Purchase Plan in offering periods generally of six months’
duration, at a purchase price equal to 85% of the fair market
value of such shares at the beginning of the offering period or
at the end of the offering period, whichever is lower. In
November 2005, the Board of Directors adopted an amend-
ment to the Purchase Plan to increase the number of shares by
1,000,000 bringing the aggregate number of shares of
Common Stock which may be purchased by employees under
the Purchase Plan to 2,518,750. Under the Purchase Plan,
98,075, 159,620, and 81,708 shares of common stock were
purchased during the years ended June 30, 2006, 2005 and
2004, respectively.
Warrants During 1999, in conjunction with an amendment to a financ-
ing agreement, the Company granted to a bank warrants to
purchase 63,410 shares of the Company’s common stock at an
exercise price of $22.19. These warrants vested immediately.
In December 1999, the financing agreement was amended to
reset the exercise price of 50% of the warrants to $15.62 per
share. During 2000, based on an antidilutive clause in the
agreement, the number of warrants was adjusted to 66,340.
The price of 33,426 warrants was adjusted to $21.05 and the
remaining 32,918 warrants were repriced to $15.03. In
November 2001 and January 2002, a total of 57,294 of the
warrants were exercised. As of June 30, 2006, warrants for
9,046 shares were outstanding and remain exercisable until
July 2009.
On May 12, 2000, in combination with the issuance of
Series G preferred stock, the Company granted warrants to
purchase 288,226 common shares at a price of $9.54 per share.
The warrants vested immediately. In April 2005, all 288,226
warrants were exercised.
In March 2000, the Company issued warrants granting
DuPont the right to purchase 1,687,500 shares of Barr’s com-
mon stock at $13.93 per share, and 1,687,500 shares at $16.89
per share, respectively. Each warrant was immediately exercis-
able. In March 2004, holders of these warrants exercised the
warrants through a cashless exercise which resulted in the
issuance of 2,340,610 shares of our common stock.
Note 15 Savings and Retirement
The Company has a savings and retirement plan (the “401(k)
Plan”) which is intended to qualify under Section 401(k) of the
Internal Revenue Code. Employees are eligible to participate
in the 401(k) Plan in the first month following the month of
hire. Participating employees may contribute up to a maximum
of 60% of their earnings before or after taxes, subject to appli-
cable Internal Revenue Code limits, including an annual limit
on pre-tax contributions of $15 in 2006 ($20 in the case of
participants age 50 or above). The Company is required, pur-
suant to the terms of its collective bargaining agreement, to
contribute to each union employee’s account an amount equal
to the 2% minimum contribution made by such employee. The
Company may, at its discretion, make matching employer con-
tributions equal to a percentage of the amount contributed by
an employee to the 401(k) Plan up to a maximum of 10% of
such employee’s compensation. In fiscal years 2006, 2005 and
2004, the Company chose to make matching employer contri-
butions at the rate of 10% of employee contributions (other
than the higher pre-tax contributions available to participants
age 50 and above). Participants are always fully vested with
06 AR Financial pgs 38-60.qxd 9/11/06 11:20 AM Page 49
50
Note 16 Other Income (Expense), Net
A summary of other income (expense), net is as follows:
Year Ended June 30,
2006 2005 2004
Proceeds from insurance settlement $ – $4,600 $ –
Gain (loss) in venture funds 5,223 (796) (1,346)
Gain on foreign currency option 10,300 – –
Other income (expense) 1,645 59 (187)
Total other income (expense), net $17,168 $3,863 $(1,533)
Note 17 Commitments and Contingencies
LeasesThe Company is party to various leases, which relate to the
rental of office facilities and equipment. The Company
believes it will be able to extend such leases, if necessary. The
table below shows the future minimum rental payments, exclu-
sive of taxes, insurance and other costs under non-cancellable
long-term lease commitments as of June 30, 2006:
Year Ending June 30,
2007 2008 2009 2010 2011 Thereafter
Operating leases $4,188 $3,561 $3,464 $3,356 $3,340 $12,825
Capital leases 856 204 95 32 – –
Minimum lease
payments $5,044 $3,765 $3,559 $3,388 $3,340 $12,825
Investment in Venture FundsDuring the second quarter of fiscal 2004, the Company made
investments, as a limited partner, in two separate venture capi-
tal funds as part of its continuing efforts to identify new prod-
ucts, new technologies and new licensing opportunities. The
Company has committed up to a total of $15,000 for each of
these funds over five- and 10-year periods, as defined by each
fund. As of June 30, 2006 and June 30, 2005, the Company
had invested $6,550 and $5,941, respectively, in these funds.
The Company accounts for these investments using the equity
method of accounting.
Employment Agreements The Company has entered into employment agreements with
certain key employees. The current terms of these agreements
expire at various dates, subject to certain renewal provisions.
Product Liability Insurance The Company’s insurance coverage at any given time reflects
market conditions, including cost and availability, existing at
the time it is written, and the decision to obtain insurance cov-
erage or to self-insure varies accordingly. If the Company were
to incur substantial liabilities that are not covered by insurance
or that substantially exceed coverage levels or accruals for
probable losses, there could be a material adverse effect on its
financial statements in a particular period.
The Company maintains third-party insurance that pro-
vides coverage, subject to specified co-insurance requirements,
respect to their own contributions and any investment return
thereon. Participants become fully vested in the Company’s
contributions and related earnings after five full years of
employment.
The Company’s contributions to the 401(k) Plans were
$9,089, $7,650 and $6,534 for the years ended June 30, 2006,
2005 and 2004, respectively.
The Company has a non-qualified plan (“Excess Plan”) that
enables certain executives whose contributions to the 401(k)
Plan are limited by the Internal Revenue Code to defer
amounts under the Excess Plan that they are unable to con-
tribute to the 401(k) Plan as a result of the Internal Revenue
Code limits. The Company credits the executives with the
matching employer contributions they would have received
under the 401(k) Plan if the Internal Revenue Code limits did
not prevent them from contributing the amounts deferred
under the Excess Plan to the 401(k) Plan. As of June 30, 2006
and 2005, the Company had an asset and matching liability for
the Excess Plan of $7,273 and $5,141, respectively.
The Company has an unfunded pension plan covering two
non-employee directors of Duramed who were elected prior to
1998 and who had served on Duramed’s Board for at least five
years. At the time of the merger with Barr, two Duramed
directors were eligible to receive benefits. The plan provides an
annual benefit, payable monthly over each director’s life, from
the time a participating director ceased to be a member of the
Board, equal to 85% and 60%, respectively, of the director’s
most recent annual Board fee, as adjusted annually to reflect
changes in the Consumer Price Index. As of June 30, 2006 and
2005, the Company has recorded $425 and $447, respectively,
as a long-term liability representing the present value of the
estimated future benefit obligation to the eligible directors.
The right of a director to receive benefits under the plan is
forfeited if the director engages in any activity determined by
the Board to be contrary to the best interests of the Company.
In October 2003, the Board of Directors approved the Barr
Pharmaceuticals, Inc. Non-Qualified Deferred Compensation
Plan (the “Plan”). The Plan provides certain executives whose
contributions to the 401(k) Plan are limited by the Internal
Revenue Code with the opportunity to defer, in whole or in
part, the portion of their salary or bonus for a particular calen-
dar year that they are unable to defer through the 401(k) Plan
or the Excess Plan. (The 401(k) Plan and the Excess Plan col-
lectively limit an employee’s deferrals to 60% of salary and
bonus.) Because deferring salary or bonus under the Plan
reduces the matching employer contributions which are credit-
ed to the executives under the Excess Plan, the Company
credits the executives under the Plan with the matching
employer contributions they would receive under the Excess
Plan if they did not defer salary or bonus under the Plan. As
of June 30, 2006 and 2005, the Company had an asset and
matching liability for the Plan of $512 and $308, respectively.
06 AR Financial pgs 38-60.qxd 9/11/06 11:20 AM Page 50
51
for the cost of product liability claims arising during the cur-
rent policy period, which began on October 1, 2004 and ends
on September 30, 2005, between an aggregate amount of
$25,000 and $75,000. The Company is self-insured for up to
the first $25,000 of costs incurred relating to product liability
claims arising during the current policy period. In addition,
the Company has obtained extended reporting periods under
previous policies for claims arising prior to the current policy
period. The current period and extended reporting period poli-
cies exclude certain products; the Company would be responsi-
ble for all product liability costs arising from these excluded
products.
The Company has been incurring significant legal costs
associated with its hormone therapy litigation (see below). To
date, these costs have been covered under extended reporting
period policies that provide up to $25,000 of coverage. As of
June 30, 2006, there was approximately $8,000 of coverage
remaining under these policies. The Company has recorded a
receivable of $5,590 for legal costs incurred and expected to be
recovered under these policies as of June 30, 2006. Once the
coverage from these extended reporting period policies has
been exhausted, future legal and settlement costs will be cov-
ered first by a combination of the Company’s cash balances
and then by a combination of self-insurance and other third-
party insurance layers.
Indemnity Provisions From time-to-time, in the normal course of business, the
Company agrees to indemnify its suppliers, customers and
employees concerning product liability and other matters. For
certain product liability matters, the Company has incurred
legal defense costs on behalf of certain of its customers under
these agreements. No amounts have been recorded in the
financial statements for probable losses with respect to the
Company’s obligations under such agreements.
In September 2001, Barr filed an ANDA for the generic
version of Sanofi-Aventis’ Allegra tablets. Sanofi-Aventis has
filed a lawsuit against Barr claiming patent infringement. A
trial date for the patent litigation has not been scheduled. In
June 2005, the Company entered into an agreement with Teva
Pharmaceuticals USA, Inc. which allowed Teva to manufacture
and launch Teva’s generic version of Allegra during the
Company’s 180 day exclusivity period, in exchange for Teva’s
obligation to pay the Company a specified percentage of Teva’s
operating profit, as defined, earned on sales of the product.
The agreement between Barr and Teva also provides that each
company will indemnify the other for a portion of any patent
infringement damages they might incur, so that the parties will
share any such damage liability in proportion to their respec-
tive share of Teva’s operating profit or generic Allegra.
On September 1, 2005, Teva launched its generic version of
Allegra. The Company, in accordance with FASB Interpretation
No. 45, “Guarantor’s Accounting and Disclosure Requirements
for Guarantees, Including Indirect Guarantees of Indebtedness
to Others,” recorded a liability of $4,057 to reflect the fair
value of the indemnification obligation it has undertaken.
Litigation Settlement On October 22, 1999, the Company entered into a settlement
agreement with Schein Pharmaceutical, Inc. (now part of
Watson Pharmaceuticals, Inc.) relating to a 1992 agreement
regarding the pursuit of a generic conjugated estrogens product.
Under the terms of the settlement, Schein relinquished any claim
to rights in Cenestin in exchange for a payment of $15,000 made
to Schein in 1999. An additional $15,000 payment is required
under the terms of the settlement if Cenestin achieves total
profits, as defined, of greater than $100,000 over any rolling five-
year period prior to October 22, 2014. As of June 30, 2006, no
liability has been accrued related to this settlement.
Litigation Matters The Company is involved in various legal proceedings inciden-
tal to its business, including product liability, intellectual
property and other commercial litigation and antitrust actions.
The Company records accruals for such contingencies to the
extent that it concludes a loss is probable and the amount can
be reasonably estimated. Additionally, the Company records
insurance receivable amounts from third party insurers when
appropriate.
Many claims involve highly complex issues relating to
patent rights, causation, label warnings, scientific evidence and
other matters. Often these issues are subject to substantial
uncertainties and therefore, the probability of loss and an esti-
mate of the amount of the loss are difficult to determine. The
Company’s assessments are based on estimates that the
Company, in consultation with outside advisors, believes are
reasonable. Although the Company believes it has substantial
defenses in these matters, litigation is inherently unpredictable.
Consequently, the Company could in the future incur judg-
ments or enter into settlements that could have a material
adverse effect on its consolidated financial statements in a
particular period.
Summarized below are the more significant matters pend-
ing to which the Company is a party. As of June 30, 2006, the
Company’s reserve for the liability associated with claims or
related defense costs for these matters is not material.
Patent Matters
Desmopressin Acetate Suit
In July 2002, the Company filed an ANDA seeking approval
from the U.S. FDA to market Desmopressin acetate tablets,
the generic equivalent of Sanofi-Aventis’ DDAVP® product.
The Company notified Ferring AB, the patent holder,
and Sanofi-Aventis pursuant to the provisions of the Hatch-
Waxman Act in October 2002. Ferring AB and Sanofi-
Aventis filed a suit in the U.S. District Court for the Southern
District of New York in December 2002 for infringement of
one of the four patents listed in the Orange Book for
Desmopressin acetate tablets, seeking to prevent the Company
from marketing Desmopressin acetate tablets until the patent
expires in 2008. In January 2003, the Company filed an answer
and counterclaim asserting non-infringement and invalidity of
all four listed patents. In January 2004, Ferring AB amended
their complaint to add a claim of willful infringement.
06 AR Financial pgs 38-60.qxd 9/11/06 11:20 AM Page 51
52
On February 7, 2005, the court granted summary judgment
in the Company’s favor, which Ferring AB and Sanofi-Aventis
have appealed. On July 5, 2005, the Company launched its
generic product. On February 15, 2006, the Court of Appeals
for the Federal Circuit denied their appeal. Ferring AB and
Sanofi-Aventis subsequently filed a petition for rehearing and
rehearing en banc, which was denied on April 10, 2006. On
June 15, 2006, the United States Supreme Court granted
Ferring AB leave to file a petition for a writ of certiorari on or
before September 9, 2006.
Fexofenadine Hydrochloride Suit
In June 2001, the Company filed an ANDA seeking approval
from the FDA to market fexofenadine hydrochloride tablets in
30 mg, 60 mg and 180 mg strengths, the generic equivalent of
Sanofi-Aventis’ Allegra tablet products for allergy relief. The
Company notified Sanofi-Aventis pursuant to the provisions
of the Hatch-Waxman Act and, in September 2001, Sanofi-
Aventis filed a patent infringement action in the U.S. District
Court for the District of New Jersey-Newark Division, seeking
to prevent the Company from marketing this product until
after the expiration of various U.S. patents, the last of which is
alleged to expire in 2017.
After the filing of the Company’s ANDAs, Sanofi-Aventis
listed an additional patent on Allegra in the Orange Book.
The Company filed appropriate amendments to its ANDAs to
address the newly listed patent and, in November 2002, noti-
fied Merrell Pharmaceuticals, Inc., the patent holder, and
Sanofi-Aventis pursuant to the provisions of the Hatch-
Waxman Act. Sanofi-Aventis filed an amended complaint in
November 2002 claiming that the Company’s ANDAs
infringe the newly listed patent.
On March 5, 2004, Sanofi-Aventis and AMR Technology,
Inc., the holder of certain patents licensed to Sanofi-Aventis,
filed an additional patent infringement action in the U.S.
District Court for the District of New Jersey – Newark
Division, based on two patents that are not listed in the
Orange Book.
In June 2004, the court granted the Company summary
judgment of non-infringement as to two patents. On March
31, 2005, the court granted the Company summary judgment
of invalidity as to a third patent. Discovery is proceeding on
the five remaining patents at issue in the case. No trial date
has been scheduled.
On August 31, 2005, the Company received final FDA
approval for its fexofenadine tablet products. As referenced
above, pursuant to the agreement between the Company and
Teva, the Company selectively waived its 180 days of generic
exclusivity in favor of Teva, and Teva launched its generic
product on September 1, 2005.
On September 21, 2005, Sanofi-Aventis filed a motion for
a preliminary injunction or expedited trial. The motion asked
the court to enjoin the Company and Teva from marketing
their generic versions of Allegra tablets, 30 mg, 60 mg and 180
mg, or to expedite the trial in the case. The motion also asked
the court to enjoin Ranbaxy Laboratories, Ltd. and Amino
Chemicals, Ltd. from the commercial production of generic
fexofenadine raw material. The preliminary injunction hearing
concluded on November 3, 2005. On January 30, 2006, the
Court denied the motion by Sanofi-Aventis for a preliminary
injunction or expedited trial. Sanofi-Aventis has appealed the
Court’s denial of its motion to the United States Court of
Appeals for the Federal Circuit. Briefing in the appeal has
been completed, but no date for argument has been set.
On May 8, 2006, Sanofi-Aventis and AMR Technology,
Inc. served a Second Amended and Supplemental Complaint
based on U.S. Patent Nos. 5,581,011 and 5,750,703 (collec-
tively, “the API patents”), asserting claims against the
Company for infringement of the API (active pharmaceutical
ingredient) patents based on the sale of the Company’s fexofe-
nadine product and for inducement of infringement of the
API patents based on the sale of Teva’s fexofenadine product.
On June 22, 2006, the Company answered the complaint,
denied the allegations against it, and asserted counterclaims for
declaratory judgment that the asserted patents are invalid
and/or not infringed and for damages for violations of the
Sherman Act, 15 U.S.C. §§ 1.2.
Sanofi-Aventis also has brought a patent infringement suit
against Teva in Israel, seeking to have Teva enjoined from
manufacturing generic versions of Allegra tablets and seeking
damages.
Product Liability Matters
Hormone Therapy Litigation
The Company has been named as a defendant in approximate-
ly 4,950 personal injury product liability cases brought against
the Company and other manufacturers by plaintiffs claiming
that they suffered injuries resulting from the use of certain
estrogen and progestin medications prescribed to treat the
symptoms of menopause. The cases against the Company
involve the Company’s Cenestin products and/or the use of
the Company’s medroxyprogesterone acetate product, which
typically has been prescribed for use in conjunction with
Premarin® or other hormone therapy products. All of these
products remain approved by the FDA and continue to be
marketed and sold to customers. While the Company has been
named as a defendant in these cases, fewer than a third of the
complaints actually allege the plaintiffs took a product manu-
factured by the Company, and the Company’s experience to
date suggests that, even in these cases, a high percentage of
the plaintiffs will be unable to demonstrate actual use of a
Company product. For that reason, approximately 3,100 of
such cases have been dismissed (leaving approximately 1,850
pending) and, based on discussions with the Company’s
outside counsel, several hundred more are expected to be
dismissed in the near future.
The Company believes it has viable defenses to the allega-
tions in the complaints and is defending the actions vigorously.
Antitrust Matters
Ciprofloxacin (Cipro) Antitrust Class Actions
The Company has been named as a co-defendant with Bayer
Corporation, The Rugby Group, Inc. and others in approxi-
06 AR Financial pgs 38-60.qxd 9/11/06 11:20 AM Page 52
53
mately 38 class action complaints filed in state and federal
courts by direct and indirect purchasers of Ciprofloxacin
(Cipro) from 1997 to the present. The complaints allege that
the 1997 Bayer-Barr patent litigation settlement agreement
was anti-competitive and violated federal antitrust laws and/or
state antitrust and consumer protection laws. A prior investi-
gation of this agreement by the Texas Attorney General’s
Office on behalf of a group of state Attorneys General was
closed without further action in December 2001.
The lawsuits include nine consolidated in California state
court, one in Kansas state court, one in Wisconsin state court,
one in Florida state court, and two consolidated in New York
state court, with the remainder of the actions pending in the
U.S. District Court for the Eastern District of New York for
coordinated or consolidated pre-trial proceedings (the “MDL
Case”). On March 31, 2005, the Court in the MDL Case
granted summary judgment in the Company’s favor and dis-
missed all of the federal actions before it. On June 7, 2005,
plaintiffs filed notices of appeal to the U.S. Court of Appeals
for the Second Circuit. The Court of Appeals has stayed con-
sideration of the merits pending consideration of the
Company’s motion to transfer the appeal to the United States
Court of Appeals for the Federal Circuit as well as plaintiffs’
request for the appeal to be considered en banc. Merits brief-
ing has not yet been completed because the proceedings are
stayed pending en banc consideration of a similar case.
On September 19, 2003, the Circuit Court for the County
of Milwaukee dismissed the Wisconsin state class action for
failure to state a claim for relief under Wisconsin law. On May
9, 2006, the Court of Appeals reinstated the complaint on
state law grounds for further proceedings in the trial court, but
on July 25, 2006, the Wisconsin Supreme Court granted the
defendants’ petition for further review and thus the case
remains on appeal. On October 17, 2003, the Supreme Court
of the State of New York for New York County dismissed the
consolidated New York state class action for failure to state a
claim upon which relief could be granted and denied the
plaintiffs’ motion for class certification. An intermediate appel-
late court affirmed that decision, and plaintiffs have sought
leave to appeal to the New York Court of Appeals. On April
13, 2005, the Superior Court of San Diego, California,
ordered a stay of the California state class actions until after
the resolution of any appeal in the MDL Case. On April 22,
2005, the District Court of Johnson County, Kansas, similarly
stayed the action before it, until after any appeal in the MDL
Case. The Florida state class action remains at a very early
stage, with no status hearings, dispositive motions, pre-trial
schedules, or a trial date set as of yet.
The Company believes that its agreement with Bayer
Corporation reflects a valid settlement to a patent suit and can-
not form the basis of an antitrust claim. Based on this belief,
the Company is vigorously defending itself in these matters.
Tamoxifen Antitrust Class Actions
To date approximately 33 consumer or third-party payor class
action complaints have been filed in state and federal courts
against Zeneca, Inc., AstraZeneca Pharmaceuticals L.P. and
the Company alleging, among other things, that the 1993 set-
tlement of patent litigation between Zeneca and the Company
violated the antitrust laws, insulated Zeneca and the Company
from generic competition and enabled Zeneca and the
Company to charge artificially inflated prices for tamoxifen
citrate. A prior investigation of this agreement by the U.S.
Department of Justice was closed without further action. On
May 19, 2003, the U.S. District Court dismissed the com-
plaints for failure to state a viable antitrust claim. On
November 2, 2005, the United States Court of Appeals for the
Second Circuit affirmed the District Court’s order dismissing
the cases for failure to state a viable antitrust claim. On
November 30, 2005, Plaintiffs petitioned the United States
Court of Appeals for the Second Circuit for a rehearing en
banc. The Court of Appeals directed the Company to file a
response to Plaintiffs’ petition, which the Company submitted
on January 26, 2006. The Court has not yet ruled on the mer-
its of the petition.
The Company believes that its agreement with Zeneca
reflects a valid settlement to a patent suit and cannot form the
basis of an antitrust claim. Based on this belief, the Company
is vigorously defending itself in these matters.
Ovcon® Antitrust Proceedings
To date, the Company has been named as a co-defendant with
Warner Chilcott Holdings, Co. III, Ltd., and others in com-
plaints filed in federal courts by the Federal Trade Commission,
34 state Attorneys General and nine private class action
plaintiffs claiming to be direct and indirect purchasers of
Ovcon-35®. These actions allege, among other things, that a
March 24, 2004 agreement between the Company and Warner
Chilcott (then known as Galen Holdings PLC) constitutes an
unfair method of competition, is anticompetitive and restrains
trade in the market for Ovcon-35 and its generic equivalents.
These cases, the first of which was filed by the FTC on or
about December 2, 2005, remain at a very early stage, with
discovery cut-off dates of December 22, 2006 for the FTC
and state cases and March 2, 2007 for the private cases. No
trial dates have been set.
The Company believes that it has not engaged in any
improper conduct and is vigorously defending itself in these
matters.
Provigil® Antitrust Proceedings
To date, the Company has been named as a co-defendant with
Cephalon, Inc., Mylan Laboratories, Inc., Teva Pharmaceutical
Industries, Ltd., Teva Pharmaceuticals USA, Inc., Ranbaxy
Laboratories, Ltd., and Ranbaxy Pharmaceuticals, Inc. (the
“Provigil Defendants”) in nine separate complaints filed in the
U. S. District Court for the Eastern District of Pennsylvania.
These actions allege, among other things, that the agreements
between Cephalon and the other individual Provigil
Defendants to settle patent litigation relating to Provigil con-
stitute an unfair method of competition, are anticompetitive
and restrain trade in the market for Provigil and its generic
equivalents in violation of the antitrust laws. These cases
remain at a very early stage and no trial dates have been set.
06 AR Financial pgs 38-60.qxd 9/11/06 11:20 AM Page 53
54
The Company was also named as a co-defendant with the
Provigil Defendants in an action filed in the U. S. District
Court for the Eastern District of Pennsylvania by Apotex, Inc.
The lawsuit alleges, among other things, that Apotex sought
to market its own generic version of Provigil and that the
settlement agreements entered into between Cephalon and the
other individual Provigil Defendants constituted an unfair
method of competition, are anticompetitive and restrain trade
in the market for Provigil and its generic equivalents in viola-
tion of the antitrust laws.
The Company believes that it has not engaged in any
improper conduct and is vigorously defending itself in these
matters.
Medicaid Reimbursement CasesThe Company, along with numerous other pharmaceutical
companies, have been named as a defendant in separate actions
brought by the states of Alabama, Hawaii, Illinois, Kentucky
and Mississippi, the Commonwealth of Massachusetts, the
City of New York, and numerous counties in New York. In
each of these matters, the plaintiffs seek to recover damages
and other relief for alleged overcharges for prescription med-
ications paid for or reimbursed by their respective Medicaid
programs.
The Commonwealth of Massachusetts case and the New
York cases, with the exception of the action filed by Erie,
Oswego, and Schenectady Counties in New York, are currently
pending in the U.S. District Court for the District of
Massachusetts. Discovery is underway in the Massachusetts
cases, but no trial dates have been set. In the consolidated New
York cases, motions to dismiss are under advisement, with no
trial dates set. The Erie, Oswego, and Schenectady County
cases are pending in state courts in New York, again with no
trial dates set.
The Alabama case was filed in Alabama state court,
removed to the U.S. District Court for the Middle District of
Alabama, and returned to state court. Discovery is underway,
but no trial date has been set. The State of Hawaii case was
filed in state court in Hawaii on April 26, 2006. This matter is
at a very early stage with no trial date set as of yet. The Illinois
and Kentucky cases were filed in Illinois and Kentucky state
courts, removed to federal court, and then remanded back to
their respective state courts. No trial dates have been set. The
State of Mississippi case was filed in state court. Discovery is
underway, but no trial date has been set.
The Company believes that it has not engaged in any
improper conduct and is vigorously defending itself in these
matters.
Breach of Contract ActionOn October 6, 2005, plaintiffs Agvar Chemicals Inc., Ranbaxy
Laboratories, Inc. and Ranbaxy Pharmaceuticals, Inc. filed suit
against the Company and Teva Pharmaceuticals USA, Inc. in
the Superior Court of New Jersey. In their complaint, plaintiffs
seek to recover damages and other relief, based on an alleged
breach of an alleged contract requiring the Company to pur-
chase raw material for the Company’s generic Allegra product
from Ranbaxy, prohibiting the Company from launching its
generic Allegra product without Ranbaxy’s consent and pro-
hibiting the Company from entering into an agreement
authorizing Teva to launch Teva’s generic Allegra product. The
court has entered a scheduling order providing for the comple-
tion of discovery by March 7, 2007 but has not yet set a date
for trial. The Company believes there was no such contract
and is vigorously defending this matter.
Other LitigationAs of June 30, 2006, the Company was involved with other
lawsuits incidental to its business, including patent infringe-
ment actions, product liability, and personal injury claims.
Management, based on the advice of legal counsel, believes
that the ultimate outcome of these other matters will not have
a material adverse effect on the Company’s consolidated finan-
cial statements.
Government InquiriesOn July 11, 2006, the Company received a request from the
FTC for the voluntary submission of information regarding
the settlement agreement reached in the matter of Cephalon,
Inc. v. Mylan Pharmaceuticals, Inc., et al., U.S. District Court
for the District of New Jersey. The FTC is investigating
whether the Company and the other parties to the litigation
have engaged in unfair methods of competition in violation of
Section 5 of the Federal Trade Commission Act by restricting
the sale of Modafinil products. In its request letter, the FTC
stated that neither the request nor the existence of an investi-
gation indicated that Barr or any other company had violated
the law. The Company believes that its settlement agreement
is in compliance with all applicable laws and intends to coop-
erate with the FTC in this matter.
Note 18 Segment Reporting
The Company operates in two reportable business segments:
generic pharmaceuticals and proprietary pharmaceuticals.
Generic PharmaceuticalsGeneric pharmaceutical products are therapeutically equivalent
to a brand name product and are marketed primarily to whole-
salers, retail pharmacy chains, mail order pharmacies and
group purchasing organizations. These products are approved
for distribution by the FDA through the ANDA process. The
Company also distributes, from time to time, product manu-
factured for Barr by the brand name company. Ciprofloxacin is
an example of a distributed product that is included in the
generic pharmaceuticals segment.
In fiscal year 2006, three customers accounted for 27%, 15%
and 11% of generic sales. In fiscal year 2005, three customers
accounted for 23%, 17% and 11% of generic sales. In fiscal
year 2004, three customers accounted for 24%, 14% and 13%
of generic product sales.
06 AR Financial pgs 38-60.qxd 9/11/06 11:20 AM Page 54
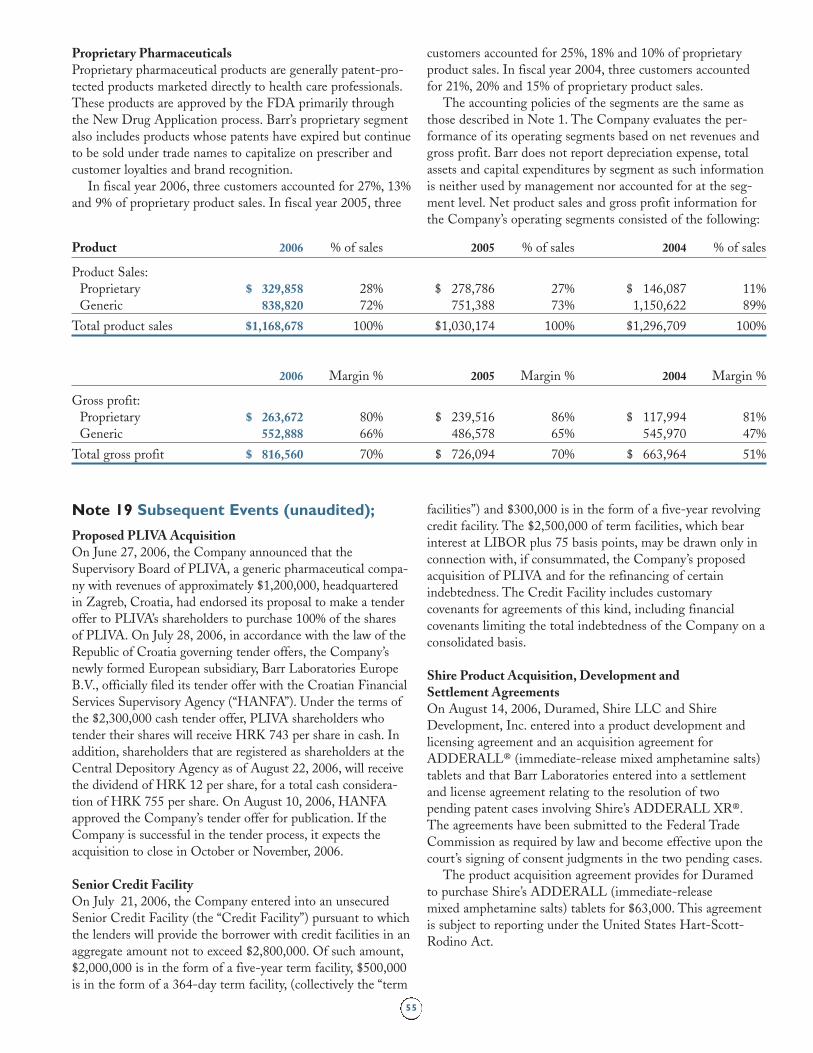
55
Product 2006 % of sales 2005 % of sales 2004 % of sales
Product Sales:
Proprietary $ 329,858 28% $ 278,786 27% $ 146,087 11%
Generic 838,820 72% 751,388 73% 1,150,622 89%
Total product sales $1,168,678 100% $1,030,174 100% $1,296,709 100%
2006 Margin % 2005 Margin % 2004 Margin %
Gross profit:
Proprietary $ 263,672 80% $ 239,516 86% $ 117,994 81%
Generic 552,888 66% 486,578 65% 545,970 47%
Total gross profit $ 816,560 70% $ 726,094 70% $ 663,964 51%
Proprietary PharmaceuticalsProprietary pharmaceutical products are generally patent-pro-
tected products marketed directly to health care professionals.
These products are approved by the FDA primarily through
the New Drug Application process. Barr’s proprietary segment
also includes products whose patents have expired but continue
to be sold under trade names to capitalize on prescriber and
customer loyalties and brand recognition.
In fiscal year 2006, three customers accounted for 27%, 13%
and 9% of proprietary product sales. In fiscal year 2005, three
facilities”) and $300,000 is in the form of a five-year revolving
credit facility. The $2,500,000 of term facilities, which bear
interest at LIBOR plus 75 basis points, may be drawn only in
connection with, if consummated, the Company’s proposed
acquisition of PLIVA and for the refinancing of certain
indebtedness. The Credit Facility includes customary
covenants for agreements of this kind, including financial
covenants limiting the total indebtedness of the Company on a
consolidated basis.
Shire Product Acquisition, Development and Settlement AgreementsOn August 14, 2006, Duramed, Shire LLC and Shire
Development, Inc. entered into a product development and
licensing agreement and an acquisition agreement for
ADDERALL® (immediate-release mixed amphetamine salts)
tablets and that Barr Laboratories entered into a settlement
and license agreement relating to the resolution of two
pending patent cases involving Shire’s ADDERALL XR®.
The agreements have been submitted to the Federal Trade
Commission as required by law and become effective upon the
court’s signing of consent judgments in the two pending cases.
The product acquisition agreement provides for Duramed
to purchase Shire’s ADDERALL (immediate-release
mixed amphetamine salts) tablets for $63,000. This agreement
is subject to reporting under the United States Hart-Scott-
Rodino Act.
customers accounted for 25%, 18% and 10% of proprietary
product sales. In fiscal year 2004, three customers accounted
for 21%, 20% and 15% of proprietary product sales.
The accounting policies of the segments are the same as
those described in Note 1. The Company evaluates the per-
formance of its operating segments based on net revenues and
gross profit. Barr does not report depreciation expense, total
assets and capital expenditures by segment as such information
is neither used by management nor accounted for at the seg-
ment level. Net product sales and gross profit information for
the Company’s operating segments consisted of the following:
Note 19 Subsequent Events (unaudited);
Proposed PLIVA AcquisitionOn June 27, 2006, the Company announced that the
Supervisory Board of PLIVA, a generic pharmaceutical compa-
ny with revenues of approximately $1,200,000, headquartered
in Zagreb, Croatia, had endorsed its proposal to make a tender
offer to PLIVA’s shareholders to purchase 100% of the shares
of PLIVA. On July 28, 2006, in accordance with the law of the
Republic of Croatia governing tender offers, the Company’s
newly formed European subsidiary, Barr Laboratories Europe
B.V., officially filed its tender offer with the Croatian Financial
Services Supervisory Agency (“HANFA”). Under the terms of
the $2,300,000 cash tender offer, PLIVA shareholders who
tender their shares will receive HRK 743 per share in cash. In
addition, shareholders that are registered as shareholders at the
Central Depository Agency as of August 22, 2006, will receive
the dividend of HRK 12 per share, for a total cash considera-
tion of HRK 755 per share. On August 10, 2006, HANFA
approved the Company’s tender offer for publication. If the
Company is successful in the tender process, it expects the
acquisition to close in October or November, 2006.
Senior Credit FacilityOn July 21, 2006, the Company entered into an unsecured
Senior Credit Facility (the “Credit Facility”) pursuant to which
the lenders will provide the borrower with credit facilities in an
aggregate amount not to exceed $2,800,000. Of such amount,
$2,000,000 is in the form of a five-year term facility, $500,000
is in the form of a 364-day term facility, (collectively the “term
06 AR Financial pgs 38-60.qxd 9/11/06 11:20 AM Page 55
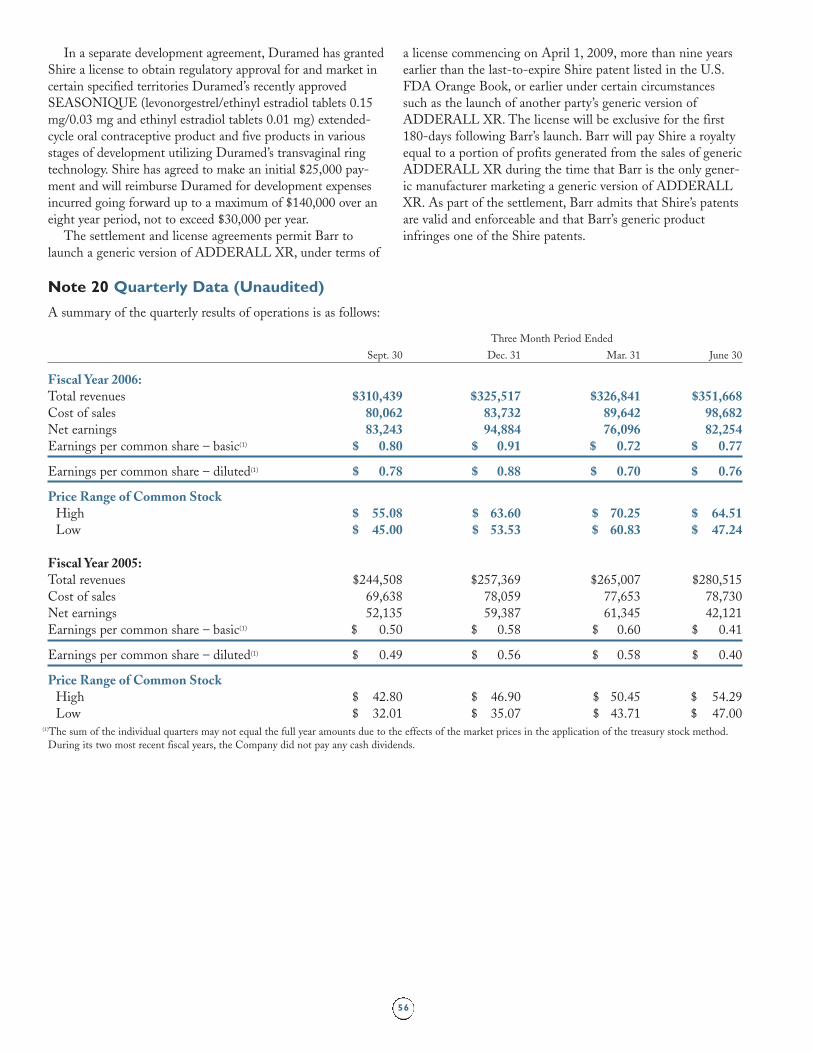
Note 20 Quarterly Data (Unaudited)
A summary of the quarterly results of operations is as follows:
Three Month Period Ended
Sept. 30 Dec. 31 Mar. 31 June 30
Fiscal Year 2006:Total revenues $310,439 $325,517 $326,841 $351,668 Cost of sales 80,062 83,732 89,642 98,682Net earnings 83,243 94,884 76,096 82,254Earnings per common share – basic(1) $ 0.80 $ 0.91 $ 0.72 $ 0.77
Earnings per common share – diluted(1) $ 0.78 $ 0.88 $ 0.70 $ 0.76
Price Range of Common StockHigh $ 55.08 $ 63.60 $ 70.25 $ 64.51 Low $ 45.00 $ 53.53 $ 60.83 $ 47.24
Fiscal Year 2005:Total revenues $244,508 $257,369 $265,007 $280,515
Cost of sales 69,638 78,059 77,653 78,730
Net earnings 52,135 59,387 61,345 42,121
Earnings per common share – basic(1) $ 0.50 $ 0.58 $ 0.60 $ 0.41
Earnings per common share – diluted(1) $ 0.49 $ 0.56 $ 0.58 $ 0.40
Price Range of Common StockHigh $ 42.80 $ 46.90 $ 50.45 $ 54.29
Low $ 32.01 $ 35.07 $ 43.71 $ 47.00 (1)The sum of the individual quarters may not equal the full year amounts due to the effects of the market prices in the application of the treasury stock method.
During its two most recent fiscal years, the Company did not pay any cash dividends.
56
In a separate development agreement, Duramed has granted
Shire a license to obtain regulatory approval for and market in
certain specified territories Duramed’s recently approved
SEASONIQUE (levonorgestrel/ethinyl estradiol tablets 0.15
mg/0.03 mg and ethinyl estradiol tablets 0.01 mg) extended-
cycle oral contraceptive product and five products in various
stages of development utilizing Duramed’s transvaginal ring
technology. Shire has agreed to make an initial $25,000 pay-
ment and will reimburse Duramed for development expenses
incurred going forward up to a maximum of $140,000 over an
eight year period, not to exceed $30,000 per year.
The settlement and license agreements permit Barr to
launch a generic version of ADDERALL XR, under terms of
a license commencing on April 1, 2009, more than nine years
earlier than the last-to-expire Shire patent listed in the U.S.
FDA Orange Book, or earlier under certain circumstances
such as the launch of another party’s generic version of
ADDERALL XR. The license will be exclusive for the first
180-days following Barr’s launch. Barr will pay Shire a royalty
equal to a portion of profits generated from the sales of generic
ADDERALL XR during the time that Barr is the only gener-
ic manufacturer marketing a generic version of ADDERALL
XR. As part of the settlement, Barr admits that Shire’s patents
are valid and enforceable and that Barr’s generic product
infringes one of the Shire patents.
06 AR Financial pgs 38-60.qxd 9/11/06 11:20 AM Page 56
57
Management is responsible for establishing and maintaining
adequate internal control over financial reporting for Barr
Pharmaceuticals, Inc. (the “Company”). We maintain internal
control over financial reporting designed to provide reasonable
assurance regarding the reliability of financial reporting and the
preparation of financial statements for external purposes in
accordance with generally accepted accounting principles in the
United States of America.
Because of its inherent limitations, any system of internal
control over financial reporting, no matter how well designed,
may not prevent or detect misstatements due to the possibility
of collusion or improper override of controls, or that misstate-
ments due to error or fraud may occur that are not detected.
Also, projections of any evaluation of effectiveness to future
periods are subject to the risk that controls may become inade-
quate because of changes in conditions, or that the degree of
compliance with the policies or procedures may deteriorate.
Management conducted an assessment of the effectiveness of
the Company’s internal control over financial reporting as of
June 30, 2006 using criteria established in Internal Control –
Integrated Framework issued by the Committee of Sponsoring
Organizations of the Treadway Commission (COSO). This
assessment included an evaluation of the design of the
Company’s internal control over financial reporting and testing
of the operational effectiveness of its internal control over finan-
cial reporting. Based on this assessment, management has con-
cluded that the Company maintained effective internal control
over financial reporting as of June 30, 2006, based upon the
COSO framework criteria.
Management’s assessment of the effectiveness of the
Company’s internal control over financial reporting as of June
30, 2006 has been audited by Deloitte & Touche LLP, an inde-
pendent registered public accounting firm, as stated in their
report which appears herein.
August 29, 2006
Management’s Report on Internal Control Over Financial Reporting
To the Board of Directors and Shareholders of Barr
Pharmaceuticals, Inc.:
We have audited the accompanying consolidated balance sheets
of Barr Pharmaceuticals, Inc. and subsidiaries (the “Company”)
as of June 30, 2006 and 2005, and the related consolidated
statements of operations, shareholders’ equity, and cash flows
for each of the three years in the period ended June 30, 2006.
These financial statements are the responsibility of the
Company’s management. Our responsibility is to express an
opinion on the financial statements based on our audits.
We conducted our audits in accordance with the standards of
the Public Company Accounting Oversight Board (United
States). Those standards require that we plan and perform the
audit to obtain reasonable assurance about whether the financial
statements are free of material misstatement. An audit includes
examining, on a test basis, evidence supporting the amounts and
disclosures in the financial statements. An audit also includes
assessing the accounting principles used and significant esti-
mates made by management, as well as evaluating the overall
financial statement presentation. We believe that our audits
provide a reasonable basis for our opinion.
In our opinion, such consolidated financial statements pres-
ent fairly, in all material respects, the financial position of Barr
Pharmaceuticals, Inc. and subsidiaries at June 30, 2006 and
2005, and the results of their operations and their cash flows for
each of the three years in the period ended June 30, 2006, in
conformity with accounting principles generally accepted in the
United States of America.
As discussed in Note 14 to the consolidated financial state-
ments, the Company adopted Statement of Financial
Accounting Standard No. 123(R), “Share-Based Payment,” effec-
tive July 1, 2005. As a result, the Company began recording fair
value stock-based compensation expense for its various share-
based compensation programs in the year ended June 30, 2006.
We have also audited, in accordance with the standards of
the Public Company Accounting Oversight Board (United
States), the effectiveness of the Company’s internal control over
financial reporting as of June 30, 2006, based on the criteria
established in Internal Control – Integrated Framework issued by
the Committee of Sponsoring Organizations of the Treadway
Commission and our report dated August 29, 2006 expressed
an unqualified opinion on management’s assessment of the
effectiveness of the Company’s internal control over financial
reporting and an unqualified opinion on the effectiveness of
the Company’s internal control over financial reporting.
Parsippany, New Jersey
August 29, 2006
Report of Independent Registered Public Accounting Firm
06 AR Financial pgs 38-60.qxd 9/11/06 11:20 AM Page 57
58
To the Board of Directors and Shareholders of
Barr Pharmaceuticals, Inc.:
We have audited management’s assessment, included in the
accompanying Management’s Report on Internal Control over
Financial Reporting, that Barr Pharmaceuticals, Inc. and sub-
sidiaries (the “Company”) maintained effective internal control
over financial reporting as of June 30, 2006, based on the criteria
established in Internal Control – Integrated Framework issued by
the Committee of Sponsoring Organizations of the Treadway
Commission. The Company’s management is responsible for
maintaining effective internal control over financial reporting
and for its assessment of the effectiveness of internal control
over financial reporting. Our responsibility is to express an opin-
ion on management’s assessment and an opinion on the effec-
tiveness of the Company’s internal control over financial
reporting based on our audit.
We conducted our audit in accordance with the standards of
the Public Company Accounting Oversight Board (United
States). Those standards require that we plan and perform the
audit to obtain reasonable assurance about whether effective
internal control over financial reporting was maintained in all
material respects. Our audit included obtaining an understand-
ing of internal control over financial reporting, evaluating man-
agement’s assessment, testing and evaluating the design and
operating effectiveness of internal control, and performing such
other procedures as we considered necessary in the circum-
stances. We believe that our audit provides a reasonable basis for
our opinions.
A company’s internal control over financial reporting is a
process designed by, or under the supervision of, the company’s
principal executive and principal financial officers, or persons
performing similar functions, and effected by the company’s
board of directors, management, and other personnel to provide
reasonable assurance regarding the reliability of financial report-
ing and the preparation of financial statements for external
purposes in accordance with generally accepted accounting prin-
ciples. A company’s internal control over financial reporting
includes those policies and procedures that (1) pertain to the
maintenance of records that, in reasonable detail, accurately and
fairly reflect the transactions and dispositions of the assets of
the company; (2) provide reasonable assurance that transactions
are recorded as necessary to permit preparation of financial
statements in accordance with generally accepted accounting
principles, and that receipts and expenditures of the company
are being made only in accordance with authorizations of
management and directors of the company; and (3) provide
reasonable assurance regarding prevention or timely detection
of unauthorized acquisition, use, or disposition of the compa-
ny’s assets that could have a material effect on the financial
statements.
Because of the inherent limitations of internal control over
financial reporting, including the possibility of collusion or
improper management override of controls, material misstate-
ments due to error or fraud may not be prevented or detected on
a timely basis. Also, projections of any evaluation of the effec-
tiveness of the internal control over financial reporting to future
periods are subject to the risk that the controls may become
inadequate because of changes in conditions, or that the degree
of compliance with the policies or procedures may deteriorate.
In our opinion, management’s assessment that the Company
maintained effective internal control over financial reporting as
of June 30, 2006, is fairly stated, in all material respects, based
on the criteria established in Internal Control – Integrated
Framework issued by the Committee of Sponsoring
Organizations of the Treadway Commission. Also in our opin-
ion, the Company maintained, in all material respects, effective
internal control over financial reporting as of June 30, 2006,
based on the criteria established in Internal Control – Integrated
Framework issued by the Committee of Sponsoring
Organizations of the Treadway Commission.
We have also audited, in accordance with the standards of
the Public Company Accounting Oversight Board (United
States), the consolidated financial statements as of and for the
year ended June 30, 2006 of the Company. Our report dated
August 29, 2006 expressed an unqualified opinion on those
financial statements and included an explanatory paragraph
regarding the Company’s adoption of Statement of Financial
Accounting Standard No. 123(R), “Share-Based Payment,”
effective July 1, 2005.
Parsippany, New Jersey
August 29, 2006
Report of Independent Registered Public Accounting Firm
06 AR Financial pgs 38-60.qxd 9/11/06 11:20 AM Page 58
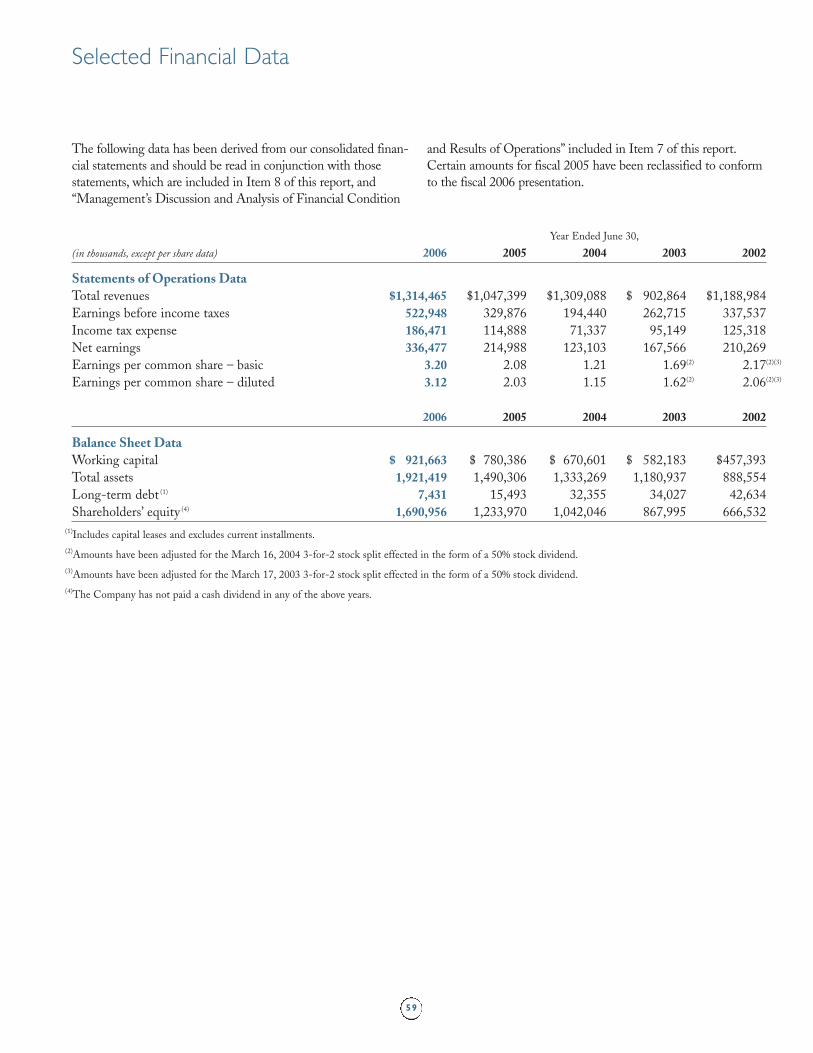
59
Year Ended June 30,
(in thousands, except per share data) 2006 2005 2004 2003 2002
Statements of Operations Data
Total revenues $1,314,465 $1,047,399 $1,309,088 $ 902,864 $1,188,984
Earnings before income taxes 522,948 329,876 194,440 262,715 337,537
Income tax expense 186,471 114,888 71,337 95,149 125,318
Net earnings 336,477 214,988 123,103 167,566 210,269
Earnings per common share – basic 3.20 2.08 1.21 1.69(2) 2.17(2)(3)
Earnings per common share – diluted 3.12 2.03 1.15 1.62(2) 2.06(2)(3)
2006 2005 2004 2003 2002
Balance Sheet Data
Working capital $ 921,663 $ 780,386 $ 670,601 $ 582,183 $457,393
Total assets 1,921,419 1,490,306 1,333,269 1,180,937 888,554
Long-term debt (1) 7,431 15,493 32,355 34,027 42,634
Shareholders’ equity (4) 1,690,956 1,233,970 1,042,046 867,995 666,532
(1)Includes capital leases and excludes current installments.
(2)Amounts have been adjusted for the March 16, 2004 3-for-2 stock split effected in the form of a 50% stock dividend.
(3)Amounts have been adjusted for the March 17, 2003 3-for-2 stock split effected in the form of a 50% stock dividend.
(4)The Company has not paid a cash dividend in any of the above years.
Selected Financial Data
The following data has been derived from our consolidated finan-
cial statements and should be read in conjunction with those
statements, which are included in Item 8 of this report, and
“Management’s Discussion and Analysis of Financial Condition
and Results of Operations” included in Item 7 of this report.
Certain amounts for fiscal 2005 have been reclassified to conform
to the fiscal 2006 presentation.
06 AR Financial pgs 38-60.qxd 9/11/06 11:20 AM Page 59
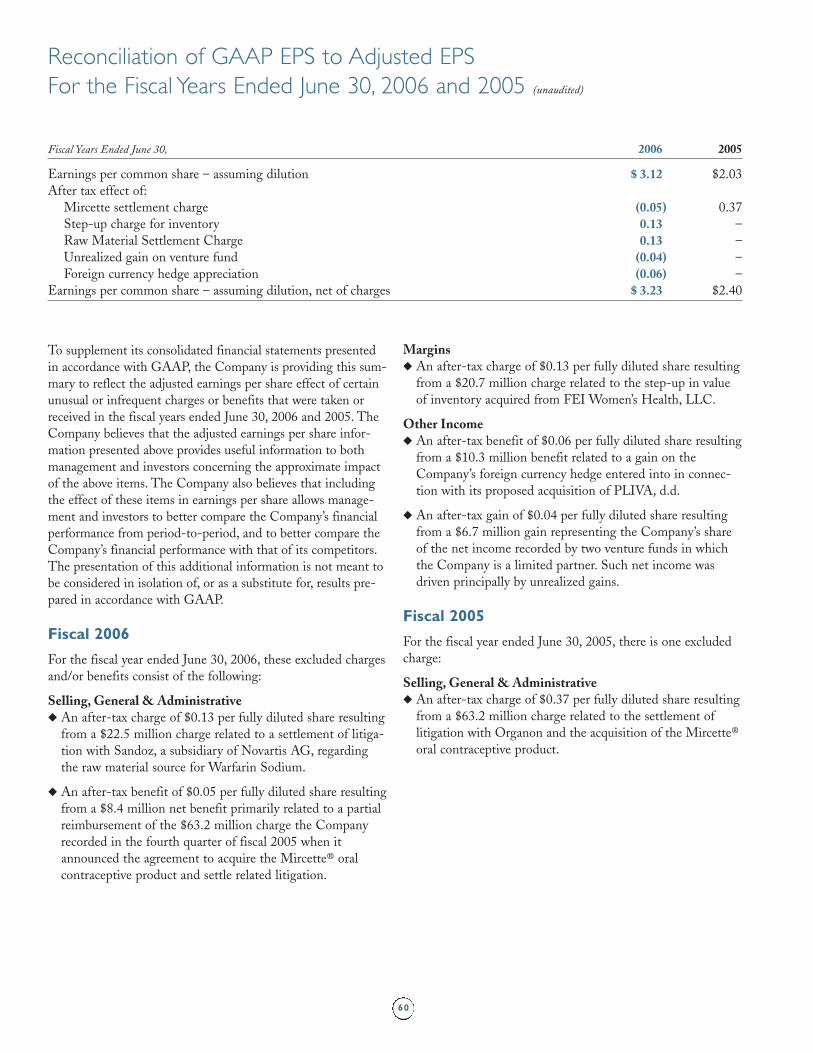
60
To supplement its consolidated financial statements presented
in accordance with GAAP, the Company is providing this sum-
mary to reflect the adjusted earnings per share effect of certain
unusual or infrequent charges or benefits that were taken or
received in the fiscal years ended June 30, 2006 and 2005. The
Company believes that the adjusted earnings per share infor-
mation presented above provides useful information to both
management and investors concerning the approximate impact
of the above items. The Company also believes that including
the effect of these items in earnings per share allows manage-
ment and investors to better compare the Company’s financial
performance from period-to-period, and to better compare the
Company’s financial performance with that of its competitors.
The presentation of this additional information is not meant to
be considered in isolation of, or as a substitute for, results pre-
pared in accordance with GAAP.
Fiscal 2006
For the fiscal year ended June 30, 2006, these excluded charges
and/or benefits consist of the following:
Selling, General & Administrative◆ An after-tax charge of $0.13 per fully diluted share resulting
from a $22.5 million charge related to a settlement of litiga-
tion with Sandoz, a subsidiary of Novartis AG, regarding
the raw material source for Warfarin Sodium.
◆ An after-tax benefit of $0.05 per fully diluted share resulting
from a $8.4 million net benefit primarily related to a partial
reimbursement of the $63.2 million charge the Company
recorded in the fourth quarter of fiscal 2005 when it
announced the agreement to acquire the Mircette® oral
contraceptive product and settle related litigation.
Margins◆ An after-tax charge of $0.13 per fully diluted share resulting
from a $20.7 million charge related to the step-up in value
of inventory acquired from FEI Women’s Health, LLC.
Other Income◆ An after-tax benefit of $0.06 per fully diluted share resulting
from a $10.3 million benefit related to a gain on the
Company’s foreign currency hedge entered into in connec-
tion with its proposed acquisition of PLIVA, d.d.
◆ An after-tax gain of $0.04 per fully diluted share resulting
from a $6.7 million gain representing the Company’s share
of the net income recorded by two venture funds in which
the Company is a limited partner. Such net income was
driven principally by unrealized gains.
Fiscal 2005
For the fiscal year ended June 30, 2005, there is one excluded
charge:
Selling, General & Administrative◆ An after-tax charge of $0.37 per fully diluted share resulting
from a $63.2 million charge related to the settlement of
litigation with Organon and the acquisition of the Mircette®
oral contraceptive product.
Reconciliation of GAAP EPS to Adjusted EPSFor the Fiscal Years Ended June 30, 2006 and 2005 (unaudited)
Fiscal Years Ended June 30, 2006 2005
Earnings per common share – assuming dilution $ 3.12 $2.03
After tax effect of:
Mircette settlement charge (0.05) 0.37
Step-up charge for inventory 0.13 –
Raw Material Settlement Charge 0.13 –
Unrealized gain on venture fund (0.04) –
Foreign currency hedge appreciation (0.06) –
Earnings per common share – assuming dilution, net of charges $ 3.23 $2.40
06 AR Financial pgs 38-60.qxd 9/11/06 11:20 AM Page 60
Timothy P. CatlettSenior Vice President, Generic Sales and Marketing
Catherine F. HigginsSenior Vice President, Human Resources
Frederick J. KillionSenior Vice President and General Counsel
William T. McKeeSenior Vice President Chief Financial Officer and Treasurer
Christopher Mengler, R.Ph.Senior Vice President, Corporate Development
Christine A. MundkurSenior Vice President Quality and Regulatory Counsel
Emad M. Alkhawam, Ph.D.Vice President Analytical Research and Development
Jay Bapna, P.E.Vice President Engineering and New York Manufacturing
Lance J. Bronnenkant, Ph.D.Vice President Business Development and Licensing
Carol A. CoxVice President, Investor Relations and Corporate Communications
Charles E. DiLiberti, M.S.Vice President, Scientific Affairs
David J. FurnissVice President, Internal Audit
Phil GioiaVice President, Proprietary Sales
Jake HansenVice President, Government Affairs
Sigurd C. KirkVice President and Corporate Controller
Shannon Thyme Klinger, Esq.Vice President, Marketing Compliance andAssociate Counsel
Heidi L. Kraus, Esq.Vice President, Intellectual Property and Associate Counsel
Daryl LeSueurVice President, Operations, Ohio Facility
Richard H. MileskiVice President, Quality Assurance
Michael MoorsheadVice President and General Manager Virginia Facility
Amy NiemannVice President, Proprietary Marketing
Rocco J. Rositano, CPA, CMAVice President, Taxation
Timothy B. SawyerVice President, Sales for Generic Products
Robert WillifordVice President of Administration and GeneralManager, Ohio Facility
Duramed Pharmaceuticals, Inc.A subsidiary of Barr Pharmaceuticals, Inc.
G. Frederick WilkinsonPresident and Chief Operating Officer
Barr Pharmaceuticals, Inc.Board of Directors Bruce L. Downey, Esq.Chairman of the Board and Chief ExecutiveOfficer, Barr Pharmaceuticals, Inc.Chairman of the Board, Generic PharmaceuticalAssociation (GPhA)Chair of Board of Ambassadors, Johns Hopkins’Project RESTORE
Carole S. Ben-Maimon, M.D.President and Chief Operating Officer Duramed Research Inc.
Paul M. Bisaro, Esq.President and Chief Operating Officer Barr Pharmaceuticals, Inc.
Harold N. ChefitzChairman of Notch Hill Advisors President of Chefitz Healthcare AdvisorsBoston University Medical School Advisor to Alzheimer’s Program
Richard R. FrankovicPharmaceutical Industry Consultant
James S. Gilmore, III, Esq.Partner, Kelley Drye & WarrenFormer Governor, Commonwealth of Virginia
Jack M. KayPresident and Chief Operating Officer of Apotex, Inc.
Peter R. SeaverHealthcare Industry Consultant
George P. Stephan, Esq.Business ConsultantFormer Director of Kollmorgen Corporation
Management TeamBruce L. Downey, Esq.Chairman of the Board and Chief Executive Officer
Paul M. Bisaro, Esq.President and Chief Operating Officer
Carole S. Ben-Maimon, M.D.Senior Vice President
Catherine F. HigginsVice President, Human Resources
Frederick J. KillionVice President, General Counsel and Secretary
William T. McKeeVice President, Chief Financial Officer and Treasurer
Rocco J. Rositano, CPA, CMAAssistant Treasurer
Barr Laboratories, Inc.A subsidiary of Barr Pharmaceuticals, Inc.
Paul M. Bisaro, Esq.President and Chief Operating Officer
Salah U. Ahmed, Ph.D.Senior Vice President, Research and Development
Michael J. BogdaSenior Vice President Manufacturing and Engineering
Duramed Research Inc.A subsidiary of Barr Pharmaceuticals, Inc.
Carole S. Ben-Maimon, M.D.President and Chief Operating Officer
Joseph A. Carrado, M.Sc., R.Ph.Vice President, Clinical Regulatory Affairs
Howard I. HaitVice President, Data Management and Biostatistics
Wayne S. Mulcahy, Ph.D.Vice President, Clinical Operations
Shareholder InformationInvestor Relations DepartmentContact: Carol A. Cox Vice President, Investor Relations and Corporate CommunicationsEmail: [email protected]: 1-800-BARRLABWebsite: www.barrlabs.com
Common Stock Common Stock is traded on the New York StockExchange Symbol: BRL
Registrar and Transfer AgentMellon Investor ServicesP.O. Box 3315South Hackensack, NJ 07606-1915
Annual MeetingThe annual meeting of shareholders will be held at 10 am on November 9, 2006 at the Park RidgeMarriott, 300 Brae Boulevard, Park Ridge, NJ 07656.
TrademarksBARR, barr (stylized), the stylized “b”, Duramed,DURAmed (stylized), “four dots” (stylized), “halfcircles with line” (stylized), “Shaping Women’sHealth” (stylized), the female symbol (stylized),CENESTIN, APRI, CRYSELLE, SPRINTEC,CAMILA, LESSINA, PORTIA, KARIVA,ERRIN, ENPRESSE, AVIANE, PLAN B,TRI-SPRINTEC, VELIVET, ARANELLE,MIRCETTE, PARAGARD, DOXY-TABS,DOXY-CAP, MYLOCEL, SHAPINGWOMEN’S HEALTH, DIAMOX, DURADRIN,E.S.P., REVIA, REVIA NALTREXONE HCL,NORTREL, ZEBETA, JUNEL, WHEEL OF MENSTRUATION, FEWER PERIODS.MORE POSSIBILITIES., SEASONALE,AYGESTIN, PREVEN, PREVENT, PREFEST,IT’S NOT TOO LATE TO PREVENT PREG-NANCY and ZIAC are registered trademarks, andCLARAVIS, TREXALL, KELNOR, ENJUVIA,ENJUVIA (stylized), JUNEL FE, MAKINGMEDICINES WORK FOR EVERYONE,OUTLOOKS & OPINIONS, A.L.E.R.T.,LIBER-T, LIBER-T (stylized) , SEASONIQUE,SEASONEST, SEASONETTE, SEASONESSE,PRAZYVA, JOLARA, JOLENNA, OCELLA,CHAYA, DEBUTET, IOSHE, LEFRIA,OCALLIA, JOLESSA, OCERA, PROJUVIA,BIJUVA, TRI-LEGEST, NEVIS, CARE andCYPAT are trademarks of Barr Laboratories, Inc.,Duramed Pharmaceuticals, Inc., or related entities.VIASPAN is a registered trademark of Bristol-Myers Squibb Pharma Company, licensed for useby Barr Laboratories, Inc. LOESTRIN is a regis-tered trademark of Galen (Chemical) Limited,licensed for use by Barr Laboratories, Inc.
All other trademarks referenced herein are theproperty of their respective owners.
© 2006 Barr Pharmaceuticals, Inc. All rights reserved.
Directory
Design: Arnold Saks Associates, NYC Major Photography: Bill Gallery Product Photography: Jim Barber Printing: PXPOhio
0614 Barr 06 AR-cov 9/6/06 4:10 PM Page 3

Barr Pharmaceuticals, Inc.
400 Chestnut Ridge Road
Woodcliff Lake, NJ 07677
1-800-BARRLAB
www.barrlabs.com
®
0614 Barr 06 AR-cov 9/6/06 3:33 PM Page 4