Embed Size (px)
Citation preview

Barclays PLCAnnual Report 2002
Barclays PLCHead Office54 Lombard StreetLondon EC3P 3AHTel 020 7699 5000www.barclays.com
a
a
Barclays PLC Annual Report
2002
9955212

Registered No. 48839This document contains certain forward-looking statements within themeaning of section 21E of the US Securities Exchange Act of 1934, asamended and section 27A of the US Securities Act of 1933, as amended with respect to certain of the Group’s plans and its current goals andexpectations relating to its future financial condition and performance.
The Group may also make forward-looking statements in other writtenmaterials, including other documents filed with or furnished to the SEC. In addition, the Group’s senior management may make forward-lookingstatements orally to analysts, investors, representatives of the media andothers. In particular, among other statements, certain statements in theFinancial Review and Business Description with regard to managementobjectives, trends in results of operations, margins, costs, return on equity,risk management, and competition are forward looking in nature. Theseforward-looking statements can be identified by the fact that they do not
relate only to historical or current facts. Forward-looking statements often use words such as “anticipate,” “target,” “expect,” “estimate,” “intend,” “plan,” “goal,” “believe,” or other words of similar meaning.
By their nature, forward-looking statements involve risk and uncertaintybecause they relate to events and depend on circumstances that will occur in the future. The Group’s actual future results may differ materially fromthose set out in the Group’s forward-looking statements. There are manyfactors that could cause actual results and developments to differ materiallyfrom those expressed or implied by these forward-looking statements. Anyforward-looking statements made by or on behalf of the Group speak only as of the date they are made. Barclays does not undertake to update forward-looking statements to reflect any changes in the Group’s expectations withregard thereto or any changes in events, conditions or circumstances onwhich any such statement is based. The reader should, however, consult anyfurther disclosures Barclays may make in documents it files with the SEC.
Section 1Review
1 Introduction2 Chairman’s Statement5 Group Chief Executive’s
Statement8 Financial Performance
Group Finance Director14 The Leadership Team
Section 2Impact
18 Corporate SocialResponsibility
32 Directors and officers of Barclays PLC andBarclays Bank PLC
35 Directors’ report37 Corporate governance
report40 Barclays report on
remuneration52 Accountability and Audit53 Presentation of
information54 Risk management
Section 3Results
87 Financial Data90 Business description96 Financial review123 Other information126 Auditors’ reports128 Consolidated accounts
Barclays PLC235 Shareholder information242 Group senior
management andprincipal offices

Barclays PLCIntroduction
Our missionOur mission is to be an innovative, customer focused Group thatdelivers superb products and services, ensures excellent careers for our people and contributes positively to the communities inwhich we live and work.
Our primary goalOur primary goal is consistently to deliver top quartile totalshareholder return versus our peers over time.
Our beliefsOur operating philosophy is ‘managing for value’. The strategies we follow and the actions we take are aligned to value creation for all stakeholders.
1Barclays PLC Annual Report 2002

Chairman’s Statement
Barclays delivered a sound performance during 2002, while continuing with the transformation of the business and progressing our longer-term economic development.
The year was a curious one. The UK, our key market, onceagain grew more rapidly than other European countries,though in an increasingly lopsided way, biased toward public and personal consumption. The US recovered from an unusually weak performance in 2001 but, if anything, was even more unbalanced and consumption biased.Continental Europe and Japan were lacklustre.
It was a year of great uncertainty about the future combinedwith extremely competitive business conditions. Financialmarkets were volatile and in decline in 2002; they remain so in 2003. This is partly the result of the collapse of overexcited sentiment stirred up primarily by the dotcom boom.Partly it reflects uncertainty about how the national economicimbalances will unfold, especially with the threat of war in Iraq. Partly it reflects the very competitive and difficultconditions in some sectors. But it also reflects the uncertaintyimposed on companies by the changing regulatory background.
To take our own business: we have had to deal with 18 differentgovernment reviews over the past three years. There is aseemingly endless stream of new accounting rules. The capitalrequirements of the bank will change as a result of Basel II. A whole industry in corporate governance has been createdspearheaded by: Sarbanes-Oxley in the US; the UK Governmentcommissioned reports including the Higgs Review of the roleand responsibilities of non-executive Directors, and the SmithReview of the role of audit committees. We see the prospect of plenty more on its way from Brussels. We have increasinglytough ‘Know Your Client’ rules from the FSA, which longstanding customers find oppressive. And we have seen theemergence of price control – from the CompetitionCommission Inquiry.
The sheer volume of this activity takes up management timeand resources, which could otherwise be devoted to drivingthe business forward. It creates uncertainty and inhibitssensible risk taking. And makes it increasingly difficult toexplain our business in simple terms to our stakeholders.
We set out to be an open company, communicatingextensively with our large and small shareholders, both about our financial results and about the way the company is organised and managed. Within our Annual Report this year there is more on risk management and corporategovernance, including a more detailed remuneration
report. Once again, we have set out in some detail our efforts under the heading of Corporate Social Responsibility,where the involvement of our employees in our CommunityProgramme grows steadily and is a great source of pleasure.
There are several changes to report at Board level. Sir AndrewLarge, one of our Deputy Chairmen, left Barclays to becomeDeputy Governor (Financial Stability) of the Bank of England.Sir Andrew brought a wealth of experience in banking andregulation to the Board; we wish him well in his important role. John Stewart, the Deputy Group Chief Executive, has also left the Board. Mr Stewart was previously Chief Executiveof The Woolwich and has played a key role in integrating the business into Barclays.
Looking ahead, Sir Nigel Mobbs will be retiring at the AGM in April 2003 after 23 years’ service with Barclays. He has made a huge contribution to the bank over this time. Hisknowledge and authority have made him an outstandingChairman of the Audit Committee. It is sad that such length of service is frowned on by current governance fashions.Graham Wallace has indicated his intention to retire from the Board in the summer, after he leaves Cable & Wireless. The Board is grateful for the contribution that he has madesince he joined Barclays in April 2001.
We shall miss the contribution of these Directors. However,there are two new arrivals to the Board, both of whom arestanding for re-election at the AGM. In July, we welcomedDr Jürgen Zech to the Board as a non-executive Director.Dr Zech is a leading businessman in Germany and bringsadded financial experience to the team. Professor SandraDawson joins the Board as a non-executive Director in March. Professor Dawson is Professor of Management Studies and Director of the Judge Institute at CambridgeUniversity, and brings both academic and managementexperience to Barclays.
Lawrence Dickinson replaced Howard Trust as Group Secretaryin September 2002. The Directors are immensely grateful toMr Trust for his services to the Board over the past eight years.
There are only two certainties about 2003. The first is that weshall have to cope again with the uncertain climate we faced in2002. The second is that Barclays is well placed thanks to thespread of its business, the quality of its staff and its determinationto succeed and seize the opportunities that arise.
Sir Peter MiddletonChairman
2 Barclays PLC Annual Report 2002

3Barclays PLC Annual Report 2002
In 2002 the Barclays University (bu) initiative was fully rolled out. Metro centreswere opened in Birmingham, Bristol, Manchester and Luton and a further 150 ‘hubs’ were established.
Barclays is equipping staff with the skills needed to raise the performance bar. In 2002, around 750,000 hours of training were delivered across the Group.
750,000
Barclaycard has developed innovative ways to share its sponsorship of thePremier League with customers. Fans who subscribe to Barclaycard’s text alert service can receive latest scores and results via their mobile phones.
Barclays is dedicated to establishing itself as an employer of choice. Staff areevaluated based not only on what they achieve but also on how they achieve it.
Openplan, which was tailored for the Spanish market, achieved tremendoussuccess in Spain during 2002. At year-end, products per person was 4.5, well above the average of 3.2 for customers outside of Openplan.
Barclays was the first major high street bank to provide integrated banking.During 2002 almost 2 million UK customers chose the Openplan proposition,which can be individually tailored and accessed through a range of channels.

4 Barclays PLC Annual Report 2002
14mPersonal Financial Services provides a wide range of products and services to 14 million personal customers throughout the UK.
Barclays Capital became a global leader in its area of focus: providing riskmanagement and financing solutions for clients.
A new IT system was piloted in Spain for customer-facing staff. The sophisticatedtechnology gives staff full customer histories at the touch of a button, providinga single view of the client’s relationship with Barclays, across many channels.
£462bnBarclays Global Investors has over 2,300 institutional clients in 44 countries with assets under management of £462 billion.
In 2002 Barclays and Canadian Imperial Bank of Commerce (CIBC) combined theirCaribbean operations creating FirstCaribbean International Bank Ltd, which has morethan 700,000 accounts, 3,000 staff, 87 branches and 123 ATMs across 15 countries.
The branch network is the public face of Barclays for 14 million personalcustomers. The introduction of a programme of extended opening hoursensures more customers can access their bank at a time that suits them.

5Barclays PLC Annual Report 2002
In the crucible of 2002, in an environmentthat was much worse than expected, wetook further strides to transform Barclays.While we were not immune to the externalenvironment, we took aggressive action to adjust to rapidly changing conditions,which was demonstrated in our resilientperformance. Barclays reported operatingprofit of £3,780 million1, profit before tax of £3,205 million and a return on equity on a statutory basis of 15%. That I regard this as a resilient performance, butnot more, is an indication of how well theGroup has been performing in recent years.
Central to our performance during 2002 was a balancebetween maximising short term results and maintainingmomentum in the execution of our strategic agenda. Weintroduced our five medium term strategic priorities last year:the protection and enhancement of our core UK franchise; the development of businesses that serve global customers and can harvest global or regional economies of scale – thebest examples of which are our investment banking and credit card businesses; the deepening of our retail andcorporate banking activities in Western Europe; the extensionin the UK and Europe of our wealth management business; and enhancing our organisational fitness in the capabilities we will need to be one of the world’s leading financialinstitutions. 2002 has been a year of sound progress towardsmeeting our ambitions.
I will start my review with our core UK businesses, whichcontributed a 13% increase in profit before tax relative to 2001 and achieved a 4% margin between income growth and cost growth. I will review three areas specifically: PersonalFinancial Services; Business Banking; and Barclaycard.
First, Personal Financial Services. The transformation herecontinues at pace. It is two years since we completed theacquisition of Woolwich and it was fully integrated intoPersonal Financial Services during 2002, ahead of schedule.Woolwich continued to make an important contribution to the performance of Personal Financial Services, particularly in helping to broaden and deepen our product range.
Our market share of net mortgage flow improved from a combined base of some 6.3% in October 2000 (when the transaction completed) to 8.7% in 2002.
We launched the Openplan proposition (which was successfullydeveloped by Woolwich) through Barclays channels in April2002. Openplan brings convenience and cost savings to ourcustomers – and therefore the potential for both higherproduct penetration and contribution per customer. Earlyperformance is encouraging: in Openplan from Barclays wegenerated new savings and mortgage balances of £13.2 billion;and products per customer are running at 4.3 relative to 2.5 outside Openplan. Openplan has also been a materialcontributor to our improved performance in the savingsmarket where, for the first time, Barclays branded savings were one of the top performers in terms of share of newsavings flow during 2002. In the increasingly competitivecurrent account market we have increased the number ofcurrent account holders we serve from 10.1 million in 2001 to 10.5 million in 2002.
So as I look at our performance in Personal Financial Services we have made strong headway across mortgages, Openplan,savings, and current accounts.
The second core UK business is Business Banking, which is our biggest profit generator – £1,262 million1 of operatingprofit in 2002. It has over 500,000 small and medium sizedbusiness customers. It is a business where: relationships are built and maintained by, in our case, 2,400 relationshipmanagers who have extensive sector specific expertise; andwho are mobile in every sense of the word, spending much of their time at the premises of their customers; where thephysical distribution base of the branch network is a vitalcontributor to customer convenience; and where there are risk management techniques born of years of data and cycles of experience.
The industry has learnt much from the experiences of the lastdecade. In the early nineties, annual write-offs as a percentageof the sterling corporate loan book for the British bankingindustry amounted to 250 basis points. Barclays corporate loanbook write-offs were 52 basis points in 2002. We have cause to remain cautious about the year ahead but the science of riskmanagement in this part of the industry has advanced hugely,and I believe nowhere more so than at Barclays.
Group Chief Executive’s Statement
1 Operating profit is as defined in paragraph 1 on page 10.
Group Chief Executive’s Statement
In our third UK franchise, Barclaycard, operating profit grew by 21%1. Barclaycard is known for its customer-centricity,innovation and profitable growth. By way of example, Nectar, the loyalty scheme launched in September 2002 with Barclaycard as a founder member, has at its heart thesame philosophy of innovation and convenience that drivesOpenplan. In the case of Nectar, customers are offered loyaltypoints in a way that makes it easy for them to accumulate, andwhich can be exchanged for a wide range of items which bestsuit their lifestyle. A total of 11 million active collectors wererecruited in the first eight weeks after Nectar was launched.
Barclaycard also continued to grow through non-organicmoves. The acquisition of the UK credit card business ofProvidian in April 2002 was a good example of strategicdevelopment by corporate action. Providian brought distinctive and complementary competencies in the credit card environment and 500,000 new customers with balances of around £400 million.
£3,205mBarclays PLC 2002 profit before tax
Barclaycard International has continued its expansion intoEurope with the launch in Italy during 2002. It has issued 1.28 million cards in Germany, Spain, Greece, France and Italy.
Looking now at our other global businesses, Barclays Capital and Barclays Global Investors. In an extremely difficultenvironment for investment banks around the world, BarclaysCapital delivered one of its best ever performances in 2002,making a return on economic capital of 19%.
Our performance in a key league table (the Euromoney Global All Debt Table – which aggregates the volume of bonds, medium term notes and loans) shows that we havebeen taking market share, rising to 5th position in the world (2001: 8th position).
Barclays Capital was the only top ten investment bank to increase debt issuance volumes in 2002, a year when overall volumes in the market were down sharply. This strongoverall performance reflected our concentrated approach tothe recruitment of business originators, our energetic riskmanagement and our ability to flex our costs to accommodatethe tougher income generating environment. Barclays Capitalis a business strongly positioned for sustained growth.
I will also say a few words about Barclays Global Investors. I like this business, especially from the point of view ofportfolio diversity. Its performance is dominated by fees and commissions, it has its main business in the United States and it is a low utiliser of regulatory capital. It leads theworld in index replication and in exchange traded funds andhas a growing franchise in active fund management.
Notwithstanding the impact on assets under management ofcollapsing stock market indices, Barclays Global Investors stillmanages funds of more than £460 billion. Operating profitsgrew 41%1 during the year.
The development of our wealth management business is one of our strategic priorities. Barclays Private Clients servesaround one million clients and we manage some £85 billion of assets on their behalf. 2002 was a particularly difficult yearfor the wealth management industry as a whole. Markets, ofcourse, were terrible. The FTSE 100 index fell 24%. Severalmajor competitors have either withdrawn or stood back.
What distinguishes the successful from the unsuccessful in thissector is the breadth of distribution base, the cost to recruitnew customers and access to world-class products. Barclays is advantaged in these dimensions, and our development paththis year has been characterised by further consolidation of theoriginating businesses of Barclays Private Clients, the integrationof our banking and investment management customer offeringsand the steady development of our strategic partnership with Legal & General. We acquired Charles Schwab Europe on 31st January 2003, an execution-only retail stockbroker to strengthen further our stockbroking business.
£1,237mBarclays PLC 2002 economic profit
In 2002, we continued to build our European retail andcommercial banking businesses through organic development.By way of example we made good strides in growing ourSpanish business, enhancing the value of this business throughcapturing profitable market share. The launch of Openplan in Spain is an example of our ability to develop successfulproducts and transport them cross-border. Our market shareof net new business in mortgages in Spain increased from0.5% in 2001 to 5% in 2002, consequent on the introductionof Openplan.
1 Operating profit is as defined in paragraph 1 on page 10.
6 Barclays PLC Annual Report 2002
Although we continue to seek out value creating non-organicopportunities in selected European markets, we will remainrigorous in applying the disciplines of value based managementin analysing potential targets. We will only consider transactionsthat meet our value based metrics.
In our drive to become a high performance organisation we have improved the calibre of human capital in key jobsacross the Group and increased the differentiation in rewardand recognition. We have directed substantial amounts ofinvestment into training and development through initiativessuch as the launch of Barclays University. We have increasedfocus on our Equality and Diversity programme which ispotentially such a fruitful source of human capital. In all of these endeavours we have been greatly supported by our trade union partners in UNIFI.
15%Barclays PLC post-tax return on average shareholders’ funds on a statutory basis
Lastly, I should touch on the outlook. The macro-economicindicators remain ambiguous. However, I am if anything a bit more optimistic about 2003 than I was about 2002. Webelieve that the UK may perform slightly better than it did in 2002. This should provide a relatively stable backdropagainst which we can grow our business in the UK. The USentered 2003 in moderately better shape than it entered 2002. However, the Eurozone presents a more subdued picture. Germany faces a series of intractable difficulties and since Germany represents one third of the Eurozone, the Eurozone as a whole is likely to continue to lag behind the UK and US. Japan shows no sign of addressing itsdifficulties, which require structural reform.
All this adds up to a UK domestic economy likely to performwell relative to the rest of Europe, but an international economywhich, in the aggregate, looks unlikely to be significantly moreexpansionary than last year.
Whatever the out-turn, you can expect us to manage our businessaggressively and proactively, adjusting to emerging conditionswhile powering ahead with our strategy. I remain optimisticabout the health of the industry and, in particular, Barclays.
Matthew W. BarrettGroup Chief Executive
7Barclays PLC Annual Report 2002

Financial PerformanceGroup Finance Director
Barclays delivered a resilientperformance during 2002 but like the rest of the financial services industry, we felt the impact of 2002’suncompromising economic climate.
Note 1: Figures exclude Woolwich fair value adjustments. Further details are provided in the Presentation of information section.
Note 2: Figures exclude the restructuring charge relating to staff displacementand related costs, costs associated with the integration of Woolwich plc,Woolwich fair value adjustments and goodwill amortisation. Further detailsare provided in the Presentation of information section.
Note 3: Woolwich plc was acquired on 25th October 2000 and its results are included from that date.
Total operating income
2001
£m
12,000
11,000
10,000
9,000
7,000
8,000
11,177
2000
9,501
2002
11,379
1,3
Operating profit
2002
£m
500
1,000
1,500
2,000
2,500
3,500
3,000
4,000
4,500
0
3,780
2001
3,951
2000
3,474
2,3
Profit before tax
£m
1,000
2,000
3,000
4,000
0
2001
3,425
2000
3,392
2002
3,205
3
8 Barclays PLC Annual Report 2002

9Barclays PLC Annual Report 2002
Note 4: The cost:income ratio is calculated by dividing cost per business unit by income per business unit and expressing it as a percentage. The benchmark cost:income ratio for each of our businesses is the upperquartile cost:income ratio for a comparable peer group of companies.
Earnings per share
2002
Penc
e
10
20
30
40
50
0
33.7
2001
36.8
2000
40.4
Dividends per share
2002
Penc
e
20
15
10
5
0
18.35
2001
16.625
2000
14.50
Tier 1 capital ratio
2002%
9
8
7
6
5
4
2
3
1
0
8.2
2001
7.8
2000
7.2
Cost:income benchmarking
2001 Full year upper quartile cost:income ratio2002 Full year Barclays cost:income ratio
2001 ratio
5054
55%
Personal Financial Services
57
71
59%
BarclaysPrivate Clients
36 35
35%
Barclaycard
4541
45%
BusinessBanking
50%
BarclaysAfrica
67
80
85%
Barclays Global Investors
73
59
63%
BarclaysCapital
Cost
inco
me
rati
o %
90
80
70
60
50
40
30
20
10
0
5250
4
2002
%
30
25
20
15
10
5
0
14.7
2001
17.4
2000
24.8
Return on average shareholders’ funds

Financial PerformanceGroup Finance Director
To facilitate a better understanding of the operating profittrends, in the following analysis references to operating profitexclude the impact of the restructuring charge relating to staffdisplacement and related costs, costs directly associated with the integration of Woolwich plc, Woolwich fair valueadjustments and goodwill amortisation.
Barclays delivered a resilient performance during 2002 but like the rest of the financial services industry, we felt the impact of 2002’s uncompromising economic climate.
While return on equity on a statutory basis was 15% and the total dividend payout for the year was up 10%, operatingprofit, at £3,780 million, was 4% lower than in 2001.
Income rose 2%. Aggressive cost management helped mitigatethe effects of the tougher environment for income growth. Wewere again able to maintain a positive margin between incomegrowth and cost growth, but not at the levels of recent years.The cost income ratio improved slightly from 54.3% in 2001 to 53.6% in 2002.
While these results were sound given the market pressures,they fell short of our recent standards. Solid performance andgood growth in many areas of the business, and an increase incustomer recruitment and business volumes, were not enoughto offset two features of 2002: first the increased provisions onthe South American Corporate Banking loan book (the year onyear impact was approximately £100 million); and second theswing from a positive income contribution of £127 million in2001 to a negative contribution of £51 million in 2002 fromthe closed life funds business. The combination of these factors converted what would have been a 3% operating profit increase into a 4% fall.
GoalsBarclays sets value based financial goals to stretch performance.The current goal cycle, 2000 to 2003, was 75% elapsed as atthe end of 2002. Goals have been an important stimulus offocus and energy for the whole organisation, helping to lift our metabolic rate and drive performance improvements.
It is right that goals should be stretching and enduring in nature so, notwithstanding the tough markets of 2002 and the difficult outlook for 2003, the goals which we have set for the period 2000 to 2003 remain unchanged.
Total shareholder returnThe primary goal is to achieve top quartile total shareholderreturn on a sustained basis, relative to our peer group. Totalshareholder return is the sum of share price appreciation and dividends (treated as if re-invested in Barclays shares). The peer group is reviewed annually. In 2002, it comprisedAbbey National, ABN Amro, BBVA, BNP Paribas, Citigroup,Deutsche Bank, HBOS, HSBC, Lloyds TSB, Royal Bank ofScotland and Standard Chartered. It remains unchanged for 2003.
We believe that total shareholder return, measured relative to the performance of comparable companies, is the best way of evaluating Barclays performance and measuring value creation for shareholders.
At the end of 2002, three years into the period, Barclaysremained in the top quartile of its peer group with totalshareholder return over the years 2000 to 2002 inclusive of minus 4%. The average return of the peer group over the same period was minus 11%.
The total shareholder return goal is supported by threeadditional goals. They are goals directed at economic profit1, absolute value and costs.
Economic profitIn order to deliver our relative total shareholder return goal, we have a goal relating to economic profit: the goal is todouble economic profit over the period 2000 to 2003 inclusive, thereby generating £6.1 billion of cumulativeeconomic profit.
We derive the cumulative total by taking economic profit in the base year (1999) and compounding it over four years at 19%, the arithmetical effect of which is to double 1999economic profit in 2003. The sum of these economic profitcontributions for the four years is £6.1 billion. Althougheconomic profit for 2002 of £1.24 billion was slightly higherthan in 2001, the cumulative total of economic profit produced in the years 2000 to 2002 inclusive was £3.9 billion, whichrepresents 93% of the goal of £4.2 billion required at the end
10 Barclays PLC Annual Report 2002
1 Economic profit is defined as profit after tax and minority interests pluscertain gains (and losses) reported within the statement of total recognisedgains and losses where they arise from the Group’s business activities andare in respect of transactions with third parties, less a charge for the cost ofaverage shareholders’ funds (which includes purchased goodwill).

of 2002. To achieve the four year goal, we need to generate£2.2 billion of economic profit in 2003 – a tough challenge.
Three years ago when we set this goal, our study of stockmarket history indicated that a compound annual growth rate in economic profit of 19% would be required to delivertop quartile total shareholder return performance during theperiod 2000 to 2003. The reality to date is that a compoundannual growth rate of economic profit equivalent to some 15% across the years 2000 to 2002 inclusive has enabled us to meet our primary top quartile total shareholder return goal.
Absolute valueAn absolute value goal was established in the belief, over time,that growth in total shareholder return would track growth in economic profit. As we adopted a doubling of economicprofit goal over the four year period 2000 to 2003 inclusive,the absolute value goal similarly seeks to double totalshareholder return over the same period. We monitor this goal by tracking the performance of £100 invested in Barclayson 31st December 1999 which should be worth £200 by 31st December 2003 from a combination of share price growthand dividends (treated as if re-invested in Barclays shares).
Despite achieving top quartile total shareholder return and a compound annual growth rate of economic profit of some15% across the years 2000 to 2002 inclusive, at the end of2002, £100 invested in Barclays stock on 31st December 1999
was worth £96. The fall in the stock market has resulted in our being significantly off the pace against this goal. We derivesome comfort, but only some, from the fact that if you hadinvested £100 over the same period in a basket of stocks made up of our peer group, it would have been worth £89 at the end of December 2002; or if you had invested in theFTSE 100 index, it would have been worth £61.
CostsWe seek opportunities to enhance value by reducing costs inways that will not impair the service we provide to customers.We set a goal at the end of 1999 of reducing the annual run rate of costs by £1 billion by the end of 2003, therebyabsorbing the impact of inflation and volume-related growthover the period.
We remained well ahead of the goal at the end of 2002, bywhich time £910 million of cost run rate savings had beencaptured, comprising £545 million in total for 2000 and 2001,and a further £365 million delivered in 2002. With a year left of the four year period, 91% of the target has already been achieved.
The major components of savings to date include costreduction initiatives in Personal Financial Services, BusinessBanking and Barclays Private Clients, sourcing efficiencies froma radical restructuring of purchasing, increased centralisation of
11Barclays PLC Annual Report 2002
Chart 2 shows the value, by the end of 2002, of £100 invested in Barclays on 31st December 1999 compared with the value of £100 invested in our peergroup or in the FTSE 100 over the same period.
Chart 2 Total shareholder return
£50£25 £75 £100 £125£0
Barclays 96
Peer group average
89
FTSE 100 61
Chart 1 shows performance against our goal of doubling economic profit over2000 to 2003 inclusive. Economic profit in the base year, 1999, was £971 million.
£bn
7
6
5
4
3
2
1
0 3.9
2001 20032002
2.7
2000
1.4
1.2
2.5
4.2
6.1
Chart 1 Cumulative economic profit performance versus goal
Cumulative actualCumulative target

information technology and operations, and the simplificationand reduction of central functions expenditure (such as financeand human resources).
Success in achieving this goal will deliver two benefits: thesavings themselves, which help protect and enhance ourprofits; and the embedding, deep within the organisation, of a strong efficiency culture. Each business is benchmarkedrelative to its competitors and a top quartile efficiencystandard is identified (this is depicted in the chart headed‘Cost: income benchmarking’ on page 9). Business performancerelative to that benchmark is reviewed regularly and allbusiness leaders have efficiency targets as an integral part ofpersonal performance contracts. We believe that if we couldachieve top quartile productivity in all businesses, then theannual cost run rate saving would exceed £300 million.
I believe the goals are serving shareholders well, because they have galvanised the whole of the Barclays Group inpursuit of stretching financial objectives. It is no coincidencethat the most profitable three years in Barclays history are the three years during which we have been pursuing them.
We will communicate another set of stretching goals to take effect at the end of this cycle: goals that will cause us to strive to deliver superior relative shareholder returns on a sustained basis.
Business performanceLet me review briefly the financial performance of our main businesses.
The ambitious plans in Personal Financial Services, BusinessBanking and Barclays Private Clients showed signs of earlysuccess, and we saw in Barclays Capital, BGI and Barclaycardgood payback on prior years’ investments. As a result, 2002 business performance across the portfolio was solid. We continued to invest in the future (a total of £381 million was directed at strategic investment), accompanied by careful tactical management of all other costs.
Personal Financial Services, incorporating Woolwich, increasedoperating profit by 8%, driven primarily by tight cost managementcombined with a 13% fall in provisions (despite a 14% increase
in risk weighted assets). The significant increase in new businessvolumes, particularly in mortgages and savings, created a short term drag on income growth because of the associatedorigination costs. Investment remained high – the launch ofOpenplan in Barclays channels would be a good example – and the fundamental transformation of the retail businessprogressed well.
In Barclays Private Clients, operating profit fell sharply largelyas a result of the £178 million adverse year on year swing inincome from the closed life funds business that I referred toearlier. Excluding the impact of the closed long term assurancefund, income fell 3%, which was a resilient performance giventhe difficult trading conditions for the wealth managementindustry in 2002. This performance reflected the benefits ofthe business’ diversity in both product and geography. Thedevelopment of Barclays Private Clients is one of our strategicpriorities and so a high level of strategic investment wasmaintained throughout 2002.
Barclaycard had a very strong year, with operating profit risingby 21%. This was driven by income growth of 14%. Customerrecruitment reached record levels and credit exposure remainedtightly managed. We made good progress in the internationalcards business, which recorded operating profits for the lastfour months in 2002.
Business Banking also had a very strong year with operatingprofit rising by 15% driven by income growth of 5% and costreduction of 4%. These cost efficiencies reflected sustainedcommitment to productivity improvement over the past threeyears. Provisions were in line with our expectations.
Barclays Capital’s operating profit fell 10%. Income was up 7%, a record year. Operating costs fell 1%, demonstrating BarclaysCapital’s ability to flex its expense base. Net revenue (incomeminus provisions) was 4% lower than in 2001 despite absorbinga substantial increase in provisions. These results were thesecond best in Barclays Capital’s history and demonstrate theability of its distinctive business model to weather a muchmore difficult business environment.
Barclays Global Investors saw operating profit rise by 41%despite falling stock market indices. This was a very strongperformance. I believe there will be very few investmentmanagers who have managed to increase profits in 2002.
12 Barclays PLC Annual Report 2002
Financial PerformanceGroup Finance Director

Capital managementOur capital position is strong. We have a double A creditrating, which is one of the highest and most stable ratings inthe banking sector. Our policy is to maintain this rating withgood ratios and an appropriate capital mix. At the end of 2002, our risk asset ratio was 12.8%, our tier 1 capital ratio was 8.2% and our tier 1 equity ratio (being the relationshipbetween shareholders’ funds including minority interests andnet of goodwill on the one hand and weighted risk assets onthe other) was 6.6%.
Our ability to pay increased dividends is dependent on goodfinancial performance and effective capital management. In 2002, we increased the dividend by 10% (the total paymentto shareholders for calendar 2002 will amount to £1.2 billion)and a further £546 million was spent in the repurchase of ourshares, which has the effect of increasing earnings per shareover time.
Earnings generation by the Group continued to exceed what was required to sustain business growth. We regard our buyback programme, along with dividend payments, as an efficient way of deploying surplus capital.
We believe that our economic capital principles create advantagefor us as we prepare for the implementation of Basel II. This isthe new regulatory capital regime for banks which is expectedto be introduced by the authorities in 2006.
Stronger for the futureIn 2002, Barclays absorbed the full impact of a difficultenvironment and still produced a return on equity of 15%. In doing so, we demonstrated the strong defensivecharacteristics of our portfolio of businesses. Those samebusinesses are well positioned for growth in the years ahead.
John VarleyGroup Finance Director
13Barclays PLC Annual Report 2002

3 Bob Diamond, Chief Executive, Barclays Capital wasappointed to his current role in October 1997. He becameChairman of Barclays Global Investors in August 2002. He joinedBarclays in 1996 and was appointed to the Group ExecutiveCommittee in 1997. Prior to that he was Vice Chairman andHead of Global Fixed Income and Foreign Exchange at CSFB.Previously, Bob spent 13 years at Morgan Stanley.
4 Gary Dibb, Group Chief Administrative Officer is responsiblefor Human Resources, Marketing, Communications, StrategicPlanning, Public Policy and Group Property Services, plus theimplementation of value based management. He joined Barclaysin February 2000 as Group Director of Strategic Planning andCorporate Development. Previously, he was Vice-Chairman ofBank of Montreal and, before that, owned and operated his ownstrategy and organisational development consulting firm.
The Leadership Team
Successful organisations need strongleadership at all levels. Ultimately it ispeople that separate the extraordinaryfrom the ordinary.
The Barclays Leadership Team is chargedwith shaping Barclays strategic directionand is also responsible for inspiring peopleacross the organisation to excel in strategyexecution.
Under the leadership of the Group Chief Executive, the Leadership Teamoperates as one in making decisions forthe entire Barclays Group. This collectivestrength has enabled Barclays to makeconsiderable progress in delivering itstransformation agenda.
1 Matthew Barrett, Group Chief Executive was appointedGroup Chief Executive on 1st October 1999. He came to BarclaysPLC from Bank of Montreal, where he was Chairman, CEO andChief Operating Officer during his 37-year career. He also filledsenior management positions in Retail Banking, InternationalBanking and Treasury. In 1994, he became an Officer of theOrder of Canada, the country’s highest civilian honour.
2 Roger Davis, Chief Executive, Business Banking wasappointed CEO of Business Banking in June 2001 and became a member of the Group Executive Committee in February2003. He was formerly Chairman and CEO of Barclays Capital,Asia Pacific, and a member of the Barclays Capital ExecutiveCommittee. He joined the bank in November 1996 from RobertFleming and Co, where he was a member of the Board ofJardine Fleming Holdings and Managing Director of JardineFleming India. Previously, he spent 12 years in the British Army.
14 Barclays PLC Annual Report 2002
1
3
2
4

5 Gary Hoffman, Chief Executive, Barclaycard was appointedin September 2001. He joined Barclays in 1982 from CambridgeUniversity and has held a variety of management positions andproject leadership roles. Prior to his appointment at Barclaycard,Gary was on the Executive Committee of Retail FinancialServices and a member of the Group Operating Committee.
6 Bob Hunter, Chief Executive, Barclays Private Clients joinedBarclays in May 1999 to lead the division serving affluent andhigh net worth clients around the world. He joined the GroupExecutive Committee two months later. Previously, Bob spent28 years with Chase Manhattan Bank and in 1996 he took up a new position as President of Standard and Poors’ InformationService. Bob will retire from Barclays in 2003.
9 Robert Nimmo, Group Risk Director joined Barclays asGroup Risk Director and became a member of the GroupExecutive in January 2002. Previously, he was Chief Risk Officerof First Union Corporation in North Carolina and a member ofthe Corporation’s Operating Committee. Prior to that he wasChief Risk Officer of Westpac Banking Corporation and heldsenior business management and risk management positionsfor Citicorp/Citibank in the US, Australia, Japan, Hong Kong,Philippines and Greece.
10 David Roberts, Chief Executive, Personal Financial Servicesbecame CEO, PFS in June 2001, when he was also appointed to the Barclays Group Executive Committee. Previously he was CEO, Business Banking. Since joining Barclays in 1983,David has also been Managing Director, Markets and Solutions,Corporate Banking, responsible for marketing, productmanagement and two pan-european asset finance businesses.
11 John Varley, Group Finance Director was appointed GroupFinance Director of Barclays PLC in November 2000. He joinedthe Group Executive Committee in September 1996 and becamean Executive Director of both Barclays PLC and Barclays Bank PLC in June 1998. Prior to this, he held positions including CEO,Retail Financial Services and Chairman of the Asset ManagementDivision. He was also Deputy Chief Executive of BZW’s EquityDivision and head of BZW’s offices in South East Asia.
12 David Weymouth, Chief Information Officer, joined theGroup Executive Committee in February 2000 when he wasappointed Chief Information Officer, responsible for overseeingtechnology capabilities across the Group. David has been with Barclays since 1977 and has held positions includingManaging Director, Service Provision for Retail and CorporateBanking. He was also Chief Operating Officer, CorporateBanking and UK Risk Management Director.
7 Naguib Kheraj, Chief Executive, Barclays Private Clients will beappointed to the Group Executive Committee on 31 March 2003,when he takes over from Bob Hunter. Naguib joined BarclaysCapital in 1997 as Chief Administrative Officer and he has servedas Global Head of Investment Banking and Deputy Chairman of BGI. Previously, he was at Robert Fleming where he wasCo-Head of Global Capital Markets and a member of the ExecutiveCommittee. Naguib has also held the posts of Managing Directorand Chief Financial Officer for Europe at Salomon Brothers.
8 Chris Lendrum, Group Executive Director, joined the Boardin 1998. He joined Barclays Bank in 1969 and assumed hiscurrent portfolio of responsibilities (including Group CorporateSocial Responsibility, Barclays Africa and South AmericanCorporate Banking) in 2003. He had previously been ChiefExecutive of Corporate Banking since 1998, prior to which he had held a number of senior positions within the Group.
15Barclays PLC Annual Report 2002
5 6
7 8
9
12
10
11
16 Barclays PLC Annual Report 2002
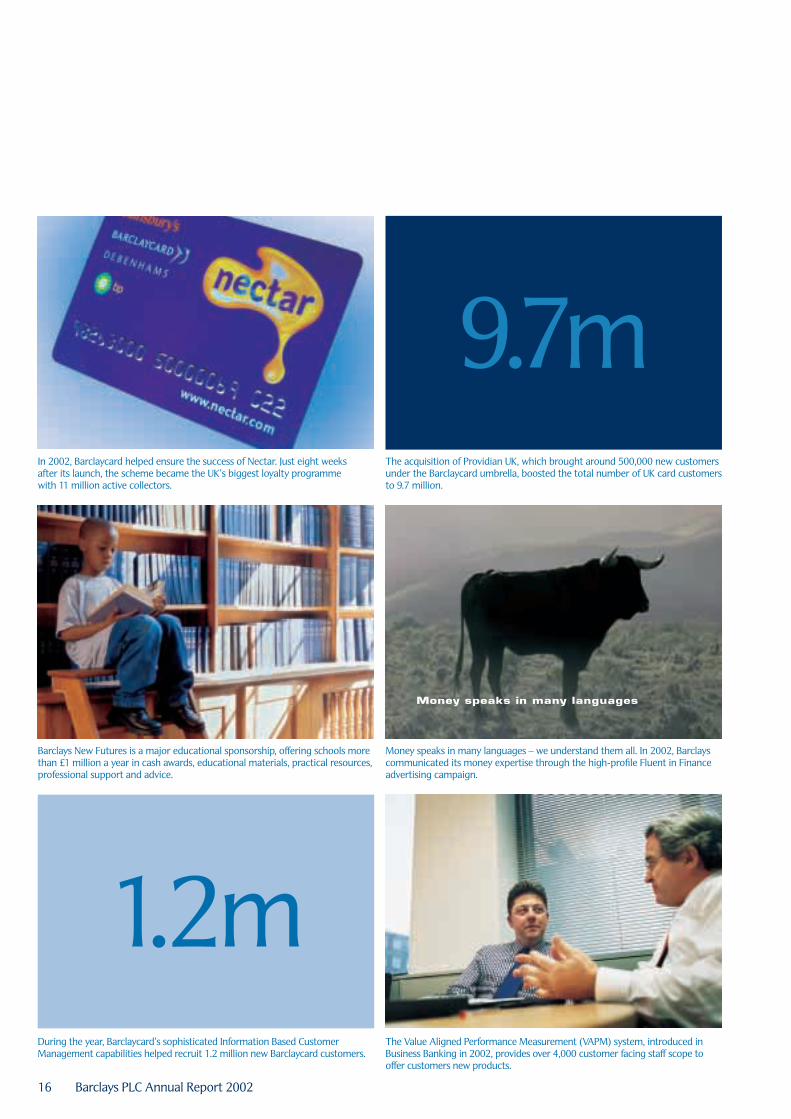
9.7mThe acquisition of Providian UK, which brought around 500,000 new customersunder the Barclaycard umbrella, boosted the total number of UK card customersto 9.7 million.
In 2002, Barclaycard helped ensure the success of Nectar. Just eight weeks after its launch, the scheme became the UK’s biggest loyalty programme with 11 million active collectors.
The Value Aligned Performance Measurement (VAPM) system, introduced inBusiness Banking in 2002, provides over 4,000 customer facing staff scope tooffer customers new products.
Barclays New Futures is a major educational sponsorship, offering schools morethan £1 million a year in cash awards, educational materials, practical resources,professional support and advice.
During the year, Barclaycard’s sophisticated Information Based CustomerManagement capabilities helped recruit 1.2 million new Barclaycard customers.
1.2m
Money speaks in many languages – we understand them all. In 2002, Barclayscommunicated its money expertise through the high-profile Fluent in Financeadvertising campaign.

17Barclays PLC Annual Report 2002
Corporate Social Responsibility 18
Making business sense 19CSR in the marketplace 20CSR in the workplace 22CSR in the community 26CSR in the environment 28
Directors and officers of Barclays PLC and Barclays Bank PLC 32
Directors’ report 35
Corporate governance report 37
Barclays report on remuneration 40
Accountability and Audit 52
Presentation of information 53
Risk management 54
2Section 2 – Impact
17Barclays PLC Annual Report 2002

18 Barclays PLC Annual Report 2002
Corporate Social Responsibility
Two youngsters who participated in Make a Difference Day along with Barclaysemployees across the world.
In 2002, Barclays global community investment totalled £32 million.
In 2002, more than 8,500 Barclays people across the world participated in Make a Difference Day.
MLE Plastic Recycling Limited has received funds from Salford Money Line, a community development finance institution supported by Barclays.
Kepplewray is a social enterprise offering activities and education for groups of disabled and able-bodied people. It was funded by The Charity Bank Limited,a community development finance institution supported by Barclays.
£32m
8,500Barclaycard is committed to supporting community football. Through theBarclaycard Free Kicks scheme, over £4 million will be invested in the game at grass roots level during the three-year run of the Premiership sponsorship.

Corporate Social ResponsibilityMaking business sense
In recent years, Barclays has published a review of its social and environmentalperformance separately from the AnnualReport. This year Barclays has included anaccount of Corporate Social Responsibility(CSR) performance as an integral part ofthe Annual Report. This reflects our beliefthat value is maximised when we meet the needs of shareholders, customers,employees, local communities and society.
The report that follows summarises how Barclays progressedits responsibilities to customers, employees, communities and the environment in 2002. As a result of feedback receivedon the 2001 Social and Environmental Report from investors,analysts, journalists, representatives of community andcampaign groups, customers and employees, we have tried to be more succinct and adopt a greater international focus. It is supported by a comprehensive online report.
The CSR report on pages 18 to 30 has been verified by SGS, a leading independent provider of management systemscertification, environmental report verification and ethicalauditing. The verification statement made by SGS is included in the Barclays online CSR report.
In February 2003, Barclays made CSR a key responsibility ofChris Lendrum, Group Executive Director, who is accountablefor leading Barclays CSR programme.
Barclays most significant CSR contribution derives from itsfinancial performance. For 2002, we will have paid £1.2 billionto shareholders in dividends, almost £1 billion in taxes andmore than £3.6 billion in employee salaries, while providingemployment to over 74,000 people and financial services tomillions of customers around the world.
In addition, progress was made in 2002 through directinvolvement in a wide range of CSR issues. For example,Barclays:
» provided access for 85,000 new customers, many of whom had not previously had a bank account, tomainstream banking through the Cash Card account;
» increased investment in the community to £32 million(2001: £31 million) and supported more than 16,000 UKemployees in their fundraising and volunteering activity;
» expanded the Barclays University (bu) programme to create new learning opportunities for employees;
» was the first UK high street bank to receive ISO 14001environmental certification; and
» launched the Barclays Global Diversity Council to ensurethat our commitment to equality and diversity is reflectedin our businesses worldwide.
As part of the FORGE Group consortium of UK financialservices companies, the bank contributed to a Government-sponsored project to develop CSR guidance for the financialservices sector. It also helped Business in the Communitydevelop a new corporate responsibility benchmarking index. A Barclays representative at the World Summit on SustainableDevelopment in South Africa worked to raise awareness ofinitiatives such as the FORGE guidelines and the United Nations Environmental Management and Reporting initiative.
Barclays is included in a number of external indices of sociallyresponsible companies, the Dow Jones Sustainability GroupIndex, the Dow Jones STOXX Sustainability Index and theFTSE4Good Indices.
CSR governanceAs an international financial services group with a largeworkforce and millions of customers, Barclays believes it has a significant impact on society and the environment bothdirectly through its own operations and indirectly through the provision of financial services and the purchase of goodsand services.
At Barclays, high-level requirements for the management ofsocial, ethical and environmental (SEE) topics are approved bythe Board and are set out in the Board governance standards.Specific topics covered in the SEE and other standards includehuman rights, labour standards, bribery and corruption,stakeholder dialogue, community investment, equality and diversity and environmental performance. The standardoutlines requirements placed on Barclays to develop and apply relevant policies and controls, and to provide the Boardwith sufficient information to demonstrate that SEE issues are identified, evaluated and managed consistently throughoutthe organisation.
19Barclays PLC Annual Report 2002

Corporate Social Responsibility
CSR in the marketplaceTackling financial exclusionBarclays recognises its responsibility to help bring financialservices within reach of individuals, businesses and socialenterprises, especially those in deprived areas, who find itdifficult to access mainstream banking.
This is being achieved in part through products such as the basic banking Cash Card account. We support local organisations such as credit unions and CommunityDevelopment Finance Institutions (CDFIs) and fund moneyadvice and financial literacy programmes.
Identifying prioritiesIn 2002, Barclays commissioned research into key stakeholders’views on its financial inclusion work. Consumer and communityorganisations, government agencies and academics wereamong those surveyed. The research also identified severalareas for improvement. Stakeholders said that all banks neededto make it easier for organisations to apply for funding offinancial inclusion initiatives, and were critical of the fact thatthey often have to submit new applications every year and sofind it difficult to implement longer-term programmes.
In response, the process for applying to Barclays for fundingwas simplified. In addition, Barclays has made several long-term commitments including providing funding over threeyears for the Community Development Finance Associationand support, for three years, for a city-wide credit union inLeicester.
Access to basic banking accountsThe number of customers with a Barclays Cash Card accountgrew by 85,000 to 202,000 in 2002. This basic no-credit account,launched in October 2000, is aimed at those who may havepreviously been unable to open a conventional accountbecause they lacked a financial track record and those worriedabout going into debt.
202,000Barclays customers now have a Cash Card account
Independent research of Cash Card customers conducted in 2002 revealed that 30% had no previous financial holdingseither with Barclays or another financial provider and 35% said they had previously applied for a current account andbeen refused.
20 Barclays PLC Annual Report 2002
Support for small businesses in deprived areas1 of the UKThe figures below refer to firms with a debit turnover of less than £1 million.
All Deprived % share % share % shareAs at 31st December 2002 Barclays areas 2002 2001 2000
Number of business current accounts 693,000 33,024 4.8 4.8 4.5% in overdraft 19.8 21.4 5.2 5.1 5.0Number of business deposit accounts 322,000 13,232 4.1 4.3 4.5Number of loans 127,000 5,014 3.9 4.0 4.3Loans and overdraft balances (£m) 9,300 247 2.7 3.0 3.0Deposit and current balances (£m) 12,200 442 3.6 3.6 3.7Number of business start-ups during 20022 77,850 4,380 5.6 10.0 11.1% of stock3 attributable to start-ups in 2002 11.2 13.3Ratio of savings to lending 1.31 1.79
1 ‘Deprived areas’ refers to areas identified by the Bank of England in its report Finance forSmall Businesses in Deprived Communities, November 2000. The term ‘small businesses’refers to businesses so defined by the British Bankers’ Association.
2 Number of business start-ups during 2002. The most significant change during 2002was the substantial fall in the number of start-up businesses in deprived areas. The totalnumber of start up businesses rose towards the end of 2002 on a national basis but thishas yet to occur in deprived areas.
3 The stock consists of all firms with a business current account that had a debit turnoverof less than £1 million during 2002 (annualised for those with less than a year’s history).
Trading position of 2001 start-up businesses
All DeprivedBarclays areas
% continuing to trade (end 2002) 70.8 41.5% of surviving firms with turnover in 2002 of:– £100,000+ 17.7 11.7– £1m+ 3.5 3.3
Support for personal customers in deprived areas of the UK
All Deprived % share % share As at 31st December 2002 Barclays areas 2002 2001
Number of current accounts 10,500,000 600,000 5.7 5.3Number of Cash Card accounts 202,000 27,000 13.4 12.4Cash cards as a % of all current accounts 1.9 4.5Unsecured loans and overdraft balances (£m) 8,000 533 6.6 6.6Mortgage lending (£m)1 57,800 1,937 3.3 3.5Deposit and current balances (£m) 51,700 1,894 3.7 3.7Ratio savings to lending 0.78 0.77
1 Mortgage lending excludes commercial lending.
All personal financial services offered by Barclays expanded in the deprived areas during2002. The number of Cash Card accounts continued to rise with increased penetration in deprived areas. Mortgage lending in deprived areas has increased such that the ratio of savings to lending in these areas is broadly similar to levels in the wider customer base.

Corporate Social Responsibility
21Barclays PLC Annual Report 2002
In anticipation of the launch of the Universal Banking services,Barclays made preparations to handle the demand for CashCard accounts. This involved developing new processes formanaging applications, enabling cash withdrawals at PostOffice™ counters and training branch teams. In addition,Barclays committed to paying its share of the £180 millionbeing provided by the major UK banks over five years to helpfinance the new Post Office™ card account. Our contribution is £30 million over five years.
Affordable creditMaking affordable credit available to individuals and smallbusinesses is a key part of our approach to promoting financial inclusion.
In 2002, we increased our support for credit unions with acontribution of £173,000. Barclays funded the pilot introductionof PEARLS financial monitoring software in nine credit unionsin England, Scotland and Wales at a cost of more than £100,000.PEARLS helps credit unions measure their financial performanceand has played an important part in the expansion of the creditunion movement worldwide. Early signs suggest that the pilotis going well, and Barclays will seek to extend its support forthe project in 2003.
£1.5mof agreed subsidised lending to the CDFI sector
Barclays currently supports nine CDFIs in deprived communitiesin the UK. CDFIs act as ‘lender of last resort’ to local businesses,social enterprises and individuals. In 2002, we agreed subsidisedlending to the CDFI sector of £1.5 million and made grants of £122,000, bringing our total commitment to £2.7 million in subsidised lending and £287,000 in grants over recent years. During 2002, Barclays worked with the New EconomicsFoundation in a pilot study to determine how data on localeconomies can help promote economic regeneration. Thiswork is due to be published during 2003.
Improving access for disabled customersBarclays equality and diversity charter, signed by allmembers of the Group’s Executive Committee in 2001,embraces all customers.
In 2002, we invested a further £7.7 million in an ongoingproject to improve access to our branches for disabledcustomers by introducing facilities such as wheelchairaccess, power-assisted doors and hearing induction loops.We plan to make similar improvements to more branches in 2003.
A focus group of disabled customers was established to help Barclays understand how better to meet their needs. In late 2002, mystery shopping of branches and thetelephone banking service was used to assess employees’general attitude and demeanour towards disabled people.The results have identified a number of employee trainingneeds for customer facing staff.
Barclays also made it easier for visually impaired customersto access information by improving the online orderingsystem for product leaflets in alternative formats (there is also a telephone ordering line). The booklet that highlightsservices for disabled customers, Disabled customers:Making our services available, is published in standardprint, Braille, large print and audiotape and can be orderedonline as well as by post, over the telephone and in person at branches. The Annual Review and SummaryFinancial Statement 2002 is available in alternative formats upon request.

Corporate Social Responsibility
CSR in the workplaceRaising the gameIn 2002, Barclays continued to build a high-performanceculture by launching a new Performance Development system to help employees fulfil their potential.
Performance Development is designed to enable Barclays to recognise and reward top performance. It encouragesdialogue between employees and their managers focusing on both results and, importantly, on the values and standardssummarised in the Barclays Behaviours, also launched in 2002.The new approach was rolled out across UK operations in2002, and is now being introduced worldwide.
Recognising the importance of developing the next generationof Barclays leaders, a ‘talent model’ was created to helpmanagers spot employees with particular potential. In addition,panels of representatives from different businesses are beingset up to oversee efforts to develop the organisation’s mosttalented people.
Rewards and benefitsBarclays aims to provide rewards and benefits that attract andretain talented people and stimulate high performance.
In March 2002, eligible UK employees received discretionarybonus payments under the Performance Incentive Plan (PIP),introduced in 2001. PIP bonuses are linked to employees’individual achievements, as well as the performance of theirbusiness and that of Barclays as a whole. They help alignemployees’ interests with those of shareholders, ensuring that high performance is rewarded accordingly.
35,000UK employees have signed up to the ShareSave scheme
Barclays is committed to helping employees benefit from the Group’s success through share schemes. In 2002, Barclaysrepeated the offer to join the ShareSave scheme: more than35,000 UK employees signed up and more than 70% of eligibleemployees now participate. ShareSave is one of the mostpopular schemes of its kind in the UK.
Advice and financial literacyLast year, Barclays provided £2.3 million for independentmoney advice services and financial education. This includedthe first of two years of funding for the Birmingham Settlement’spilot scheme offering local citizens free and independentinformation about bank accounts, savings, mortgages and investments.
Promoting financial literacy is an increasing priority for Barclays.In 2002, we agreed a three-year sponsorship of the uprojectwhich runs summer activities for school leavers and helps themmake informed decisions about their future including financialissues. More than 10,000 young people participated.
£2.3mBarclays provided £2.3 million for independent money advice services and financial education
More than 7,000 budding entrepreneurs were targeted to attendStart Right seminars run by Barclays in conjunction with theNational Federation of Enterprise Agencies. During 2002, 353 local seminars were held for people in the early stages of running their own business or considering self-employment.Thirty-four (9%) were held in deprived areas, up from thirteen(3%) in 2001.
22 Barclays PLC Annual Report 2002
Total funding for free independent money advice support
£ Th
ousa
nds
1,000
500
1,500
2,000
2,500
0
2002
2,300
1999
1,050
2000
1,300
2001
1,800
1998
870

Corporate Social Responsibility
In 2002, ShareSave was introduced to the Barclays operation in Spain for the first time, and more than two-thirds of eligibleemployees joined.
A new share scheme, the Share Incentive Plan (SIP), wasintroduced in 2002 in line with the UK Government’s policy of encouraging employee share ownership. The SIP provideseligible UK employees the opportunity to buy Barclays sharesfrom pre-tax pay. Approximately 7,000 employees have signed up.
During 2002, the Group’s range of benefits in the UK wasaugmented with the launch of a new childcare payment schemeunder which eligible employees with children can choose tohave childcare costs deducted from their salary and benefitfrom exemption from National Insurance Contributions. Inaddition, Barclays began an in-depth review of its parentalleave and flexible working policies, and is due to report theoutcomes in 2003.
Opportunities for allBarclays values people from all backgrounds and is committedto becoming a more inclusive organisation with a workforcethat reflects the markets it serves.
22%The target for representation of women in the UK senior executive population by the end of 2005
The organisation monitors its performance against key equalityand diversity objectives. In 2002, good progress was madeagainst the goal of having 3% of UK senior executives fromethnic minorities by the end of 2005, moving to 2.2% in 2002 from 1.1% in 2001. However, the goal of doubling therepresentation of women in the UK senior executive populationto 22% by the end of 2005 is proving more challenging. By theend of September 2002, the figure stood at 11.8%, up slightlyfrom 11.7% at the end of 2001. Barclays remains focused onachieving its equality and diversity objectives.
Progress in equality and diversity is also reflected in regular globalemployee opinion surveys. In 2002, 69% of employees surveyed byindependent research firm ISR agreed that Barclays managementsupports equal opportunities (compared with a norm of 62% for UK financial service companies in which ISR has carried outsimilar research).
During 2002, training was provided for senior executives andmanagers in the UK to raise their awareness of equality anddiversity issues and build a more inclusive culture. Equality and diversity training was also undertaken for branch andcontact centre staff, including programmes to help employeesunderstand the needs of customers of all backgrounds.
Barclays policy requires that equal pay is awarded for work ofequal value, regardless of factors such as gender, full or part-time status, race, age or disability. A recent review of salarylevels across a sample of Barclays UK operations indicated thatthe principle of equal pay for work of equal value is adhered to in practice.
Barclays launched recruitment initiatives to attract people with disabilities in Sunderland and ethnic minorities in Bradford;this will be extended to other areas in 2003. In addition, Barclaysheld career development workshops for ethnic minorityemployees and for employees with disabilities.
23Barclays PLC Annual Report 2002
Wider equality and diversity issuesBarclays is committed to being a leader in equality anddiversity practices in everything it does for customers,shareholders and the community, as well as for employees.This commitment is set out in an equality and diversitycharter signed by all members of the Executive Committeein 2001.
During 2002, equality and diversity programmes werelaunched at Barclays Capital in the US, and in Barclaysbusinesses in France, Spain, Germany, Ghana and Zambia.
Barclays Global Diversity Council, chaired by GroupExecutive Director Chris Lendrum, was launched in 2002and brings together senior representatives from across theGroup who are accountable for driving and monitoringequality and diversity progress. The Council reports to theExecutive Committee and the Board through its chairman.
The bank’s equality and diversity work in 2003 will focus onfurther culture change, meeting the needs of all customersand the continuing roll-out of equality and diversityprinciples to non-UK operations.

24 Barclays PLC Annual Report 2002
Corporate Social Responsibility
In 2002, Barclays made it possible for UK employees to workfor Barclays beyond the normal retirement age of 60, andbegan actively recruiting people over the age of 60. As a result,170 people over the age of 60 are now employed in the UK. In acknowledgement of the Group’s activity in this area, Barclaysbecame a Government Age Champion.
Early in 2002, Barclays launched the Spectrum network for gay, lesbian, bi-sexual and transgender employees. The networkprovides support for employees and opportunities to becomeinvolved in community fundraising.
In 2002, Barclays achieved a gold standard for race equality inRace for Opportunity benchmarking, and for gender equalityin Opportunity Now benchmarking.
Training and developmentAs a service business Barclays is heavily reliant on theknowledge and expertise of its people. As we strive to improveour performance and to keep pace with changing customerrequirements, we recognise the need to support employeesthrough training. We also believe we have a duty to provide the professional and personal development opportunities vital to long-term employability and job satisfaction.
£42mwas spent on training and development in 2002
Around £42 million (2001: £57 million) was spent on training and development in 2002. Cost efficiencies wereachieved through the ongoing centralisation of separatetraining functions, many of which were duplicating activity and effort, into a single function, and the development of more cost-effective delivery methods such as online computer-based training. As a result, Barclays believes that, while overallspending on training will decrease between now and 2006, the volume and relevance of training should continue toincrease year on year.
In 2002, Barclays corporate university, Barclays University (bu),continued to expand. The bu website provides access to onlinelearning, self-assessment tools and a facility to order resourcesfrom the bu library from where more than 29,000 library loanswere made in 2002.
In addition, bu opened a new ‘metro centre’. There are nowfour centres nationwide offering access to learning materials,computer-based training and learning advisors who can
provide coaching and advice. In partnership with the learndirectinitiative, bu opened smaller local learning facilities in 141learndirect centres.
bu also gave UK employees the chance to apply for grants forup to £150 to fund their personal development. Some 8,700employees took up this offer.
PartnershipA spirit of partnership characterises our relationship withUNIFI, the trade union that represents many Barclays UKemployees. This partnership approach is often held up by UNIFI as a model of progressive employee relations practice.UNIFI is consulted on all plans for business change whichimpacts staff within the areas it covers and in 2002, UNIFIhelped shape the new Performance Development system.
During the year, 77 UNIFI representatives and line managersundertook training to help them work together to putpartnership into practice in the resolution of local issues. Under a scheme developed and run jointly by UNIFI andBarclays, 101 UNIFI representatives received official accreditation.This enables them to represent colleagues at disciplinary andgrievance hearings and to involve colleagues in UNIFI’s work.
Health and safetyIn 2002, we extended our support for employees in Africa withHIV/AIDS. Employees in Botswana and Zambia are now offeredfree, voluntary and confidential HIV/AIDS testing. Free medicaltreatment and counselling is offered to staff and their families.In the bank’s other sub-Saharan African operations, Barclays isrolling out employee education and awareness programmes.
Barclays remains concerned about the level of absence throughsickness among UK employees and will continue its efforts toreduce absence levels.
Human rightsIn 2002, Barclays initiated the development of a formalstatement of human rights principles to inform employmentand sourcing practices worldwide. The principles reflect thehuman rights standards enshrined in the UN UniversalDeclaration of Human Rights and the International LabourOrganisation conventions, and cover issues such as minimumworking age, health and safety, working hours and discrimination.We are developing a system to monitor our compliance withthese principles worldwide.

Corporate Social Responsibility
25Barclays PLC Annual Report 2002
More than 70% of eligible employees participate in Barclays ShareSave scheme.
During 2002, a training programme was delivered to senior executives andmanagers in the UK to raise their awareness of equality and diversity issues and build a more inclusive culture.
Barclays lent its support to a three-year partnership with Age Concern to fund Web Aware, a programme giving older people access to IT, the internetand e-mail.
Barclays Global Investors managed £28.3 billion of institutional funds accordingto environmental or social criteria specified by clients.
Barclays believes value is created and maximised when it meets the needs not only of shareholders, but also of customers, employees, local communitiesand society as a whole.
70%
£28.3bn
In 2002, Barclays made it possible for UK employees to work for the companybeyond the normal retirement age of 60, and began actively recruiting peopleover the age of 60.

Corporate Social Responsibility
CSR in the communityCommitted to communitiesBarclays is committed to playing a leading role in thecommunities it serves. In 2002, our global communityinvestment totalled £32 million, including £30 million in the UK which makes Barclays one of the country’s topcorporate contributors (based on figures from the PerCentclub). The Group invested 1% of Barclays UK and Africa pre-tax profit in community programmes.
Community investment is channelled into five key areas:education, people with disabilities, social inclusion, the arts and the environment. During 2002, 880 UK projects receivedBarclays support through charitable donations of £11 million.
£11mIn 2002, Barclays community investment included charitable donations of £11 million
Barclays commitment extends beyond simply making donations.Through a range of employee involvement schemes, staff areencouraged to give their time, energy and expertise to localcommunities. In 2002, 16,113 UK employees received supportfor their volunteering and fundraising, an increase of 58% on 2001.
Our support for employees takes many forms, from matchedfunding to paid time off work, in order to participate incommunity activity.
Making a differenceThe enthusiasm of Barclays people for community involvementwas unmistakable on Make a Difference Day (MADD). Managedby Community Service Volunteers and sponsored by Barclays,MADD is the UK’s single biggest day of volunteering action. In 2002, more than 8,500 Barclays people across the worldparticipated in MADD.
Many of our employees in Africa took part in MADD for the first time in 2002. They worked on activities includingrenovating schools, orphanages and local hospitals, takingdisadvantaged and disabled children on outings, repairingroads and adding safety features such as pedestrian crossingsand speed bumps, and clearing parks and play areas.
26 Barclays PLC Annual Report 2002
Barclays employees2002 2001 2000
UK employment statistics1
Total employees 64,018 64,143 57,000Average length of service (years) 11 11 11Percentage with parental responsibilities 38.5% 40% – Percentage working part time 24.5% 24% 23%
Women in Barclays1,2
Percentage of all employees 67.0% 67.0% 67.3%Percentage of senior managers3 29.7% 27.6% 26.3%Percentage of senior executives 11.8% 11.7% 10.3%
Ethnic minorities in Barclays1,2
Percentage of all employees 7.7% 7.2% 6.7%Percentage of senior managers3 3.5% 3.2% 2.6%Percentage of senior executives 2.2% 1.1% 0.0%
Age profile1,2
Employees aged under 24 14.7% 14.7% 9.4%Employees aged 25-29 12.5% 13.6% 12.9%Employees aged 30-49 62.9% 61.9% 65.7%Employees aged 50+ 9.9% 9.8% 11.9%
Training1
Total training budget £42.2m £57m £70mFace-to-face training days delivered 99,984 – – Distance learning training days 20,340 – –
Pensions2
Barclays Bank UK Retirement Fund active members 65,122 63,250 55,000Current pensioners 35,049 34,185 33,000
1 Staff numbers are UK permanent staff only. These figures differ from those givenelsewhere in the Annual Report which are based on full time equivalent.
2 Data to 30th September 2002. 3 Senior managers include all B5 up to SX and equivalents
Women employees
All roles67%
Senior managers29.7%
Senior executives11.8%

Corporate Social Responsibility
Every year, Barclays recognises the efforts of employeesinvolved in their communities through the Chairman’s Awardsfor Community and Diversity. Entries are received from all overthe world, and finalists are invited to an awards ceremony inLondon. Winners, who in 2002 came from the UK and as farafield as Zimbabwe and Mauritius; each receive a cheque for£1,000 for their chosen charity.
Investing in new futuresBarclays donates money to support a range of communityinitiatives. The Group’s activities in education serve as anexample of this community investment.
The Barclays New Futures scheme provides cash awards,practical resources and professional advice to help schools setup and run community projects that encourage students todevelop citizenship skills. We are investing £10 million over tenyears in this scheme. In 2002, 138 schools received awards and,since the scheme’s 1995 launch, more than 800 schools havereceived funding for projects involving 100,000 students andbenefiting more than 500,000 people.
£10mThe amount being invested over 10 years in the Barclays New Futures scheme
For example in 2002, we granted £20,000 to Tiverton HighSchool in Devon for students to develop a support programmefor families going through divorces and break-ups. Studentsworked together on activities to help them come to terms withchanges in their home life. To provide advice and support forthose outside the school, they created and ran workshops forchildren in local primary schools and built a website offeringadvice to parents.
In the US, Barclays Global Investors continued to supportseveral educational programmes for underprivileged youngpeople in San Francisco, and Barclays Capital employeesvolunteered as mentors to inner-city school pupils in New York. Barclays Africa funded HIV/AIDS awareness programmesfor both staff and customers, and initiatives to improvechildren’s access to education.
Raising awarenessResearch undertaken in 2002 confirmed that a key expectationof the public, including our customers, is that Barclays contributesto its local communities. However, many remained unaware ofour activities in this area.
To address this, the community programme was outlined in abrochure available in all branches. A full-page advert was placedin national newspapers to thank Barclays staff for their activityin the community and to alert the general public to the scale of Barclays community involvement. In addition, transactionreceipts, monthly statements and messages on cash machinespromoted aspects of the community programme.
27Barclays PLC Annual Report 2002
Working with communities2002 2001 2000 1999
Total global community contribution £32.3m £31.1m £26.3m £20.9mDirect donations to UK charities £11.1m £9.6m £8.9m £5.8m
Employee involvement in the UKAmount raised by employees through ‘£ for £’ match-funded activities £7.4m £5.9m £6.8m £8.2mActivities match funded 7,615 6,663 7,107 6,877Employee volunteering groups 1,309 631 70 #Employee volunteers 10,051 5,102 432 #Bank hours given to support employee volunteers 10,948 6,195 # #Employees receiving paid time off for volunteering 1,409 1,175 # #Total employees and pensioners receiving Barclays support for fundraising or volunteering 16,113 10,200 4,202 #UK charities/voluntary organisations supported by Barclays programmes1 5,882 5,293 # #Employees giving through ‘Pennies from Heaven’ scheme 6,271 6,000 # #Employees and pensioners giving through payroll 4,580 3,383 # #
1 Figures include local branches of national charities as separate organisations.# = Figure not available

Corporate Social Responsibility
Indirect impactsCommercial lendingThroughout 2002, Barclays maintained its focus on managingthe environmental impact of its commercial lending.
Barclays is aware of the sensitivities surrounding certain typesof projects (for example, mining or hydroelectric schemes),and will lend only to such projects when we are satisfied thatenvironmental impacts are being managed in accordance withstringent environmental criteria (attainment of World Bankstandards is generally the minimum requirement). The Group’sEnvironmental Impact Assessment Policy clarifies Barclaysapproach to ensuring project finance proposals are rigorouslyassessed to identify, quantify and, where appropriate, mitigatethe environmental risks.
In 2002, the Environmental Risk Management Unit (ERMU)continued to work with the Group’s credit teams worldwide to raise their awareness of the environmental considerations to be factored into lending decisions. Screening of commercialland offered as loan collateral for potential contamination is akey component of the company’s approach, and heightenedawareness of this and other environmental issues resulted in a 19% increase in the number of lending proposals referred to ERMU. While the majority came from the UK and mainlandEurope, the number of cases referred from Barclays businessesin Africa was twice that in 2001.
19%The increase in the number of lending proposals referred to the Environmental Risk Management Unit
The standard of Barclays management of the environmentalimpact of its commercial lending was recognised independentlyby fund managers ISIS (formerly Friends Ivory and Sime) whoexamined the environmental credit risk assessment policiesand procedures of ten European banks.
Product stewardshipTo encourage the use of products and services that contributeto environmental protection, Barclays offered:
» personal customers access to the Legal & General Ethical Fund and HomeFile Energy Rating surveys with their property surveys;
CSR in the environmentManaging our environmental impactAll stakeholders stand to gain from the company’s fulfilment of its environmental responsibilities. In 20 years of commitmentto environmental improvement, Barclays has expanded itsenvironmental programme. During 2002, our environmentalmanagement system (EMS), introduced in 1999, was extendedto cover more than 80% of Barclays operations worldwide.
During 2002, Barclays gained accredited certification of the central components of the EMS to the internationalenvironmental management system standard ISO 14001, andbegan implementing the EMS in our main businesses in Africa.
ISO14001Barclays was the first UK high street bank to receive ISO 14001 environmental certification
Barclays progress was reflected in the improvement in its Business in the Environment Index of Corporate EnvironmentalEngagement ranking among financial services sector participantsfrom 16th out of 37 in 2001 to 9th out of 39 in 2002.
Governance and complianceBoard level responsibility for environmental managementpolicy and performance rests with the Chief Executive Officer.Representatives from the major business areas and supportfunctions make up an Environmental Steering Group chaired by Gary Dibb, Chief Administrative Officer, who is the responsible Executive for environmental management.
In 2002, Barclays environmental policy statement was revisedand adopted by the Group Governance and Control Committee(see page 56), and distributed to our UK and key European and African operations.
Barclays Group Environmental Management team maintainsregisters of environmental legislation for all countries wherethe EMS is operational. During 2002, we introduced improvedcontrols and checks to track compliance with this legislation.
There are no environmental prosecutions to report for 2002.
28 Barclays PLC Annual Report 2002

Corporate Social Responsibility
» business customers an Environmental Loan SupportScheme and access to the Barclays EMS trainingprogramme; and
» employees an ethical investment option provided by ISIS fund managers in connection with the Barclays UK Retirement Fund.
In addition, Barclays Global Investors managed £28.3 billion of institutional funds according to environmental or socialcriteria specified by clients.
SuppliersBarclays spends more than £2 billion a year on externalproducts and services. During 2002, Barclays continued to use environmental, social and ethical criteria to judge potentialsuppliers as part of its standard tendering process in the UK.This involves issuing questionnaires on environmental, socialand ethical issues to those bidding for contracts.
For outsourcing contracts, Barclays Group EnvironmentalManagement team works closely with proposed outsourcingpartners to address environmental issues.
During 2002, Barclays Africa began work to makeenvironmental issues a core part of its sourcing decisions.
Direct impactsOur size means that we have a significant direct impact on the environment through the consumption of energy andother resources. In 2002, we made further progress towardsmeeting our environmental targets.
10.2%The reduction in Barclays CO2 emissions in 2002
Carbon dioxide (CO2) is one of the primary agents of globalclimate change. Originating from consumption of electricityand gas, as well as from business travel, it is one of thecompany’s most significant direct environmental impacts.During the year, Barclays reduced its UK CO2 emissions by10.2%, and was the only financial services organisation tovolunteer for the UK Government Carbon Dioxide EmissionsTrading Scheme. Barclays remains committed to a continualreduction of its global CO2 emissions.
29Barclays PLC Annual Report 2002
Progress in reducing water use, paper consumption and waste generation in the UK was achieved. Our UK paper use reduction targets for 2002 were met. Furthermore, our disposal of redundant electronic equipment in the UK no longer leads to land-filling.
For the first time, environmental targets were agreed forBarclays Private Clients businesses in France, Spain andPortugal for 2003 onwards. In addition, we are developing an action plan to measure significant direct environmentalimpacts in our key African operations.
Environmental prioritiesInevitably there remains more to do as we strive for continuousenvironmental improvement. Our focus in 2003 will be onperformance improvement rather than systems development,and on continuing to extend the geographical reach of ourenvironmental programme.
This description of Barclays environmental programme and the corresponding data on page 30 have been put togetherwith reference to guidelines produced by the Global ReportingInitiative, an independent global institution set up to develop a generally accepted framework for sustainability reporting.
www.barclays.co.uk/socialresponsibility
For a full account of Barclays corporate social responsibilityperformance in 2002
A short printed report on Barclays corporate socialresponsibility performance in 2002 is available bytelephoning +44 (0)207 699 4003
Audio cassette, Braille and large print versions of the printed report are available by telephoning the BarclaysInformation line on 0800 400 100, via TextDirect, ifappropriate or by e-mailing a request for your preferredformat to [email protected]

30 Barclays PLC Annual Report 2002
LendingUnit of
measurement 2002 2001 2000
Responsible lendingUK land valuation cases reviewed No. 5,663 6,180 6,138UK land valuation cases subjected to further review % 32 32 25Additional case referrals (global) No. 512 430 457
Environmental loan support schemeNumber of loans No. 38 91 105Value of loans £m 6 15 17Total project cost £m 13 25 29
Ethical investmentUnit of
measurement 2002 2001 2000
Barclays pension fund: UK retirement ethical fund – Additional Voluntary Contributions £000 364 305 71Barclays Global Investors: Total invested in ethical funds £bn 28 38 28
Direct impactsUnit of Progress
measurement 2002 2001 2000 against target
Carbon dioxide (CO2) emissionsTotal energy use and travel: UK Tonnes CO2 170,743 190,192 230,627Electricity and gas: UK KWh/m2 297 295 320 2005 target: on-trackBusiness travel: UK Grammes CO2/km 144 160 151 2002 target: achievedEnergy use and travel: Barclays Private Clients: France, Spain and Portugal (BPC: F, S and P) Tonnes CO2 5,213* # #
Water consumptionUK CuM/m2 0.56 0.59 0.57 2005 target: off-trackBPC: F, S and P CuM/m2 0.98* # #
Paper consumptionMarketing and advertising, PFS paper use: UK Tonnes 3,643* 5,319* # 2002 target: achievedInternal publications paper use: UK Tonnes 202 338 # 2002 target: achievedA4 copier paper: UK Tonnes 2,571 2,637 # 2005 target: on-trackA4 copier paper: BPC: F, S and P Tonnes 212 # #
Waste generationWaste paper recycled: UK Tonnes 4,976 † †Waste paper recycled: BPC: F, S and P Tonnes 215 114 #Redundant Electronic Equipment (REE): UK– Items sold or donated % 64 58 # 2002 target: achieved– Items recycled or disposed % 36 42 #– Of items recycled or disposed: reused within industry % 93 87 # 2002 target: achieved
Key* = Figure includes some estimation# = Figure not available† = Figure previously reported not a direct comparison to 2002
Corporate Social Responsibility
UK CO2 conversion factors taken from DEFRA guidelines for Environmental Reporting atwww.defra.gov.uk/environment/envrp/gas/05.htm
Electricity: 1KW = 0.43kg CO2; Gas: 1KW = 0.19kg CO2; Rail travel: 1km = 0.06kg CO2; Short-haul air: 1km = 0.18kg CO2; Long-haul air: 1km = 0.11kg CO2
BPC CO2 conversion factors for electricity taken from “The GHG Indicator: UNEP Guidelines forCalculating Greenhouse Gas Emissions for Businesses and Non-Commercial Organisations” ©2000.
France: 1KW = 0.040kg CO2; Spain: 1KW = 0.322kg CO2; Portugal: 1KW = 0.384kg CO2.

31Barclays PLC Annual Report 2002
Directors and officers of Barclays PLC and Barclays Bank PLC 32
Directors’ report 35
Corporate governance report 37
Barclays report on remuneration 40
Accountability and Audit 52
Presentation of information 53
Risk management 54
Risk management and control – overview 54Credit risk management 57Analysis of loans and advances 59Analysis of loans and advances – further information 61Country risk 65Potential credit risk lendings 66Provisions for bad and doubtful debts 68Market risk management 74Disclosures about certain trading activities includingnon-exchange traded contracts 77Derivatives 79Treasury asset and liability management 81Management of other risks 85
2Section 2 – Impactcontinued

Directors and officers
Directors and officers of Barclays PLC andBarclays Bank PLC1 ChairmanSir Peter Middleton GCB
Sir Peter Middleton GCB (age 68) was appointed as Chairmanat the 1999 AGM. Sir Peter joined the Board in 1991 as DeputyChairman and Chairman of BZW. This followed a long career inHM Treasury where he was Permanent Secretary from 1983 to1991. He became Chairman of Barclays Capital following thereorganisation of BZW in 1997. In 1998, he relinquished hisexecutive responsibilities as Deputy Chairman and Chairman ofBarclays Capital but remained a non-executive Director. Heresumed executive responsibilities when he was appointedGroup Chief Executive and reappointed Group DeputyChairman in 1998. He stepped down as Group Chief Executivefollowing the appointment of Matthew Barrett in 1999. He isDeputy Chairman of United Utilities PLC, Chancellor ofSheffield University, a Director of the International MonetaryConference and a member of the International Advisory Panelof the Monetary Authority of Singapore. He is Chairman of theBoard Nominations and Board Risk Committees.
2 Group Chief ExecutiveMatthew William Barrett
Matthew William Barrett (age 58) was appointed Group ChiefExecutive and joined the Board in 1999. He joined Barclaysfrom Bank of Montreal where he was Chairman and ChiefExecutive Officer. He joined the Bank of Montreal in 1962 andduring his career held a variety of senior managementpositions in different areas within the Bank, including RetailBanking, International Banking and Treasury. He was appointedChief Operating Officer in 1987, Chief Executive Officer in 1989and elected Chairman of the Board in 1990. In 1994, hebecame an Officer of the Order of Canada, the country’shighest civilian honour, and in 1995 he was awarded the title ofCanada’s Outstanding CEO of the Year. He has been a non-executive Director of The Molson Companies Limited since1992 and is a governor of the London Business School.
3 Group Executive DirectorChristopher John Lendrum
Christopher John Lendrum (age 56) joined the Board in 1998.He joined Barclays Bank in 1969 and assumed his currentportfolio of responsibilities (including Group Corporate SocialResponsibility, Barclays Africa and South American CorporateBanking) in 2003. He had previously been Chief Executive ofCorporate Banking since 1998, prior to which he had held anumber of senior positions within the Group. These includedDeputy Managing Director of Barclays Banking Division.Regional Director, North London and Executive Vice President,Barclays Bank New York.
4 Group Finance DirectorJohn Silvester Varley
John Silvester Varley (age 46) joined the Board in 1998 and was appointed Group Finance Director on 9th November 2000.He joined Barclays Merchant Bank in 1982 and was ChiefExecutive of Retail Financial Services from April 1998 toOctober 2000, having previously been Chairman of the AssetManagement Division since 1995.
1 2
3 4
5
7
6
8
9 10
11
13
12
32 Barclays PLC Annual Report 2002

Directors and officers
Non-executive Directors
5 Deputy ChairmanSir Brian Garton Jenkins GBE
Sir Brian Garton Jenkins GBE (age 67) joined the Board in 2000as a Deputy Chairman on completion of the acquisition ofWoolwich plc. He joined the Woolwich’s Board as a non-executive Director in 1994 and was appointed DeputyChairman in 1995. He became Chairman later that year andoversaw the conversion of The Woolwich Building Society to a public limited company in 1997. A former senior partner ofCoopers & Lybrand Chartered Accountants, Sir Brian hasserved as Lord Mayor of London, President of the Institute ofChartered Accountants in England & Wales and the Presidentof the British Computer Society. He is also Chairman of theCharities Aid Foundation. He is a member of the Board Audit,Board Remuneration, Board Nominations and Board RiskCommittees.
6 Thomas David Guy ArculusThomas David Guy Arculus (age 56) joined the Board in 1997.He is Chairman of Severn Trent plc, the water and waste groupand is also Chairman of the UK Government’s Better RegulationTask Force. Other roles include Chairman of Earls Court &Olympia Group Limited and a delegate of Oxford UniversityPress. His previous positions include Chairman of IPC Mediaand Group Managing Director of EMAP plc. He is a member ofthe Board Remuneration and Board Nominations Committees.
7 Hilary Mary Cropper CBEHilary Mary Cropper CBE (age 62) joined the Board in 1998.She is Chairman of Xansa PLC, a leading supplier of businessenabling technology services. She is a member of the FinancialReporting Council, an external adviser to the Home CivilService Senior Appointments Selection Committee and amember of the Government’s National Employment Panel. She is a member of the Board Risk Committee.
8 Professor Sandra DawsonProfessor Sandra Dawson (age 56) has been appointed to theBoard from 1st March 2003. She is currently KPMG Professorof Management Studies at the University of Cambridge,Director of the Judge Institute of Management and Master ofSidney Sussex College, Cambridge. Professor Dawson has helda range of non-executive posts in other organisations includingRand Europe (UK), the Society for the Advancement ofManagement Studies, Fleming Claverhouse Investment Trust,and Riverside Mental Health Trust. She was also a member ofthe Senior Salaries Review Body.
9 Sir Nigel MobbsSir Nigel Mobbs (age 65) joined the Board in 1979. He isChairman of Slough Estates plc and Bovis Homes Group PLCand a Director of Howard de Walden Estates. He is also Lord-Lieutenant of Buckinghamshire. He is a member of the BoardAudit, Board Remuneration and Board NominationsCommittees. He will be retiring at the 2003 AGM.
10 Sir Nigel Rudd DLSir Nigel Rudd DL (age 56) joined the Board in 1996. He isnon-executive Chairman of Kidde PLC, Pilkington PLC andPendragon PLC and Deputy Chairman of The Boots CompanyPLC. He is Chairman of the Board Remuneration Committeeand a member of the Board Nominations Committee.
11 Stephen George Russell Stephen George Russell (age 57) joined the Board in October2000 on completion of the acquisition of Woolwich plc. Hejoined Woolwich plc’s board as a non-executive Director in1998. He was Managing Director of Boots The Chemists Ltdfrom 1995 and joint Group Managing Director of The BootsCompany PLC from 1997 until he became Chief Executive in2000. He has succeeded Sir Nigel Mobbs as Chairman of theBoard Audit Committee and is a member of the Board Risk Committee.
12 Graham Martyn WallaceGraham Martyn Wallace (age 54) joined the Board in April2001. He was appointed Chief Executive of Cable and Wirelessplc in February 1999. He joined Cable and Wireless in 1997 asChief Executive of Cable and Wireless Communications plc andwas appointed a Director of Cable and Wireless plc in 1998.Before joining Cable and Wireless, he held a number of Boardpositions at Granada Group. He is a member of the BoardRemuneration and Nominations Committees.
13 Dr Jürgen ZechDr Jürgen Zech (age 63) joined the Board on 30th July 2002.Until 2001, Dr Zech was Chief Executive of Gerling-Konzern, the general insurance arm of Gerling. Before joining Gerling he held a number of executive positions in German insurancecompanies. The last was as Chief Executive of Cologne, Re, the oldest reinsurance company in the world. He now holds anumber of non-executive positions, including being a Directorof Misys PLC and Partner, Re Limited. He is a member of theBoard Audit Committee.
Barclays considers that each of its non-executive Directors areindependent within the meaning of the Combined Code asthey are independent of management and free from anybusiness or other relationship which could materially interferewith the exercise of their independent judgement. See alsopage 38.
33Barclays PLC Annual Report 2002

Directors and officers
Group Executive Committee members Appointed
Matthew Barrett Group Chief Executive 1999
Roger Davis Chief Executive, Business Banking 2003
Bob Diamond Chief Executive, Barclays Capital 1997
Gary Dibb Chief Administrative Officer 2000
Gary Hoffman Chief Executive, Barclaycard 2001
Bob Hunter Chief Executive, Barclays Private Clients(until 31st March 2003) 1999
Naguib Kheraj Chief Executive,Barclays Private Clients(from 31st March 2003) 2003
Chris Lendrum Group Executive Director 1996
Robert Nimmo Group Risk Director 2002
David Roberts Chief Executive,Personal Financial Services 2001
John Varley Group Finance Director 1996
David Weymouth Chief Information Officer 2000
Other officers
Lawrence Dickinson Group Secretary 2002
Patrick Gonsalves Joint Secretary, Barclays Bank PLC 2002
Howard Trust Group General Counsel 1995
34 Barclays PLC Annual Report 2002

Directors’ report
Directors’ reportProfit attributableThe profit attributable to shareholders for the year amountedto £2,230m, compared with £2,446m in 2001.
DividendsThe final dividends for the year ended 31st December 2002 of 12p per ordinary share of 25p each and 10p per staff shareof £1 each have been approved by the Directors. The finaldividends will be paid on 28th April 2003 in respect of theordinary shares registered at the close of business on 28thFebruary 2003 and in respect of the staff shares so registeredon 31st December 2002. With the interim dividend of 6.35pper ordinary share and of 10p per staff share that were paid on 1st October 2002, the total distribution for 2002 is 18.35p(2001: 16.625p) per ordinary share and 20p (2001: 20p) perstaff share. The dividends for the year absorb a total of£1,206m (2001: £1,110m).
Dividend Reinvestment PlanOrdinary shareholders may have their dividends reinvested inBarclays PLC ordinary shares by participating in the DividendReinvestment Plan. The Plan is available to all ordinaryshareholders provided that they do not live in, or are subject tothe jurisdiction of, any country where their participation in thePlan would require Barclays or The Plan Administrator to takeaction to comply with local government or regulatoryprocedures or any similar formalities. Any shareholder wishingto obtain details of the Plan and a mandate form shouldcontact The Plan Administrator to Barclays at PO Box 82, ThePavilions, Bridgwater Road, Bristol BS99 7NH. Those wishing to participate for the first time in the Plan should send theircompleted mandate form to The Plan Administrator so as tobe received by 3rd April 2003 for it to be applicable to thepayment of the final dividend on 28th April 2003. Existingparticipants should take no action unless they wish to altertheir current mandate instructions, in which case they shouldcontact The Plan Administrator.
Share capitalAt the 2002 AGM held on 25th April 2002, a resolution waspassed to divide each ordinary share of £1 each (issued andunissued) into four ordinary shares of 25p each.
During the year, Barclays PLC purchased in the market forcancellation 4.6 million of its ordinary shares of £1 each priorto the subdivision and 101.5 million of its ordinary shares of25p following the subdivision at a total cost of £546m as partof its programme of returning excess capital to shareholders.These transactions represented some 1.8% of the issuedordinary share capital at 31st December 2002. As at 12thFebruary 2003, the Company has an unexpired authority torepurchase further shares up to a maximum of 957.1 millionordinary shares of 25p.
In addition, the ordinary share capital was increased by 28.6million ordinary shares during the year as a result of theexercise of options under the SAYE and Executive Share OptionSchemes. At 31st December 2002 the issued ordinary sharecapital totalled 6,576 million shares.
Substantial shareholdingsAs at 12th February 2003, the Company has not been notifiedof any major interests in its shares as required by sections 198to 208 of the Companies Act 1985.
Board membershipThe membership of the Boards of Directors of Barclays PLCand Barclays Bank PLC is identical, and is set out on pages 32and 33. Dr Jürgen Zech was appointed as a non-executiveDirector on 30th July 2002 and Professor Sandra Dawson hasbeen appointed as a non-executive Director from 1st March2003. Sir Andrew Large resigned from the Board on 3rd September 2002 and John Stewart has resigned from the Board with effect from 27th February 2003.
Group SecretaryHoward Trust stepped down as Group Secretary on 19thSeptember 2002. He was succeeded by Lawrence Dickinson.
Retirement and re-election of DirectorsIn accordance with its articles of association, one-third (or thenearest whole number below one-third) of the Directors ofBarclays PLC are required to retire by rotation at each AGM,together with Directors appointed by the Board since theprevious AGM. The retiring Directors may stand for re-election.The Directors retiring by rotation at the 2003 AGM andoffering themselves for re-election are Matthew Barrett and SirNigel Rudd. Sir Nigel Mobbs will be retiring as a Director at the2003 AGM. In addition, Dr Jürgen Zech and Professor SandraDawson, who were appointed as Directors since the last AGM,will be offering themselves for re-election at the 2003 AGM.
Directors’ interestsDirectors’ interests in the shares of the Group on 31st December2002, according to the register maintained under the CompaniesAct 1985, are shown on page 51. The register is available forinspection during business hours at the Group’s Head office andwill be available for inspection at the 2003 AGM.
Directors’ emoluments and optionsInformation on emoluments and share options of Directors ofBarclays PLC, in accordance with the Companies Act 1985 andthe Listing Rules of the United Kingdom Listing Authority, isgiven in the corporate governance report by the Board onpages 44 to 51 and in notes 57 and 58 to the accounts.
For US disclosure purposes, the aggregate emoluments of allDirectors and officers of Barclays PLC who held office duringthe year (2002: 25 persons, 2001: 24 persons) for the yearended 31st December 2002 amounted to £30,409,000 (2001: £34,459,000). In addition, the aggregate amount setaside for the year ended 31st December 2002, to providepension benefits for the Directors and officers amounted to£1,356,000 (2001: £702,000). The aggregate emoluments of all Directors and officers of Barclays Bank PLC who held officeduring the year (2002: 27 persons, 2001: 25 persons) for theyear ended 31st December 2002 amounted to £30,475,000(2001: £34,562,000). In addition, the aggregate amount setaside by the Bank and its subsidiary undertakings, for the yearended 31st December 2002, to provide pension benefits for theDirectors and officers amounted to £1,357,000 (2001: £796,000).
ActivitiesBarclays PLC Group is an international financial services groupengaged primarily in banking, investment banking and assetmanagement. The Group operates through branches, officesand subsidiaries in the UK and overseas. The activities of theGroup are described on pages 90 to 95 and developments in the Group’s business during the year and an indication of likely future developments are analysed in the Riskmanagement section on pages 54 to 85 and the Financialreview on pages 96 to 122.
35Barclays PLC Annual Report 2002

Directors’ report
Community involvementCommunity support totalled £32.3m (2001: £31.1m).
Barclays gave £30.0m in support of the community in the UK(2001: £23.9m) and £2.3m was given in international support(2001: £2.2m). UK community support includes £11.1m ofcharitable donations (2001: £9.6m).
Barclays is a member of the Percent Club – a group ofcompanies that undertook to ensure that donations to thecommunity in 2002 amounted to at least 1% of their UK pre-tax profit.
In line with the Group’s policy, the Group made no politicaldonations, as defined by the Companies Act 1985, in the UKduring 2002.
Employee involvementBarclays is committed to ensuring that employees share in thesuccess of the company and have the opportunity to sharetheir views and provide feedback on issues which areimportant to them.
Equality and diversityBarclays is committed to giving full and fair consideration toapplications for employment from people with disabilities andto continuing the employment of staff who become disabledand arranging any appropriate training to achieve this. Moreinformation can be found in the Corporate Social Responsibilitysection of the Annual Report.
Creditors’ payment policyBarclays policy follows the DTI’s Better Payment Practice Code,copies of which can be obtained from the Better PaymentPractice Group’s website at www.payontime.co.uk. The Codestates that a company should have a clear, consistent policy,adhered to by the finance and purchasing departments, thatpayment terms are agreed at the outset and paymentprocedures explained to suppliers, that bills are settled inaccordance with payment terms agreed with suppliers, thatcomplaints are dealt with quickly and that suppliers areadvised of disputes. Barclays values its suppliers andacknowledges the importance of paying invoices, especiallythose of small businesses, promptly. Normal policy is to pay allsmall business purchases within 30 days.
Creditor payment days are carefully monitored in the Group,using the systems which record the actual purchases andpayments. Barclays estimates that for all UK supplies toBarclays Bank PLC, average creditor payment days in 2002were 31 days. Paragraph 12(3) of Schedule 7 to the CompaniesAct 1985 requires disclosure of trade creditor payment days.Disclosure is required by the Company, rather than the Group.The Group’s principal trading subsidiary in the UK is BarclaysBank PLC, the accounts for which are prepared under Schedule9 of the Companies Act 1985. The components for the tradecreditor calculation are not easily identified in Schedule 9.However, by identifying as closely as possible the componentsrequired by the Schedule, the trade creditor payment days forBarclays Bank PLC for 2002 were 28 days (2001: 31 days). Thisis an arithmetical calculation which includes property rentalsand payments, and does not necessarily reflect our practice,which is described above, nor the experience of any individualcreditor.
The auditorsFollowing the conversion of PricewaterhouseCoopers to aLimited Liability Partnership (LLP), effective from 1st January2003, PricewaterhouseCoopers resigned as auditors and theBoard appointed PricewaterhouseCoopers LLP to fill the casualvacancy created by the resignation. PricewaterhouseCoopersLLP have signified their willingness to continue in office and anordinary resolution, with special notice, re-appointing them asauditors and authorising the Directors to determine theirremuneration will be proposed at the 2003 AGM. The BoardAudit Committee approves and reviews the appointment of theexternal auditors, as well as their relationship with the Group,including monitoring the balance of audit and non-audit feespaid to the auditors.
The annual general meetingThe AGM will be held at The Queen Elizabeth II ConferenceCentre on 24th April 2003. The Notice of Annual GeneralMeeting is included in the Annual Review and SummaryFinancial Statement 2002 sent to shareholders at the sametime as this report.
By order of the Board
Lawrence DickinsonGroup Secretary12th February 2003
36 Barclays PLC Annual Report 2002

Corporate governance Corporate governance report
Corporate governance reportChairman’s statementCorporate governance is the system by which companies aremanaged and controlled. At Barclays, we place a great deal ofimportance on robust corporate governance practices and weare committed to applying the highest standards of businessintegrity and professionalism in all of our activities.
It has been a year in which corporate governance has beenvery much in the public eye as a result of the failures of anumber of high profile US companies. The reaction to this bythe US Government has been swift and far-reaching with theimplementation of the Sarbanes-Oxley Act 2002, which affectsall companies registered with the US Securities and ExchangeCommission, including Barclays.
During 2002 there has also been a number of reviewsconducted in the UK, such as the recently published Higgsreport on the role and effectiveness of non-executive Directors,Sir Robert Smith’s report on Audit committees and the WhitePaper on the reform of UK Company Law. We have, as ever,played an active role in contributing to the growing debate inthis important area and we strongly believe that the key toeffective systems of corporate governance lies in the continueddevelopment of codes of best practice, such as the CombinedCode, and disclosure, rather than through legislation. TheEuropean Commission commented in 2002 that best practice,as reflected in the corporate governance codes of EU memberstates, should be allowed to develop over time by the businessand investment communities, under the influence of marketforces. This is a position we support.
The development of codes of best practice in recent years hasimproved corporate governance standards in corporate UK. Inaddition, we continually strive to ensure our own standards aremaintained. To assist with that, we have established a formalprocess for the Board to assess its own effectiveness. As a partof the assessment we conducted in 2002, the Board defined itscore role as being accountable to shareholders for the creationand delivery of sustainable shareholder value.
Under the leadership of the Group Chief Executive, executivemanagement is responsible to the Board for theimplementation of the objectives and policies approved by the Board. Meetings of the Board are structured to allow opendiscussion and to enable non-executive Directors to challengeproposals put forward by the executive. Improvements in thecontent and format of reports to the Board have also beenmade to ensure the Board spends its time as effectively as possible.
Another development during 2002 is a change to the way wereward our non-executive Directors. Since the entire Board isaccountable for creating shareholder value, we believe it isimportant that their reward contains a significant share basedelement. Consequently, 40% of the basic fee paid to non-executive Directors is now in the form of Barclays shares. Full details of these arrangements can be found on page 43.
In conclusion, I can assure you that your Board is focused onmaintaining the highest standards of corporate governance to protect the interests of our shareholders. We will continue to play an active role in the debate on how to improvegovernance practices, although our stance continues to be thatshareholders’ and other stakeholders’ best interests are servedby greater openness and transparency rather than prescriptiveregulation.
We have this year included a report from the Chairman of theBoard Audit Committee on the work done by this committee.Details of the work of the Board Remuneration Committee aregiven in the report on remuneration on page 40.
Sir Peter MiddletonChairman
Board structureAs at 1st March 2003, the Board will consist of the Chairman,who has no executive responsibilities, nine non-executiveDirectors and three executive Directors, including the GroupChief Executive. Their details appear on pages 32 and 33. Theroles of our Chairman and Group Chief Executive are separatewith a clear division of responsibilities between them.Responsibility for the evaluation of the Group Chief Executivelies with the Chairman, in consultation with the othermembers of the Board. Responsibility for the evaluation of theChairman lies with the Board Remuneration Committee.
Executive Directors under the leadership of the Group ChiefExecutive generally have responsibility for making andimplementing operational decisions and running the Group’sbusinesses. The non-executive Directors support the skills andexperience of the executive Directors, by challenging andtesting the strategy and policy put forward by the executivebased on their wide knowledge and experience.
The Board meets regularly and has a formal schedule ofmatters reserved to it. All Directors have access to the adviceof the Group Secretary and independent professional advice isalso available to Directors at the Group’s expense.
Following the appointment of new Directors to the Board, acomprehensive induction programme is arranged, includingvisits to the Group’s businesses and meetings with seniormanagement as appropriate, to help them quickly build up anunderstanding of the working of the Group. Additional trainingand updates on particular issues are arranged by the GroupSecretary as appropriate. For example, during 2002, a seminarwas arranged for non-executive Directors covering suchmatters as market risk, credit risk, non-financial risk andcompliance.
At each AGM, one-third of the Directors retire and offerthemselves for re-election. In practice, this means that everyDirector stands for re-election at least once every three years.Any Directors appointed by the Board since the last AGM mustalso stand for re-election.
Our Directors diligently support the work of the Board and its committees. During the year 13 Board meetings were heldwhich included a full day’s meeting on the Group’s strategy.
37Barclays PLC Annual Report 2002

Corporate governanceCorporate governance report
Combined Code statement of complianceAs a company listed on the London Stock Exchange, Barclaysfollows the United Kingdom Listing Authority’s CombinedCode – Principles of Good Governance and Code of Best Practice.
For the year ended 31st December 2002, Barclays compliedwith the Combined Code save for the formal appointment of a senior independent director. As there is a clear division of
responsibilities at the head of the Group between theChairman and Group Chief Executive and as the Board also has a Deputy Chairman, Sir Brian Jenkins, who is anindependent Director, the Board feels that such anappointment is, at present, unnecessary. However, this will bereviewed in light of the recommendations of the Higgs Report.
The Board has determined that all the non-executive Directorsare independent in terms of the UK Combined Code as they areindependent of management and free from any business orother relationship which could materially interfere with theexercise of their independent judgement. There is a strategicalliance between Barclaycard and Xansa, of which HilaryCropper is Chairman. As a result, Hilary Cropper has not, andwill not, participate in discussions of this alliance at the Board.Having considered the matter carefully, the Board hasconcluded that Hilary Cropper remains independent forCombined Code purposes.
The Board annually reviews the independence of its non-executive Directors, taking into account developing bestpractice and regulation as and when it becomes effective.
Board committees Specific responsibilities have been delegated to the Boardcommittees. The four principal Board committees are:
Board Audit Committee
Statement from the Chairman of the Board Audit CommitteeThe Board Audit Committee plays an important role inreviewing the Group’s controls and financial reporting systems.While the Committee’s role is becoming increasingly complexfollowing the impact of the US Sarbanes-Oxley Act and otherbest practice developments during the year, Barclays is fullycommitted to ensuring the Committee fulfils its duties andresponsibilities.
The Committee is made up entirely of non-executive Directors,all of whom are considered by the Board to be independent.Current members of the Committee are:
Board Audit Committee
Stephen Russell, ChairmanSir Nigel Mobbs, Chairman during 2002Sir Brian JenkinsDr Jürgen Zech
During 2002, the Committee met four times, with the Group’ssenior management, the internal audit team and the externalauditors, PricewaterhouseCoopers LLP. I maintained closecontact with each of the aforementioned parties to ensuredthat the meetings of the Committee were as effective aspossible. The Committee also met privately with the externalauditors after each Committee meeting and at other times,where appropriate. For example, in December, the externalauditors briefed the Committee on recent corporategovernance developments, including the requirements of theUS Sarbanes-Oxley Act and the nature of their reporting to theCommittee going forward.
The Committee is responsible for approving and reviewing theappointment and retirement of the external auditors, as well asoverseeing their relationship with the Group. This includes anannual review of the independence of the external auditorsand the recommendation to the Board of the level of fees to bepaid to the external auditors. The Committee is alsoresponsible for the approval, monitoring and review of theGroup’s policy in relation to the use of the external auditors forcarrying out non-audit work.
The responsibility for ensuring that management maintain aneffective system of internal control and for reviewing itseffectiveness rests with the Board. The Group Chief Executiveand the Group Executive Committee are responsible for themanagement of risk and the Group Governance and ControlCommittee is responsible for monitoring the Group’s assuranceprocess and the risk governance framework to ensure that it iscomplete and effective. The Board Audit Committee reviewsthe effectiveness of risk management standards and reviewsreports on control issues of Group level significance.
The Committee has a pivotal role in reviewing the Group’sannual and interim financial statements, including theeffectiveness of the Group’s disclosure controls and proceduresand system of internal control. The remit of the Committeealso extends to reviewing the work undertaken by the internalaudit team and reports produced by senior management oncontrol issues, reporting its findings to the Board asappropriate.
The Committee reviews arrangements established bymanagement for compliance with the requirements of relevantregulatory and supervisory bodies. In particular it reviewsreports carried out under Section 166 of the Financial Servicesand Market Act 2000 together with any other matters ofsignificance that arise out of management’s meetings withsupervisors such as the Financial Services Authority.
The Committee strives to ensure that it keeps abreast of allmaterial developments in regulation and best practice affectingthe work within its remit. The Committee has in placeprocedures to ensure that it receives regular briefings on suchissues as well as training, where appropriate.
I shall be retiring from the Board at the 2003 AGM and havebeen succeeded by Stephen Russell as Chairman of theCommittee, whose appointment I fully endorse.
Sir Nigel MobbsBoard Audit Committee Chairman during 2002
38 Barclays PLC Annual Report 2002

Corporate governanceCorporate governance report
Board Remuneration Committee
Sir Nigel Rudd, ChairmanDavid ArculusSir Brian JenkinsSir Nigel Mobbs Graham Wallace
The Board Remuneration Committee meets at least four timesa year to consider matters relating to executive remunerationincluding remuneration policy for executive Directors,employee benefits and long-term incentive schemes. Duringthe year the Committee has also taken time to consider thenew Regulations in respect of the disclosure of Directors’emoluments. The Committee is also responsible for theevaluation of the Chairman of the Board.
Board Nominations Committee
Sir Peter Middleton, ChairmanDavid ArculusSir Brian JenkinsSir Nigel MobbsSir Nigel RuddGraham Wallace
The Board Nominations Committee is chaired by the Chairmanof the Board, except when the Committee is considering thesuccession of the Chairman of the Board, in which case theChairman of the Board Remuneration Committee, Sir NigelRudd, also chairs the Board Nominations Committee. TheCommittee’s other members are all non-executive Directors.The Committee considers and makes recommendations to theBoard on the composition of the Board, potential new Boardappointments and other top executive appointments.
Board Risk Committee
Sir Peter Middleton, ChairmanHilary CropperSir Brian JenkinsStephen RussellJohn Varley
The Board Risk Committee meets at least twice a year to reviewand recommend to the Board policies and standards for the riskgovernance and risk management of the Group. An overview ofthe Group’s risk management and control framework can befound on page 54.
Copies of the terms of reference of the Board committees areavailable from the Group Secretary.
Relations with shareholdersBarclays has just over 900,000 institutional and privateshareholders (including Barclays Sharestore members) and has adopted a proactive approach to its relationship with them. In the UK, senior executives hold meetings with our key institutional shareholders to discuss strategy, financialperformance and investment activities. Throughout Europeand in the US, we arrange road shows about the Group for key investors. In addition, the Chairman meets regularly with investor bodies and investors to discuss corporategovernance issues.
The Group aims to provide a first-class service to its privateshareholders. For example, we have introduced Barclays e-view,a service which enables shareholders to receive shareholderdocuments electronically as soon as they are published and toappoint someone, if they wish, to vote for them at shareholdermeetings. It also gives shareholders immediate access toinformation relating to their personal shareholding anddividend history and provides the necessary forms to changethe details held on the share register.
Our policy is also to make constructive use of the AGM. Thechairmen of the Board Audit and Board RemunerationCommittees are, whenever possible, present at the AGM andare available to answer shareholders’ questions. Normally, allresolutions are voted on by a poll to ensure that the views of allshareholders are reflected.
39Barclays PLC Annual Report 2002
Corporate governanceBarclays report on remuneration
Barclays report on remuneration Statement from the Chairman of the Board RemunerationCommittee (the Committee)The primary purpose of the Committee is to determine theGroup’s policy on the remuneration of executive Directors andthe specific remuneration packages for each of the executiveDirectors. The Committee is made up exclusively of non-executive Directors, and executive Directors play no part indetermining their own remuneration.
This Report describes the current components of the Group’sremuneration policy and details the remuneration during 2002of each of the Directors. This will be the first year that theReport will be put to shareholders for approval at the AGM.
The Committee has continued to apply the three fundamentalprinciples of accountability, transparency and linkage withperformance in its deliberations throughout the year and inpreparing this Report.
Barclays emphasis on reward for performance, and alignment with shareholders’ interests, is illustrated by thefollowing points:
» Executive Directors’ annual cash bonuses for 2002 aresignificantly lower than in 2001. This recognises that Barclayseconomic profit1 performance for 2002, while higher thanfor 2001, was at the lower end of the target range.
» As shown in the table on page 46, the executive Directorshave a very substantial personal interest in Barclays shares,through shares they own, and shares and options held inemployee share plans on their behalf. As the tableillustrates, movements in the Barclays share price have hada major effect on the value of these holdings.
» The performance conditions set for the Incentive ShareOption Plan, as described in the Remuneration Report, arecumulative economic profit performance1, and totalshareholder return relative to 11 competitor companies.These are both good measures of the value created forshareholders. The options are granted at market price, andthey will only deliver value to the executive Directors ifBarclays achieves sustained share price growth.
The Committee unanimously recommend that you vote infavour of this Report at the AGM.
Sir Nigel RuddBoard Remuneration Committee Chairman
Note 1: Economic profit is defined as profit after tax and minority interests pluscertain gains (and losses) reported within the statement of total recognised gainsand losses where they arise from the Group’s business activities and are inrespect of transactions with third parties, less a charge for the cost of averageshareholders’ funds (which includes purchased goodwill).
Note 2: Towers Perrin have given and not withdrawn their written consent to theissue of this document with the inclusion of references to their name in the formand context in which it appears.
40 Barclays PLC Annual Report 2002
Board Remuneration Committee membersThe Committee comprises the following non-executiveDirectors:
Sir Nigel Rudd, ChairmanDavid ArculusSir Brian JenkinsSir Nigel MobbsGraham Wallace
Sir Nigel Mobbs is due to retire from the Board at the 2003 AGM.
The Committee members are independent of managementand free from any business or other relationship which couldmaterially interfere with the exercise of their independentjudgement.
The constitution and operation of the Committee comply withthe Best Practice Provisions on Directors’ Remuneration in theCombined Code of the UK Listing Authority.
Advisers to the CommitteeThe Committee has access to executive remunerationconsultants to ensure that it receives the best independentadvice. The selection of advisers is at the discretion of theCommittee Chairman. Advisers are appointed by theCommittee for specific pieces of work, as necessary, and arerequired to disclose any potential conflict of interest to theCommittee.
During 2002, Towers Perrin2 advised the Committee on thelatest market developments in executive compensation. TowersPerrin has also advised the Company on other human resourcerelated issues including advice in the area of employee reward,pensions and employee communication.
The Chairman of the Board, Group Chief Executive and GroupHuman Resources Director also advise the Committee, but arenot permitted to participate in discussions or decisions relatingto their own remuneration. The Human Resources Director isresponsible for personnel matters within Barclays, is not aBoard Director, and is not appointed by the Committee.
Our remuneration policyWe are committed to using reward to support a strongperformance oriented culture in which excellence is expectedat every level in the organisation. Employees can expectoutstanding reward for outstanding performance.
The remuneration policy is:
» To align the interests of employees with those of theshareholders to create value;
» To recognise excellent performance of the Group, businessand individual;
» To encourage the right behaviours to achieve excellentperformance;
» That reward is to be commercially competitive; and» That reward is to be transparent, well communicated and
easily understood.

Corporate governanceBarclays report on remuneration
Barclays reward programmes are designed to support andfacilitate generation of total shareholder return. The graphbelow shows the total shareholder return for the FTSE 100Index and Barclays since 31st December 1997. The FTSE 100 isthe 100 largest UK quoted companies by market capitalisation.It has been chosen because it is a widely recognisedperformance comparison for large UK companies. It shows thevalue, by the end of 2002, of £100 invested in Barclays on 31stDecember 1997 compared with the value of £100 invested inthe FTSE 100 Index. This shows that Barclays out-performed the FTSE 100 for this period.
The reward package for executive DirectorsThe reward package for the executive Directors and othersenior executives comprises:
» Base salary;» Annual bonus including the Executive Share Award Scheme
(ESAS);» The Incentive Share Option Plan (ISOP); and» Pension and other benefits.
The Committee reviews the elements of the reward packagerelative to the practice of other comparable organisations.
The sections that follow explain how each of the elements ofremuneration listed above is structured. Each part of thepackage is important and has a specific role in achieving theaims of the remuneration policy. The combined potentialearnings from bonus and ISOP outweigh the other elements.Annual bonus and ISOP are subject to performance conditions,thereby placing more reward at risk. The component parts foreach Director are detailed in tables accompanying this Report.
Base SalaryThis is a fixed cash sum, payable monthly. The RemunerationCommittee reviews salaries each year as part of the totalreward package, recognising market practice and individual contribution.
Annual bonus including Executive Share Award Scheme (ESAS)The annual bonus for executive Directors is linked to Groupeconomic profit performance and individual performance.Bonuses (including ESAS) for 2002 were 67% of base salary at31st December 2002 for the Group Chief Executive andbetween 50% and 62% of base salary for other executiveDirectors. This represents a total reduction in executiveDirectors’ bonuses of 39% since the previous year.
Total shareholder return
Valu
e (£
)
50
100
150
200
0
Barclays PLCFTSE 100 Index
1998
82
1997
100
1999
116
2000
139
2001
157
2002
110117
142
130 112
87
In addition, the former Deputy Group Chief Executive, JohnStewart, received a bonus for his work on Woolwichintegration as detailed in the tables accompanying this Report.
Up to 75% of any bonus award is normally paid as cash and the balance as a mandatory award of shares under ESAS. (See page 47 for details.)
Incentive Share Option Plan (ISOP)The ISOP is designed to provide the opportunity for individualsto receive rewards for creating sustained shareholder valuegrowth. Under the ISOP, participants are granted options overBarclays PLC ordinary shares which are exercisable at the marketprice at the time of grant. The number of shares over whichoptions can be exercised depends upon Barclays performanceagainst specific targets. In establishing the performance targets,the Committee has sought to encourage excellent businessperformance. The two measures of performance used areeconomic profit (EP) growth and total shareholder return (TSR).These were chosen because they are both good measures of thevalue created for shareholders. EP is an audited measure which isused as a key internal value creation metric.
The Committee agrees a target ISOP award for each executiveDirector taking account of market practice for comparablepositions and ranges for other positions. A proportion of thetarget award for executive Directors is subject to the EPmeasure and a proportion to the TSR measure.
1 Growth in Economic ProfitAll participants have some options related to cumulative EP,measured over three years. This measure encourages bothprofitable growth and the efficient use of capital.
Where cumulative EP is above the target range at the end of the three-year performance period, options over double thenumber of target award shares will become exercisable. Wherecumulative EP is below the target range at the end of the three-year performance period, options over half of the target awardshares will become exercisable. Where EP is below the three-year cumulative EP for the previous three years, the optionslapse. This is described, for the 2002 awards, in the following table.
EP Ranges for 2002 Grant of ISOP for Performance Period 2002 to 2004
Number of sharesunder option that
Performance achieved become exercisable
Above the ‘Target’ range, (i.e. the 3-year cumulative EP for the performance period is above £5,100m) 2 x Target Award
In the ‘Target’ range (i.e. the 3-year cumulative EP for the performance period is between £4,000m and £5,100m) 1 x Target Award
Below the ‘Target’ range (i.e. the 3-year cumulative EP for the performance period is below £4,000m) 0.5 x Target Award
EP growth is not positive (i.e. the 3-year cumulative EP for the performance period is not more than the cumulative EP for the previous 3-year period) Zero
41Barclays PLC Annual Report 2002

Corporate governanceBarclays report on remuneration
2 Total Shareholder Return (TSR)For the most senior participants, a proportion of the sharesunder option are subject to a tougher performance conditionbased on TSR measured against a financial services peer groupapproved by the Committee. This peer group comprises 11 UKand internationally based financial institutions which havebeen chosen to reflect Barclays business mix. For theperformance period 2002 – 2004 the initial peer group is ABNAmro, Abbey National, BBVA, BNP Paribas, Citigroup, DeutscheBank, HBOS, HSBC, Lloyds TSB, Royal Bank of Scotland andStandard Chartered.
If the Company is ranked first, second or third in the peergroup, then the options will become exercisable overquadruple, triple or double the target award shares,respectively. If the Company is ranked fourth, fifth or sixth inthe peer group, the options will become exercisable over thetarget award shares. However, if the Company is ranked belowsixth after three years, there will be a retest on the fourthanniversary, over the full four-year period. If the Company is not ranked sixth or higher after four years, the options will lapse.
The method for measuring relative performance is shown in the table that follows, together with the multiple of target award.
Performance achieved in the TSR Number of sharesranking scale out of 12 financial under option thatinstitutions including Barclays become exercisable1st place 4 x Target Award2nd place 3 x Target Award3rd place 2 x Target Award4th – 6th place 1 x Target Award7th – 12th place Zero
Note: Under the TSR condition, the ability to exercise is also subject to thecondition that EP for the three-year performance period is greater than theprevious performance period.
Options must normally be held for three years before they canbe exercised and lapse ten years after grant if not exercised.
SharesaveAll eligible employees including executive Directors have theopportunity to participate in Barclays Sharesave Scheme.Sharesave is an Inland Revenue approved all-employee shareplan the terms of which do not permit performance conditionsto be attached to the exercise of options. Under the plan,participants are granted options over Barclays PLC ordinaryshares. Each participant may save up to £250 per month topurchase Barclays shares at a discount. For the 2002 grant, thediscount was 20% of the market value at the time the optionwas granted.
Share Incentive Plan The Share Incentive Plan was introduced in January 2002. It is an Inland Revenue approved all-employee share plan. Theplan is open to all eligible UK employees including executiveDirectors. Under the plan, participants are able to purchase upto £125 worth of Barclays PLC ordinary shares each month,which if kept in trust for five years can be withdrawn from theplan tax-free. Any shares in the plan will earn dividends in theform of additional shares, which must normally be held by thetrustee for three years before being eligible for release.
PensionsA pension is payable on retirement at contractual retirementdate (normally 60), and is calculated either by reference to anexecutive Director’s length of service and pensionable salary orto a money purchase arrangement, depending upon date ofhire. Matthew Barrett is not a member of the Group’s mainpension schemes. A notional fund was accrued on his behalfoutside the pension scheme (see page 45 for further details).
Service ContractsThe Group has service contracts with its Chairman, executiveDirectors and senior executives. Non-executive Directors donot have service contracts. The service contracts do not have a fixed term but provide for a notice period from the Group of one year and normally for retirement at age 601. TheCommittee’s policy is that executive Directors’ contractsshould allow for termination with reasonable notice from theCompany, except in circumstances of summary dismissal whennotice is not given.
The service contract with Matthew Barrett, who will bestanding for re-election at the 2003 AGM, provides for a noticeperiod of one year in line with the other executive Directors. If Mr Barrett’s contract is terminated following a change ofcontrol of Barclays, pre-determined compensation is payableequivalent to twice annual basic salary, pension contribution,bonus and other benefits. Exceptionally, the Committeedecided to retain this provision in Mr Barrett’s contract at thetime of renewal of his first contract with the Group in March2002 in order to retain the services of an executive with aglobal reputation in a competitive market for talent. None ofthe other executive Directors has a similar clause in theirservice contracts.
The Committee has considered what arrangements shouldapply in the event of termination of the contract. TheCommittee’s approach when considering payments in theevent of termination is to examine individual circumstancesincluding the reason for termination, contractual notice periodand share scheme rules relating to contract termination andtake a decision based on this information.
1 Effective dates of employment contracts: Sir Peter Middleton 1st May 1999; Matthew Barrett 1st January 2002; Chris Lendrum 15th June 1992; John Varley1st April 1998.
42 Barclays PLC Annual Report 2002

Corporate governanceBarclays report on remuneration
Forward looking statementThe Committee will keep the existing remunerationarrangements, as detailed in this Report, under review during 2003 and ensure that Barclays reward programmesremain competitive and provide appropriate incentive forperformance. No significant changes to reward arrangementsfor executive Directors are expected. However, as usual, there will be individual reviews of base salary, annual bonus(including ESAS) and ISOP awards. The performance targetsfor incentive plans will also be reviewed to ensure alignmentwith Group strategy.
Non-executive DirectorsThe Board determines the fees of non-executive Directors. The Board’s policy is that fees should reflect individualresponsibilities and membership of Board Committees. The Board, during 2002, has increased the basic fee for our non-executive Directors to £50,000 per annum, to takeaccount of the ever-growing importance, responsibility and time that the role demands.
Barclays encourages its non-executive Directors to build up a holding in the Company’s shares. £20,000 of their basicDirector’s fee is used to buy shares in the Company for eachnon-executive Director. These shares, together with reinvesteddividends, are retained on behalf of the non-executiveDirectors until they retire from the Board. They are included inthe table of Directors’ interests in ordinary shares of BarclaysPLC on page 51. Non-executive Directors do not participate inshare schemes for employees.
Sir Nigel Mobbs will be retiring at the 2003 AGM. Sir NigelRudd, Dr Jürgen Zech and Professor Sandra Dawson will bestanding for re-election at the 2003 AGM.
43Barclays PLC Annual Report 2002

Corporate governanceBarclays report on remuneration
2002 Annual Remuneration(a)
Executive ShareAward Scheme
Salary Annual Integration 2002 2001 ESAS (c)
& fees Benefits (b) cash bonus Bonus Total Total 2002 2001£000 £000 £000 £000 £000 £000 £000 £000
ChairmanSir Peter Middleton (d) 513 15 – – 528 409 – –
ExecutiveMW Barrett 1,100 81 516 – 1,697 1,862 223 331CJ Lendrum 400 10 150 – 560 664 65 117JM Stewart (e) 460 12 230 900 1,602 779 – 135JS Varley 460 9 199 – 668 797 86 149
Non-executive (f )TDG Arculus 52 – – – 52 43 – –HM Cropper 52 – – – 52 42 – –Sir Brian Jenkins 100 – – – 100 100 – –Sir Nigel Mobbs 79 – – – 79 70 – –Sir Nigel Rudd 57 – – – 57 49 – –SG Russell 58 – – – 58 44 – –GM Wallace 52 – – – 52 26 – –Dr Jürgen Zech (g) 21 – – – 21 – – –
Former DirectorSir Andrew Large (h) 169 – – – 169 175 – –
Notes (a) Emoluments include amounts, if any, payable by subsidiary undertakings and by other companies where services areundertaken at the Group’s request.
(b) The Chairman and executive Directors receive benefits in kind, which may include life cover, the use of a company ownedvehicle, or cash equivalent, and medical health insurance on similar terms to other senior executives.
(c) The amounts shown for ESAS 2002 represent payments which are expected to be made by the trustee to fund theprovisional allocation of shares in 2003, including a maximum potential 30% bonus share element. Refer to page 47 for further details about ESAS.
(d) Sir Peter Middleton receives pension payments through the Barclays Bank Retirement Plan. Details of the payments are notincluded since this is a pension in payment relating to his Barclays service prior to becoming Chairman.
(e) John Stewart led the second phase of the Woolwich integration process for the period from July 2001 to the end of 2002. TheBoard considered that it was important to the success of the integration process to reward and retain Mr Stewart in this periodto maximise shareholder value through further synergies. On 11th July 2001, Mr Stewart was therefore granted a special bonusopportunity of up to a maximum value of £900,000 payable on or before 31st March 2003 based upon the level of hisachievement by 31st December 2002 of three performance metrics which include cost savings and business development. TheCommittee has assessed Mr Stewart’s performance and awarded the maximum bonus of £900,000. Mr Stewart has resigned as aDirector with effect from 27th February 2003.
(f ) Fees to non-executive Directors include an amount of not less than £20,000 which, after tax, is used to buy Barclays PLCordinary shares for each non-executive Director. Further details are provided on page 43.
(g) Fees for Dr Jürgen Zech are in respect of service since his appointment as non-executive Director on 30th July 2002.
(h) Sir Andrew Large resigned from the Board with effect from 3rd September 2002.
44 Barclays PLC Annual Report 2002

Corporate governanceBarclays report on remuneration
Executive Directors’ annual pension accrued assuming retirement at contractual age(a)(e)(f )
PensionAccrued accrued Accrued Transfer value Transfer value
Age pension during 2002 pension of accrued of accrued Increase in Otherat 31st at 31st (including at 31st pension at 31st pension at 31st transfer contributions
December Years December increase for December December December value during made in 2002 of service 2001 inflation) 2002 2001 2002 the year 2002
£000 £000 £000 £000 £000 £000 £000
ExecutiveMW Barrett (b) 58 3 – – – – – – 990CJ Lendrum (c) 55 33 224 14 238 3,146 3,415 269 –JM Stewart (d) 53 25 235 10 245 3,058 3,218 160 –JS Varley (c) 46 20 151 16 167 1,502 1,693 191 –
Notes(a) Pension accrued during 2002 represents the increase in accrued pension which occurred during the entire year. All pensionsare reviewed annually, with a guaranteed increase in line with retail price inflation, up to a maximum of 5%.
(b) Matthew Barrett is not a member of the Group’s main pension schemes. A notional fund was accrued on his behalf outside the pension scheme. In the event of Mr Barrett’s death before retirement, a capital sum of up to four times salary would be payable.
(c) The Group has a closed non-contributory pension scheme, Barclays Bank UK Retirement Fund – 1964 Pension Scheme (‘1964Scheme’) which provides that, in the case of death before retirement, a capital sum of up to four times salary is payable,together with a spouse’s pension of approximately 50% of the member’s prospective pension at retirement. For death inretirement, a spouse’s pension of approximately 50% of the member’s pre-commutation pension is payable. If a member,granted a deferred pension, dies before their pension becomes payable, their widow/widower will immediately be paid a pensionof 50% of their deferred pension. In all circumstances, children’s allowances are payable, usually up to the age of 18. Enhancedbenefits are payable if a member is unable to work as the result of serious ill health. Chris Lendrum and John Varley are membersof the ‘1964 Scheme’ and are entitled to enhanced benefits that will give them two-thirds of their pensionable salary at age 60.
(d) John Stewart is entitled to a pension of up to two-thirds of pensionable salary at age 60. For service to 30th June 2001, Mr Stewart accrued pension rights in The Woolwich Pension Fund. The Woolwich Pension Fund is similar to the ‘1964 Scheme’except that employees contribute at the rate of 3% of pensionable salary. From 1st July 2001, Mr Stewart became a member of the Group’s ‘1964 Scheme’ for future pension accrual. Mr Stewart has resigned as a Director with effect from 27th February 2003.
(e) The accrued pension amounts at the end of the year are the value if the Director left service on that date.
(f ) The transfer values have been calculated in a manner consistent with ‘Retirement Benefit Schemes – Transfer Values (GN11)’published by the Institute of Actuaries and the Faculty of Actuaries.
45Barclays PLC Annual Report 2002

Executive Directors: Illustration of change in value of shares owned beneficially, or heldunder option or award under employee share plans during the year(a)(g)
Number at 31st December 2002s
Notional NotionalShares Executive Executive Incentive value based value based Change inowned Share Share Share on share price on share price notional
beneficially Award Option Option Plan of £5.6875 (e) of £3.85 (f ) value(b) Scheme Scheme (d) Sharesave Total £000 £000 £000
ExecutiveMW Barrett 263,384 185,724 766,628 2,596,000 3,064 3,814,800 5,077 1,731 (3,346)CJ Lendrum 202,860 91,164 – 348,000 6,626 648,650 1,986 1,140 (846)JM Stewart (c) (h) 4,050 25,940 396,516 240,000 5,588 672,094 1,095 201 (894)JS Varley 247,448 195,704 – 360,000 4,096 807,248 2,842 1,706 (1,136)
Notes (a) The register of Directors’ interests which shows full details of Directors’ current share awards and options, is available forpublic inspection at the Group’s Head office in London.
(b) The number shown includes shares held under the Profit Sharing Scheme and the Share Incentive Plan.
(c) The number shown under the Executive Share Option Scheme (ESOS) column includes the Barclays shares under optionunder The Woolwich Executive Share Option Plan (The Woolwich ESOP).
(d) The number of shares shown represent the target award shares under option.
(e) The value is based on the share price as at 1st January 2002. The notional value of shares under option under the IncentiveShare Option Plan (ISOP), ESOS, Woolwich ESOP and Sharesave have been set at zero where the market price at 1st January2002 is lower than the exercise price per share.
(f ) The value is based on the share price as at 31st December 2002. The notional value of shares under option under ISOP, ESOS,Woolwich ESOP and Sharesave have been set at zero where the market price at 31st December 2002 is lower than the exerciseprice per share.
(g) All the numbers in the table have been restated for the 4 for 1 share split approved by shareholders at the AGM on 25th April 2002.
(h) John Stewart resigned as a Director with effect from 27th February 2003.
The closing market price at 31st December 2002 was 385p, during the year the highest and lowest prices were 624p and 355p respectively.
Under ESAS, ISOP, ESOS and The Woolwich ESOP, nothing was paid by a participant on the grant of options.
Corporate governanceBarclays report on remuneration
46 Barclays PLC Annual Report 2002

Corporate governanceBarclays report on remuneration
Executive Directors: shares provisionally allocated and shares under option underExecutive Share Award Scheme (ESAS)(a)(e)
During 2002
Awarded in Market Nil cost Date Awarded in 2003Number at respect of price at Number at option from Latest in respect of1st January the results release 31st December granted at 3rd which expiry the results
2002 for 2001 Released (b) date £ 2002 anniversary (c) exercisable date for 2002 (d)
ChairmanSir Peter Middleton 9,564 – (9,564) 5.27 – – – – –
ExecutiveMW Barrett 121,816 63,908 – – 185,724 – – – 60,225CJ Lendrum 73,988 22,560 (5,384) 5.27 91,164 24,896 23/03/01 25/02/04 17,520JM Stewart (f ) – 25,940 – – 25,940 – – – –JS Varley 213,268 28,828 (46,392) 5.27 195,704 107,740 23/03/01 25/02/04 23,214
Notes(a) The size of any award under ESAS is subject to the same Group and individual performance criteria as the annual bonus.Awards under ESAS are granted in the form of provisional allocations over Barclays PLC ordinary shares, which do not give riseto any entitlement to these shares. Normally, the trustees will permit the executive to call for the shares from the end of the thirdyear from grant of an award by granting a right to acquire shares (a nil cost option) exercisable for two years. As this nil costoption is part of the structure of an ESAS award described above, which is a deferred share award scheme, it would not beappropriate to attach a performance condition to the exercise of options. If the right is not exercised, the trustees may at theend of the fifth year release all of the shares, including bonus shares equal to 30% of the basic award. If the right is exercised, anexecutive may lose the opportunity of receiving one-third of the bonus shares. The number of shares shown in the table includesthe bonus shares.
(b) The trustees may release additional shares to participants which represent accumulated net dividends in respect of sharesunder award. During 2002, the trustees released the following accumulated dividend shares – 2,720 to Sir Peter Middleton, 1,544to Chris Lendrum and 11,972 to John Varley. These are not awarded as part of the original award and consequently are notincluded in the Released column.
(c) The shares under option shown in this column are already included in the numbers shown at 1st January 2002 and relate toprovisional allocations made in 1998 and 1999 except that the figures do not include accumulated dividend shares under optionas follows: 1,776 shares for Chris Lendrum and 7,792 shares for John Varley. Under ESAS, a participant pays £1 to exercise anoption, irrespective of the number of shares involved. No options were either exercised or lapsed during the year.
(d)The awards in respect of 2002 were made in February 2003. The shares awarded represent shares purchased by the trusteesafter 18th February 2003 at £3.71 in respect of a recommendation by the Company for an award, including a maximumpotential 30% bonus shares, of £223,438 to Matthew Barrett, £65,000 to Chris Lendrum and £86,125 to John Varley.
(e) All the numbers in the table have been restated for the 4 for 1 share split approved by shareholders at the AGM on 25th April 2002.
(f ) John Stewart resigned as a Director with effect from 27th February 2003.
47Barclays PLC Annual Report 2002

Corporate governanceBarclays report on remuneration
Executive Directors: shares under option under Incentive Share Option Plan (ISOP)(a)(b)(e)
During the year (c)
Number held as at Number held as at1st January 2002 Granted 31st December 2002
Maximum Maximum Maximumnumber number number
Target over which Target over which Target over which Shares Exercise DateAward potentially Award potentially Award potentially due to vest price per fromShares exercisable Shares exercisable Shares exercisable in 2003 share which Expiry
000 000 000 000 000 000 (d) £ exercisable Date
MW Barrett2002EP – – 40 80 40 80 – 5.20 20/03/05 19/03/12TSR – – 1,960 7,840 1,960 7,840 – 5.20 20/03/05 19/03/122001EP 40 80 – – 40 80 – 5.34 12/03/04 11/03/11TSR 300 1,200 – – 300 1,200 – 5.34 12/03/04 11/03/112000EP 40 80 – – 40 80 80 3.90 18/05/03 17/05/10TSR 216 864 – – 216 864 432 3.90 18/05/03 17/05/10
CJ Lendrum2002EP – – 40 80 40 80 – 5.20 20/03/05 19/03/12TSR – – 80 320 80 320 – 5.20 20/03/05 19/03/122001EP 40 80 – – 40 80 – 5.34 12/03/04 11/03/11TSR 80 320 – – 80 320 – 5.34 12/03/04 11/03/112000EP 40 80 – – 40 80 80 3.90 18/05/03 17/05/10TSR 68 272 – – 68 272 136 3.90 18/05/03 17/05/10
JM Stewart (f)2002EP – – 40 80 40 80 – 5.20 20/03/05 19/03/12TSR – – 80 320 80 320 – 5.20 20/03/05 19/03/122001EP 40 80 – – 40 80 – 5.34 12/03/04 11/03/11TSR 80 320 – – 80 320 – 5.34 12/03/04 11/03/11
JS Varley2002EP – – 40 80 40 80 – 5.20 20/03/05 19/03/12TSR – – 80 320 80 320 – 5.20 20/03/05 19/03/122001EP 40 80 – – 40 80 – 5.34 12/03/04 11/03/11TSR 80 320 – – 80 320 – 5.34 12/03/04 11/03/112000EP 40 80 – – 40 80 80 3.90 18/05/03 17/05/10TSR 80 320 – – 80 320 160 3.90 18/05/03 17/05/10
Notes(a) The Register of Directors’ interests which shows full details of Directors’ current share awards and options, is available forinspection at the Group’s head office in London.
(b) For details of the performance targets which must be satisfied for options to become exercisable and the extent to whichoptions will become exercisable see pages 41 and 42.
(c) No options either lapsed or were exercised during the year and therefore are not shown in the table. As there were nooptions exercised during the year, the table does not show the market price on the exercise date.
(d) The 2000 grant is due to vest on 18th May 2003. The number of shares due to vest represents the number over which anoption may be exercised after the third anniversary from grant, as determined by the Committee in respect of the performanceconditions attached to the options originally set at the time of the grant of the option. The shares under option that are not dueto vest will lapse. The result of the economic profit performance against the target has resulted in two times the Target Awardvesting. The result of the relative TSR performance target against the comparator group of companies placed Barclays in 3rdposition with a vesting multiplier of two times the Target Award.
(e) All the numbers in the table have been restated for the 4 for 1 share split approved by shareholders at the AGM on 25th April 2002.
(f ) John Stewart resigned as a Director with effect from 27th February 2003.
48 Barclays PLC Annual Report 2002

Corporate governanceBarclays report on remuneration
Executive Directors: shares under option under Sharesave(a)(b)(d)
During 2002 Information as at 31st December 2002
WeightedNumber held at Number at Exercise average Date from
1st January 31st December price per exercise which Latest2002 Granted 2002 share price exercisable expiry date
£ £
MW Barrett 3,064 – 3,064 – 3.16 01/11/03 30/04/04CJ Lendrum 3,912 2,714 6,626 – 2.61 01/11/03 30/04/06JM Stewart (c) 5,588 – 5,588 – 3.08 01/07/03 31/12/03JS Varley 4,096 – 4,096 – 4.11 01/11/06 30/04/07
Notes(a) The Register of Directors’ Interests which shows full details of Directors’ current share awards and options is available forinspection at the Group’s Head office in London.
(b) Please see page 42 for details of the Sharesave scheme. No options were either exercised or lapsed during the year.
(c) John Stewart was previously awarded an option over Woolwich plc shares. This option was rolled over into an option overBarclays PLC shares in accordance with the scheme of arrangement for the acquisition of Woolwich plc. These figures representoption held under the Woolwich plc Sharesave Scheme. Mr Stewart resigned as a Director with effect from 27th February 2003.
(d) All the numbers in the table have been restated for the 4 for 1 share split approved by shareholders at the AGM on 25th April 2002.
49Barclays PLC Annual Report 2002

Corporate governanceBarclays report on remuneration
Directors: Closed Group incentive schemes (Performance Share Plan (PSP), ExecutiveShare Option Scheme (ESOS) and Woolwich Executive Share Option Plan (ESOP))In addition, executive Directors continue to have interests under the PSP, ESOS and Woolwich plc 1998 ESOP schemes (asindicated in the table below). No further awards will be made under these schemes. Under PSP, executives were awarded a rightto acquire shares, the number of which is determined by the Company’s relative TSR performance against a FTSE 100 indexcomparator group of companies. If ranked in the top 25 positions, awards would vest in full. If ranked below 60th position, nonewould vest. If between 26th and 60th, vesting would be pro-rata. Under the ESOS, options granted (at market value) toexecutives were exercisable only if the growth in earnings per share of the Company over a three year period was, at least, equalto the percentage increase in the UK Retail Prices Index plus 6%, over the same period. The performance targets for the 1997,1998 and 1999 ESOS grants were met.
Under the ESOP, options originally granted over Woolwich plc shares at market value were exercised in 2001 or exchanged, inaccordance with the proposals made under the Offer to acquire the Woolwich, for options over Barclays PLC shares. Under therules of ESOP, the performance conditions attached to the exercise of options were disapplied on acquisition of Woolwich plc byBarclays.
Directors: awards under closed Group incentive schemes(a)(e)
Number Market WeightedNumber at at 31st Exercise Price on average Date from Latest1st January During the year December price per exercise exercise which expiry
2002 Granted Exercised Lapsed 2002 share date price exercisable date£ £
MW Barrett (b)ESOS 766,628 – – – 766,628 – – 4.43 04/10/02 03/10/09PSP 191,656 – (191,656) – – n/a 3.88 – – –CJ LendrumESOS 60,000 – (60,000) – – 1.76 6.06 – – –PSP (c) 55,928 – (55,928) – – n/a 4.39 – – –JM Stewart (f)Woolwich 536,052 – (69,420) – 396,516 3.85 5.59 3.65 14/12/02 16/02/10ESOP (d) (70,116) 4.22 5.94JS VarleyPSP (c) 55,928 – (55,928) – – n/a 4.39 – – –
Notes(a) The register of Directors’ interests which shows full details of Directors’ current share awards and options, is available forpublic inspection at the Group’s head office in London.
(b) The independent trustee of the Barclays Group (PSP and ESOS) employees’ benefit trust granted Matthew Barrett a shareaward in 1999 comprising (i) an option on similar terms to options granted under ESOS and (ii) an award on similar terms toawards granted under PSP except that no exercise price was payable as the award was granted as a provisional allocation. For convenience these are described as granted under ESOS and PSP in the above table.
(c) Under PSP, a participant pays £1 to exercise an award, irrespective of the number of shares involved.
(d) Under The Woolwich ESOP, John Stewart held an option over Woolwich plc shares. This was rolled over into a new optionover Barclays PLC shares under the terms of The Woolwich ESOP in accordance with proposals offered to all Woolwichemployees participating in The Woolwich ESOP following the acquisition of Woolwich plc.
(e) All the numbers in the table have been restated for the 4 for 1 share split approved by shareholders at the AGM on 25th April 2002.
(f ) John Stewart resigned as a Director with effect from 27th February 2003.
50 Barclays PLC Annual Report 2002

Corporate governanceBarclays report on remuneration
Directors: interests in ordinary shares of Barclays PLC(a)(e)
At 1st January 2002 (b)(e) At 31st December 2002
Beneficial Non-beneficial Beneficial Non-beneficial
ChairmanSir Peter Middleton 154,376 6,000 163,748 6,000
ExecutiveMW Barrett 104,356 – 263,384 –CJ Lendrum (f ) 169,044 – 202,860 –JM Stewart (c) 4,024 – 4,050 –JS Varley (f ) 178,616 – 247,448 –
Non-executiveTDG Arculus 9,764 – 11,391 –HM Cropper 7,972 – 9,703 –Sir Brian Jenkins 2,540 105,200 3,576 105,200Sir Nigel Mobbs 44,492 20,000 46,327 20,000Sir Nigel Rudd 6,928 – 8,604 –SG Russell 5,084 – 7,125 –GM Wallace 2,124 – 3,704 –Dr Jürgen Zech (d) – – 2,500 –
Notes(a) Beneficial interests in the table above represent shares held by Directors, either directly or through a nominee, their spouseand children under 18. They include any interests held through the 1991 UK Profit Sharing Schemes (PSS) and the ShareIncentive Plan, but do not include any awards under ESAS, ISOP, PSP, ESOS, Sharesave schemes or under the Woolwich Sharesaveor the Woolwich plc 2000 Sharesave Scheme (together The Woolwich Sharesave scheme), or the ESOP. At 31st December 2002,Sir Peter Middleton and the executive Directors together with other senior executives were potential beneficiaries in respect of atotal of 70,656,045 Barclays PLC ordinary shares (1st January 2002: 41,920,308) held by the trustees of the Barclays GroupEmployees’ Benefit Trusts. At 12th February 2003, a total of 70,651,234 shares were held by the trustees.
(b) Or date appointed to the Board if later.
(c) At 31st December 2002 John Stewart together with other senior executives from Woolwich plc, was a potential beneficiary inrespect of a total of 1,883,196 Barclays PLC ordinary shares held by the trustee of the Woolwich Qualifying Employee ShareOwnership Trust. At 12th February 2003 a total of 1,833,196 shares were held by the trustees.
(d) Appointed with effect from 30th July 2002.
(e) Restated for the 4 for 1 share split approved by shareholders at the AGM on 25th April 2002.
(f ) Between 31st December 2002 and 12th February 2003, John Varley and Chris Lendrum each purchased 68 ordinary sharesthrough the Share Incentive Plan.
51Barclays PLC Annual Report 2002

Accountability and AuditGoing concernThe Directors confirm they are satisfied that the Group has adequate resources to continue in business for theforeseeable future. For this reason, they continue to adopt the‘going concern’ basis for preparing the accounts.
Internal controlThe Directors have responsibility for ensuring thatmanagement maintain an effective system of internal controland for reviewing its effectiveness. Such a system is designedto manage rather than eliminate the risk of failure to achievebusiness objectives, and can only provide reasonable and notabsolute assurance against material misstatement or loss.Throughout the year ended 31st December 2002, and to date,the Group has operated a system of internal control whichprovides reasonable assurance of effective and efficientoperations covering all controls, including financial andoperational controls and compliance with laws and regulations.Processes are in place for identifying, evaluating and managingthe significant risks facing the Group in accordance with theguidance ‘Internal Control: Guidance for Directors on theCombined Code’ issued by the Institute of CharteredAccountants in England and Wales. The Board regularlyreviews these processes through the Board committees.
The Directors review the effectiveness of the system of internalcontrol annually. An internal control compliance certificationprocess is conducted throughout the Group in support of thisreview. The effectiveness of controls is periodically reviewedwithin the business areas. Quarterly risk reports are made tothe Board covering all risks of Group significance includingcredit risk, market risk, operational risk, and legal andcompliance risk. Regular reports are made to the Board AuditCommittee by management, Group Internal Audit and thecompliance and legal functions covering particularly financialcontrols, compliance and operational controls. Reportscovering risk measurement standards and risk appetite aremade to the Board Risk Committee.
The key document for the Group’s internal control processes isthe record of Group Governance practices which describes theGroup’s governance and control framework and details Grouppolicies and processes. The record of Group Governancepractices is reviewed and approved on behalf of the GroupChief Executive by the Group Governance and ControlCommittee. Further details of risk management procedures aregiven in the Risk management section on pages 54 to 85.
The system of internal financial and operational controls is alsosubject to regulatory oversight in the United Kingdom andoverseas. Further information on supervision by the financialservices regulators is provided under Supervision andregulation on pages 123 to 124.
Statement of Directors’ responsibilities for accountsThe following statement, which should be read in conjunctionwith the Auditors’ report set out on page 126, is made with a view to distinguishing for shareholders the respectiveresponsibilities of the Directors and of the auditors in relationto the accounts.
The Directors are required by the Companies Act 1985 toprepare accounts for each financial year which give a true and fair view of the state of affairs of the Company and Groupas at the end of the financial year and of the profit or loss forthe financial year.
The Directors consider that, in preparing the accounts on pages 128 to 219 and 224 to 232, and the additionalinformation contained on pages 40 to 51, the Group has used appropriate accounting policies, consistently applied and supported by reasonable and prudent judgements andestimates, and that all accounting standards which theyconsider to be applicable have been followed.
The Directors have responsibility for ensuring that theCompany and the Group keep accounting records whichdisclose with reasonable accuracy the financial position of theCompany and the Group and which enable them to ensurethat the accounts comply with the Companies Act 1985.
The maintenance and integrity of the Barclays website is theresponsibility of the directors; the work carried out by theauditors does not involve consideration of these matters and,accordingly, the auditors accept no responsibility for anychanges that may have occurred to the financial statementssince they were initially presented on the website.
Legislation in the United Kingdom governing the preparationand dissemination of financial statements may differ fromlegislation in other jurisdictions.
The Directors have general responsibility for taking such stepsas are reasonably open to them to safeguard the assets of theGroup and to prevent and detect fraud and other irregularities.
Signed on behalf of the Board
Sir Peter Middleton12th February 2003
Disclosure controls and proceduresWithin the 90-day period prior to the filing of this reportwith the US Securities and Exchange Commission, anevaluation was carried out under the supervision and with theparticipation of the Group’s management, including the GroupChief Executive and the Group Finance Director, of theeffectiveness of the design and operation of the Group’sdisclosure controls and procedures, which are defined as thosecontrols and procedures designed to ensure that informationrequired to be disclosed in reports filed under the US SecuritiesExchange Act of 1934 is recorded, summarised and reportedwithin specified time periods. As of the date of the evaluation,the Group Chief Executive and Group Finance Directorconcluded that the design and operation of these disclosurecontrols and procedures were effective. No significant changeswere made in our internal controls or in other factors thatcould significantly affect these controls subsequent to theirevaluation.
Corporate governanceAccountability and Audit
52 Barclays PLC Annual Report 2002

53Barclays PLC Annual Report 2002
Presentation of information
Presentation of informationBarclays PLC is a public limited company registered in Englandand Wales under company number 48839. The Company,originally named Barclay & Company Limited, wasincorporated in England and Wales on 20th July 1896 underthe Companies Acts 1862 to 1890 as a company limited byshares. The company name was changed to Barclays BankLimited on 17th February 1917 and it was re-registered in 1982as a public limited company under Companies Acts 1948 to1980. On 1st January 1985, the company changed its name to Barclays PLC.
Barclays Bank PLC is a public limited company registered inEngland and Wales under number 1026167. The Bank wasincorporated on 7th August 1925 under the Colonial Bank Act1925 and on 4th October 1971 was registered as a companylimited by shares under the Companies Acts 1948 to 1967.Pursuant to The Barclays Bank Act 1984, on 1st January 1985the Bank was re-registered as a public limited company and itsname was changed from Barclays Bank International Limited toBarclays Bank PLC.
All of the issued ordinary share capital of Barclays Bank PLC is owned by Barclays PLC. The Annual report for Barclays PLCalso contains the consolidated accounts of and otherinformation relating to Barclays Bank PLC. The Annual reportincludes information required on Form 20-F. Form 20-F willcontain certificates pursuant to Section 302 of the Sarbanes-Oxley Act of 2002, signed by the Group Chief Executive andGroup Finance Director, with respect to both Barclays PLC andBarclays Bank PLC. Except where otherwise indicated, theinformation given is identical with respect to both Barclays PLCand Barclays Bank PLC.
The accounts of Barclays Bank PLC included in this documentdo not comprise statutory accounts within the meaning ofSection 240 of the Companies Act 1985. The statutoryaccounts of Barclays Bank PLC, which contain an unqualifiedaudit report and do not contain any statement under Section237(2) or (3) of that Act, will be delivered to the Registrar ofCompanies in accordance with Section 242 of that Act and are published as a separate document.
The term ‘Barclays PLC Group’ means Barclays PLC togetherwith its subsidiary undertakings and the term ‘Barclays BankPLC Group’ means Barclays Bank PLC together with itssubsidiary undertakings. ‘Barclays’ and ‘Group’ are terms whichare used to refer to either of the preceding groups when thesubject matter is identical. The term ‘Company’ refers toBarclays PLC and the term ‘Bank’ refers to Barclays Bank PLC.‘Woolwich plc’ is used, as the context requires, to refer toWoolwich plc and its subsidiary undertakings. In this report,the abbreviations ‘£m’ and ‘£bn’ represent millions andthousands of millions of pounds sterling respectively; theabbreviations ‘$m’ and ‘$bn’ represent millions and thousandsof millions of US dollars respectively and ‘sm’ and ‘sbn’represent millions and thousands of millions of eurosrespectively. References to operating results ‘before the impact ofthe Finance Act’ exclude the impact of taxation changes arisingfrom Finance Act 1998.
Statutory accountsThe consolidated accounts of Barclays PLC and its subsidiaryundertakings are set out on pages 136 to 141 along with theaccounts of Barclays PLC itself on page 142. The consolidatedaccounts of Barclays Bank PLC and its subsidiary undertakingsare set out on pages 224 to 229. The accounting policies onpages 128 to 134 and the notes commencing on page 143apply equally to both sets of accounts unless otherwise stated.
The financial statements contained in this document, whichinclude the results of Woolwich plc from its acquisition on 25thOctober 2000, also reflect changes in the Group’s managementstructure which took place in 2002, as explained on pages 90 and94. The comparative data has been restated, where appropriate.
Further analysis of profit and loss account To assist the analysis of the ongoing business performance,further analysis of the profit and loss account is provided onpage 97. Barclays believes that the further analysis of the profitand loss account assists in the understanding of profit trends inthe results. This differs from the statutory presentation ofincome, cost and operating profit in that:
(a) Woolwich fair value adjustments relating to interest areexcluded from income and operating profit;
(b) the restructuring charge, costs directly associated with the integration of Woolwich plc, Woolwich fair valueadjustments relating to administrative expenses andgoodwill amortisation are excluded from costs andoperating profit; and
(c) the share of results from joint ventures and associatedundertakings is included within operating profit.
The analysis of results by business is based on this furtheranalysis and figures based on this analysis are also provided inthe Results by nature of income and expense section.

Risk managementRisk management and control – overview
Risk management and control – overviewBarclays aims to employ superior riskpractices to optimise financialperformance and value.Risk governanceBarclays manages a variety of risks through various controlmechanisms consistent with the requirements of the ‘Internalcontrol: Guidance for Directors on the Combined Code’ issued by the Institute of Chartered Accountants in England and Wales.
Barclays approach to risk management and control continues toevolve to reflect best practice, informed by new developmentsderived from risk management research. Barclays seeks to takerisks that are commensurate with the returns and within itsoverall risk appetite. Risk management’s objective is to ensurethat the variability of the results is within the range anticipatedin the business strategy.
Barclays governance framework has been further developedduring 2002. The framework is based on the following four principles:
During 2002, the Board established requirements (BoardGovernance Standards – ‘Standards’) for the management ofBarclays most significant areas of risk. From 2003, adherenceto these Standards is monitored by the Board through reportsthat include key risk indicators.
Responsibilities for risk management and controlThe responsibilities for risk management and control withinthe overall governance framework rest with:
» The Board, which ensures that management maintain an effective system of internal control and reviews itseffectiveness;
» The Group Risk Director, under delegation from the GroupChief Executive, who has responsibility for the adequacy of risk management and control;
» Business leaders, who are responsible for the identificationof the risks in their businesses and for the management of them;
» Business Risk Directors and their teams in the businesses,who are responsible for assisting business leaders in theidentification and management of their business riskprofile;
» Group Risk Type Heads and their teams in the GroupCentre, who are responsible for the risk control oversight of credit risk, operational risk, regulatory compliance riskand market risk; and
» Other Function Heads in the Group centre, who areresponsible for the risk control oversight of other risk types.
The leaders who execute these responsibilities are guided andmonitored by:
» The Group’s management committees. The maincommittees and their principal risk management andcontrol responsibilities are shown in the risk governancestructure chart on page 56. The committees’ roles havebeen reviewed and updated during 2002.
» Business and regional governance and control committees.These committees report to the Group Governance andControl Committee. Together, they are responsible forensuring that business risk governance and controlframeworks have been established in each business,consistent with the Group’s risk governance and controlframework. They also review and assess the completenessand effectiveness of, and compliance with, internal controlswithin each business.
Shareholder value based:» Internal controls should focus on risks that could prevent
the Group achieving its business objectives and thedesired shareholder value-added.
» Responsibility for internal controls must be clearlydefined and documented.
Board review:» The Board should undertake an annual review of the
effectiveness of the risk management processes andsystems of internal control.
» The Group’s risk profile should be reviewed on a regular basis.
Assurance:» Risk management systems should be able to provide
management with assurance that risks are beingmanaged appropriately and the system of internalcontrols over risk systems is adequate.
Embedded in the culture:» The culture of the Group should reflect the risk appetite
approved by the Board at all levels in the organisation.
» Training should be given to staff to ensure that risks canbe regularly monitored and that corrective action can betaken in a timely manner.
54 Barclays PLC Annual Report 2002

Risk management in the businesses is the responsibility ofbusiness management, who are assisted by Business RiskDirectors, with a functional reporting line to the Group RiskDirector. The key role of Business Risk Directors and theirteams is to assist the businesses to maximise value by:
» performing high quality risk analysis;» ensuring that risks are properly controlled;» evaluating economic trade-offs between risk and return;» designing cost-effective ways of mitigating and
transferring risks;» generating alternative risk strategies; and» ensuring that Group level policies are properly
implemented in their business line.
Specialist risk teams led by Group Risk Type Heads and other risk specialists report to the Group Risk Director. Their role is to:
» measure aggregate risk by type;» set high level policies and controls within the overall risk
governance framework;» perform research, development and quality assurance;» provide analytical support to businesses;» provide comprehensive reports to all levels of management
and the Board to enable them to make effective riskmanagement decisions; and
» run risk limit setting systems.
Risk management and measurementThe following are the principal risks managed by Barclays:
» Credit risk;» Market risk;» Asset and liability, liquidity and pricing mismatch risks; and» Other risks (including Operational, Legal and Tax risks,
and the risk of non-compliance with the many regulatoryregimes applicable to Barclays around the world).
Barclays uses a common metric to ensure that the returnsthroughout the Group are commensurate with the associatedrisks. Under this methodology, it allocates economic capital toeach business based on its risks. The businesses are expectedto optimise the return on the economic capital allocated to them.
The following charts show the relative amounts of capitalallocated to the various risks and businesses. The major risksare discussed in subsequent sections of this report.
Risk managementRisk management and control – overview
Average economic capital allocation by business during 2002
Business BankingPersonal Financial ServicesAfricaBarclays CapitalBGIBarclaycardBarclays Private ClientsGroup CentreOther Operations19%
25%
18%
13%
8%
8%
5%
2%
2%
Average economic capital allocationby risk type during 2002
CreditCountry TransferBusiness & OperationalProperty & EquipmentOtherMarketGroup Centre
8%4%
6%
10%63%
8%
1%
55Barclays PLC Annual Report 2002

» Debates and agrees actions on the riskprofile, strategy and key controlsacross the Group.
» Ensures consistency with Group riskappetite.
» Considers issues escalated by Risk typecommittees.
» Authority» Standards» Appetite
Credit Risk Review*Group Internal Audit
» Monitors the Group’s liquidity andmaturity mismatch.
» Monitors usage of regulatory andeconomic capital.
» Reviews policy/controls for liquidity,maturity transformation and structuralinterest rate exposure.
» Approves the Group risk governanceframework and principles.
» Approves risk management Standards.
» Approves overall Group risk appetite.
» Reviews the Group risk profile.
» Reviews the effectiveness of riskmanagement Standards.
» Reviews reports on control issues ofGroup level significance.
» Reviews the application of credit riskpolicies, procedures and processes andtheir consistency with businessdecisions and strategy.
» Assesses compliance with the systemof Internal control.
» Assesses management assuranceprocesses.
» Maintains and reviews thecompleteness and effectiveness of theGroup risk governance and controlframework.
» Monitors compliance with the riskgovernance framework.
» Ensures that principal controls areconsistent with risk managementStandards.
» Reviews reports of the managementassurance process over adequacy andeffectiveness of internal controls.
Group Risk Governance Structure
*Team to commence activities during 2003.
BO
AR
DO
VER
SIG
HT
MA
NA
GEM
ENT
PER
FOR
MA
NC
EA
SSU
RA
NC
E
Board Audit Committee
Board
Board Risk Committee
Group Risk Oversight CommitteeGroup Treasury CommitteeGroup Governance and Control Committee
Group Chief Executive Group Executive Committee
» Monitors and manages risk adjustedperformance of strategic business units.
» Approves economic capital allocations.
ASSURANCE REPORTING
Risk managementRisk management and control – overview
56 Barclays PLC Annual Report 2002

Barclays Probability of Default (PD) S&P Moody’sInternal Equivalent Equivalent
Rating Minimum Maximum Mid Point Rating Rating
1.2 0.02% 0.04% 0.025% AAA/AA+/AA Aaa/Aa/A1
1.5 0.05% 0.09% 0.075% AA-/A+ A2
1.8 0.10% 0.14% 0.125% A/A- A3
2.1 0.15% 0.19% 0.175% BBB+ Baa1
2.5 0.20% 0.24% 0.225% BBB+ Baa1
2.8 0.25% 0.29% 0.275% BBB Baa2
3 0.30% 0.59% 0.450% BBB/BBB- Baa2/Baa3
4 0.60% 1.19% 0.900% BB+/BB/BB- Ba1/Ba2
5 1.20% 2.49% 1.850% B+/B Ba3
6 2.50% 4.99% 3.750% B- B1
7 5.00% 9.99% 7.500% CCC- B2/B3
8 10.00%+ – 15.000% CC/C Caa/Ca/C
Risk managementCredit risk management
Credit risk managementCredit risk arises because the Group’scustomers, clients or counterparties may not be able or willing to fulfil their contractual obligations.Credit risk controlCredit is the Group’s most significant risk and its approach to managing credit risk varies according to the nature of the business.
In consumer businesses, such as Barclaycard where there arelarge numbers of accounts, a systems driven environmentprevails. Credit decisions are made with the aid of statisticallybased scoring systems and account management is likewiseautomated.
Mid-range credits are approved and reviewed according to a hierarchy of discretions, whereby discretionary limits are set according to the skills, experience and seniority of thesanctioning teams, in addition to the quality of the borrower as measured by the credit grading structure.
Large value wholesale loans are referred to the Group CreditCommittee or are sanctioned within business risk managementdepartments. Besides loans, these include significant creditexposures arising from money market, foreign exchange,derivatives, securities dealing and other similar products.
The Group Credit Risk Director provides central credit riskreview and oversight.
Functional areas assist the Group Credit Risk team and linebusinesses in setting policy and standards, defining the Group’srisk appetite and providing the capability for effective riskmanagement, including the regular review and challenge ofbusiness credit risk positions. These central risk functions addvalue by undertaking reporting, analysis, strategy and portfolioactivities that support corporate governance, overall portfoliomanagement, capital allocation for risk, Basel II implementationand credit decisions within business areas.
Credit risk measurementAs part of its credit risk measurement system, the Group uses a model-based methodology to assess the quality of creditacross different customer categories. The approach is termedRisk Tendency and applies to all credit exposures in bothwholesale and retail sectors, and it provides a statisticalestimate of the average losses looking one year ahead basedon the current performing loan portfolio. It estimates theaverage in the range of possible losses from the currentperforming loan portfolio and as such the actual outcome inany one year is likely to be different. Thus it is not a predictionof specific provisions but it gives management a clear view of the evolution of the quality of the credit portfolio.
Risk Tendency reflects the results of a set of model basedcalculations, the models having been created using historicaldata. The models are designed to estimate the loss over theforthcoming 12 months for the current performing loanportfolio, given the current composition and current riskcharacteristics of the portfolio. Significant variation around thisvalue can occur, due to changes in the economic environmentor the business conditions in specific sectors or countriesduring the year. This applies especially in wholesale portfolioswhere the default of a small number of large exposures canhave a significant impact on the outcome. However, for retailportfolios consisting of a very large number of small exposures,the variation from Risk Tendency is usually much smaller.
In addition to enhancing the understanding of the averagecredit quality of the portfolio, Risk Tendency is one of themeasures used by the Group to inform a wider range ofdecisions, such as:
» Setting exposure limits to any single counterparty or borrower;
» Establishing the desired aggregate exposure levels to individual sectors;
» Determining pricing policy; and
» Setting the level of the general provision for loan losses.
57Barclays PLC Annual Report 2002
Barclays Probability of Default (PD) S&P Moody’sInternal Equivalent Equivalent
Rating Minimum Maximum Mid Point Rating Rating
1.2 0.02% 0.04% 0.025% AAA/AA+/AA Aaa/Aa/A1
1.5 0.05% 0.09% 0.075% AA-/A+ A2
1.8 0.10% 0.14% 0.125% A/A- A3
2.1 0.15% 0.19% 0.175% BBB+ Baa1
2.5 0.20% 0.24% 0.225% BBB+ Baa1
2.8 0.25% 0.29% 0.275% BBB Baa2
3 0.30% 0.59% 0.450% BBB/BBB- Baa2/Baa3
4 0.60% 1.19% 0.900% BB+/BB/BB- Ba1/Ba2
5 1.20% 2.49% 1.850% B+/B Ba3
6 2.50% 4.99% 3.750% B- B1
7 5.00% 9.99% 7.500% CCC- B2/B3
8 10.00%+ – 15.000% CC/C Caa/Ca/C

The models assess the probability of customer default, severity,and exposure in the event of default. These terms are explainedbelow. A consistent approach is used across the organisation.Decision support model outputs are a way of assessing whatmight happen in the future based on past experience. Anincrease in the size of the portfolio and/or a decrease in thecredit quality will be highlighted to management by anincrease in Risk Tendency.
A number of different models are used in the Risk Tendencycalculation reflecting the diversity of the portfolio. They arebeing improved constantly as the Group collects more dataand deploys more sophisticated techniques. The Groupbelieves that each change will have a minor impact on the total result but should lead to better estimates over time.
Since Risk Tendency is a point in time calculation looking one year ahead, it does not make any allowance for growth orchange in the composition of the loan book after the reportingdate nor take account of write-backs and recoveries fromspecific provisions taken in previous years. In contrast, theprovisions process is dynamic where provisions are assessedand allocated throughout the year.
Risk Tendency is used when allocating general provisions for the existing portfolio of fully performing credits as at thecalculation date. Excluded from this portfolio is the subset of credit exposures relating to non-performing loans againstwhich specific provisions are held.
Internal ratingsInternal ratings are used to assess the credit quality ofborrowers. Each internal rating corresponds to a probability ofdefault (PD), which is the statistical probability of a customerdefaulting within a 12-month period. This internal rating isderived from different sources depending upon the borrower,e.g. internal model or credit rating agency. The table on page57 shows Barclays internal rating and the associated expectedprobability of default, together with comparisons with creditrating agency ratings. The rating agency comparisons shownare indicative only and, in practice, will vary over timedepending on the position within an economic cycle.
Where internal models are used they are based upon up-to-date account, market and financial information. The modelsare reviewed regularly to monitor their robustness relative toactual performance and revised as necessary to optimise their effectiveness.
SeveritySeverity is the estimated amount of loss expected if a loandefaults, calculated as a percentage of the exposure at the dateof default. It recognises that the loss is usually substantially lessthan the exposure. The value depends on the collateral, if any,seniority or subordination of the exposure, work-out expensesrelative to the loan value and other considerations. Theoutcome is heavily dependent on economic conditions thatdetermine prices that can be realised for assets or whetherbusinesses can be refinanced.
ExposureExposure in the event of default represents the expected levelof usage of the credit facility when default occurs. For example,the customer may not have drawn the loan up to the approvedlimit or may already have repaid some of it.
For derivative instruments, exposure in the event of default isthe estimated cost of replacing contracts with a positive valueif counterparties fail to perform their obligations. This cost ismonitored on an ongoing basis.
As shown in the table below, based upon the composition ofthe lending portfolio as at 31st December 2002, Risk Tendencyis £1,375m (31st December 2001: £1,245m). The increase isprimarily in Barclays Capital (total increase £65m), a reflectionof the grade migration of a small number of larger corporateclients, principally in the US, partially offset by some managedexposure reduction in the loan book; and a £35m increase inBarclaycard (total increase £55m) attributable to the acquisitionof the UK Providian credit card business. Risk Tendency inPersonal Financial Services has fallen by £10m to £370m during2002 as a result of actions taken to improve the asset qualitywithin the book and an improved collection process.
Risk mitigationBarclays uses mechanisms such as credit derivatives andsecuritisations to reduce the uncertainty of returns from thecredit portfolio. The cost of these transactions is treated as adeduction from the related category of income. The benefitsare reflected in reduced credit risk provisions, reduced volatilityof earnings and consequently an improved return on economic capital.
Risk Tendency by Business Cluster
2002 2001 2000£m £m £m
Personal Financial Services 370 380 335Barclays Private Clients 45 45 45Barclaycard 435 380 300Business Banking 280 260 215Barclays Africa 30 30 20Barclays Capital 210 145 115South American Corporate Banking 5 5 –
Total 1,375 1,245 1,030
Risk managementCredit risk management
58 Barclays PLC Annual Report 2002

Risk managementAnalysis of loans and advances
Analysis of loans and advancesLoans and advances grew strongly during2002. The following section analysesBarclays outstanding credit exposures atthe year end. We review the main points,then present more detailed information ina separate section, beginning on page 61.
Loans and advances overviewAs indicated in the table below, loans and advances grew over the year increasing by £32.5bn (14%) to £264bn at 31st December 2002.
2002 2001£m £m
Retail businessesCustomers 90,625 80,557Banks 1,748 2,588
Total retail businesses 92,373 83,145 Wholesale businesses
Customers 114,767 102,675Banks 56,508 45,353
Total wholesale businesses 171,275 148,028
Total 263,648 231,173
The analysis above is based on the business unit in which theloans are booked. Those businesses that deal primarily withpersonal customers, such as Personal Financial Services andBarclaycard, are included under retail businesses, even thoughthey have some business customers. Similarly, businesses that deal primarily with corporate, institutional and sovereignclients are included in wholesale businesses, even though theymay have some small business customers.
2002 2001£m £m
Banking book 175,667 161,240Trading book 87,981 69,933
Total 263,648 231,173
The amounts shown in the tables above are before deductionof provisions and interest in suspense.
Loans and advances to customersGeographical analysisThe geographical analysis is based on the location of the office recording the transaction.
The chart below shows that about two thirds of loans andadvances to customers have been booked in the UK on thebanking book.
Industry analysisBarclays tracks its global exposure by industry, payingparticular attention to industries that might be volatile or pose higher risk. Over recent years it has been apparent thatindustries are often synchronised globally. For example, whenoil prices rise or fall, customers sensitive to such changes will be affected regardless of their location.
A critical element of risk management is to ensure adequatediversification of credit exposures. As the following chartshows, (for banking book only) Barclays largest sectoralexposures are to home loans, other personal loans andbusiness and other services. These categories overwhelminglycomprise small loans, have lower volatility of credit riskoutcomes, and are intrinsically highly diversified.
Loans and advances to the energy and utility sector were ofspecial interest in 2002 due to financial stress experienced byseveral companies on both sides of the Atlantic. The majorityof Barclays exposure in this sector is to companies that theGroup believes remain financially strong, with three-quartershaving an investment grade rating at year end.
The communications sector continued to experience stress in2002. In addition to the lendings categorised as communications,exposure to this sector is also included in the category ofoverseas customers.
Industry classifications have been prepared at the level of theborrowing entity. This means that a loan to the subsidiary of a major corporation is classified by the industry in which thesubsidiary operates, even though the parent’s predominantbusiness may be in a different industry.
Loans to customers domiciled outside the country where theoffice recording the transaction is located are shown in thechart below under ‘Overseas customers’ and not by industry.
More detail on loans and advances to customers appears on pages 61 to 63.
Geographic analysis of loans and advances to customers*
UK**Other European Union**United States**Rest of the World**Trading business
66%
3%3%
6%
22%
* £205bn at 31st December 2002** Banking Book
59Barclays PLC Annual Report 2002
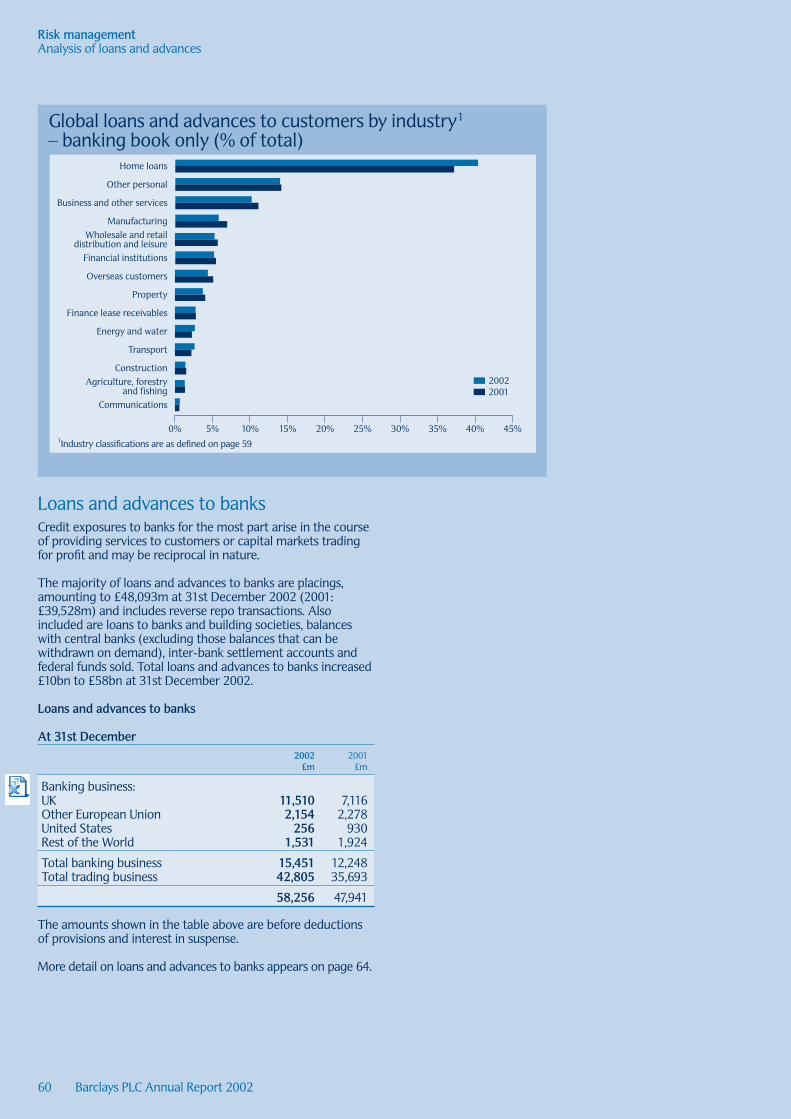
Risk managementAnalysis of loans and advances
Loans and advances to banksCredit exposures to banks for the most part arise in the courseof providing services to customers or capital markets tradingfor profit and may be reciprocal in nature.
The majority of loans and advances to banks are placings,amounting to £48,093m at 31st December 2002 (2001:£39,528m) and includes reverse repo transactions. Alsoincluded are loans to banks and building societies, balanceswith central banks (excluding those balances that can bewithdrawn on demand), inter-bank settlement accounts andfederal funds sold. Total loans and advances to banks increased£10bn to £58bn at 31st December 2002.
Loans and advances to banks
At 31st December 2002 2001
£m £m
Banking business:UK 11,510 7,116Other European Union 2,154 2,278United States 256 930Rest of the World 1,531 1,924
Total banking business 15,451 12,248Total trading business 42,805 35,693
58,256 47,941
The amounts shown in the table above are before deductionsof provisions and interest in suspense.
More detail on loans and advances to banks appears on page 64.
60 Barclays PLC Annual Report 2002
Global loans and advances to customers by industry – banking book only (% of total)
20% 25%10% 15%5% 30% 35% 40% 45%
Home loans
Other personal
Business and other services
ManufacturingWholesale and retail
distribution and leisureFinancial institutions
Overseas customers
Property
Finance lease receivables
Energy and water
Transport
ConstructionAgriculture, forestry
and fishingCommunications
0%
20022001
1
1Industry classifications are as defined on page 59

Risk managementAnalysis of loans and advances – further information
61Barclays PLC Annual Report 2002 61
Further information and statutorydisclosures on loans and advancesThis section presents more detailedinformation on loans and advances and includes disclosures that Barclays isrequired to make. For an overview of loansand advances, see the preceding section.Loans advances to customers – further informationMaturity analysisThe analysis by maturity, shown in the accompanying tables and chart, show that approximately 40% of lendings to customers have a maturity of more than five years, themajority of which are mortgages.
Maturity analysis of loans and advances to customers*
On demandNot more than three monthsOver three months but not more than one yearOver one year but no more than five yearsOver five years
*£205bn at 31st December 2002
29%
15%9%
40%
7%
Maturity analysis of loans and advances to customersOver three Over one
months year but Not more but not not more
than three more than than five OverOn demand (a) months one year years five years Total
At 31st December 2002 £m £m £m £m £m £m
Banking business:UKCorporate lending (b) 8,340 7,047 5,604 14,251 10,519 45,761Other lending from UK offices 2,416 6,693 6,135 10,919 63,976 90,139
Total UK 10,756 13,740 11,739 25,170 74,495 135,900Other European Union 856 1,976 2,187 2,945 4,615 12,579United States – 768 1,227 2,451 1,692 6,138Rest of the World 439 2,859 1,370 605 326 5,599
Total banking business 12,051 19,343 16,523 31,171 81,128 160,216Total trading business 2,409 41,247 1,392 91 37 45,176
14,460 60,590 17,915 31,262 81,165 205,392
At 31st December 2001
Banking business:UKCorporate lending (b) 8,335 6,344 7,165 11,522 9,588 42,954Other lending from UK offices 2,533 6,447 6,559 10,155 55,606 81,300
Total UK 10,868 12,791 13,724 21,677 65,194 124,254Other European Union 1,251 2,475 1,550 2,277 3,155 10,708United States – 1,237 1,541 2,348 1,488 6,614Rest of the World 1,089 1,820 2,670 823 1,014 7,416
Total banking business 13,208 18,323 19,485 27,125 70,851 148,992Total trading business 1,977 29,733 2,398 132 – 34,240
15,185 48,056 21,883 27,257 70,851 183,232
Notes(a) Overdrafts are included in the ‘on demand’ category.
(b) In the UK, finance lease receivables are included in Other Lending although some leases are to corporate customers.

Risk managementAnalysis of loans and advances – further information
Interest rate sensitivity of loans and advances to customers
Fixed Variable rate rate Total
At 31st December 2002 £m £m £m
Banking business:UK 41,332 94,568 135,900Other European Union 2,876 9,703 12,579United States 314 5,824 6,138Rest of the World 4,351 1,248 5,599
Total banking business 48,873 111,343 160,216Total trading business 20,204 24,972 45,176
69,077 136,315 205,392
Geographic and industry analysisIn the analyses below, overseas customers are customers resident outside the country in which the lending business is based.
Loans and advances to customers in offices in the UK – banking business2002 2001 2000 1999 1998
At 31st December £m £m £m £m £m
Financial institutions 6,158 5,616 4,215 4,118 1,839 Agriculture, forestry and fishing 1,747 1,626 1,689 1,693 1,612 Manufacturing 6,435 6,766 7,573 6,954 6,840 Construction 1,825 1,779 1,666 1,331 1,227 Property 5,695 5,600 5,130 3,689 3,205Energy and water 1,290 1,153 1,120 613 668 Wholesale and retail distribution and leisure 7,858 7,571 7,531 6,455 6,778 Transport 2,366 1,894 1,353 1,270 1,164 Communications 694 368 180 345 261 Business and other services 11,693 10,581 9,894 8,415 7,549 Home loans 58,436 50,945 47,235 18,316 16,580 Other personal 21,357 19,678 18,200 15,673 14,376 Overseas customers 6,201 6,472 5,024 4,711 3,056
131,755 120,049 110,810 73,583 65,155 Finance lease receivables 4,145 4,205 4,504 5,094 5,279
135,900 124,254 115,314 78,677 70,434
The majority of the growth in the UK occurred in home loans, where balances increased 15% to £58.4bn. Other personal loans inthe UK increased in part due to the acquisition of the UK card business of Providian (£470m).
62 Barclays PLC Annual Report 2002

63Barclays PLC Annual Report 2002
Risk managementAnalysis of loans and advances – further information
Loans and advances to customers in offices in other European Union countries – banking business
2002 2001 2000 1999 1998 At 31st December £m £m £m £m £m
Financial institutions 371 500 436 178 220 Agriculture, forestry and fishing 165 240 303 223 109 Manufacturing 1,422 1,317 1,420 1,322 975Construction 314 298 261 193 148Property 137 241 182 144 182 Energy and water 367 282 372 145 114 Wholesale and retail distribution and leisure 215 283 140 207 323Transport 252 318 172 119 133 Communications 173 185 83 37 9 Business and other services 1,648 1,679 1,284 918 1,433 Home loans 6,243 3,871 4,436 1,029 932 Other personal 721 661 582 505 500 Overseas customers 384 685 381 462 358
12,412 10,560 10,052 5,482 5,436 Finance lease receivables 167 148 151 494 503
12,579 10,708 10,203 5,976 5,939
Loans and advances to customers in offices in the United States – banking business
2002 2001 2000 1999 1998 At 31st December £m £m £m £m £m
Financial institutions 1,036 1,053 616 320 527 Agriculture, forestry and fishing 3 – – 1 1 Manufacturing 842 1,553 1,123 727 592 Construction 31 24 – – 12Property 15 21 30 69 80 Energy and water 2,229 1,567 1,440 1,168 645 Wholesale and retail distribution and leisure 141 160 214 138 323 Transport 1,248 931 580 356 53 Communications 46 66 88 166 383 Business and other services 441 901 2,174 1,000 1,471 Home loans – – 1 1 1Other personal – 267 6 58 7 Overseas customers 62 23 56 – 27
6,094 6,566 6,328 4,004 4,122 Finance lease receivables 44 48 48 44 42
6,138 6,614 6,376 4,048 4,164
Loans and advances to customers in offices in the Rest of the World – banking business2002 2001 2000 1999 1998
At 31st December £m £m £m £m £m
Loans and advances 5,566 7,384 8,920 8,316 2,883 Finance lease receivables 33 32 30 28 28
5,599 7,416 8,950 8,344 2,911
£1.4bn of the reduction in the Rest of the World balance arose from the reorganisation of the Group’s Caribbean business.
Total loans and advances to customers2002 2001 2000 1999 1998
At 31st December £m £m £m £m £m
Banking business 160,216 148,992 140,843 97,045 83,448 Trading business 45,176 34,240 23,198 21,562 13,611
205,392 183,232 164,041 118,607 97,059
Of the total loans and advances to customers, reverse repos were £42.5bn (31st December 2001: £29.7bn).

Loans and advances to banks – further informationMaturity analysis of loans and advances to banks
Over three Over onemonths year but
Not more but not not morethan three more than than five Over
On demand months one year years five years TotalAt 31st December 2002 £m £m £m £m £m £m
Banking business:UK 423 2,742 648 7,518 179 11,510Other European Union 222 1,689 84 31 128 2,154United States 14 110 118 14 – 256Rest of the World 262 890 376 3 – 1,531
Total banking business 921 5,431 1,226 7,566 307 15,451Total trading business 1,052 38,693 3,060 – – 42,805
1,973 44,124 4,286 7,566 307 58,256
Over three Over onemonths year but
Not more but not not morethan three more than than five Over
On demand months one year years five years TotalAt 31st December 2001 £m £m £m £m £m £m
Banking business:UK 723 1,244 1,302 3,766 81 7,116 Other European Union 535 1,397 59 49 238 2,278United States 12 342 489 87 – 930Rest of the World 490 1,202 230 2 – 1,924
Total banking business 1,760 4,185 2,080 3,904 319 12,248Total trading business 2,357 31,808 1,517 11 – 35,693
4,117 35,993 3,597 3,915 319 47,941
Interest rate sensitivity of loans and advances to banksFixed Variable
rate rate TotalAt 31st December 2002 £m £m £m
Banking business:UK 6,493 5,017 11,510Other European Union 1,830 324 2,154United States 30 226 256Rest of the World 1,212 319 1,531
Total banking business 9,565 5,886 15,451Total trading business 24,929 17,876 42,805
34,494 23,762 58,256
Risk managementAnalysis of loans and advances – further information
64 Barclays PLC Annual Report 2002

6565Barclays PLC Annual Report 2002
Loans and advances to borrowers in currencies other than the local currency of the borrower for countries where this exceeds 1% of total Group assets
Banks Commercialand other Governments industrial
As % of financial and official and otherassets Total institutions institutions private sector
% £m £m £m £m
At 31st December 2002United States 4.2 17,140 9,672 1 7,467Germany 2.5 10,094 9,841 7 246France 1.2 4,871 4,484 24 363
At 31st December 2001United States 2.3 8,294 4,878 – 3,416Germany 2.3 8,218 8,031 1 186France 1.2 4,203 3,088 22 1,093
At 31st December 2000Germany 2.4 7,505 6,829 554 122United States 1.9 6,104 3,125 5 2,974Japan 1.1 3,493 2,721 96 676
Loans and advances to borrowers in currencies other than the local currency of the borrower for countries where this isbetween 0.75% and 1% of total Group assets.At 31st December 2002, Netherlands and Ireland had cross-currency outstanding of between 0.75% and 1% of total Groupassets, amounting to £7,552m. At 31st December 2001, Japan and Netherlands had cross-currency outstandings of between0.75% and 1% of total Group assets, amounting to £5,774m. At 31st December 2000, Netherlands and France had cross-currency outstandings of between 0.75% and 1% of total Group assets, amounting to £5,745m.
Country riskExposure to countries subject to International Monetary Fund liquidity support programmesThe table below provides data on total country exposure,which includes both cross-border and local currencyobligations. Exposure includes amounts outstanding pluscommitments, and is net of provisions. The sample ofcountries is based on those that make significant use of IMFliquidity support programmes, i.e. those drawing more thanSpecial Drawing Rights 2bn.
2002 2001 2000At 31st December £bn £bn £bn
EuropeTurkey 0.1 0.2 *
AsiaIndonesia 0.1 0.1 0.1 South Korea * * 0.2Thailand * * 0.1
0.1 0.1 0.4 Latin AmericaArgentina 0.1 0.3 0.9 Brazil** 0.2 0.7 *
0.3 1.0 0.9
Total 0.5 1.3 1.3
Comprising of:Banks 0.2 0.7 0.8 Governments/sovereigns 0.1 0.1 0.1 Corporates and project financings 0.2 0.5 0.4
0.5 1.3 1.3
* Did not make significant use of IMF Liquidity supportprogrammes at the end of the period.
** £0.1 billion of this total relates to local currency exposure.
Risk managementCountry risk
Loans and advances to borrowers in currencies other than the local currency of the borrower The world-wide operations of the Group involve significantexposures in non-local currencies. These cross-borderexposures are controlled through a well-developed system of country limits, which are frequently reviewed to avoidconcentrations of transfer, economic or political risks.
The US SEC requires that Barclays report those exposuresdenominated in currencies other than the borrower’s localcurrency. These outstandings exclude finance provided withinthe Group, and are based on the country of domicile of theborrower or guarantor of ultimate risk. They comprise loansand advances to customers and banks (including placings),finance lease receivables, interest bearing investments,acceptances, other monetary assets and on-balance sheetamounts arising from off-balance sheet financial instruments.
At 31st December 2002, the countries where theseoutstandings exceeded 1% of total Group assets were UnitedStates, Germany and France. Exposures to these countriesamounted to £32,105m at 31st December 2002 (2001:£20,715m). Further detail is provided in the table below.

Risk managementPotential credit risk lendings
The tables and charts that follow present an analysis ofpotential credit risk lendings consistent in total with UKguidelines and practice, although more detail is provided tomeet SEC guidelines. Further disclosure is made to record loans where interest is accrued but is being suspended orwhere specific provisions have been raised. Normal US banking practice would be to place such loans on non-accrualstatus. The amounts are stated before deduction of the valueof security held, the specific provisions carried or interestsuspended, all of which might reduce the impact of aneventual default, should it occur. The geographical presentationis based on the location of the office recording the transaction.
Potential credit risk lendingsPotential credit risk lendings (PCRL’s)comprise non-performing loans (NPL’s)and potential problem loans (PPL’s). NPL’sare loans where the customers have failedto meet their commitments, either in partor in whole. PPL’s are loans which arecurrent as to payment of principal andinterest, but where there exists seriousdoubt as to the ability of the borrowers to comply with repayment terms in thenear future.
Non-performing loans2002 2001 2000 1999 1998
restated restated£m £m £m £m £m
Non-accrual lendings:UK 1,557 1,292 1,223 1,007 985Other European Union 108 90 96 122 208United States 744 306 119 47 38Rest of the World 133 235 101 75 36
Accruing lendings where interest is being suspended:UK 472 386 351 326 266Other European Union 44 30 36 19 26United States – – – – –Rest of the World 95 145 109 91 92
Other accruing lendings against which provisionshave been made:UK 606 660 474 423 457 Other European Union 27 20 71 42 74United States – 11 2 38 10Rest of the World 44 43 76 50 50
Subtotals:UK 2,635 2,338 2,048 1,756 1,708 Other European Union 179 140 203 183 308United States 744 317 121 85 48Rest of the World 272 423 286 216 178
Accruing lendings 90 days overdue, against whichno provisions have been made:UK 687 621 695 343 309 Other European Union 3 – 1 – 2United States – – – – –Rest of the World – 27 17 18 17
Reduced rate lendings:UK 4 4 6 6 7Other European Union – – – – –United States – – – – –Rest of the World 2 1 – 2 –
Total non-performing loans:UK 3,326 2,963 2,749 2,105 2,024 Other European Union 182 140 204 183 310United States 744 317 121 85 48Rest of the World 274 451 303 236 195
Total 4,526 3,871 3,377 2,609 2,577
66 Barclays PLC Annual Report 2002

Barclays PLC Annual Report 2002 67
Risk managementPotential credit risk lendings
Potential problem loans
2002 2001 2000 1999 1998 £m £m £m £m £m
UK 993 968 728 648 590Other European Union 2 2 2 23 24United States 241 369 313 5 4Rest of the World 68 63 64 35 68
Total 1,304 1,402 1,107 711 686
UK non-performing loans increased by £363m to £3,326m primarily reflecting increases in the large corporate sector. Theseincluded loans to foreign borrowers made in the UK and were spread across a number of sectors, with telecommunications andenergy being prominent. There were also additions from UK middle market business customers.
US non-performing loans increased by £427m to £744m reflecting the continued difficult economic conditions faced by thetelecommunications and energy sectors. US potential problem loans fell by £128m to £241m primarily due to the reclassificationof balances into the non-performing categories.
Other European Union non-performing loans increased from £140m to £182m. In the Rest of the World they fell to £274m, a decrease of £177m, primarily reflecting the reorganisation of the Group’s Caribbean business in October 2002.
Interest forgone on non-performing loansThe total interest income that would have been recognised under the original contractual terms of the non-performing loans in 2002 was £275m (2001: £279m) of which £209m (2001: £210m) related to domestic lending and £66m (2001: £69m) relatedto foreign loans.
Interest income of approximately £22m (2001: £50m) from such loans was included in profit, of which £21m (2001: £33m)related to domestic lending and the remainder to foreign lending.
Ratios of provisions to non-performing loans and PCRL’s appear in the next section, following the discussion of provisions.
Potential problem lendings
£m
800
600
400
200
1,200
1,000
1,400
1,600
0
UK officesForeign offices
993
648590728
968
311
63
379
434
96
20021999 2000 20011998
Non-performing lendings
£m
1,000
3,000
2,000
4,000
5,000
0
UK officesForeign offices
2002
3,326
1999
2,105
2000
2,749
2001
2,963
1998
2,024
1,200
504
628908
553

68 Barclays PLC Annual Report 2002
Risk managementProvisions for bad and doubtful debts
Provisions for bad and doubtful debtsBarclays policy is to provide for creditlosses when it considers that recovery is doubtful. The provision is made up of two components, a specific provisionand a general provision. Risk managerscontinuously review the quality of theexposures based on their knowledge of the customer or counterparty, anddevelopments in the industry and countryof operation.During 2002, credit conditions were less favourable than forseveral years and some sectors experienced difficulties. Thesecircumstances are reflected in the bad debt charge for the yearas set out in the table below. The net charge rose by 29% to£1,484m, an increase of £335m. New and increased specificprovisions were 19% higher at £1,719m. Releases andrecoveries together decreased by 15% at £233m.
The greater part of this increase occurred in Barclays Capital(£231m) and in the South American Corporate Banking(£96m) portfolios. The increase in provisions at BarclaysCapital reflected difficult economic conditions, mainly in thetelecommunications and energy sectors, particularly in the US. The deterioration in the second half of 2002 was largely in existing non-performing loans. The increase in SouthAmerican Corporate Banking mainly related to Argentina.
Business Banking sustained an 8% increase in its bad debtprovision charge, broadly in line with expectations. The charge for Barclaycard was £402m, 7% higher reflecting theacquisition of Providian UK and organic growth in averageextended credit balances of 9%. Within Personal FinancialServices, the provision charge fell by 13%, reflecting in partimprovements in risk management.
Analysis of provision charges for bad and doubtful debtsAs at 31st December
2002 2001 2000 1999 1998 £m £m £m £m £m
Net specific provision charge / (release)*UK 1,041 964 688 568 501Other European Union 14 20 12 1 (4)United States** 385 136 17 34 (10) Rest of the World 46 45 60 32 5
Total net specific provision charge 1,486 1,165 777 635 492General provision charge / (release) (2) (16) 40 (14) –
1,484 1,149 817 621 492
* The geographical analysis of provisions is based on the location of the office recording the transaction.** The US charge includes provisions raised against Argentinean exposures booked in the US.
Analysis of provision balances for bad and doubtful debtsAs at 31st December
2002 2001 2000 1999 1998 £m £m £m £m £m
Specific provision*UK 1,790 1,605 1,343 1,083 937Other European Union 84 89 112 131 220United States** 257 89 20 23 23 Rest of the World 130 188 118 74 35
Total specific provision 2,261 1,971 1,593 1,311 1,215General provision 737 745 760 672 728
2,998 2,716 2,353 1,983 1,943
Average loans and advances for the year(excluding trading business) 174,764 157,904 122,333 106,488 101,338
(including trading business) 256,789 223,221 176,938 147,139 145,749
* The geographical analysis of provisions is based on the location of the office recording the transaction.** The US balance includes provisions held against Argentinean exposures booked in the US.

69Barclays PLC Annual Report 2002
Provisioning approachGeneral provisions reflect losses that, although not specificallyidentified, are known from experience to be present in thelending portfolio at the balance sheet date.
These provisions are adjusted at least half yearly by anappropriate charge or release of general provisions based onstatistical estimates. The general provisions take Risk Tendency(statistically expected losses) into account, based on modelsthat are systematically updated to reflect evolving lossexperience.
See Credit risk management on pages 57 to 58 for a fullerdescription of Risk Tendency.
Specific provisions are raised for:
» Individual counterparties when the Group considers thatthe creditworthiness of a borrower or counterparty hasundergone deterioration such that the recovery of thewhole or part of an outstanding advance is in seriousdoubt.
» Homogeneous portfolios comprised of large numbers ofindividually small lendings, where the characteristics of theportfolio permit statistical models to be used in estimatingspecific provisions. These statistical models are consistentwith the Group’s policy of raising provision when recoveryis doubtful. These provisions are raised in parts of PersonalFinancial Services, Woolwich, Barclays Private Clients,Barclaycard and Business Banking.
Write-off occurs immediately to the extent that the whole orpart of the debt is considered unrecoverable.
Risk managementProvisions for bad and doubtful debts
Provision charge analysis
Specific provisions – New and IncreasedSpecific provisions – Releases and RecoveriesGeneral provision – Charge/(release)Total provisions charge
981
-204
2000
40
817
1,440
-275
2001
-16
1,149
£m
200
0
400
600
1,000
800
1,400
1,200
1,800
1,600
-200
-400
2002
1,719
-233
-2
1,484
Provision balances
GeneralSpecific
£m
1,000
500
1,500
2,000
2,500
4,000
3,500
3,000
0
2,261
2002
737
1,971
2001
745
1,311
1999
672
1,593
2000
760
1,215
1998
728
1,122
1997
728
1,374
1996
756
1995
1,875
853
2,342
1994
8502,975
1993
789
2,755
1992
690

Risk managementProvisions for bad and doubtful debts
70 Barclays PLC Annual Report 2002
Treatment of interest on debts that have specific provisions If the collection of interest is doubtful, it is credited to asuspense account and excluded from interest income in theprofit and loss account. Although interest continues to becharged to the customer’s account, the amount suspended is netted against the relevant loan. Loans on which interest is suspended are not reclassified as accruing interest untilinterest and principal payments are up-to-date and futurepayments are reasonably assured. If the collection of interest is considered remote, interest is no longer applied.
Treatment of collateral assets acquired in exchange for advancesAssets acquired in exchange for advances in order to achievean orderly realisation continue to be reported as advances. The assets acquired are recorded at the carrying value of the original advance as at the date of the exchange. Any impairment is accounted for as a specific provision.
Bad debt provisions charge ratios
Year ended 31st December
2002 2001 2000 1999 1998% % % % %
Provisions charge as a percentage of averageloans and advances for the year(excluding trading business):Specific provisions 0.85 0.74 0.64 0.60 0.49General provisions – (0.01) 0.03 (0.02) –
0.85 0.73 0.67 0.58 0.49
Amounts written off (net of recoveries) 0.64 0.53 0.47 0.52 0.40
Provisions charge as a percentage of averageloans and advances for the year(including trading business):Specific provisions 0.58 0.52 0.44 0.43 0.34 General provisions – – 0.02 (0.01) –
0.58 0.52 0.46 0.42 0.34
Amounts written off (net of recoveries) 0.43 0.37 0.32 0.38 0.28
Provisions balance ratiosAs at 31st December
2002 2001 2000 1999 1998% % % % %
Provisions balance at end of year as a percentageof loans and advances at end of year(excluding trading business):Specific provision 1.29 1.22 1.06 1.19 1.17General provision 0.42 0.46 0.51 0.61 0.70
1.71 1.68 1.57 1.80 1.87
Provisions balance at end of year as a percentageof loans and advances at end of year(including trading business):Specific provision 0.86 0.85 0.79 0.83 0.90 General provision 0.28 0.32 0.38 0.42 0.54
1.14 1.17 1.17 1.25 1.44

71Barclays PLC Annual Report 2002
Movements in provisions for bad and doubtful debtsYear ended 31st December
2002 2001 2000 1999 1998 £m £m £m £m £m
Provisions balance at beginning of year 2,716 2,353 1,983 1,943 1,850 Acquisitions and disposals (11) 46 119 (10) – Exchange and other adjustments (77) (1) 4 (13) 6 Amounts written off:UK (950) (814) (595) (546) (520) Other European Union (31) (36) (45) (44) (45) United States (215) (94) (26) (40) (7) Rest of the World (24) (29) (17) (21) (9)
(1,220) (973) (683) (651) (581)
Recoveries (analysed below) 106 142 113 93 176
Subtotal 1,514 1,567 1,536 1,362 1,451 Provisions charged against profitNew and increased specific provisions:UK 1,210 1,157 843 768 753 Other European Union 33 35 35 27 32 United States 404 173 27 45 11 Rest of the World 72 75 76 47 23
1,719 1,440 981 887 819
Releases of specific provisions:UK (81) (87) (55) (115) (96)Other European Union (12) (10) (17) (22) (32)United States (10) (10) (6) (7) (8) Rest of the World (24) (26) (13) (15) (15)
(127) (133) (91) (159) (151)
Recoveries:UK (88) (106) (100) (85) (156) Other European Union (7) (5) (6) (4) (4)United States (9) (27) (4) (4) (13)Rest of the World (2) (4) (3) – (3)
(106) (142) (113) (93) (176)
Net specific provisions charge 1,486 1,165 777 635 492 General provision charge/(release)* (2) (16) 40 (14) –
Net charge to profit 1,484 1,149 817 621 492
Provisions balance at end of year 2,998 2,716 2,353 1,983 1,943
* An analysis of the movement in general provisions is shown in note 17 to the accounts.
Risk managementProvisions for bad and doubtful debts

Provisions charge for bad and doubtful debts by industry
Net specific provision for the year Specific provisions at 31st December
2002 2001 2000 1999 1998 2002 2001 2000 1999 1998£m £m £m £m £m £m £m £m £m £m
UK:Banks and other financial institutions 1 (2) 7 10 11 1 5 7 9 14Agriculture, forestry and fishing (1) 6 6 4 (5) 7 13 11 7 4Manufacturing 80 62 8 4 15 98 49 43 48 41Construction 41 12 7 4 (7) 35 6 8 7 10Property 8 3 1 (5) (20) 9 8 8 8 12Energy and water 22 1 8 – – 28 10 8 2 2Wholesale and retaildistribution and leisure 37 44 21 34 (10) 54 60 42 42 18Transport 7 6 2 4 (1) 7 6 4 4 2Communications 16 1 – – 1 15 1 1 1 1Business and other services 62 75 27 14 (7) 92 77 40 34 43Home loans 4 8 10 5 (4) 53 60 61 39 35Other personal 748 782 577 504 376 1,343 1,252 1,041 830 664Overseas customers (a) 13 (34) 6 (22) 152 39 52 58 41 88Finance lease receivables 3 – 8 12 – 9 6 11 11 3
1,041 964 688 568 501 1,790 1,605 1,343 1,083 937Foreign 445 201 89 67 (9) 471 366 250 228 278
1,486 1,165 777 635 492 2,261 1,971 1,593 1,311 1,215
Analysis of amounts written off and recovered by industry
Amounts written off for the year Recoveries of amounts previously written off
2002 2001 2000 1999 1998 2002 2001 2000 1999 1998£m £m £m £m £m £m £m £m £m £m
UK:Banks and other financial institutions 2 3 13 14 16 – 3 4 2 12Agriculture, forestry and fishing 4 7 6 6 2 2 2 2 3 7Manufacturing 72 65 30 20 28 22 11 16 12 12Construction 15 16 8 12 12 3 2 2 3 5Property 10 5 5 9 17 2 1 3 7 22Energy and water 4 1 2 – – 1 – – – –Wholesale and retaildistribution and leisure 53 35 34 35 25 11 9 12 17 45Transport 7 4 3 4 2 1 – 1 1 1Communications 2 – – 1 – – – – – –Business and other services 65 57 33 43 36 13 9 11 12 27Home loans 11 14 15 3 8 1 4 3 2 4Other personal 692 599 435 363 254 31 29 28 24 21Overseas customers (a) 9 2 7 31 120 – 35 17 1 –Finance lease receivables 4 6 4 5 – 1 1 1 1 –
950 814 595 546 520 88 106 100 85 156Foreign 270 159 88 105 61 18 36 13 8 20
1,220 973 683 651 581 106 142 113 93 176
Note(a) includes amounts in 1998 in respect of Russian counterparties recorded in the UK.
Risk managementProvisions for bad and doubtful debts
72 Barclays PLC Annual Report 2002

73Barclays PLC Annual Report 2002
Risk managementProvisions for bad and doubtful debts
Total provision coverage of total non-performing loans2002 2001 2000 1999 1998
% % % % %
UK 73.5 74.9 72.9 81.1 78.4Other European Union 71.4 78.6 72.1 94.5 95.2United States 43.7 61.8 81.0 74.1 104.2Rest of the World 65.0 59.2 64.7 50.4 45.1
Total 68.0 72.1 72.4 79.1 78.4
Total provision coverage of total potential credit risk lendings (NPL’s and PPL’s)
2002 2001 2000 1999 1998 % % % % %
UK 56.6 56.4 57.7 62.0 60.7Other European Union 70.7 77.5 71.4 84.0 88.3United States 33.0 28.6 22.6 70.0 96.2Rest of the World 52.0 51.9 53.4 43.9 33.5
Total 52.8 52.9 54.5 62.1 61.9
Geographically, the specific provision is allocated according to the location of the office recording the transaction. Similarly, thegeneral provision is allocated according to the characteristics of the loans in each geographic area.
Another useful way of assessing provision balances is to recognise that specific provisions are created to cover non-performingloans, whereas general provisions relate to as yet unidentified losses on performing lendings. The following table provides ananalysis of provision balances on this basis.
Ratios of general and specific provision balances2002 2001 2000 1999 1998
% % % % %
Specific provisions coverage of non-performing loansSpecific provisions/Non-performing loans 50.0 50.9 47.2 50.2 47.1General provisions coverage of performing loansGeneral provisions/Performing loans 0.28 0.33 0.38 0.43 0.55
The ratio of general provisions to performing loans declined in 2001 with the acquisition of Woolwich plc, a portfolio consistingpredominantly of secured residential mortgage loans needing comparatively low general provisions. These ratios include bothtrading and banking books. Performing loans comprise gross loans and advances to banks and customers (banking and trading)less non-performing loans.
Provisions ratios
%
40
20
80
60
100
120
0
Total provisions/non-performing lendingsTotal provisions/potential credit risk lendings
2002
52.8
68.0
1999
62.1
79.1
2000
54.5
72.4
2001
52.9
72.1
1998
61.9
78.4

74 Barclays PLC Annual Report 2002
Risk managementMarket risk management
Market risk managementMarket risk is the risk that the Group’searnings or capital, or its ability to meetbusiness objectives, will be adverselyaffected by changes in the level orvolatility of market rates or prices such as interest rates including credit spreads,foreign exchange rates, equity prices and commodity prices.Market risk management and control responsibilitiesThe market risk management policies of the Group aredetermined by the Group Risk Oversight Committee, whichalso recommends overall market risk appetite to the Board Risk Committee. The Group’s policy is that exposure to marketrisk arising from trading activities is concentrated in BarclaysCapital and that residual market risk in other parts of the bankis tightly controlled and significantly limited.
The Group Market Risk Director is responsible for theeffectiveness and efficiency of the Group’s market risk controlframework, and is assisted by risk management departments in the Group’s businesses and a central market riskmanagement team.
The Group Risk Oversight Committee allocates a total DailyValue at Risk (DVaR) limit for the Group and delegates the day to day control and monitoring of market risk to the GroupMarket Risk Director, who sets limits for each business area. Toassist this process, a market risk report is produced daily whichsummarises the Group’s market risk exposures against agreedlimits. Data for this report is supplied by the business areas.This daily report is sent to the Group Risk Director, the GroupMarket Risk Director, the Group Finance Director and theappropriate Business Risk Directors.
A more detailed market risk report is presented each month by the Group Market Risk Director to the Group Risk OversightCommittee. This report brings to the attention of all Committeemembers current Group market risk exposures and issuesalong with relevant background information.
Each business area of the Group is accountable for identifying,measuring and managing all market risks associated with itsactivities. In managing market risk, businesses must considerasset liquidity risk and funding liquidity risk where these issuesare relevant.
Market risk measurementBarclays uses the DVaR measure as the primary mechanism forcontrolling market risk. DVaR is an estimate, with a confidencelevel of 98%, of the potential loss which might arise if thecurrent positions were to be held unchanged for one businessday. Daily losses exceeding the DVaR figure are likely to occur,on average, only twice in every one hundred business days.
Where DVaR does not adequately measure the risk, alternativemethods are used such as Annual Earnings at Risk. AnnualEarnings at Risk measures the sensitivity of annual earnings to shocks in market rates at the 99th percentile for changeover a one year period. This rate shock is consistent with thestandardised rate shock recommended by the Basel IIframework for assessing banking book interest rate risk.
To facilitate the identification, measurement, control andreporting of market risk, Barclays has categorised market risk into three broad categories as described below:
(i) Trading market riskTrading includes transactions where Barclays Capital acts asprincipal with clients or with the market. A detailed analysis of this risk is provided below.
(ii) Asset and liability managementThe Group encounters risks in managing its assets and liabilities.A detailed analysis of these risks is covered in the Treasury Assetand Liability Management section on pages 81 to 84.
(iii) Other market risksIn some instances, the Group incurs market risks that do not fitinto the above categories. The principal risks of this type areAsset Management Structural Market Risk and Defined BenefitPension Scheme Risk. These are covered below.
Trading market riskAs mentioned earlier, the Group’s policy is to concentratetrading activities in Barclays Capital. Trading includestransactions where Barclays Capital acts as principal withclients or with the market. For maximum efficiency, Barclaysmanages client and market activities together. In BarclaysCapital, trading risk occurs in both the Trading book and the Banking book as defined for regulatory purposes.
In anticipation of future customer demand, the Groupmaintains access to market liquidity by quoting bid and offerprices with other market makers and carries an inventory ofcapital market and treasury instruments, including a broadrange of cash, securities and derivatives. Trading positions and any offsetting hedges are established as appropriate toaccommodate customer or Group requirements. BarclaysCapital takes principal positions in the interest rate includingcredit spread, foreign exchange, equity and commoditymarkets based on expectations of customer demand or a change in market conditions.
Derivatives entered into for trading purposes include swaps,forward rate agreements, futures, credit derivatives, optionsand combinations of these instruments. For a description ofthe nature of derivative instruments, see pages 79 to 80.

Barclays Capital DVaR: Summary table for 2002 and 2001Twelve months to Twelve months to
31st December 2002 31st December 2001 (a)
Average High (b) Low (b) Average High (b) Low (b)restated restated restated
£m £m £m £m £m £m
Interest rate risk 21.7 34.5 10.0 14.9 24.1 7.6Credit spread risk 9.4 12.5 6.0 8.8 14.7 4.6 Foreign exchange risk 2.9 4.4 1.9 2.3 6.2 0.6 Equities risk 3.6 5.4 2.1 3.3 6.4 2.1 Commodities risk 1.8 3.3 0.8 1.7 4.3 0.6 Diversification effect (16.2) (12.5)
Total DVaR 23.2 35.7 13.4 18.5 25.4 11.3
Notes(a) Restatements of interest rate DVaRs, total DVaRs and diversification effect reflect the move to a methodology that identifiescredit spread risk separately.
(b) The high (and low) DVaR figures reported for each category did not necessarily occur on the same day as the high (and low)DVaR reported as a whole. A corresponding diversification effect cannot be calculated and is therefore omitted from the above table.
Risk controlIn Barclays Capital, the formal process for the management of risk is through the Barclays Capital Risk ManagementCommittee. Day to day responsibility for managing exposure to market risk lies with the senior management of BarclaysCapital, supported by the Global Market Risk Management Unitthat operates independently of the trading areas. Daily DVaRutilisation reports are produced across the main business areasand the five main risk factor categories, namely interest rate,credit spread, foreign exchange, equity and commodity risk.
Any DVaR excess at the business level, risk factor level or totallevel, along with the relevant background information andproposed way forward, is reported to the senior managementof Barclays Capital and the Group Market Risk Director. TheGroup Market Risk Director will present these DVaR excesses to the Group Risk Oversight Committee.
As DVaR does not provide a direct indication of the potentialsize of losses that could arise in extreme conditions, BarclaysCapital uses a number of complementary techniques forcontrolling market risk. These include revenue loss triggers and stress tests. The latter are based on both historical andhypothetical extreme movements of market prices and arereviewed as part of the detailed market risk presentation at the fortnightly Traded Products Risk Review meeting. Theattendees at this meeting include the senior management ofBarclays Capital, the Group Risk Director, the Group MarketRisk Director and the Group Treasurer. The meeting is chairedby the Chief Executive of Barclays Capital.
If the potential loss indicated by a stress test exceeds an agreedtrigger level, then the positions captured by the stress test arereviewed and discussed by Barclays Capital Market Risk and therespective Business Head(s). The minutes of the discussion,including the merits of the position and the appropriate courseof action, are then sent to the Group Market Risk Director.
Risk measurementBarclays Capital calculates DVaR using the historical simulationmethod with an historical sample of two years. As statedabove, the calculation assumes a one-day holding period and is performed to the 98% level of confidence.
The interest rate DVaR methodology maps interest rateexposures into government and non-governments (six creditgrades and interest rate swaps). This allows the measurementprocess to discriminate between the market risk of holdingbonds with different credit qualities, for example AAAsecurities as against non-investment grade securities. Inparticular, it shows the effectiveness of hedging strategies such as shorting government bonds or swaps against non-government bond portfolios.
For a non-government interest rate instrument, the totalinterest rate is separated into the government interest rate for the equivalent maturity and the credit spread. The creditspread is the premium for holding non-government paper, and is the difference between the total interest rate and theappropriate government interest rate. This approach allows the interest rate risk (due to changes in the governmentinterest rates) to be measured separately from credit spreadrisk (due to changes in credit spreads).
The DVaR numbers shown in the table below are all based on the above methodology.
Analysis of market risk exposuresBarclays Capital’s market risk exposure increased in 2002compared to 2001, due mainly to interest rate opportunitiestaken in the second half of 2002. The year-end DVaR for 2002was £25.8m (2001: £21.3m).
Risk managementMarket risk management
75Barclays PLC Annual Report 2002

76 Barclays PLC Annual Report 2002
Risk managementMarket risk management
Trading revenue and back-testingThe histogram below shows the distribution of market riskdaily trading revenue for Barclays Capital in 2002. Market risk daily trading revenue includes all primary (net fees andcommissions) and secondary (net interest income and dealingprofits) income. The average daily revenue was £8.7m. Therewere 238 positive revenue days out of 252.
Barclays recognises the importance of assessing theeffectiveness of DVaR. The main approach employed is thetechnique known as back-testing, which counts the number ofdays when trading related losses are bigger than the estimatedDVaR figure. The regulatory standard for back-testing is tomeasure DVaR assuming a one day holding period with a 99%level of confidence. For Barclays Capital’s regulatory tradingbook, there were two instances in 2002 of a daily tradingrevenue loss exceeding the corresponding back-testing DVaR.This is the same result as recorded for 2001.
Total DVaR Daily exposures in 2001 and 2002
£m
20
10
30
40
0
20022001
Other market risksAsset management structural market riskAsset management structural market risk is the risk that feeand commission income is affected by a change in equitymarket levels. It affects Barclays Private Clients’ assets undermanagement, Barclays Life, Woolwich Life and Barclays GlobalInvestors. This risk is measured using Annual Earnings at Risk (AEaR) where the potential reduction in income ismeasured over a year. For more detail on AEaR, see market riskmeasurement on page 74. As at end 2002, the AEaR relating toUK indices was £120m, while the AEaR relating to non-UKindices was £60m. In both cases, a 25% reduction in stockmarket prices was assumed. These AEaR numbers werebroadly unchanged from the end 2001 AEaR numbers.
Defined benefit pension scheme risk Defined benefit pension scheme risk arises if the Group has toincrease its level of funding for the final salary schemes. Thiswould occur if the value of the assets was insufficient over timeto cover the projected liabilities. Information on the currentposition is given in notes 5 and 62.
Barclays Capital Trading Revenue 2002 (GBP in millions)
Num
ber
of d
ays
30
10
20
40
50
60
90
80
70
0
>0 to 5 >10 to 15 >20 to 25 >15 to 20>5 to 10>(5) to 0>(10)to(5) (10) >25

Risk managementDisclosures about certain trading activitiesincluding non-exchange traded contracts
Fair values generated by models are independently validatedwith reference to market price quotes, or price sharing withother institutions. However, where no observable marketparameter is available then instrument fair value will include a provision for the uncertainty in that parameter based on sale price or subsequent traded levels.
Discounting of expected cash flows back to present value isachieved by constructing discount curves from the marketprice of observable interest rate products, such as deposits,interest rate futures and swaps. In addition, the Groupmaintains fair value adjustments reflecting the cost of creditrisk (where this is not embedded in the fair value), futureadministration costs associated with ongoing operationalsupport of products, the cost of exiting illiquid or significantpositions, as well as the cost of trading out of a position (allpositions are marked to mid-market and hence the bid/offercost would be incurred).
The tables on page 78 analyse the fair value of the commodityderivative contracts at 31st December 2002 by movement overtime, source of fair value and investment grade of counterparty.
Disclosures about certain trading activitiesincluding non-exchange traded contractsThe US Securities and ExchangeCommission requires disclosures to beprovided in relation to certain tradingactivities, particularly energy trading andcommodity trading which covers non-exchange traded contracts.The Group delivers a fully integrated service to clients for basemetals, precious metals, energy products (covering gas, oil andoil-related products) and UK Power through Barclays Capital.The base and precious metals business enters into outrightmetal purchase and sales transactions as well as the associated‘over the counter’ (OTC) and exchange traded derivatives. Theenergy business deals in commodity derivative contracts butdoes not maintain any physical exposures. Structured productsare also developed and offered in respect of energy, base andprecious metal commodities. In August 2002, the UK Powerteam commenced trading in power physical forward contracts.
The Group’s commodity business has continued to expand asmarket conditions allow, both through the addition of newproducts in the UK Power market, and the continuing growthin the existing metals and energy trading volumes. In 2002, the total commodities business (including exchange trading)contributed £89m to dealing profits (2001: £38m) and resultedin assets of £844m in respect of physical commodity positionsas at 31st December 2002 (2001: £1,257m) and net assets of£40m (2001: net liabilities of £45m) relating to the fair value of derivative contracts.
The Group’s principal commodity related derivative contractsare swaps, options, forwards and futures, which are similar innature to such non-commodity related contracts. Commodityderivatives contracts are specified in terms of commodityspecification and delivery location as well as forward date and notional values.
The fair values of commodity physical and derivative positionsare determined through a combination of recognised marketobservable prices, exchange prices and established intercommodity relationships. In common with all derivatives, the fair value of OTC commodity derivative contracts is eitherdetermined using a quoted market price or by using valuationmodels. Where a valuation model is used, the fair value isdetermined based on the expected cash flows under the terms of each specific contract, discounted back to presentvalue. The expected cash flows for each contract are eitherdetermined using market parameters such as commodity pricecurves, commodity volatilities, interest rate yield curves andforeign exchange rates, or derived from historical or othermarket prices.
77Barclays PLC Annual Report 2002

Risk managementDisclosures about certain trading activitiesincluding non-exchange traded contracts
Movement in fair value of commodity positions
Total£m
Fair value of contracts outstanding at 31st December 2001 (45)Contracts realised or otherwise settled during the period 25Fair value of new contracts entered into during the period 50Other changes in fair value 10
Fair values of contracts outstanding at 31st December 2002 40
Source of fair value – commoditiesFair Value of Contracts at 31st December 2002
Maturity Maturity Maturity Maturity Total less than one to four to over fair one year three years five years five years value
Prices actively quoted (17) 13 15 (1) 10Prices provided by other external sources – 1 – – 1Prices based on models and other valuation methods 8 – – – 8Prices based on other valuation methods – – – 21 21
Total (9) 14 15 20 40
Analysis of fair value by counterparty investment grade – commoditiesTotalvalue2002
£m
A- to AAA (9)BBB to BBB+ 68Below investment grade (19)
Total 40
78 Barclays PLC Annual Report 2002

DerivativesThe use of derivatives and their sale tocustomers as risk management products is an integral part of the Group’s tradingactivities. These instruments are also usedto manage the Group’s own exposure tofluctuations in interest and exchange ratesas part of its asset and liabilitymanagement activities.Barclays Capital manages the trading derivatives book as part of the market risk book. This includes foreign exchange,interest rate, equity, commodity and credit derivatives. Thepolicies regarding market risk management are outlined in the market risk management section on pages 74 to 76.
The policies for derivatives that are used to manage theGroup’s own exposure to interest and exchange ratefluctuations are outlined in the treasury asset and liabilitymanagement section on pages 81 to 84.
Derivative instruments are contracts whose value is derivedfrom one or more underlying financial instruments or indicesdefined in the contract. They include swaps, forward rateagreements, futures, options and combinations of theseinstruments and primarily affect the Group’s net interestincome, dealing profits, commissions received and other assets and liabilities. Notional amounts of the contracts are not recorded on the balance sheet.
The Group participates both in exchange traded and OTCderivatives markets.
Exchange traded derivatives The Group buys and sells financial instruments that are tradedor cleared on an exchange, including interest rate swaps,futures and options on futures. Holders of exchange tradedinstruments provide margin daily with cash or other security at the exchange, to which the holders look for ultimatesettlement.
OTC traded derivatives The Group buys and sells financial instruments that are tradedover the counter, rather than on a recognised exchange. These instruments range from commoditised transactions in derivative markets, to trades where the specific terms aretailored to the requirements of the Group’s customers. In many cases, industry standard documentation is used, mostcommonly in the form of a master agreement, with individualtransaction confirmations. The existence of a signed masteragreement is intended to give the Group protection insituations where a counterparty is in default, including theability to net outstanding balances where the rules of offset are legally enforceable. For further explanation of the Group’s policies on netting, see Accounting policies on pages128 to 134.
Foreign exchange derivatives The Group’s principal exchange rate related contracts areforward foreign exchange contracts, currency swaps andcurrency options. Forward foreign exchange contracts areagreements to buy or sell a specified quantity of foreigncurrency, usually on a specified future date at an agreed rate. A currency swap generally involves the exchange, or notionalexchange, of equivalent amounts of two currencies and acommitment to exchange interest periodically until theprincipal amounts are re-exchanged on a future date.
Currency options provide the buyer with the right, but not the obligation, either to purchase or sell a fixed amount of acurrency at a specified exchange rate on or before a futuredate. As compensation for assuming the option risk, the option writer generally receives a premium at the start of the option period.
Interest rate derivatives The Group’s principal interest rate related contracts are interestrate swaps, forward rate agreements, basis swaps, caps, floors and swaptions. Included in this product category aretransactions that include combinations of these features.
An interest rate swap is an agreement between two parties to exchange fixed rate and floating rate interest by means ofperiodic payments based upon a notional principal amountand the interest rates defined in the contract. Certainagreements combine interest rate and foreign currency swaptransactions, which may or may not include the exchange ofprincipal amounts. A basis swap is a form of interest rate swap,in which both parties exchange interest payments based onfloating rates, where the floating rates are based upon differentunderlying reference indices. In a forward rate agreement, twoparties agree a future settlement of the difference between anagreed rate and a future interest rate, applied to a notionalprincipal amount. The settlement, which generally occurs atthe start of the contract period, is the discounted present valueof the payment that would otherwise be made at the end of that period.
Equity derivatives The Group’s principal equity related contracts are equity andstock index swaps and options (including warrants, which areoptions listed on an exchange).
An equity swap is an agreement between two parties toexchange periodic payments, based upon a notional principalamount, with one side paying fixed or floating interest and theother side paying based on the actual return of the stock orstock index. No principal amounts are exchanged.
An equity option provides the buyer with the right, but not theobligation, either to purchase or sell a specified stock or stockindex at a specified price or level on or before a specified date.
Risk managementDerivatives
79Barclays PLC Annual Report 2002

Credit derivatives The Group’s principal credit derivative related contracts includecredit default swaps and total return swaps. A credit derivativeis an arrangement whereby the credit risk of an asset (thereference asset) is transferred from the buyer to the seller of protection.
A credit default swap is a contract where the protection sellerreceives premium or interest related payments in return for contracting to make payments to the protection buyerupon a defined credit event. Credit events normally includebankruptcy, payment default on a reference asset anddowngrades by a rating agency.
A total return swap is an instrument whereby the seller ofprotection receives the full return of the asset, including boththe income and change in the capital value of the asset. The buyer in return receives a predetermined amount.
A description of how credit derivatives are used within theGroup is provided on page 122.
Commodity derivatives The Group’s principal commodity related derivative contracts are swaps, options, forwards and futures. The maincommodities transacted are oil, base metals, precious metals,US and UK natural gas, and UK electricity.
A description of commodity derivatives is provided on page 77.
Risk managementDerivatives
80 Barclays PLC Annual Report 2002
Risk managementTreasury asset and liability management
Treasury asset and liability managementThe financial risks relating to the Group’sassets and liabilities, comprising liquidity,funding and concentration risks, interestrate risks and exchange rate risks, areactively managed by Group Treasury. Group policies are set by the Group Treasury Committee,chaired by the Group Finance Director, which also providesgovernance and oversight of Group Treasury. Group policy is to centralise asset and liability management within GroupTreasury to minimise earnings volatility and meet Groupcontrol standards. The Group Treasury Committee sanctionsLiquidity and Structural Interest Rate risk limits across theGroup and ensures compliance via a limit and controlmonitoring structure in collaboration with the local asset and liability committees.
Liquidity risk managementLiquidity risk is the risk that the Group is unable to meet itspayment obligations when they fall due and to replace fundswhen they are withdrawn; in particular, its failure to meetobligations to repay depositors and fulfil commitments to lend.
The Group’s overall liquidity policy and control is theresponsibility of Group Treasury and is managed to ensure thatthe Group can meet its current and future re-financing needsat all times and at acceptable costs. The Group’s liquidityposition was strong at 31st December 2002.
Barclays is currently unaware of any terms, conditions orcircumstances that could significantly impair the Group’sability to raise short or long-term funding. Where investorshave the right to put, or Barclays has the right of call, on debtsecurities in issue at certain dates, the maturity date is taken tobe the first date. Investors do not have the ability to initiate theredemption of undated or dated loan capital or other capitalinstruments, except where stated in note 35.
Liquidity management within the Group has two main strands.The first is day to day funding, managed by monitoring future cash flows to ensure that requirements can be met. This includes replenishment of existing funds as they matureor are withdrawn to satisfy demands for additional borrowingsby customers. The second is maintaining a portfolio of highlymarketable assets that can easily be liquidated as protectionagainst any unforeseen interruption to cash flow.
In order to avoid reliance on a particular group of customers ormarket sectors, the distribution of sources and maturity profileof deposits are also carefully managed. Important factors inassuring liquidity are competitive rates and the maintenance ofdepositors’ confidence. Such confidence is based on a numberof factors including the Group’s reputation, the strength ofearnings and the Group’s financial position.
An important source of liquidity is our core UK retail deposits,mainly current accounts and savings accounts. Althoughcurrent accounts are repayable on demand and savingsaccounts are repayable at short notice, maintaining a broadbase of customers, both numerically and by depositor type,helps to protect against unexpected fluctuations. Suchaccounts form a stable deposit base for the Group’s operationsand liquidity needs.
Sources of liquidity are regularly reviewed to maintain a widediversification by currency, geography, provider and product.There have been a number of significant market events overrecent years including corporate scandals in the United Statesand the turmoil of the dotcom bubble, all resulting in a short-term flight to quality in financial markets. The Group’s liquidityhas benefited in all cases. The ability to raise funds is in partdependent on maintaining the bank’s credit rating, although,except at extremes, a credit downgrade is likely to affect onlythe price at which funding is available rather than the volumethat can be raised.
Many factors contribute to the credit rating process includingassessment of management capability, and the quality of the corporate governance and risk management processes. The Group considers one of the most important factors inpreserving its strong credit rating, which is a core ambition, ismaintaining a strong capital base and strong regulatory ratios.
Monitoring and reporting take the form of cash flowmeasurement and projections for the next day, week andmonth as these are key periods for liquidity management. This is based on principles agreed by the UK Financial ServicesAuthority. Each operation is required to maintain sufficientaccess to funds, in terms of maturing assets and provencapacity to borrow in the money markets.
Additionally, in evaluating the Group’s liquidity position, GroupTreasury monitors unmatched medium-term assets and thelevel and type of undrawn lending commitments, the usage of overdraft facilities and the impact of contingent liabilitiessuch as standby letters of credit and guarantees.
In overseas markets, day to day liquidity is the responsibility of local treasury management in each territory within theparameters set by Group Treasury and subject to regular reports to Group Treasury in order to maximise the benefits of knowledge gained. Local asset and liability managementcommittees comprising senior local executives and GroupTreasury representatives also review liquidity managementdepending on the size and complexity of the treasury operation.
For further details see contractual cash obligations andcommercial commitments of the Group on page 84.
Interest rate risk managementInterest rate risk is the risk of loss arising from adversemovements in the level or volatility of market interest rates.The interest rate risk arising from the UK banking operations is aggregated and managed by Group Treasury, which is alsoresponsible for the overall Group position.
81Barclays PLC Annual Report 2002

Overall mismatches of fixed rate assets and liabilities aremanaged in the aggregate by Group Treasury through the useof interest rate swaps and other derivatives. Care is taken toensure that the management of the portfolio is flexible, asmarket circumstances and customer requirements can rapidlychange the desired portfolio structure. Group Treasury canexercise some discretion within limits prescribed by GroupMarket Risk with respect to the risk management of thesepositions and flows.
The exposure is then passed to the market mainly viaindependently managed dealing units within Barclays Capitalwho treat these transactions as part of their normal tradingactivities, and also via third parties. Risks arising in the Group’sother banking operations are managed in a similar way.
Retail market risk is the risk to earnings from retail products(generally in personal and corporate banking), which can beadversely affected by movements in the level or volatility ofmarket rates and prices and/or customer behaviour. The retailmarket risk embedded within retail contracts is measuredusing behavioural models and then converted into wholesaleswap and option exposure which is transferred to GroupTreasury at an appropriate market rate transfer price. Thisleaves residual risk within the business to the extent that thewholesale contract does not replicate the customer productbehaviour. This risk is controlled by limits set by Group Market Risk.
Management of the non-trading positions inherent in theGroup’s balance sheet include the structural interest rate riskassociated with interest free deposits, other interest free orfixed rate liabilities as well as the Group’s shareholders’ funds.The positions arising from these balances are managed by themaintenance of assets with fixed interest rates over severalyears, including loans and advances to customers and debtsecurities, and also variable rate assets.
International banking operations also incur market interestrate risk. Policies for managing this risk are agreed betweenGroup Treasury and Group Market Risk and are appliedthrough Asset and Liability Management Committees (ALCOs).Guidance on the scope and constitution of ALCOs is providedby Group Treasury, who maintain regular contact with thebusinesses on treasury issues. Compliance with the policy iscontrolled via a comprehensive financial risk reportingframework including interest rate gap limits or value at risklimits issued by Group Market Risk. These limits allow bankingbooks to be managed by local treasury operations in an orderlyfashion, either through Barclays Capital or, where necessary,through local markets.
The total Group exposure is shown in the form of an interestrate repricing table. This summarises the repricing profile ofthe Group’s assets, liabilities and off-balance sheet exposures at31st December 2002. It includes non-trading hedges. However,Barclays Capital interest rate risk is disclosed within TradingMarket Risk and is therefore excluded.
This table provides the basis for assessment of the sensitivity ofthe Group’s earnings to interest rate movements. Based on theGroup balance sheet as at 31st December 2002, the Group’sexpected earnings in 2003 would not be significantly affectedeither by a hypothetical immediate and sustained 1% increaseor decrease in interest rates.
Group risk management activities employing interest rateswaps, currency swaps, basis swaps and other derivatives that are designated as hedges are summarised below. Thedisclosure relates to derivative components of the Group’shedging programme transferred to the market via internal or external counterparties.
Risk managementTreasury asset and liability management
Activity Risk Type of hedge
Fixed rate lending and Reduced earnings due to an Pay fixed interest rate swapsfixed rate investment. increase in interest rates. and buy interest rate caps.
Fixed rate funding Reduced earnings due to a fall Receive fixed interest rate (e.g medium-term note issuance). in interest rates. swaps and buy interest
rate floors.
Variable rate assets. Reduced earnings due to a fall Receive fixed interest rate in interest rates. swaps and buy interest
rate options.
Firm foreign currency commitments Reduced earnings due to changes Foreign currency transactions.(e.g. asset purchases and sales). in exchange rates between arranging
a transaction and completion.
Managing the Group’s risk asset ratios. Reduced risk asset ratio due to strengthening Currency swaps. of foreign currency against sterling.
82 Barclays PLC Annual Report 2002

Risk managementTreasury asset and liability management
Interest rate swaps and cross currency interest rate swaps that are used in the management of the non-trading exposures(excepting those within Barclays Capital, where the risk is managed by DVaR) are shown in the table below. These figures are the weighted average pay fixed rates and receive fixed rates by maturity date and nominal amount at 31st December 2002. The nominal amounts below include £2,994m and £317m, in respect of sterling and non-sterling basis swaps respectively. Basisswaps are swaps where both payable and receivable legs are variable. In managing the non-trading exposures relating to capitalbalances and demand deposits, both on-balance sheet and derivative positions are held.
The reported figures do not take account of underlying balance sheet items being hedged, the net interest income thereon ortheir mark to market values.
The weighted-average receive fixed and pay fixed rates by reset maturity date and nominal amount at 31st December 2002 wereas follows:
Sterling denominated contracts Non-sterling denominated contracts
Pay fixed Receive fixed Pay fixed Receive fixed
Nominal Average Nominal Average Nominal Average Nominal Averageamount rate amount rate amount rate amount rate
£m % £m % £m % £m %
Maturity dateNot more than three months 2,383 6.42 3,945 5.15 1,238 3.79 779 3.81Over three months but notmore than six months 3,344 5.99 1,300 6.19 175 5.86 607 5.50Over six months but notmore than one year 3,543 6.20 2,251 5.71 1,020 3.73 355 4.59Over one year but notmore than five years 8,645 5.68 18,504 5.86 2,464 6.22 2,327 4.56Over five years 2,259 6.02 6,177 6.11 1,105 5.07 4,385 6.84
20,174 5.95 32,177 5.82 6,002 5.07 8,453 5.74
The weighted-average receive variable and pay variable rates by reset maturity date and nominal amount at 31st December2002 were as follows:
Sterling denominated contracts Non-sterling denominated contracts
Receive variable Pay variable Receive variable Pay variable
Nominal Average Nominal Average Nominal Average Nominal Averageamount rate amount rate amount rate amount rate
£m % £m % £m % £m %
Reset maturity dateNot more than three months 15,020 3.90 25,075 4.12 5,065 2.99 8,104 2.91Over three months but notmore than six months 8,148 4.00 10,096 4.13 1,254 3.30 666 2.56
23,168 3.94 35,171 4.12 6,319 3.05 8,770 2.89
83Barclays PLC Annual Report 2002

Risk managementTreasury asset and liability management
The net effect of the derivative positions, in isolation, on net interest income was a credit of £246m (2001: credit of £122m). This included credits of £242m (2001: £93m) and £4m (2001: £29m) for interest rate and exchange rate derivatives respectively.
Foreign exchange risk managementCorporate and retail banking businesses incur foreign exchange risk in the course of providing services to their customers. The part of this risk that arises in UK operations is transferred directly to and managed by Barclays Capital. In the case of the international operations, Group Market Risk allocates modest foreign exchange open position limits to facilitate themanagement of customer originated flows. Exposures are reported daily to Group Market Risk. As at 31st December 2002,aggregate DVaR of these businesses for foreign exchange rate risk was immaterial.
Management of foreign currency investmentsNon-trading positions in foreign currencies arise from the currency investments that the Group makes in its overseas businesses.The Group’s policy is to manage the currency balance of the funding, financing these investments so as to limit the effect ofexchange rate movements on the Group’s risk asset ratios. The management of funding investments in overseas branches,subsidiaries, associated undertakings and joint ventures is carried out and reviewed by Group Treasury. The principal structuralcurrency exposures of the Group are set out on page 175.
These positions, together with the currency composition of tiers 2 and 3 capital and minority interests in tier 1 and tier 2 capital,ensure that movements in exchange rates have little impact on the Group’s risk asset ratios. However, exchange rate movementsdo have an impact on reserves (see Consolidated statement of changes in reserves on page 140). With the positions in place at31st December 2002, a hypothetical increase of 10% in the value of sterling against all currencies would have led to a fall ofsome £36m in reserves (2001: £146m).
Additional information on liquidity managementThe tables below give details of the contractual obligations and commercial commitments of the Group as at 31st December 2002.
Contractual cash obligations
Payments due by period
Less than One to Four to After Totalone three five five
year years years years
Long-term debt 206 – – 4,653 4,859Capital lease obligations 18 20 47 55 140Operating leases 176 361 318 2,014 2,869Unconditional obligations to purchase goods and services obligations 176 312 76 61 625
Total contractual cash obligations 576 693 441 6,783 8,493
The table above excludes deposits and other liabilities taken in the normal course of banking business and short-term andundated liabilities. The maturity of deposits by banks is given in note 27, customer accounts in note 28, and debt securities inissue in note 29.
Other commercial commitmentsAmount of commitment expiration per period
Less than One to Four to After Total one three five five amounts
year years years years committed£m £m £m £m £m
Acceptances and endorsements 2,375 90 124 – 2,589Guarantees and assets pledged as collateral security 12,081 2,245 1,135 582 16,043Other contingent liabilities 5,884 983 668 379 7,914
Documentary credits and other short-term trade relatedtransactions 311 27 1 1 340Forward asset purchases and forward forward deposits placed 20 – – – 20Undrawn note issuance and revolving underwriting facilities – – – – –Undrawn formal standby facilities, credit lines and other commitments to lend 79,518 12,454 7,358 1,688 101,018
Total 100,189 15,799 9,286 2,650 127,924
Further information on guarantees is provided in note 63 on page 216.
84 Barclays PLC Annual Report 2002

Management of other risksIn addition to credit, market and treasuryrisk, Barclays faces a number of other risks.These risks are managed within the overallrisk management framework.Non-financial risk managementNon-financial risk, which is inherent in all business activities, isthe direct or indirect loss resulting from inadequate or failedinternal processes, people and systems or from external events.It can occur in any of the Group’s businesses and includeserrors, omissions, natural disasters and deliberate acts such as fraud. This risk is commonly called operational risk, butBarclays uses the term ‘Non-financial risk’ to emphasise thebreadth of issues encompassed by this risk category.
The Group has established a comprehensive non-financial riskframework to manage the risks included in this broad category.The framework and policies implement the Non-Financial RiskGovernance Standards approved by the Board Risk Committee.
Responsibility for managing non-financial risk is dividedbetween the businesses and the corporate centre. The mainresponsibility rests with the business units and functionalservice areas where the risks exist. Business Risk Directors areaccountable for the implementation of and compliance withGroup standards and policies.
In the corporate centre, the Group Non-Financial Risk unit,which incorporates Group IT Security, Group Operational Risk,Group Business Continuity Management, Group Insurance andGroup Security, have the responsibility through the delegatedauthority of the Non-Financial Risk Director to establish,maintain and exercise governance over the policies andprocesses that are encompassed in the framework.
Measures of performance (key risk indicators) have beenestablished that give the Group Non-Financial Risk unit theability to monitor the risks against agreed thresholds andchallenge business performance where appropriate. This isenhanced by comprehensive reporting from businesses to the corporate centre of both periodic and event-driven data.Specific quarterly reports are prepared and submitted to theGroup Risk Oversight Committee and Board Risk Committee.
The information also feeds into a risk scorecard for eachbusiness. During 2003, this will form the basis of an allocationof Economic Capital for non-financial risk, giving each businessan incentive to improve its risk control.
Coupled with the non-financial risk framework, this approachforms the basis of the Group’s response to the requirements ofthe Basel II Capital Accord. In this respect, as in others, Barclaysaims to qualify for the Advanced Measurement Approach andthe lower level of regulatory capital that this implies.
It is recognised that non-financial risk cannot be eliminatedand that thresholds can be reached where the cost ofminimising these risks outweighs the potential benefits. The Group will continue to assess the risks and invest inappropriate management and mitigation systems.
Assessment of the management of non-financial risk isundertaken by the Group Internal Audit function. This providesexecutive management and the Board with a view of theadequacy and effectiveness of non-financial risk management,through an avenue outside the hierarchical organisationstructure.
Compliance risk managementCompliance or regulatory risk arises from a failure or inabilityto comply with the laws, regulations or codes applicablespecifically to the financial services industry. Non-compliancecan lead to fines, public reprimands, enforced suspension ofoperations or, in extreme cases, withdrawal of authorisation to operate.
The Group is subject to extensive supervisory and regulatoryregimes in the UK, Europe, the USA, the Asia-Pacific region andin the other countries around the world in which it operates. Inthese many jurisdictions, specific resources and expertise areneeded to assist the Group Chief Executive, the Business Headsand others in management to comply with financial servicesregulation. This is the responsibility of the Group ComplianceDirector, the Compliance Directors in each of the businessesand the Group Compliance function.
Legal risk managementThe purpose of the legal function is to identify and, in conjunctionwith business management, manage the legal risks of Barclays.In this context, “Legal risk” includes any of the following typesof risk:
» The risk that Barclays businesses will not be conducted in accordance with applicable laws and regulations;
» The risk that contractual arrangements will either not beenforceable as intended or will be enforced against Barclaysin an unexpected and adverse way;
» The risk that the tangible and intangible property ofBarclays (such as its trade names and copyrights) will notbe adequately protected from infringement; and
» The risk that Barclays will be liable for damages to thirdparties harmed by the conduct of its business.
The Group identifies and manages legal risk through theeffective use of its internal and external legal advisers. TheGroup General Counsel has responsibility for providing thesupport necessary to identify, manage and control legal riskacross the Group.
Tax risk management This is the risk of loss or increased charges associated withchanges in, or errors in the interpretation of, taxation rates or law. Responsibility for control of this lies with the GroupTaxation Director, reporting to the Group Finance Director, and systems are in place to identify and manage this risk. This includes taking external advice as necessary. Thebusinesses are advised of their obligations to comply withthese requirements and also of their tax reporting obligations.Whilst managed centrally, taxation staff are co-located withbusiness areas, in the UK and overseas, where this adds to theeffectiveness of risk management.
Risk managementManagement of other risks
85Barclays PLC Annual Report 2002

Financial data Barclays PLC 87
Business description 90
Financial review 96
Introduction 98Analysis of results by business 99Results by nature of income and expense 105Total assets and liabilities 111Average balance sheet 112Capital resources 116Deposits 118Short-term borrowings 118Securities 119Critical accounting estimates 120Special purpose entities 121
Other information 123
Economic and monetary union 123Supervision and regulation 123Risk factors 124
Auditors’ reports 126
Consolidated accounts Barclays PLC 128
Accounting policies 128Accounting presentation 134Consolidated profit and loss account 136Statement of total recognised gains and losses 137Consolidated balance sheet 138Consolidated statement of changes in reserves 140Consolidated cash flow statement 141Parent company accounts 142Notes to the accounts 143
SEC Form 20-F cross reference and other information 221
Glossary 223
Barclays Bank PLC data 224
US GAAP financial data 234
Shareholder information 235
Dividends 235Trading market for ordinary shares of Barclays PLC 236Shareholdings at 31st December 2002 237Memorandum and Articles of Association 238Taxation 239Exchange controls and other limitationsaffecting security holders 240Sub-division of ordinary shares 240Documents on display 241Shareholder enquiries 241
Group senior management and principal offices 242
3Section 3 – Results
Barclays PLC Annual Report 200286

Financial data Barclays PLC
87Barclays PLC Annual Report 2002
Earnings per share
penc
e
30
15
45
60
0
2002
33.7
1999
29.6
2000
40.4
2001
36.8
1998
22.3
Post-tax return on average shareholders’ funds
%
10
5
15
20
25
30
0
2002
14.7
1999
21.5
2000
24.8
2001
17.4
1998
17.3
Dividends per share
penc
e
10
5
15
20
0
2002
18.35
1999
12.50
2000
14.50
2001
16.625
1998
10.75
Profit before tax
£m
2,000
1,000
3,000
4,000
0
2002
3,205
1999
2,478
2000
3,392
2001
3,425
1998
1,910

Financial data Barclays PLC
88 Barclays PLC Annual Report 2002
Consolidated profit and loss account summary(a)
2001 2000 1999 1998 2002 restated restated restated restated
£m £m £m £m £m
Interest receivable 12,044 13,458 11,788 9,320 9,952Interest payable 5,839 7,492 6,682 4,696 5,644 Profit on redemption/repurchase of loan capital – – 2 3 3
Net interest income 6,205 5,966 5,108 4,627 4,311 Fees and commissions receivable 4,454 4,202 3,676 3,201 2,995 Less: fees and commissions payable (529) (465) (320) (275) (229)Dealing profits 833 1,011 677 556 (42) Other operating income 364 428 353 287 339
Operating income 11,327 11,142 9,494 8,396 7,374
Administration expenses – staff costs 3,755 3,714 3,219 3,057 2,811 Administration expenses – other 2,312 2,303 1,967 1,807 1,829 Depreciation and amortisation 557 537 306 280 275
Operating expenses 6,624 6,554 5,492 5,144 4,915
Operating profit before provisions 4,703 4,588 4,002 3,252 2,459
Provisions for bad and doubtful debts 1,484 1,149 817 621 492 Provisions for contingent liabilities and commitments 1 1 (1) 1 76
Provisions 1,485 1,150 816 622 568
Operating profit 3,218 3,438 3,186 2,630 1,891Loss from joint ventures (5) (1) (1) (1) –(Loss)/income from associated undertakings (5) (8) (7) (13) 22 Loss on sale or restructuring of BZW – – – (30) (3)(Loss)/profit on disposal of other Group undertakings (3) (4) 214 (108) 4 Write-down of fixed asset investments – – – – (4)
Profit on ordinary activities before tax 3,205 3,425 3,392 2,478 1,910 Tax on profit on ordinary activities (955) (943) (901) (655) (521)
Profit on ordinary activities after tax 2,250 2,482 2,491 1,823 1,389 Profit attributable to minority and other non-equity interests (20) (36) (46) (52) (45)
Profit for the financial year attributableto the members of Barclays PLC 2,230 2,446 2,445 1,771 1,344Dividends (1,206) (1,110) (927) (746) (646)
Profit retained for the financial year 1,024 1,336 1,518 1,025 698
Selected financial statistics
Earnings per ordinary share 33.7p 36.8p 40.4p 29.6p 22.3p Dividends per ordinary share 18.35p 16.625p 14.50p 12.50p 10.75pDividend cover (times) 1.8 2.2 2.6 2.4 2.1 Attributable profit before tax as a percentage of: average shareholders’ funds 21.0% 23.9% 33.8% 29.2% 23.8%Attributable profit after tax as a percentage of:average shareholders’ funds 14.7% 17.4% 24.8% 21.5% 17.3% average total assets (note (b)) 0.5% 0.6% 0.8% 0.7% 0.6% Average US dollar exchange rate used in preparing the accounts 1.50 1.44 1.52 1.62 1.66 Average euro exchange rate used in preparing the accounts 1.59 1.61 1.64 1.52 –
See notes on page 89.

Financial data Barclays PLC
89Barclays PLC Annual Report 2002
Consolidated balance sheet summary(a)
2001 2000 1999 1998 2002 restated restated restated restated
Assets £m £m £m £m £m
Loans and advances to banks and customers 260,572 228,382 198,536 156,194 132,722 Other assets 129,195 113,923 102,489 88,507 77,422
389,767 342,305 301,025 244,701 210,144Infrastructure 6,015 6,137 6,450 2,089 2,285
395,782 348,442 307,475 246,790 212,429Retail life-fund assets attributable to policyholders 7,284 8,170 8,711 8,040 7,085
Total assets 403,066 356,612 316,186 254,830 219,514
LiabilitiesDeposits by banks, customer accounts and debt securities in issue 304,817 273,073 240,607 191,781 161,049 Other liabilities 64,067 50,763 45,715 41,567 39,478
368,884 323,836 286,322 233,348 200,527
Capital resourcesUndated loan capital 6,678 5,054 4,022 1,749 1,742 Dated loan capital 4,859 4,933 3,698 2,848 1,992 Other subordinated liabilities – – – – –Minority and other interests 156 134 250 352 314 Shareholders’ funds 15,205 14,485 13,183 8,493 7,854
26,898 24,606 21,153 13,442 11,902
395,782 348,442 307,475 246,790 212,429 Retail life-fund liabilities attributable to policyholders 7,284 8,170 8,711 8,040 7,085
Total liabilities and shareholders’ funds 403,066 356,612 316,186 254,830 219,514
Weighted risk assets and capital ratios
Weighted risk assets 172,748 158,873 147,040 115,878 109,800 Tier 1 ratio 8.2% 7.8% 7.2% 7.5% 7.3% Risk asset ratio 12.8% 12.5% 11.0% 11.3% 10.6%
Selected financial statistics
Average shareholders’ funds as a percentage of average total assets (note (b)) 3.5% 3.7% 3.2% 3.4% 3.2% Net asset value per ordinary share 231p 217p 198p 142p 130p Year-end US dollar exchange rate used in preparing the accounts 1.61 1.45 1.49 1.62 1.66Year-end euro exchange rate used in preparing the accounts 1.54 1.64 1.60 1.61 –
Notes(a) The financial information on pages 88 and 89 is extracted from the published accounts for the last five years, restated whereappropriate to accord with the current accounting policies of the Group (see page 128). This information should be readtogether with, and is qualified by reference to, the accounts and notes included in this report.
(b) For the purposes of this summary, the retail life-fund assets attributable to policyholders have been excluded from averagetotal assets.
Note 63 to the accounts provides a reconciliation of net profit and shareholders’ funds between the amounts calculated underUK GAAP and US GAAP.

Business description
Business descriptionIntroductionBarclays is an international financial services group engaged primarily in banking, investment banking and assetmanagement. In terms of assets employed, Barclays is one of the largest financial services groups in the UK. The Groupalso operates in many other countries around the world and is a leading provider of co-ordinated global services tomultinational corporations and financial institutions in theworld’s main financial centres. Worldwide, the Barclays Grouphas 2,579 branches.
The Group is organised in Strategic Business Units (SBUs),which are supported by shared services. Each SBU has beentasked with identifying and implementing value maximisingstrategies, and achieving these by creating advantage forcustomers through superior products and services.
For reporting purposes, the SBUs have been organised into thefollowing business groups or clusters:
» Personal Financial Services (including Woolwich)» Barclays Private Clients» Barclaycard» Business Banking» Barclays Africa» Barclays Capital» Barclays Global Investors
Results are also provided for Other operations and Head officefunctions. The results for Personal Financial Services andBusiness Banking are reported after allocating the costs ofshared support functions, the UK branch network and othercommon infrastructure.
Personal Financial ServicesPersonal Financial Services provides a wide range of products and services to 14 million personal customers throughoutthe United Kingdom, including currentaccounts, savings, mortgages, consumerloans, general insurance and the provisionof independent financial advice. These are available to all customers throughintegrated channels comprising thebranch network, telephone banking and online banking.On 1st January 2002, the Woolwich operations became part of Personal Financial Services in line with integration plans,providing a platform for transformation within the enlargedretail business. Separate brands have been retained to maintaindistinctive customer propositions.
Personal Financial Services works closely with other businessesin the Group, in particular Barclays Private Clients, Barclaycardand Business Banking, to provide better customer servicingand to develop cross-selling opportunities.
Key business developments in 2002:
» Openplan, which was successfully developed by Woolwich,was launched fully in the Barclays network in April 2002and now has nearly 2 million customers relative to ourtarget for 2002 of 1.5 million. Balances within Openplanfrom Barclays grew to £13.2bn, £10.3bn from savings and£2.9bn from mortgages. 55% of customers choosingOpenplan from Woolwich are new.
» Personal Financial Services has continued to be a netrecruiter of current accounts, increasing to 10.5 million(2001: 10.1 million), and the number of value-addedaccounts (Additions and Platinum) has grown to 1.75million from 1.38 million.
» Online customers increased to 3.9 million, with 20% of alltransactions now being undertaken online (2001: 14%).
» Total mortgage balances have increased 13% to £58.7bn.Net new mortgage lending grew 60% to £6.9bn withgrowth being focused in the first half of the year. Marketshare of net new lending in mortgages has increased to8.7% from 7.8% in 2001. The latest loan to value ratioswithin the residential mortgage book averaged 45%.
» Total average retail savings balances increased 7% to £28.8 billion, with Barclays branded savings balancesincreasing 22%.
» Margin pressure, particularly within mortgages, has beenactively managed with increased balances mitigating someof the compression primarily due to the lower averageinterest rates in 2002 versus 2001.
Refer to page 99 for further information.
90 Barclays PLC Annual Report 2002

Business description
Barclays Private Clients Barclays Private Clients serves affluent andhigh net worth clients, primarily in the UKand continental Europe, providing bankingand asset management services.There has been continued progress in the development of anintegrated business model during 2002. The focus remainedon improving operational efficiency and on the provision of adistinctive customer service and a diverse banking andinvestment product capability.
Barclays Private Clients works closely with other Groupbusinesses, particularly Personal Financial Services and in areassuch as offshore banking and UK mass affluent customers.
Barclays Private Clients completed the acquisition of CharlesSchwab Europe, an award-winning execution-only retailstockbroker, on 31st January 2003.
Key business developments in 2002:
» Customer numbers in Spain have increased by 36,000 with40% of those new to Barclays being attracted by Openplan.
» In Spain, the average products per customer was 3.2increasing to 4.5 for Openplan customers.
» Globally affluent and high net worth client numbersincreased 3% to 970,000, excluding the impact of theCaribbean transaction (see below).
» The combination of the Caribbean operations of Barclaysand CIBC was completed on 11th October 2002.
» Operating income from the closed long-term assurancefunds moved from a positive contribution in 2001 of£127m to a negative contribution in 2002 of £51m, a yearon year swing of £178m. This was primarily attributable tothe fall in stock markets in 2002.
Refer to page 100 for further information.
BarclaycardBarclaycard is one of the leading creditcard businesses in Europe. In addition toits operations in the United Kingdom, it isactive in Germany, Spain, Greece, Franceand Italy. It also operates in Africa.Barclaycard offers a full range of creditcard services to individual customers,together with card payment facilities toretailers and other businesses.Barclaycard acquired the credit card business of Providian UKin April 2002. The acquisition was consistent withBarclaycard’s strategy of defending and growing its core UKcredit card business.
Key business developments in 2002:
» Barclaycard has 10.4 million customers, primarily in the UKand Europe. In the UK alone, one in every five credit cards isa Barclaycard. Barclaycard increased market share ofextended credit balances during the year.
» Average extended credit balances amounted to more than75% of total card outstandings. Period end extended creditbalances in the UK grew 19% year on year.
» UK customer recruitment increased 60% to 1.2 million. Inthe UK, Barclaycard now has over 400 pricing points with awide range of annual percentage rates.
» In September a new loyalty scheme, called Nectar, waslaunched in conjunction with Sainsburys, Debenhams andBP and has 11 million active customers. Nectar is thebiggest loyalty programme in the UK.
» Barclaycard International has 1.28 million cards in issueacross continental Europe.
» During the year, Barclaycard worked with Banca Woolwichto launch a full range of credit cards in Italy, one ofEurope’s largest credit card markets.
Refer to page 101 for further information.
91Barclays PLC Annual Report 2002
Business description
Business BankingBusiness Banking provides relationshipbanking to the Group’s small, medium andlarge business customers in the UnitedKingdom. Customers are served by a network of relationship and industrysector specialist managers who provide local access to anextensive range of products and services, as well as offeringinformation and support.
Customers are also offered access to business centres incontinental Europe and the United States and to the productsuite and expertise of other businesses of the Group includingBarclays Capital.
The way that Business Banking does business with itscustomers continued to evolve. The Value AlignedPerformance Measurement (VAPM) system provides the salesteams with customer level risk adjusted profitability data. Thisenables business targets and rewards to be aligned with thecreation of shareholder value. Improving operational efficiencyis also an important point of focus in Business Banking.
Key business developments in 2002:
» Business Banking has a relationship with 530,000customers. Customers rate us first in the market for serviceand price. Over 4,000 customer facing staff are now usingVAPM technology.
» Business Banking implemented its response to theCompetition Commission Report at the end of the year,creating segment specific offerings, giving customers a realchoice – reflecting customers’ overwhelming preference forcheaper money transmission over interest bearing businesscurrent accounts.
» Medium Business launched a Law Society accreditedproposition for solicitors firms.
» Clearlybusiness became 100% owned by Barclays. During2002 over 10,000 copies of a new product,Clearlybookkeeping, were sold.
» Average lending balances increased 4% to £42.6 billion andaverage deposit balances increased 3% to £43.9 billion.Lending growth was concentrated towards large businesscustomers whilst lending to the small business sectorcontinued to be affected by weak economic conditions.
Refer to page 102 for further information.
Barclays AfricaBarclays Africa provides banking servicesto personal and corporate customers in North Africa, sub-Saharan Africa andislands in the Indian Ocean. The portfoliocomprises banking operations in Botswana,Egypt, Ghana, Kenya, Mauritius, Seychelles,South Africa, Tanzania, Uganda, Zambiaand Zimbabwe.During the year, significant restructuring initiatives wereundertaken to reposition the businesses in the light ofchallenges posed by the deteriorating economic situation in certain African countries.
Key business developments in 2002:
» In November 2002, Barclays acquired the business of BNPI Mauritius.
» The Retail business continued an active refurbishmentprogramme of branches across the continent and expandedPrestige centres to bring the number of Prestige centresopened to 53.
» The Retail business launched telephone banking in many ofits businesses and has since recruited 27,000 customers.
» The Corporate segment of Barclays Africa continued todevelop its merchant banking activities during the year,winning and executing mandates. Asset Finance wassuccessfully launched in Kenya and Zambia in 2002.
» Operating profit decreased £25m. This decrease wasmainly attributable to the situation in Zimbabwe wherethere was a decline in operating profit of £14m.
Refer to page 103 for further information.
92 Barclays PLC Annual Report 2002

Business description
Barclays CapitalBarclays Capital conducts the Group’sinvestment banking business. As theGroup’s principal point of access to thewholesale markets, it provides corporate,institutional and government clients with solutions to their financing and risk management needs.The Barclays Capital business model is distinctive. It focuses ona broad span of financing and risk management services in theinterest rate, foreign exchange, commodities and creditmarkets combined with certain capabilities in equities.Activities are split between two areas: Rates, which includesfixed income, foreign exchange, derivatives, commodities andmoney markets sales, trading and research, prime brokerageand equities; and, Credit, which includes origination, sales,trading and research relating to loans, debt capital markets andstructured capital markets, and private equity.
Barclays Capital works increasingly with other Groupbusinesses, including Business Banking and Barclays GlobalInvestors, to provide a more integrated customer service andto develop business opportunities across the Group.
Key business developments in 2002:
» Barclays Capital remained in first position for issuingsterling denominated debt (Euromoney sterling bondsleague table) with a 20% market share; and continued to be the top arranger of European syndicated loans.(Euromoney syndicated loans (Europe, Middle East, Africa)league table).
» Barclays Capital improved its market share in bothinternational bonds and syndicated loans amid lowervolumes in both these markets compared to 2001.
» Barclays Capital moved into the top 10 in privateplacements for the first time – 4th position for 2002, withdeals in nine countries and significant partnerships withBusiness Banking.
» Barclays Capital was the only firm in the top 10 of theEuromoney Global All Debt table to increase debt issuancevolumes in 2002 versus 2001.
» Barclays Capital led 24 dollar denominated deals for USissuers in 2002 versus one prior to 2001. For most of thosecompanies Barclays Capital had led deals in sterling oreuros prior to being mandated for the dollar deal. BarclaysCapital is leveraging the relationships built in Europe togain market share in the US.
Refer to page 103 for further information.
Barclays Global InvestorsBarclays Global Investors is a leadingglobal provider of investmentmanagement products and services,offering structured investment strategiesincluding indexing, asset allocation, and risk-controlled active strategies. BGI’s investment philosophy focuses on managing alldimensions of performance: return, risk and cost. Assetmanagement is complemented by a range of related financialservices including cash management, securities lending andportfolio transition management.
Key business developments in 2002:
» BGI has over 2,300 institutional clients in 44 countries.£56bn net new assets were attracted in 2002. More thanhalf of the net new assets were from new clients. Assetsunder management are £462bn, a fall of 13% on 2001.
» Investment performance in our active strategies continuedto be excellent.
» The active business accounted for 58% of managementfees in 2002.
» Growth in Global iShares (Exchange Traded Funds)continued to be strong. Global iShares assets grew to£22bn, up 47% (2001: £15bn).
» The launch of the first Fixed Income iShares in the US in thethird quarter of the year demonstrated the ongoingcommitment to market leading innovation.
Refer to page 104 for further information.
93Barclays PLC Annual Report 2002

Business description
Other operationsProperty costs include Barclays Group Property Services, whichis responsible for the management of the Group’s operationalpremises, property related services and the centraladministration of certain operational properties.
Central services includes certain activities which support theoperating business and provide central information technology services.
South American Corporate Banking comprises non-corerelationships which are now being managed separately withthe objective of maximising the recovery from the assetsconcerned.
Within Management of Group capital there are certain centralitems including residual balances arising from centrallymanaged transition businesses. Earnings on centrally heldGroup capital are allocated to business groups on the basis of economic capital.
Head office functionsHead office functions comprise all the Group’s central costs,including Group Executive, Group Finance, CorporateCommunications, Human Resources, Group Strategy andPlanning, Internal Audit, Marketing, Legal, CorporateSecretariat, Tax, Compliance and Risk. Costs incurred wholly on behalf of the business units are recharged to them.
Competition and outlookThe UK financial services market remains highly competitiveand innovative. Competition comes both from incumbentplayers and a steady stream of new market entrants. Barclaysremains at the forefront of market innovation to introduce newpropositions to the market.
The landscape is expected to remain highly competitive in allour businesses. We are confident that the integrated businessmodel employed by the Group, combined with rigorousapplication of managing for value principles, will stand theGroup in good stead to meet the challenges ahead.
The Group believes that the UK domestic economy is likely to perform well relative to the rest of Europe, but that theinternational economy in the aggregate, is unlikely to besignificantly more expansionary than in 2002.
Financial markets were volatile and in decline in 2002; theyremain so in 2003. This is partly the result of over-excitedsentiments stirred up primarily by the dotcom boom. Partly it reflects uncertainty about how the national economicimbalances will unfold, especially with the threat of war in Iraq.Partly it reflects the very competitive and difficult conditions in some sectors.
Group structureThe figures in the business group analyses have been restatedto take account of the following changes relative to 2001.
The various constituents of the Woolwich business group havebeen transferred into other Barclays business groups.Woolwich Plan Managers and Unit Trusts have been transferredinto Barclays Global Investors, Woolwich Guernsey andWoolwich Life to Barclays Private Clients and the Woolwichcredit card business to Barclaycard. The remainder of theWoolwich business is reported within Personal FinancialServices.
Following a Group review of its South American corporatebanking activities, a number of non-strategic relationshipshave been identified within Barclays Capital and BusinessBanking which did not fit their strategic business models. As aresult, a number of non-performing lendings, that are notexpected to be of long-term interest to the Group and whichare being managed separately with the objective ofmaximising the recovery from the assets concerned, are nowreported within Other operations.
Changes in accounting presentationFollowing the issue of UITF Abstract 33, ‘Obligations in capital instruments’, Reserve Capital Instruments (RCIs) arenow treated as forming part of the undated loan capital of the Bank, rather than as Minority interests – non-equity. The coupon on the RCIs is now reported in Interest payable,rather than as Minority non-equity interests. Comparativeshave been restated accordingly. Profit after tax for the year to 31st December 2001 has been reduced by £97m with noimpact on retained profit. Liabilities have been increased and Minority interests have been reduced at 31st December2001 by £1,872m.
The prior period presentation has, where appropriate, beenrestated to conform with current year classification.
Accounting developments in UK GAAP are described on page134, those under US GAAP are described on page 202.
94 Barclays PLC Annual Report 2002

Business description
Other informationThe Competition Commission published its report into theprovision of banking services to small and medium sizedenterprises (SMEs) on 14th March 2002. Barclays Bank PLC andcertain other banks have given undertakings to the Secretaryof State for Trade and Industry and the Chancellor of theExchequer regarding the implementation of the transitionalpricing remedy contained in the Report. As a result, from 1stJanuary 2003 Barclays now offers each of its SME customerseither interest on current accounts or free money transmissionservices or a choice between the two in accordance with theterms of such undertakings. Also, in October 2002, Barclaysagreed certain behavioural remedies with the Secretary ofState and the Chancellor and is taking the necessary measures forward.
Recent developmentsOn 31st January 2003, Barclays PLC announced the acquisitionof Charles Schwab Europe, an execution only retail stockbroker.
95Barclays PLC Annual Report 2002

Financial reviewProfit/(loss) before tax and total assets and weighted risk assets
96 Barclays PLC Annual Report 2002
Profit/(loss) before tax2002 2001 2000
restated restated£m £m £m
Personal Financial Services 867 803 557Barclays Private Clients 281 553 553 Barclaycard 615 504 429 Business Banking 1,219 1,050 1,006 Barclays Africa 89 123 93Barclays Capital 581 655 517Barclays Global Investors 110 78 59Other operations1 (179) (28) 79 Head office functions (121) (80) (64) Goodwill amortisation (254) (229) (51)Exceptional items (3) (4) 214
Profit before tax 3,205 3,425 3,392
Note 1 Other operations now include South American Corporate Banking activities previously included in Barclays Capital andBusiness Banking, prior periods have been restated accordingly.
Total assets and weighted risk assetsTotal assets Weighted risk assets
2002 2001 2000 2002 2001 2000restated restated restated restated
£m £m £m £m £m £m
Personal Financial Services 71,871 64,314 60,993 41,100 36,154 34,156 Barclays Private Clients 14,016 13,886 14,098 11,713 9,197 8,390 Barclaycard 10,669 9,404 9,867 10,647 9,467 9,685 Business Banking 47,315 44,132 41,344 50,449 46,272 43,636Barclays Africa 2,632 2,756 2,291 1,892 1,943 1,661Barclays Capital 236,472 201,301 167,197 53,496 51,943 45,380Barclays Global Investors 494 308 259 666 563 653 Other operations and head office functions 8,379 8,250 7,157 2,785 3,334 3,479Goodwill 3,934 4,091 4,269 – – – Retail life-fund assets 7,284 8,170 8,711 – – –
403,066 356,612 316,186 172,748 158,873 147,040

Financial reviewSummary statutory profit and loss account and furtheranalysis of profit and loss account
97Barclays PLC Annual Report 2002
Summary statutory profit and loss account2002 2001 2000
restated restated£m £m £m
Operating income 11,327 11,142 9,494 Operating expenses (6,624) (6,554) (5,492)
Operating profit before provisions 4,703 4,588 4,002 Provisions for bad and doubtful debts (1,484) (1,149) (817) Provisions for contingent liabilities and commitments (1) (1) 1
Operating profit 3,218 3,438 3,186 Loss from joint ventures (5) (1) (1) Loss from associated undertakings (5) (8) (7)(Loss)/profit on disposal/termination of Group undertakings (3) (4) 214
Profit on ordinary activities before tax 3,205 3,425 3,392
Further analysis of profit and loss account 2002 2001 2000
restated restated£m £m £m
Interest receivable 12,096 13,513 11,799Interest payable 5,839 7,512 6,686Profit on repurchase of loan capital – – 2
Net interest income 6,257 6,001 5,115 Net fees and commissions receivable 3,925 3,737 3,356 Dealing profits 833 1,011 677 Other operating income 364 428 353
Operating income 11,379 11,177 9,501
Administration expenses – staff costs (3,630) (3,578) (3,047) Administration expenses – other (2,171) (2,181) (1,900)Depreciation and amortisation (303) (308) (256)
Operating expenses (6,104) (6,067) (5,203)
Operating profit before provisions 5,275 5,110 4,298Provisions for bad and doubtful debts (1,484) (1,149) (817) Provisions for contingent liabilities and commitments (1) (1) 1Loss from joint ventures and associated undertakings (10) (9) (8)
Operating profit 3,780 3,951 3,474Restructuring charge (187) (171) (232)Woolwich integration costs (80) (89) (7)Woolwich fair value adjustments (51) (33) (6)Goodwill amortisation (254) (229) (51)Exceptional items (3) (4) 214
Profit on ordinary activities before tax 3,205 3,425 3,392
Earnings per ordinary share before restructuring charge,integration costs, Woolwich fair value adjustments, goodwill amortisation and exceptional items 40.9p 43.2p 40.5p
Post-tax return on average shareholders’ funds (on a consistent basis with earnings per share above) 17.7% 20.1% 25.0%
The above presentation of operating profit for the years ended 31st December 2002, 2001 and 2000 differs from the statutoryoperating profit shown on page 136 in that it is shown before charging for costs directly associated with the integration ofWoolwich plc, Woolwich fair value adjustments, goodwill amortisation and the restructuring charge relating to staffdisplacement and related costs.
Woolwich fair value adjustments consist of £52m net interest charge (2001: £35m) and £1m of credit to operating expenses(2001: £2m).

Financial reviewIntroduction
IntroductionThe Group’s profit before tax reduced by 6% to £3,205m(2001: £3,425m). This reduction reflected an adversemovement of £178m attributable to the impact of the 24%decline in the FTSE 100 Index on income from the lifeassurance funds and a 29% increase in credit risk provisions to £1,484m (2001: £1,149m). Statutory earnings per sharereduced by 8% to 33.7p.
To facilitate a better understanding of profit trends thebusiness analysis of operating profit below excludes the impactof the restructuring charge, costs directly associated with theintegration of Woolwich plc, Woolwich fair value adjustmentsand goodwill amortisation. Further details on these alternativepresentations are provided on page 97.
Personal Financial Services increased operating profit by 8% to£1,027m (2001: £949m). Income was up 1% at £2,968m(2001: £2,952m). Costs which totalled £1,606m fell 1%(2001:£1,624m) while provisions were down 13% at £334m(2001: £382m).
Barclays Private Clients operating profit decreased by 44% to£333m (2001: £596m) largely reflecting the impact of thesharp reduction in income from the closed long-termassurance funds. Costs increased to £944m (2001: £915m)although were lower than last year when excluding the £72m(2001: £31m) of costs attributable to the change in treatmentof the regulated sales force.
Barclaycard increased operating profit by 21% to £628m(2001: £520m) driven by strong income growth of 14% to£1,582m (2001: £1,386m). Excluding the acquisition ofProvidian UK, income grew 10% and costs 6%. Provisionsincreased by 7% to £402m (2001: £374m).
Business Banking increased operating profit by 15% to£1,262m (2001: £1,100m) reflecting volume growth and thebenefits of tight cost management. Income grew by 5% to£2,508m (2001: £2,382m) and costs fell by 4% to £1,018m(2001: £1,061m). Provisions increased to £226m (2001:£210m).
Barclays Africa operating profit decreased 19% to £105m(2001: £130m) with the fall in profit being mainly attributableto Zimbabwe. All businesses, including Zimbabwe, remainedprofitable in local currencies.
Barclays Capital operating profit fell by 10% to £593m (2001:£662m). Income was up 7% to £2,239m (2001: £2,087m),benefiting from increased market share through a broadeningbusiness mix and further progress in building the clientfranchise. Costs fell 1% to £1,312m (2001: £1,322m). Provisionsrose to £334m (2001: £103m) reflecting continued difficulteconomic conditions (particularly in the US) primarily in thetelecommunications and energy sectors.
Barclays Global Investors operating profit increased 41% to £110m (2001: £78m). Income increased by 5% to £550m(2001: £523m) and costs were down 1% at £439m (2001: £444m).
Total Group provisions of £1,484m comprised £132m (2001:£36m) in respect of South American Corporate Banking and£1,352m ( 2001: £1,113m) of other provisions.
Non-performing lendings increased by £655m to £4,526m.Potential problem loans decreased by £98m to £1,304m.Coverage of non-performing lendings reduced from 72.1% to 68.0% while the coverage of total potential credit risk wasbroadly unchanged at 52.8% (2001: 52.9%).
Shareholders’ funds increased by £720m primarily due to profitretentions. Weighted risk assets increased by £13.9bn (9%) to£173bn. The tier 1 ratio increased from 7.8% to 8.2% while thetotal risk asset ratio increased from 12.5% to 12.8%. Totalassets increased by £46bn to £403bn, including a £35bnincrease within Barclays Capital.
98 Barclays PLC Annual Report 2002
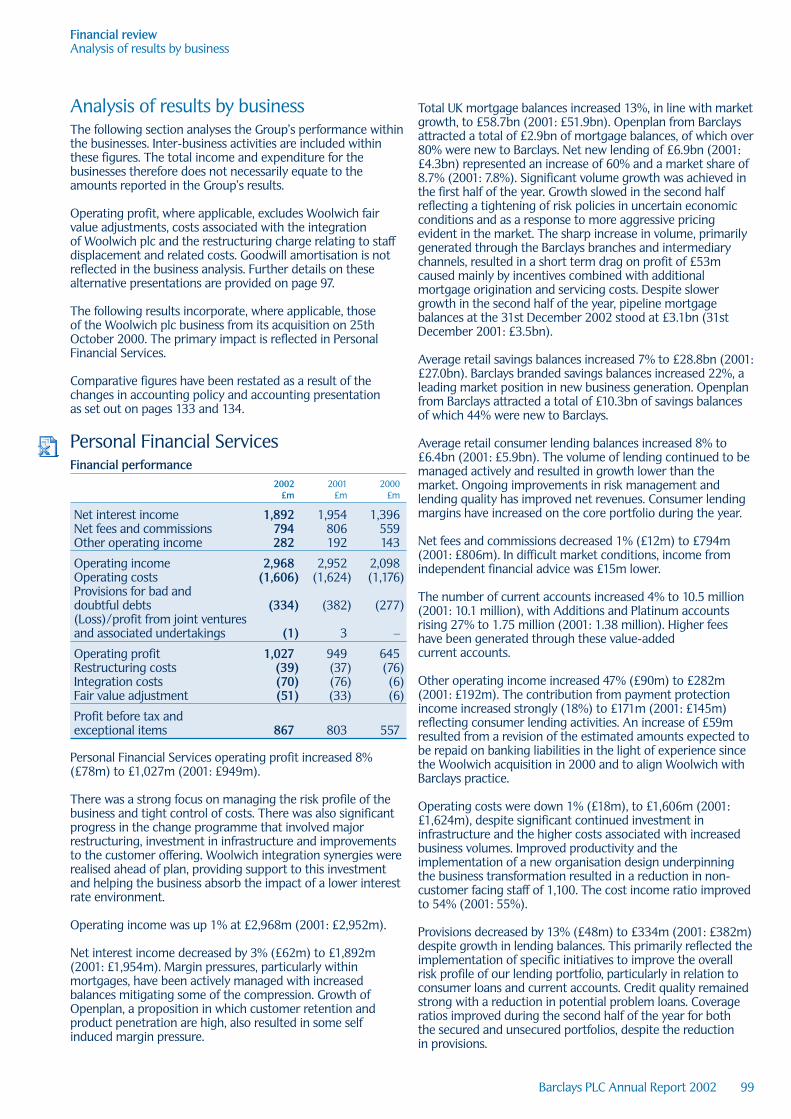
Financial reviewAnalysis of results by business
Total UK mortgage balances increased 13%, in line with marketgrowth, to £58.7bn (2001: £51.9bn). Openplan from Barclaysattracted a total of £2.9bn of mortgage balances, of which over80% were new to Barclays. Net new lending of £6.9bn (2001:£4.3bn) represented an increase of 60% and a market share of8.7% (2001: 7.8%). Significant volume growth was achieved inthe first half of the year. Growth slowed in the second halfreflecting a tightening of risk policies in uncertain economicconditions and as a response to more aggressive pricingevident in the market. The sharp increase in volume, primarilygenerated through the Barclays branches and intermediarychannels, resulted in a short term drag on profit of £53mcaused mainly by incentives combined with additionalmortgage origination and servicing costs. Despite slowergrowth in the second half of the year, pipeline mortgagebalances at the 31st December 2002 stood at £3.1bn (31stDecember 2001: £3.5bn).
Average retail savings balances increased 7% to £28.8bn (2001:£27.0bn). Barclays branded savings balances increased 22%, aleading market position in new business generation. Openplanfrom Barclays attracted a total of £10.3bn of savings balancesof which 44% were new to Barclays.
Average retail consumer lending balances increased 8% to£6.4bn (2001: £5.9bn). The volume of lending continued to bemanaged actively and resulted in growth lower than themarket. Ongoing improvements in risk management andlending quality has improved net revenues. Consumer lendingmargins have increased on the core portfolio during the year.
Net fees and commissions decreased 1% (£12m) to £794m(2001: £806m). In difficult market conditions, income fromindependent financial advice was £15m lower.
The number of current accounts increased 4% to 10.5 million(2001: 10.1 million), with Additions and Platinum accountsrising 27% to 1.75 million (2001: 1.38 million). Higher feeshave been generated through these value-added current accounts.
Other operating income increased 47% (£90m) to £282m(2001: £192m). The contribution from payment protectionincome increased strongly (18%) to £171m (2001: £145m)reflecting consumer lending activities. An increase of £59mresulted from a revision of the estimated amounts expected tobe repaid on banking liabilities in the light of experience sincethe Woolwich acquisition in 2000 and to align Woolwich withBarclays practice.
Operating costs were down 1% (£18m), to £1,606m (2001:£1,624m), despite significant continued investment ininfrastructure and the higher costs associated with increasedbusiness volumes. Improved productivity and theimplementation of a new organisation design underpinningthe business transformation resulted in a reduction in non-customer facing staff of 1,100. The cost income ratio improvedto 54% (2001: 55%).
Provisions decreased by 13% (£48m) to £334m (2001: £382m)despite growth in lending balances. This primarily reflected theimplementation of specific initiatives to improve the overallrisk profile of our lending portfolio, particularly in relation toconsumer loans and current accounts. Credit quality remainedstrong with a reduction in potential problem loans. Coverageratios improved during the second half of the year for both the secured and unsecured portfolios, despite the reduction in provisions.
99Barclays PLC Annual Report 2002
Analysis of results by businessThe following section analyses the Group’s performance withinthe businesses. Inter-business activities are included withinthese figures. The total income and expenditure for thebusinesses therefore does not necessarily equate to theamounts reported in the Group’s results.
Operating profit, where applicable, excludes Woolwich fairvalue adjustments, costs associated with the integration of Woolwich plc and the restructuring charge relating to staffdisplacement and related costs. Goodwill amortisation is notreflected in the business analysis. Further details on thesealternative presentations are provided on page 97.
The following results incorporate, where applicable, those of the Woolwich plc business from its acquisition on 25thOctober 2000. The primary impact is reflected in PersonalFinancial Services.
Comparative figures have been restated as a result of thechanges in accounting policy and accounting presentation as set out on pages 133 and 134.
Personal Financial ServicesFinancial performance
2002 2001 2000£m £m £m
Net interest income 1,892 1,954 1,396Net fees and commissions 794 806 559Other operating income 282 192 143
Operating income 2,968 2,952 2,098Operating costs (1,606) (1,624) (1,176)Provisions for bad and doubtful debts (334) (382) (277)(Loss)/profit from joint venturesand associated undertakings (1) 3 –
Operating profit 1,027 949 645Restructuring costs (39) (37) (76)Integration costs (70) (76) (6)Fair value adjustment (51) (33) (6)
Profit before tax andexceptional items 867 803 557
Personal Financial Services operating profit increased 8%(£78m) to £1,027m (2001: £949m).
There was a strong focus on managing the risk profile of thebusiness and tight control of costs. There was also significantprogress in the change programme that involved majorrestructuring, investment in infrastructure and improvementsto the customer offering. Woolwich integration synergies wererealised ahead of plan, providing support to this investmentand helping the business absorb the impact of a lower interestrate environment.
Operating income was up 1% at £2,968m (2001: £2,952m).
Net interest income decreased by 3% (£62m) to £1,892m(2001: £1,954m). Margin pressures, particularly withinmortgages, have been actively managed with increasedbalances mitigating some of the compression. Growth ofOpenplan, a proposition in which customer retention andproduct penetration are high, also resulted in some selfinduced margin pressure.

Financial reviewAnalysis of results by business
Latest loan to value ratios within the mortgage book averaged45%. Buy to let balances represented less than 5% of the totalmortgage book and the latest loan to value ratios for theseloans averaged 57%. Lending criteria for buy to let mortgageswere tightened in the second half of the year.
The Openplan proposition continued to be highly successful inattracting new customers and retaining existing customers.Fully launched in April 2002, Openplan from Barclays attracted778,000 customers across the UK (2001: 10,000). Productpenetration was 4.3, well above the average of 2.5 outsideOpenplan. Openplan from The Woolwich customer numbersrose to 1,206,000 (2001: 960,000) and product penetrationincreased to 3.25 (2001: 3.08). There is evidence thatOpenplan facilitates the development of a deeper and moreenduring customer relationship through higher productpenetration and lower attrition rates.
Personal Financial Services operating profit in 2001 was£949m (2000: £645m). The year on year comparison isimpacted by the inclusion of a significant element of theWoolwich plc business which was acquired on 25th October 2000.
Net interest income in 2001 was £1,954m (2000: £1,396m)primarily reflecting the inclusion of Woolwich where thecontribution from mortgage and other lending activitiescompensated for margin pressure on deposit income. In otherparts of the business, increased net interest income was drivenby strong growth in deposit balances and by continued growthin consumer lending balances.
Net fees and commissions in 2001 were £806m (2000: £559m)primarily reflecting the inclusion of Woolwich where there was a good performance from IFA operations and fees frommortgage related activities. Additional current account andoverdraft lending activity, and higher income from the fee-based Additions current account also contributed to the increase.
Other operating income in 2001 was £192m (2000: £143m).In addition to the impact of the inclusion of Woolwich theincrease reflects higher levels of payment protection insuranceand underwriting which benefited from improved volumesrelating to customer lending and credit card borrowing.
Operating costs in 2001 were £1,624m (2000: £1,176m). Apartfrom the inclusion of Woolwich, where the level of costs wasimpacted by increased business, costs were maintained notwithstanding the growth in business volumes.
Provisions in 2001 were £382m (2000: £277m). In addition tothe inclusion of Woolwich, provisions also rose in otherconsumer lending portfolios albeit at a rate below the growthin consumer lending balances.
100 Barclays PLC Annual Report 2002
Barclays Private ClientsFinancial performance
2002 2001 2000£m £m £m
Net interest income 766 829 788Net fees and commissions 594 567 579Income from the long-termassurance business (51) 127 114Other operating income 14 24 36
Operating income 1,323 1,547 1,517Operating costs (944) (915) (895)Provisions for bad and doubtful debts (37) (36) (23)Loss from joint ventures and associated undertakings (9) – –
Operating profit 333 596 599Restructuring costs (44) (34) (46)Integration costs (8) (9) –
Profit before tax andexceptional items 281 553 553
Barclays Private Clients operating profit fell 44% (£263m) to£333m (2001: £596m), with a large part of the decreaseattributable to the impact of falling equity markets affectingthe income of the closed long-term assurance funds.
On 11th October 2002, the Caribbean businesses of Barclaysand Canadian Imperial Bank of Commerce were combined toform FirstCaribbean International Bank Ltd, generating a one-off economic profit contribution of £206m. The gain isrecognised in the statement of total recognised gains andlosses and in the economic profit for the year of BarclaysPrivate Clients. From 11th October 2002, the interest inFirstCaribbean was accounted for as an associated undertaking.
Excluding the impact of the closed long-term assurance fundsand adjusting for the change to the Caribbean business, theoperating profit decline was 10%.
Operating income decreased 14% (£224m) to £1,323m (2001:£1,547m) mainly reflecting the impact of the fall in incomefrom the closed long-term assurance funds. Income from long-term assurance business was also impacted by the cost ofcustomer redress for endowment policies. Income was resilientin a difficult market environment.
Net interest income decreased 8% (£63m), to £766m (2001:£829m). The increased income generated from higher averagecustomer deposits, up 2%, and average loans, up 3%, wasoffset by margin compression and the effects of lower interest rates.
Net fees and commissions increased 5% (£27m), to £594m(2001: £567m). On a comparative basis, this included £72m(2001: £31m) of commission income associated with theregulated sales force and previously offset against costs andborne within the life assurance fund. Excluding this and theCaribbean income, net fees and commissions decreased by 2%reflecting the impact of market conditions on the appetite forinvestment products. Average daily deal volumes in UK retailstockbroking were slightly down on 2001, at 6,300 (2001:6,400). The stockbroking business continued to maintain itsleading UK position with a 12% (2001: 11%) market share ofretail stockbroking, as measured by retail client orders.

Financial reviewAnalysis of results by business
Operating costs were up 3% (£29m), to £944m (2001: £915m).Costs were tightly managed and were lower than 2001 whenexcluding the £72m (2001: £31m) of costs attributable to thechange in treatment of the regulated sales force as detailedabove. Headcount was tightly managed with a net reduction of600 in the year, excluding the impact of the Caribbeantransaction. Strategic investment spend at £87m, almost 10%of operating costs, was maintained at a level similar to 2001,despite the challenging market environment.
Total customer funds, comprising customer deposits andassets under management (including assets now managed byLegal & General under the strategic alliance), fell by £8bn to£85bn (31st December 2001: £93bn). This included areduction of £4bn as a result of the Caribbean transaction andthe sale of the US based Americas private banking business tothe Royal Bank of Canada in June 2002.
Despite the volatile markets, 2002 witnessed a net increase incustomer numbers of 1% and higher volumes of business withexisting customers. In the UK, regulated product sales volumesincreased 43%. Openplan was launched for UK affluentcustomers, building on the successful launch in Spain inSeptember 2001. In the UK, 95,000 affluent customers joinedOpenplan, which attracted £3.7bn of savings and £1.6bn ofmortgage balances. In Spain, 36,000 new customers wereattracted to the bank in 2002 with 40% of the new customerflow choosing Openplan. In Spain, our market share of net newmortgage business increased to 5.0% in 2002 from 0.5% at thepoint of launch of Openplan in September 2001.
Sales of Legal & General life and pension products weremaintained at levels broadly similar to 2001, but sales of fundsand bonds were impacted by poor market sentiment forinvestment products. With the success of the Legal & Generalstrategic alliance in the UK, similar arrangements in Francewith Axa and Fidelity were established during 2002.
Operating profit in 2001 of £596m was at a similar level to thatin 2000 (£599m). Operating income in 2001 increased by 2%compared to 2000 benefiting from the diversity of the product,geography and client mix, despite difficult market conditions.
Net interest income in 2001 increased by 5% to £829m (2000:£788m). Increased lending volumes and average deposits werepartially offset by margin compression in deposits, due toreduced interest rates.
Net fees and commissions in 2001 decreased by 2% to £567m(2000: £579m), primarily due to lower fund management andbrokerage fees. This was partially offset by commission incomeof £35m from the sale of Legal & General products.
Income from long-term assurance in 2001 increased by 11% to£127m (2000: £114m).
Operating costs in 2001 increased by 2% to £915m (2000:£895m). This increase includes the £31m relating to theregulated sales force and field sales managers following theLegal & General strategic alliance where costs were previouslyborne within the long-term assurance fund.
101Barclays PLC Annual Report 2002
BarclaycardFinancial performance
2002 2001 2000£m £m £m
Net interest income 886 807 681Net fees and commissions 696 579 518
Operating income 1,582 1,386 1,199Operating costs (552) (489) (454)Provisions for bad and doubtful debts (402) (374) (304)Loss from joint ventures – (3) (2)
Operating profit 628 520 439Restructuring costs (12) (13) (9)Integration costs (1) (3) (1)
Profit before tax andexceptional items 615 504 429
Barclaycard’s operating profit increased 21% (£108m) to£628m (2001: £520m).
Operating income increased 14%. Excluding the impact of theacquisition of Providian UK, the increase was 10%.
Net interest income increased 10% (£79m) to £886m (2001:£807m). This was mainly due to good growth in average UKextended credit balances, up 9% to £6.5bn (2001: £6.0bn), andto continued cardholder rate management coupled with fallinginterest rates. Period end extended credit balances were 19%,or £1.1bn, higher (at £7.1bn) than at 31st December 2001, ofwhich Providian UK contributed £434m. Recruitment of UKcustomers reached a record 1,218,000 (2001: 763,000) in theperiod, up 60%, driven by the continued application ofInformation Based Customer Management (IBCM) capabilities.Despite strong competition in the market throughout 2002,Barclaycard increased its market share of new cards issued.
Net fees and commissions increased 20% (£117m) to £696m(2001: £579m), principally as a result of replacing UK annualfees with fees based on account activity.
Operating costs increased 13% (£63m) to £552m (2001:£489m). Excluding Providian UK, costs grew 6%. The costincome ratio was maintained at 35% (2001: 35%).
Provisions, which increased 7% (£28m) to £402m (2001:£374m), rose in line with the growth in average extended creditbalances and broadly tracked Risk Tendency. The provisionsimpact of strong customer recruitment was mitigated by anumber of new risk management initiatives primarily focusedon collections.
Barclaycard International businesses recorded an operating lossof £13m (2001: loss £20m). Operating profits were recordedfor the last four months of 2002, delivering profitability aheadof schedule. Income increased 30% and average extendedcredit balances rose by 29%.
Operating profit in 2001 increased by 18% to £520m (2000: £439m).
Net interest income in 2001 increased by 19% to £807m(2000: £681m). This was mainly as a result of good growth inaverage UK extended credit balances which rose 9% to £6.0bn(2000: £5.5bn), and improved cardholder rate managementcoupled with lower interest rates.

Financial reviewAnalysis of results by business
102 Barclays PLC Annual Report 2002
Fees and commissions in 2001 increased by 12% to £579m(2000: £518m) principally reflecting the impact of replacing UKannual account fees with fees based on account behaviour.
Operating costs in 2001 increased 8% to £489m (2000:£454m). This was largely attributable to higher strategicinvestment costs arising from increased recruitment ofcustomers outside the UK and investment in capacity tofacilitate the growing number of online users.
Provisions in 2001 increased 23% to £374m (2000: £304m)and was mainly attributable to growth in lending across the UKand international businesses and the continuing high levels ofrecruitment during the last two years.
Business BankingFinancial performance
2002 2001 2000£m £m £m
Net interest income 1,620 1,553 1,488Net fees and commissions 864 833 787Other operating income 24 (4) 8
Operating income 2,508 2,382 2,283Operating costs (1,018) (1,061) (1,078)Provisions for bad and doubtful debts (226) (210) (120)Loss fromassociated undertakings (2) (11) (1)
Operating profit 1,262 1,100 1,084Restructuring costs (42) (49) (78)Integration costs (1) (1) –
Profit before tax andexceptional items 1,219 1,050 1,006
Business Banking operating profit increased 15% (£162m) to£1,262m (2001: £1,100m), reflecting improved income growthand tight cost management.
Net interest income increased 4% (£67m) to £1,620m (2001:£1,553m) partly as a result of increased volumes. Averagelending balances increased 4% to £42.6bn and average depositbalances increased 3% to £43.9bn. Lending margins continuedto ease modestly, but stabilised in the second half of the year.Deposit margins improved slightly, reflecting good growth inhigher margin products combined with changes in the product mix.
Lending growth was concentrated towards large businesscustomers. The strategy for the large business sector is to takeadvantage of profitable market opportunities and to increaseindustry focus and expertise within the relationshipmanagement teams. Lending volumes to medium businesscustomers showed encouraging signs of growth in the secondhalf of the year, while lending to the small business sectorcontinued to be affected by weak economic conditions. TheSales Financing product range remained a high growth areawith turnover volume up 57%. The overall lending portfolioremained well diversified by industrial classification.
Net fees and commissions increased 4% (£31m) to £864m(2001: £833m). Lending related fees increased strongly andincluded an increased contribution from leveraged finance.Money transmission income fell as a result of pricecompetition and a reduction in average fee levels due to themigration to more efficient, lower cost, electronic paymentmechanisms. Foreign exchange related income was flat despitea reduction in volumes.
Other operating income mainly represented income from arestructuring of the leasing portfolio.
Operating costs fell 4% (£43m) to £1,018m (2001: £1,061m),reflecting continued management focus on operational costefficiency. Business as usual costs fell by 1% as a result of areduction in headcount but also reflected the impact of thediscontinuation of the BarclaysB2B customer proposition in thefirst half of 2002. The cost income ratio improved to 41%(2001: 45%).
Provisions increased 8% (£16m) to £226m (2001: £210m),broadly in line with expectations. Conditions in a number of industries were weaker, although the composition of thelending stock and flow by risk grade for end 2002 against end 2001 remained steady. Provisions remained below RiskTendency.
Operating profit in 2001 increased by 1% to £1,100m (2000: £1,084m).
Net interest income in 2001 increased 4% to £1,553m (2000:£1,488m) reflecting increased lending and deposit balancespartly offset by a slight reduction in the overall margin.
Net fees and commissions in 2001 increased 6% to £833m(2000: £787m). Lending related fees growth was driven bygood activity levels in Large Business. Money transmissionincome fell with higher volumes offset by the impact ofcompetitve pressures on fee levels. Foreign exchange relatedincome increased strongly as a result of higher turnover.
Operating costs in 2001 fell 2% to £1,061m (2000: £1,078m).
Provisions in 2001 increased 75% to £210m (2000: £120m) thisreflected weaker economic conditions especially in themanufacturing sector.

Financial reviewAnalysis of results by business
103Barclays PLC Annual Report 2002
Barclays AfricaFinancial performance
2002 2001 2000£m £m £m
Net interest income 160 176 179Net fees and commissions 114 130 126Other operating income 1 6 7
Operating income 275 312 312Operating costs (143) (157) (156)Provision for bad anddoubtful debts (27) (25) (47)
Operating profit 105 130 109Restructuring costs (16) (7) (16)
Profit before tax andexceptional items 89 123 93
Operating profit decreased 19% (£25m) to £105m (2001:£130m). This decrease was mainly attributable to the situationin Zimbabwe, where there was a decline in operating profit of£14m. All businesses remained profitable in local currencies.
Net interest income fell 9% (£16m) to £160m (2001: £176m)primarily attributable to the effects of Zimbabwe. ExcludingZimbabwe, net interest income increased 2% (£3m) to £151m(2001: £148m) reflecting growth in customer balances, withlending up 29% to £1.5bn and deposits rising 25% to £2.5bn.Net interest margins fell due to the impact of lower interestrates, particularly affecting deposit margins.
Net fees and commissions decreased 12% (£16m) to £114m(2001: £130m), mainly due to Zimbabwe.
Operating costs declined 9% (£14m) to £143m (2001: £157m)largely as a result of the impact of Zimbabwe. The cost income ratio increased marginally to 52% (2001: 50%) with tight control of costs offsetting increased strategicinvestment spend.
Provisions increased by 8% (£2m) to £27m (2001: £25m).
Operating profit in 2001 increased by 19% to £130m (2000:£109m), primarily as a result of a £22m reduction in the netprovisions charge to £25m.
Barclays CapitalFinancial performance
2002 2001 2000£m £m £m
Net interest income 889 639 474Dealing profits 827 1,006 680Net fees and commissions 463 389 453Other operating income 60 53 39
Operating income 2,239 2,087 1,646Operating costs (1,312) (1,322) (1,061)Provisions for bad and doubtful debts (334) (103) (66)
Operating profit 593 662 519Restructuring costs (12) (7) (2)
Profit before tax andexceptional items 581 655 517
Operating profit fell 10% to £593m (2001: £662m), due toincreased provisions as the difficult economic conditionsaffected specific sectors. Operating income grew 7% to£2,239m (2001: £2,087m). This reflects the underlyingstrength of the Barclays Capital business model and continuedprogress in building the client franchise. Weighted risk assetsgrew 3% to £53bn (2001: £52bn). The average daily value atrisk (DVaR) remained relatively low at £23m (2001: £19m).
Secondary income, comprising net interest income and dealingprofits, primarily arises from market activities including clientrisk management and financing solutions. The increase to£1,716m (2001: £1,645m) reflected strong growth in netinterest income to £889m (2001: £639m), in particular frommoney markets and structured capital markets. Dealing profitsfell to £827m (2001: £1,006m). The fall resulted from poorconditions in the credit and equity markets partially offset bystrong gains in fixed income and commodities.
Primary income, net fees and commissions, increased to£463m (2001: £389m). This growth was driven by the Creditbusiness with strong performances from primary bonds andstructured capital markets. This reflected both increasingmarket share and the depth and quality of client relationships.Net fees and commissions included £87m (2001: £61m) ofinternal fees for structured capital market activities arrangedby Barclays Capital.
Operating costs fell 1% to £1,312m (2001: £1,322m). Therewas continued strategic investment in product, client coverageand distribution capabilities, offset by focused cost reduction inother areas. Revenue related costs fell in line with performance.Staff costs were maintained at 53% (2001: 53%) of operatingincome less provisions. Headcount remained flat at 5,500.
Provisions increased to £334m (2001: £103m). The increasereflected continued difficult economic conditions (particularlyin the US), primarily in the telecommunications and energysectors. In the second half, provisions largely arose from thefurther deterioration of existing non performing loans.
Operating profit in 2001 increased 28% to £662m (2000: £519m).
Secondary income in 2001 increased 43% to £1,645m (2000:£1,154m) reflecting strong growth in net interest income anddealing profits. Both the Rates and Credit businessesperformed well.
Primary income in 2001 fell 14% to £389m (2000: £453m)mainly due to lower financing volumes in syndicated loans.
Operating costs in 2001 rose 25% to £1,322m (2000:£1,061m), largely due to variable revenue related costsincreasing in line with performance.
Provisions in 2001 increased to £103m (2000: £66m). Therewas an increase in new and increased provisions in the US,primarily relating to a small number of large loans.

Financial reviewAnalysis of results by business
Barclays Global InvestorsFinancial performance
2002 2001 2000£m £m £m
Net interest income 12 5 6Net fees and commissions 538 518 435Other operating income – (1)
Operating income 550 523 440Operating costs (439) (444) (381)Loss from associated undertakings (1) (1) –
Operating profit beforetax and exceptional items 110 78 59
Barclays Global Investors operating profit increased 41%(£32m) to £110m (2001: £78m) reflecting strong assetgathering, a greater proportion of higher margin active fundsbusiness, good investment performance across a range ofproducts and ongoing cost management.
Fees and commissions increased by 4% (£20m) to £538m(2001: £518m) despite significantly lower stock market levels.Within an increasingly diverse set of business lines, thisincrease reflected the continued expansion in the advancedactive business and growth of Global iShares (Exchange TradedFunds). These more than offset the impact of the decline in thestock market levels and lower securities lending fee spreads(which were the result of a more stable interest rateenvironment) and the impact of exchange rate translation movements.
New business from strong asset gathering coupled with a shiftin asset mix towards higher margin active products drovegrowth in management fees. Performance fees benefited fromstrong advanced active product investment performance andnew assets within incentive contracts. A change in the timingof the recognition of management fees has contributed £11mto the growth in fees. 58% of management fees are derivedfrom active asset management.
Operating costs of £439m were down 1% relative to 2001.Increased performance related pay was offset by improvedefficiency and the impact of exchange rate translationmovements. The cost income ratio improved to 80% (2001: 85%).
Total assets under management decreased 13% (£68bn) to£462bn (2001: £530bn). This was the net result of an increaseof £56bn attributable to new assets being more than offset by£52bn due to exchange rate translation movements and £72bnattributable to adverse market movements. Assets undermanagement comprised £338bn (73%) of indexed assets,£41bn (9%) of managed cash assets and £83bn (18%) of active assets.
Growth in Global iShares (Exchange Traded Funds) continuedto be strong. Global iShares assets grew to £22bn, up 47%(2001: £15bn). The launch of the first Fixed Income iShares inthe US in the third quarter of the year demonstrated theongoing commitment to market leading innovation.
Operating profit in 2001 increased 32% to £78m (2000: £59m)in a year of significantly lower stock market levels.
104 Barclays PLC Annual Report 2002
Fees and commissions in 2001 increased by 19% to £518m(2000: £435m). The increase was driven by a large increase inperformance fees as a result of strong active productperformance, increased securities lending revenues as a resultof increases in stock lending volumes and spreads, and byhigher transition fees due to increased business in clientportfolio restructuring.
Operating costs in 2001 increased by 17% to £444m (2001:£381m) primarily reflecting higher performance related staff costs.
Other operationsFinancial performance
2002 2001 2000£m £m £m
Property costs 12 14 31Central services (17) (10) 2Management of Group capital (37) 5 15South American Corporate Banking (127) (18) 25
Operating (loss)/profit (169) (9) 73Restructuring costs (10) (19) 6
(Loss)/profit before tax and exceptional items (179) (28) 79
The loss in South American Corporate Banking for the full year2002 of £127m (2001: £18m) reflected provisions relating tovarious Latin American exposures primarily in Argentina.
The Management of Group capital includes the internal feescharged by Barclays Capital for structured capital marketsactivities. In 2002, these fees amounted to £87m (2001: £61m).
The reduced property surplus in 2001 reflects decreaseddisposal activity. The increased deficit in Central servicesreflects additional investment in core technology andoperational infrastructure.
The decreased surplus in 2001 in Management of Groupcapital was attributable to reduced credits arising in centrallymanaged transition businesses partially offset by lower internalfees payable The loss in South American Corporate Bankingreflected the higher level of provisions relating to various LatinAmerican exposures primarily in Argentina.
Head office functionsFinancial performance
2002 2001 2000£m £m £m
Operating costs (109) (75) (53)Restructuring costs (12) (5) (11)
Total (121) (80) (64)
The increase in operating costs of £34m primarily reflectsincreased expenditure relating to marketing and centralsystems costs.
The increase in 2001 operating costs reflected expenditure onvarious group initiatives, the cost of which were held centrally.

105Barclays PLC Annual Report 2002
Financial reviewResults by nature of income and expense
The reduction in the Group net interest margin reflecteddecreases in both the domestic and international margins.
The domestic margin has shown a decrease of 14 basis pointsreflecting active management of margins across the UKbusinesses in competitive market conditions, particularly in themortgage market, and a low interest rate environment. Theinternational margin has fallen by 11 basis points mainly as aresult of managing down the higher yielding South AmericanCorporate Banking business and an increase in non performingloans in the US.
The benefit of free funds fell 0.08% to 0.33% as a result of thereduction in interest rates.
The overall benefit of free funds on a hedged basis rose to0.55% (2001: 0.53%) reflecting an increase in the effective rateof the hedge more than offsetting the fall in the liabilityinterest rates.
Net interest income of £5,966m in 2001, including the impactof the inclusion of Woolwich for the whole year, was 17%higher than 2000 (£5,108m).
In 2001, overall banking margins were 17 basis points down onthe level recorded in 2000 (3.08%) The adverse impact on themargin of the acquisition of Woolwich plc was mitigated inpart by the benefit of a gain on closure of a surplus hedgefollowing the acquisition of Woolwich plc. Increased margins inBarclaycard in part offset margin pressure in Personal FinancialServices, Barclays Private Clients and Business Banking.
In 2001, the benefit of free funds fell 0.09% from its 2000 levelof 0.50%. The fall in short term market rates increased thecontribution to the net margin from the central managementof Group interest rate exposure to 0.11% from 0.05%.
Prevailing average interest rates2002 2001 2000
% % %
UK:Barclays Bank PLC base rate 4.00 5.12 5.96 London Inter-Bank OfferedRate (LIBOR):three month sterling 4.06 5.04 6.10 three month eurodollar 1.80 3.78 6.47 United States prime rate 4.68 6.92 9.24
Average interest earning assets and liabilities – banking business
2002 2001 2000£m £m £m
Average interest earning assets:Group 225,178 205,017 166,200Domestic 151,810 141,087 104,845 International 73,368 63,930 61,355 Average interest bearing liabilities:Group 199,708 184,105 147,949Domestic 130,045 122,422 89,712International 69,663 61,683 58,237
Results by nature of income and expenseIn the tables below, statutory basis refers to the presentation ofthe Group’s results in the statutory profit and loss account onpage 136. In addition, income and cost totals are shownexcluding, where appropriate, Woolwich fair value adjustmentsand costs associated with the integration of Woolwich plc, therestructuring charge relating to staff displacement and relatedcosts and goodwill amortisation, to assist in the analysis of theongoing business performance. Further details on thesealternative presentations are provided on page 97.
Consideration of the results for 2001 and 2002 as compared to2000 is materially impacted by the acquisition of Woolwich plcon 25th October 2000.
Comparative figures have been restated as a result of thechanges in accounting policy and accounting presentation asset out on pages 133 to 134.
Net interest income2002 2001 2000
£m £m £m
Interest receivable 12,044 13,458 11,788Interest payable (5,839) (7,492) (6,682)Profit on redemption/repurchase of loan capital – – 2
Statutory basis 6,205 5,966 5,108
Excluding Woolwich fair valueadjustments 6,257 6,001 5,115
Group net interest income increased by 4% to £6,205m,reflecting growth in balances which more than offset a 16 basispoint fall in the Group net interest margin to 2.75%.
Average interest earning assets increased by 10% to £225bn,primarily due to a £6bn increase in UK mortgage balanceswithin Personal Financial Services and increases of £4bn inholdings of debt securities and £5bn of lending to banks inBarclays Capital.
Domestic average interest earning assets increased by 8% to£152bn (2001: £141bn), predominantly driven by the £6bnincrease in mortgage balances in Personal Financial Services.International average interest earning assets increased by 15%to £73bn (2001: £64bn), primarily driven by an increase inBarclays Capital wholesale activities.
Net interest income
£bn
2
4
6
8
12
10
14
16
0
Interest receivableInterest payableNet interest income
2002
6.20
5.84
12.04
2001
5.97
7.49
13.46
2000
6.68
5.11
11.79

Net fees and commissions2002 2001 2000
£m £m £m
Fees and commissions receivable 4,454 4,202 3,676Less: fees and commissionspayable (529) (465) (320)
Statutory basis 3,925 3,737 3,356
Group net fees and commissions increased by £188m (5%) to£3,925m, predominantly reflecting increases in Barclaycardand Barclays Capital.
In Barclaycard, the impact of replacing annual fees with feesbased on account activity was the principal factor fuellinggrowth in net fees and commissions of 20% to £696m (2001: £579m).
Barclays Capital net fees and commissions increased 19% to£463m (2001: £389m). This growth was driven by the Creditbusiness with strong performances from primary bonds andstructured capital markets.
In Business Banking, net fees and commissions increased by 4%to £864m (2001: £833m).
Barclays Private Clients and Barclays Global Investorscontributed increases totalling £47m. In Barclays Africa, therewas a £16m reduction principally due to the situation inZimbabwe. In Personal Financial Services, there was a reductionof £12m reflecting lower income from independent financial advice.
Personal Financial Services, Barclays Private Clients and BusinessBanking fees and commissions included £135m (2001: £129m)in respect of foreign exchange income on customer transactionswith Barclays Capital.
Net fees and commissions in 2001, including the impact of theinclusion of Woolwich for the whole year, were 11% higherthan in 2000 (£3,356m).
In addition to the inclusion of Woolwich plc there were strongperformances in a number of areas in 2001. In PersonalFinancial Services net fees and commissions increased by44% to £806m reflecting a good performance from IFAoperations, fees from lending activities and higher fee incomefrom fee-based Additions accounts. Barclaycard net fees andcommissions increased by 12% to £579m, principally as aresult of replacing UK annual account fees with fees based on account behaviour.
Barclays Global Investors net fees and commissions increased£83m to £518m largely driven by a large increase inperformance fees.
In Barclays Capital net fees and commissions fell 14% to£389m (2000: £453m) mainly due to lower financing volumesin syndicated loans. In Barclays Private Clients net fees andcommissions were £12m lower than in 2000 (£579m) primarilydue to lower fund management and brokerage fees.
106 Barclays PLC Annual Report 2002
Financial reviewResults by nature of income and expense
Yields, spreads and margins – banking business (a)2002 2001 2000
% % %
Gross yield (b)Group 5.35 6.56 7.09 Domestic 5.97 7.10 7.90 International 4.06 5.38 5.71 Interest spread (c)Group 2.42 2.50 2.58Domestic 3.22 3.23 3.51International 0.80 0.91 1.01 Interest margin (d)Group 2.75 2.91 3.08Domestic 3.61 3.75 4.15 International 0.96 1.07 1.25
Notes(a) Domestic business is conducted primarily in the UK in
Sterling. International business is conducted primarily inforeign currencies. In addition to the business carried outby overseas branches and subsidiaries, internationalbusiness is transacted in the United Kingdom by Barclays Capital.
The yields, spreads, and margins shown above exclude non-margin related items including profits and losses on therepurchase of loan capital and the unwinding of thediscount on vacant leasehold property provisions.
(b) Gross yield is the interest rate earned on average interestearning assets.
(c) Interest spread is the difference between the interest rateearned on average interest earning assets and the interestrate paid on average interest bearing liabilities.
(d) Interest margin is net interest income as a percentage ofaverage interest earning assets.
The net interest income and average balances of the tradingbusiness are shown separately on the average balance sheet onpages 112 to 115.
Non-interest income
£m
1,000
2,000
3,000
4,000
6,000
5,000
0
Net fees and commissionsOther operating incomeDealing profits
2002
833364
3,925
2000
353677
3,356
2001
1,011428
3,737
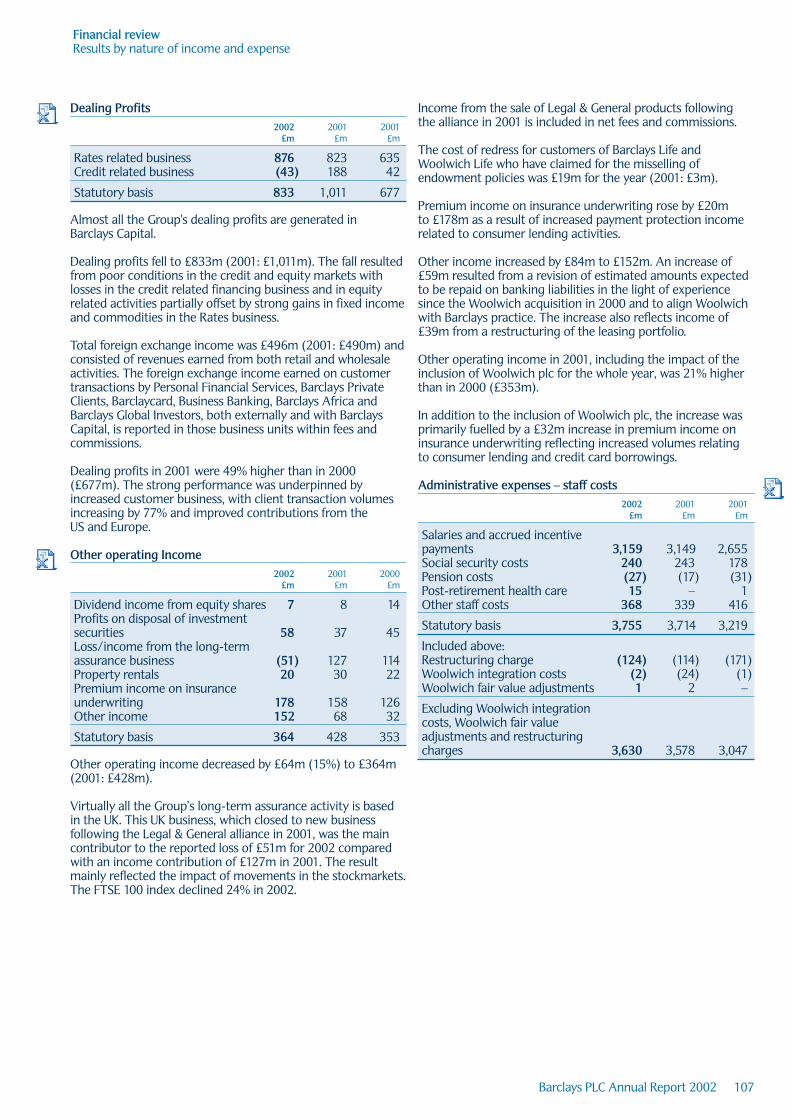
107Barclays PLC Annual Report 2002
Financial reviewResults by nature of income and expense
Dealing Profits2002 2001 2001
£m £m £m
Rates related business 876 823 635Credit related business (43) 188 42
Statutory basis 833 1,011 677
Almost all the Group's dealing profits are generated in Barclays Capital.
Dealing profits fell to £833m (2001: £1,011m). The fall resultedfrom poor conditions in the credit and equity markets withlosses in the credit related financing business and in equityrelated activities partially offset by strong gains in fixed incomeand commodities in the Rates business.
Total foreign exchange income was £496m (2001: £490m) andconsisted of revenues earned from both retail and wholesaleactivities. The foreign exchange income earned on customertransactions by Personal Financial Services, Barclays PrivateClients, Barclaycard, Business Banking, Barclays Africa andBarclays Global Investors, both externally and with BarclaysCapital, is reported in those business units within fees andcommissions.
Dealing profits in 2001 were 49% higher than in 2000 (£677m). The strong performance was underpinned byincreased customer business, with client transaction volumesincreasing by 77% and improved contributions from the US and Europe.
Other operating Income2002 2001 2000
£m £m £m
Dividend income from equity shares 7 8 14 Profits on disposal of investmentsecurities 58 37 45 Loss/income from the long-termassurance business (51) 127 114Property rentals 20 30 22 Premium income on insuranceunderwriting 178 158 126 Other income 152 68 32
Statutory basis 364 428 353
Other operating income decreased by £64m (15%) to £364m(2001: £428m).
Virtually all the Group’s long-term assurance activity is basedin the UK. This UK business, which closed to new businessfollowing the Legal & General alliance in 2001, was the maincontributor to the reported loss of £51m for 2002 comparedwith an income contribution of £127m in 2001. The resultmainly reflected the impact of movements in the stockmarkets.The FTSE 100 index declined 24% in 2002.
Income from the sale of Legal & General products following the alliance in 2001 is included in net fees and commissions.
The cost of redress for customers of Barclays Life andWoolwich Life who have claimed for the misselling ofendowment policies was £19m for the year (2001: £3m).
Premium income on insurance underwriting rose by £20m to £178m as a result of increased payment protection incomerelated to consumer lending activities.
Other income increased by £84m to £152m. An increase of£59m resulted from a revision of estimated amounts expectedto be repaid on banking liabilities in the light of experiencesince the Woolwich acquisition in 2000 and to align Woolwichwith Barclays practice. The increase also reflects income of£39m from a restructuring of the leasing portfolio.
Other operating income in 2001, including the impact of theinclusion of Woolwich plc for the whole year, was 21% higherthan in 2000 (£353m).
In addition to the inclusion of Woolwich plc, the increase wasprimarily fuelled by a £32m increase in premium income oninsurance underwriting reflecting increased volumes relating to consumer lending and credit card borrowings.
Administrative expenses – staff costs2002 2001 2001
£m £m £m
Salaries and accrued incentivepayments 3,159 3,149 2,655 Social security costs 240 243 178 Pension costs (27) (17) (31) Post-retirement health care 15 – 1 Other staff costs 368 339 416
Statutory basis 3,755 3,714 3,219
Included above:Restructuring charge (124) (114) (171)Woolwich integration costs (2) (24) (1)Woolwich fair value adjustments 1 2 –
Excluding Woolwich integrationcosts, Woolwich fair valueadjustments and restructuringcharges 3,630 3,578 3,047

108 Barclays PLC Annual Report 2002
Financial reviewResults by nature of income and expense
Staff costsStaff costs, excluding the restructuring charge together withthe integration costs and fair value adjustments arising fromthe acquisition of Woolwich plc, increased by 1% to £3,630m.
Salaries and accrued incentive payments were broadly flat. Theimpact of the annual UK pay award was offset by a reduction inGroup staff numbers and in payments to temporary staff. Inaddition, staff costs included £55m (2001: £25m) relating tothe regulated sales force following the formation of thestrategic alliance with Legal & General from August 2001.Increased costs in Barclays Global Investors were in line withimproved performance but were more than offset by areduction in Barclays Capital.
Pension costs, calculated in accordance with SSAP 24, includeda credit of £72m (2001: £72m) in respect of the Group's mainUK pension schemes. Pension assets at the end of September2002 were £9.5bn (2001: £10.7bn). Based on a valuation dateof 30th September 2002, there was an actuarial funding ratioof 104% (2001: 110%).
Under FRS 17, there would have been a charge of £130m inrespect of the Group's main UK pension scheme in 2002 and adeficit of £1.3bn. This compares with the surplus of £544munder SSAP 24 for 2002.
Permanent and contract staff numbers fell by 3,900 of which1,600 were attributable to the treatment of the Caribbeanbusiness as an associated undertaking. The implementation ofrestructuring programmes resulted in a decrease of 2,600. Thiswas primarily in Personal Financial Services, Barclays PrivateClients and Barclays Africa, but it was spread across thebusinesses. A further 1,000 came from outsourcing, (of which700 staff were outsourced to an associated undertaking),mainly of mortgage production administration. This was partlyoffset by an increase in Barclaycard of 500, mostly attributableto the acquisition of Providian UK and growth in other businessareas of 800.
Staff costs in 2001, including the impact of the inclusion ofWoolwich plc for the whole year except for costs of integrationbut excluding the restructuring charge, were £531m higherthan in 2000 (£3,047m).
Staff numbers
000’
s
20
40
60
100
80
0
2002
74.7
2001
78.6
2000
76.2
Staff numbers (a)2002 2001 2000
Personal Financial Services (b) 29,600 32,100 30,600Barclays Private Clients (c) 8,900 11,100 10,800Barclaycard (d) 4,700 4,200 4,000Business Banking 9,600 9,800 9,500Barclays Africa (e) 7,500 8,000 8,000Barclays Capital 5,500 5,500 4,900 Barclays Global Investors 2,100 2,100 2,100 Other operations (f ) 6,300 5,400 5,900 Head office functions 500 400 400
Total Group permanent and contract staff worldwide 74,700 78,600 76,200Temporary and agency staffworldwide 3,700 4,600 4,800
Total including temporaryand agency staff 78,400 83,200 81,000
Notes(a) Staff numbers are on a full time equivalent basis. United
Kingdom permanent and contract staff are 59,000 (31stDecember 2001: 60,400).
(b) Includes 800 regulated sales force (31st December 2001:1,100) whose costs, following the strategic alliance withLegal & General in 2001, are included in administrativeexpenses – staff costs. During 2002, staff numbers inPersonal Financial Services decreased by 600 as a result ofrestructuring. A further 700 staff relating to a mortgagecall centre were outsourced to an associated undertakingwhile an additional 1,000 staff were transferred to sharedservice units reported within Other operations.
(c) Excludes 200 administrative staff (31st December 2001:500) whose costs are borne within the long-term assurancefunds. Staff numbers at 31st December 2001 included1,600 staff employed by the Barclays Caribbean businessnow part of FirstCaribbean, which is an associatedundertaking and whose staff are not included in the table above. A further reduction of 500 resulted from restructuring.
(d) Staff numbers at 31st December 2002 included 600 arising from the acquisition of the Providian UK credit cardbusiness.
(e) During 2002, staff numbers in Africa decreased by 400 as a result of restructuring.
(f ) Staff numbers at 31st December 2002 included 1,000transferred from Personal Financial Services.
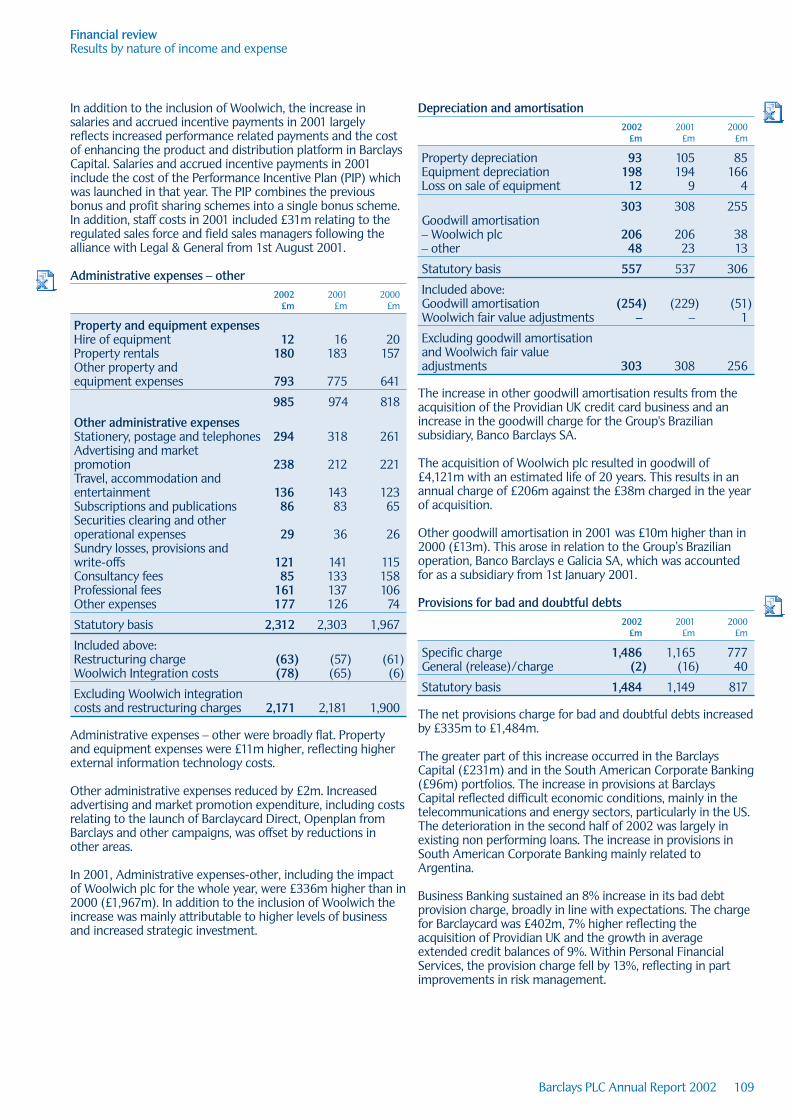
109Barclays PLC Annual Report 2002
Financial reviewResults by nature of income and expense
Depreciation and amortisation2002 2001 2000
£m £m £m
Property depreciation 93 105 85 Equipment depreciation 198 194 166 Loss on sale of equipment 12 9 4
303 308 255Goodwill amortisation– Woolwich plc 206 206 38– other 48 23 13
Statutory basis 557 537 306
Included above:Goodwill amortisation (254) (229) (51)Woolwich fair value adjustments – – 1
Excluding goodwill amortisationand Woolwich fair valueadjustments 303 308 256
The increase in other goodwill amortisation results from theacquisition of the Providian UK credit card business and anincrease in the goodwill charge for the Group's Braziliansubsidiary, Banco Barclays SA.
The acquisition of Woolwich plc resulted in goodwill of£4,121m with an estimated life of 20 years. This results in anannual charge of £206m against the £38m charged in the yearof acquisition.
Other goodwill amortisation in 2001 was £10m higher than in2000 (£13m). This arose in relation to the Group’s Brazilianoperation, Banco Barclays e Galicia SA, which was accountedfor as a subsidiary from 1st January 2001.
Provisions for bad and doubtful debts2002 2001 2000
£m £m £m
Specific charge 1,486 1,165 777General (release)/charge (2) (16) 40
Statutory basis 1,484 1,149 817
The net provisions charge for bad and doubtful debts increasedby £335m to £1,484m.
The greater part of this increase occurred in the BarclaysCapital (£231m) and in the South American Corporate Banking(£96m) portfolios. The increase in provisions at BarclaysCapital reflected difficult economic conditions, mainly in thetelecommunications and energy sectors, particularly in the US.The deterioration in the second half of 2002 was largely inexisting non performing loans. The increase in provisions inSouth American Corporate Banking mainly related toArgentina.
Business Banking sustained an 8% increase in its bad debtprovision charge, broadly in line with expectations. The chargefor Barclaycard was £402m, 7% higher reflecting theacquisition of Providian UK and the growth in averageextended credit balances of 9%. Within Personal FinancialServices, the provision charge fell by 13%, reflecting in partimprovements in risk management.
In addition to the inclusion of Woolwich, the increase insalaries and accrued incentive payments in 2001 largelyreflects increased performance related payments and the costof enhancing the product and distribution platform in BarclaysCapital. Salaries and accrued incentive payments in 2001include the cost of the Performance Incentive Plan (PIP) whichwas launched in that year. The PIP combines the previousbonus and profit sharing schemes into a single bonus scheme.In addition, staff costs in 2001 included £31m relating to theregulated sales force and field sales managers following thealliance with Legal & General from 1st August 2001.
Administrative expenses – other2002 2001 2000
£m £m £m
Property and equipment expensesHire of equipment 12 16 20 Property rentals 180 183 157 Other property andequipment expenses 793 775 641
985 974 818
Other administrative expensesStationery, postage and telephones 294 318 261Advertising and marketpromotion 238 212 221 Travel, accommodation andentertainment 136 143 123 Subscriptions and publications 86 83 65 Securities clearing and otheroperational expenses 29 36 26 Sundry losses, provisions andwrite-offs 121 141 115 Consultancy fees 85 133 158 Professional fees 161 137 106Other expenses 177 126 74
Statutory basis 2,312 2,303 1,967
Included above:Restructuring charge (63) (57) (61)Woolwich Integration costs (78) (65) (6)
Excluding Woolwich integration costs and restructuring charges 2,171 2,181 1,900
Administrative expenses – other were broadly flat. Propertyand equipment expenses were £11m higher, reflecting higherexternal information technology costs.
Other administrative expenses reduced by £2m. Increasedadvertising and market promotion expenditure, including costsrelating to the launch of Barclaycard Direct, Openplan fromBarclays and other campaigns, was offset by reductions inother areas.
In 2001, Administrative expenses-other, including the impactof Woolwich plc for the whole year, were £336m higher than in2000 (£1,967m). In addition to the inclusion of Woolwich theincrease was mainly attributable to higher levels of businessand increased strategic investment.

110 Barclays PLC Annual Report 2002
Financial reviewResults by nature of income and expense
In 2001, the net provisions charge, including the impact ofWoolwich for the whole year, was £332m higher than in 2000(£817m). New and increased provisions were 47% higher at£1,440m while releases and recoveries of £275m were £71mhigher. During 2001 there was a £40m reclassification fromgeneral provision to specific provision in Personal FinancialServices based on the introduction of a statistical methodologyenabling earlier recognition of specific impairment. This isreflected as a new and increased specific provision and arelease of general provision.
Loss from joint ventures and associated undertakings
2002 2001 2000£m £m £m
Loss from joint ventures (5) (1) (1)Loss from associatedundertakings (5) (8) (7)
Statutory basis (10) (9) (8)
In 2002 the loss from joint ventures relates primarily to anentity within Personal Financial Services.
The loss from associated undertakings includes a loss of £9mrelating to FirstCaribbean (see page 156) which was due tointegration and restructuring costs following the creation ofthe new enlarged business. It also includes £1m relating to theamortisation of the goodwill arising on completion of theCaribbean transaction.
The loss from associated undertakings in 2001 is attributable to start up costs of new ventures in Business Banking. The lossfrom associated undertakings in 2000 largely arose from theGroup’s then associated undertaking Banco Barclays e Galicia SA.
(Loss)/profit on disposal/termination of Group undertakings
2002 2001 2000£m £m £m
Profit on disposal of other Groupundertakings 8 (4) 214Loss on termination of Groupactivities (11) – –
Statutory basis (3) (4) 214
The profit on disposal of Group undertakings in 2002 relatesprimarily to a £7m release of provisions in connection with atransaction in previous years which are no longer required. Thegross gain on the sale of the US based Americas privatebanking business was broadly offset by goodwill written off.
The net loss on disposal of Group undertakings in 2001represented losses of £19m offset by gains of £15m. The netloss included goodwill written off of £1m.
In 2000, the profit on disposal of Group undertakings includesa £186m profit on the sale of Dial and £18m profit on the saleof Barclays Property Investment Management in October 2000.
TaxThe overall tax charge is explained in the following table:
2002 2001 2000£m £m £m
Tax charge at average UK corporationtax rate of 30%(2001: 30%, 2000: 30%) 961 1,027 1,017Prior year adjustments (25) 34 9Effect of change in non-allowablegeneral provisions (2) (11) 24 Effect of non-allowable propertywrite-downs and depreciation 12 17 6 Net effect of differing tax ratesoverseas (70) (65) (43)Net effect of overseas losses notavailable for relief in the UK (40) (17) (5)Other non-allowable expenses 8 (21) 16 Gains covered by capital lossesbrought forward (3) (49) (53)Goodwill 69 67 11Other items 45 (39) (81)
Overall tax charge 955 943 901
Effective tax rate % 29.8 27.5 26.6
The charge for the year assumes a UK corporation tax rate of30% for the year 2002 (2001: 30%). The effective rate of tax is29.8% (2001: 27.5%). The increase in the rate from last year isprimarily due to the absence of tax-free disposals, coupledwith a reduction in the payments made to the qualifyingemployee trust reflecting the reduced share price and areduction in the benefit generated by the utilisation ofoverseas losses.
Included in the charge is a credit of £38m (2001: £11m charge)tax on the decrease in shareholders' interest in the long-termassurance funds.
Restructuring charge The total restructuring charge is £187m, with the mainelements relating to Business Banking (£42m), Barclays PrivateClients (£44m), Personal Financial Services (£39m), BarclaysAfrica (£16m) and Barclaycard (£12m).
Accrued provisions at 31st December 2002 for restructuringand closure costs amounted to £117m (31st December 2001:£130m). Expenditure of £85m was incurred during the yearagainst provisions raised as at 31st December 2001 and £122min respect of the 2002 programme.
In 2001 the Group incurred a restructuring charge of £171m(2000: £232m).

111Barclays PLC Annual Report 2002
Financial reviewTotal assets and liabilities
Total assets and liabilities
The Group's balance sheet grew by 13% (£46bn) to £403bn.Weighted risk assets rose by 9% to £173bn.
Within Personal Financial Services, total assets grew by 12% to£72bn. Weighted risk assets increased by 14% to £41bnprimarily as a result of strong growth in UK mortgage balances,up 13% to £58.7bn (31st December 2001: £51.9bn), and goodgrowth in other secured and unsecured lending.
Barclays Private Clients total assets of £14bn were at a similarlevel to 2001, with the increase in assets resulting from thegrowth of Openplan in Spain being offset by the effect of theCaribbean transaction. Weighted risk assets increased by£2.5bn reflecting the growth in Openplan assets and theinclusion of 100% of the weighted risk assets of the Caribbeanassociate, FirstCaribbean International Bank (see Capital Ratioson pages 116 and 117).
Within Barclaycard, total assets increased by £1.3bn in the yearto £10.7bn. Weighted risk assets increased by 12% to £10.6bn.The increase reflected higher extended credit balances and theinclusion of the Providian UK business.
Within Business Banking, total assets grew by 7% to £47bn.Weighted risk assets increased by 9% during the same period.Growth was predominantly in lending to larger businesscustomers.
Barclays Capital total assets increased by 17% (£35bn) to£236bn during 2002 due to increases in reverse repo balancesand government securities. Reverse repo balances, which arefully collateralised, increased £22bn, driven by growth inmoney markets and prime brokerage. There were alsoincreases in government debt securities within the fixedincome business of £9bn. Total weighted risk assets increasedby only 3% to £53bn (2001: £52bn), reflecting the higherquality and therefore lower risk weightings associated withreverse repos and government backed securities.
Total assets and weighted risk assets
£bn
450
400
350
300
250
150
100
50
200
0
AssetsWeighted risk assets
2002
172.7
2001
158.9
2000
147.0
316.2356.6
403.1
Repo transactionsUnder a repo (sale and repurchase agreement), an asset is sold to a counterparty with a commitment to repurchase it at a future date at an agreed price. The Group engages in reposand also in reverse repos, which are the same transaction inthe opposite direction, i.e. the Group buying an asset with afixed commitment to resell. The Group aims to earn spreadand trading income from these activities as well as funding its own holdings of securities.
The following amounts were included in the balance sheet for repos and reverse repos and are reported on a net basiswhere permitted:
2002 2001 2000£m £m £m
Reverse repos (assets)Loans and advances to banks 41,001 32,042 25,595 Loans and advances to customers 42,505 29,731 20,758
83,506 61,773 46,353
Repos (liabilities)Deposits by banks 37,857 25,048 16,275 Customer accounts 24,580 16,204 17,053
62,437 41,252 33,328
The average and maximum amount of reverse repos for 2002 were £76,215m and £103,895m (2001: £95,849m and£119,942m, 2000: £48,952m and £60,356m) respectively. The average and maximum amount of repos for 2002 were£61,416 and £92,219m (2001: £88,311 and £116,458m, 2000:£40,462m and £52,163).

112 Barclays PLC Annual Report 2002
Financial reviewAverage balance sheet
Average balance sheet and net interest income (year ended 31st December)
2002 2001 2000
Average Average Average Average Average Averagebalance Interest rate balance Interest rate balance Interest rate
£m £m % £m £m % £m £m %
AssetsTreasury bills and other eligible bills:in offices in the UK 4,496 158 3.5 3,952 189 4.8 4,491 146 3.3 in offices outside the UK 960 66 6.9 1,114 89 8.0 844 88 10.4 Loans and advances to banks:in offices in the UK 12,560 561 4.5 7,615 346 4.5 6,579 355 5.4 in offices outside the UK 5,535 161 2.9 5,827 265 4.5 6,361 397 6.2 Loans and advances to customers:in offices in the UK 126,306 7,712 6.1 116,279 8,406 7.2 83,651 6,810 8.1 in offices outside the UK 25,896 1,132 4.4 23,573 1,498 6.4 20,693 1,298 6.3 Lease receivables:in offices in the UK 4,245 209 4.9 4,384 245 5.6 4,683 316 6.7 in offices outside the UK 222 15 6.8 226 18 8.0 366 39 10.6 Debt securities:in offices in the UK 40,115 1,790 4.5 36,858 2,069 5.6 26,973 1,630 6.0 in offices outside the UK 4,843 240 5.0 5,189 333 6.4 11,559 709 6.1
Average assets of banking business 225,178 12,044 5.3 205,017 13,458 6.6 166,200 11,788 7.1 Average assets of trading business 160,647 4,372 2.7 132,904 5,437 4.1 98,156 4,808 4.9
Total average interest earning assets 385,825 16,416 4.2 337,921 18,895 5.6 264,356 16,596 6.3Provisions (2,808) (2,513) (2,115)Non-interest earning assets 46,753 48,796 43,148
Total average assets andinterest income 429,770 16,416 3.8 384,204 18,895 4.9 305,389 16,596 5.4
Percentage of total average assetsin offices outside the UK 27.2% 27.5% 31.4%
Average interest earning assetsand net interest income:Banking business 225,178 6,188 2.7 205,017 5,970 2.9 166,200 5,114 3.1 Trading business 160,647 75 0.0 132,904 (387) (0.3) 98,156 (216) (0.2) Non margin interest 17 – (4) – (6) –
Total average interest earning assets and net interest income 385,825 6,280 1.6 337,921 5,579 1.7 264,356 4,892 1.9
Total average interest earning assetsrelated to:Interest income 16,416 4.2 18,895 5.6 16,596 6.3 Interest expense (10,153) (2.6) (13,312) (3.9) (11,698) (4.4)Adjustment for non margin interest 17 – (4) – (6) –
6,280 1.6 5,579 1.7 4,892 1.9

113Barclays PLC Annual Report 2002
Financial reviewAverage balance sheet
Average balance sheet and net interest income (year ended 31st December)
2002 2001 2000
Average Average Average Average Average Averagebalance Interest rate balance Interest rate balance Interest rate
£m £m % £m £m % £m £m %
Liabilities and shareholders’ fundsDeposits by banks:in offices in the UK 31,880 987 3.1 27,547 1,144 4.2 21,465 932 4.3 in offices outside the UK 8,908 200 2.2 10,548 366 3.5 13,736 545 4.0 Customer accounts – demand deposits:in offices in the UK 16,260 164 1.0 14,646 209 1.4 13,302 220 1.7 in offices outside the UK 1,846 27 1.5 1,734 37 2.1 1,707 50 2.9 Customer accounts – savings deposits:in offices in the UK 41,722 982 2.4 37,341 1,153 3.1 27,349 1,005 3.7 in offices outside the UK 1,262 32 2.5 1,297 50 3.9 1,312 62 4.7 Customer accounts – other time deposits – retail:in offices in the UK 40,075 1,303 3.3 38,521 1,906 4.9 28,639 1,634 5.7in offices outside the UK 5,479 139 2.5 5,611 251 4.5 5,785 316 5.5 Customer accounts –other time deposits – wholesale:in offices in the UK 35,607 1,175 3.3 31,474 1,316 4.2 22,596 1,165 5.2in offices outside the UK 7,959 231 2.9 7,240 340 4.7 10,005 553 5.5Debt securities in issue:in offices in the UK 28,596 1,061 3.7 30,378 1,546 5.1 19,904 1,057 5.3 in offices outside the UK 11,728 339 2.9 11,083 522 4.7 7,279 457 6.3 Dated and undated loan capitaland other subordinated liabilitiesprincipally in offices in the UK 11,012 645 5.9 9,165 601 6.6 5,225 382 7.3Internal funding of trading business (42,626) (1,429) (3.4) (42,480) (1,953) (4.6) (30,355) (1,704) (5.6)
Average liabilities of banking business 199,708 5,856 2.9 184,105 7,488 4.1 147,949 6,674 4.5 Average liabilities of trading business 162,858 4,297 2.6 134,609 5,824 4.3 98,297 5,024 5.1
Total average interestbearing liabilities 362,566 10,153 2.8 318,714 13,312 4.2 246,246 11,698 4.8Interest free customer deposits:in offices in the UK 11,614 10,282 9,468 in offices outside the UK 2,132 2,151 1,858 Other non-interest bearing liabilities 38,172 38,828 37,673Minority and other interests and shareholders’ funds 15,286 14,229 10,144
Total average liabilities, shareholders’funds and interest expense 429,770 10,153 2.4 384,204 13,312 3.5 305,389 11,698 3.8
Percentage of total average non-capital liabilities in offices outside the UK 25.5% 26.4% 30.4%
Notes(a) Loans and advances to customers and banks include all doubtful lendings, including non-accrual lendings. Interest receivableon such lendings has been included to the extent to which either cash payments have been received or interest has beenaccrued in accordance with the income recognition policy of the Group.
(b) Average balances are based upon daily averages for most UK banking operations and monthly averages elsewhere.
(c) The average balance sheet does not include the retail life-fund assets attributable to policyholders nor the related liabilities.

114 Barclays PLC Annual Report 2002
Financial reviewAverage balance sheet
Changes in net interest income – volume and rate analysisThe following table allocates changes in net interest income between changes in volume and changes in interest rates for thelast two years. Volume and rate variances have been calculated on the movement in the average balances and the change in the interest rates on average interest earning assets and average interest bearing liabilities. Where variances have arisen fromchanges in both volumes and interest rates, these have been allocated proportionately between the two.
2002/2001 Change due 2001/2000 Change due to increase/(decrease) in: to increase/(decrease) in:
Total Totalchange Volume Rate change Volume Rate
£m £m £m £m £m £m
Interest receivableTreasury bills and other eligible bills:in offices in the UK (31) 24 (55) 43 (19) 62in offices outside the UK (23) (11) (12) 1 24 (23)
(54) 13 (67) 44 5 39
Loans and advances to banks:in offices in the UK 215 221 (6) (9) 52 (61)in offices outside the UK (104) (13) (91) (132) (31) (101)
111 208 (97) (141) 21 (162)
Loans and advances to customers:in offices in the UK (694) 685 (1,379) 1,596 2,425 (829)in offices outside the UK (366) 137 (503) 200 183 17
(1,060) 822 (1,882) 1,796 2,608 (812)
Lease receivables:in offices in the UK (36) (8) (28) (71) (19) (52)in offices outside the UK (3) – (3) (21) (13) (8)
(39) (8) (31) (92) (32) (60)
Debt securities:in offices in the UK (279) 172 (451) 439 562 (123)in offices outside the UK (93) (21) (72) (376) (407) 31
(372) 151 (523) 63 155 (92)
Total banking business interest receivable:in offices in the UK (825) 1,094 (1,919) 1,998 3,001 (1,003)in offices outside the UK (589) 92 (681) (328) (244) (84)
(1,414) 1,186 (2,600) 1,670 2,757 (1,087)
Total trading business interest receivable (1,065) 989 (2,054) 629 1,512 (883)
Total interest receivable (2,479) 2,175 (4,654) 2,299 4,269 (1,970)

115Barclays PLC Annual Report 2002
Financial reviewAverage balance sheet
Changes in net interest income – volume and rate analysis
2002/2001 Change due 2001/2000 Change due to increase/(decrease) in: to increase/(decrease) in:
Total Totalchange Volume Rate change Volume Rate
£m £m £m £m £m £m
Interest payableDeposits by banks:in offices in the UK (157) 162 (319) 212 254 (42)in offices outside the UK (166) (51) (115) (179) (116) (63)
(323) 111 (434) 33 138 (105)
Customer accounts – demand deposits:in offices in the UK (45) 21 (66) (11) 21 (32)in offices outside the UK (10) 2 (12) (13) 1 (14)
(55) 23 (78) (24) 22 (46)
Customer accounts – savings deposits:in offices in the UK (171) 125 (296) 148 326 (178)in offices outside the UK (18) (1) (17) (12) (1) (11)
(189) 124 (313) 136 325 (189)
Customer accounts – other time deposits – retail:in offices in the UK (603) 74 (677) 272 510 (238)in offices outside the UK (112) (6) (106) (65) (9) (56)
(715) 68 (783) 207 501 (294)
Customer accounts – other time deposits – wholesale:in offices in the UK (141) 159 (300) 151 400 (249)in offices outside the UK (109) 31 (140) (213) (138) (75)
(250) 190 (440) (62) 262 (324)
Debt securities in issue:in offices in the UK (485) (86) (399) 489 535 (46)in offices outside the UK (183) 29 (212) 65 198 (133)
(668) (57) (611) 554 733 (179)
Dated and undated loan capital and other subordinated liabilities principally in offices in the UK 44 113 (69) 219 261 (42)
Internal funding of trading businesses 524 (7) 531 (249) (596) 347
Total banking business interest payable:in offices in the UK (1,034) 561 (1,595) 1,231 1,711 (480)in offices outside the UK (598) 4 (602) (417) (65) (352)
(1,632) 565 (2,197) 814 1,646 (832)
Total trading business interest payable (1,527) 1,055 (2,582) 800 1,655 (855)
Total interest payable (3,159) 1,620 (4,779) 1,614 3,301 (1,687)
Movement in net interest income(Decrease)/increase in interest receivable (2,479) 2,175 (4,654) 2,299 4,269 (1,970)Decrease/(increase) in interest payable 3,159 (1,620) 4,779 (1,614) (3,301) 1,687
680 555 125 685 968 (283)Movement in non margin interest 21 2
701 687

116 Barclays PLC Annual Report 2002
Financial reviewCapital resources
Capital ratiosCapital adequacy and the use of regulatory capital aremonitored by the Group, employing techniques based on theguidelines developed by the Basel Committee on BankingSupervision (the Basel Committee) and European CommunityDirectives, as implemented by the Financial Services Authority(FSA) for supervisory purposes.
These techniques include the risk asset ratio calculation, whichthe FSA regards as a key supervisory tool. The FSA sets ratiorequirements for individual banks in the UK at or above theinternationally agreed minimum of 8%. The ratio calculationinvolves the application of designated risk weightings to reflectan estimate of credit, market and other risks associated withbroad categories of transactions and counterparties.Regulatory guidelines define three 'tiers' of capital resources.Tier 1 capital, comprising mainly shareholders' funds andincluding Reserve Capital Instruments and Tier One Notes, isthe highest tier and can be used to meet trading and bankingactivity requirements. Tier 2 includes perpetual, medium-termand long-term subordinated debt, general provisions for badand doubtful debts and fixed asset revaluation reserves. Tier 2capital can be used to support both trading and bankingactivities. Tier 3 capital comprises short-term subordinateddebt with a minimum original maturity of two years. The useof tier 3 capital is restricted to trading activities only and it isnot eligible to support counterparty or settlement risk. Theaggregate of tiers 2 and 3 capital included in the risk assetratio calculation may not exceed tier 1 capital.
Capital adequacy data
2002 2001£m £m
Weighted risk assetsBanking book on-balance sheet 128,691 120,113off-balance sheet 21,999 20,368Associated undertakingsand joint ventures 3,065 499
Total banking book 153,755 140,980
Trading book market risks 7,988 7,801counterparty andsettlement risks 11,005 10,092
Total trading book 18,993 17,893
Total weighted risk assets 172,748 158,873
Capital resourcesThe Group continues to manage activelyboth its debt and equity capital. Totalcapital resources increased in the year by £2,292m.
2002 2001 2000£m £m £m
Barclays PLC GroupShareholders’ funds 15,205 14,485 13,183Minority & other interests 156 134 250
15,361 14,619 13,433Undated loan capital 6,678 5,054 4,022Dated loan capital 4,859 4,933 3,698
Total capital resources 26,898 24,606 21,153
2002 2001 2000£m £m £m
Barclays Bank PLC GroupShareholders’ funds 15,205 14,485 13,325Minority interests 156 134 108
15,361 14,619 13,433Undated loan capital 6,678 5,054 4,022Dated loan capital 4,859 4,933 3,698
Total capital resources 26,898 24,606 21,153
The Group manages both its debt and equity capital actively.The Group's authority to buy back equity was renewed at the2002 AGM to provide additional flexibility in the managementof the Group's capital resources.
Total capital resources increased in the period by £2,292m.
Equity shareholders' funds increased by £720m primarilyreflecting profit retentions of £1,024m, net proceeds of shareissues of £87m and the gain on the disposal of the Group'sCaribbean business of £206m (see page 186) offset by sharerepurchases of £546m and exchange rate movements of £61m.
Loan capital rose by £1,550m, reflecting raisings of £2,173m.This was offset by redemptions of £376m, amortisation of issueexpenses of £1m and exchange rate movements of £246m.

117Barclays PLC Annual Report 2002
Financial reviewCapital resources
The following table analyses capital resources at 31stDecember 2002, as defined for regulatory purposes:
2002 2001
Barclays Barclays Barclays BarclaysPLC Bank PLC PLC Bank PLC
Group Group Group GroupCapital resources £m £m £m £m
Tier 1Called up share capital 1,641 2,293 1,668 2,286Eligible reserves 13,409 12,757 12,775 12,157Minority interests –equity 522 522 203 203Reserve CapitalInstuments (a) 1,771 1,771 1,867 1,867Tier One Notes (a) 1,019 1,019 – –Less: goodwill (4,158) (4,158) (4,108) (4,108)
Total qualifyingtier 1 capital 14,204 14,204 12,405 12,405
2002 2001£m £m
Tier 2Revaluation reserves 25 31General provisions 737 745Qualifying subordinatedliabilities (b)Undated loan capital 3,854 3,147Dated loan capital 4,573 4,466Other (c) 2 8
Total qualifyingtier 2 capital 9,191 8,397
Tier 3: short-term subordinated liabilities (b) 203 392
Less: Supervisory deductionsInvestments not consolidated forsupervisory purposes (d) (1,288) (1,233)Other deductions (119) (62)
Total deductions (1,407) (1,295)
Total net capital resources 22,191 19,899
2002 2001
Barclays Barclays Barclays BarclaysPLC Bank PLC PLC Bank PLC
Group Group Group Group% % % %
Capital ratiosTier 1 ratio 8.2 8.2 7.8 7.8Risk asset ratio 12.8 12.8 12.5 12.5
Notes(a) Reserve Capital Instruments and Tier One Notes are included
in undated loan capital in the consolidated balance sheet.
(b) Subordinated liabilities are included in tiers 2 or 3, subjectto limits laid down in the supervisory requirements.Barclays retains significant capacity to raise additionalcapital within these limits.
(c) Comprises reserve capital instruments £nil (2001: £5m) and revaluation reserves attributable to minorities £2m(2001: £3m).
(d) Includes £867m (2001: £884m) of shareholders' interest in the life-fund.
Capital ratios have increased as a result of a £2.3bn (11%)growth in net capital resources which more than offset theimpact of a £13.9bn (9%) growth in weighted risk assets. Thenet impact on the risk asset ratio was an increase of 0.3% to12.8% and on the tier 1 ratio an increase of 0.4% to 8.2%.
Within tier 1 capital, equity shareholders’ funds increased by£0.6bn (see 'Capital resources' above) and the issues of TierOne Notes (TONs) added a further £1bn. In addition, equityminority interests increased by £0.3bn, mainly reflecting theinclusion of capital attributable to other shareholdings inFirstCaribbean which is fully consolidated for supervisorypurposes. These gains are partly offset by exchange losses on reserve capital instruments and additional goodwill inFirstCaribbean.
Loan capital increased by £0.6bn (see ‘Capital resources’above). Within this, capital eligible for inclusion in tier 2increased by £0.8bn, and £0.2bn of tier 3 capital was repaid.
The increase in supervisory deductions relates mainly to equityin other banks that is held by FirstCaribbean.
Capital ratios
%
5
15
10
0
Risk asset ratioTier 1 ratio
2002
8.2
12.8
2000
11.0
7.2
2001
7.8
12.5

118 Barclays PLC Annual Report 2002
Financial reviewDeposits and Short-term borrowings
DepositsAverage: year ended 31st December
2002 2001 2000£m £m £m
Deposits by banksOffices in the UK 31,880 27,547 21,465Offices outside the UK:Other European Union 1,889 3,313 3,996 United States 2,201 2,667 4,618 Rest of the World 4,818 4,568 5,122
40,788 38,095 35,201
Customer accountsOffices in the UK 145,278 132,264 101,354Offices outside the UK:Other European Union 5,423 5,231 5,050 United States 3,976 3,550 5,201Rest of the World 9,279 9,252 10,416
163,956 150,297 122,021
Average deposits (excluding trading balances) are analysed bytype in the average balance sheet on page 113 and are basedon the location of the office in which the deposits arerecorded.
‘Demand deposits’ in offices in the UK are mainly currentaccounts with credit balances, obtained through the UK branch network.
‘Savings deposits’ in offices in the UK are also obtainedthrough, and administered by, the UK branch network. Interestrates are varied from time to time in response to competitiveconditions. These deposits are not drawn against by cheque orsimilar instrument.
‘Other time deposits – retail’ in offices in the UK are interestbearing and also are not drawn against by cheque or similarinstrument. They are generally distinguished from savingsdeposits by having fixed maturity requirements and fromwholesale deposits by being collected, in the main, through theUK branch network.
‘Other time deposits – wholesale’ in offices in the UK areobtained through the London money market and are bookedmainly within the Group’s money market operations. Thesedeposits are of fixed maturity and bear interest rates whichrelate to the London inter-bank money market rates.
‘Other time deposits’ includes commercial paper andinter-bank funds.
Although the types of deposit products offered through officeslocated outside the UK are broadly similar to those describedabove, they are tailored to meet the specific requirements oflocal markets.
A further analysis of Deposits by banks and customers is givenin note 27 and note 28 to the accounts on pages 159 and 160.
Short-term borrowingsShort-term borrowings include Deposits by banks as reportedin ‘Deposits’, Commercial paper and negotiable certificatesof Deposit.
Deposits by banks (excluding trading business)Deposits by banks are taken from a wide range ofcounterparties and generally have maturities of lessthan one year.
2002 2001 2000£m £m £m
Year-end balance 48,751 45,837 32,445Average balance 40,788 38,095 35,201Maximum balance 56,414 53,621 45,923Average interest rate during year 2.9% 4.0% 4.2%Year-end interest rate 2.6% 3.3% 4.5%
Commercial paperCommercial paper is issued by the Group, mainly in theUnited States, generally in denominations of not less than$100,000, with maturities of up to 270 days.
2002 2001 2000£m £m £m
Year-end balance 5,192 3,268 2,209Average balance 4,818 2,669 2,001Maximum balance 5,234 4,419 3,668 Average interest rate during year 2.0% 3.0% 6.6%Year-end interest rate 1.6% 2.0% 6.4%
Negotiable certificates of depositNegotiable certificates of deposits are issued mainly in the UKand US, generally in denominations of not less than $100,000.
2002 2001 2000£m £m £m
Year-end balance 30,045 28,258 22,413Average balance 27,111 30,209 20,918Maximum balance 36,780 37,686 29,125Average interest rate during year 3.3% 4.7% 5.2% Year-end interest rate 2.8% 3.0% 6.3%

119Barclays PLC Annual Report 2002
Financial reviewSecurities
SecuritiesThe following table analyses the book value and valuation of securities.
2002 2001 2000
Book value Valuation Book value Valuation Book value Valuation£m £m £m £m £m £m
Investment securitiesDebt securities:UK government 1,465 1,496 1,500 1,499 1,496 1,571Other government 18,963 19,564 15,152 15,330 12,117 12,378 Other public bodies 3,699 3,710 1,144 1,150 1,194 1,193 Other issuers 16,141 16,207 13,248 13,265 14,913 14,929 Equity shares 505 509 194 215 244 295
40,773 41,486 31,238 31,459 29,964 30,366 Other securitiesDebt securities:UK government 1,025 1,025 1,284 1,284 845 845 Other government 25,385 25,385 15,659 15,659 15,555 15,555 Other public bodies 2,438 2,438 1,091 1,091 1,280 1,280 Bank and building society certificates of deposit 12,027 12,027 15,376 15,376 13,837 13,837 Other issuers 13,086 13,086 14,470 14,470 9,533 9,533 Equity shares 2,628 2,628 2,924 2,924 3,818 3,818
97,362 98,075 82,042 82,263 74,832 75,234
Investment debt securities include government securities held as part of the Group’s treasury management portfolio for assetand liability, liquidity and regulatory purposes and are for use on a continuing basis in the activities of the Group. In addition, theGroup holds as investments listed and unlisted corporate securities. Investment securities are valued at cost, adjusted for theamortisation of premiums or discounts to redemption, less any provision for diminution in value.
Other securities comprise dealing securities which are valued at market value.
Bank and building society certificates of deposit are freely negotiable and have original maturities of up to five years, but aretypically held for shorter periods.
A further analysis of the book value and valuation of securities is given in notes 18 and 19 to the accounts.
In addition to UK government securities shown above, at 31st December 2002 and 2001 the Group held the followinggovernment securities which exceeded 10% of shareholders’ funds:
2002 2001
Book value Valuation Book value Valuation£m £m £m £m
US government securities 12,728 12,811 4,849 4,846Italian government securities 7,944 8,090 6,068 6,122Japanese government securities 7,060 7,080 6,012 6,014 German government securities 3,026 3,048 5,880 5,889Spanish government securities 2,890 2,988 630 645
Maturities and weighted average yield of investment debt securities
Maturing Maturing after Maturing after within one but within five but within Maturing after
one year: five years: ten years: ten years: TotalAmount Yield Amount Yield Amount Yield Amount Yield Amount Yield
£m % £m % £m % £m % £m %
Government 4,753 4.3 7,541 5.0 6,676 3.2 1,458 5.0 20,428 4.3Other public bodies 24 4.2 3,625 1.5 50 2.0 – – 3,699 1.6Other issuers 4,581 3.6 10,433 3.7 1,003 3.7 124 7.3 16,141 3.8
Total book value 9,358 4.0 21,599 3.8 7,729 3.3 1,582 5.2 40,268 4.2
Total valuation 9,434 21,893 8,026 1,624 40,977
The weighted average yield for each range of maturities is calculated by dividing the annualised interest income prevailing at31st December 2002 by the book value of securities held at that date. Yields on certain US securities, which are exempt from tax,have been calculated using interest income adjusted to reflect a taxable equivalent basic.

120 Barclays PLC Annual Report 2002
Financial reviewCritical accounting estimates
Critical accounting estimatesUK accounting standards require that the Group adopt theaccounting policies and estimation techniques that theDirectors believe are most appropriate in the circumstances forthe purpose of giving a true and fair view of the Group's stateof affairs, profit and cashflows. However, different policies,estimation techniques and assumptions in critical areas couldlead to materially different results.
The following are estimates which are considered to be themost complex and involve significant amounts of managementvaluation judgements, often in areas which are inherentlyuncertain.
Bad and doubtful debtsThe estimation of potential credit losses is inherently uncertainand depends upon many factors, including general economicconditions, migration, structural changes within industries thatalter competitive positions, and other external factors such aslegal and regulatory requirements. For example, the continueddifficult economic conditions in the telecommunications andenergy sector in the US has resulted in an increase to therequired credit risk provision level.
Specific provisions are raised when the Group considers thatthe creditworthiness of a borrower has deteriorated such thatthe recovery of the whole or part of an outstanding advance isin serious doubt. For larger accounts this is usually done on anindividual basis and all relevant considerations that have abearing on the expected future cash flows are taken intoaccount, for example the business prospects for the customer,the realisable value of collateral, the Group’s position relative toother claimants, the reliability of customer information and thelikely cost and duration of the work-out process. Subjectivejudgements are made in this process that may vary fromperson to person and team to team. Furthermore judgementschange with time as new information becomes available or asworkout strategies evolve, resulting in frequent revisions to thespecific provisions as individual decisions are taken on a case-by-case basis.
Within the retail businesses, where the portfolio compriseslarge numbers of homogeneous assets, statistical techniquesare used to raise specific provisions on a portfolio basis, basedon historical recovery rates.
General provisions are raised to cover losses which are knownfrom previous historical experience to be present in loans andadvances at the balance sheet date, but which have not yet beenspecifically identified. These provisions are adjusted at least halfyearly by an appropriate charge or release of general provisionbased on a statistical analysis. The accuracy of this analysis isperiodically assessed against actual losses. Gradings are used torate the credit quality of borrowers. Each grade corresponds toan Expected Default Frequency and is calculated by usingmanual score-sheets or computer driven models validated by ananalysis of the Group’s own historic data. The grade can bederived from different sources depending upon the borrower(e.g. internal model, credit rating agency). The general provisionalso takes into account the economic climate in the market inwhich the Group operates, the expected severity at default(which depends, for example, on the level of security held inrelation to each category or counterparty), and the expectedexposure at default (the last two of which are statistically derivedvalues). The general provision includes a specifically identifiedelement to cover country transfer risk calculated on a basisconsistent with the overall general provision calculation.
General provisions are created with respect to therecoverability of assets arising from off-balance sheetexposures in a manner consistent with the general provisioningmethodology.
Further information on credit risk provisioning is set out onpage 68.
Fair value of financial instrumentsSome of the Bank’s financial instruments are carried at fairvalue, including derivatives and debt securities held for trading purposes.
Financial instruments entered into as trading transactions,together with any associated hedging thereof, are measured atfair value and the resultant profits and losses are included indealing profits, along with interest and dividends arising fromlong and short positions and funding costs relating to tradingactivities. Assets and liabilities resulting from gains or losses onderivative and foreign exchange contracts are reported gross inother assets or liabilities, reduced by the effects of qualifyingnetting agreements with counterparties.
Financial instruments are either priced with reference to aquoted market price for that instrument or by using avaluation model. Where the fair value is calculated usingfinancial-markets pricing models, the methodology is tocalculate the expected cash flows under the terms of eachspecific contract and then discount these values back to apresent value. These models use as their basis independentlysourced market parameters including, for example, interestrate yield curves, equities and commodities prices, optionvolatilities and currency rates. Most market parameters areeither directly observable or are implied from instrumentprices. However, where no observable price is available theninstrument fair value will include a provision for theuncertainty in the market parameter based on sale price orsubsequent traded levels. The calculation of fair value for anyfinancial instrument may require adjustment of quoted priceor model value to reflect the cost of credit risk (where notembedded in underlying models or prices used), hedging costsnot captured in pricing models and adjustments to reflect thecost of exiting illiquid or other significant positions. This wouldalso include an estimation of the likely occurence of futureevents which could affect the cashflows of the financialinstrument. The valuation model used for a particularinstrument, the quality and liquidity of market data used forpricing, other fair value adjustments not specifically capturedby the model and market data are all subject to internal reviewand approval procedures and consistent application betweenaccounting periods. Under US GAAP the unrealised gain or lossat the inception of a derivative contract should not berecognised in the profit and loss account unless obtained usingobservable market data.
Certain financial instruments which are held on an accrualsbasis under UK GAAP are required to be measured at fair valueunder US GAAP. The Group does not manage its business withregard to reported trends on a US GAAP basis. Fair valueadjustments to net income or other comprehensive incomeunder US GAAP in current or past periods are not necessarilyindicative of the magnitude or direction of such adjustments insubsequent periods.
The fair value of financial instruments is provided in note 47 onpages 183 and 184.
121Barclays PLC Annual Report 2002
Financial reviewCritical accounting estimates andSpecial purpose entities
GoodwillDetermining the period over which to amortise goodwill,where amortisation is applicable under GAAP, requires theassessment of its useful economic life. This assessment involvesmaking judgements over the nature of the acquired business,the economic environment in which it operates and the periodof time over which the value of the business is expected toexceed the values of net assets. As a starting point, businessesacquired which operate in more volatile economicenvironments, such as emerging markets, are considered tohave a useful economic life of five years, in other cases 20years is generally used.
Management also have to consider at least annually whetherthe current carrying value of goodwill is impaired. This isparticularly important under US GAAP where goodwill is notbeing amortised. For the purposes of such impairment reviews,the goodwill is allocated to business segments that representindependent operating units. The first element of thisallocation is based on the areas of the business expected tobenefit from the synergies derived from the acquisition. Thesecond element reflects the allocation of the net assetsacquired and the difference between the consideration paid forthose net assets and their fair value. This allocation is reviewedfollowing business reorganisation. The carrying value of theoperating unit, including the allocated goodwill, is comparedto its fair value to determine whether any impairment exists.Detailed calculations may need to be carried out taking intoconsideration changes in the market in which a businessoperates (e.g. competition activity, regulatory change) intoconsideration. In the absence of readily available market pricedata this calculation is usually based upon discountingexpected cashflows at a relevant discount factor, thedetermination of both of which require the exercise of judgement.
PensionsThe Group operates defined benefit pension schemes, detailsof which are given in note 5 on page 144 and note 62 on page194. The pension cost for these schemes is assessed inaccordance with the advice of a qualified actuary, using theprojected unit method. Variations from the regular cost areallocated over the expected average service lives of currentemployees. Provisions for pensions arise when the profit andloss account charge exceeds the contribution to the scheme asa result of actuarial valuations. These provisions will beeliminated over the estimated service lives of the employees.
In determining this cost the actuarial value of the assets andliabilities of the scheme are calculated. This involves modellingtheir future growth and requires the management to makeassumptions as to, inter alia, price inflation, dividend growth,pension increases, earnings growth and return on newinvestment and employee lives. There is an acceptable range in which these estimates can validly fall. If different estimateswithin that range had been chosen, the cost recognised in the accounts could be significantly altered. The estimates used in the calculation of the 2002 pension credit aredescribed on page 144.
Shareholders’ interest in the retail long-term assurance fundChanges in the net present value of the profits inherent in thein-force policies of the retail long-term assurance fund areincluded in the profit and loss account. In estimating the netpresent value of the profits inherent in the in-force policies, thecalculations use assumed economic parameters (futureinvestment returns, expense inflation and risk discount rate),taxation, mortality, persistency, expenses and the requiredlevels of regulatory and solvency capital. The returns on fixedinterest investments are set to market yields at the period end.The returns on UK and overseas equities and property are setrelative to fixed interest returns. The expense inflationassumption reflects long-term expectations of both earningsand retail price inflation.
The risk discount rate is set to market yields on Governmentsecurities plus a margin to allow for the risks borne. Themortality, persistency and expense assumptions are chosen torepresent best estimates of future experience and are based oncurrent business experience. As with the pension calculation,there is an acceptable range in which these estimates canvalidly fall, and the income recognised in the accounts could besignificantly altered if different estimates had been chosen.
All of the Group’s significant accounting policies, includingthose mentioned above, and information about the estimationtechniques used to enable the accounting policies to beapplied, are set out on pages 128 to 134.
Special purpose entitiesSpecial purpose entities (SPEs) are entities that are typically setup for a specific purpose and generally would not enter into anoperating activity nor have any employees. The most commonform of SPE involves the acquisition of financial assets that arefunded by the issuance of securities to external investors,which have cash flows different from those of the underlyinginstruments. The repayment of these securities is determinedby the performance of the assets acquired by the SPE. Theseentities form an integral part of many financial markets, andare important to the development of the Europeansecuritisation market and functioning of the US commercialpaper market.
An important feature of financial accounts prepared under UKGAAP is that they are required to present a true and fair view,which includes reflecting the substance of the transactions andarrangements and not just the legal form.
Accordingly, the substance of any transaction with an SPEforms the basis for the treatment in the Group’s financialstatements. When a Group company has transferred assets intoan SPE, these assets should only be derecognised when thecriteria within Financial Reporting Standard (FRS) 5 (Reportingthe substance of transactions) are fully met.
An SPE is consolidated by the Group either if it meets thecriteria of FRS 2 (Accounting for subsidiaries), or if the risk andrewards associated with the SPE reside with the Group, suchthat the substance of the relationship is that of a subsidiary.Financial data relating to entities consolidated on this latterbasis is given in note 60 on page 190.

122 Barclays PLC Annual Report 2002
Financial reviewSpecial purpose entities
Under US GAAP, entities are consolidated if they are undercontrol of the reporting entity as described in ARB 51. Inaddition, unless an SPE meets the qualifying criteria under FAS140, the sponsor of the SPE shall consider it for consolidation.Consolidation can be avoided if the requirements of EITF TopicD-14 are met.
The Group, in the ordinary course of business, and primarily tofacilitate client transactions, has helped establish SPEs invarious areas which are described below, along with their UKand US GAAP treatment:
Commercial paper conduitsThe Group provides its clients with access to liquidity throughthe use of asset backed commercial paper programmes. Theseprogrammes involve the sale of financial assets by clients toentities which are, in effect, commercial paper conduits thatthen issue commercial paper to fund the purchases. Thefinancial assets acquired by the conduits, which totalled£16,090m (2001: £17,624m) at 31st December 2002, normallytake the form of consumer or trade receivables. Of the aboveamount, assets held by the conduits which have beenoriginated by the Group amounted to £319m (2001: £608m)and have been reported on the Group’s balance sheet. Theremainder represents client assets in which the Group has nointerest and which are not reported on the Group’s balancesheet at 31st December 2002. Certain administrative activitiesand the provision of liquidity and credit facilities to theprogrammes are performed by the Group under arm’s lengthcontracts that it, or the conduit’s independent board ofdirectors, can terminate. Net fees received by the Group forperforming these services amounted to £40m (2001: £34m).Under US GAAP, certain of these entities are consolidated bythe Group. This has minimal impact on net income, althoughassets increase by £2,767m (2001: £2,792m). Thecommitments to provide liquidity to these vehicles are amaximum of £12,271m, which would be required to beprovided in the event of the conduits’ access to fundingmarkets being restricted.
Credit structuring businessThe Group structures investments with specific risk profileswhich are attractive to investors. This business involves the saleby the Group of credit exposures based on an underlyingportfolio of assets into SPEs, often using credit derivativecontracts. The assets are funded by issuing securities withvarying terms. In accordance with FRS 5, the Group does notrecognise the assets and liabilities of these entities in itsbalance sheet once the securities that represent subtstantiallyall the risks and rewards associated with the SPE have beensold to third parties. Otherwise these are recognised in full. Asat 31st December 2002, the Group had recognised assets of£3,663m (2001: £2,973m) in respect of these transactions.Assets within these structures not recognised amounted to£638m (2001: £1,212m) at that date. The Group’s net incomefor 2002 included £3m loss (2001: £2m) generated by therelationship with these entities. Under US GAAP, all of theassets are recognised, but due to different measurement basestotal assets are lower by £29m (2001: £45m). There is noimpact on net income of consolidating these entities. Thesummarised combined results of these entities are given innote 60 on page 190.
Financing transactionsThe Group has relationships with numerous SPEs to providefinancing to clients or to enable the placing of clients’ surplusfunds with the Group. These surplus funds are in all casesincluded as liabilities in the balance sheet. These relationshipsinclude arrangements to fund the purchase or construction ofspecific assets (most common in the property industry). Theuse of an SPE to isolate cash flows and assets is common in thebanking industry to enable the client to minimise its fundingcost or maximise its investment returns and for the bank tohave access to specific collateral. Any financing relationshipsare entered into under normal lending criteria, and subject tothe Group’s credit sanctioning process. The exposures arisingfrom the lendings are included in either loans and advances tocustomers and banks or debt securities and equity shares.Exposures in the form of guarantees or undrawn credit linesare included within commitments.
The Group has used SPEs to securitise some of its retail lendingportfolio. Securitisation primarily involves the sale ofreceivables originated by the lending business. The SPEsconcerned have been consolidated for UK and US GAAP anddetails are included in notes 16 and 60 on pages 151 and 190.
Fund management As one of the world’s largest institutional asset managers, theGroup provides asset management services to a large numberof investment entities on an arm’s length basis and at marketterms and prices. The majority of these entities are investmentfunds that are owned by a large and diversified number ofinvestors.
In addition there are various partnerships, funds and openended investment companies that are used by a limitednumber of independent third parties to facilitate their tailoredprivate equity, debt securities or hedge fund investmentstrategies. These entities have assets under management of£653m (2001: £1,078m). The Group has acquired interests inthese entities, which are included within debt securities orequity shares, but the entities are not consolidated because theGroup does not own either a significant portion of the equity,or the risks and rewards inherent in the assets. Some £9m(2001: £4m) of net income relates to transactions with theseentities.
Under the new US GAAP requirement FIN 46, furtherdisclosure of the Group’s involvement with entities of this andsimilar nature are given in note 63 on pages 213 and 214.

123Barclays PLC Annual Report 2002
Other informationEconomic and monetary union and Supervision and regulation
Economic and monetary unionBarclays is maintaining a prudent programme to validate anddevelop further its existing plans relating to the potentialmembership of European Monetary Union by the UK, and toconduct feasibility studies with selected suppliers and partners.
Barclays has contributed to the development of, and supportsthe conclusions arising from, the British Bankers' Associationand Association for Payment Clearing Services' UK BankingIndustry Outline Euro Blueprint published in June 2002.
Given the considerable uncertainty that continues to surroundwhether and when the UK may enter, it has not been possibleto draw any definitive conclusions as to the final overall cost ofpreparing retail systems and operations.
Barclays incurred minimal expenditure during 2002 withrespect to any decision to introduce the euro in the UK.
Supervision and regulationUK The Financial Services Authority (FSA) is responsible forsupervising the full range of financial business, includingdeposit-taking business, securities and other investmentbusiness and life insurance business in the UK. However, HMTreasury has recently announced its intention that fromOctober 2004, the FSA will also assume responsibility for theregulation of mortgage advice and from January 2005 the saleof general insurance products. The cornerstone of theregulatory regime is the Financial Services and Markets Act2000 (FSMA 2000) which came into force on 1st December2001 (a date known as N2). The FSMA 2000 replaced much ofthe previous legislation, including the Financial Services Act1986, the Banking Act 1987 and the Insurance Companies Act1982 under which banks, insurance companies and otherfinancial services firms had been authorised and supervised.
Under the FSMA 2000, the FSA is required to pursue fourstatutory objectives to:
1) Maintain market confidence in the UK financial system;
2) Promote public awareness and understanding of thefinancial system;
3) Secure an appropriate degree of protection for consumers; and
4) Reduce the scope for financial crime.
In addition to pursuing these statutory objectives, the FSA isrequired to take into account a number of factors includingusing its resources in the most efficient way, taking intoaccount the international character of financial services andthe desirability of maintaining the UK’s competitive positionand minimising adverse effects on competition between thosesubject to regulation by the FSA.
The FSA has also issued a new unified Handbook of rules andguidance for all financial services firms. While certain parts ofthe Handbook have yet to be finalised (in particular some ofthe specialist sourcebooks, such as mortgages), the majority ofthe new rules and regulations came into force at N2.
In its role as supervisor, the FSA is seeking to ensure the safetyand soundness of financial institutions (in fulfilment of the firstand third objectives above) with the aim of strengthening, butnot ensuring, the protection of customers. Barclays Bank PLC isauthorised under the FSMA 2000 to carry on regulatedactivities within the UK and is subject to consolidatedsupervision by the FSA.
The FSA’s continuing supervision of financial institutionsauthorised by it is conducted through a variety of regulatorytools, including the collection of information from statisticaland prudential returns, reports obtained from skilled persons,visits to banks and regular meetings with management todiscuss issues such as performance, risk management andstrategy. Under the FSA’s risk-based approach to supervision,the starting point for the FSA’s supervision of all financialinstitutions is based on a systematic analysis of the risk profilefor each authorised firm. The FSA has adopted a homogenousrisk, processes and resourcing model in its approach to itssupervisory responsibilities (known as the ARROW model) and the results of the risk assessment will be used by the FSA todevelop a risk mitigation programme for a firm.The FSA alsopromulgates requirements that banks and other financialinstitutions are required to meet on matters such as capitaladequacy (see Capital resources on page 116), limits on largeexposures to individual entities and groups of closelyconnected entities, and liquidity.
Banks, insurance companies and other financial institutions inthe UK are subject to a single financial services compensationscheme (the Financial Services Compensation Scheme) wherean authorised firm is unable or is likely to be unable to meetclaims made against it due to its financial circumstances. Thissingle scheme replaces a number of pre-N2 schemes, includingthe Deposit Protection Scheme, the Investors CompensationScheme and the Policyholders Protection Scheme.
Eligible claimants under the Financial Services CompensationScheme may make claims against the Scheme in the event ofan authorised firm’s default and may receive compensation iftheir claim is a protected claim. Different levels ofcompensation are available to eligible claimants dependingupon whether the protected claim is in relation to a deposit, acontract of insurance or protected investment business. Themanager of the Scheme is able to make an offer ofcompensation or, in respect of insurance contracts, offer tocontinue cover or provide assistance to an insuranceundertaking to allow it to continue insurance business inaccordance with the rules of the Scheme. Most deposits madewith branches of Barclays Bank PLC within the EuropeanEconomic Area (“EEA”) which are denominated in sterling orother EEA currencies (including the euro) are covered by theScheme. Most claims made in respect of designatedinvestment business will also be protected claims if thebusiness was carried on from the UK or from a branch of thebank or investment firm in another EEA member state. TheScheme establishes the maximum amounts of compensationpayable in respect of protected claims: for eligible protecteddeposit claims, this is £31,700 (100% of the first £2,000 and90% of the next £33,000) and for protected investmentbusiness, this is £48,000 (100% of the first £30,000 and 90% ofthe next £20,000). There is no maximum limit for protectedinsurance claims. The first £2,000 of a valid claim is paid in fulltogether with 90% of the remaining loss.

124 Barclays PLC Annual Report 2002
Other informationSupervision and regulation and Risk factors
The UK has implemented the minimum requirements imposedby the European Community Directives on such matters as thecarrying on the business of credit institutions and investmentfirms, capital adequacy, own funds and large exposures. Theseform part of the European Single Market programme, animportant feature of which is the framework for the regulationof authorised firms. This framework is designed to enable acredit institution or investment firm authorised in oneEuropean Union member state to conduct banking orinvestment business through the establishment of branches orby the provision of services on a cross-border basis in othermember states without the need for local authorisation. Manyof these Directives are being amended to reflect changes in themarket and further European Community Directives areplanned including the areas of distance marketing, marketabuse and insurance regulation which once coming into effectwill further shape and influence the UK regulatory agenda.
With effect from February 2003, the Group has becomesubject to The Proceeds of Crime Act 2002 which furtherstrengthens the law with regard to anti-money laundering, andwhich is complimentary to the existing rules and guidancefond in the FSA’s Handbook, the 1993 Money LaunderingRegulations and the JMLSG Guidance Notes.
Formal consultation is a key aspect of the UK Government’sreform programme and the Group has been reviewing and,where relevant, commenting on proposals both directly andthrough industry associations.
The Basel Committee on Banking Supervision and theEuropean Commission have also issued consultation papersdesigned to replace the existing framework for the allocationof regulatory capital for credit risk. These bodies recognise thata more sophisticated approach is required to address bothfinancial innovation and the increasingly complex risks facedby financial institutions. The revised Basel Capital Accord andthe EU capital adequacy directive are not currently expected tobe implemented until the end of 2006.
Rest of the WorldIn the United States, Barclays PLC, Barclays Bank PLC andcertain US subsidiary undertakings, branches and agencies ofthe Bank are subject to a comprehensive regulatory structure,involving numerous statutes, rules and regulations, includingthe International Banking Act of 1978, the Bank HoldingCompany Act of 1956, as amended, and the Foreign BankSupervision Enhancement Act of 1991 and the USA PATRIOTAct of 2001. Such laws and regulations impose limitations onthe types of businesses, and the ways in which they may beconducted, in the United States and on the location andexpansion of banking business there. The securities andinvestment management activities conducted in the UnitedStates are also subject to a comprehensive scheme ofregulation under the US federal securities laws, as enforced bythe Securities and Exchange Commission.
Barclays operates in many other countries and its overseasoffices subsidiary and asociated undertakings are subject toreserve and reporting requirements and controls imposed bythe relevant central banks and regulatory authorities.
Risk factors This document contains certain forward-looking statementswithin the meaning of section 21E of the US SecuritiesExchange Act of 1934, as amended and section 27A of the USSecurities Act of 1933, as amended with respect to certain ofthe Group’s plans and its current goals and expectationsrelating to its future financial condition and performance.
The Group may also make forward-looking statements in otherwritten materials, including other documents filed with orfurnished to the SEC. In addition, the Group’s seniormanagement may make forward-looking statements orally toanalysts, investors, representatives of the media and others. Inparticular, among other statements, certain statements in theFinancial review and Business Description with regard tomanagement objectives, trends in results of operations,margins, costs, return on equity, risk management, andcompetition are forward looking in nature. These forward-looking statements can be identified by the fact that they donot relate only to historical or current facts. Forward-lookingstatements often use words such as “anticipate,” “target,”“expect,” “estimate,” “intend,” “plan,” “goal,” “believe,” orother words of similar meaning.
By their nature, forward-looking statements involve risk anduncertainty because they relate to events and depend oncircumstances that will occur in the future. The Group’s actualfuture results may differ materially from those set out in theGroup’s forward-looking statements. There are many factorsthat could cause actual results and developments to differmaterially from those expressed or implied by these forward-looking statements. Any forward-looking statements made byor on behalf of the Group speak only as of the date they aremade. Barclays does not undertake to update forward-lookingstatements to reflect any changes in the Group’s expectationswith regard thereto or any changes in events, conditions orcircumstances on which any such statement is based. Thereader should, however, consult any further disclosuresBarclays may make in documents it files with the SEC.
The following discussion sets forth certain risk factors that theGroup believes could cause its actual future results to differmaterially from expected results. The reader should also notethe references to liquidity risk (page 81) and non-financial,compliance, legal and tax risk (page 85). However, otherfactors could also adversely affect the Group results and thereader should not consider the factors discussed in this reportto be a complete set of all potential risks and uncertainties.
Business conditions and general economy. The profitability of Barclays’ businesses could be adverselyaffected by a worsening of general economic conditions in theUnited Kingdom or abroad. Factors such as the liquidity of theglobal financial markets, the level and volatility of equity pricesand interest rates, investor sentiment, inflation, and theavailability and cost of credit could significantly affect theactivity level of customers. A continued market downturnwould likely lead to a decline in the volume of transactions thatBarclays executes for its customers and, therefore, lead to adecline in the income it receives from fees and commissions.

125Barclays PLC Annual Report 2002
Other informationRisk factors
A continued market downturn or worsening of the economycould cause the Group to incur mark to market losses in itstrading portfolios. A market downturn also could potentiallyresult in a decline in the fees Barclays earns for managingassets. For example, a higher level of domestic or foreigninterest rates or a downturn in trading markets could affect theflows of assets under management. An economic downturn orsignificantly higher interest rates could adversely affect thecredit quality of Barclays on-balance sheet and off-balancesheet assets by increasing the risk that a greater number of theGroups customers would be unable to meet their obligations.
Credit riskThe Group’s provisions for credit losses provide for lossesinherent in loans and advances. Estimating potential losses isinherently uncertain and depends on many factors, includinggeneral economic conditions, rating migration, structuralchanges within industries that alter competitive positions, andother external factors such as legal and regulatoryrequirements.
Market risksThe most significant market risks the Group faces are interestrate, foreign exchange and bond and equity price risks.Changes in interest rate levels, yield curves and spreads mayaffect the interest rate margin realised between lending andborrowing costs. Changes in currency rates, particularly in thesterling-dollar and sterling-euro exchange rates, affect thevalue of assets and liabilities denominated in foreign currenciesand affect earnings reported by the Group’s non-UKsubsidiaries and may affect revenues from foreign exchangedealing. The performance of financial markets may causechanges in the value of the Group’s investment and tradingportfolios. The Group has implemented risk managementmethods to mitigate and control these and other market risksto which the Group is exposed. However, it is difficult to predictwith accuracy changes in economic or market conditions andto anticipate the effects that such changes could have on theGroup’s financial performance and business operations. Inaddition the value of assets held in the Group’s pension andlong-term assurance funds are also affected by the performance.
Non-financial risksThe Group’s businesses are dependent on the ability to processa large number of transactions efficiently and accurately. Non-financial risk and losses can result from fraud, errors byemployees, failure to properly document transactions or toobtain proper internal authorisation, failure to comply withregulatory requirements and Conduct of Business rules,equipment failures, natural disasters or the failure of externalsystems, for example, the Group’s suppliers or counterparties.Although the Group has implemented risk controls and lossmitigation actions, and substantial resources are devoted todeveloping efficient procedures and to staff training, it is onlypossible to be reasonably, but not absolutely, certain that suchprocedures will be effective in controlling each of the non-financial risks faced by the Group.
Changes in governmental policy and regulationThe Group’s businesses and earnings can be affected by thefiscal or other policies that are adopted by various regulatoryauthorities of the UK, foreign governments and internationalagencies. The nature and impact of future changes in suchpolicies are not predictable and are beyond the Group’scontrol. Areas where changes could have an impact include, inter alia;
» the monetary, interest rate and other policies of centralbanks and regulatory authorities;
» general changes in government or regulatory policy thatmay significantly influence investor decisions in particularmarkets in which the Group operates;
» general changes in the regulatory requirements, forexample prudential rules relating to the capital adequacyframework;
» changes in competition and pricing environments;
» expropriation, nationalisation, confiscation of assets andchanges in legislation relating to foreign ownership; and
» other unfavourable political or diplomatic developmentsproducing social instability or legal uncertainty which inturn may affect demand for the Group’s products andservices.
Impact of strategic decisions taken by the GroupThe Group devotes substantial management and planningresources to the development of strategic plans for organicgrowth and identification of possible acquisitions, supportedby substantial expenditure to generate growth in customerbusiness. If these strategic plans do not meet with success, theGroup’s earnings could grow more slowly or decline.
CompetitionThe UK financial services market remains highly competitiveand innovative competition comes both from incumbentplayers and a steady stream of new market entrants. Thelandscape is expected to remain highly competitive in all theGroup’s businesses.

126 Barclays PLC Annual Report 2002
Auditors’ reports
UK audit report of the independentauditors’ to the members of Barclays PLCWe have audited the accounts on pages 128 to 196 whichcomprise the profit and loss account, the balance sheet, thecash flow statement, the statement of total recognised gainsand losses and the related notes which have been preparedunder the historical cost convention, as modified by therevaluation of certain assets, and the accounting policies setout on pages 128 to 134.
We have also audited the disclosures required by Part 3 ofSchedule 7A to the Companies Act 1985 contained in theBarclays report on remuneration (“the auditable part”)contained on pages 44 to 51.
Respective responsibilities of Directors and auditors The Directors’ responsibilities for preparing the Annual Report,the Barclays report on remuneration and the accounts in accordance with applicable United Kingdom law andaccounting standards are set out in the statement of Directors’responsibilities on page 52.
Our responsibility is to audit the accounts and the auditablepart of the Barclays report on remuneration in accordance withrelevant legal and regulatory requirements and United KingdomAuditing Standards issued by the Auditing Practices Board. Thisreport, including the opinion, has been prepared for and onlyfor the Company’s members as a body in accordance withSection 235 of the Companies Act 1985, and for no otherpurpose. We do not, in giving this opinion, accept or assumeresponsibility for any other purpose or to any other person towhom this report is shown or in to whose hands it may comesave where expressly agreed by our prior consent in writing.
We report to you our opinion as to whether the accounts give a true and fair view and whether the accounts and the auditablepart of the Barclays report on remuneration have been properlyprepared in accordance with the Companies Act 1985. We alsoreport to you if, in our opinion, the Directors’ report is notconsistent with the accounts, if the Company or Group has notkept proper accounting records, if we have not received all theinformation and explanations we require for our audit, or ifinformation specified by law regarding Directors’ remunerationand transactions is not disclosed.
We read the other information contained in the Annual report and consider the implications for our report if webecome aware of any apparent misstatements or materialinconsistencies with the accounts. The other informationcomprises only the Corporate governance report, the unauditedpart of the Barclays remuneration report, Accountability andAudit, Presentation of information, Risk management, Financialdata, Business description and Financial review.
We review whether the corporate governance report reflectsthe Company’s and Group’s compliance with the sevenprovisions of the Combined Code specified for our review bythe Listing Rules of the Financial Services Authority, and wereport if it does not. We are not required to consider whetherthe Board’s statements on internal control cover all risks andcontrols, or to form an opinion on the effectiveness of theCompany’s or Group’s corporate governance procedures or its risk and control procedures.
Basis of audit opinion We conducted our audit in accordance with auditing standardsissued by the Auditing Practices Board. An audit includesexamination, on a test basis, of evidence relevant to theamounts and disclosures in the accounts and the auditablepart of the Barclays report on remuneration. It also includes anassessment of the significant estimates and judgements madeby the Directors in the preparation of the accounts, and ofwhether the accounting policies are appropriate to theCompany’s and Group’s circumstances, consistently appliedand adequately disclosed.
We planned and performed our audit so as to obtain all theinformation and explanations which we considered necessaryin order to provide us with sufficient evidence to givereasonable assurance that the accounts and the auditable partof the Barclays report on remuneration are free from materialmisstatement, whether caused by fraud or other irregularity orerror. In forming our opinion we also evaluated the overalladequacy of the presentation of information in the accounts.
Opinion In our opinion:
» The accounts give a true and fair view of the state of theaffairs of the Company and the Group at 31st December2002 and of the profit and cash flows of the Group for theyear then ended;
» The accounts have been properly prepared in accordancewith the Companies Act 1985; and
» Those parts of the Barclays report on remunerationrequired by Part 3 of Schedule 7A to the Companies Act1985 have been properly prepared in accordance with theCompanies Act 1985.
PricewaterhouseCoopers LLPChartered Accountants and Registered Auditors London, United Kingdom, 12th February 2003
127Barclays PLC Annual Report 2002
Auditors’ reports
US audit report of the independentaccountants to the Board of Directors and shareholders of Barclays PLC andBarclays Bank PLCWe have audited the accompanying consolidated financialstatements of Barclays PLC and its subsidiary undertakings on pages 128 to 219 and Barclays Bank PLC and its subsidiaryundertakings on pages 224 to 232. These financial statementsare the responsibility of the Company’s management. Our responsibility is to express an opinion on these financialstatements based on our audits.
We conducted our audits in accordance with auditing standards generally accepted in the United States of America.Those standards require that we plan and perform the audit to obtain reasonable assurance about whether the financialstatements are free of material misstatement. An audit includesexamining, on a test basis, evidence supporting the amountsand disclosures in the financial statements. An audit also includesassessing the accounting principles used and significantestimates made by management, as well as evaluating theoverall financial statement presentation. We believe that ouraudits provide a reasonable basis for our opinion.
In our opinion, the consolidated financial statements referred to above present fairly, in all material respects, the financialposition of Barclays PLC and its subsidiary undertakings andBarclays Bank PLC and its subsidiary undertakings at31st December 2002 and 2001, and the results of theiroperations and their cash flows for each of the three years in the period ended 31st December 2002 in conformity withaccounting principles generally accepted in the United Kingdom.
Accounting principles generally accepted in the UnitedKingdom vary in certain significant respects from accountingprinciples generally accepted in the United States. Theapplication of the latter would have affected the determinationof consolidated net income for each of the three years in theperiod ended 31st December 2002 and the determination ofthe consolidated shareholders’ equity at 31st December 2002and 2001 to the extent summarised in note 63 and note g tothe consolidated financial statements.
PricewaterhouseCoopers LLPChartered Accountants and Registered AuditorsLondon, United Kingdom, 12th February 2003

128 Barclays PLC Annual Report 2002
Accounting policiesSummary of significant accountingpolicies(a) Accounting convention The accounts have been prepared under the historical costconvention, as modified by the revaluation of certain assetsheld for dealing purposes, assets held in the long-termassurance business and the investment in Barclays Bank PLC in the balance sheet of Barclays PLC. They are prepared inaccordance with applicable accounting standards of the UKAccounting Standards Board (ASB) and pronouncements of its Urgent Issues Task Force (UITF) and with the Statements ofRecommended Accounting Practice (SORPs) issued by theBritish Bankers’ Association (BBA) and the Finance and LeasingAssociation (FLA).
The SORP issued by the Association of British Insurers (ABI)addresses the accounting and disclosure of insurance businessfor insurance undertakings. Barclays is primarily a bankinggroup, not an insurance group, and prepares accounts inaccordance with Schedule 9 of the Companies Act. The ABI SORP does not specifically address the accounting for long-term assurance business in this context. In line with other such banking groups, Barclays uses the embedded valuemethod to measure the shareholders’ interest in its long-termassurance business, which is consistent with the alternativemeasurement method described in guidance issued by the ABI‘Supplementary Reporting for Long-Term Insurance Business’and is considered more relevant than the modified statutorysolvency basis for describing the financial position and currentperformance of the business.
Changes to the accounting policies described in the 2001Annual report are set out on pages 133 to 134.
(b) Consolidation and formatThe consolidated accounts have been prepared in compliancewith Sections 230, 255, 255A and 255B of, and Schedule 9 to,the Companies Act 1985 (the Act). The profit and loss accountand balance sheet of Barclays PLC have been prepared incompliance with Section 226 of, and Schedule 4 to, the Act.
The consolidated accounts include the accounts of Barclays PLC and its subsidiary undertakings made up to31st December. Entities that do not qualify as subsidiaries but which give rise to benefits that are, in substance, nodifferent from those that would arise were the entity asubsidiary, are included in the consolidated accounts. Details of the principal subsidiary undertakings are given in note 44. In order to reflect the different nature of the shareholders’ and policyholders’ interests in the retail long-term assurancebusiness, the value of the long-term assurance businessattributable to shareholders is included in Other Assets and the assets and liabilities attributable to policyholders are classified under separate headings in the consolidatedbalance sheet.
As the consolidated accounts include partnerships where a Group member is a partner, advantage has been taken of the exemption given by Regulation 7 of the Partnerships and Unlimited Companies (Accounts) Regulations 1993 with regard to the preparation and filing of individualpartnership accounts.
(c) Shares in subsidiary undertakingsBarclays PLC’s investment in Barclays Bank PLC together withBarclays Bank PLC’s investments in subsidiary undertakings are stated at the amount of the underlying net asset, includingattributable goodwill. Changes in the value of the net assets areaccounted for as movements in the revaluation reserve.
(d) Interests in associated undertakings and joint venturesAn associated undertaking generally is one in which theGroup’s interest is more than 20% and no more than 50% and where the Group exercises a significant influence over theentity’s operating and financial policies. A joint venture is onewhere the Group holds an interest on a long-term basis andwhich is jointly controlled by the Group and one or more otherventurer. The profit and loss account includes income frominterests in associated undertakings and joint ventures basedon accounts made up to dates not earlier than three monthsbefore the balance sheet date. Interests in associatedundertakings and joint ventures are included in the consolidatedbalance sheet at the Group’s share of the book value of the net assets of the undertakings concerned plus unamortisedgoodwill arising on the acquisition of the interest.
(e) GoodwillGoodwill may arise on the acquisition of subsidiary andassociated undertakings and joint ventures. It represents the excess of cost over fair value of the Group’s share of netassets acquired.
In accordance with Financial Reporting Standard (FRS) 10,goodwill is capitalised as an intangible asset and amortisedthrough the profit and loss account over its expected usefuleconomic life. For acquisitions prior to 1st January 1998, the Group accounting policy had been to write-off goodwilldirectly to reserves. The transitional arrangements of FRS 10allow this goodwill to remain eliminated. In the event of asubsequent disposal, any goodwill previously charged directlyagainst reserves prior to FRS 10 will be written back andreflected in the profit and loss account.
The useful economic life of the goodwill is determined at thetime of the acquisition giving rise to it by considering thenature of the acquired business, the economic environment in which it operates and period of time over which the value ofthe business is expected to exceed the values of the identifiablenet assets. For acquisitions in less mature economicenvironments, goodwill is generally considered to have a usefuleconomic life of five years. For all other acquisitions, goodwillis generally expected to have a useful economic life of 20 years.In all cases, goodwill is amortised over its useful economic lifeand is subject to regular review as set out in policy (k).
Consolidated accounts Barclays PLCAccounting policies

129Barclays PLC Annual Report 2002
For the purpose of calculating goodwill, fair values of acquiredassets and liabilities are determined by reference to marketvalues, where available, or by reference to the current price atwhich similar assets could be acquired or similar obligationsentered into, or by discounting expected future cash flows topresent value. This discounting is performed using eithermarket rates or by using risk-free rates and risk-adjustedexpected future cash flows.
(f) Foreign currenciesAssets and liabilities in foreign currencies are translated intosterling at rates of exchange ruling on the balance sheet date. Overseas profits and losses are translated into sterling at average rates of exchange for the year. Profits arising inareas experiencing hyper-inflation are adjusted to recognise its effect on the worth of the working capital employed.Exchange differences arising from the application of closingrates of exchange to the opening net assets held overseas, to the retranslation of the result for the year from the averagerate to the closing rate and to related foreign currencyborrowings are taken directly to reserves. All other exchangeprofits and losses, which arise from normal trading activities,are included in the profit and loss account.
(g) Shareholders’ interest in the retail long-term assurance fundThe value of the shareholders’ interest in the Group’s retaillong-term assurance business represents an estimate of the net present value of the profits inherent in the in-force policies,based on the advice of qualified actuaries, together with thesurplus retained within the long-term assurance funds. Thisvalue is calculated after tax. Changes in the value placed on thelong-term assurance business attributable to shareholders areincluded in the profit and loss account.
For the purpose of presentation, the change in value is grossedup at the effective rate of corporation tax.
In estimating the net present value of the profits inherent in the in-force policies, the calculations use assumed economicparameters (future investment returns, expense inflation andrisk discount rate), taxation, mortality, persistency, expensesand the required levels of regulatory and solvency capital. Eachof these assumptions is reviewed annually. The returns on fixedinterest investments are set to market yields at the period end.The returns on UK and overseas equities and property are set to fixed interest returns plus a margin to reflect the additionalreturn expected on each of these investments. The calculationsare based on the market value of assets at the period end. The expense inflation assumption is based on long-termexpectations of both earnings and retail price inflation. The riskdiscount rate is set to market yields on Government securitiesplus a margin to allow for the risks borne. The mortality,persistency and expense assumptions are chosen to representbest estimates of future experience and are based on currentbusiness experience. No credit is taken for favourable changes in experience unless it is reasonably certain to be delivered. The projected tax charges and the required levels of regulatoryand solvency capital are based on current legislation.
(h) Revenue recognitionInterest income is recognised in the profit and loss account asit accrues, with the exception of interest on non-performingloans as set out in accounting policy (l) below.
Fee income relating to loans and advances is recognised in the profit and loss account to match the cost of providing acontinuing service, together with a reasonable profit margin.Where a fee is charged in lieu of interest, it is recognised in the profit and loss account as interest receivable on a levelyield basis over the life of the advance. Fees and commissionsreceivable in respect of all other services provided arerecognised in the profit and loss account when the relatedservices are performed and when considered recoverable.
Income arises from the margins which are achieved throughmarket-making and customer business and from changes inmarket value caused by movements in interest and exchangerates, equity prices and other market variables. On- and off-balance sheet trading positions are valued on a mark tomarket basis. The resulting income is included in dealingprofits along with interest and dividends arising from long andshort positions and funding costs relating to trading activities.
(i) Lending related fees and commissions payable and incentives Fees and commissions payable to introducers in respect ofobtaining certain lending business, where this is the primaryform of distribution, are charged to the profit and loss accountas fees and commissions payable, over the anticipated life ofthe loans.
The costs of mortgage incentives, which comprise cashbacksand interest discounts, are charged to the profit and lossaccount as a reduction to interest receivable as incurred.
The amount of a fee payable by a borrower in respect of highloan to value UK residential secured loans representing aninsurance premium, is deferred and included in accruals anddeferred income in the Group balance sheet. Following regularreviews of the amount of deferred income required to coveranticipated losses in respect of this lending, deferred income is released to the profit and loss account on an annual basis.
Consolidated accounts Barclays PLCAccounting policies

130 Barclays PLC Annual Report 2002
(j) DepreciationTangible fixed assets are depreciated on a straight-line basisover their useful economic lives at the following annual rates:
Freehold buildings and long-leasehold property (more than 50 years to run) 2%Leasehold property over the remaining (less than 50 years to run) life of the leaseCosts of adaptation of freehold and leasehold property* 10%Equipment installed in freehold and leasehold property* 10%Computers and similar equipment 20%-33%Fixtures and fittings and other equipment 20%
*Where a leasehold has a remaining useful life of less than10 years, costs of adaptation and installed equipment aredepreciated over the remaining life of the lease.
The Group selects its depreciation rates carefully and reviewsthem regularly to take account of any changes in circumstances.When setting useful economic lives, the principal factors the Group takes into account are the expected rate oftechnological developments, expected market requirements for the equipment and the intensity at which the assets areexpected to be used.
No depreciation is provided on freehold land.
(k) ImpairmentTangible fixed assets and goodwill are subject to impairmentreview in accordance with FRS 11 if there are events orchanges in circumstances that indicate that the carryingamount of the fixed asset or goodwill may not be fullyrecoverable. The impairment review comprises a comparisonof the carrying amount of the fixed asset or goodwill with itsrecoverable amount, which is the higher of net realisable valueand value in use. Net realisable value is calculated by referenceto the amount at which the asset could be disposed of. Value in use is calculated by discounting the expected futurecash flows obtainable as a result of the assets continued use,including those resulting from its ultimate disposal, at a marketbased discount rate on a pre-tax basis. The carrying values offixed assets and goodwill are written down by the amount ofany impairment and this loss is recognised in the profit and loss account in the period in which it occurs. If the occurrence of an external event gives rise to a reversal of an impairment loss, the reversal is recognised in the profitand loss account and by increasing the carrying amount of the fixed asset or goodwill in the period in which it occurs. The carrying amount of the fixed asset or goodwill will only be increased up to the amount that it would have been had the original impairment not occurred. For the purpose ofconducting impairment reviews, income generating units are identified as groups of assets, liabilities and associatedgoodwill that generates income that is largely independent of other income streams. The assets and liabilities includethose directly involved in generating the income and anappropriate proportion of those used to generate more than one income stream.
(l) Bad and doubtful debtsSpecific provisions are raised when the Group considers thatthe creditworthiness of a borrower has deteriorated such thatthe recovery of the whole or part of an outstanding advance is in serious doubt. Typically, this is done on an individual basis,although scope exists within the retail businesses, where theportfolio comprises homogeneous assets and where statisticaltechniques are appropriate, to raise specific provisions on aportfolio basis.
General provisions are raised to cover losses which are judgedto be present in loans and advances at the balance sheet date, but which have not been specifically identified as such.These provisions are adjusted at least half yearly by anappropriate charge or release of general provision based on astatistical analysis. The accuracy of this analysis is periodicallyassessed against actual losses. Gradings are used to rate thecredit quality of borrowers. Each grade corresponds to anExpected Default Frequency and is calculated by using manualor computer driven score-sheets validated by an analysis of theGroup’s own historical data. This grade can be derived fromdifferent sources depending upon the borrower (e.g. internalmodel, credit rating agency). The general provision also takesinto account the economic climate in the market in which theGroup operates and the level of security held in relation toeach category of counterparty. The general provision includesa specifically identified element to cover country transfer risk calculated on a basis consistent with the overall generalprovision calculation. General provisions are created withrespect to the recoverability of assets arising from off-balancesheet exposures in a manner consistent with the generalprovisioning methodology.
The aggregate specific and general provisions which are made during the year, less amounts released and recoveries ofbad debts previously written off, are charged against operatingprofit and are deducted from loans and advances. Impairedlendings are written off against the balance sheet asset andprovision in part, or in whole, when the extent of the lossincurred has been confirmed.
If the collection of interest is doubtful, it is credited to asuspense account and excluded from interest income in theprofit and loss account. Although it continues to be charged to the customers’ accounts, the suspense account in thebalance sheet is netted against the relevant loan. If thecollection of interest is considered to be remote, interest is nolonger applied and suspended interest is written off. Loans onwhich interest is suspended are not reclassified as accruinginterest until interest and principal payments are up-to-dateand future payments are reasonably assured.
Assets acquired in exchange for advances in order to achievean orderly realisation continue to be reported as advances. Theasset acquired is recorded at the carrying value of the originaladvance updated as at the date of the exchange. Any subsequentimpairment is accounted for as a specific provision.
Consolidated accounts Barclays PLCAccounting policies

131Barclays PLC Annual Report 2002
Consolidated accounts Barclays PLCAccounting policies
(m) Debt securities and equity sharesInvestment securities are debt securities and equity sharesintended for use on a continuing basis by the Group andidentified as such. Investment securities are stated at cost lessany provision for impairment. The cost of dated investmentsecurities is adjusted for the amortisation of premiums ordiscounts on purchase over the period to redemption. Theamortisation of premiums and discounts is included in Interest receivable.
Other debt securities and equity shares are stated at marketvalue and profits and losses arising from this revaluation aretaken directly to the profit and loss account through dealingprofits. Listed securities are valued based on mid-market pricesand unlisted securities are valued based on the Directors’estimate, which takes into consideration discounted cash flows,price earnings ratios and other valuation techniques.
In the case of private equity investments, listed and unlistedinvestments are stated at cost less any provision for impairment.
Investment and other securities may be lent or sold subject toa commitment to repurchase them. Securities lent or sold areretained on the balance sheet where substantially all the risksand rewards of ownership remain with the Group. Similarly,securities purchased subject to a commitment to resell aretreated as collateralised lending transactions where the Groupdoes not acquire the risks and rewards of ownership.
(n) Pensions and other post-retirement benefitsThe Group provides pension plans for employees in most partsof the world. Arrangements for staff retirement benefits inoverseas locations vary from country to country and are madein accordance with local regulations and customs. For definedcontribution schemes, the pension cost recognised in the profitand loss account represents the contributions payable to thescheme. The majority of UK staff are members of The BarclaysBank UK Retirement Fund (the UK Fund) which comprises afunded defined benefit scheme and a money purchase schemefor new joiners since July 1997. Staff do not make contributionsfor basic pensions. Other UK staff are covered by broadlycomparable schemes and are accounted for on a comparablebasis. The assets of the UK Fund are held separately from theassets of the Group and are administered by a trustee. Thepension cost is assessed in accordance with the advice of aqualified actuary, using the projected unit method. Variationsfrom the regular cost are allocated over the expected averageservice lives of current employees. Provisions for pensions arisewhen the profit and loss account charge exceeds thecontribution to the scheme as a result of actuarial valuations.These provisions will be eliminated over the estimated servicelives of the employees. The basis of estimation is set out innote 5 on page 144. The Group also provides post-retirementhealth care to certain staff and pensioners in the UK and US,the cost of which has been accrued on a similar basis.Provisions for post-retirement benefits are raised to cover theexpected cost of providing the benefits.
(o) Finance leasesAssets leased to customers under agreements which transfersubstantially all the risks and rewards of ownership, other than legal title, are classified as finance leases. Finance leasereceivables are included in loans and advances to customers.Gross earnings under finance leases are allocated to accounting periods in such a way as to give a constant periodic rate of return on the net cash investment. Financelease receivables are stated at the cost of the equipment,including gross earnings to date, less rentals received to date.
(p) Deferred taxDeferred tax is provided in full in respect of timing differencesthat have originated but not reversed at the balance sheetdate. Timing differences are differences between the Group’staxable profits and its results as stated in the accounts thatarise from the inclusion of gains and losses in tax assessmentsin periods different from those in which they are recognised in the financial statements. Deferred tax is not provided onpermanent differences. Deferred tax assets are recognised tothe extent that it is regarded as more likely than not that theywill be recoverable. Deferred tax is not provided on theunremitted earnings of subsidiary undertakings, joint venturesand associated undertakings except to the extent thatdividends have been accrued or a binding agreement todistribute past earnings in the future has been entered into.
Deferred tax is measured at the average tax rates that areexpected to apply in the periods in which the timing differencesare expected to reverse, based on tax rates and laws that havebeen enacted or substantially enacted by the balance sheet date.Deferred tax is not discounted.
(q) Non-credit risk provisionsProvisions are recognised for present obligations arising asconsequences of past events where it is probable that atransfer of economic benefit will be necessary to settle theobligation and it can be reliably estimated.
When a leasehold property ceases to be used in the business,provision is made where the unavoidable costs of the futureobligations relating to the lease are expected to exceedanticipated income. The provision is discounted using marketrates to reflect the long-term nature of the cashflows.
When the Group has a detailed formal plan for restructuring a business and has raised valid expectations in those affected by the restructuring by starting to implement the plan orannouncing its main features, provision is made for theanticipated cost of the restructuring, including redundancycosts. The provision raised is normally utilised within 12 months.
Contingent liabilities are possible obligations whose existencewill be confirmed only by uncertain future events or presentobligations where the transfer of economic benefit is uncertainor cannot be reliably measured. Contingent liabilities are notrecognised but are disclosed unless they are remote.

132 Barclays PLC Annual Report 2002
Consolidated accounts Barclays PLCAccounting policies
(r) Derivatives Derivatives are used to hedge interest, exchange rate andequity exposures related to non-trading positions. Instrumentsused for hedging purposes include swaps, equity derivatives,forward rate agreements, futures, options and combinations ofthese instruments. In addition, the use of derivatives and theirsale to customers as risk management products is an integralpart of the Group’s trading activities. Derivatives entered intofor trading purposes include swaps, equity derivatives, creditderivatives, commodity derivatives, forward rate agreements,futures, options and combinations of these instruments.
Derivatives used for asset and liability management purposes Derivatives used for hedging purposes are measured on anaccruals basis consistent with the assets, liabilities, positions or future cash flows being hedged. The gains and losses onthese instruments (arising from changes in fair value) are notrecognised in the profit and loss account immediately as theyarise. Such gains are either not recognised in the balance sheetor are recognised and carried forward. When the hedgedtransaction occurs, the gain or loss is recognised in the profitand loss account at the same time as the hedged item.
The criteria required for a derivative instrument to be classifiedas a designated hedge are that:
(i) the transaction must be reasonably expected to match oreliminate a significant proportion of the risk inherent in theassets, liabilities, other positions or cash flows being hedgedand which results from potential movements in market ratesand credit risk; and
(ii) adequate evidence of the intention to hedge and linkagewith the underlying risk inherent in the assets, liabilities, otherpositions or cash flows being hedged, must be established atthe outset of the transaction.
Designated hedges are reviewed for effectiveness by regulartests to determine that the hedge is closely negativelycorrelated to the designated hedged position in each and everyidentified time band in the maturity profile.
Profits and losses on interest rate swaps and options enteredinto for hedging purposes are measured on an accrualaccounting basis, included in the related category of incomeand expense and reported as part of the yield on the hedged transaction. Amounts paid or received over the life of futures contracts are deferred until the contract is closed;accumulated deferred amounts on futures contracts andsettlement amounts paid or received on forward contracts are accounted for as elements of the carrying value of theassociated instrument, affecting the resulting yield.
A premium paid or received in respect of a credit derivativehedging an asset or liability is amortised over the life of theprotection purchased or sold against either interest payable orinterest receivable. Where a credit event occurs which triggers a recovery under the credit derivative then the recovery will beoffset against the profit and loss charge on the underlyingasset or liability.
Foreign exchange contracts which qualify as hedges of foreign currency exposures, including positions relating toinvestments the Group makes outside the UK, are retranslatedat the closing rate with any forward premium or discountrecognised over the life of the contract in net interest income.
Profits and losses related to qualifying hedges, includingforeign exchange contracts, of firm commitments andprobable anticipated transactions are deferred and recognisedin income or as adjustments to carrying amounts when thehedged transactions occur.
Hedging transactions that are superseded or cease to beeffective are measured at fair value. Any profit or loss on these transactions, together with any profit or loss arising onhedging transactions that are terminated prior to the end ofthe life of the asset, are deferred and amortised into interestincome or expense over the remaining life of the itempreviously being hedged.
When the underlying asset, liability position or cash flow is terminated prior to the hedging transaction, or ananticipated transaction is no longer likely to occur, the hedgingtransaction is measured on the fair value accounting basis, asdescribed in the section on derivatives used for tradingpurposes below, prior to being transferred to the tradingportfolio. The profit or loss arising from the fair valuemeasurement prior to the transfer to the trading portfolio isincluded in the category of income or expense relating to thepreviously hedged transaction.
Derivatives used for trading purposesDerivatives entered into as trading transactions, together with any associated hedging thereof, are measured at fair valueand the resultant profits and losses are included in dealingprofits, along with interest and dividends arising from long andshort positions and funding costs relating to trading activities.Assets and liabilities resulting from gains or losses onderivative and foreign exchange contracts are reported gross inother assets or liabilities, reduced by the effects of qualifyingnetting agreements with counterparties.
The fair value of derivatives is determined by calculating theexpected cash flows under the terms of each specific contract,discounted back to a present value. The expected cash flowsfor each contract are determined either directly by reference to actual cash flows implicit in observable market prices or through modelling cash flows using appropriate financial-markets pricing models. The effect of discountingexpected cash flows back to present value is achieved byconstructing discount curves derived from the market price of the most appropriate observable interest rate products such as deposits, interest rate futures and swaps. In addition,the Group maintains fair value adjustments reflecting the costof credit risk (where this is not embedded in the fair value),hedging costs not captured in pricing models, futureadministration costs associated with ongoing operationalsupport of products as well as adjustments to reflect the costof exiting illiquid or other significant positions.

133Barclays PLC Annual Report 2002
Consolidated accounts Barclays PLCAccounting policies
(s) Collateral and nettingThe Group enters into master agreements with counterpartieswhenever possible and, when appropriate, obtains collateral.Master agreements provide that, if an event of default occurs,all outstanding transactions with the counterparty will fall dueand all amounts outstanding will be settled on a net basis.
Where the amounts owed by both the Group and thecounterparty are determinable and in freely convertiblecurrencies, and where the Group has the ability to insist on netsettlement which is assured beyond doubt, and is based on alegal right under the netting agreement that would survive theinsolvency of the counterparty, transactions with positive fairvalues are netted against transactions with negative fair values.
The Group obtains collateral in respect of customer liabilitieswhere this is considered appropriate. The collateral normallytakes the form of a lien over the customer’s assets and gives the Group a claim on these assets for both existing and future liabilities.
The Group also receives collateral in the form of cash orsecurities in respect of other credit instruments, such as stockborrowing contracts, and derivative contracts in order toreduce credit risk. Collateral received in the form of securities is not recorded on the balance sheet. Collateral received in the form of cash is recorded on the balance sheet with acorresponding liability or asset. These items are assigned todeposits received from bank or other counterparties in thecase of cash collateral received, and to loans and advances tobanks or customers in the case of cash collateral paid away.Any interest payable or receivable arising is recorded asinterest payable or interest income respectively.
(t) Credit related instrumentsThe Group treats credit related instruments (other than creditderivatives) as contingent liabilities and these are not shownon the balance sheet unless, and until, the Group is called upon to make a payment under the instrument. Assets arisingfrom payments to a third party where the Group is awaitingreimbursement from the customer, are shown on the balancesheet where reimbursement is considered to be virtuallycertain. Fees received for providing these instruments are takento profit over the life of the instrument and reflected in feesand commissions receivable.
(u) Sale and repurchase agreements (including stockborrowing and lending)The Group enters into sale and repurchase agreements,including stock lending arrangements (repos), and purchase and resale agreements, including stock borrowingarrangements (reverse repos). Under a repo (sale andrepurchase agreement) an asset is sold (or lent) to acounterparty with a commitment to repurchase (or return) the assets at a future date at an agreed price. A reverse repo is the same transaction from the opposite viewpoint. The cashlegs of these transactions are included within loans andadvances to banks, loans and advances to customers, depositsby banks and customer accounts. The Group aims to earn netinterest income and dealing profits from these activities, aswell as funding its own holdings of securities. The differencebetween sale and repurchase and purchase and resale pricesfor such transactions, including dividends received whereappropriate, is charged or credited to the profit and lossaccount over the life of the relevant transactions.
(v) Securitisation transactionsCertain Group undertakings have issued debt securities or have entered into funding arrangements with lenders in order to finance specific loans and advances to customers. In accordance with FRS 5, these balances are either accountedfor on the basis of linked presentation or through separaterecognition of the gross assets and related funding.
(w)Capital instrumentsDebt securities in issue and similar securities are stated at the net issue proceeds adjusted for amortisation of premiums,discounts and expenses related to their issue where the liabilityis a fixed amount. Where the liability fluctuates, based on, forexample, the performance of an index then the debt securityreflects the current value of the liability.
Loan capital in issue is stated at the net issue proceedsadjusted for amortisation of premiums, discounts and expensesrelated to their issue. Amortisation is calculated in order toachieve a constant yield across the life of the instrument.
(x) Internally developed softwareThe Group’s general policy is to write-off such expenditure asincurred except where the software is required to facilitate theuse of new hardware. Capitalised amounts are recorded astangible fixed assets.
Changes in accounting policyA change in accounting policy has arisen from the adoption in 2002 of Financial Reporting Standard 19 ‘Deferred tax’ (FRS 19). Previously, deferred tax was only provided on timingdifferences where it was considered probable that a liability totax would crystallise. As explained in accounting policy (p)above, deferred tax is now provided in full in respect of timingdifferences that have originated but not reversed at thebalance sheet date.
The change in policy has resulted in a prior year adjustment,and the profit and loss accounts and balance sheets for theprevious years have been restated. This has resulted in a netcredit to shareholders’ funds of £14m as at 1st January 2002comprising the cumulative impact of prior year reductions indeferred tax recognised in the profit and loss account andbalance sheet. Comparative figures have been restated with theeffect that shareholders’ funds have been increased by £14m at1st January 2002. Profit after tax for the year ended 31stDecember 2002 has been reduced by £10m. Profit after tax forthe years ending 31st December 2001 and 2000 have beenincreased by £14m and £13m respectively.

134 Barclays PLC Annual Report 2002
Consolidated accounts Barclays PLCAccounting policies and Accounting presentation
A change in accounting policy has also been made by adoptingthe recent guidelines of the Association of British Insurers on the calculation of income from the long-term assurancebusiness. This guidance encourages companies providingresults calculated using the achieved profits methodology touse actual, rather than smoothed, fund values. In view of thesimilarity between the achieved profits and embedded valuemethodologies and in order to ensure comparability to theresults of listed insurers, the Group has decided to change itspolicy on the calculation of embedded values to use actual fund values at the balance sheet date. This has resulted in a net reduction to shareholders’ funds of £37m as at 1st January2002 comprising the cumulative impact of the prior yearreductions in shareholders’ interest in long-term assurancefunds. Comparative figures have been restated with the effectthat Other operating income in 2002, 2001 and 2000 has beenincreased by £8m and reduced by £45m and £57m respectively.
There have been no other significant changes to theaccounting policies as described in the 2001 Annual report.
Future UK accounting developmentsThe Group is currently considering the implications of the recentdecision by the ASB to extend the transitional provisions ofFinancial Reporting Standard 17 ‘Retirement Benefits’ until 2005.
The European Commission issued a Regulation in 2002requiring all listed companies to adopt InternationalAccounting Standards in their consolidated financialstatements by 2005. The Group is considering the implicationsof such a requirement and would expect first to preparefinancial statements in accordance with InternationalAccounting Standards and International Financial ReportingStandards issued by the International Accounting StandardsBoard for the year ended 31st December 2005.
US GAAPSignificant differences exist between accounting principlesgenerally accepted in the UK and those generally accepted in the United States, and the effect on attributable profit andshareholders’ funds of Barclays PLC is set out in note 63.
Accounting presentationChanges in accounting presentation Following the issue of UITF Abstract 33, ‘Obligations in capitalinstruments’, Reserve Capital Instruments (RCIs) are nowtreated as forming part of the undated loan capital of the Bank,rather than as Minority interests – non-equity. The coupon onthe RCIs is now reported in Interest payable, rather than asMinority non-equity interests. Comparatives have been restatedaccordingly. Profit after tax for the year to 31st December 2001has been reduced by £97m with no impact on retained profit.Liabilities have been increased and Minority interests have beenreduced at 31st December 2001 by £1,872m.
The prior period presentation has, where appropriate, beenrestated to conform with current year classification.
Nature of businessBarclays is an international financial services group engagedprimarily in banking, investment banking and assetmanagement. In terms of assets employed, Barclays is one of the largest financial services groups in the UK. The Groupalso operates in many other countries around the world and is a leading provider of co-ordinated global services tomultinational corporations and financial institutions in theworld’s main financial centres.
Analyses by geographical segments and classes of businessThe analyses by geographical segment are generally based on the location of the office recording the transaction.

Consolidated accounts Barclays PLCAccounting presentation
AcquisitionsIn April 2002, Barclaycard acquired the UK Providian creditcard business at a cost of £446m.
In October 2002, Barclays and Canadian Imperial Bank ofCommerce (CIBC) completed the combination of their retail,corporate and offshore banking operations in the Caribbean to create FirstCaribbean International Bank (FirstCaribbean).Barclays interest in the new entity is being accounted for as an Associated undertaking. The transaction resulted in aneconomic profit for Barclays of £206m (recognised in theStatement of total recognised gains and losses) consequent on the disposal of a share of its Caribbean operations. Theacquisition of a share of CIBC West Indies Holding Limited has generated goodwill in Barclays of £131m.
DisposalsThe significant disposal in 2002 related to the disposal of ashare of the Group’s Caribbean operation (see detail underAcquisitions above). The effect of the disposal is reflected inthe Statement of total recognised gains and losses on page 137.
The effect of other disposals on the profit for the year isreflected in note 9 to the accounts.
135Barclays PLC Annual Report 2002

136 Barclays PLC Annual Report 2002
Consolidated accounts Barclays PLCConsolidated profit and loss account
Consolidated profit and loss accountFor the year ended 31st December 2002
2002 2001 2000restated restated
Note £m £m £m
Interest receivable:Interest receivable and similar income arising from debt securities 2,030 2,383 2,339Other interest receivable and similar income 10,014 11,075 9,449
12,044 13,458 11,788Interest payable 5,839 7,492 6,682 Profit on repurchase of loan capital 1 – – 2
Net interest income 6,205 5,966 5,108 Fees and commissions receivable 4,454 4,202 3,676Less: fees and commissions payable (529) (465) (320)Dealing profits 2 833 1,011 677Other operating income 3 364 428 353
Operating income 11,327 11,142 9,494
Administrative expenses – staff costs 4 3,755 3,714 3,219 Administrative expenses – other 6 2,312 2,303 1,967Depreciation and amortisation 7 557 537 306
Operating expenses 6,624 6,554 5,492
Operating profit before provisions 4,703 4,588 4,002
Provisions for bad and doubtful debts 17 1,484 1,149 817 Provisions for contingent liabilities and commitments 8 1 1 (1)
Provisions 1,485 1,150 816
Operating profit 3,218 3,438 3,186 Loss from joint ventures (5) (1) (1)Loss from associated undertakings (5) (8) (7)(Loss)/profit on disposal/termination of Group undertakings 9 (3) (4) 214
Profit on ordinary activities before tax 3,205 3,425 3,392Tax on profit on ordinary activities 10 (955) (943) (901)
Profit on ordinary activities after tax 2,250 2,482 2,491 Minority interests – equity 11 (20) (31) (22)Minority interests – non-equity 11 – (5) (24)
Profit for the financial year attributableto the members of Barclays PLC 2,230 2,446 2,445Dividends 12 (1,206) (1,110) (927)
Profit retained for the financial year 1,024 1,336 1,518
Basic earnings per 25p ordinary share 13 33.7p 36.8p 40.4p
Diluted earnings per 25p ordinary share 13 33.4p 36.4p 40.0p
All results arise from continuing operations. For each of the years reported above, there was no material difference betweenprofit before tax and profit retained and profit on a modified historical cost basis.
The Board of Directors approved the accounts set out on page 128 to 219 on 12th February 2003.

137Barclays PLC Annual Report 2002
Consolidated accounts Barclays PLCStatement of total recognised gains and losses
Statement of total recognised gains and lossesFor the year ended 31st December 2002
2002 2001 2000restated restated
£m £m £m
Profit for the financial year attributable to the members of Barclays PLC 2,230 2,446 2,445Exchange rate translation differences (61) 3 15Gain arising from transaction with third parties 206 – –Other items 8 (24) 8Joint ventures and associated undertakings 2 (15) 6
Total recognised gains relating to the period 2,385 2,410 2,474Prior period adjustment (see pages 133 and 134) (23) – –
Total recognised gains including prior period adjustment 2,362 2,410 2,474

138 Barclays PLC Annual Report 2002
Consolidated accounts Barclays PLCConsolidated balance sheet
Consolidated balance sheet As at 31st December 2002
2002 2001restated
Note £m £m £m £m
AssetsCash and balances at central banks 2,032 1,281 Items in course of collection from other banks 2,335 2,444 Treasury bills and other eligible bills 14 7,645 7,417Loans and advances to banks – banking 15,369 12,196
– trading 42,805 35,69315 58,174 47,889
Loans and advances to customers – banking 157,222 146,253– trading 45,176 34,240
16 202,398 180,493 Debt securities 18 94,229 78,924 Equity shares 19 3,133 3,118 Interests in joint ventures – share of gross assets 242 230
– share of gross liabilities (184) (174)20 58 56
Interests in associated undertakings 20 397 32 Intangible fixed assets 21 3,934 4,091 Tangible fixed assets 22 1,626 1,958 Other assets 24 16,839 18,186 Prepayments and accrued income 26 2,982 2,553
395,782 348,442Retail life-fund assets attributable to policyholders 25 7,284 8,170
Total assets 403,066 356,612
Sir Peter Middleton GCB Chairman
Matthew Barrett Group Chief Executive
John Varley Group Finance Director

139Barclays PLC Annual Report 2002
Consolidated accounts Barclays PLCConsolidated balance sheet
Consolidated balance sheetAs at 31st December 2002
2002 2001restated
Note £m £m £m £m
LiabilitiesDeposits by banks – banking 48,751 45,837
– trading 38,683 21,54327 87,434 67,380
Customer accounts – banking 144,078 139,863– trading 27,420 23,984
28 171,498 163,847Debt securities in issue 29 45,885 41,846Items in course of collection due to other banks 1,416 1,550 Other liabilities 30 56,564 42,930 Accruals and deferred income 31 4,352 4,377 Provisions for liabilities and charges – deferred tax 32 461 616 Provisions for liabilities and charges – other 33 486 562Dividend 788 728 Subordinated liabilities:Undated loan capital – convertible to preference shares 34 310 345 Undated loan capital – non-convertible 34 6,368 4,709Dated loan capital – convertible to preference shares 35 11 –Dated loan capital – non-convertible 35 4,848 4,933
380,421 333,823
Minority and other interests and shareholders’ fundsMinority interests – equity 156 134Called up share capital 36 1,645 1,668Share premium account 5,277 5,149Capital redemption reserve 262 232Other capital reserve 617 617Revaluation reserve 24 30Profit and loss account 7,380 6,789Shareholders’ funds – equity 38 15,205 14,485
15,361 14,619
395,782 348,442 Retail life-fund liabilities to policyholders 25 7,284 8,170
Total liabilities and shareholders’ funds 403,066 356,612
2002 2001Note £m £m
Memorandum items 45Contingent liabilities:Acceptances and endorsements 2,589 2,460Guarantees and assets pledged as collateral security 16,043 14,826 Other contingent liabilities 7,914 7,313
26,546 24,599
Commitments – standby facilities, credit lines and other 101,378 99,917

140 Barclays PLC Annual Report 2002
Consolidated accounts Barclays PLCConsolidated statement of changes in reserves
Consolidated statement of changes in reservesFor the year ended 31st December 2002
2002 2001 2000restated restated
£m £m £m
Share premium accountAt beginning of year 5,149 4,950 1,583Premium arising on shares issued 128 199 3,367
At end of year 5,277 5,149 4,950
Capital redemption reserveAt beginning of year 232 227 207Repurchase of ordinary shares 30 5 20
At end of year 262 232 227
Other capital reserveAt beginning of year 617 469 320Repurchase of preference shares – 148 149
At end of year 617 617 469
Revaluation reserveAt beginning of year 30 35 37 Exchange rate translation differences – (1) (2)Released on transaction with third parties (6) – –Other items – (4) –
At end of year 24 30 35
Profit and loss accountAt beginning of year 6,812 5,844 4,841Prior year adjustment (23) (4) 10At beginning of year as restated 6,789 5,840 4,851
Profit retained 1,024 1,336 1,518 Exchange rate translation differences (61) 4 19Repurchase of ordinary shares (516) (96) (291)Transfer to capital redemption reserve (30) (5) (20)Goodwill written back on disposals 10 – –Shares issued to employee trusts (see below) (48) (107) (114)Transfer to other capital reserve – (148) (149)Gain arising from transaction with third parties 212 – –Other items – (35) 26
At end of year 7,380 6,789 5,840
Total reserves 13,560 12,817 11,521
The Group operates in a number of countries subject to regulations under which a local subsidiary undertaking has to maintaina minimum level of capital. The current policy of the Group is that local capital requirements are met, as far as possible, by theretention of profit. Certain countries operate exchange control regulations which limit the amount of dividends that can beremitted to non-resident shareholders. It is not possible to determine the amount of profit retained and other reserves that isrestricted by these regulations, but the net profit retained of overseas subsidiaries, associated undertakings and joint ventures at31st December 2002 totalled £1,038m (2001: £1,190m, 2000: £965m). If such overseas reserves were to be remitted, other taxliabilities, which have not been provided for in the accounts, might arise.
Goodwill amounting to £205m (2001: £215m, 2000: £215m) has been charged directly against reserves in prior years in respectof acquisitions. This amount is net of any goodwill attributable to subsidiary undertakings disposed of prior to the balance sheetdate.
In 1998, the Group established a Qualifying Employee Share Ownership Trust (QUEST) for the purposes of delivering shares onthe exercise of options under the SAYE. During 2002 the Group received from the trustees of the QUEST £122m (2001: £195m,2000: £183m) on the issue of shares in respect of the exercise of options awarded under SAYE. Of the amount received from the trustees, employees paid £76m (2001: £90m, 2000: £69m) and the balance of £46m (2001: £105m, 2000: £114m) comprisedcontribution to the QUEST from Group Companies. Additionally, the Barclays Group (PSP & ESOS) Employee Share OwnershipTrust (ESOT) is used to facilitate the provision of Barclays PLC shares to participants exercising rollover options under theWoolwich plc 1998 Executive Share Option Plan (WESOP). During 2002, the Group received from the trustees of this trust £8m(2001: £6m and 2000: £nil) on the issue of shares in respect of the exercise of options awarded under WESOP. Of the amountreceived from the trustees, employees paid £6m (2001: £4m and 2000: £nil) and the balance of £2m (2001: £2m and 2000: £nil)comprised contribution to the trust from Group Companies.
Accumulated exchange rate translation differences included in reserves are £539m debit (2001: £478m, 2000: £481m both debit).

141Barclays PLC Annual Report 2002
Consolidated accounts Barclays PLCConsolidated cash flow statement
Consolidated cash flow statementFor the year ended 31st December 2002
2002 2001 2000restated restated
Note £m £m £m £m £m £m
Net cash inflow from operating activities 50 7,391 3,799 8,486Dividends received from joint ventures and associated undertakings 1 3 1Returns on investments and servicing of finance:Interest paid on loan capital and othersubordinated liabilities (607) (598) (370)Preference dividends paid by subsidiary undertaking – (5) (24)Dividends paid to minority shareholders (23) (17) (10)Net cash outflow from returns oninvestment and servicing of finance (630) (620) (404)Tax paid (828) (1,004) (636)Capital expenditure and financial investment:Capital expenditure (301) (351) (365)Sale of property and equipment 289 152 112Purchase of investment securities (28,128) (20,173) (14,490)Redemption of investment securities 10,247 5,704 5,666Sale of investment securities 11,137 13,338 4,115Net cash outflow from capital expenditure and financial investment (6,756) (1,330) (4,962)Acquisitions and disposalsNet cash outflow from formation of FirstCaribbean International Bank Ltd 51 (160) – –Acquisition of Group undertakings 54 (451) (36) (2,421)Sale of associated undertakings – – 13Sale of other Group undertakings 51 (1) 42 307Net cash (outflow)/inflow fromacquisitions and disposals (612) 6 (2,101)Equity dividend paid (1,146) (1,014) (779)
Net cash outflow before financing (2,580) (160) (395)Financing: 52Issue of loan capital and other subordinated liabilities (net of expenses) 2,173 3,019 2,211Redemption/repurchase of loan capital and other subordinated liabilities (376) (715) (212)Repurchase of ordinary shares (546) (101) (311)Issue of ordinary shares (net of contribution to the QUEST) 87 103 81Redemption of preference shares – (148) (149)Issue of shares to minority interest 35 –Net cash inflow from financing 1,373 2,158 1,620
(Decrease)/Increase in cash 53 (1,207) 1,998 1,225

142 Barclays PLC Annual Report 2002
Parent company accounts2002 2001 2000
restated restatedProfit and loss account and changes in reserves for the year ended 31st December £m £m £m
Interest income 6 5 4Operating expenses:Management charge from subsidiary undertaking (6) (5) (4)
Operating profit – – –Dividends from subsidiary undertaking 1,798 1,317 1,352
Profit on ordinary activities before tax 1,798 1,317 1,352Tax on profit on ordinary activities – – –
Profit on ordinary activities after tax 1,798 1,317 1,352Dividends (1,206) (1,110) (927)
Profit retained by Barclays PLC 592 207 425Profit retained by subsidiary undertakings 443 1,143 1,105Loss retained by associated undertakings and joint ventures (11) (14) (12)
Profit retained for the financial year 1,024 1,336 1,518Premium arising on shares issued 128 199 3,367Reduction in reserves arising from repurchase of shares (516) (96) (291)Shares issued to the QUEST in relation to share option schemes for staff (46) (105) (114)Other movements in investment in Barclays Bank PLC 153 (38) 43Profit and loss account and other reserves brought forward 12,817 11,521 6,998
Profit and loss account and other reserves carried forward 13,560 12,817 11,521
2002 2001restated
Balance sheet as at 31st December Note £m £m
Fixed assetsInvestment in Barclays Bank PLC 39 15,205 14,485
Current assetsAmounts falling due within one year:Due from subsidiary undertaking 788 728
788 728Current liabilitiesAmounts falling due within one year – dividend (788) (728)
Net current assets – –
Assets less current liabilities 15,205 14,485
Capital and reservesCalled up share capital 36 1,645 1,668Share premium account 5,277 5,149Capital redemption reserve 262 232 Revaluation reserve 7,140 6,555 Profit and loss account 881 881
Shareholders’ funds – equity 38 15,205 14,485
Prior year shareholders’ funds has been restated for a reduction of £23m in 2001 (2000: £4m) arising from changes in accounting policy as described on pages 133 and 134.
All results arise from continuing operations. For each of the years reported above, there was no material difference between profit before tax and profit retained and profit on a modified historical cost basis.
Sir Peter Middleton GCB Chairman
Matthew Barrett Group Chief Executive
John Varley Group Finance Director
Consolidated accounts Barclays PLCParent company accounts

143Barclays PLC Annual Report 2002
Notes to the accountsFor the year ended 31st December 2002
1 Profit on repurchase of loan capitalIn 2000, $17m of undated loan capital was repurchased at a discount of £2m.
2 Dealing profits2002 2001 2000
£m £m £m
Rates related business 876 823 635 Credit related business (43) 188 42
833 1,011 677
Dealing profits include the profits and losses arising both on the purchase and sale of trading instruments and from therevaluation to market value, together with the interest income earned from these instruments and the related funding cost.
Of the total dealing profit, £325m was earned on securities (2001: £345m, 2000: £229m).
Rates related business includes sales and trading relating to government bonds, money markets, foreign exchange, commoditiesand their related derivative instruments. Credit related business includes origination, sales and trading relating to loans,securitised assets, corporate bonds and their related derivative instruments, equity derivatives and private equity investment.
3 Other operating income2002 2001 2000
restated restated£m £m £m
Dividend income from equity shares 7 8 14 Profits on disposal of investment securities 58 37 45 (Loss)/Income from the long-term assurance business (51) 127 114Property rentals 20 30 22 Premium income on insurance underwriting 178 158 126 Other income 152 68 32
364 428 353
4 Administrative expenses – staff costs2002 2001 2000
£m £m £m
Salaries and accrued incentive payments 3,159 3,149 2,655 Social security costs 240 243 178 Pension costs (27) (17) (31) Post-retirement health care 15 – 1 Other staff costs 368 339 416
3,755 3,714 3,219
Staff costs reported above for 2002 include £124m (2001: £114m, 2000: £171m) of costs relating to staff reductions andrelocations under previous restructuring plans.
The following amounts, relating to the administration staff, (2001 and 2000 additionally the regulated sales force of BarclaysFinancial Management Limited), including temporary staff whose remuneration is reflected in the valuation of the long-termassurance fund, are not included in staff costs reported above:
2002 2001 2000£m £m £m
Salaries and accrued incentive payments 12 47 67 Social security costs 1 5 7 Other staff costs – 18 27
13 70 101
Average number of employeesThe average number of persons employed by the Group worldwide during the year, excluding agency staff, was 77,200(2001: 77,100, 2000: 73,000). All staff fall within a single structure. The average number of administration staff (2001 and 2000additionally the regulated sales force of Barclays Financial Management Limited), whose remuneration is reflected in thevaluation of the long-term assurance fund, was 370 (2001: 1,600, 2000: 2,100).

144 Barclays PLC Annual Report 2002
Notes to the accountsFor the year ended 31st December 2002
5 Pensions, post-retirement benefits, and other staff costsPensionsThe UK Fund (UKRF) comprises three sections:
The 1964 Pension SchemeMost employees recruited before July 1997 are members of this non-contributory defined benefit scheme. Pensions arecalculated by reference to service and pensionable salary and are normally subject to a deduction from State pension age.
The Retirement Investment Scheme (RIS)A defined contribution plan for most new joiners. Between 5.5% and 13.5% of pensionable pay is credited to members’retirement accounts in addition to contributions paid by the members themselves; precise amounts are dependent upon eachmember’s age and contribution decision.
The Pension Investment Plan (PIP)A defined contribution plan created from 1st July 2001 to provide benefits for certain employees of Barclays Capital. 10% of payis credited to members’ retirement accounts.
In addition, the costs of ill-health retirements and death in service benefits are generally borne by the UK Fund for each of thethree sections.
Formal actuarial valuations of the UK Fund are carried out triennially by a professionally qualified independent actuary. The mostrecent valuation was conducted as at 30th September 2001 and expresses the assets and liabilities at market values. However, in light of changing market conditions and changes in the investment strategy of the scheme, which resulted in a significantreduction in the equity holding of the UK Fund, an interim actuarial review was conducted as at 30th September 2002. Themarket value of the assets at the interim review date was £9,553m and the valuation revealed a surplus of assets over theaccrued liabilities of 4% after allowing for expected future salary increases. This surplus was estimated to be sufficient to allowthe Bank to continue its contribution holiday, which commenced in January 1998, for all sections until 2004, and a furtherinterim review will be conducted as at 30th September 2003. Protected Rights contributions in respect of RIS and PIP membershave been paid as required by the contracting-out regulations. The principal financial assumptions underlying the 2002 interimactuarial review were:
Price inflation 2.5% Earnings growth 4.0%Dividend growth 4.0% Return on new investments 6.5%Pension increases 2.5%
In calculating the surplus of assets over accrued liabilities, assets were taken at their market value and a discount rate of 6.8%p.a. at 30th September 2002 was used to value the 1964 Pension Scheme accrued liabilities. This rate of 6.8% was derived bytaking a weighted average of the market yields on the day, weighting by reference to the UK Fund’s strategic asset allocation; for the equity component, allowance was made for future dividend growth.
It is the Bank’s policy to allow for the results of a new valuation in its pension charge in the year following the valuation date.Therefore, the figures shown below reflect the 2001 formal actuarial valuation, with the pensions charge in the accounts beingreduced over the remaining service lives of the members to take account of the surplus.
Without the benefit of the surplus, the 1964 Pension Scheme charge, based on the 2001 valuation, would be 17.4% of pensionablesalaries (on the projected unit method) assessed using the assumption regarding return on new investments, while contributionsto the RIS and PIP would equal the contributions described above plus the costs of ill-health and death in service benefits.

145Barclays PLC Annual Report 2002
Notes to the accountsFor the year ended 31st December 2002
5 Pensions, post-retirement benefits, profit sharing and other staff costs (continued)
2002 2001 2000 £m £m £m
Pensions costs vary from regular costs as follows (UKRF):Regular costs 197 181 161 Variation from regular costs (including interest) (266) (250) (226)
(69) (69) (65)
Of the total regular cost in 2002 of £197m, £146m relates to the 1964 Pension Scheme, £32m to the RIS and £19m to the PIP.
The approach taken to calculating the pensions charge in the accounts for the 1964 Pension Scheme is to take assets andliabilities at market values with effect from 1st January 2002. The assumptions used to derive the 1964 Pension Scheme pensionscharge differ from those shown above in that returns on new investments are assumed to be 7.5% p.a. and dividend growth isassumed to be 4.5% p.a. A discount rate at 1st January 2002 of 6.7% was used to value the accrued liabilities, derived asexplained above. This resulted in an accounting surplus of assets over the accrued liabilities of 23%, allowing for expected futuresalary increases. Spreading this surplus using the straight line method over the future remaining service lives of the activemembers would be sufficient to produce a variation from regular cost of £266m including interest.
Total pension costs of the Group are summarised as follows:
2002 2001 2000 £m £m £m
The Barclays Bank UK Retirement Fund (69) (69) (65)Other UK pension schemes 20 24 9Overseas pension schemes 22 28 25
(27) (17) (31)
The Bank also operates a defined benefit scheme for overseas employees of the Bank similar in design to the 1964 PensionScheme, the Barclays Bank (1951) Pension Fund, which had a formal valuation as at 30th September 2002. The creation ofFirstCaribbean affected a significant proportion of the active members of this fund as at 11th October 2002 so the pensioncharge for this fund allows for the results of this valuation for the last three months of 2002. The pension charge has beenassessed using consistent assumptions to those used for the 1964 Pension Scheme and a credit of £3m (2001: £3m, 2000: £9m) is included in Other UK pension schemes.
Note 62 contains the disclosures required by FRS 17. Note 63 provides additional disclosures required by US Statement ofFinancial Accounting Standards No. 132.
Post-retirement benefitsSome 11,000 UK and US pensioners are provided with private health care on similar terms to current employees. In addition, 5,900members of staff and a further 1,000 Barclays Bank PLC pensioners who have retired since 30th June 1999 and have satisfied thequalification criteria may also become eligible for this benefit, which is being progressively withdrawn for these pensioners overthe period to 30th June 2008.
Other staff costsOther staff costs comprise medical healthcare costs, social welfare taxes, staff transfer costs, redundancy payments and othersundry employee costs.

146 Barclays PLC Annual Report 2002
Notes to the accountsFor the year ended 31st December 2002
6 Administrative expenses – other2002 2001 2000
Property and equipment expenses £m £m £m
Hire of equipment 12 16 20Property rentals 180 183 157Other property and equipment expenses 793 775 641Other administrative expenses 1,327 1,329 1,149
2,312 2,303 1,967
Other property and equipment expenses include £27m of exceptional costs relating to the restructuring in 2002 (2001: £38m,2000: £27m). Other administration expenses include £36m of exceptional costs relating to the restructuring in 2002 (2001: £19m, 2000: £34m).
Fees paid to the Group’s main auditors, PricewaterhouseCoopers LLP and its worldwide associates, were as follows:
2002 2001 2000£m £m £m
Audit RelatedGroup statutory 5 5 5Regulatory 4 6 8Accounting and Audit related 5 6 7
14 17 20
Non-AuditTransaction Services 3 3 2Taxation Services 5 5 4Other – 1 –
Non-audit fees 8 9 6
Total fees 22 26 26
The figures shown in the above table include amounts paid in the United Kingdom to both PricewaterhouseCoopers andPricewaterhouseCoopers LLP. Audit related fees include all amounts paid to the Group’s auditors in their capacity as such.
In addition to the fees included in the above table, amounts paid to PwC Consulting, the management consultancy arm ofPricewaterhouseCoopers, amounted to £6m up to its sale to the IBM Corporation on 1st October 2002 (2001: £12m, 2000: £6m).
7 Depreciation and amortisation2002 2001 2000
£m £m £m
Property depreciation 93 105 85 Equipment depreciation 198 194 166 Goodwill amortisation 254 229 51 Loss on sale of equipment 12 9 4
557 537 306
8 Provisions for contingent liabilities and commitments2002 2001 2000
£m £m £m
1 1 (1)

147Barclays PLC Annual Report 2002
Notes to the accountsFor the year ended 31st December 2002
9 (Loss)/profit on disposal/termination of Group undertakings2002 2001 2000
£m £m £m
Net profit/(loss) on disposal of Group undertakings 8 (4) 214Loss on termination of Group activities (11) – –
(3) (4) 214
The net profit on disposal of Group undertakings comprised profits on disposal of £14m (2001: £15m, 2000: £222m) and losseson disposal of £6m (2001: £19m, 2000: £8m).
Goodwill previously written off to reserves on disposals amounted to £10m (2001: £nil, 2000: £nil). No tax credit is attributable to the losses on disposal in 2002, 2001 and 2000 and no tax was payable on the 2002, 2001 and 2000 gains.
Up to the date of sale, the businesses sold in 2002 contributed £3m profit to Group profit before tax (2001: £8m loss, 2000: £20m loss).
10 Tax The charge for tax assumes an effective UK corporation tax rate of 30% (2001: 30%, 2000: 30%) and comprises:
2002 2001 2000restated restated
£m £m £m
Current tax:UK 806 792 689Overseas 184 149 219
Total current tax 990 941 908
Deferred tax (credit)/charge:UK (32) 13 1 Overseas (2) (9) (7)
Total deferred tax (34) 4 (6)
Associated undertakings and joint ventures, including overseas tax of (£1m) (2001: (£2m), 2000: (£1m)) (1) (2) (1)
Total charge 955 943 901
Analysis of deferred tax (credit)/charge:Leasing transactions 57 24 13Short-term and other timing differences (91) (20) (19)
(34) 4 (6)
Current tax includes a credit of £38m (2001: £11m charge, 2000: £32m charge) on the shareholders’ interest in the long-termassurance fund. Included within current tax are prior year adjustments to UK of (£12m) (2001: £26m, 2000: 4m) and overseas of £3m (2001: £2m, 2000: £8m).
Available overseas tax credits of £221m (2001: £232m, 2000: £194m) have been applied to reduce UK tax in accordance with UK legislation.

148 Barclays PLC Annual Report 2002
Notes to the accountsFor the year ended 31st December 2002
10 Tax (continued)
The tax for the year is lower (2001 and 2000 lower) than the standard rate of corporation tax in the UK (30%) (2001 and 200030%). The differences are set out below:
2002 2001 2000restated restated
£m £m £m
Tax charge at average UK corporation tax rate of 30% (2001: 30%, 2000: 30%) 961 1,027 1,017Prior year adjustments (9) 28 12Effect of change in non-allowable general provisions (2) (11) 24Effect of non-allowable property write-downs and depreciation 12 17 6Net effect of differing tax rates overseas (70) (65) (43)Net effect of overseas losses not available for relief in the UK (40) (17) (5)Other non-allowable expenses 8 (21) 16Gains covered by capital losses brought forward (3) (49) (53)Goodwill 69 67 11Other items 63 (37) (78)
Current tax charge 989 939 907Deferred tax charge (34) 4 (6)
Overall tax charge 955 943 901
Effective tax rate % 29.8 27.5 26.6
The charge for the year assumes a UK corporation tax rate of 30% for the year 2002 (2001: 30%, 2000: 30%). The effective rateof tax is 29.8% (2001: 27.5%, 2000: 26.6%). The increase in the rate from last year is primarily due to the absence of tax-freedisposals, coupled with a reduction in the payments made to the qualifying employee trust reflecting the reduced share priceand a reduction in the benefit generated by the utilisation of overseas losses.
11 Minority and other interests – Barclays PLCEquity minority interests in the balance sheet represent the interests of third parties in the equity shares of the Group subsidiaryundertakings.
12 Dividends – Barclays PLC2002 2001 2000
Dividends per ordinary share £m £m £m
Interim 419 383 295 Final 787 727 632
1,206 1,110 927
(pence per share)Interim 6.35 5.750 5.0Final 12.00 10.875 9.5
18.35 16.625 14.5
Dividends amounting to £0.2m (2001: £0.2m, 2000: £0.2m) are payable on the staff shares, which carry a fixed dividend of 20%per annum unless no dividend is paid for the year on the ordinary shares.

149Barclays PLC Annual Report 2002
Notes to the accountsFor the year ended 31st December 2002
13 Earnings per 25p ordinary share – Barclays PLC2002 2001 2000
restated restated£m £m £m
Basic and diluted earnings 2,230 2,446 2,445
Basic weighted average number of shares 6,626 6,651 6,055Add potential ordinary shares 47 67 62
Diluted weighted average number of shares 6,673 6,718 6,117
Basic and diluted earnings are based upon the results after deducting tax, profit attributable to minority interests and dividendson staff shares.
Certain shares held by incentive plans have been excluded from the calculation of earnings per share in line with UITF 13, on thegrounds that the trustee has waived all dividend and voting rights.
The recognition of potential ordinary shares for the purposes of calculating diluted earnings per share is in accordance with FRS14 ‘Earnings per Share’.
See note 63 for earnings per 25p ordinary share calculated in accordance with the accounting principles generally accepted inthe United States.
14 Treasury bills and other eligible bills2002 2001
£m £m
Treasury bills 5,389 5,500Other eligible bills 2,256 1,917
7,645 7,417
Treasury bills and other eligible bills comprise:Banking business 4,759 5,723Trading business 2,886 1,694
7,645 7,417
Treasury bills and other eligible bills are mainly short term in maturity with a book value not materially different from market value.
The total amount of treasury bills and other eligible bills included above, which are subject to sale and repurchase agreements,was £10m at 31st December 2002 (2001: £11m).

150 Barclays PLC Annual Report 2002
Notes to the accountsFor the year ended 31st December 2002
15 Loans and advances to banks2002 2001
£m £m
Repayableon demand 1,973 4,117not more than three months 44,124 35,993over three months but not more than one year 4,286 3,597 over one year but not more than five years 7,566 3,915over five years 307 319
58,256 47,941Less:Provisions (82) (52)
58,174 47,889
2002 2001£m £m
By geographical area Banking business:UK 11,510 7,116Other European Union 2,154 2,278United States 256 930Rest of the World 1,531 1,924
Total banking business 15,451 12,248Total trading business 42,805 35,693
58,256 47,941
At 31st December 2002, there were loans and advances to banks of £9m (2001: £nil) outstanding from associated undertakingsand joint ventures.
The Group is required to maintain balances with central banks and other regulatory authorities and these amounted to £565mat 31st December 2002 (2001: £711m).
Additional analyses are provided within the loans and advances, provisions for bad and doubtful debts and potential credit risklendings sections on pages 59 to 73.
The geographic analysis of the banking business is based on the location of the office from which the lendings are made. Thetrading business, which is largely carried out in the UK, the United States and Japan, is more international in nature and has notbeen analysed geographically. It primarily constitutes settlement and reverse repo balances.
Provisions include specific provisions of £77m (2001: £11m) and general provisions of £5m (2001: £41m).

151Barclays PLC Annual Report 2002
Notes to the accountsFor the year ended 31st December 2002
16 Loans and advances to customers2002 2001
£m £m £m £m
Repayableon demand 14,460 15,185 not more than three months 60,590 48,056 over three months but not more than one year 17,915 21,883over one year but not more than five years 31,262 27,257 over five years 81,165 70,851
205,392 183,232Less:Provisions (2,916) (2,664)Interest in suspense (78) (75)
(2,994) (2,739)
202,398 180,493
By geographical areaBanking business:UK 135,900 124,254Other European Union 12,579 10,708United States 6,138 6,614Rest of the World 5,599 7,416
Total banking business 160,216 148,992Total trading business 45,176 34,240
205,392 183,232
At 31st December 2002, there were loans and advances to customers of £249m (2001: £163m) outstanding from associatedundertakings and joint ventures.
Mortgage incentive costs of £86m (2001: £115m, 2000: £22m) have been charged to net interest income.
Additional analyses are provided within the loans and advances, provisions for bad and doubtful debts and potential credit risk lendings sections on pages 59 to 73.
The geographical analysis of the banking business is based on the location of the office from which the lendings are made. The trading business, which is largely carried out in the UK, the United States and Japan, is more international in nature and has not been analysed geographically. It primarily constitutes settlement and reverse repo balances.
Provisions include specific provisions of £2,184m (2001: £1,960m) and general provisions of £732m (2001: £704m).
Banking business loans and advances to customers include finance lease receivables of £4,389m (2001: £4,433m) which arestated in the balance sheet after deducting £2,993m (2001: £2,318m) of unearned charges and interest. Assets acquired in theyear for letting under finance leases amounted to £401m (2001: £898m).
The following residual values are included in finance lease receivables:
2002 2001£m £m
Recoverable:not more than one year 17 18over one year but not more than two years 4 9over two years but not more than five years 6 8over five years 11 11
38 46
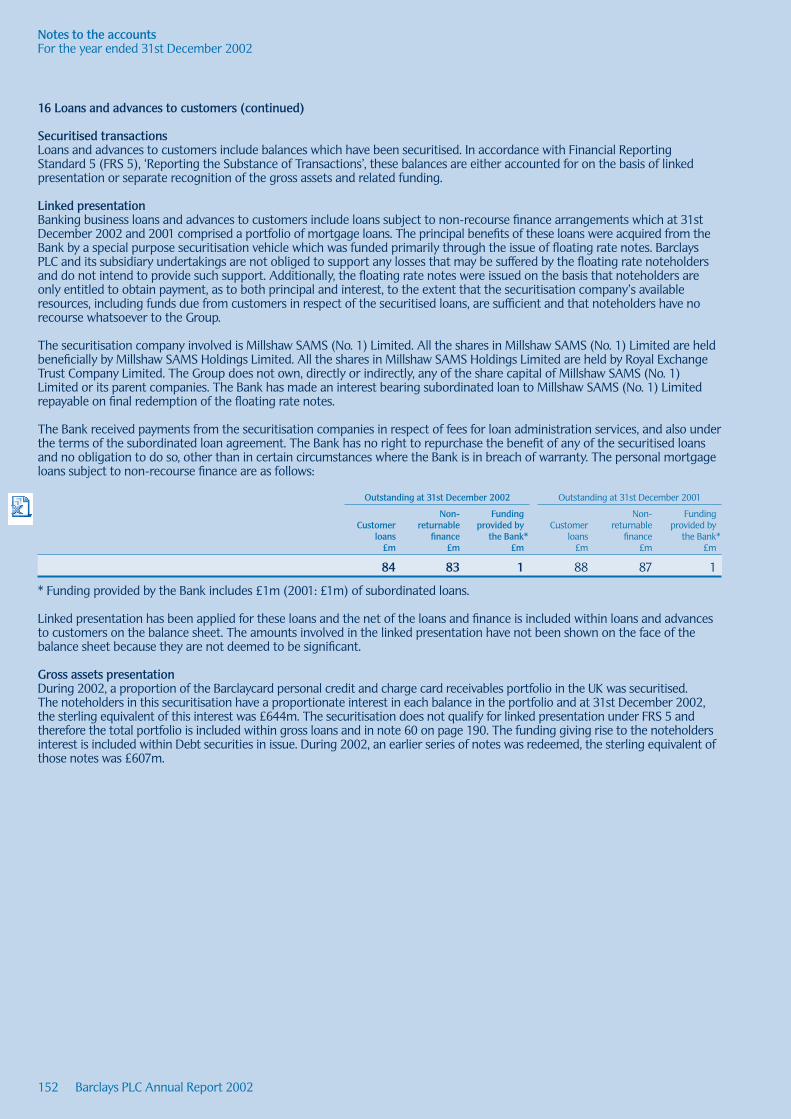
152 Barclays PLC Annual Report 2002
Notes to the accountsFor the year ended 31st December 2002
16 Loans and advances to customers (continued)
Securitised transactionsLoans and advances to customers include balances which have been securitised. In accordance with Financial ReportingStandard 5 (FRS 5), ‘Reporting the Substance of Transactions’, these balances are either accounted for on the basis of linkedpresentation or separate recognition of the gross assets and related funding.
Linked presentation Banking business loans and advances to customers include loans subject to non-recourse finance arrangements which at 31stDecember 2002 and 2001 comprised a portfolio of mortgage loans. The principal benefits of these loans were acquired from theBank by a special purpose securitisation vehicle which was funded primarily through the issue of floating rate notes. BarclaysPLC and its subsidiary undertakings are not obliged to support any losses that may be suffered by the floating rate noteholdersand do not intend to provide such support. Additionally, the floating rate notes were issued on the basis that noteholders areonly entitled to obtain payment, as to both principal and interest, to the extent that the securitisation company’s availableresources, including funds due from customers in respect of the securitised loans, are sufficient and that noteholders have norecourse whatsoever to the Group.
The securitisation company involved is Millshaw SAMS (No. 1) Limited. All the shares in Millshaw SAMS (No. 1) Limited are heldbeneficially by Millshaw SAMS Holdings Limited. All the shares in Millshaw SAMS Holdings Limited are held by Royal ExchangeTrust Company Limited. The Group does not own, directly or indirectly, any of the share capital of Millshaw SAMS (No. 1)Limited or its parent companies. The Bank has made an interest bearing subordinated loan to Millshaw SAMS (No. 1) Limitedrepayable on final redemption of the floating rate notes.
The Bank received payments from the securitisation companies in respect of fees for loan administration services, and also underthe terms of the subordinated loan agreement. The Bank has no right to repurchase the benefit of any of the securitised loansand no obligation to do so, other than in certain circumstances where the Bank is in breach of warranty. The personal mortgageloans subject to non-recourse finance are as follows:
Outstanding at 31st December 2002 Outstanding at 31st December 2001
Non- Funding Non- FundingCustomer returnable provided by Customer returnable provided by
loans finance the Bank* loans finance the Bank*£m £m £m £m £m £m
84 83 1 88 87 1
* Funding provided by the Bank includes £1m (2001: £1m) of subordinated loans.
Linked presentation has been applied for these loans and the net of the loans and finance is included within loans and advancesto customers on the balance sheet. The amounts involved in the linked presentation have not been shown on the face of thebalance sheet because they are not deemed to be significant.
Gross assets presentationDuring 2002, a proportion of the Barclaycard personal credit and charge card receivables portfolio in the UK was securitised. The noteholders in this securitisation have a proportionate interest in each balance in the portfolio and at 31st December 2002,the sterling equivalent of this interest was £644m. The securitisation does not qualify for linked presentation under FRS 5 andtherefore the total portfolio is included within gross loans and in note 60 on page 190. The funding giving rise to the noteholdersinterest is included within Debt securities in issue. During 2002, an earlier series of notes was redeemed, the sterling equivalent ofthose notes was £607m.

153Barclays PLC Annual Report 2002
Notes to the accountsFor the year ended 31st December 2002
17 Provisions for bad and doubtful debts2002 2001
Specific General Total Specific General TotalMovements in provisions for bad and doubtful debts £m £m £m £m £m £m
Provisions at beginning of year 1,971 745 2,716 1,593 760 2,353Acquisitions and disposals (25) 14 (11) 50 (4) 46Exchange and other adjustments (57) (20) (77) (6) 5 (1)
1,889 739 2,628 1,637 761 2,398Provision for the year 1,486 (2) 1,484 1,165 (16) 1,149Amounts written off, net of recoveries of £106m (2001: £142m) (1,114) – (1,114) (831) – (831)
Provisions at end of year 2,261 737 2,998 1,971 745 2,716
2002 2001Provisions at 31st December £m £m
Specific provisions UK 1,790 1,605Other European Union 84 89United States 257 89Rest of the World 130 188
2,261 1,971General provisions 737 745
2,998 2,716
2002 2001Non performing advances £m £m
Loans and advances on which interest is in suspense or is not being applied 3,153 2,484Specific provisions (1,634) (1,457)
1,519 1,027

Notes to the accountsFor the year ended 31st December 2002
154 Barclays PLC Annual Report 2002
18 Debt securities2002 2001
Gross Gross Gross Gross Balance unrealised unrealised Balance unrealised unrealised
Sheet gains losses Valuation Sheet gains losses ValuationInvestment securities: £m £m £m £m £m £m £m £m
UK government 1,465 31 – 1,496 1,500 – (1) 1,499 other government 18,963 601 – 19,564 15,152 205 (27) 15,330 other public bodies 17 – – 17 3 – – 3mortgage-backed securities 4,693 11 – 4,704 244 11 – 255corporate issuers 12,601 81 (16) 12,666 12,977 17 (7) 12,987other issuers 2,529 1 – 2,530 1,168 2 – 1,170
40,268 725 (16) 40,977 31,044 235 (35) 31,244Other debt securities:UK government 1,025 – – 1,025 1,284 – – 1,284 other government 25,385 25,385 15,659 – – 15,659 other public bodies 2,438 – – 2,438 1,091 – – 1,091bank and building society certificatesof deposit 12,027 – – 12,027 15,376 – – 15,376other issuers 13,086 13,086 14,470 – – 14,470
94,229 725 (16) 94,938 78,924 235 (35) 79,124
2002
BalanceCost Provisions Sheet
Movements in investment securities £m £m £m
At beginning of year 31,084 (40) 31,044Exchange and other adjustments (153) 3 (150)Acquisitions and transfers 30,726 – 30,726Redemption of Investment securities (10,247) – (10,247)Sale of Investment securities (11,002) – (11,002)Provisions raised – (18) (18)Amortisation of discounts and premiums (85) – (85)
At end of year 40,323 (55) 40,268
The total value of debt securities at 31st December 2002 includes securities which are subject to sale and repurchase agreements of£5,839m (2001: £3,446m), and unamortised net discount on investment securities of £2m (2001: premium of £24m). The valueof securities due within one year at 31st December 2002 was £22,281m (2001: £23,478m). At 31st December 2002, there weredebt securities of £1,112m (2001: £nil) issued by associated undertakings or joint ventures.
During 1999, the Group securitised a portfolio of investment debt securities. Linked presentation under FRS 5 is not availableand therefore the portfolio with a sterling equivalent book value of £318m at 31st December 2002 (2001: £605m) is includedwithin the total above. The funding from this transaction is reported in Other liabilities (note 30 on page 161).
During 2002, the Group purchased a portfolio of investment debt securities, a large portion of which were subject to limitedrecourse financing. Linked presentation under FRS 5 is not available and therefore the portfolio with a sterling equivalent bookvalue of £457m is included in the total above, with the financing reported in Deposits by banks. At 31st December 2002, theGroup’s net exposure to these investment debt securities, after taking into account the limited recourse financing, was £97m.

Notes to the accountsFor the year ended 31st December 2002
155Barclays PLC Annual Report 2002
18 Debt securities (continued)
Barclays PLC holds, as an investment, British government stock with a book value of £0.1m (2001: £0.1m). As part of its normalmarket-making activities, Barclays Capital holds positions in Barclays Bank PLC’s loan capital.
Gross gains of £5m (2001: £37m, 2000: £6m) and gross losses of £37m (2001: £13m, 2000: £9m) were realised on the sale andredemption of investment securities.
The cost of Other debt securities is not available and would be unreasonably expensive to obtain.
Of the total debt securities disclosed above, £56,290m (2001: £56,814m) were listed on a recognised exchange. These listed debtsecurities had a market value of £56,991m (2001: £57,039m).
Under US GAAP all Investment securities are classified as ‘available for sale’ unless the Group has a clear intention and ability tohold them to maturity. Other debt securities are classified as ‘trading securities’.
See page 119 of the Financial review for the valuation and maturity analysis of Investment securities.
19 Equity shares2002 2001
Balance Balance Sheet Valuation Sheet Valuation
£m £m £m £m
Investment securities 505 509 194 215Other securities 2,628 2,628 2,924 2,924
3,133 3,137 3,118 3,139
2002
BalanceCost Provisions Sheet
Movements in Investment securities £m £m £m
At beginning of year 199 (5) 194Acquisitions and transfers 406 – 406Sale of Investment securities (89) – (89)Provisions raised – (6) (6)
At end of year 516 (11) 505
Gross unrealised gains on equity shares amounted to £14m (2001: £21m). Gross unrealised losses amounted to £10m (2001: £nil).
Gross gains of £91m (2001: £68m, 2000: £54m) and gross losses of £12m (2001: £8m, 2000: £1m) were realised on the sale ofInvestment securities.
The cost of Other securities is not available and would be unreasonably expensive to obtain.
As part of its normal operations, the equity derivatives business of Barclays Capital holds shares in Barclays PLC.
Of the total equity securities disclosed above, £2,273m (2001: £2,963m) were listed on a recognised exchange. These listedequity securities had a market value of £2,277m (2001: £2,979m).

Notes to the accountsFor the year ended 31st December 2002
156 Barclays PLC Annual Report 2002
20 Interests in associated undertakings and joint venturesAssociates Joint Ventures
2002 2001 2002 2001Share of net assets £m £m £m £m
At beginning of year 32 60 56 62Exchange and other adjustments (2) (30) – (3)New investments/acquisitions 373 13 7 3Disposals – – – (3)Loss retained (6) (11) (5) (3)
At end of year 397 32 58 56
Interest in FirstCaribbean International Bank– share of gross assets 2,671 –– share of gross liabilities (2,444) –– goodwill 130 –
Other associates – share of net assets 40 32
Total 397 32
Associated undertakings and joint ventures included £357m in respect of banks (2001: £nil). Dividend income from associatedundertakings and joint ventures amounted to £1m (2001: £3m). On an historical cost basis, the Group’s interests in associatedundertakings and joint ventures at 31st December 2002 amounted to £455m (2001: £87m). Of the above interests in associatedundertakings and joint ventures, only FirstCaribbean International Bank is listed on a recognised exchange. FirstCaribbeanInternational Bank is listed on the Barbados, Trinidad and Tobago and Jamaican Stock Exchanges. The Group’s share of the totaloperating income of joint ventures is £17m (2001: £44m, 2000: £8m).
The Group’s share of the total operating income of FirstCaribbean International Bank is £31m.
Included within Barclays share of associates assets is goodwill as follows:
2002 2001Goodwill £m £m
Additions 131 –
Cost at end of year 131 –
Accumulated amortisation
Amortisation charge for year 1 –
At end of year 1 –
Net book value 130 –
The table below provides summarised financial information of associated undertakings and joint ventures, in which the Grouphas an interest (the entities’ entire financial position and results of operations are presented, not Barclays share).
2002
FirstCaribbeanInternational Other Joint
Bank Associates Ventures Total£m £m £m £m
Fixed assets 79 281 360 720Debt and equity securities 564 803 – 1,367Loans to banks and customers 4,386 116 128 4,630Other assets 271 201 31 503
Total assets 5,300 1,401 519 7,220
Deposits from banks and customers 4,718 219 120 5,057Other liabilities 130 801 297 1,228Shareholders’ funds 452 381 102 935
Total liabilities 5,300 1,401 519 7,220
(Loss)/profit before tax (18) 22 (15) (11)Taxation 2 (13) – (11)
(Loss)/profit after tax (16) 9 (15) (22)
The amounts included above are based on accounts made up to 31st December 2002 with the exception of FirstCaribbeanInternational Bank and certain undertakings included within the Other Associates category for which the amounts are based on accounts made up to dates not earlier than three months before the balance sheet date.
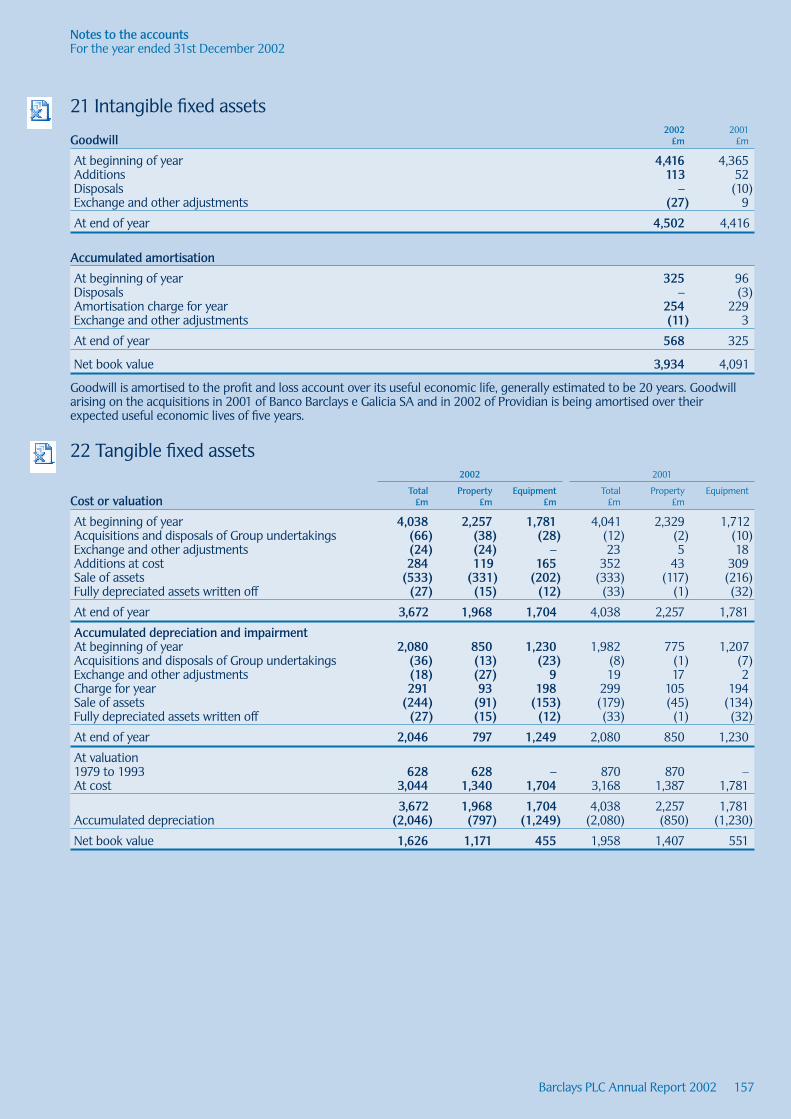
Notes to the accountsFor the year ended 31st December 2002
157Barclays PLC Annual Report 2002
21 Intangible fixed assets2002 2001
Goodwill £m £m
At beginning of year 4,416 4,365Additions 113 52Disposals – (10)Exchange and other adjustments (27) 9
At end of year 4,502 4,416
Accumulated amortisation
At beginning of year 325 96Disposals – (3)Amortisation charge for year 254 229Exchange and other adjustments (11) 3
At end of year 568 325
Net book value 3,934 4,091
Goodwill is amortised to the profit and loss account over its useful economic life, generally estimated to be 20 years. Goodwillarising on the acquisitions in 2001 of Banco Barclays e Galicia SA and in 2002 of Providian is being amortised over theirexpected useful economic lives of five years.
22 Tangible fixed assets2002 2001
Total Property Equipment Total Property EquipmentCost or valuation £m £m £m £m £m
At beginning of year 4,038 2,257 1,781 4,041 2,329 1,712Acquisitions and disposals of Group undertakings (66) (38) (28) (12) (2) (10)Exchange and other adjustments (24) (24) – 23 5 18Additions at cost 284 119 165 352 43 309Sale of assets (533) (331) (202) (333) (117) (216)Fully depreciated assets written off (27) (15) (12) (33) (1) (32)
At end of year 3,672 1,968 1,704 4,038 2,257 1,781
Accumulated depreciation and impairmentAt beginning of year 2,080 850 1,230 1,982 775 1,207Acquisitions and disposals of Group undertakings (36) (13) (23) (8) (1) (7)Exchange and other adjustments (18) (27) 9 19 17 2Charge for year 291 93 198 299 105 194Sale of assets (244) (91) (153) (179) (45) (134)Fully depreciated assets written off (27) (15) (12) (33) (1) (32)
At end of year 2,046 797 1,249 2,080 850 1,230
At valuation1979 to 1993 628 628 – 870 870 –At cost 3,044 1,340 1,704 3,168 1,387 1,781
3,672 1,968 1,704 4,038 2,257 1,781 Accumulated depreciation (2,046) (797) (1,249) (2,080) (850) (1,230)
Net book value 1,626 1,171 455 1,958 1,407 551

158 Barclays PLC Annual Report 2002
Notes to the accountsFor the year ended 31st December 2002
22 Tangible fixed assets (continued)
2002 2001Balance sheet value of property £m £m
Freehold 846 1,126Leasehold over 50 years unexpired 93 108Leasehold up to 50 years unexpired 231 171Assets in the course of construction 1 2
1,171 1,407
Historical cost of propertyAt cost 1,727 1,953Accumulated depreciation and impairment (797) (819)
Net book value 930 1,134
The net book value of property occupied by the Group for its own use was £1,116m at 31st December 2002 (2001: £1,352m).The net book value of property at 31st December 2002 included £194m (2001: £317m) in respect of land.
23 Commitments for capital expenditure not provided in these accountsAt 31st December 2002, commitments for capital expenditure under contract amounted to £1m (2001: £1m).
24 Other assets2002 2001
restated£m £m
Own shares 55 6Balances arising from off-balance sheet financial instruments 13,454 13,730Shareholders’ interest in the long-term assurance fund 867 884London Metal Exchange warrants and other metals trading positions 829 1,236Sundry debtors 1,634 2,330
16,839 18,186
Own shares represent Barclays PLC shares held in employee benefit trusts where the Group retains the risks and rewards relatedto those shares.
25 Retail long-term assurance fundsThe (decrease)/increase in the shareholders’ interest in the retail long-term assurance funds is calculated as follows:
2002 2001restated
£m £m
Value of the shareholders’ interest at beginning of year 884 816Transfer to shareholders’ account – (40)
884 776
Value of the shareholders’ interest at end of year 867 884
(Decrease)/increase in value for the year after tax (17) 108
(Decrease)/increase in value before tax (55) 119
In addition to the decrease (2001 an increase) in the shareholders’ interest in the retail long-term assurance funds detailedabove, £4m (2001: £8m) of other income from the long-term assurance business has been recognised in the year.

159Barclays PLC Annual Report 2002
Notes to the accountsFor the year ended 31st December 2002
25 Long-term assurance funds (continued)
The principal economic assumptions used in calculating the value of the shareholders’ interest were as follows:
2002 2001% %
Risk discount rate (net of tax) 7.0 9.0Gross UK equities returns for unit linked business (net of irrecoverable tax credit) 6.8 7.5Gross UK equities dividend yield for unit linked business (net of irrecoverable tax credit) 2.8 2.2Gross property and overseas equities returns for unit linked business 7.5 8.0Gross fixed interest returns for unit linked business 4.5 5.0Renewal expense inflation (including effect of fixed costs) 4.4 5.25
The retail life-fund assets attributable to policyholders comprise:2002 2001
£m £m
Assets:Investments 7,199 8,129Group undertakings 5 20Other debtors 205 726
7,409 8,875Current liabilities (125) (705)
7,284 8,170
26 Prepayments and accrued income2002 2001
£m £m
Accrued interest and commission 2,586 2,249Prepayments 396 304
2,982 2,553
27 Deposits by banks2002 2001
£m £m
Repayableon demand 7,148 6,633 not more than three months 68,470 49,108 over three months but not more than six months 3,438 3,479over six months but not more than one year 1,397 1,101over one year but not more than two years 371 294over two years but not more than five years 2,196 3,773over five years 4,414 2,992
87,434 67,380
By geographical areaBanking business:UK 34,230 35,027 Other European Union 2,220 1,637United States 6,606 4,187Rest of the World 5,695 4,986
Total banking business 48,751 45,837 Total trading business 38,683 21,543
87,434 67,380
At 31st December there were deposits by banks of £717m (2001: £nil) due to associated undertakings and joint ventures.Deposits by banks are mostly over £50,000.
A further analysis of Deposits by banks is given within the Deposits section on page 118 of the Financial review.

160 Barclays PLC Annual Report 2002
Notes to the accountsFor the year ended 31st December 2002
28 Customer accounts2002 2001
restated£m £m
Repayableon demand 83,731 74,594not more than three months 76,761 77,940 over three months but not more than six months 3,333 3,181over six months but not more than one year 2,669 3,351over one year but not more than two years 2,342 1,016over two years but not more than five years 1,427 3,044over five years 1,235 721
171,498 163,847
By geographical areaBanking business:UK 132,502 123,866Other European Union 5,233 4,822United States 1,166 3,111Rest of the World 5,177 8,064
Total banking business 144,078 139,863Total trading business 27,420 23,984
171,498 163,847
2002 2001£m £m
By typeIn offices in the UK:current and demand accounts – interest free 11,159 11,570current and demand accounts – interest bearing 17,558 19,532savings accounts 45,586 40,218other time deposits – retail 33,687 33,267other time deposits – wholesale 35,029 24,230In offices outside the UK:current and demand accounts – interest free 1,132 2,032current and demand accounts – interest bearing 1,774 2,174savings accounts 459 1,409other time deposits 25,114 29,415
171,498 163,847
At 31st December 2002, there were customer accounts of £189m (2001: £14m) due to associated undertakings and joint ventures.
Deposits in offices in the UK received from non-residents amounted to £19,490m (2001: £11,112m).
Other time deposits in the UK and the United States are mostly over £50,000.
A further analysis of customer accounts is provided within the Deposits section on page 118 of the Financial review.
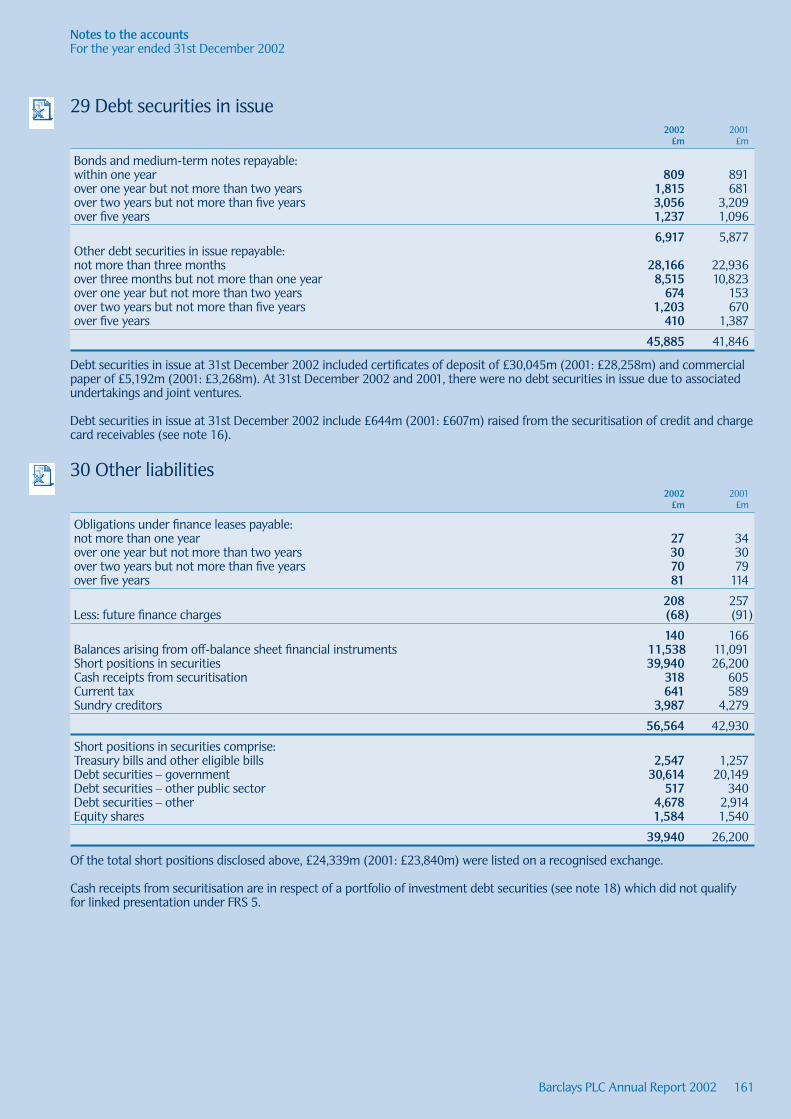
161Barclays PLC Annual Report 2002
Notes to the accountsFor the year ended 31st December 2002
29 Debt securities in issue2002 2001
£m £m
Bonds and medium-term notes repayable:within one year 809 891over one year but not more than two years 1,815 681over two years but not more than five years 3,056 3,209over five years 1,237 1,096
6,917 5,877Other debt securities in issue repayable:not more than three months 28,166 22,936over three months but not more than one year 8,515 10,823over one year but not more than two years 674 153over two years but not more than five years 1,203 670over five years 410 1,387
45,885 41,846
Debt securities in issue at 31st December 2002 included certificates of deposit of £30,045m (2001: £28,258m) and commercialpaper of £5,192m (2001: £3,268m). At 31st December 2002 and 2001, there were no debt securities in issue due to associatedundertakings and joint ventures.
Debt securities in issue at 31st December 2002 include £644m (2001: £607m) raised from the securitisation of credit and chargecard receivables (see note 16).
30 Other liabilities2002 2001
£m £m
Obligations under finance leases payable:not more than one year 27 34over one year but not more than two years 30 30over two years but not more than five years 70 79over five years 81 114
208 257Less: future finance charges (68) (91)
140 166Balances arising from off-balance sheet financial instruments 11,538 11,091Short positions in securities 39,940 26,200Cash receipts from securitisation 318 605Current tax 641 589Sundry creditors 3,987 4,279
56,564 42,930
Short positions in securities comprise:Treasury bills and other eligible bills 2,547 1,257Debt securities – government 30,614 20,149 Debt securities – other public sector 517 340Debt securities – other 4,678 2,914 Equity shares 1,584 1,540
39,940 26,200
Of the total short positions disclosed above, £24,339m (2001: £23,840m) were listed on a recognised exchange.
Cash receipts from securitisation are in respect of a portfolio of investment debt securities (see note 18) which did not qualifyfor linked presentation under FRS 5.

162 Barclays PLC Annual Report 2002
Notes to the accountsFor the year ended 31st December 2002
31 Accruals and deferred income2002 2001
£m £m
Accrued interest and commission 2,207 2,172Other accruals and deferred income 2,145 2,205
4,352 4,377
32 Deferred taxThe movements on deferred tax during the year were:
2002 2001restated
£m £m
At beginning of year as previously reported 630 631Prior year adjustment – FRS 19 (14) –
At beginning of year as restated 616 631Exchange and other adjustments (121) (19)Charge to profit and loss account (34) 4
At end of year 461 616
Deferred tax at 31st December:Leasing transactions 766 814Other timing differences (305) (198)
461 616
No tax (2001: £nil) has been provided on capital gains that might arise on the disposal of Barclays Bank PLC at the amounts atwhich it is stated. The Directors are of the opinion that the likelihood of any such tax liability arising in the foreseeable future isremote. Tax would become payable only if the investment (and consequently virtually all of the Group’s activities) were disposedof. The amount of tax payable would be dependent upon the level of capital losses available within the Barclays Group to reduceany capital gains that may arise.
No tax has been provided on capital gains (2001: £nil) that might arise on the disposal of properties at their balance sheetamounts. The aggregate disposal of the property portfolio would not be expected to give rise to a significant gain or loss. Taxwould become payable only if property were sold without it being possible to claim rollover relief. At present, it is not envisagedthat any tax will become payable in the foreseeable future.
The fair values of certain derivatives and financial instruments are disclosed in note 47. For trading balances, where fair valuesare recognised in the financial statements and mark to market movements included in the profit and loss account, the gains andlosses are subject to current tax and no deferred tax arises. In the case of derivatives used for asset and liability managementpurposes, tax arises when the gain or loss is recognised in the profit and loss account at the same time as the hedged item.Where fair values are disclosed but not recognised, tax would arise if the assets were sold at their fair value. Tax of £1,106m(2001: £902m) would become payable on the sale of the non-trading financial assets for which a valuation has been given.
Deferred tax assets have not been recognised on tax losses to the extent that they are not regarded as recoverable in theforeseeable future. The unrecognised asset of £24m (2001: £nil) would be regarded as recoverable to the extent that, on thebasis of all available evidence, it was more likely than not that there would be suitable taxable profits from which the tax lossescould be deducted.
No deferred tax is recognised on the unremitted earnings of overseas subsidiary undertakings, associated undertakings and jointventures. Such earnings form part of the balance sheet value and are therefore included in the deferred tax of subsidiaries.

Notes to the accountsFor the year ended 31st December 2002
163Barclays PLC Annual Report 2002
33 Other provisions for liabilities and chargesEmployee
pension andpost-retirement Customer Redundancy
benefit Onerous loyalty and Sundrycontributions contracts provisions restructuring provisions Total
£m £m £m £m £m £m
At 1st January 2002 180 39 68 131 144 562Exchange (3) – – 2 (5) (6)Additions 61 1 16 220 78 376Amounts used (34) (13) (29) (169) (31) (276)Unused amounts reversed (24) (2) – (72) (74) (172)Amortisation of discount – 1 – 1 – 2
180 26 55 113 112 486
At 1st January 2001 194 56 66 151 168 635Acquisitions and disposals of Group undertakings – – – – 15 15Exchange 1 (2) – – (3) (4)Additions 41 3 12 185 54 295Amounts used (28) (20) (10) (183) (38) (279)Unused amounts reversed (28) – – (24) (52) (104)Amortisation of discount – 2 – 2 – 4
180 39 68 131 144 562
Customer loyalty provisions are made with respect to anticipated future claims on redemption under the Group’s customerloyalty bonus schemes. Sundry provisions are made with respect to commission clawbacks, warranties and litigation claims.
Redundancy and restructuringIt is anticipated that the majority of the remaining provision will be utilised in 2003.

Notes to the accountsFor the year ended 31st December 2002
164 Barclays PLC Annual Report 2002
34 Undated loan capitalUndated loan capital, issued by the Bank for the development and expansion of the Group’s business and to strengthen thecapital base and by Woolwich plc for the general purposes of its business, comprised:
2002 2001restated
Notes £m £m
Non-convertibleThe Bank6% Callable Perpetual Core Tier One Notes (a, o) 400 –6.86% Callable Perpetual Core Tier One Notes ($1,000m) (a, o) 619 –8.55% Step-up Callable Perpetual Reserve Capital Instruments ($1,250m) (b, p) 767 8527.375% Step-up Callable Perpetual Reserve Capital Instruments ($750m) (b, q) 459 5107.50% Step-up Callable Perpetual Reserve Capital Instruments (s850m) (c, r) 545 510Junior Undated Floating Rate Notes ($121m) (d, s) 75 83Undated Floating Rate Primary Capital Notes Series 1 ($358m) (d, t) 222 247Undated Floating Rate Primary Capital Notes Series 2 ($442m) (d, t) 274 304Undated Floating Rate Primary Capital Notes Series 3 (d, t) 145 1459.875% Undated Subordinated Notes (e, u) 300 3009% Permanent Interest Bearing Capital Bonds (f, v) 100 1007.875% Undated Subordinated Notes (g, w) 100 1007.125% Undated Subordinated Notes (h, x) 525 5256.875% Undated Subordinated Notes (i, y) 650 6506.375% Undated Subordinated Notes (j, z) 400 –6.125% Undated Subordinated Notes (k, aa) 400 –6.5% Undated Subordinated Notes (FFr 1,000m) (l, ab) 99 935.03% Reverse Dual Currency Undated Subordinated Loan (Yen 8,000m) (m, ac) 42 425% Reverse Dual Currency Undated Subordinated Loan (Yen 12,000m) (m, ac) 63 63Woolwich plc9.25% Perpetual Subordinated Bonds (n, ae) 183 185
6,368 4,709
Convertible to preference sharesThe Bank8% Convertible Capital Notes Series E ($500m) (f, ad) 310 345
Security and subordination None of the undated loan capital of the Bank or Woolwich plc is secured.
The Junior Undated Floating Rate Notes (the “Junior Notes”) rank behind the claims against the Bank of depositors and otherunsecured unsubordinated creditors and holders of dated loan capital.
All other issues of the Bank’s undated loan capital rank pari passu with each other and behind the claims of the holders of JuniorNotes, except for the 6% and 6.86% Callable Perpetual Core Tier One Notes (the “TONs”) and the 8.55%, 7.375% and 7.5% Step-up Callable Perpetual Reserve Capital Instruments (the “RCIs”) (such issues, excluding the Tons and the RCI’s, being the “UndatedNotes and Loans”).
The TONs and the RCIs rank pari passu with each other and behind the claims of the holders of the Undated Notes and Loans.
The 9.25% Perpetual Subordinated Bonds rank behind the claims against Woolwich plc of its depositors and other unsecuredunsubordinated creditors and holders of its dated loan capital.

Notes to the accountsFor the year ended 31st December 2002
34 Undated loan capital (continued)
Interest
Notes(a) These TONs bear a fixed rate of interest until 2032. After that date, in the event that the TONs are not redeemed, the TONswill bear interest at rates fixed periodically in advance based on London interbank rates.
(b) These RCIs bear a fixed rate of interest until 2011. After that date, in the event that the RCIs are not redeemed, the RCIs willbear interest at rates fixed periodically in advance based on London interbank rates.
(c) These RCIs bear a fixed rate of interest until 2010. After that date, in the event that the RCIs are not redeemed, the RCIs willbear interest at rates fixed periodically in advance based on European interbank rates.
(d) These Notes bear interest at rates fixed periodically in advance based on London interbank rates.
(e) These Notes bear a fixed rate of interest until 2008. After that date, in the event that the Notes are not redeemed, thecoupon will be reset to a fixed margin over a reference gilt rate for a further period of five years.
(f ) The interest rates on these Notes are fixed for the life of those issues.
(g) These Notes bear a fixed rate of interest until 2003. After that date, in the event that the Notes are not redeemed, thecoupon will be reset to a fixed margin over a reference gilt rate for a further period of 10 years.
(h) These Notes bear a fixed rate of interest until 2020. After that date, in the event that the Notes are not redeemed, thecoupon will be reset to a fixed margin over a reference gilt rate for a further period of five years.
(i) These Notes bear a fixed rate of interest until 2015. After that date, in the event that the Notes are not redeemed, the couponwill be reset to a fixed margin over a reference gilt rate for a further period of five years.
(j) These Notes bear a fixed rate of interest until 2017. After that date, in the event that the Notes are not redeemed, the couponwill be reset to a fixed margin over a reference gilt rate for a further period of five years.
(k) These Notes bear a fixed rate of interest until 2027. After that date, in the event that the Notes are not redeemed, the couponwill be reset to a fixed margin over a reference gilt rate for a further period of five years.
(l) These Notes bear a fixed rate of interest until 2009. After that date, in the event that the Notes are not redeemed, the Noteswill bear interest at rates fixed periodically in advance based on European interbank rates.
(m) These Loans bear a fixed rate of interest until 2028 based on a US dollar principal amount, but the interest payments havebeen swapped, resulting in a Yen interest rate payable which is fixed periodically in advance based on London interbank rates.After that date, in the event that the Loans are not redeemed, the Loans will bear Yen interest at rates fixed periodically inadvance based on London interbank rates.
(n) These Notes bear a fixed rate of interest until 2021. After that date, in the event that the Notes are not redeemed, thecoupon will be reset to a fixed margin over a reference gilt rate for a further period of five years.
The Bank is not obliged to make a payment of interest on its Undated Notes and Loans if, in the preceding six months, adividend has not been declared or paid on any class of shares of Barclays PLC or, in certain cases, any class of preference sharesof the Bank. Woolwich plc is not obliged to a make a payment of interest on its undated loan capital if, in the immediatelypreceding interest period, a dividend has not been paid on any class of its share capital. Interest not so paid becomes payable ifsuch a dividend is subsequently paid or in certain other circumstances.
No payment of principal or any interest on any such undated loan capital may be made unless the Bank or Woolwich plc, asappropriate, satisfies a specified solvency test.
The Bank may elect to defer any payment of interest on the RCIs for any period of time. Whilst such deferral is continuing,neither the Bank nor Barclays PLC may declare or pay a dividend, subject to certain exceptions, on any of its ordinary shares orpreference shares.
The Bank may elect to defer any payment of interest on the TONs if it determines that it is, or such payment would result in itbeing, in non-compliance with capital adequacy requirements and policies of the Financial Services Authority. Any such deferredpayment of interest will only be payable on a redemption of the TONs. Until such time as the Bank next makes a payment ofinterest on the TONs, neither the Bank nor Barclays PLC may (a) declare or pay a dividend, subject to certain exceptions, on anyof their respective ordinary shares or preference shares, or make payments of interest in respect of the RCIs and (b) certainrestrictions on the redemption, purchase or reduction of their respective share capital and certain other securities also apply.
Interest payable on undated loan capital amounted to £407m (2001: £345m, 2000: £190m).
Barclays PLC Annual Report 2002 165
Notes to the accountsFor the year ended 31st December 2002
34 Undated loan capital (continued)
Repayment and conversionNotes(o) These TONs are repayable, at the option of the Bank, in whole on any coupon payment date falling in or after June 2032.
(p) These RCIs are repayable, at the option of the Bank, in whole on any coupon payment date falling in or after June 2011.
(q) These RCIs are repayable, at the option of the Bank, in whole on any coupon payment date falling in or after December 2011.
(r) These RCIs are repayable, at the option of the Bank, in whole on any coupon payment date falling in or after December 2010.
(s) These Notes are repayable, at the option of the Bank, in whole or in part on any interest payment date.
(t) These Notes are repayable in each case, at the option of the Bank, in whole on any interest payment date.
(u) These Notes are repayable, at the option of the Bank, in whole in 2008, or on any fifth anniversary thereafter.
(v) These Bonds are repayable, at the option of the Bank, in whole at any time.
(w) These Notes are repayable, at the option of the Bank, in whole at any time up to and including October 2003, or on anytenth anniversary thereafter.
(x) These Notes are repayable, at the option of the Bank, in whole in 2020, or on any fifth anniversary thereafter.
(y) These Notes are repayable, at the option of the Bank, in whole in 2015, or on any fifth anniversary thereafter.
(z) These Notes are repayable, at the option of the Bank, in whole in 2017, or on any fifth anniversary thereafter.
(aa) These Notes are repayable, at the option of the Bank, in whole in 2027, or on any fifth anniversary thereafter.
(ab) These Notes are repayable, at the option of the Bank, in whole in 2009, or on any fifth anniversary thereafter.
(ac) These Loans are repayable, at the option of the Bank, in whole in 2028, or on any fifth anniversary thereafter.
(ad) These Notes are repayable at par, at the option of the Bank, in whole on any interest payment date falling in or after April2003 and are convertible on any interest payment date, at the option of the Bank, into 40,000,000 non-cumulative dollar-denominated preference shares of the Bank.
(ae) These Bonds are repayable, at the option of Woolwich plc, in whole in 2021, or on any fifth anniversary thereafter.
In addition, each issue of undated loan capital is repayable, at the option of the Bank or Woolwich plc, as appropriate, in wholefor certain tax reasons, either at any time, or on an interest payment date. There are no events of default except non-payment ofprincipal or mandatory interest. Any repayments require the prior approval of the Financial Services Authority.
The Series E Notes have been registered under the US Securities Act of 1933. The other issues of undated loan capital, whichwere made in the eurocurrency market and/or under Rule 144A, have not been so registered.
Barclays PLC Annual Report 2002166

Notes to the accountsFor the year ended 31st December 2002
Barclays PLC Annual Report 2002 167
35 Dated loan capitalDated loan capital, issued by the Bank for the development and expansion of the Group’s business and to strengthen its capital base,by Woolwich plc for the general purposes of its business and by Barclays Bank of Botswana to enhance its capital base, comprise:
2002 2001Notes £m £m
Non-convertibleThe Bank5.5% Subordinated Notes 2002 (2001: s200m) – 119Floating Rate Subordinated Notes 2002 (2001: s115m) – 73Floating Rate Subordinated Notes 2003 (s55m) (a, i) 36 34Subordinated Floating Notes 2003 (s200m) (a, f, i) 125 125Subordinated Floating Notes 2003 (Yen 8,000m) (a, i) 42 42Floating Rate Unsecured Capital Loan Stock 2006 (a, k, l) 3 416% Unsecured Capital Loan Stock 2002/07 – 1004.875% Step-up Callable Subordinated Notes 2008 (FFr 1,000m) (b, k) 99 93Floating Rate Subordinated Notes 2008 (ITL 250,000m) (a, k) 84 79Subordinated Floating Rate Notes 2008 ($250m) (a, f, k) 171 171Subordinated Floating Rate Notes 2009 ($60m) (a, f, k) 41 41Floating Rate Subordinated Step-up Callable Notes 2009 ($550m) (a, g, k) 355 379Floating Rate Subordinated Step-up Callable Notes 2009 ($115m) (a, f, k) 79 797.4% Subordinated Notes 2009 ($400m) (h) 248 276Subordinated Fixed to CMS-Linked Notes 2009 (s31m) (a) 20 19Floating Rate Subordinated Step-up Callable Notes 2009 (s150m) (a, k) 98 91Variable Floating Rate Subordinated Notes 2009 (Yen 5,000m) (a, k) 26 2612% Unsecured Capital Loan Stock 2010 (h) 25 25Floating Rate Subordinated Step-up Callable Notes 2011($100m) (a, k) 62 69Floating Rate Subordinated Step-up Callable Notes 2011($125m) (a, k) 78 86Floating Rate Subordinated Notes 2011($400m) (a, k) 248 2765.75% Fixed Rate Subordinated Notes 2011(s1,000m) (h) 651 610Fixed/Floating Rate Subordinated Notes 2011 (Yen 5,000m) (c, k) 26 26Floating Rate Subordinated Notes 2012 (a, k) 299 299Callable Subordinated Floating Rate Notes 2012 (a, k) 44 –Callable Subordinated Floating Rate Notes 2012 ($150m) (a, k) 93 –Floating Rate Subordinated Notes 2012 ($100m) (a, k) 62 –Capped Floating Rate Subordinated Notes 2012 ($100m) (a, k) 62 –5.5% Subordinated Notes 2013 (DM 500m) (d, k) 166 156Floating Rate Subordinated Notes 2019 (s50m) (a) 33 31Subordinated Floating Rate Notes 2021 (s100m) (a) 65 61Subordinated Floating Rate Notes 2022 (s50m) (a) 33 –5.75% Fixed Rate Subordinated Notes 2026 (h) 600 6005.4% Reverse Dual Currency Subordinated Loan 2027 (Yen 15,000m) (e) 78 796.33% Subordinated Notes 2032 (h) 50 50Subordinated Floating Rate Notes 2040 (s100m) (a) 65 61Barclays Overseas Investment Company B.V.Guaranteed Notes 2007 (2001: Yen 15,000m) – 79Woolwich plc5.25% Subordinated Notes 2011 (s250m) (h) 152 140Step-up Callable Floating Rate Subordinated Bonds 2012 (a, k) 147 14710.125% Subordinated Notes 2017 (j, k) 121 1239.5% Subordinated Bonds 2021 (h) 261 264
4,848 4,933
ConvertibleBarclays Bank of Botswana (BBB)Subordinated Unsecured Floating Rate Capital Notes 2014 (Pula 100m) (k, m) 11 –
4,859 4,933
Repayablenot more than one year 206 196over one year but not more than two years – 201over two years but not more than five years – –over five years 4,653 4,536
4,859 4,933
None of the Group’s dated loan capital is secured. The debt obligations of the Bank, Woolwich plc and Barclays Bank of Botswanarank ahead of the interests of holders of their equity. Dated loan capital of the Bank, Woolwich plc and Barclays Bank of Botswanahas been issued on the basis that the claims thereunder are subordinated to the respective claims of their depositors and otherunsecured unsubordinated creditors.

168 Barclays PLC Annual Report 2002
Notes to the accountsFor the year ended 31st December 2002
35 Dated loan capital (continued)
Interest
Notes(a) These Notes bear interest at rates fixed periodically in advance based on London or European interbank rates.
(b) These Notes bear a fixed rate of interest until 2003. After that date, in the event that the Notes are not redeemed, the Noteswill bear interest at rates fixed periodically in advance based on European interbank rates.
(c) These Notes bear a fixed rate of interest until 2006. After that date, in the event that the Notes are not redeemed, the Noteswill bear interest at rates fixed periodically in advance based on London interbank rates.
(d) These Notes bear a fixed rate of interest until 2008. After that date, in the event that the Notes are not redeemed, the Noteswill bear interest at rates fixed periodically in advance based on London interbank rates.
(e) This Loan bears a fixed rate of interest based on a US dollar principal amount, but the interest payments have been swapped,resulting in a Yen interest rate payable which is fixed periodically in advance based on London interbank rates.
(f ) The Bank has swapped the proceeds of these Notes for sterling under swaps, the durations of which will match the respectiveterms of the Notes.The payment obligations of the Bank under these swaps are subordinated so that the claims against the Bankin respect of these swaps rank pari passu with claims against the Bank in respect of its dated loan capital. The sterling values ofthese Notes in the figures set out above take into account these subordinated swaps.
(g) The Bank has swapped US$200 million of the proceeds of these Notes under a swap, the duration of which matches the termof the Notes. The payment obligations of the Bank under this swap are subordinated so that the claims against the Bank inrespect of this swap rank pari passu with claims against the Bank in respect of its dated loan capital. The sterling value of theseNotes in the figures set out above takes into account this subordinated swap.
(h) The interest rates on these Notes are fixed for the life of those issues.
(i) The Bank may defer the payment of interest and principal on these Notes in the event that the Financial Services Authorityhas required or requested the Bank to make such a deferral.
(j) These Notes bear a fixed rate of interest until 2012. After that date, in the event that the Notes are not redeemed, the couponwill be reset to a fixed margin over a reference gilt rate for a further period of five years.
(k) Repayable at the option of the issuer, prior to maturity, on conditions governing the respective debt obligations, some inwhole or in part, and some only in whole.
(l) Holders of these Notes have certain rights to call for the redemption of their holdings.
(m) These Notes bear interest at rates fixed periodically in advance based on the Bank of Botswana Certificate Rate. All of theseNotes will be compulsorily converted to Preference Shares of BBB, having a total par value equal in sum to the principal amountof Notes outstanding at the time of conversion, should BBB experience pre-tax losses in excess of its retained earnings and othercapital surplus accounts.
Interest payable on loan capital with a final maturity within five years amounted to £28m (2001: £14m, 2000: £16m).
The 7.4% Subordinated Notes 2009 (the ‘7.4% Notes’) issued by the Bank have been registered under the US Securities Act of 1933. All other issues of dated loan capital by the Bank, Woolwich plc and Barclays Bank of Botswana, which were made in non-US markets, have not been so registered. With respect to the 7.4% Notes, the Bank is not obliged to make (i) a payment of interest on any interest payment date unless a dividend is paid on any class of share capital and (ii) a payment of principaluntil six months after the respective maturity date with respect to such Notes.
Repayment termsUnless otherwise indicated, the Group’s dated loan capital outstanding at 31st December 2002 is redeemable only on maturitysubject, in particular cases, to provisions allowing an early redemption in the event of certain changes in tax law or, in the caseof Barclays Bank of Botswana, to certain changes in legislation or regulations.
Any repayments prior to maturity require in the case of the Bank, or Woolwich plc, the prior approval of the Financial ServicesAuthority and, in the case of Barclays Bank of Botswana, the prior approval of the Bank of Botswana.
There are no committed facilities in existence at the balance sheet date which permit the refinancing of debt beyond the date of maturity.
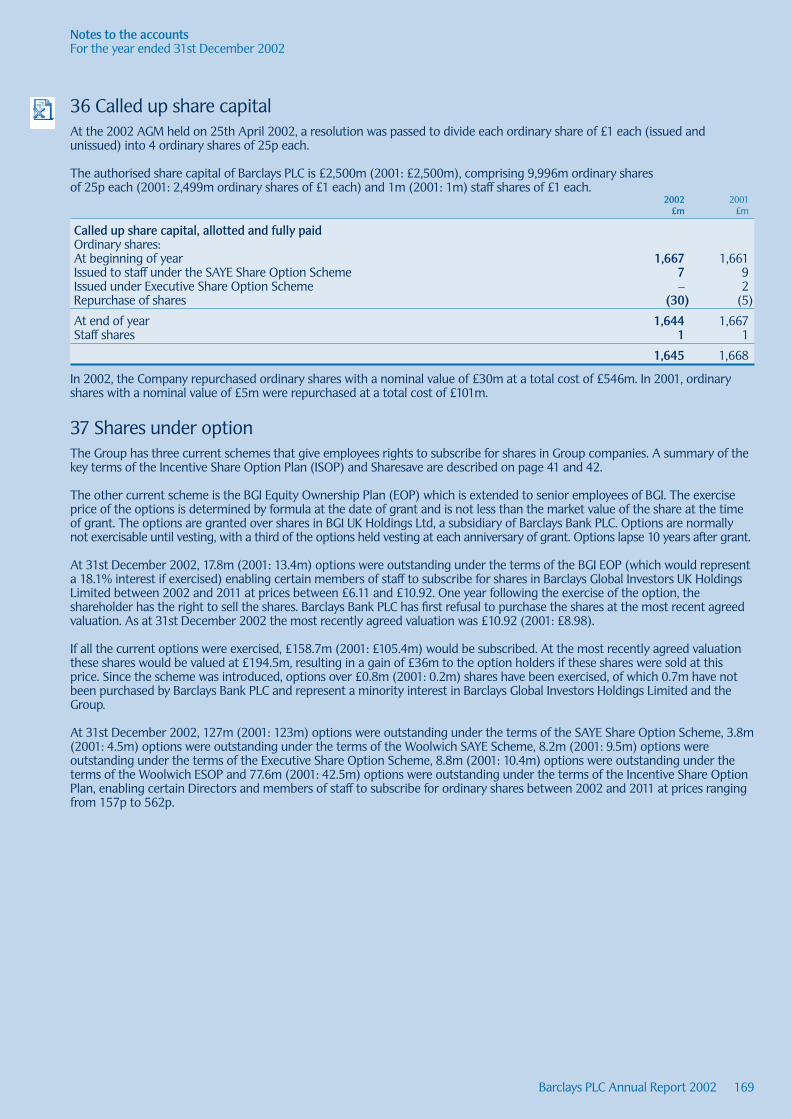
169Barclays PLC Annual Report 2002
Notes to the accountsFor the year ended 31st December 2002
36 Called up share capitalAt the 2002 AGM held on 25th April 2002, a resolution was passed to divide each ordinary share of £1 each (issued andunissued) into 4 ordinary shares of 25p each.
The authorised share capital of Barclays PLC is £2,500m (2001: £2,500m), comprising 9,996m ordinary shares of 25p each (2001: 2,499m ordinary shares of £1 each) and 1m (2001: 1m) staff shares of £1 each.
2002 2001£m £m
Called up share capital, allotted and fully paidOrdinary shares:At beginning of year 1,667 1,661Issued to staff under the SAYE Share Option Scheme 7 9Issued under Executive Share Option Scheme – 2Repurchase of shares (30) (5)
At end of year 1,644 1,667Staff shares 1 1
1,645 1,668
In 2002, the Company repurchased ordinary shares with a nominal value of £30m at a total cost of £546m. In 2001, ordinaryshares with a nominal value of £5m were repurchased at a total cost of £101m.
37 Shares under optionThe Group has three current schemes that give employees rights to subscribe for shares in Group companies. A summary of thekey terms of the Incentive Share Option Plan (ISOP) and Sharesave are described on page 41 and 42.
The other current scheme is the BGI Equity Ownership Plan (EOP) which is extended to senior employees of BGI. The exerciseprice of the options is determined by formula at the date of grant and is not less than the market value of the share at the timeof grant. The options are granted over shares in BGI UK Holdings Ltd, a subsidiary of Barclays Bank PLC. Options are normallynot exercisable until vesting, with a third of the options held vesting at each anniversary of grant. Options lapse 10 years after grant.
At 31st December 2002, 17.8m (2001: 13.4m) options were outstanding under the terms of the BGI EOP (which would representa 18.1% interest if exercised) enabling certain members of staff to subscribe for shares in Barclays Global Investors UK HoldingsLimited between 2002 and 2011 at prices between £6.11 and £10.92. One year following the exercise of the option, theshareholder has the right to sell the shares. Barclays Bank PLC has first refusal to purchase the shares at the most recent agreedvaluation. As at 31st December 2002 the most recently agreed valuation was £10.92 (2001: £8.98).
If all the current options were exercised, £158.7m (2001: £105.4m) would be subscribed. At the most recently agreed valuationthese shares would be valued at £194.5m, resulting in a gain of £36m to the option holders if these shares were sold at thisprice. Since the scheme was introduced, options over £0.8m (2001: 0.2m) shares have been exercised, of which 0.7m have notbeen purchased by Barclays Bank PLC and represent a minority interest in Barclays Global Investors Holdings Limited and theGroup.
At 31st December 2002, 127m (2001: 123m) options were outstanding under the terms of the SAYE Share Option Scheme, 3.8m(2001: 4.5m) options were outstanding under the terms of the Woolwich SAYE Scheme, 8.2m (2001: 9.5m) options wereoutstanding under the terms of the Executive Share Option Scheme, 8.8m (2001: 10.4m) options were outstanding under theterms of the Woolwich ESOP and 77.6m (2001: 42.5m) options were outstanding under the terms of the Incentive Share OptionPlan, enabling certain Directors and members of staff to subscribe for ordinary shares between 2002 and 2011 at prices rangingfrom 157p to 562p.

170 Barclays PLC Annual Report 2002
Notes to the accountsFor the year ended 31st December 2002
38 Shareholders’ funds2002 2001
restated
Associated Associatedundertakings undertakings
and joint and jointConsolidated Barclays PLC ventures Consolidated Barclays PLC ventures
£m £m £m £m £m £m
At beginning of year 14,485 14,485 1 13,183 13,183 30Proceeds of shares issued (net of expenses) 135 135 – 210 210 –Exchange rate translation differences (61) – – 3 – –Repurchase of ordinary shares (546) (546) – (101) (101) –Revaluation of investment in subsidiary undertaking – 585 – – 1,092 –Shares issued to employee trusts inrelation to share option schemes (48) (46) – (107) (105) –Gain arising from transactions with third parties 206 – – – – –Goodwill written back on disposals 10 – – – – –Other items – – 2 (39) (1) (15)Profit/(loss) retained 1,024 592 (11) 1,336 207 (14)
At end of year 15,205 15,205 (8) 14,485 14,485 1
The revaluation reserve of Barclays PLC arises from the revaluation of the investment in Barclays Bank PLC.
The decrease in consolidated shareholders’ funds of £61m (2001: increase £3m) arising from exchange rate translationdifferences is net of a related tax credit of £3m (2001: credit £6m).
Prior year shareholders’ funds has been restated for a reduction of £23m in 2001 (2000: £4m) arising from changes inaccounting policy as described on pages 133 and 134.
39 Investment in Barclays Bank PLCThe investment in Barclays Bank PLC is stated in the balance sheet at Barclays PLC’s share of the book value of the net assets of Barclays Bank PLC including unamortised goodwill. The net increase of £720m during the year comprised the cost ofadditional shares of £135m and an increase of £585m in other net assets of Barclays Bank PLC. The cost of the investment was £7,616m (2001: £7,481m).
Details of principal subsidiary undertakings, held through Barclays Bank PLC, are shown in note 44.
40 Leasing activitiesAggregate amounts received and receivable during the year under finance leases were £433m (2001: £486m, 2000: £598m),including interest income of £225m (2001: £263m, 2000: £355m).
41 Assets and liabilities denominated in sterling and foreign currencies2002 2001
restated£m £m
Denominated in sterling 190,303 174,462Denominated in currencies other than sterling 212,763 182,150
Total assets 403,066 356,612
Denominated in sterling 186,938 188,467Denominated in currencies other than sterling 216,128 168,145
Total liabilities 403,066 356,612

171Barclays PLC Annual Report 2002
Notes to the accountsFor the year ended 31st December 2002
42 Assets pledged to secure liabilitiesAt 31st December 2002, the amount of assets pledged to secure liabilities was £16,109m (2001: £15,227m). The securedliabilities outstanding amounted to £12,151m (2001: £12,985m).
43 Future rental commitments under operating leasesAt 31st December 2002, the Group held various leases on land and buildings, many for extended periods, and other leases for equipment.
2002 2001
Property Equipment Property Equipment£m £m £m £m
Annual commitments under non-cancellable operating leases expiring:not more than one year 19 1 19 1over one year but not more than five years 46 – 24 1over five years 110 – 118 –
175 1 161 2
The following aggregate rental payments outstanding at 31st December 2002 fall due as follows:
Year ended 31st December
Total2003 2004 2005 2006 2007 thereafter
£m £m £m £m £m £m
Aggregate rental payments 176 179 182 164 154 2,014
The aggregate rental payments above include amounts relating to a commitment to lease a new headquarters at Canary Wharf.
The rentals for leasehold land, buildings and equipment, included in operating expenses for the year ended 31st December 2002,amounted to £192m (2001: £200m, 2000: £176m).

Notes to the accountsFor the year ended 31st December 2002
Barclays PLC Annual Report 2002172
44 Principal subsidiary undertakingsPercentage
of equityCountry of registration capital heldor incorporation Company name Nature of Business %
England Barclays Bank PLC – ordinary shares Banking, holding company 100*England Barclays Private Bank Limited Banking 100*England Barclays Mercantile Business Finance Limited Commercial finance, holding company, leasing 100England Barclays Global Investors UK Holdings Limited Holding company 100England Barclays Life Assurance Company Limited Life and pensions business 100England Barclays Bank Trust Company Limited Banking, securities industries and trust services 100England Barclays Stockbrokers Limited Stockbroking 100England Barclays Capital Securities Limited Securities dealing 100England Barclays Global Investors Pensions Investment management 100*
Management LimitedEngland Woolwich plc Banking, holding company 100England FIRSTPLUS Financial Group PLC Consumer finance 100*England Woolwich Independent Financial Financial advisory services 100*
Advisory Services LimitedJersey Barclays Private Bank and Trust Limited Banking, holding company 100*Isle of Man Barclays Private Clients
International Limited Banking 100Spain Barclays Bank SA Banking 99.7Botswana Barclays Bank of Botswana Limited Banking 74.9Egypt Cairo Barclays Bank SAE Banking 60Ghana Barclays Bank of Ghana Limited Banking 90Kenya Barclays Bank of Kenya Limited Banking 68.5Zimbabwe Barclays Bank of Zimbabwe Limited Banking 64.6*USA Barclays Capital Inc. Securities dealing 100*USA Barclays Global Investors, NA Investments and securities industry business 100*Switzerland Barclays Bank (Suisse) SA Banking and trust services 100*Cayman Islands Barclays Capital Japan Limited Securities dealing 100*Italy Banca Woolwich SpA Banking 100*
In accordance with Section 231(5) of the Companies Act 1985 the above information is provided solely in relation to principalsubsidiary undertakings. Full information on all subsidiaries will be included with the Annual Return.
With the exception of Barclays Capital Japan Limited which operates in Japan, the country of registration or incorporation is alsothe principal area of operation for each of the above undertakings. Investments in these undertakings are held directly by Barclays Bank PLC except where marked *.
45 Contingent liabilities and commitmentsIn common with other banks, the Group conducts business involving acceptances, guarantees, performance bonds andindemnities. The majority of these facilities are offset by corresponding obligations of third parties. In addition, there are other off-balance sheet financial instruments, including swaps, futures, forwards and option contracts or combinations thereof (all commonly known as derivatives) the nominal amounts of which are not reflected in the consolidated balance sheet.
Following internationally accepted banking supervisory practice for the calculation of the credit risk associated with such non-derivative off-balance sheet items, for the purpose of this note the contract or underlying principal amounts are eitherrecognised at face value or converted to credit risk equivalents by applying specified conversion factors.
Nature of instrumentsFor a description of the nature of derivative financial instruments, see page 79.
An acceptance is an undertaking by a bank to pay a bill of exchange drawn on a customer. The Group expects most acceptancesto be presented, but reimbursement by the customer is normally immediate. Endorsements are residual liabilities of the Group inrespect of bills of exchange which have been paid and subsequently rediscounted.
Guarantees and assets pledged as collateral security are generally written by a bank to support the performance of a customerto third parties. As the Group will only be required to meet these obligations in the event of the customer’s default, the cashrequirements of these instruments are expected to be considerably below their nominal amounts.
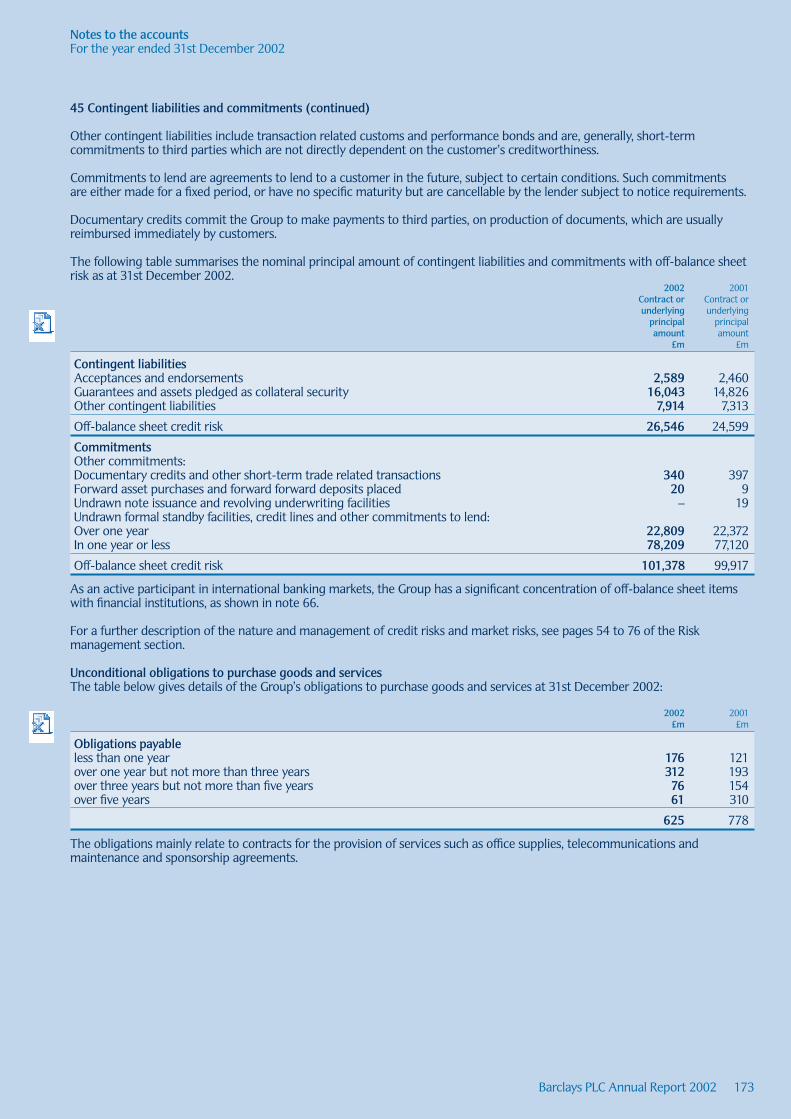
173Barclays PLC Annual Report 2002
Notes to the accountsFor the year ended 31st December 2002
45 Contingent liabilities and commitments (continued)
Other contingent liabilities include transaction related customs and performance bonds and are, generally, short-termcommitments to third parties which are not directly dependent on the customer’s creditworthiness.
Commitments to lend are agreements to lend to a customer in the future, subject to certain conditions. Such commitments are either made for a fixed period, or have no specific maturity but are cancellable by the lender subject to notice requirements.
Documentary credits commit the Group to make payments to third parties, on production of documents, which are usuallyreimbursed immediately by customers.
The following table summarises the nominal principal amount of contingent liabilities and commitments with off-balance sheetrisk as at 31st December 2002.
2002 2001Contract or Contract orunderlying underlying
principal principalamount amount
£m £m
Contingent liabilitiesAcceptances and endorsements 2,589 2,460 Guarantees and assets pledged as collateral security 16,043 14,826 Other contingent liabilities 7,914 7,313
Off-balance sheet credit risk 26,546 24,599
CommitmentsOther commitments:Documentary credits and other short-term trade related transactions 340 397Forward asset purchases and forward forward deposits placed 20 9 Undrawn note issuance and revolving underwriting facilities – 19 Undrawn formal standby facilities, credit lines and other commitments to lend:Over one year 22,809 22,372 In one year or less 78,209 77,120
Off-balance sheet credit risk 101,378 99,917
As an active participant in international banking markets, the Group has a significant concentration of off-balance sheet itemswith financial institutions, as shown in note 66.
For a further description of the nature and management of credit risks and market risks, see pages 54 to 76 of the Riskmanagement section.
Unconditional obligations to purchase goods and servicesThe table below gives details of the Group’s obligations to purchase goods and services at 31st December 2002:
2002 2001£m £m
Obligations payableless than one year 176 121over one year but not more than three years 312 193over three years but not more than five years 76 154over five years 61 310
625 778
The obligations mainly relate to contracts for the provision of services such as office supplies, telecommunications andmaintenance and sponsorship agreements.
Notes to the accountsFor the year ended 31st December 2002
Barclays PLC Annual Report 2002174
46 Derivatives and other financial instrumentsThe Group’s objectives and policies in managing the risks that arise in connection with the use of financial instruments are set out on pages 54 to 84 under the headings ‘Risk management and control – overview’; ‘Market risk management’ and‘Treasury asset and liability management’. Short-term debtors and creditors are included in the following interest rate repricingand non-trading currency risk tables. All other disclosures in note 46 exclude these short-term balances.
Interest rate sensitivity gap analysisThe table below summarises the repricing profiles of the Group’s non-trading book as at 31st December 2002. Items areallocated to time bands by reference to the earlier of the next contractual interest rate repricing date and the maturity date.
Interest rate repricing – as at 31st December 2002
Over three Over Over Over Over months but six months one year three years five years
Not more not more but not but not but not but not Over Non-than three than six more than more than more than more than ten interest Trading
months months one year three years five years ten years years bearing balances Total£m £m £m £m £m £m £m £m £m £m
Assets:Treasury bills and othereligible bills 261 87 42 21 – – – – 7,234 7,645Loans and advances to banks 2,844 35 56 44 1 84 – 281 54,829 58,174Loans and advances to customers 94,934 4,302 6,239 9,106 5,692 3,886 1,251 861 76,127 202,398Debt securitiesand equity shares 3,794 174 87 1,173 434 313 254 960 90,173 97,362Other assets 758 – – – – – – 11,322 18,123 30,203
Total assets 102,591 4,598 6,424 10,344 6,127 4,283 1,505 13,424 246,486 395,782
Liabilities:Deposits by banks 3,348 298 40 352 291 263 – 53 82,789 87,434Customer accounts 109,670 1,978 1,957 2,142 97 13 355 13,454 41,832 171,498Debt securities in issue 3,180 248 15 803 1,089 31 80 – 40,439 45,885Other liabilities – – – – – – – 8,493 55,574 64,067Loan capital and othersubordinated liabilities 2,565 621 100 – 37 3,511 4,703 – – 11,537Minority andotherinterests and shareholders’ funds – – – – – – – 15,361 – 15,361Internal funding of trading business (14,966) (3,570) 124 (977) 21 (48) 391 (6,827) 25,852 –
Total liabilities 103,797 (425) 2,236 2,320 1,535 3,770 5,529 30,534 246,486 395,782
Off-balance sheet items (13,222) (1,205) (3,316) 4,544 5,956 3,601 3,642 – – –
Interest rate repricing gap (14,428) 3,818 872 12,568 10,548 4,114 (382) (17,110) – –
Cumulative gap (14,428) (10,610) (9,738) 2,830 13,378 17,492 17,110 – – –
Total assets and liabilities exclude retail life-fund assets and liabilities. These are not relevant in considering the interest rate riskof the Group.
Trading balances for the purposes of this table are those, within Barclays Capital, where the risk is managed by DVaR (see pages74 to 76).

Notes to the accountsFor the year ended 31st December 2002
Barclays PLC Annual Report 2002 175
46 Derivatives and other financial instruments (continued)
Interest rate repricing – as at 31st December 2001
Over three Over Over Over Over months but six months one year three years five years
Not more not more but not but not but not but not Over Non-than three than six more than more than more than more than ten interest Trading
months months one year three years five years ten years years bearing balances Total£m £m £m £m £m £m £m £m £m £m
Assets:Treasury bills and othereligible bills 565 49 36 40 – – – – 6,727 7,417Loans and advances to banks 3,531 306 58 18 2 189 – 298 43,487 47,889Loans and advances to customers 82,427 2,827 3,820 14,818 5,587 3,635 1,212 592 65,575 180,493Debt securitiesand equity shares 539 50 1,378 604 1,452 668 491 135 76,725 82,042Other assets 749 – – – – – – 11,687 18,165 30,601
Total assets 87,811 3,232 5,292 15,480 7,041 4,492 1,703 12,712 210,679 348,442
Liabilities:Deposits by banks 2,610 491 86 291 416 287 – 115 63,084 67,380Customer accounts 105,204 2,258 2,658 483 570 13 219 13,472 38,970 163,847Debt securities in issue 3,695 296 143 609 822 63 77 – 36,141 41,846Other liabilities – – – – – – – 8,301 42,462 50,763Loan capital and othersubordinated liabilities 2,895 77 198 193 26 3,584 3,014 – – 9,987Minority and other interests and shareholders’ funds – – – – – – – 14,619 – 14,619Internal funding of trading business (22,824) (555) 316 (188) 308 (12) 325 (7,392) 30,022 –
Total liabilities 91,580 2,567 3,401 1,388 2,142 3,935 3,635 29,115 210,679 348,442
Off-balance sheet items (8,830) 3,461 (3,535) (2,146) 5,571 3,595 1,884 – – –
Interest rate repricing gap (12,599) 4,126 (1,644) 11,946 10,470 4,152 (48) (16,403) – –
Cumulative gap (12,599) (8,473) (10,117) 1,829 12,299 16,451 16,403 – – –
Non-trading currency riskNon-trading currency risk exposure arises principally from the Group’s investments in overseas branches and subsidiary andassociated undertakings, principally in the United States, Japan and Europe.
The Group’s structural currency exposures at 31st December 2002 were as follows:
Net investments in Borrowings which hedge Remaining structuraloverseas operations the net investments currency exposures
2002 2001 2002 2001 2002 2001Functional currency of the operation involved £m £m £m £m £m £m
US dollar 1,078 709 959 593 119 116Yen 2,125 118 2,094 1 31 117Euro 2,930 2,610 2,633 2,065 297 545Other non-sterling 512 493 164 106 348 387
Total 6,645 3,930 5,850 2,765 795 1,165
In accordance with Group policy, as at 31st December 2002 and 31st December 2001 there were no material net currencyexposures in the non-trading book relating to transactional (or non-structural) positions that would give rise to net currencygains and losses recognised in the profit and loss account. Instruments used in hedging non-trading exposures are described on pages 81 to 84.

Notes to the accountsFor the year ended 31st December 2002
Barclays PLC Annual Report 2002176
46 Derivatives and other financial instruments (continued)
Daily value at riskThe Daily Value at Risk (DVaR) methodology of estimating potential losses arising from the Group’s exposure to market risk is explained on pages 74 to 76. The models used in estimating potential losses are based on past movements and may not be indicative of future market conditions. The following table shows an analysis of DVaR for the market risk exposures in BarclaysCapital as an average for the year and the high and low during the year.
Year to 31st December 2002 Year to 31st December 2001 (a)
Average High (b) Low (b)Average High (b) Low (b) restated restated restated
£m £m £m £m £m £m
Interest rate risk 21.7 34.5 10.0 14.9 24.1 7.6Credit spread risk 9.4 12.5 6.0 8.8 14.7 4.6Foreign exchange risk 2.9 4.4 1.9 2.3 6.2 0.6Equities risk 3.6 5.4 2.1 3.3 6.4 2.1Commodities risk 1.8 3.3 0.8 1.7 4.3 0.6Diversification effect (16.2) (12.5)
Total DVaR 23.2 35.7 13.4 18.5 25.4 11.3
Notes(a) Restatements of interest rate DVaRs, total DVaRs and diversification effect reflect the move to a methodology that identifiescredit spread risk separately.
(b) The high (and low) DVaR figures reported for each category did not necessarily occur on the same day as the high (and low)DVaR reported as a whole. A corresponding diversification effect cannot be calculated and is therefore omitted from the abovetable. The DVaR at 31st December 2002 was £25.8m (2001: £21.3m).
The hedging tables below summarise, firstly, the unrecognised gains and losses on hedges at 31st December 2002 and 31stDecember 2001 and the movements therein during the year, and, secondly, the deferred gains and losses on hedges carried forwardin the balance sheet at 31st December 2002 and 31st December 2001, pending their recognition in the profit and loss account.
Gains Losses Total net gains/(losses)
2002 2001 2002 2001 2002 2001£m £m £m £m £m £m
Unrecognised gains and losses on hedgesAt 1st January 2,441 1,755 (1,738) (1,709) 703 46(Gains)/losses arising in previous years thatwere recognised in 2002/2001 (1,369) (762) 890 590 (479) (172)
Brought forward gains/(losses) not recognised in 2002/2001 1,072 993 (848) (1,119) 224 (126)Gains/(losses) arising in 2002/2001 that were not recognised in 2002/2001 2,218 1,448 (1,505) (619) 713 829
At 31st December 3,290 2,441 (2,353) (1,738) 937 703
Of which:Gains/(losses) expected to be recognised in 2003/2002 1,101 1,338 (664) (844) 437 494Gains/(losses) expected to be recognised in 2004/2003 or later 2,189 1,103 (1,689) (894) 500 209
Deferred gains and losses on hedges carried forward in the balance sheetAt 1st January 49 20 (77) (81) (28) (61)Deferred (gains)/losses brought forward that were recognised in income in 2002/2001 (31) (10) 56 39 25 29
Brought forward deferred gains/(losses) not recognised in 2002/2001 18 10 (21) (42) (3) (32)Gains/(losses) that became deferred in 2002/2001 73 39 (86) (35) (13) 4
At 31st December 91 49 (107) (77) (16) (28)
Of which:Gains/(losses) expected to be recognised in income in 2003/2002 72 19 (61) (49) 11 (30)Gains/(losses) expected to be recognised in income in 2004/2003 or later 19 30 (46) (28) (27) 2
Where a non-trading derivative no longer represents a hedge because the underlying non-trading asset, liability or position has beende-recognised or transferred into a trading portfolio, it is restated at fair value and any resultant gains or losses taken directly to theprofit and loss account. Gains of £66m (2001: £89m) and losses of £39m (2001: £122m) were recognised in the year to 31st December2002. The disclosure of the fair value of financial instruments as required by FRS 13 is provided in note 47 on pages 183 to 184.

Notes to the accountsFor the year ended 31st December 2002
Barclays PLC Annual Report 2002 177
46 Derivatives and other financial instruments (continued)
Derivatives held or issued for trading purposesThe tables set out below analyse the notional principal amounts and fair values (which, after netting, are the book values) oftrading instruments entered into with third parties.
2002
Contract or Year-end Year-end Average Averageunderlying positive negative positive negative
principal fair fair fair fairamount value value value value
£m £m £m £m £m
Foreign exchange derivativesForward foreign exchange 269,832 4,521 5,335 3,412 3,676Currency swaps 148,481 5,022 5,160 4,200 4,273OTC options bought and sold 64,252 1,096 786 799 680
OTC derivatives 482,565 10,639 11,281 8,411 8,629Exchange traded futures – bought and sold 100 – – – –Exchange traded options – bought and sold 31 – – – –Exchange traded – swaps 16 – – – –
Total 482,712 10,639 11,281 8,411 8,629
Interest rate derivativesSwaps 1,938,902 54,757 53,334 43,221 42,004Forward rate agreements 168,392 111 107 108 100OTC options bought and sold 581,272 8,074 7,891 6,839 6,703
OTC derivatives 2,688,566 62,942 61,332 50,168 48,807Exchange traded futures – bought and sold 338,581 – – – –Exchange traded options – bought and sold 67,757 – – – –Exchange traded swaps 382,540 – – – –
Total 3,477,444 62,942 61,332 50,168 48,807
Credit derivativesSwaps 10,665 660 106 675 198
Equity and stock index derivativesOTC options bought and sold 37,476 1,992 2,060 1,921 2,128Equity swaps and forwards 3,267 57 57 101 39
OTC derivatives 40,743 2,049 2,117 2,022 2,167Exchange traded futures – bought and sold 15,585 – – – –Exchange traded options – bought and sold 9,103 – – – –
Total 65,431 2,049 2,117 2,022 2,167
Commodity derivativesOTC options bought and sold 7,880 171 153 122 87Commodity swaps and forwards 18,217 520 502 410 535
OTC derivatives 26,097 691 655 532 622Exchange traded futures – bought and sold 17,545 10 – 24 22Exchange traded options – bought and sold 760 – 6 – 10
Total 44,402 701 661 556 654
Total trading derivatives 76,991 75,497Effect of netting (60,327) (60,327)Allowable offset – cash collateral (3,210) (3,632)
Balances arising from off-balance sheet financial instruments(see Other assets/Other liabilities, notes 24 and 30) 13,454 11,538
Collateral held that reduced credit risk in respect of derivative instruments at 31st December 2002, but did not meet the offsetcriteria amounted to £591m (2001: £238m).
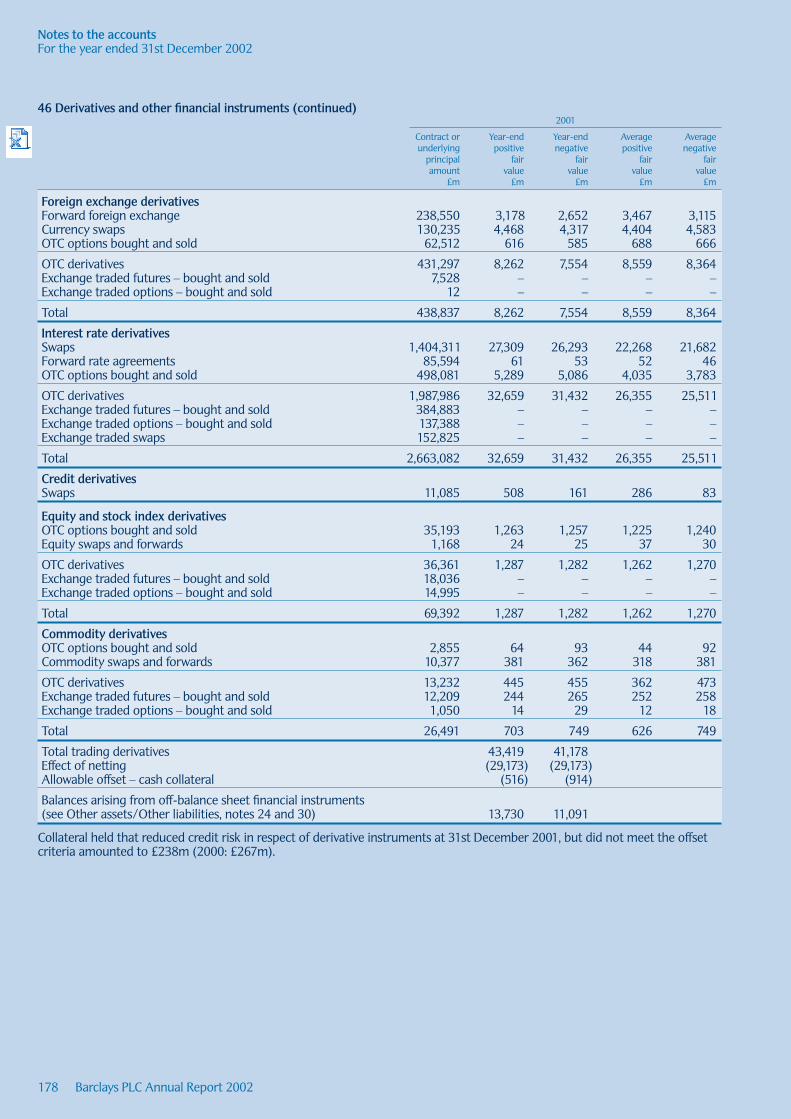
Notes to the accountsFor the year ended 31st December 2002
Barclays PLC Annual Report 2002178
46 Derivatives and other financial instruments (continued)2001
Contract or Year-end Year-end Average Averageunderlying positive negative positive negative
principal fair fair fair fairamount value value value value
£m £m £m £m £m
Foreign exchange derivativesForward foreign exchange 238,550 3,178 2,652 3,467 3,115Currency swaps 130,235 4,468 4,317 4,404 4,583OTC options bought and sold 62,512 616 585 688 666
OTC derivatives 431,297 8,262 7,554 8,559 8,364Exchange traded futures – bought and sold 7,528 – – – –Exchange traded options – bought and sold 12 – – – –
Total 438,837 8,262 7,554 8,559 8,364
Interest rate derivativesSwaps 1,404,311 27,309 26,293 22,268 21,682Forward rate agreements 85,594 61 53 52 46OTC options bought and sold 498,081 5,289 5,086 4,035 3,783
OTC derivatives 1,987,986 32,659 31,432 26,355 25,511Exchange traded futures – bought and sold 384,883 – – – –Exchange traded options – bought and sold 137,388 – – – –Exchange traded swaps 152,825 – – – –
Total 2,663,082 32,659 31,432 26,355 25,511
Credit derivativesSwaps 11,085 508 161 286 83
Equity and stock index derivativesOTC options bought and sold 35,193 1,263 1,257 1,225 1,240Equity swaps and forwards 1,168 24 25 37 30
OTC derivatives 36,361 1,287 1,282 1,262 1,270Exchange traded futures – bought and sold 18,036 – – – –Exchange traded options – bought and sold 14,995 – – – –
Total 69,392 1,287 1,282 1,262 1,270
Commodity derivativesOTC options bought and sold 2,855 64 93 44 92Commodity swaps and forwards 10,377 381 362 318 381
OTC derivatives 13,232 445 455 362 473Exchange traded futures – bought and sold 12,209 244 265 252 258Exchange traded options – bought and sold 1,050 14 29 12 18
Total 26,491 703 749 626 749
Total trading derivatives 43,419 41,178Effect of netting (29,173) (29,173)Allowable offset – cash collateral (516) (914)
Balances arising from off-balance sheet financial instruments(see Other assets/Other liabilities, notes 24 and 30) 13,730 11,091
Collateral held that reduced credit risk in respect of derivative instruments at 31st December 2001, but did not meet the offsetcriteria amounted to £238m (2000: £267m).

Notes to the accountsFor the year ended 31st December 2002
Barclays PLC Annual Report 2002 179
46 Derivatives and other financial instruments (continued)
Derivative financial instruments held for the purpose of managing non-trading exposuresThe following table, which includes only the derivative components of the Group’s hedging programme, summarises thenominal values, fair values and book values of derivatives held for the purpose of managing non-trading exposures. Included in the amounts below were £10,984m (2001: £13,920m) contract amount of foreign exchange derivatives and £192,463m (2001: £131,306m) of interest rate derivatives which were made for asset and liability management purposes with independentlymanaged dealing units of the Group.
2002 2001
Contract or Year-end Year-end Year-end Year-end Contract or Year-end Year-endunderlying positive negative positive negative underlying positive negative
principal fair fair book book principal fair fairamount value value value value amount value value
£m £m £m £m £m £m £m £m
Foreign exchange derivativesForward foreign exchange 1,814 21 11 43 6 3,727 245 –Currency swaps 10,651 176 273 114 338 16,062 717 379OTC options bought and sold – – – – – 5,062 22 66
OTC derivatives 12,465 197 284 157 344 24,851 984 445
Interest rate derivativesSwaps 225,410 4,272 3,263 1,661 1,468 152,146 2,458 1,754Forward rate agreements 11,651 17 22 10 9 17,853 19 11OTC options bought and sold 10,865 62 38 6 1 4,622 19 6Other interest rate contracts – – – – – 150 17 –
OTC derivatives 247,926 4,351 3,323 1,677 1,478 174,771 2,513 1,771
Credit derivativesSwaps 7,736 30 23 – 2 5,555 2 15
Equity, stock index andcommodity derivatives 372 – 1 – – 335 10 1
At 31st December 2001, the total positive book value of derivatives held for the purposes of managing non-trading exposureswas £1,476m. The total negative book value of such contracts at 31st December 2001 was £902m.
The nominal amounts of OTC foreign exchange derivatives held to manage the non-trading exposure of the Group analysed by currency and final maturity are as follows:
2002 2001
Over one Over one year but year but
not more not more One year than five Over five One year than five Over five
or less years years Total or less years years Total£m £m £m £m £m £m £m £m
£/euro 337 2,587 6 2,930 2,621 1,777 44 4,442£/Yen 710 5,186 29 5,925 2,792 2,998 89 5,879£/US Dollar 242 696 391 1,329 6,818 2,019 337 9,174US Dollar/euro 131 – 21 152 419 49 11 479US Dollar/Yen 127 121 176 424 51 922 196 1,169US Dollar/South African Rand 526 – – 526 396 – – 396US/Australian Dollar – – – – 2 – – 2Yen/euro – 875 – 875 945 1,325 – 2,270Other 224 57 23 304 926 87 27 1,040
Total 2,297 9,522 646 12,465 14,970 9,177 704 24,851

Notes to the accountsFor the year ended 31st December 2002
Barclays PLC Annual Report 2002180
46 Derivatives and other financial instruments (continued)
Maturity of notional principal amounts as at 31st December 2002At 31st December 2002, the notional principal amounts, by residual maturity, of the Group’s trading and non-trading derivativeswere as follows:
Over one year but
not more OverOne year than five five
or less years years Total£m £m £m £m
Foreign exchange derivativesForward foreign exchange 253,424 17,166 1,056 271,646Currency swaps 27,547 90,322 41,263 159,132OTC options bought and sold 55,900 6,652 1,700 64,252
OTC derivatives 336,871 114,140 44,019 495,030Exchange traded futures – bought and sold 100 – – 100Exchange traded options – bought and sold 31 – – 31Exchange traded swaps 16 – – 16
Total 337,018 114,140 44,019 495,177
Interest rate derivativesSwaps 640,098 849,818 674,396 2,164,312Forward rate agreements 167,638 12,405 – 180,043OTC options bought and sold 240,441 258,378 93,318 592,137
OTC derivatives 1,048,177 1,120,601 767,714 2,936,492Exchange traded futures – bought and sold 229,256 105,269 4,056 338,581Exchange traded options – bought and sold 62,814 4,943 – 67,757Exchange traded swaps 47,672 176,722 158,146 382,540
Total 1,387,919 1,407,535 929,916 3,725,370
Credit derivativesSwaps 1,882 14,376 2,143 18,401
Equity and stock index derivativesOTC options bought and sold 11,166 25,154 1,528 37,848Equity swaps and forwards 3,045 222 – 3,267
OTC derivatives 14,211 25,376 1,528 41,115Exchange traded futures – bought and sold 15,585 – – 15,585Exchange traded options – bought and sold 7,002 2,101 – 9,103
Total 36,798 27,477 1,528 65,803
Commodity derivativesOTC options bought and sold 5,016 2,342 522 7,880Commodity swaps and forwards 9,283 7,279 1,655 18,217
OTC derivatives 14,299 9,621 2,177 26,097Exchange traded futures – bought and sold 14,424 3,086 35 17,545Exchange traded options – bought and sold 753 7 – 760
Total 29,476 12,714 2,212 44,402

181Barclays PLC Annual Report 2002
Notes to the accountsFor the year ended 31st December 2002
46 Derivatives and other financial instruments (continued)
Maturity of notional principal amounts as at 31st December 2001At 31st December 2001, the notional principal amounts, by residual maturity, of the Group’s trading and non-trading derivativeswere as follows:
Over one year but
not more OverOne year than five five
or less years years Total£m £m £m £m
Foreign exchange derivativesForward foreign exchange 231,183 9,528 1,566 242,277Currency swaps 41,377 66,461 38,459 146,297OTC options bought and sold 62,429 4,500 645 67,574
OTC derivatives 334,989 80,489 40,670 456,148Exchange traded futures – bought and sold 7,528 – – 7,528Exchange traded options – bought and sold 12 – – 12
Total 342,529 80,489 40,670 463,688
Interest rate derivativesSwaps 319,636 698,275 538,546 1,556,457Forward rate agreements 85,853 17,594 – 103,447OTC options bought and sold 182,559 231,307 88,837 502,703Other interest rate contracts – 150 – 150
OTC derivatives 588,048 947,326 627,383 2,162,757Exchange traded futures – bought and sold 318,915 65,968 – 384,883Exchange traded options – bought and sold 133,483 3,905 – 137,388Exchange traded swaps 16,674 75,002 61,149 152,825
Total 1,057,120 1,092,201 688,532 2,837,853
Credit derivativesSwaps 1,216 6,578 8,846 16,640
Equity and stock index derivativesOTC options bought and sold 11,263 23,023 1,242 35,528Equity swaps and forwards 1,168 – – 1,168
OTC derivatives 12,431 23,023 1,242 36,696Exchange traded futures – bought and sold 18,036 – – 18,036Exchange traded options – bought and sold 11,858 3,137 – 14,995
Total 42,325 26,160 1,242 69,727
Commodity derivativesOTC options bought and sold 1,753 1,102 – 2,855Commodity swaps and forwards 7,385 2,302 690 10,377
OTC derivatives 9,138 3,404 690 13,232Exchange traded futures – bought and sold 11,728 481 – 12,209Exchange traded options – bought and sold 895 155 – 1,050
Total 21,761 4,040 690 26,491

Notes to the accountsFor the year ended 31st December 2002
Barclays PLC Annual Report 2002182
46 Derivatives and other financial instruments (continued)
Maturity analyses of replacement cost and counterparty analyses of net replacement costThe fair value of a derivative contract represents the amount at which that contract could be exchanged in an arm’s lengthtransaction, calculated at market rates current at the balance sheet date. The totals of positive and negative fair values arising on trading derivatives at the balance sheet date have been netted where the Group has a legal right of offset with the relevantcounterparty. The total positive fair value after permitted netting equates to net replacement cost.
The residual replacement cost by maturity and net replacement cost by counterparty analyses of OTC and non-margined exchangetraded derivatives held for trading and non-trading purposes at 31st December 2002 and 31st December 2001 are as follows:
2002 2001
Over one Over one year but year but
One not more Over One not more Overyear or than five five year or than five five
less years years Total less years years Total£m £m £m £m £m £m £m £m
Replacement cost by residual maturityForeign exchange derivatives 5,627 3,398 1,654 10,679 4,656 2,339 1,390 8,385Interest rate derivatives 6,387 24,335 32,872 63,594 3,924 14,578 14,619 33,121Equity and stock index derivatives 668 1,335 46 2,049 381 896 13 1,290Commodity derivatives 372 244 85 701 549 138 16 703Credit derivatives 6 236 448 690 7 78 425 510
13,060 29,548 35,105 77,713 9,517 18,029 16,463 44,009
Total Total2002 2001
£m £m
Net replacement cost by counterpartyCentral Banks 48 97Banks and other financial institutions 9,469 9,332Other corporate and public bodies 4,398 4,839
13,915 14,268
Potential credit risk exposureThe potential credit risk exposure for each product equals net replacement cost as reduced by the fair value of collateralprovided by the counterparty.
At 31st December 2002 and 31st December 2001, the potential credit risk exposures in respect of the Group’s trading and non-trading OTC derivatives were not significantly different to net replacement cost.

183Barclays PLC Annual Report 2002
Notes to the accountsFor the year ended 31st December 2002
47 Fair values of financial instrumentsFinancial instruments include both financial assets and financial liabilities and also derivatives. The fair value of a financialinstrument is the amount at which the instrument could be exchanged in a current transaction between willing parties, otherthan in a forced or liquidation sale.
Wherever possible, the Group has estimated fair value using market prices or data available for instruments with characteristicseither identical or similar to those of the instruments held by the Group. In certain cases, however, including loans and advancesto customers, no ready markets currently exist in the UK wherein exchanges between willing parties occur. Accordingly, varioustechniques have been developed to estimate what the fair value of such instruments might be.
These estimation techniques are necessarily subjective in nature and involve several assumptions. There have been no significantchanges in the estimation techniques or the methodology used compared with those used at 31st December 2001.
Because a variety of estimation techniques are employed and significant estimates made, comparisons of fair values betweenfinancial institutions may not be meaningful. Readers of these accounts are thus advised to use caution when using this datato evaluate the Group’s financial position.
Fair value information is not provided for items that do not meet the definitions of a financial instrument. These items include short term debtors and creditors, intangible assets such as the value of the Group’s branch network, the long-termrelationships with depositors (core deposit intangibles), premises and equipment and shareholders’ equity. These items are material and accordingly the fair value information presented does not purport to represent, nor should it be construed to represent, the underlying value of the Group as a going concern at 31st December 2002.
The following table shows the carrying amount and the fair value of the Group’s financial instruments analysed between tradingand non-trading assets and liabilities.
2002 2001
Carrying Fair Carrying Fairamount value amount value
Note £m £m £m £m
Trading
AssetsTreasury bills and other eligible bills (a) 2,886 2,886 1,694 1,694Loans and advances to banks(including reverse repurchase agreements) (a) 42,805 42,805 35,693 35,693Loans and advances to customers(including reverse repurchase agreements) (a) 45,176 45,176 34,240 34,240Debt securities (a) 53,961 53,961 47,880 47,880Equity shares (a) 2,628 2,628 2,924 2,924Derivatives (see analysis in note 46) (b) 13,454 13,454 13,730 13,730London Metal Exchange warrants and other metals (a) 829 829 1,236 1,236trading positions (see note 24)
LiabilitiesDeposits by Banks and customers accounts(including repurchase agreements) (a) 66,103 66,103 45,527 45,527Short positions in securities (see note 30) (a) 39,940 39,940 26,200 26,200Derivatives (see analysis in note 46) (b) 11,538 11,538 11,091 11,091

Notes to the accountsFor the year ended 31st December 2002
Barclays PLC Annual Report 2002184
47 Fair values of financial instruments (continued)
2002 2001
Carrying FairCarrying Fair amount valueamount value restated restated
Note £m £m £m £m
Non-trading
AssetsCash and balances at central banks (a) 2,032 2,032 1,281 1,281Items in course of collection from other banks (a) 2,335 2,335 2,444 2,444Treasury bills and other eligible bills (a) 4,759 4,759 5,723 5,723Loans and advances to banks (c) 15,369 15,370 12,196 12,200Loans and advances to customers (d) 157,222 157,450 146,253 147,000Debt securities (e) 40,268 40,977 31,044 31,244Equity shares (e) 505 509 194 215Derivatives (see analysis in note 46) (b) 1,821 4,578 1,476 3,509
LiabilitiesDeposits by Banks and customers accounts (f ) 192,829 193,000 185,668 185,700Debt securities in issue (g) 45,885 46,004 41,846 41,904Items in course of collection due to other banks (a) 1,416 1,416 1,550 1,550Undated loan capital (h) 6,678 7,308 5,054 5,350Dated loan capital (h) 4,859 5,106 4,933 5,013Derivatives (see analysis in note 46) (b) 1,789 3,631 902 2,232
Notes(a) Financial assets and financial liabilities where fair value approximates carrying value because they are either (i) carried atmarket value or (ii) have minimal credit losses and are either short-term in nature or repriced frequently.
(b) Derivatives held for trading purposes are carried at fair value. Derivatives held for non-trading purposes are accounted for in accordance with the accounting treatment of the underlying transaction or transactions being hedged. The fair value of these instruments is estimated using market prices or pricing models consistent with the methods used for valuing similarinstruments used for trading purposes.
(c) Within this calculation, the fair value for loans and advances to banks was estimated using discounted cash flows, applying eithermarket rates, where practicable, or rates currently offered by other financial institutions for placings with similar characteristics.
(d) The Group provides lending facilities of varying rates and maturities to corporate and personal customers. In estimating thefair value of such instruments, the fair value of personal and corporate loans subject to variable interest rates is considered toapproximate the carrying value, in view of the unrestricted ability to prepay. The fair value of such instruments subject to fixedinterest rates was estimated by discounting cash flows using market rates or rates normally offered by the Group.
(e) The valuation of listed securities and investments is at mid-market prices and that of unlisted securities and investments isbased on the Directors’ estimate, which takes into consideration discounted cash flows, price earnings ratios and other suitablevaluation techniques.
(f ) Fair values of deposit liabilities payable on demand (interest free, interest bearing and savings deposits) approximate to their carrying value. The fair value of all other deposits and other borrowings was estimated using discounted cash flows,applying either market rates, where practicable, or rates currently offered by the Group for deposits of similar remaining maturities.
(g) Fair values of short-term debt securities in issue are approximately equal to their carrying amount. Fair values of other debt securities in issue are based on quoted prices where available, or where these are unavailable, are estimated using othervaluation techniques.
(h) The estimated fair values for dated and undated convertible and non-convertible loan capital were based upon quotedmarket rates for the issue concerned or equivalent issues with similar terms and conditions.

185Barclays PLC Annual Report 2002
Notes to the accountsFor the year ended 31st December 2002
48 Legal proceedingsProceedings have been brought in the United States against a number of defendants, including Barclays, following the collapse of Enron. In each case the claims are against groups of defendants and it is not possible to estimate Barclays possible loss, if any,in relation to them. Barclays considers the claims against it to be without merit and is defending them vigorously.
Barclays does not expect the ultimate resolution of the Enron related claims or the various other legal proceedings to whichBarclays is party to have a significant adverse effect on the financial position or profitability of the Group.
49 Post balance sheet eventsOn 31st January 2003, Barclays PLC announced the acquisition of Charles Schwab Europe, an execution-only retail stockbroker.
50 Reconciliation of operating profit to net cash flow from operating activities
2002 2001 2000restated restated
£m £m £m
Operating profit 3,218 3,438 3,186Provisions for bad and doubtful debts 1,484 1,149 817Depreciation and amortisation 545 528 302Net increase in accrued expenditure and prepayments (90) 114 188Provisions for contingent liabilities and commitments 1 1 (1)Other provisions for liabilities and charges 203 194 313Interest on dated and undated loan capital 645 602 382Decrease/(increase) in shareholders’ interest in the long-term assurance fund 55 (164) (165)Profit on redemption/repurchase of loan capital – – (2)Net (increase)/decrease in accrued interest payable and deferred income (402) 76 369Net profit on disposal of investments and fixed assets (47) (83) (60)Other non-cash movements 85 23 35
5,697 5,878 5,364Net change in items in course of collection (25) 439 (241)Net increase in other credit balances 13,105 4,717 1,857Net increase in loans and advances to banks and customers (35,997) (30,695) (7,942)Net increase in deposits and debt securities in issue 34,129 33,780 13,611Net (increase)/decrease in other assets (387) (2,523) 1,292Net (increase) in debt securities and equity shares (8,816) (5,949) (7,079)Net (increase)/decrease in treasury and other eligible bills (260) (1,901) 1,676Other non-cash movements (55) 53 (52)
Net cash inflow from operating activities 7,391 3,799 8,486

Notes to the accountsFor the year ended 31st December 2002
Barclays PLC Annual Report 2002186
51 Sale of Group undertakings during the year
2002Net cash outflow from formation of FirstCaribbean International Bank Ltd £m
Advances and other accounts 3,277Deposits and other borrowings (3,189)
Net assets disposed of 88Balance transferred to associated undertaking (366)Profit on disposal reflected in statementof total recognised gains and losses 206Amounts not yet settled (including deferred consideration) 28Cash at Bank and in hand disposed of (116)
Net cash outflow from formation ofFirstCaribbean International Bank Ltd (160)
The balance transferred to associated undertakings comprises the Group’s share of the net assets disposed of and the Group’sshare of the net assets acquired from the Canadian Imperial Bank of Commerce and goodwill thereon. Fair value adjustments of (£1m) have been applied to the assets acquired primarily relating to loans and advances to customers and customer accounts.
2002 2001 2000Sale of other Group undertakings £m £m £m
Goodwill written off 10 7 –Advances and other accounts 2 2,148 949Deposits and other borrowings (1) (2,109) (849)
Net assets disposed of 11 46 100Net (loss)/profit on disposal (3) (4) 207Amounts not yet settled (including deferred consideration) (8) – –Cash at bank and in hand disposed of (1) – –
Net cash (outflow)/inflow from sale of other Group undertakings (1) 42 307
52 Changes in financing during the yearThe following table does not include the premium of £516m paid in respect of the repurchase of ordinary shares or the Group’scontributions to the Qualifying Employee Share Ownership Trust (QUEST) of £48m.
Undated Datedloan loan Ordinary Share Minority
capital capital shares premium Interests£m £m £m £m £m
Barclays PLCAt beginning of year (restated) 5,054 4,933 1,668 5,149 134Exchange rate and other movements (220) (27) – – (13)Net cash inflow/(outflow) from financing 1,844 (47) (23) 128 35
At end of year 6,678 4,859 1,645 5,277 156

187Barclays PLC Annual Report 2002
Notes to the accountsFor the year ended 31st December 2002
53 Analysis of cash balances
31.12.02 Change 31.12.01 Change 31.12.00 Change 31.12.99£m £m £m £m £m £m £m
Cash and balances at central bank 2,032 751 1,281 38 1,243 77 1,166Loans and advances to other banks repayable on demand 1,973 (2,144) 4,117 2,023 2,094 1,127 967
4,005 (1,393) 5,398 2,061 3,337 1,204 2,133
2002 2001 2000
£m £m £m £m £m £m
Balance at beginning of year 5,398 3,337 2,133Net (decrease)/increase in cash before theeffect of exchange rate movements (1,207) 1,998 1,225Effect of exchange rate movements (186) 63 (21)
(1,393) 2,061 1,204
Balance at end of year 4,005 5,398 3,337
54 Analysis of the net outflow of cash in respect of the acquisition of subsidiary undertakings
2002 2001 2000£m £m £m
Cash consideration, including acquisition expenses 454 84 2,494Cash at bank and in hand acquired (3) (48) (73)
Net outflow of cash in respect of the purchase of Group undertakings 451 36 2,421
55 AcquisitionsThe Group made the following significant acquisitions of Group undertakings in 2002 which are accounted for on an acquisition basis:
% Acquired Date
UK Providian Credit Card Business 100.0 19th April 2002BNPI Mauritius 100.0 31st October 2002
Fair valueBook Value adjustments Fair value
£m £m £m
Net assets acquired Cash and balances at central banks 3 – 3Loans and advances to banks 156 – 156Loans and advances to customers 905 (32) 873Other assets 27 6 33Deposits by banks (24) – (24)Customer accounts (197) – (197)Other liabilities (497) (6) (503)
Net assets 373 (32) 341Goodwill 113
Satisfied by cash 454
The book value in the above table reflects all acquisitions made in the year.
The fair value adjustments in the above table primarily relate to UK Providian Credit Card Business and represent revaluationsresulting from adjusting assets and liabilities to a fair value based on discounted cashflow methodologies or management’s bestestimates of future economic benefits.

188 Barclays PLC Annual Report 2002
Notes to the accountsFor the year ended 31st December 2002
56 Related party transactionsa) Subsidiary undertakingsDetails of the principal subsidiary undertakings are shown in note 44. In accordance with FRS 8, transactions or balancesbetween Group entities that have been eliminated on consolidation are not reported.
b) Associated undertakings and joint venturesThe Group provides certain banking and financial services for associated undertakings and joint ventures. These are conductedon similar terms to third party transactions and are not material to the Group’s results. Details of lendings to associatedundertakings and joint ventures are set out in notes 15 and 16.
Edotech Limited, an associated undertaking, provides printing services to the Group. The cost of these services provided in theyear was £24.1m (2001: £22.9m, 2000: £10.7m). At the year end, the balance outstanding of £2.3m was included in sundrycreditors (2001: £2.2m).
Intelligent Processing Systems Limited (IPSL) is a joint venture between the Group, Lloyds TSB Bank PLC, HSBC Bank plc andUnisys Limited. The Bank has outsourced its cheque processing services to IPSL. The cost of these core services to the BarclaysGroup in the UK provided in the year was £30.2m (2001: £30.5m, 2000: £9.5m). At the year end, the balance outstanding of£2.2m was included in sundry creditors (2001: £0.6m). In addition, a further £6.3m was included in prepayments and accruedincome (2001: £nil).
Gresham Insurance Company Limited (Gresham) became an associated undertaking following the acquisition of Woolwich plc.The arrangement enables Gresham to underwrite major household insurances provided to customers of Woolwich plc.Underwriting payments made to Gresham during the year were £54.9m (2001: £53.2m, 2000: £49.3m) and balancesoutstanding of £6.9m (2001: £12.6m) are included in sundry creditors.
Global Home Loans Limited (GHL) is an associated undertaking of the Woolwich. Woolwich plc is engaged in transactions wherethe origination and processing activities of its mortgages are outsourced to GHL and its subsidiaries. The fees payable to GHLand its subsidiaries during the year were £57.9m (2001: £45.6m, 2000: £40.4). At the year end, the balance outstanding includedin sundry creditors was £8.9m. Payments made during the year by Woolwich plc as agent of GHL for salaries and other expensesamounted to £1.1m.
Gabetti Holding SpA, an associated undertaking, acts as an introducer of mortgage business to Woolwich plc and receivedcommission of £7.0m in 2002 (2001: £7.3m, 2000: £5.5m). At the year end, amounts outstanding of £1.0m (2001: £1.7m) were included in sundry creditors.
At the year end, an interest free loan of £4.5m made by Woolwich plc to Woolwich Qualifying Employee Share OwnershipTrustee Limited was outstanding. The loan was made to enable the Trustees to purchase shares in Woolwich plc to satisfy future exercises of share options and is repayable on or before 31 December 2005.
Littlewoods Personal Finance Limited (Littlewoods) was established in 1999 as a joint venture. The Group provides a retailfinancial service to Littlewoods’ retail customers and charged £1.7m during 2002 for account servicing, maintenance anddevelopment costs (2001: £0.8m, 2000: £1.2m). During 2002, Littlewoods provided marketing services to the Group for whicha fee of £5.3m was paid (2001: £2.9m, 2000: £1.2m). At 31st December 2002, £2.2m was owed to Littlewoods (2001: £nil).There was no amount outstanding from Littlewoods at that date (2001: £1.0m).
Barshelfco (No 73) Limited became a joint venture between the Group and Xansa PLC on 1st February 2002. The companydelivers IT services to Barclaycard. The IT service contract has an estimated minimum value of £125m over five years and around450 employees have transferred to Xansa from 1st February 2002. The cost of providing these services to Group during the yearwas £38.5m (2001: £nil). At 31st December the balance outstanding of £0.6m was included within sundry creditors. As set outin section d) below, Xansa is also a related party of the Group by way of common directorship.
FirstCaribbean International Bank(FCIB) became an associate of the Group in October 2002 following the combination of theretail, corporate and offshore banking operations of Barclays and Canadian Imperial Bank of Commerce. As part of thistransaction, the bank has agreed to ensure that the pension scheme assets are sufficient to cover the pension fund liabilities ofthe affected employees. At 31st December 2002, a provision of £20m is held to cover this liability. In addition, Barclaycard iscontinuing to manage the credit card portfolio for FCIB. Since October 2002, Barclaycard received £0.2m in management feesin respect of this arrangement.

189Barclays PLC Annual Report 2002
Notes to the accountsFor the year ended 31st December 2002
56 Related party transactions (continued)
c) Pension funds, unit trusts and investment fundsThe Group provides a number of normal current and interest bearing cash accounts to the Group pension funds (principally the UKRetirement Fund, the 1951 Fund and the Woolwich Pension Fund) in order to facilitate the day to day financial administration of thefunds. Group companies, principally BGI, also provide investment management and custodian services. The Group also providesnormal banking services for unit trust and investment funds managed by Group companies. These are all conducted on similarterms to third party transactions and are not individually material. In aggregate, amounts included in the accounts are as follows:
2002 2001 2000£m £m £m
Liabilities of Group – banking facilities 87 112 108Interest payable – banking facilities 2 3 4Commissions receivable – 6 9Fees receivable – investment management and custody 12 12 16Value of schemes’ investments in pooled funds managed by BGI 11,866 13,578 14,654Income from pooled funds managed by BGI 11 – –Investments in over the counter derivatives with other Group Companies 331 186 188Margin loans from other Group Companies 176 183 183
d) DirectorsDetails of Directors’ emoluments are set out in note 57 and further information on Directors’ emoluments, shareholding, options and awards is given in the Barclays report on remuneration on pages 44 to 51.
In the ordinary course of business, the Bank makes loans to companies where a Director or officer is also a Director of Barclays.With the exception of an interest free five year loan of £0.5m to the Charities Aid Foundation group of which Sir Brian Jenkins isChairman of Trustees, these loans are made on substantially the same criteria and terms, including interest rates and collateral,as those prevailing at the time for comparable transactions with other persons and did not involve more than the normal risk ofcollectibility or present other unfavourable features.
Xansa PLC, of which Hilary Cropper CBE is Executive Chairman, provides software support and development resource capabilityto the Group. The total value of these transactions for the years ending 31st December 2002 was £14.3m. (2001: £21.5m, 2000:£15.5m) This is in addition to the transactions with Barshelfco (No. 73) Limited discussed in note b) above
Cable and Wireless PLC, of which Graham Wallace is Chief Executive, has a five year Telecommunication services contract withthe Group. This was awarded as part of a competitive tender activity. The cost to the Group during 2002 for the provision ofthese services was £2.2m.
57 Directors’ emoluments and other benefitsThe aggregate emoluments and other benefits of the Directors of Barclays PLC set out below are disclosed in accordance withPart I of Schedule 6 to the Companies Act 1985.
2002 2001£000 £000
Aggregate emoluments 6,069 5,828Gains made on the exercise of share options 499 27Amounts paid under long-term incentive schemes 1,235 638Compensation for loss of office – –Notional pension contributions to money purchase schemes (2002: 1 Director and 2001: 1 Director) 990 425
3 Directors are accruing retirement benefits under a defined benefit scheme (2001: 3 Directors).
Of the figures in the table above, the amounts attributable to the highest paid Director, Matthew Barrett, are as follows:
2002 2001£000 £000
Aggregate emoluments 1,920 2,193Amounts paid under long-term incentive schemes 744 –Notional pension contribution to a money purchase scheme 990 425
Further information on Directors’ emoluments, shareholdings, options and awards is given in the Barclays report onremuneration section.

190 Barclays PLC Annual Report 2002
Notes to the accountsFor the year ended 31st December 2002
58 Directors’ and officers’ shareholding and optionsDetails of Directors’ share interests and options are given in the Corporate Governance section on pages 44 to 51.
The beneficial ownership of the ordinary share capital of Barclays PLC by all Directors and officers of Barclays PLC (involving22 persons) and Barclays Bank PLC (involving 23 persons) at 31st December 2002 amounted to 1,474,863 ordinary shares of 25p each (0.02% of ordinary share capital outstanding).
Executive Directors and officers of Barclays PLC as a group (involving 13 persons) held, at 31st December 2002, options topurchase 23,014,430 Barclays PLC ordinary shares of 25p each at prices ranging from 199p to 411p under the SAYE Share OptionScheme, and ranging from 222p to 445p under the Executive Share Option Scheme and ranging from 390p to 520p under theIncentive Share Option Plan, respectively, and ranging from 329p to 384p under The Woolwich ESOP, exercisable in the periodfrom 2003 to 2012.
59 Contracts with Directors and connected persons and with managersThe aggregate amounts outstanding at 31st December 2002 under transactions, arrangements and agreements made by authorisedinstitutions within the Group for persons who are, or were during the year, Directors of Barclays PLC and persons connected withthem and for managers, within the meaning of the Financial Services and Markets Act 2000, of Barclays Bank PLC were:
Number of Number of AmountDirectors or connected £000
managers persons
DirectorsLoans 2 – 930Quasi-loans and credit card accounts 9 7 42ManagersLoans 7 – 514Quasi-loans and credit card accounts 7 – 12
There are no transactions, arrangements or agreements with Barclays PLC or its subsidiary undertakings in which Directors, or persons connected with them, or managers of Barclays Bank PLC had a material interest and which are disclosable under therelevant provisions of the Companies Act 1985, other than options to subscribe for Barclays PLC ordinary shares as described in note 58.
60 Other entitiesThere are a number of entities that do not qualify as subsidiary undertakings but which give rise to benefits that are insubstance no different from those that would arise were the entity a subsidiary. The details of these entities are given below.
In accordance with the disclosure required by FRS 5, the summarised combined results by type of entity for each main financialstatement heading where there are material items, are set out below:
Credit structuring business Asset securitisation vehicles Financing transactions
2002 2001 2002 2001 2002 2001£m £m £m £m £m £m
Profit and loss accountInterest receivable 164 139 36 34 3 5Interest payable (164) (139) (36) (34) (3) (5)Operating profit – – – – – –
Balance sheetFixed Assets – – 91 – – –Investment in subsidiaries 1 – – – – 2Other Investments – – 807 – 159 78Debt securities 1,966 1,411 644 607 – –Amounts due from related party 1,482 1,522 – – 1,846 60Other debtors – 8 – – –Current assets – – 6 – – –Cash 44 32 – – – –Debt securities in issue (3,463) (2,933) (1,451) (607) – –Corporation tax payable – – – – – (2)Amounts due to related party (26) – – – (2,005) (137)Creditors due less than one year/accruals (1) (40) (2) – – –Creditors due greater than one year – – (95) – – –Shareholders’ funds – retained profit (3) – – – – (1)
CashflowNet cash inflow from operating activities 10 32 – – (3) –

191Barclays PLC Annual Report 2002
Notes to the accountsFor the year ended 31st December 2002
61 Segmental analysis2002 2001 2000
restated restated
By geographical segments (a)(b) £m % £m % £m %
Interest receivableUK 10,429 87 11,328 84 9,347 80Other European Union 737 6 862 6 679 6United States 262 2 511 4 1,001 8Rest of the World 616 5 757 6 761 6
12,044 100 13,458 100 11,788 100
Fees and commissions receivableUK 3,396 76 3,095 74 2,581 70Other European Union 247 6 258 6 262 7United States 537 12 547 13 461 13Rest of the World 274 6 302 7 372 10
4,454 100 4,202 100 3,676 100
Dealing profitsUK 642 77 729 72 583 87Other European Union 8 1 21 2 1 –United States 136 16 212 21 44 6Rest of the World 47 6 49 5 49 7
833 100 1,011 100 677 100
Other operating incomeUK 150 41 253 59 183 53Other European Union 207 57 166 39 152 43United States 2 1 1 – 9 2Rest of the World 5 1 8 2 9 2
364 100 428 100 353 100
Gross income (d)UK 14,617 83 15,405 81 12,694 77Other European Union 1,199 7 1,307 7 1,094 7United States 937 5 1,271 6 1,515 9Rest of the World 942 5 1,116 6 1,191 7
17,695 100 19,099 100 16,494 100
Profit on ordinary activities before taxUK 2,898 91 2,680 79 2,758 81Other European Union 351 11 410 12 315 9United States (218) (7) 85 2 67 2Rest of the World 174 5 250 7 252 8
3,205 100 3,425 100 3,392 100
Attributable profitUK 2,025 90 1,922 79 1,990 82Other European Union 284 13 347 14 252 10United States (161) (7) 48 2 41 2Rest of the World 82 4 129 5 162 6
2,230 100 2,446 100 2,445 100

192 Barclays PLC Annual Report 2002
Notes to the accountsFor the year ended 31st December 2002
61 Segmental analysis (continued)2002 2001 2000
restated restated
£m % £m % £m %
Total assetsUK 302,386 75 266,830 75 235,339 75Other European Union 26,126 6 20,278 5 18,788 6United States 51,919 13 48,701 14 38,662 12Rest of the World 22,635 6 20,803 6 23,397 7
403,066 100 356,612 100 316,186 100
Net assetsUK 11,084 72 10,572 72 9,555 71Other European Union 2,521 16 2,294 16 2,188 17United States 1,074 7 988 7 1,002 7Rest of the World 682 5 765 5 688 5
15,361 100 14,619 100 13,433 100
By class of business (a), (b)
Net interest incomePersonal Financial Services 1,892 31 1,954 33 1,396 27Barclays Private Clients 766 12 829 14 788 16Barclaycard 886 14 807 14 681 13Business Banking 1,620 26 1,553 25 1,488 29Barclays Africa 160 3 176 3 179 4Barclays Capital 889 14 639 11 474 9Barclays Global Investors 12 – 5 – 6 –Other operations and Head office functions 32 1 38 1 103 2Other items (c) (52) (1) (35) (1) (7) –
6,205 100 5,966 100 5,108 100
Non interest incomePersonal Financial Services 1,076 21 998 19 702 16Barclays Private Clients 557 11 718 14 729 17Barclaycard 696 14 579 11 518 11Business Banking 888 17 829 16 795 17Barclays Africa 115 2 136 3 133 3Barclays Capital 1,350 26 1,448 28 1,172 26Barclays Global Investors 538 11 518 10 434 10Other operations and Head office functions (98) (2) (50) (1) (97) –
5,122 100 5,176 100 4,386 100
Total income (d)Personal Financial Services 2,968 26 2,952 26 2,098 22Barclays Private Clients 1,323 12 1,547 14 1,517 16Barclaycard 1,582 14 1,386 12 1,199 13Business Banking 2,508 22 2,382 21 2,283 24Barclays Africa 275 2 312 3 312 3Barclays Capital 2,239 20 2,087 19 1,646 17Barclays Global Investors 550 5 523 5 440 5Other operations and Head office functions (66) (1) (12) – 6 –Other items (c) (52) – (35) – (7) –
11,327 100 11,142 100 9,494 100

193Barclays PLC Annual Report 2002
Notes to the accountsFor the year ended 31st December 2002
61 Segmental analysis (continued)
2002 2001 2000restated restated
£m % £m % £m %
Profit/(loss) on ordinary activities before taxPersonal Financial Service 867 27 803 23 557 16Barclays Private Clients 281 9 553 16 553 16Barclaycard 615 19 504 15 429 13Business Banking 1,219 38 1,050 31 1,006 30Barclays Africa 89 3 123 4 93 3Barclays Capital 581 18 655 19 517 15Barclays Global Investors 110 4 78 2 59 2Other operations (179) (6) (28) (1) 79 2Head office functions (121) (4) (80) (2) (64) (2)Other items (c) (257) (8) (233) (7) 163 5
3,205 100 3,425 100 3,392 100
Total assets
Personal Financial Services 71,871 18 64,314 18 60,993 19Barclays Private Clients 14,016 3 13,886 4 14,098 5Barclaycard 10,669 3 9,404 3 9,867 3Business Banking 47,315 12 44,132 12 41,344 13Barclays Africa 2,632 1 2,756 1 2,291 1Barclays Capital 236,472 58 201,301 57 167,197 53Barclays Global Investors 494 – 308 – 259 –Other operations and Head office functions 8,379 2 8,250 2 7,157 2Goodwill 3,934 1 4,091 1 4,269 1Retail life-fund attributable to policyholders 7,284 2 8,170 2 8,711 3
403,066 100 356,612 100 316,186 100
Net assetsPersonal Financial Services 6,041 39 6,375 44 5,783 43Barclays Private Clients 946 6 933 6 906 7Barclaycard 1,759 11 1,086 7 1,171 8Business Banking 3,080 20 2,855 20 2,436 18Barclays Africa 244 2 274 2 222 2Barclays Capital 2,279 16 2,006 14 1,849 14Barclays Global Investors 358 2 267 2 269 2Other operations and Head office functions 654 4 823 5 797 6
15,361 100 14,619 100 13,433 100
Notes(a) The analyses above are for Barclays PLC. Figures for attributable profit differ for Barclays Bank PLC and are shown on page 231.
(b) Basis of geographical and class of business analysis – see Accounting presentation on page 134.
(c) ‘Other items within class of business net interest income and total income reflects fair value adjustments relating to theacquisition of Woolwich plc of (£52m) (2001: (£35m), 2000: (£7m). ‘Other items’ in profit/(loss) on ordinary activities before taxconsist of (i) Goodwill amortisation £254m (2001: £229m, 2000: £51m) and (ii) an exceptional item charge of £3m (2001: £4mcharge, 2000: £214m credit).
(d) Gross income for geographical disclosure includes interest receivable, fees and commissions receivable, dealing profits andother operating income. Total income for class of business disclosure analyses operating income from the profit and loss account.
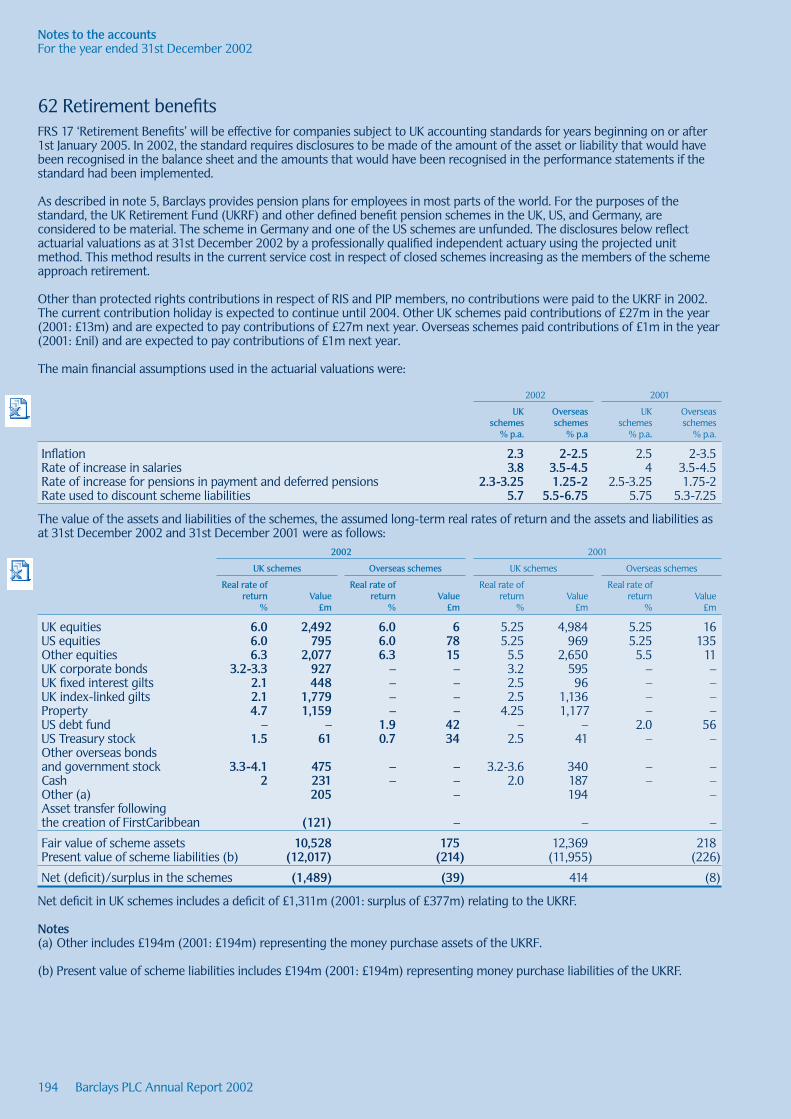
194 Barclays PLC Annual Report 2002
Notes to the accountsFor the year ended 31st December 2002
62 Retirement benefitsFRS 17 ‘Retirement Benefits’ will be effective for companies subject to UK accounting standards for years beginning on or after1st January 2005. In 2002, the standard requires disclosures to be made of the amount of the asset or liability that would havebeen recognised in the balance sheet and the amounts that would have been recognised in the performance statements if thestandard had been implemented.
As described in note 5, Barclays provides pension plans for employees in most parts of the world. For the purposes of thestandard, the UK Retirement Fund (UKRF) and other defined benefit pension schemes in the UK, US, and Germany, areconsidered to be material. The scheme in Germany and one of the US schemes are unfunded. The disclosures below reflectactuarial valuations as at 31st December 2002 by a professionally qualified independent actuary using the projected unitmethod. This method results in the current service cost in respect of closed schemes increasing as the members of the schemeapproach retirement.
Other than protected rights contributions in respect of RIS and PIP members, no contributions were paid to the UKRF in 2002.The current contribution holiday is expected to continue until 2004. Other UK schemes paid contributions of £27m in the year(2001: £13m) and are expected to pay contributions of £27m next year. Overseas schemes paid contributions of £1m in the year(2001: £nil) and are expected to pay contributions of £1m next year.
The main financial assumptions used in the actuarial valuations were:
2002 2001
UK Overseas UK Overseasschemes schemes schemes schemes
% p.a. % p.a % p.a. % p.a.
Inflation 2.3 2-2.5 2.5 2-3.5Rate of increase in salaries 3.8 3.5-4.5 4 3.5-4.5Rate of increase for pensions in payment and deferred pensions 2.3-3.25 1.25-2 2.5-3.25 1.75-2Rate used to discount scheme liabilities 5.7 5.5-6.75 5.75 5.3-7.25
The value of the assets and liabilities of the schemes, the assumed long-term real rates of return and the assets and liabilities asat 31st December 2002 and 31st December 2001 were as follows:
2002 2001
UK schemes Overseas schemes UK schemes Overseas schemes
Real rate of Real rate of Real rate of Real rate ofreturn Value return Value return Value return Value
% £m % £m % £m % £m
UK equities 6.0 2,492 6.0 6 5.25 4,984 5.25 16US equities 6.0 795 6.0 78 5.25 969 5.25 135Other equities 6.3 2,077 6.3 15 5.5 2,650 5.5 11UK corporate bonds 3.2-3.3 927 – – 3.2 595 – –UK fixed interest gilts 2.1 448 – – 2.5 96 – –UK index-linked gilts 2.1 1,779 – – 2.5 1,136 – –Property 4.7 1,159 – – 4.25 1,177 – –US debt fund – – 1.9 42 – – 2.0 56US Treasury stock 1.5 61 0.7 34 2.5 41 – –Other overseas bonds and government stock 3.3-4.1 475 – – 3.2-3.6 340 – –Cash 2 231 – – 2.0 187 – –Other (a) 205 – 194 –Asset transfer followingthe creation of FirstCaribbean (121) – – –
Fair value of scheme assets 10,528 175 12,369 218Present value of scheme liabilities (b) (12,017) (214) (11,955) (226)
Net (deficit)/surplus in the schemes (1,489) (39) 414 (8)
Net deficit in UK schemes includes a deficit of £1,311m (2001: surplus of £377m) relating to the UKRF.
Notes(a) Other includes £194m (2001: £194m) representing the money purchase assets of the UKRF.
(b) Present value of scheme liabilities includes £194m (2001: £194m) representing money purchase liabilities of the UKRF.

195Barclays PLC Annual Report 2002
Notes to the accountsFor the year ended 31st December 2002
62 Retirement benefits (continued)
The surpluses and deficits would be presented in the balance sheet as follows:2002 2001
Pension Pension Pension Pensionasset liability asset liability
£m £m £m £m
Scheme surpluses/(deficits) 28 (1,556) 550 (144)Related deferred tax (liability)/asset (8) 467 (165) 43
Net pension asset/(liability) 20 (1,089) 385 (101)
As described in note 5, the Group also provides post-retirement health care to certain UK and US pensioners. The disclosuresbelow reflect actuarial valuations as at 31st December 2002 by a professionally qualified independent actuary. The rate ofincrease in medical expenses used in the actuarial valuation was 4.8% in the UK (2001: 5%) and 4.75% in the US (2001: 6%) and the discount rate used was 5.7% in the UK (2001: 5.75%) and 6.75% in the US (2001: 7.25%). The liability was as follows:
2002 2001£m £m
Deficit (306) (304)Related deferred tax asset 92 91
Net post-retirement liability (214) (213)
The net reserve for pension schemes and post-retirement healthcare is (£1,283m) (2001: £71m).
The amounts that would have been recognised in the profit and loss account and statement of total recognised gains and lossesin respect of pension schemes and post-retirement health care in 2002 were as follows:
2002Analysis of amounts charged to operating profit £m
Current service cost (a) 322Past service cost 19Gains and losses on settlements and curtailments 5
Total operating charge 346
Note(a) Current service cost includes £48m relating to the RIS and PIP section of the UKRF.
2002Analysis of amounts included as other finance income £m
Expected return on scheme assets 892Interest on scheme liabilities (699)
Net return 193

196 Barclays PLC Annual Report 2002
Notes to the accountsFor the year ended 31st December 2002
62 Retirement benefits (continued)
2002 2002UK schemes Overseas schemes
As % of As % ofpresent present
As % of value of As % of value ofscheme scheme scheme scheme
assets liabilities assets liabilities£m % % £m % %
Actual return less expected return on scheme assets 2,153 21 31 18Experience gains and losses arising on the scheme liabilities (33) – 2 1Changes in assumptions underlying thepresent value of scheme liabilities (302) 3 (2) 1
Actuarial loss recognised in statement of totalrecognised gains and losses 1,818 15 31 14
Post-UK Overseas retirement
pension pension healthschemes schemes care
£m £m £m
Surplus/(deficit) in the schemes at beginning of year 414 (8) (304)Contributions 42 1 17Current service cost (316) (5) (1)Past service cost (18) (1) –Settlements and curtailments (6) 1 –Exchange movements – 2 4Other finance income/(cost) 209 2 (18)Actuarial loss (1,814) (31) (4)
Deficit in the schemes at end of year (1,489) (39) (306)
Analysis of movements in pension scheme and post-retirementhealthcare surpluses/(deficits) during 2002
Analysis of amounts included in the statement of total recognised gains and losses

197Barclays PLC Annual Report 2002
Notes to the accountsFor the year ended 31st December 2002
63 Differences between UK GAAP and US GAAP accounting principlesThe accounts presented in this report have been prepared in accordance with accounting principles generally accepted in the UK(UK GAAP). Such principles vary in significant respects from those generally accepted in the United States (US GAAP). Preparingthe financial statements requires management to make estimates and assumptions that affect reported income, expenses, assetsand liabilities and disclosures of contingent assets and liabilities. Actual results could be different from those estimates. Thesignificant differences applicable to the Group’s accounts are summarised below.
UK GAAPGoodwillGoodwill arising on acquisitions of subsidiary and associatedundertakings and joint ventures is capitalised and amortisedthrough the profit and loss account over its expected usefuleconomic life (with a maximum of 20 years). Capitalisedgoodwill is written off when judged to be irrecoverable. In the event of a subsequent disposal, any goodwill previouslycharged directly against reserves under Statement of Standard Accounting Practice (SSAP) 22 will be writtenback and reflected in the profit or loss on disposal.
Core deposit intangiblesUnder UK GAAP the value of depositor relationships is notconsidered to be a separately identifiable asset and is includedwithin goodwill.
PensionsIn respect of defined benefit schemes, pension fund assets are assessed actuarially at the present value of the expectedfuture investment income, which is consistent with SSAP 24.Most liabilities are discounted at a long-term interest rate and variations from regular cost are allocated over the expected average remaining service lives of currentemployees.
For defined contribution schemes the net pension cost recognised in the profit and loss account represents the contributions payable to the scheme, in accordance with SSAP 24.
Post-retirement benefitsPost-retirement health care liabilities are assessed actuariallyon a similar basis to pension liabilities under SSAP 24 and arediscounted at a long-term rate. Variations from regular costare expressed as a percentage of payroll and spread over theaverage remaining service lives of current eligible employees.
Leasing – lessorGross earnings under finance leases are allocated in such a wayas to give a constant periodic rate of return on the (post-tax) net cash investment.
US GAAP
Prior to 1st January 2002, goodwill was capitalised and amortisedover its useful economic life under the provisions of APB16.
SFAS 141 and SFAS 142 require intangible assets currently heldon the balance sheet to be separately identified, amortisationto cease being charged on goodwill balances and goodwillbalances to be reviewed annually for impairment.
US GAAP can require the recognition of certain assets and liabilities that would either not be recognised or have a different measurement value under UK GAAP. This will lead to a different value of goodwill for US purposes.
In relation to the acquisition of a deposit taking institution, a separate intangible asset representing depositor relationshipsis recognised. To the extent that such an asset is recognisedthere is a commensurate reduction in the amount of recordedgoodwill. The value ascribed is amortised to net income overthe average life of the depositor relationships in question.Following the issue of SFAS 147, on the acquisition of financialinstitutions after 1st October 2002 the excess of assumedliabilities over acquired assets is treated as part of goodwillrather than as an unidentifiable intangible asset.
Intangible assets are reviewed annually for impairment underthe provisions of SFAS 144 as required by SFAS 147.
In respect of defined benefit schemes, the same basic actuarial method is used under SFAS 87 as under UK GAAP, but certain assumptions differ, assets are assessed at fair value and liabilities are assessed at current settlement rates.Certain variations from regular cost are allocated in equalamounts over the average remaining service lives of currentemployees.
For defined contribution schemes SFAS 87 provides for the same treatment as under UK GAAP.
Under SFAS 106, there are certain differences in the actuarialmethod used and variations in the computation of regular costas compared with UK GAAP.
Application of SFAS 13 gives rise to a level rate of return on theinvestment in the lease, but without taking into account taxpayments and receipts. This results in income being recognisedin different periods than under UK GAAP, the magnitude of thedifference depending upon the value and average age of theleasing portfolio at each period end.

198 Barclays PLC Annual Report 2002
63 Differences between UK GAAP and US GAAP accounting principles (continued)
UK GAAPLeasing – lesseeIn accordance with FRS 5 and SSAP 21, leases are categorisedas finance leases when the substance of the agreement is thatof a financing transaction and the lessee assumes substantiallyall of the risks and benefits relating to the asset. All otherleases are categorised as operating leases.
Deferred taxPrior to 1st January 2002 deferred tax was recognised usingthe liability method on timing differences that have originatedbut not reversed at the balance sheet date.
Following the introduction of FRS 19 deferred tax is nowprovided in full in respect of timing differences which have notreversed at the the balance sheet date.
Revaluation of propertyProperty is carried either at original cost or at subsequentvaluation less related depreciation (as described in Accountingpolicies), calculated on the revalued amount where applicable.Revaluation surpluses are taken directly to shareholders’ funds,while deficits below cost, less any related depreciation, areincluded in attributable profit.
From 1st January 2000, following the introduction of FRS 15, the revalued book amounts are being retained withoutsubsequent revaluation subject to the requirement to test for impairment.
Depreciation is charged on the cost or revalued amounts offreehold and long-leasehold properties over their estimateduseful economic lives.
Shareholders’ interest in the retail long-term assurance fundThe value of the shareholders’ interest in the retail long-termassurance fund represents an estimate of the net present valueof the profits inherent in the in-force policies.
Disposal of investmentsExchange rate translation differences, which arise in respect offoreign currency denominated investments, are included in thecarrying value of the investment and are also accumulated inthe reserves in the consolidated accounts. The profit or loss onany disposal is calculated by comparing the net proceeds withthe then carrying value of the investment.
Share compensation schemesWhere shares are purchased, the difference between thepurchase price and any contribution made by the employee is charged to the profit and loss account in the period to whichit relates. Where shares are issued, or options granted, thecharge made to the profit and loss account is the differencebetween the fair value at the time the award is made and anycontribution made by the employee. For these purposes fairvalue is equal to the intrinsic value of the option.
US GAAP
Leases are classified as capital leases when any of certaincriteria are met as outlined under SFAS 13. All other leases areclassified as operating leases. Provisions are made for certainlosses arising on subleases of leases treated as finance leasesunder SFAS 13.
Under SFAS 109, a liability method is also used, but deferredtax assets and liabilities are calculated for all temporarydifferences. A valuation allowance is raised against a deferred tax asset where it is more likely than not that some portion of the deferred tax asset will not be realised.
Revaluations of property are not permitted in the accountsunder US GAAP. As a result, when a revalued property isdisposed of, a greater profit or lower loss is generally recordedunder US GAAP than under UK GAAP.
Freehold and long-leasehold property is depreciated over itsestimated useful economic life based on the historical cost.
The net present value of the profits inherent in the in-force life and pensions policies of the long-term assurance fund is not recognised by the Group under US GAAP. An adjustment is made for the amortisation of acquisition costs and fees inaccordance with SFAS 60 and SFAS 97.
SFAS 52 requires similar treatment of exchange rate translationdifferences, except that, on disposal, cumulative exchange ratetranslation differences, which have previously been taken toreserves, are reversed and reported as part of the profit or losson sale of the investment.
The Group adopted SFAS 123 which encourages the adoptionof accounting for share compensation schemes, based on theirestimated fair values at the date of the grant. Accordingly, theGroup charges this fair value to the profit and loss accountover the period to their vesting dates.
Notes to the accountsFor the year ended 31st December 2002
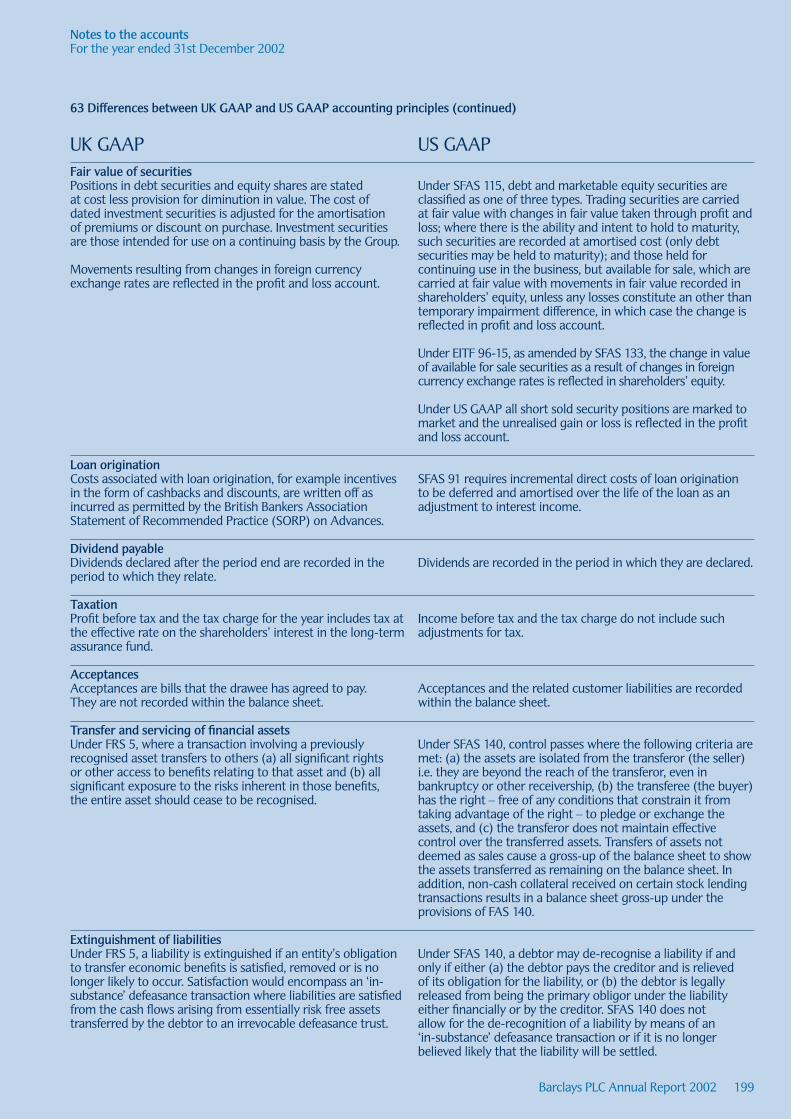
199Barclays PLC Annual Report 2002
Notes to the accountsFor the year ended 31st December 2002
63 Differences between UK GAAP and US GAAP accounting principles (continued)
UK GAAPFair value of securitiesPositions in debt securities and equity shares are statedat cost less provision for diminution in value. The cost of dated investment securities is adjusted for the amortisationof premiums or discount on purchase. Investment securitiesare those intended for use on a continuing basis by the Group.
Movements resulting from changes in foreign currencyexchange rates are reflected in the profit and loss account.
Loan origination Costs associated with loan origination, for example incentivesin the form of cashbacks and discounts, are written off asincurred as permitted by the British Bankers AssociationStatement of Recommended Practice (SORP) on Advances.
Dividend payableDividends declared after the period end are recorded in theperiod to which they relate.
TaxationProfit before tax and the tax charge for the year includes tax atthe effective rate on the shareholders’ interest in the long-termassurance fund.
AcceptancesAcceptances are bills that the drawee has agreed to pay. They are not recorded within the balance sheet.
Transfer and servicing of financial assetsUnder FRS 5, where a transaction involving a previouslyrecognised asset transfers to others (a) all significant rights or other access to benefits relating to that asset and (b) allsignificant exposure to the risks inherent in those benefits, the entire asset should cease to be recognised.
Extinguishment of liabilitiesUnder FRS 5, a liability is extinguished if an entity’s obligationto transfer economic benefits is satisfied, removed or is nolonger likely to occur. Satisfaction would encompass an ‘in-substance’ defeasance transaction where liabilities are satisfiedfrom the cash flows arising from essentially risk free assetstransferred by the debtor to an irrevocable defeasance trust.
US GAAP
Under SFAS 115, debt and marketable equity securities areclassified as one of three types. Trading securities are carriedat fair value with changes in fair value taken through profit andloss; where there is the ability and intent to hold to maturity,such securities are recorded at amortised cost (only debtsecurities may be held to maturity); and those held forcontinuing use in the business, but available for sale, which arecarried at fair value with movements in fair value recorded inshareholders’ equity, unless any losses constitute an other thantemporary impairment difference, in which case the change isreflected in profit and loss account.
Under EITF 96-15, as amended by SFAS 133, the change in valueof available for sale securities as a result of changes in foreigncurrency exchange rates is reflected in shareholders’ equity.
Under US GAAP all short sold security positions are marked tomarket and the unrealised gain or loss is reflected in the profitand loss account.
SFAS 91 requires incremental direct costs of loan origination to be deferred and amortised over the life of the loan as anadjustment to interest income.
Dividends are recorded in the period in which they are declared.
Income before tax and the tax charge do not include suchadjustments for tax.
Acceptances and the related customer liabilities are recordedwithin the balance sheet.
Under SFAS 140, control passes where the following criteria aremet: (a) the assets are isolated from the transferor (the seller)i.e. they are beyond the reach of the transferor, even inbankruptcy or other receivership, (b) the transferee (the buyer)has the right – free of any conditions that constrain it fromtaking advantage of the right – to pledge or exchange theassets, and (c) the transferor does not maintain effectivecontrol over the transferred assets. Transfers of assets notdeemed as sales cause a gross-up of the balance sheet to showthe assets transferred as remaining on the balance sheet. Inaddition, non-cash collateral received on certain stock lendingtransactions results in a balance sheet gross-up under theprovisions of FAS 140.
Under SFAS 140, a debtor may de-recognise a liability if andonly if either (a) the debtor pays the creditor and is relieved of its obligation for the liability, or (b) the debtor is legallyreleased from being the primary obligor under the liabilityeither financially or by the creditor. SFAS 140 does not allow for the de-recognition of a liability by means of an ‘in-substance’ defeasance transaction or if it is no longerbelieved likely that the liability will be settled.

200 Barclays PLC Annual Report 2002
63 Differences between UK GAAP and US GAAP accounting principles (continued)
UK GAAPNettingUnder FRS 5, items should be aggregated into a single itemwhere there is a right to insist on net settlement and thedebit balance matures no later than the credit balance.
Own sharesOwn shares are holdings of Barclays PLC listed sharesreacquired on the open market. Shares are purchased byemployee benefit trusts or held as part of the trading equityoperations and shown as assets where Barclays retains the risks and rewards of ownership. They are carried at cost lessimpairment or fair value respectively.
Restructuring of business provisionsIn accordance with FRS 3 and FRS 12, provisions have beenmade for any direct costs and net future operating lossesarising from a business that management is committed torestructure, sell or terminate, has a detailed formal plan forexit, and has raised a valid expectation of carrying out therestructuring plan.
Computer software developed or obtained for internal useThe Group’s general policy is to write-off such expenditure asincurred except where the software is required to facilitate theuse of new hardware. Capitalised amounts are recorded astangible fixed assets.
DerivativesWhere a derivative is documented and evidenced as reasonablyexpected to match or eliminate risk from a transaction, hedgeaccounting is applied. Profits or losses on that derivative areincluded in the relevant income or expense category as part ofthe yield on that transaction.
Derivatives that are not hedge accounted are recorded at fairvalue, with the change recorded in the profit and loss account.
US GAAP
Under FASB interpretation No (FIN) 39, netting is onlypermitted where there is a legal right of set-off and anintention to settle on a net basis. In addition, under FIN 41,repurchase and reverse repurchase agreements may only be netted where they have the same explicit settlement datespecified at the inception of the agreement.
Netting presentation differences exist between UK and US GAAPin relation to repurchase and reverse repurchase agreements,securities lending and borrowing agreements, receivables andpayables in respect of unsettled trades, long and shortsecurities, and cash collateral held against derivatives.
ARB 31 requires shares purchased at balance sheet date tobe held at cost and deducted from equity.
Emerging Issues Task Force (EITF) 94-3 and Staff AccountingBulletin (SAB) 100 set out specific conditions which must be met to enable liabilities relating to restructuring, sale orinvoluntary terminations to be recognised in the periodmanagement approve the termination plan. In respect of costs other than employee termination benefits, the basicrequirements for recognition at the date of commitment to the plan to terminate are that they are not associated with, or do not benefit, activities that will be continued.
AICPA Statement of Position (SOP) 98-1 requires certain costsincurred in respect of software for internal use to be capitalisedand subsequently amortised over its useful life. Capitalisedamounts are reviewed regularly for impairment.
SFAS 133 requires all derivatives to be recorded at fair value. If certain conditions are met then the derivative may bedesignated as a fair value or cash flow hedge. The change in value of the fair value hedge is recorded in income alongwith the change in fair value of the hedged asset or liability.The change in value of a cash flow hedge is recorded in othercomprehensive income and reclassified to income as thehedged cash flows affect earnings. Barclays has chosen not toupdate the documentation of hedges to comply fully with therequirements of SFAS 133.
Certain terms and conditions of hybrid contracts whichthemselves would be standalone derivatives are bifurcatedfrom the underlying hybrid contract and fair valued if they arenot clearly and closely related to the contract they arecontained in. These are referred to as embedded derivatives.
Notes to the accountsFor the year ended 31st December 2002

201Barclays PLC Annual Report 2002
Notes to the accountsFor the year ended 31st December 2002
63 Differences between UK GAAP and US GAAP accounting principles (continued)
UK GAAPInvestment contractsIn accordance with FRS 5, certain products offered toinstitutional pension funds are accounted for as investmentproducts when the substance of the investment is that ofmanaged funds. The assets and related liabilities are excludedfrom consolidated balance sheet.
Consolidation of special purpose entitiesEntities should be consolidated when they are under thecontrol of the reporting entity. Under FRS 2 control is theability to direct the financial and operating policies of theentity with a view to gaining economic benefit and may beexercised through majority voting rights or other means.Under FRS 5 control may also be evidenced by the party thatreceives the benefits of the net assets of the entity wherefinancial and operating policies are predetermined.
Earnings per shareBasic earnings per share (EPS) is net income per weightedaverage share in issue. Diluted EPS measures the effect thatexisting options would have on the basic EPS if they were to beexercised, by increasing the number of ordinary shares.
Cash flow statementThe cashflow statement is prepared according to therequirements of FRS 1 (revised). It defines cash as cash andbalances at central banks and loans and advances to banksrepayable on demand.
The two statements differ with regard to the classification of items within the cash flow statement and with regard to the definition of cash.
Classification Classificationunder FRS 1 (revised) under SFAS 95/104
Dividends received Returns on investment and servicing of finance Operating activities
Dividends paid – equity Equity dividends paid Financing activities
Tax paid Taxation Operating activities
Net change in loans and advances, including finance lease receivables Operating activities Investing activities
Net change in deposits and debt securities in issue Operating activities Financing activities
US GAAP
The legal form of these products is similar to insurancecontracts, which are accounted for in accordance with SFAS 97.Accordingly, the assets and liabilities associated with these products are recorded on the balance sheet.
Entities should be consolidated when they are under thecontrol of the reporting entity. This is presumed when the reporting entity is the majority owner. However, thispresumption can be rebutted in certain circumstances, if theentity meets criteria set out in EITF 90-15, EITF 96-21 and inrelation to Qualifying Special Purpose Entities under theprovisions of FAS 140. In cases where the reporting entity isnot the majority owner, entities may still be required to beconsolidated in certain circumstances if they fail to meet thecriteria set out in EITF Topic D-14 to avoid consolidation.
The basic EPS under US GAAP differs only to the extent thatincome under US GAAP differs. In addition, the Diluted EPSdiffers as the increased shares are reduced by the number ofshares that could be bought (using the average market priceover the year) with the assumed exercise proceeds (actualproceeds arising on exercise plus unamortised compensationcosts, where appropriate). Any options that are antidilutive are excluded from this calculation.
The cash flow statement for US GAAP is prepared under SFAS 95, as amended by SFAS 104. This defines cash beinginclusive of cash equivalents which are short-term highly liquid investments that are both readily convertible into known amounts of cash and that are so near maturity thatthey present insignificant risk of changes in value because of changes in interest rates.

202 Barclays PLC Annual Report 2002
Notes to the accountsFor the year ended 31st December 2002
63 Differences between UK GAAP and US GAAP accounting principles (continued)
Applicable developments in US GAAPSFAS 143 ‘Accounting for Asset Retirement Obligations’SFAS 143 was issued in June 2001. It requires a provision to be raised for the legal obligation in relation to the other-than-temporary removal of a tangible fixed asset, at fair value, when incurred. It is effective for Barclays from 1st January 2003. It is not expected to have a material impact on the financial statements.
SFAS 146: ‘Accounting for costs associated with exit or disposals’SFAS 146 was issued in June 2002 and is effective for Barclays from 1st January 2003 and addresses the financial accounting and reporting for costs associated with exit or disposal activities. This standard requires that the fair value of a liability for acost associated with an exit or disposal activity be recognised when the liability is incurred and nullifies EITF 94-3 whichrequires the recognition of a liability at the date of an entity’s commitment to an exit plan. This is not expected to have amaterial effect on the Group’s results.
SFAS 147: ‘Accounting of certain financial institutions, an amendment to SFAS 72 and 144 and FIN 9’SFAS 147 was issued on 1st October 2002 and amends the requirements of FASB 72 and 144 and FIN 9. It requires that for acquisitions of financial institutions that occur after 1st October 2002 and which meet the definitions of a businesscombination, the excess of assumed liabilities over acquired assets should be treated as goodwill rather than as an unidentifiable intangible asset. In addition the standard requires that long term customer relationship intangible assets offinancial institutions should be subject to the same impairment tests as required by FAS 144 ‘Impairment of Disposal of Long-Lived Assets. The effect of the adoption in 2002 was not material.
SFAS 148: ‘Accounting for share-based compensation-transition and disclosures’ SFAS 148 was issued on 1st January 2003. It amends SFAS 123 to provide alternate methods of transition for entitiesvoluntarily adopting a fair value based method of accounting for stock-based employee compensation. It also amends thedisclosure provisions of SFAS 123. Barclays adopted the fair value method of accounting for stock-based employeecompensation from 1st January 1996 and therefore is not affected by this standard.
EITF Issue 02-03 ‘Issues involved in accounting for derivative contracts held for trading purposes and contracts involved inEnergy Trading and Risk Management activities’The EITF discussed issue 02-03 through much of 2002 and reached a final consensus at the 25th October meeting. The FASBstaff’s view on the impact of the consensus on non-energy derivative contracts was clarified at the 21st November 2002meeting.
The principal requirement affecting Barclays is that, for energy derivative contracts with effect from July 2002 and non-energycontracts with effect from 21st November 2002, where the fair value is not determined using either observable market pricesor models which use market-observable variables as inputs, the unrealised gain or loss at inception on new contracts shouldnot be recognised. The impact on the reported results for 2002 was not material.
FIN45: Guarantor’s accounting and disclosure requirements for guarantees, including indirect guarantees of indebtedness of others.FIN 45 was issued on 25th November 2002. It addresses disclosure requirements for guarantors in respect of guarantees issued(including guarantees embedded in other contracts) and requires recognition of a liability to be recognised for all obligationsassumed under guarantees issued.
The disclosure requirements are effective for periods ending after 15th December 2002 and are reflected on page 216 in thisreport. The measurement requirements are effective for guarantees issued from 1st January 2003. Barclays is currentlyassessing the impact this will have on future reporting.
FIN46: Consolidation of variable interest entities.FIN 46 was issued on 17th January 2003. This addresses the criteria to be applied when determining whether certain specialpurpose entities (variable interest entities) should be consolidated and requires disclosures to be made if the involvement withan unconsolidated variable interest entity is significant. The interpretation is effective for interests in vehicles acquired after31st January 2003. The disclosure requirements of the interpretation are effective for interests Barclays has acquired before1st February 2003 for the year ended 31st December 2003. The guidance may be applied prospectively with a cumulativeeffect adjustment in the period of initial application or by restating comparatives with a cumulative effect adjustment in thefirst year restated.
Barclays is assessing the impact of FIN46 on all entities with which it is involved. Management’s assessment of the possibleimpact as regards consolidation or deconsolidation is ongoing. Where it has been identified as possible that entities will beconsolidated or that the relationship with such an entity will need to be disclosed once the new pronouncement is effective,the relationships are discussed on page 214.

203Barclays PLC Annual Report 2002
Notes to the accountsFor the year ended 31st December 2002
63 Differences between UK GAAP and US GAAP accounting principles (continued)2002 2001 2000
Note £m £m £m
Attributable profit of Barclays PLC Group (UK GAAP) 2,230 2,465 2,473Prior year adjustment (UK GAAP) (y) – (19) (28)
2,230 2,446 2,445
Goodwill (a) 237 5 (12)Core deposit intangibles (b) (64) (64) (12)Pension cost (c) (195) (203) (193)Post-retirement benefits (c) (18) (17) (15)Leasing – lessor (7) 9 (14)Leasing – lessee (10) (3) 3Deferred tax (d),(y) (32) 30 (175)Share compensation schemes (e),(y) (82) (81) (44)Shareholders’ interest in the long-term assurance fund (f) 109 87 (20)Provisions for restructuring of business (l) (22) 23 15Disposal of investments – (3) (12)Extinguishment of liabilities (159) – –Revaluation of property 5 1 4Business Combinations (k) 206 – –Internal use software (n) (207) 70 123Internal hedging (o) – – 148Derivatives (q) 553 278 –Fair value of securities (h) (276) (39) –Foreign exchange on available for sale securities (p) 152 210 –Loan origination 31 43 17Fair value amortisation credit (s) 8 8 1Consolidation of special purpose entities – 72 (72)Tax effect on the above UK/US GAAP reconciling items 17 (177) 8
Net income (US GAAP) 2,476 2,695 2,195
Barclays PLC Group p p p
Basic earnings per 25p ordinary share (g) 37.4 40.5 36.3Diluted earnings per 25p ordinary share (g) 37.2 40.1 35.9
2002 2001£m £m
Equity shareholders’ funds (UK GAAP) 15,205 14,508Prior year adjustment (UK GAAP) (y) – (23)
15,205 14,485
Goodwill (a) 298 71Core deposit intangibles (b) (140) (76)Pension cost (c) (848) (462)Post-retirement benefits (c) (50) (32)Leasing – lessor (166) (159)Leasing – lessee – 10Deferred tax (d),(y) – 32Share compensation schemes (e) – (191)Shareholders’ interest in the long-term assurance fund (f),(y) (549) (658)Revaluation of property (i) (241) (313)Fair value of securities (h) 515 387Dividend payable 787 728Own shares (59) (6)Extinguishment of liabilities (159) –Provisions for restructuring of business (l) 16 38Internal use software (n) 81 288Derivatives (q) 1,273 628Loan origination 91 60Fair value amortisation credit (s) 17 9Tax effect on the above UK/US GAAP reconciling items (56) (26)
Shareholders’ equity (US GAAP) 16,015 14,813
Selected financial data, adjusted from UK GAAP to reflect the main differences from US GAAP, is given on page 234.

204 Barclays PLC Annual Report 2002
Notes to the accountsFor the year ended 31st December 2002
63 Differences between UK GAAP and US GAAP accounting principles (continued)
(a) GoodwillOn 1st January 2002, the Group implemented SFAS 141 ‘Business Combinations’ and SFAS 142 ‘Goodwill and other tangibleassets’. The Group reviewed the carrying value of its goodwill as at 1st January 2002 and considered that there was noimpairment to be recognised. From the date of implementation, goodwill is no longer amortised. Due to significant changes inthe operating environments of certain subsidiaries, further impairment tests were conducted based on expected future earningsand the value of comparable businesses and an impairment charge of £24m was made during the year. The effect on net incomeof applying this standard to previous periods would have been:
2001 2000£m £m
Reported net income 2,695 2,195Goodwill amortisation 199 40
Net income 2,894 2,235
The current carrying value of goodwill for US GAAP purposes has been allocated as follows to the reportable business segmentsof the Group:
2002£m
Personal Financial Services 2,712Barclays Private Clients 629Barclaycard 224Business Banking 41Barclays Africa 7Barclays Capital 47Barclays Global Investors 201Other Operations 10
3,871
(b) Core deposit intangible2002 2001
£m £m
Balance bought forward 374 438Additions 8 –Amortisation charged to profit and loss (64) (64)
Balance carried forward 318 374
The core deposit intangible consists of £310m in relation to the acquisition of Woolwich plc and £8m in respect of the transactionthat created FirstCaribbean. These amounts are allocated to the Personal Financial Services and Barclays Private Clientsrespectively for the purposes of conducting impairment reviews under SFAS 142.
(c) Pension cost and post-retirement benefitsThe disclosures below reflect the amendments to the requirements of SFAS 87 and SFAS 106 arising from SFAS 132 ‘Employers’Disclosures about Pensions and Other Post-retirement Benefits’.
The excess of pension plan assets over the projected benefit obligation, as at the transition date, is recognised as a reduction ofpension expense on a prospective basis over approximately 15 years.
The provisions of US GAAP have only been applied to the main UK pension scheme, the UK Retirement Fund (previouslyknown as the Barclays Bank (1964) Pension Fund) and the Woolwich Pension Fund based on a valuation date of 30th September2002. The following analysis relates to the UK Retirement Fund (1964 Pension Scheme and retirement investment scheme) andthe Woolwich pension fund which makes up approximately 95% of all the Group’s schemes in terms of assets and actuarialliabilities. The impact on income of applying US GAAP on the other Group schemes is considered to be immaterial.

205Barclays PLC Annual Report 2002
Notes to the accountsFor the year ended 31st December 2002
63 Differences between UK GAAP and US GAAP accounting principles (continued)
(c) Pension cost and post-retirement benefits (continued)The components of the pension and post-retirements expense which arise under US GAAP are as follows:
2002 2001 2000
Post- Post- Post-retirement retirement retirement
Pensions benefits Pensions benefits Pensions benefits£m £m £m £m £m £m
Components of net periodic benefit costService cost 275 1 374 1 352 1Interest cost 624 18 652 11 591 9Expected return on plan assets (807) – (854) – (788) –Amortisation of transition adjustment (23) 2 (23) 2 (23) 2Curtailment and termination benefits 76 2 (5) – – –Recognised net actuarial (gain)/deficit – 10 – 3 – 4
Net periodic benefit cost 145 33 144 17 132 16
For measurement purposes, the calculation assumes a 12% and 4.75% annual rate of increase in the per capita cost of coveredmedical benefits and dental benefits respectively for pensioners in schemes in the US. The medical benefit rate is furtherassumed to reduce steadily each year to 4.75% in 2007 and remain at that level thereafter.
For pensioners in schemes in the UK a 4.75% annual rate of increase in the per capita cost of covered medical benefits was assumed.
Assumed health care cost trend rates have a significant effect on the amounts reported for the health care plans. A onepercentage point change in assumed health care trend rates would have the following effects for 2002.
1% increase 1% decrease£m £m
Effect on total of service and interest cost components 3 (3)Effect on post-retirement benefit obligation 52 (46)
The following table presents the estimated funded status of the pension schemes and post-retirement benefits (the latter areunfunded) under US GAAP:
2002 2001 2000
Post- Post- Post-retirement retirement retirement
Pensions benefits Pensions benefits Pensions benefits£m £m £m £m £m £m
Change in benefit obligationBenefit obligation at beginning of year 10,789 295 13,361 184 10,872 176Adjustment for RIS – – – – 74 –Service cost 275 1 374 1 352 1Interest cost 624 13 652 11 591 9Plan participants’ contributions 6 – 7 – 4 –Curtailment and termination benefits 76 – (24) – – –Actuarial (gain)/loss 941 28 (3,159) 111 1,846 9Benefits paid (415) (16) (422) (12) (378) (11)
Benefit obligation at end of year 12,296 321 10,789 295 13,361 184
Change in plan assetsFair value of plan assets at beginning of year 11,135 – 13,452 – 11,337 –Adjustment for RIS – – – – 74 –Actual return on plan assets (618) – (1,981) – 1,414 –Employer contribution/transfers 44 16 97 12 1,001 11Curtailment adjustment – – (18) – – –Plan participants’ contributions 6 – 7 – 4 –Benefits paid (415) (16) (422) (12) (378) (11)
Fair value of plan assets at end of year 10,152 – 11,135 – 13,452 –
Funded status (2,144) (321) 346 (295) 91 (184)Unrecognised transition amount (12) 13 (35) 18 (57) 19Unrecognised net actuarial (gain)/loss 1,590 182 (774) 164 (371) 57
Accrued benefit cost (566) (126) (463) (113) (337) (108)
206 Barclays PLC Annual Report 2002
Notes to the accountsFor the year ended 31st December 2002
63 Differences between UK GAAP and US GAAP accounting principles (continued)
(c) Pension cost and post-retirement benefits (continued)The accumulated benefit obligations are £10,909m resulting in a minimum liability (excess of accumulated benefit obligationsover market value of assets) of £757m. The accumulated benefit obligation exceeds the accrued benefit cost by £191m. This hasbeen charged through other comprehensive income.
Pension plan assets are invested primarily in equities, fixed interest securities and property.
Further details of the post-retirement health care expense under UK GAAP are given in note 5 to the accounts.
In accordance with US GAAP requirements, the actuaries for the pensions plan used the following assumptions on a weightedaverage basis; discount rate of 5.3% (2001: 6.0%, 2000: 5.0%), rate of compensation increase of 3.75% (2001: 4.0%, 2000: 4.5%),and expected long-term rate of return on plan assets of 6.8% (2001: 7.5 %, 2000: 6.5%).
In accordance with the US GAAP requirements, the accounting for the post-retirement benefits charge assumed a discount rate of 5.3% (2001: 6.0%, 2000: 5.0%) for UK benefits and 6.75% (2001: 7.25%, 2000: 7.5%) for US benefits, on a weightedaverage basis.
(d) Deferred taxIn accordance with SFAS No. 109 ‘Accounting for Income Taxes’, the components of the net US GAAP deferred tax liability are as follows:
2002 2001£m £m
Deferred tax liabilities:Leasing transactions (766) (816)Capital allowances – –In respect of UK/US GAAP reconciling items (332) (160)Other (266) (284)
Total deferred tax liabilities (1,364) (1,260)
Deferred tax assets:Specific allowances 15 39General allowance 245 201Tax losses 203 183Capital allowances 108 14In respect of UK/US GAAP reconciling items 254 139Other 159 218
Total deferred tax assets before valuation allowance 984 794Less: valuation allowance (159) (139)
Deferred tax assets less valuation allowance 825 655
Net deferred tax liability under US GAAP (539) (605)
(i) The main components of the tax charge attributable to continuing operations are shown in note 10 to the accounts.Included in the tax effect on net income of UK/US GAAP reconciling items for 2002 is a credit amount of £59m relating todeferred tax (2001: £61m, 2000: £58m).
(ii) The valuation allowance relates to the Group’s capital losses and unrelieved overseas tax losses. These assets will berecognised in the future when it becomes likely that they will be utilised.

207Barclays PLC Annual Report 2002
Notes to the accountsFor the year ended 31st December 2002
63 Differences between UK GAAP and US GAAP accounting principles (continued)
(e) Share compensation schemesThe SFAS 123 charge for the fair value of options granted since 1995 is £82m (2001: £81m, 2000: £44m).
The ESOS, SAYE, ISOP, the BGI Equity Ownership Plan (EOP), the Woolwich ESOP and the Woolwich SAYE scheme fall within the scope of SFAS 123.
Analysis of the movement in the number and weighted average exercise price of options are set out below. The prior yearcomparatives for all the schemes apart from the BGI Equity ownership plan have been restated to take into account thesubdivision of each ordinary share of £1 each into four ordinary shares of 25p each.
Executive Share Option Scheme (a) SAYE Share Option Scheme (a)
Number Weighted average Number Weighted average(000’s) ex. price (£) (000’s) ex. price (£)
2002 2001 2002 2001 2002 2001 2002 2001
Outstanding at beginning of year 9,546 14,352 4.04 3.89 123,441 132,458 3.29 2.92Granted in the year – – – – 30,216 25,741 3.50 4.12Exercised in the year (1,066) (4,085) 3.56 3.51 (20,087) (27,066) 3.22 2.30Less: Forfeited in the year (312) (721) 4.33 4.06 (6,675) (7,692) 3.51 3.05
Outstanding at end of year 8,168 9,546 4.09 4.04 126,895 123,441 3.34 3.29
Incentive Share Option Plan (a) BGI Equity ownership plan (b)
Number Weighted average Number Weighted average(000’s) ex. price (£) (000’s) ex. price (£)
2002 2001 2002 2001 2002 2001 2002 2001
Outstanding at beginning of year 42,523 15,024 4.83 3.91 13,407 5,535 7.87 6.11Granted in the year 36,397 28,215 5.14 5.15 5,885 8,498 10.92 8.98Exercised in the year – – – – (659) (162) 6.36 6.11Less: Forfeited in the year (1,327) (716) 4.77 4.37 (824) (464) 8.33 7.95
Outstanding at end of year 77,593 42,523 4.98 4.83 17,809 13,407 8.91 7.87
Woolwich ESOP scheme (a) Woolwich SAYE scheme (a)
Number Weighted average Number Weighted average(000’s) ex. price (£) (000’s) ex. price (£)
2002 2001 2002 2001 2002 2001 2002 2001
Outstanding at beginning of year 10,448 12,024 3.79 3.80 4,529 6,262 3.18 3.16Granted in the year – – – – – – – –Exercised in the year (1,522) (1,500) 3.97 3.84 (504) (1,553) 3.30 3.10Less: Forfeited in the year (141) (76) 3.50 3.87 (261) (180) 3.28 3.17
Outstanding at end of year 8,785 10,448 3.77 3.79 3,764 4,529 3.16 3.18
Woolwich ESOP (c) Woolwich SAYE scheme (c)
Number Weighted average Number Weighted average(000’s) ex. price (£) (000’s) ex. price (£)
2002 2001 2002 2001 2002 2001 2002 2001
Outstanding at beginning of year or upon acquisition if earlier – 1,300 – 3.27 – 673 – 2.93Rolled over into Barclays options – – – – – – – –or cancelled for cash – – – – – – – –Exercised in the year – (671) – 3.22 – (160) – 2.87Less: Forfeited in the year – (629) – 3.32 – (513) – 2.95
Outstanding at end of year – – – – – – – –
Notes(a) Options granted over Barclays PLC shares(b) Options granted over BGI UK Holdings Limited shares(c) Options granted over Woolwich plc shares

208 Barclays PLC Annual Report 2002
Notes to the accountsFor the year ended 31st December 2002
63 Differences between UK GAAP and US GAAP accounting principles (continued)
(e) Share compensation schemes (continued)The disclosures of options outstanding only relate to those granted from 1995 onwards.
The range of exercise prices, weighted average fair values at the date of grant and the weighted average remaining contractuallife for options outstanding at the balance sheet date are as follows:
2002 2001
Weighted Weighted Weighted Weightedaverage Weighted average average Weighted average
Exercise exercise average remaining Exercise exercise average remainingprice range price fair value life price range price fair value life
£ £ £ Years £ £ £ Years
Executive Share Option Scheme (a) 1.76-4.45 4.09 1.13 6 1.76-4.45 4.04 1.14 6SAYE Share Option Scheme (a) 1.57-4.11 3.33 1.85 3 1.57-3.56 3.29 1.68 3Incentive Share Option Plan (a) 3.77-5.62 4.98 2.06 7 3.77-4.22 4.83 1.94 9BGI Equity Ownership Plan (b) 6.11-10.92 8.91 3.03 9 6.11-8.98 7.87 3.18 9The Woolwich SAYE scheme (a) 3.08-3.37 3.16 2.48 1 3.08-3.37 3.18 2.44 2The Woolwich ESOP (a) 3.29-4.22 3.77 2.71 7 3.29-4.22 3.79 2.68 8
Fair values for the ISOP, ESOS, SAYE, the Woolwich ESOP, the Woolwich SAYE and the BGI EOP are calculated at the date of grantusing a binomial model which produces similar results to the Black-Scholes model. The significant weighted averageassumptions used to estimate the fair value of the options granted in 2002 are as follows:
BGIISOP SAYE EOP(b)
Risk-free interest rate 5.56 4.68 4.01Expected life (years) 10 4 10Expected volatility 51 59 –
The range, weighted average exercise price, weighted average remaining contractual life and number of options outstanding,including those exercisable at year end (see page 209), are as follows:
Weighted Weightedaverage average Number of
exercise price remaining life optionsExecutive Price Range £ Years outstanding
Executive Share Option Scheme£1.50 – £2.49 2.04 4 260,000£2.50– £3.49 3.47 5 611,068£3.50 – £4.49 4.22 8 7,296,804SAYE Share Option Scheme (a)£1.50 – £2.49 1.80 2 11,580,052£2.50 – £3.49 3.13 4 44,939,898£3.50 – £4.49 3.72 4 70,375,808BGI Equity Ownership Plan (b)£6.00 – £9.99 7.92 8 11,924,117£10.00 – £13.99 10.92 10 5,885,000Incentive Share Option Plan (a)£3.50 – £4.49 3.91 8 16,140,600£4.50 – £5.49 5.26 8 61,452,192Woolwich ESOP (a)£2.50 – £3.49 3.29 7 1,876,984£3.50 – £4.49 3.67 7 6,907,976Woolwich SAYE scheme (a)£2.50 – £3.49 3.16 1 3,764,117
Notes(a) Options granted over Barclays PLC shares(b) Options granted over BGI UK Holdings Limited shares

209Barclays PLC Annual Report 2002
Notes to the accountsFor the year ended 31st December 2002
63 Differences between UK GAAP and US GAAP accounting principles (continued)
(e) Share compensation schemes (continued)The range, weighted average exercise price and number of options exercisable at the year end are as follows:
Weighted average Number of exercise price options
Exercise Price Range £
Executive Share Option Scheme£1.50 – £2.49 2.04 260,000£2.50– £3.49 3.47 611,068£3.50 – £4.49 4.28 6,595,980SAYE Share Option Scheme£1.50 – £2.49 1.57 5,394,840£2.50 – £4.49 3.36 1,429,500BGI Equity Ownership Plan£6.11 – £8.98 7.48 5,420,898Woolwich SAYE Scheme£2.50 – £3.49 – –Woolwich ESOP£3.50 – £4.49 3.67 6,907,976
The expected dividends for all schemes are assumed to grow in line with the expected increases in share prices for the industrysector until exercise.
The ESOS is a long-term incentive scheme and was available by invitation to certain senior executives of the Group with grants usually made annually. Options were issued at the market price at the date of the grant without any discount,calculated in accordance with the rules of the Scheme, and are normally exercisable between three and ten years from that date.No further awards are made under ESOS.
Eligible employees in the UK may participate in the SAYE. Under this Scheme, employees may enter into contracts to save up to £250 per month and, at the expiry of a fixed term of three, five or seven years, have the option to use these savings to acquireshares in the Company at a discount, calculated in accordance with the rules of the scheme. The discount is currently 20% of themarket price at the date the options were granted.
The ISOP has been introduced to replace the ESOS. It is open by invitation to the employees and Directors of Barclays PLC.Options are granted at the market price at the date of grant calculated in accordance with the rules of the Plan, and arenormally exercisable between three and ten years from that date. The final number of shares over which the option may be exercised will be determined by reference to set performance criteria. The number of shares under option represents themaximum possible number that may be exercised.
The BGI Equity Ownership Plan is extended to senior employees of BGI. The exercise price of the options is determined by formula at the date of grant and is not less than the market value of the share at the time of grant. The options are granted over shares in BGI UK Holdings Limited, a subsidiary of Barclays Bank PLC. Options are normally not exercisable untilvesting, with a third of the options held becoming exercisable at each anniversary of grant. Options lapse ten years after grant.At 31st December 2002 17.8m (2001: 13.4m) options were outstanding under the terms of the BGI Equity Ownership Planenabling certain members of staff to subscribe for shares in BGI UK Holdings Limited between 2002 and 2011 at prices between£6.11 and £10.92.
The Woolwich ESOP and SAYE schemes have similar terms to the Barclays ESOS and SAYE schemes described above, issuingoptions over shares in Woolwich plc. No further awards will be made under either of these schemes. Following the acquisition ofWoolwich plc by Barclays PLC holders of options under these two schemes were able to rollover the options for an option on thesame terms, except for the withdrawal of the performance criteria, over Barclays shares, obtain a cash payment in exchange forcancellation of the options or choose to exercise the options at any time up to 24th April 2001. Upon exercise of an option overWoolwich plc shares, the option holder received £1.64 in cash and 0.1175 Barclays shares for each Woolwich share availableunder the option.

210 Barclays PLC Annual Report 2002
Notes to the accountsFor the year ended 31st December 2002
63 Differences between UK GAAP and US GAAP accounting principles (continued)
(f) Shareholders’ interest in the long-term assurance fundThe adjustment to US GAAP net income in 2002 of £109m (2001: £87m, 2000: (£20m)) reflects the impact of the closure of the UK activity to new business.
(g) Earnings per share2002 2001 2000
Weighted Weighted Weightedaverage Per-Share average Per-Share average Per-Share
Income Share no. amount Income Share no. amount Income Share no. amount£m (in millions) Pence £m (in millions) Pence £m (in millions) Pence
Basic EPSNet income(US GAAP) available toordinary shareholders 2,476 6,626 37.4 2,695 6,651 40.5 2,195 6,055 36.3Effect of dilutive securitiesEmployee share options 40 60 52Other schemes (6) 4 8
Diluted EPS 2,476 6,660 37.2 2,695 6,715 40.1 2,195 6,115 35.9
The effect of applying SFAS 142 to the previous periods would have been:2001 2000
pence pence
Reported basic EPS 40.5 36.3Goodwill amortisation 3.0 0.7
Adjusted basic EPS 43.5 37.0
Reported Diluted EPS 40.1 35.9Goodwill amortisation 3.0 0.7
Adjusted Diluted EPS 43.1 36.6
UK EPS is detailed in note 13. Of the total number of employees’ share options existing at the year end, the following were notincluded in the dilution calculation above because they were antidilutive:
2002 2001 2000in millions in millions in millions
Number of options 80 52 68
Certain incentive plan shares have been excluded from the calculation of the basic EPS as the trustee has waived all dividend andvoting rights. These shares are subsequently brought into the diluted earnings per share calculation (called ‘Other schemes’) above.

211Barclays PLC Annual Report 2002
Notes to the accountsFor the year ended 31st December 2002
63 Differences between UK GAAP and US GAAP accounting principles (continued)
(h) Fair value of securitiesUnlisted investment equity securities are outside the scope of SFAS 115 ‘Accounting for Certain Investments in Debt and EquitySecurities’ and continued to be carried at cost of £456m at 31st December 2002 (2001: £121m). The fair value of thesesecurities was £456m (2001: £126m). Included within fair value of securities is an adjustment of (£276m) (2001: (£39m), 2000:£nil) relating to mark to market of short positions.
All quoted investment securities are classified as being ‘available for sale’ unless the Group has a clear intention and abilityto hold them to maturity. Other debt securities are classified as trading securities (see note 18).
There were no material gross gains or gross losses realised on the transfer of debt and equity securities from the available forsale category into the trading category in 2002 or 2001.
(i) Revaluation of propertyIn 1990, £449m of property revaluation reserve was capitalised by the issue of bonus shares.
(j) Loan impairment and disclosureSFAS 114 applies only to impaired loans, the measurement of which is based upon the present value of expected future cashflows discounted at the loan’s effective interest rate, the loan’s observable market value, or the fair value of the collateral if theloan is collateral dependent. Smaller balance homogeneous consumer loans that are collectively evaluated for impairment areoutside the scope of SFAS 114, as are debt securities and leases. At 31st December 2002, the element of impaired loans outsidethe scope of SFAS 114 amounted to £1,922m (2001: £2,670m).
In accordance with SFAS 114, the Group’s total impaired loans are those reported as non-performing on page 66, less impairedloans outside the scope of SFAS 114, and amount to £2,604m at 31st December 2002 (2001: £1,201m). Credit risk provisions of £1,335m, estimated in accordance with SFAS 114, were held against these loans (2001: £705m). The average level of suchimpaired lendings in 2002 was £2,147m (2001: £1,093m).
Where cash received represents the realisation of security, or there is doubt regarding the recovery of a loan, such receipts are treated as repayments of the loan principal. Otherwise, cash received in respect of impaired loans is recognised as interestincome. Estimated interest income which was recognised in 2002 on impaired loans within the scope of SFAS 114 was £5m(2001: £36m).
SFAS 114 modifies the accounting for in-substance foreclosure, in that collateralised debts where the Group takes physicalpossession of the collateral, regardless of formal insolvency procedures, would be reclassified as if the collateral had beenacquired for cash. At 31st December 2002, under US GAAP, the amount of collateral recorded at the lower of the book value of the debt or the fair value of the collateral that would be reclassified as “other real estate owned” was £6m (2001: £17m), as “other assets” was £nil (2001: £78m) and as equity was £6m (2001: £nil).
Included within loans and advances to customers are £830m (2001: £887m) which are held with the intention of resale.
(k) Business combinationOn 11th October 2002, Barclays and Canadian Imperial Bank of Commerce completed the combination of their retail, corporateand offshore banking operations and created FirstCaribbean International Bank. Under both UK and US GAAPs Barclays accountsfor the resulting interest as an associate. The transaction generated a gain of £206m under both UK and US GAAP, the gainbeing recorded through the Statement of Total Recognised Gains and Losses for UK GAAP under UITF 31 but in the profit andloss account under US GAAP (APB 29 and EITF 01-02). The net assets of the businesses transferred by Barclays to the new entityare not materially different under US GAAP.
Barclays share of the adjustments FirstCaribbean International Bank made to reflect its net income and net assets on a US GAAPbasis of £6m are included in the appropriate reconciling item.
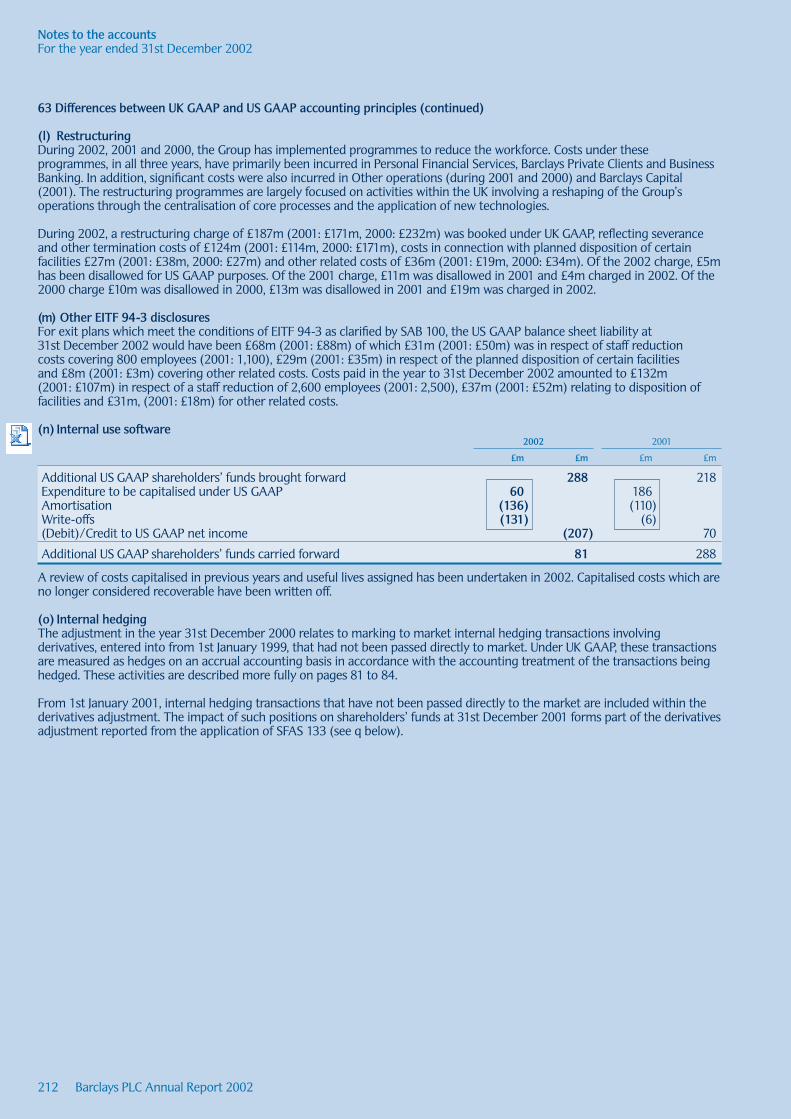
212 Barclays PLC Annual Report 2002
Notes to the accountsFor the year ended 31st December 2002
63 Differences between UK GAAP and US GAAP accounting principles (continued)
(l) RestructuringDuring 2002, 2001 and 2000, the Group has implemented programmes to reduce the workforce. Costs under theseprogrammes, in all three years, have primarily been incurred in Personal Financial Services, Barclays Private Clients and BusinessBanking. In addition, significant costs were also incurred in Other operations (during 2001 and 2000) and Barclays Capital(2001). The restructuring programmes are largely focused on activities within the UK involving a reshaping of the Group’soperations through the centralisation of core processes and the application of new technologies.
During 2002, a restructuring charge of £187m (2001: £171m, 2000: £232m) was booked under UK GAAP, reflecting severanceand other termination costs of £124m (2001: £114m, 2000: £171m), costs in connection with planned disposition of certainfacilities £27m (2001: £38m, 2000: £27m) and other related costs of £36m (2001: £19m, 2000: £34m). Of the 2002 charge, £5mhas been disallowed for US GAAP purposes. Of the 2001 charge, £11m was disallowed in 2001 and £4m charged in 2002. Of the2000 charge £10m was disallowed in 2000, £13m was disallowed in 2001 and £19m was charged in 2002.
(m) Other EITF 94-3 disclosuresFor exit plans which meet the conditions of EITF 94-3 as clarified by SAB 100, the US GAAP balance sheet liability at31st December 2002 would have been £68m (2001: £88m) of which £31m (2001: £50m) was in respect of staff reduction costs covering 800 employees (2001: 1,100), £29m (2001: £35m) in respect of the planned disposition of certain facilities and £8m (2001: £3m) covering other related costs. Costs paid in the year to 31st December 2002 amounted to £132m (2001: £107m) in respect of a staff reduction of 2,600 employees (2001: 2,500), £37m (2001: £52m) relating to disposition offacilities and £31m, (2001: £18m) for other related costs.
(n) Internal use software2002 2001
£m £m £m £m
Additional US GAAP shareholders’ funds brought forward 288 218Expenditure to be capitalised under US GAAP 60 186Amortisation (136) (110)Write-offs (131) (6)(Debit)/Credit to US GAAP net income (207) 70
Additional US GAAP shareholders’ funds carried forward 81 288
A review of costs capitalised in previous years and useful lives assigned has been undertaken in 2002. Capitalised costs which areno longer considered recoverable have been written off.
(o) Internal hedgingThe adjustment in the year 31st December 2000 relates to marking to market internal hedging transactions involvingderivatives, entered into from 1st January 1999, that had not been passed directly to market. Under UK GAAP, these transactionsare measured as hedges on an accrual accounting basis in accordance with the accounting treatment of the transactions beinghedged. These activities are described more fully on pages 81 to 84.
From 1st January 2001, internal hedging transactions that have not been passed directly to the market are included within thederivatives adjustment. The impact of such positions on shareholders’ funds at 31st December 2001 forms part of the derivativesadjustment reported from the application of SFAS 133 (see q below).

213Barclays PLC Annual Report 2002
Notes to the accountsFor the year ended 31st December 2002
63 Differences between UK GAAP and US GAAP accounting principles (continued)
(p) Foreign exchange differences on available for sale securitiesWithin individual legal entities Barclays holds securities in a number of different currencies which are classified as available forsale. In general, no foreign exchange exposure arises from this because, although the value of the assets changes in sterlingterms according to the exchange rate, there is an identical offsetting change in the sterling value of the related funding. UnderUK GAAP both the assets and the liabilities are generally translated at closing exchange rates and the differences betweenhistorical book value and current value are reflected in the profit and loss account.
Under US GAAP, the change in value of the investments is taken directly to reserves while the offsetting change in sterling termsof the borrowing is taken to profit and loss.
A similar difference arises where foreign currency assets are covered using forward contracts but where the Group does notmanage these hedges to conform with the detailed US designation requirements. Prior to 2001, all these differences wereincluded within the derivatives adjustment.
The impact of this requirement is to transfer net foreign exchange gains or losses on currency securities from net income toother comprehensive income. No difference between the Group's UK and US GAAP shareholder’s equity arises from this transfer.
(q) DerivativesSFAS 133 requires all derivatives to be recorded at fair value. If certain conditions are met then the derivative may be designatedas a fair value hedge or cashflow hedge. Barclays has chosen not to update the documentation of hedges to fully comply withthe requirements of SFAS 133 and therefore, in general, economic hedge relationships do not qualify for treatment as hedgesunder US GAAP. Accordingly, adjustments in current or past periods to US GAAP net income in respect of derivatives whichqualify for hedge accounting under UK GAAP, are not necessarily indicative of the magnitude or direction of such adjustments toUS GAAP net income in subsequent periods.
The adjustment to net income is composed of the following elements:
2002 2001 Transition£m £m £m
Mark to market adjustment 548 431 45Embedded derivatives 109 (28) (62)Deferred gains and losses 12 33 (61)Amortisation of fair value hedge (156) (128) –Reclassification of gains and losses from Other comprehensive income to net income 40 28 –Hedges of available for sale securities – – 20
553 336 (58)

214 Barclays PLC Annual Report 2002
Notes to the accountsFor the year ended 31st December 2002
63 Differences between UK GAAP and US GAAP accounting principles (continued)
(r) Consolidation The Group has certain sponsored entities that do not meet the consolidation criteria of quasi-subsidiaries under FRS 5 but nevertheless fall to be consolidated under US GAAP. Total assets increase by £2,738m (2001: £2,748m).
In January 2003, the FASB issued FIN 46. This pronouncement modifies the framework for determining consolidation of certainentities that meet the definition of a “variable interest entity”. This is met where the entity either does not have sufficient equityof the appropriate nature to support its expected losses, or the third party equity capital lacks certain characteristics whichwould be expected to be present within a controlling financial interest.
Entities which do not meet this definition would continue to apply the voting interest model and Barclays would generallyconsolidate when it has a controlling financial interest.
Under the variable interest model promulgated by FIN 46, all ownership, contractual and other pecuniary interests in the entityare evaluated to determine which of the holders, if any, hold a variable interest which will absorb the majority of the expectedlosses, expected residual returns, or both. This holder is the “primary beneficiary” of the variable interest entity and would berequired to consolidate the entity.
The provisions of FIN 46 are immediately effective for variable interest entities created after 31st January 2003. The standardmust be applied to all entities beginning in the first fiscal year after 15th June 2003.
For those variable interest entities which are in existence prior to 31st January 2003, and where Barclays has a significantvariable interest or it is reasonably possible that Barclays would have to consolidate the entity on application of FIN 46, atransitional disclosure is required which quantifies the maximum exposure to loss as a consequence of Barclays involvement withthe entity. The maximum exposure to loss represents a “worst case” scenario in the event that all such vehicles simultaneouslyfail. It does not provide an indication of ongoing exposure which is managed within the Group’s risk management framework.
Where a maximum exposure to loss is quoted this represents the Group’s total exposure and includes both drawn and undrawnlending facilities. The Group’s exposure is determined by changes in the value of the variable interests it holds within theseentities, which primarily comprise liquidity, credit enhancements, derivative transactions and financing arrangements.
The following is a summary of the nature, purpose, size and activities of those entities with which Barclays is currently involved,and which are expected to be impacted by FIN 46:
Multi-seller conduit programsBarclays creates, administers and provides liquidity and credit enhancements to several commercial paper conduit programs,primarily in the United States. These conduits provide clients access to liquidity in the commercial paper markets by allowingthem to sell consumer or trade receivables to the conduit, which then issues commercial paper to investors to fund thepurchase. The conduits have sufficient collateral, credit enhancements and liquidity support to maintain an investment graderating for the commercial paper.
The total assets of these conduits are £16,090m of which £3,086m are already consolidated by the Group under US GAAP. Themaximum loss associated with the Group’s relationships is £15,681m which includes commitments to provide liquidity to thesevehicles to a maximum of £12,271m. These would be required to be provided in the event of the conduit’s access to fundingmarkets being restricted.
Management’s initial assessment is that these multi-seller conduits in their current form would be required to be consolidated bythe Group upon implementation of FIN 46.
Other securitisationsThe Group provides financing to assist companies with the formation of client originated asset securitisation. These entities haveminimal equity and rely upon funding in the form of senior notes to purchase the assets for securitisation. Since the Group onlyprovides senior lending, the notes typically are not expected to absorb the first risk of loss. In addition, the Group has securitisedsome of its retail lending portfolio using entities established solely for that purpose. In some cases the funding of these entitieshas been provided by third party lenders, in others the lending has been provided by the Group.
Total maximum exposure to loss to these entities is £5,138m, total assets of the entities concerned is £5,222m, of which£2,710m are already consolidated by the Group under US GAAP.

215Barclays PLC Annual Report 2002
Notes to the accountsFor the year ended 31st December 2002
63 Differences between UK GAAP and US GAAP accounting principles (continued)
(r) Consolidation (continued)
Client intermediationAs a financial intermediary, the Group is involved in structuring transactions to meet investor and client needs. Thesetransactions may involve entities that fall within the scope of FIN 46 structured by either Barclays or the client and that are usedto modify cash flows of third party assets to create investments with specific risk or return profiles, or to assist clients in theefficient management of other risks. These transactions may include derivative instruments, and often contain contractualclauses to enable Barclays to terminate the transaction under certain circumstances, for example if the legal or accounting basison which the transaction was completed changes. In addition, Barclays invests as a limited partner in lessor partnerships,specifically to acquire assets for leasing.
Total assets included within the entities structured by Barclays is £1,396m, of which £996m is already consolidated under USGAAP. The Group’s maximum exposure to loss to these entities is £888m.
Credit structuringThe Group structures investments to provide specific risk profiles to investors. This may involve the sale of credit exposures,often by way of credit derivatives, to an entity which that entity subsequently funds by issuing securities. These securities mayinitially be held by Barclays prior to sale outside of the Group.
The maximum exposure to loss and total assets associated with these entities is £1,243m and £2,893m respectively. £2,881m ofthese assets are already consolidated under US GAAP.
Property and construction financeIn the normal course of business Barclays will often lend to entities formed to isolate the assets and cashflows associated withthe particular project being funded. An example of these transactions is the Private Finance Initiative, which was launched by theUK Government in 1992 as a mechanism for pooling private capital and public sector resources to fund medium and large-scaleprojects including public buildings, transport infrastructure, information systems and the provision of vehicles and equipment.These are often structured such that the funding of the contracts are through an entity that is potentially subject to FIN 46. Themaximum exposure to loss associated with these structures is £294m, and total assets of the associated entities is £278m.
Private equity transactionsIn order to enable the Group to participate in private equity transactions, it is often necessary to structure deals using holdingcompanies specifically set-up to facilitate the sale and purchase of shares or assets in the target company. The Group hasacquired interests in these entities, which are included within debt or equity securities.
The maximum loss to such entities is £310m, which have total assets of £1,862m. These vehicles are not currently consolidatedunder US GAAP as they do not constitute a controlling interest under existing consolidation principles.
Fund of fundsThe group uses fund platforms that are used by a limited number of independent third parties predominantly to facilitate theirtailored hedge fund investment strategies. At any time, the Group may hold a significant proportion of the trust units issued by afund platform which constitute variable interest in the fund.
These entities have assets under management of £288m. The maximum exposure to loss to these entities is £186m.

216 Barclays PLC Annual Report 2002
Notes to the accountsFor the year ended 31st December 2002
63 Differences between UK GAAP and US GAAP accounting principles (continued)
(s) Fair value amortisation creditFair value adjustments that are different from those in the UK are amortised over the expected life of the relevant asset/liability.This resulted in an additional credit of £8m (2001: £8m, 2000: £1m) under US GAAP.
(t) CollateralThe Group enters into reverse repos (see page 111) and stock borrowing transactions which are accounted for as collateralisedloans. It is the Group’s policy to seek collateral at the outset equal to 100% to 105% of the loan amount. The level of collateralheld is monitored daily and further collateral calls made to bring the level of cash held and the market value of collateral in linewith the loan balance.
Under certain transactions including reverse repo and stock borrowing transactions the Group is allowed to sell or repledge thecollateral held. At 31st December 2002, the fair value of collateral held was £109bn (2001: £76bn) of which £93bn (2001: £76bn)related to items that have been sold or repledged.
The Group also enters into repos (see page 111) and stock lending transactions which are accounted for as secured borrowings.At 31st December 2002, the Group had given £53bn (2001: £55bn) of its assets as collateral in respect of these transactions. Ofthe total collateral given £36bn (2001: £41bn) was on terms which gave the recipient the right to sell or repledge comprisingdebt securities of £34bn (2001: £37bn) and equity securities of £2bn (2001: £4bn). The residual £17bn (2001: £14bn) was onterms by which the counterparty cannot sell or repledge and related to debt securities.
For the pledge of collateral to secure on-balance sheet liabilities see note 42 and in relation to contingent liabilities generally in support of the performance of a customer to third parties see note 45.
(u) Provisions for bad and doubtful debtsDuring 2002, there was a net write-back of £2m (2001: £9m charge, 2000: £nil) in respect of credit losses on derivatives. Noneof the year end specific provisions related to credit losses on derivatives (2001: £nil).
At 31st December 2002, £43m of the general provision (2001: £26m) was held in respect of off-balance sheet exposures(including derivatives).
The specific provision for contingent liabilities and commitments is £14m (2001: £12m).
(v) GuaranteesAn element of Barclays normal banking business is to issue guarantees on behalf of its customers. In almost all cases, Barclayswill hold collateral against the exposure, have a right of recourse to the customer or both. In addition, Barclays also issuesguarantees on it own behalf. The major categories of these guarantees are:
Financial guaranteesThese are given to banks and financial institutions on behalf of customers to secure loans, overdrafts and other banking facilities.These are commonly called facility guarantees.
Included within this category are stock borrowing indemnities. These relate to funds managed by Barclays on behalf of clients,which participate in stock lending programmes. Barclays indemnifies the clients against any losses incurred by the clients resultingfrom borrower default. Collateral, principally cash, is maintained against all stock borrowing transactions ranging from 102% to105% of the securities loaned with adjustments to collateral made daily. It is possible that the exposure could exceed the collateralprovided should the value of the security rise concurrently with the default of the borrowers.
Standby letters of creditThese are irrevocable commitments to pay a third party, on behalf of our customers, the value of which on demand is subject tocertain criteria being complied with. Any amounts paid are debited to the customers accounts. These contracts are used whenrequired in substitution of guarantees due to a greater acceptability in the beneficiary country.
Other guaranteesThis category includes the following types of contracts:
Performance guarantees – a guarantee given by the bank on behalf of a customer, undertaking to pay a certain sum if ourcustomer has failed to carry out the terms or certain terms of the contract.
Advance payment guarantees – enables the beneficiary to demand repayment of an advance in funds in certain circumstances.

217Barclays PLC Annual Report 2002
Notes to the accountsFor the year ended 31st December 2002
63 Differences between UK GAAP and US GAAP accounting principles (continued)
(v) Guarantees (continued)Tender guarantees – provided during a tender process to lend support to a customer’s commitment to a tender process.
Customs and Excise – guarantees provided to HM Customs and Excise to cover a customer’s liability, most commonly for import duties.
Retention guarantees – similar to advance payments but are used to secure early release of retained contract payments.
The table below provides the maturity analysis of the above guarantees:
Less than One to Four to Overone year three years five years five years Total
£m £m £m £m £m
Financial Guarantees 8,044 958 285 366 9,653Standby Letters of Credit 4,037 1,288 850 215 6,390Other Guarantees 5,884 983 668 379 7,914
Credit Card GuaranteesUnder the Consumer Credit Act of 1974, Barclays may be liable to customers to refund payments made for unsatisfactory goodsor services or unfulfilled contracts where payment was made through a credit card. The maximum liability that Barclays couldhave is the total credit limits marked to customers of £29,208m. These limits are included within commitments with a maturityof less than one year, as the limit can be revoked at any time.
Warranties and indemnities given as part of acquisition and disposal activityWarranties and indemnities are routinely provided to counterparties as part of the terms and conditions required in a businessacquisition, disposal or outsourcing. Most commonly these relate to indemnification against tax liabilities arising from pre-transaction activities or trademark and branding issues. In general the total liability for a transaction is capped and the maximumliability under these is £4.1bn. In some cases an uncapped liability may be provided. No collateral or recourse to third parties isgenerally available.
In addition to the contracts described above, there are certain derivative contracts to which the Group is a counterparty thatmay meet the characteristics of a guarantee under FIN 45. These derivatives are recorded in the Group’s balance sheet at fairvalue under US GAAP. These contracts include written put options that require the Group to purchase assets from the optionholder at a specified price by a specified date in the future, as well as derivatives that effectively guarantee the return on acounterparty’s reference portfolio of assets.
Certain written put options and credit derivatives permit cash settlement and do not require the option holder or the buyer ofcredit protection to own the reference asset. The Group does not consider these contracts to be guarantees as described in FIN 45.
Included in other provisions for liabilities and charges is £4m in respect of guarantees. The Group considers the amounts providedin the balance sheet represent a reasonable estimate of amounts actually anticipated to be paid under such arrangements.
(w)Total assetsIn addition to the adjustments to total assets arising from the GAAP differences dealt with in the tables on page 203, and note r), there are other adjustments resulting from differences in GAAP.
In accordance with ARB No. 51, Barclays PLC shares shown for UK GAAP within Other assets in note 24 have been netted againstUS GAAP shareholders’ equity.
The application of SFAS 140 resulted in an addition to US GAAP total assets of £9,454m (2001: £106m) in respect of funded loan participations, defeasance and servicing assets and liabilities which did not meet the SFAS requirements for derecognition.No adjustment to net income or shareholders’ funds was required for 2002 or 2001.
Certain repurchase and reverse repurchase transactions have been netted in the UK as required under FRS 5. To the extent these arrangements do not satisfy the requirement of FIN 39 and FIN 41, total assets have been increased by £25,419m (2001: £10,970m).
Gross assets and liabilities have been increased by £36,541m (2001: £38,490m) due to inclusion of certain BGI insuranceproducts.
Fair valuing assets and derivative positions under FAS 133 resulted in an increase to total assets of £3,307m (2001: £2,823m).
The inclusion of acceptances resulted in an increase in total assets under US GAAP of £2,588m (2001: £2,422m).

218 Barclays PLC Annual Report 2002
Notes to the accountsFor the year ended 31st December 2002
63 Differences between UK GAAP and US GAAP accounting principles (continued)
(x) Profit and loss account presentationThere are certain differences in the presentation of the profit and loss account between UK GAAP and US GAAP. For example,profits or losses on disposal of Group undertakings (2002: £3m loss, 2001: £4m loss, 2000: £214m profit) would be classified as operating income or expense under US GAAP rather than being shown separately. Under US GAAP, net interest received(2002: £75m, 2001: £387m paid, 2000: £216m paid) relating to trading activities would be shown within net interest revenue,rather than included in dealing profits. Reconciling differences arising from associated undertakings (2002: £6m profit, 2001: £nil, 2000: £nil) would be included within a single component of net income.
(y) Changes in UK GAAPDuring 2002, Barclays restated the 2001 and 2000 Net Income and shareholders’ funds under UK GAAP in respect of changes ofaccounting policy for deferred tax and the shareholders’ interest in the long-term assurance funds, as described on pages 133and 134. There has been no effect on the reported US GAAP figures and as a result the reconciling items reported in 2001 and2000 have been restated as described below:
Net Income Original Prior year Restated
reconciliation adjustment reconciliationitem item
£m £m £m
2001Deferred tax 44 (14) 30Shareholders’ interest in the long-term assurance fund 42 45 87Tax effect on the above UK/US GAAP reconciling item (165) (12) (177)
Total affected reconciling items (79) 19 (60)
2000Deferred tax (162) (13) (175)Shareholders’ interest in the long-term assurance fund (77) 57 (20)Tax effect on the above UK/US GAAP reconciling item 24 (16) 8
Total affected reconciling items (215) 28 (187)
Shareholders’ funds
Original Prior year Restatedreconciliation adjustment Reconciliation
item item£m £m £m
2001Deferred tax 46 (14) 32Shareholders’ interest in the long-term assurance fund (709) 51 (658)Tax effect on the above UK/US GAAP reconciling item (12) (14) (26)
Total affected reconciling items (675) 23 (652)
64 Consolidated statement of cash flowsInterest paid in the year, including amounts relating to trading activities, was £10,167m (2001: £13,319m, 2000: £10,888m).
Set out below, for illustrative purposes, is a summary consolidated statement of cash flows presented on a US GAAP basis:
2002 2001 2000£m £m £m
Net cash provided by operating activities 15,911 7,047 4,318Net cash used in investing activities (46,968) (32,413) (17,768)Net cash provided by financing activities 34,333 35,616 14,394Effect of exchange rate changes on cash and due from banks 990 143 (977)
Net increase/(decrease) in cash and cash equivalents 4,266 10,393 (33)Cash and cash equivalents at beginning of year 45,972 35,579 35,612
Cash and cash equivalents at end of year 50,238 45,972 35,579

Notes to the accountsFor the year ended 31st December 2002
219Barclays PLC Annual Report 2002
65 Regulatory capital requirementsCapital adequacy and the use of regulatory capital are monitored by the Group, employing techniques based on the guidelinesdeveloped by the Basel Committee on Banking Regulations and Supervisory Practices (the Basel Committee) and EuropeanCommunity Directives, as implemented by the Financial Services Authority (FSA) for supervisory purposes. The FSA regards therisk asset ratio calculation, originally developed by the Basel Committee, as a key supervisory tool and sets individual minimumratio requirements for banks in the UK at or above the minimum of 8%. The concept of risk weighting and the basis forcalculating eligible capital resources are described under Capital ratios on page 116.
The following tables summarises capital resources and capital ratios, as defined for Supervisory purposes:
Barclays PLC Group and Barclays Bank PLC Group Amount Ratio
As at 31st December 2002 £m %
Total net capital resources 22,191 12.8Tier 1 capital resources 14,204 8.2
Amount RatioAs at 31st December 2001 £m %
Total net capital resources 19,899 12.5Tier 1 capital resources 12,405 7.8
66 Significant Group concentration of credit riskSFAS 105 defines a concentration of credit risk as an exposure to a number of counterparties engaged in similar activities andhaving similar economic characteristics that would cause their ability to meet contractual obligations to be similarly affected bychanges in economic or other conditions. Barclays exposure to credit risk is concentrated in the UK where the majority of theGroup’s activities are conducted. As one of the largest UK banks, Barclays accounts for a significant share of credit exposure toalmost all sectors of the economy and the Group is therefore significantly affected by the general economic conditions in the UK.Lending in respect of home loans represents 40% (2001: 37%) of the total banking book lending to customers. However, creditrisk is well spread over a diversity of both personal and commercial customers, reflecting the Group’s risk management policy ofimposing limits on exposure to any one single counterparty. Outside the UK, the Group’s geographical spread ensures a widevariety of counterparties in the main areas of operation in Europe, the United States and other areas of the world. As an activeparticipant in the international banking markets, the Group has a significant concentration of credit risk with banks and otherfinancial institutions. In total, credit risk exposure to financial institutions at 31st December 2002 was estimated to have amountedto £87bn (2001: £92bn) of which £60bn (2001: £55bn) consisted of placings and negotiable certificates of deposit and £10bn(2001: £9bn) of mark to market balances in respect of exchange and interest rate contracts. The remaining credit risk exposure islargely related to letters of credit and guarantees. Within the overall exposure, the Group maintains relationships with some 932(2001: 950) banking groups in countries all over the world.

Notes to the accountsFor the year ended 31st December 2002
220 Barclays PLC Annual Report 2002
67 Ratio of earnings to fixed charges and preference share dividends
2002 2001 2000 1999 1998
Ratio of earnings to fixed chargesUK GAAP: (a)Excluding interest on deposits 1.50 1.38 1.48 1.48 1.35Including interest on deposits 1.31 1.25 1.29 1.29 1.20US GAAP:Excluding interest on deposits 1.54 1.47 1.49 1.42 1.37Including interest on deposits 1.34 1.30 1.29 1.26 1.21
Ratio of earnings to combined fixed charges, preference share dividends and payments made in respect of Reserve Capital Instruments (RCIs)UK GAAP: (a)Excluding interest on deposits 1.50 1.38 1.48 1.47 1.34Including interest on deposits 1.31 1.25 1.29 1.29 1.19US GAAP:Excluding interest on deposits 1.52 1.45 1.47 1.41 1.36Including interest on deposits 1.33 1.29 1.28 1.25 1.20
(a) The UK GAAP ratios have been restated in respect of changes in accounting policy for deferred tax and shareholders’ interestin the long-term assurance fund and for the change in presentation of RCIs following the issue of UTIF Abstract 33 ‘obligations incapital instruments’. This is described in further detail on pages 133 and 134.

SEC Form 20-F cross reference and other information
221Barclays PLC Annual Report 2002
SEC Form 20-F cross referenceand other informationForm 20–F Page referenceitem number in this document
1 Identity of Directors, Senior Managementand AdvisorsNot applicable
2 Offer Statistics and Expected TimetableNot applicable
3 Key InformationRisk factors 124Currency of presentation 222Selected financial data 88/234Dividends 235
4 Information on the CompanyPresentation of information 53Glossary 223Business description 90Economic and monetary union 123Supervision and regulation 123Note 22 Tangible fixed assets 157Note 43 Future rental commitments under operating leases 171Note 44 Principal subsidiary undertakings 172Note 49 Post balance sheet events 185Note 61 Segmental analysis 191
5 Operating and Financial Review and ProspectsFinancial Review 96Other information 123
6 Directors, Senior Management and EmployeesAdministrative expenses – staff costs 107Directors and Officers 32Directors’ report 35Corporate governance report 37Barclays report on remuneration 40Audit and Accountability 52Note 4 Administrative expenses – staff costs 143Note 5 Pensions, post-retirement benefits, and other staff costs 144Note 56 Related party transactions 188Note 57 Directors’ emoluments and otherbenefits 189Note 58 Directors’ and officers’ shareholdingand options 190Note 59 Contracts with Directors andconnected persons and with managers 190
7 Major Shareholders and Related PartyTransactionsPresentation of information 53Directors’ report 35Note 56 Related party transactions 188Trading market for ordinary sharesof Barclays PLC 236
8 Financial InformationNote 12 Dividends – Barclays PLC 148Note 48 Legal proceedings 185Note 49 Post balance sheet events 185
9 The Offer and ListingTrading market for ordinary sharesof Barclays PLC 236
Form 20–F Page referenceitem number in this document
10 Additional InformationMemorandum and Articles of Association 238Taxation 239Exchange controls and otherlimitations affecting security holders 240Sub-division of ordinary shares 240Documents on display 241
11 Quantitative and qualitative disclosureabout market riskRisk management and control – overview 54Credit risk management 57Analysis of loans and advances 59Provisions for bad and doubtful debts 68Potential credit risk lendings 66Country risk 65Market risk management 74Derivatives 79Treasury asset and liability management 81Note 46 Derivatives and other financial instruments 174
12 Description of Securities Other than Equity SecuritiesNot applicable
13 Defaults, Dividends Arrearagesand DelinquenciesNot applicable
14 Material Modifications to the Rights of SecurityHolders and Use of ProceedsNot applicable
15 Controls and ProceduresDisclosure controls and procedures 52
16 RESERVED17 Financial Statements
Not applicable 18 Financial statements
US audit report 127Accounting policies 128Consolidated accounts Barclays PLC 136
except page 142Notes to accounts of Barclays PLC 143Consolidated accounts Barclays Bank PLC 224Notes to consolidated accounts of Barclays Bank PLC 230
19 ExhibitsNot included
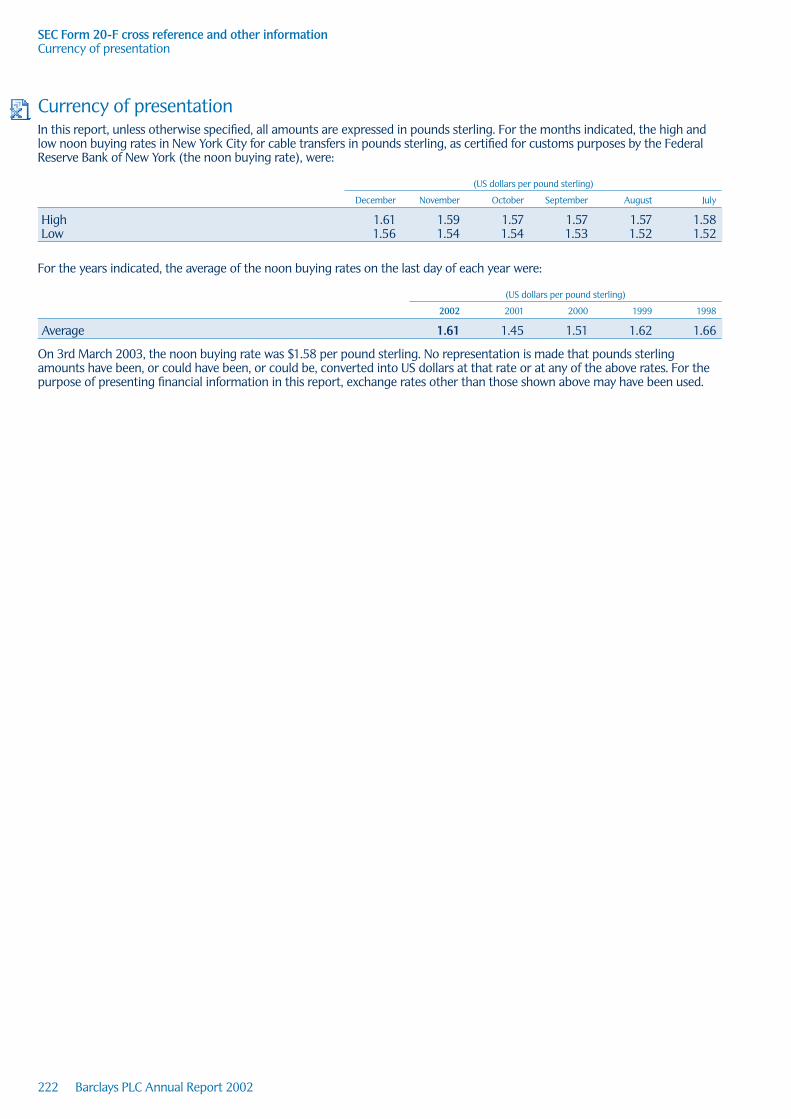
222 Barclays PLC Annual Report 2002
SEC Form 20-F cross reference and other informationCurrency of presentation
Currency of presentationIn this report, unless otherwise specified, all amounts are expressed in pounds sterling. For the months indicated, the high andlow noon buying rates in New York City for cable transfers in pounds sterling, as certified for customs purposes by the FederalReserve Bank of New York (the noon buying rate), were:
(US dollars per pound sterling)
December November October September August July
High 1.61 1.59 1.57 1.57 1.57 1.58Low 1.56 1.54 1.54 1.53 1.52 1.52
For the years indicated, the average of the noon buying rates on the last day of each year were:
(US dollars per pound sterling)
2002 2001 2000 1999 1998
Average 1.61 1.45 1.51 1.62 1.66
On 3rd March 2003, the noon buying rate was $1.58 per pound sterling. No representation is made that pounds sterlingamounts have been, or could have been, or could be, converted into US dollars at that rate or at any of the above rates. For thepurpose of presenting financial information in this report, exchange rates other than those shown above may have been used.

223Barclays PLC Annual Report 2002
SEC Form 20-F cross reference and other informationGlossary
GlossaryTerm used in Annual report
Accounts
Advance corporation tax
Allotted
Attributable profit
Called-up share capital
Capital allowances
Cash at bank and in hand
Class of business
Fees and commissions receivable
Fees and commissions payable
Finance lease
Freehold
Interest receivable
Interest payable
Loans and advances
Loan capital
Net asset value
Profit
Profit and loss account
Profit and loss account reserve
Provisions
Revaluation reserve
Share capital
Shareholders’ funds
Share premium account
Shares in issue
Tangible fixed assets
Write-offs
US equivalent or brief description
Financial statements
No direct US equivalent. Tax paid on company distributionsrecoverable from UK taxes due on income
Issued
Net income
Ordinary shares, issued and fully paid
Tax term equivalent to US tax depreciation allowances
Cash
Industry segment
Fee and commission income
Fee and commission expense
Capital lease
Ownership with absolute rights in perpetuity
Interest income
Interest expense
Lendings
Long-term debt
Book value
Income
Income statement
Retained earnings
Allowances
No direct US equivalent. Represents the increase in thevaluation of certain assets as compared with historical cost
Ordinary shares, capital stock or common stock issued and fully paid
Shareholders’ equity
Additional paid-up capital or paid-in surplus (not distributable)
Shares outstanding
Property and equipment
Charge-offs

224 Barclays PLC Annual Report 2002
Barclays Bank PLC dataConsolidated profit and loss account
Consolidated profit and loss accountFor the year ended 31st December 2002
2002 2001 2000restated restated
Note £m £m £m
Interest receivable:Interest receivable and similar income arising from debt securities 2,030 2,383 2,339Other interest receivable and similar income 10,014 11,075 9,449
12,044 13,458 11,788Interest payable 5,839 7,492 6,682Profit on repurchase of loan capital 1 – – 2
Net interest income 6,205 5,966 5,108Fees and commissions receivable 4,454 4,202 3,676Less: fees and commissions payable (529) (465) (320)Dealing profits 2 833 1,011 677Other operating income 3 364 428 353
Operating income 11,327 11,142 9,494
Administrative expenses – staff costs a 3,757 3,716 3,219Administrative expenses – other 6 2,312 2,303 1,967Depreciation and amortisation 7 557 537 306
Operating expenses 6,626 6,556 5,492
Operating profit before provisions 4,701 4,586 4,002
Provisions for bad and doubtful debts 17 1,484 1,149 817Provisions for contingent liabilities and commitments 8 1 1 (1)
Provisions 1,485 1,150 816
Operating profit 3,216 3,436 3,186Loss from joint ventures (5) (1) (1)Loss from associated undertakings (5) (8) (7)(Loss)/profit on disposal/termination of Group undertakings 9 (3) (4) 214
Profit on ordinary activities before tax 3,203 3,423 3,392Tax on profit on ordinary activities 10 955 943 901
Profit on ordinary activities after tax 2,248 2,480 2,491Minority interests – equity 11 (20) (31) (22)
Profit for the financial year attributableto the members of Barclays Bank PLC 2,228 2,449 2,469Dividends payable to Barclays PLC c (1,798) (1,317) (1,352)Dividends payable to preference shareholders c – (5) (24)
Profit retained for the financial year 430 1,127 1,093
The note numbers refer to the notes on pages 128 to 220, whereas the note letters refer to those on pages 230 to 232.
All results arise from continuing operations. For each of the years reported above, there was no material difference betweenprofit before tax and profit retained and profit on a modified historical cost basis.
The consolidated profit and loss account of Barclays Bank PLC for the year ended 31st December 2002, contains a charge of£2m (2001: £2m, 2000: £nil) within staff costs that is debited directly to reserves in the consolidated accounts of Barclays PLC.The amounts in respect of administration expenses – staff costs, other staff costs, and all related profit and loss items, includingprofit retained for the financial year on pages 98 to 122, are for Barclays PLC. These amounts should be debited by £2m toreflect those for Barclays Bank PLC (2001: £2m, 2000: £nil).

Barclays Bank PLC dataStatement of total recognised gains and losses
Statement of total recognised gains and lossesFor the year ended 31st December 2002
2002 2001 2000restated restated
£m £m £m
Profit for the financial year attributable to the members of Barclays Bank PLC 2,228 2,449 2,469Exchange rate translation differences (61) 10 36Gain arising from transactions with third parties 206 – –Other items 8 (24) 8Joint ventures and associated undertakings 2 (15) 6
Total recognised gains relating to the period 2,383 2.420 2,519Prior period adjustment (see pages 133 to 134) (23) – –
Total gains and losses recognised including prior period adjustment 2,360 2,420 2,519
225Barclays PLC Annual Report 2002

Barclays Bank PLC dataConsolidated balance sheet
Consolidated balance sheetAs at 31st December 2002
2002 2001restated
Note £m £m £m £m
AssetsCash and balances at central banks 2,032 1,281Items in course of collection from other banks 2,335 2,444Treasury bills and other eligible bills 14 7,645 7,417Loans and advances to banks – banking 15,369 12,196
– trading 42,805 35,69315 58,174 47,889
Loans and advances to customers – banking 157,222 146,253– trading 45,176 34,240
16 202,398 180,493Debt securities 18 94,229 78,924Equity shares 19 3,133 3,118Interests in joint ventures – share of gross assets 242 230
– share of gross liabilities (184) (174)20 58 56
Interests in associated undertakings 20 397 32Intangible fixed assets 21 3,934 4,091Tangible fixed assets 22 1,626 1,958Other assets 24 16,839 18,186Prepayments and accrued income 26 2,982 2,553
395,782 348,442Retail life-fund assets attributable to policyholders 25 7,284 8,170
Total assets 403,066 356,612
The note numbers refer to the notes on pages 128 to 220.
226 Barclays PLC Annual Report 2002

Barclays Bank PLC dataConsolidated balance sheet
Consolidated balance sheetAs at 31st December 2002
2002 2001restated
Note £m £m £m £m
LiabilitiesDeposits by banks – banking 48,751 45,837
– trading 38,683 21,54327 87,434 67,380
Customer accounts – banking 144,078 139,863– trading 27,420 23,984
28 171,498 163,847Debt securities in issue 29 45,885 41,846Items in course of collection due to other banks 1,416 1,550Other liabilities 30 56,564 42,930Balances due to Barclays PLC 788 728Accruals and deferred income 31 4,352 4,377Provisions for liabilities and charges – deferred tax 32 461 616Provisions for liabilities and charges – other 33 486 562Subordinated liabilities:Undated loan capital – convertible to preference shares 34 310 345Undated loan capital – non-convertible 34 6,368 4,709Dated loan capital – convertible 35 11 –Dated loan capital – non-convertible 35 4,848 4,933
380,421 333,823
Minority interests and shareholders’ fundsMinority interests – equity 156 134Called up share capital b 2,293 2,286Share premium account 5,603 5,475Revaluation reserve 24 30Profit and loss account 7,285 6,694Shareholders’ funds – equity 38 15,205 14,485
15,361 14,619
395,782 348,442Retail life-fund liabilities to policyholders 25 7,284 8,170
Total liabilities and shareholders’ funds 403,066 356,612
2002 2001Note £m £m
Memorandum items 45Contingent liabilities:Acceptances and endorsements 2,589 2,460Guarantees and assets pledged as collateral security 16,043 14,826Other contingent liabilities 7,914 7,313
26,546 24,599
Commitments – standby facilities, credit lines and other 101,378 99,917
The note numbers refer to the notes on pages 128 to 220, whereas the note letters refer to those on pages 230 to 232.
227Barclays PLC Annual Report 2002

Barclays Bank PLC dataConsolidated statement of changes in reserves
Consolidated statement of changes in reservesAs at 31st December 2002
2002 2001 2000restated restated
£m £m £m
Share premium accountAt beginning of year 5,475 5,269 1,881Premium arising on shares issued 128 199 3,367Exchange rate translation differences – 7 21
At end of year 5,603 5,475 5,269
Revaluation reserveAt beginning of year 30 35 37Exchange rate translation differences – (1) (2)Released on transaction with third parties (6) – –Other items – (4) –
At end of year 24 30 35
Profit and loss accountAt beginning of year 6,717 5,750 4,747Prior year adjustment (23) (4) (10)
Restated as at 1st January 2002 6,694 5,746 4,737Profit retained 430 1,127 1,093Redemption of preference shares – (148) (149)Exchange rate translation differences (61) 4 19Goodwill written back on disposals 10 – –Gain arising from transaction with third parties 212 – –Other items – (35) 12
At end of year 7,285 6,694 5,712
Total reserves 12,912 12,199 11,016
The Group operates in a number of countries subject to regulations under which a local subsidiary undertaking has to maintaina minimum level of capital. The current policy of the Group is that local capital requirements are met, as far as possible, by theretention of profit. Certain countries operate exchange control regulations which limit the amount of dividends that can beremitted to non-resident shareholders. It is not possible to determine the amount of profit retained and other reserves that isrestricted by these regulations, but the net profit retained of overseas subsidiaries, associated undertakings and joint ventures at 31st December 2002 totalled £1,038m (2001: £1,149m, 2000: £953m). If such overseas reserves were to be remitted, other tax liabilities, which have not been provided for in the accounts, might arise.
Accumulated exchange rate translation differences are £491m debit (2001: £430m debit, 2000: £440m debit).
Goodwill amounting to £205m (2001: £215m, 2000: £215m) has been charged directly against reserves in the current and prior years in respect of acquisitions. This amount is net of any goodwill attributable to subsidiary undertakings disposed ofprior to the balance sheet date.
228 Barclays PLC Annual Report 2002

Barclays Bank PLC dataConsolidated cash flow statement
Consolidated cash flow statement For the year ended 31st December 2002
2002 2001 2000restated restated
Note £m £m £m £m £m £m
Net cash inflow from operating activities d 7,447 3,831 8,499Dividends received from joint ventures andassociated undertakings 1 3 1Returns on investments and servicing of finance:Interest paid on loan capital and othersubordinated liabilities (607) (598) (370)Preference dividends paid – (5) (24)Dividends paid to minority shareholders (23) (17) (10)Net cash outflows from returns oninvestment and servicing of finance (630) (620) (404)Tax paid (828) (1,004) (636)Capital expenditure and financial investment:Capital expenditure (301) (351) (365)Sale of property and equipment 289 152 112Purchase of investment securities (28,128) (20,173) (14,490)Redemption of investment securities 10,247 5,704 5,666Sale of investment securities 11,137 13,338 4,115Net cash outflow from capitalexpenditure and financial investment (6,756) (1,330) (4,962)Acquisitions and disposals:Net cash outflow from formation of FirstCaribbean International Bank Ltd 51 (160) – –Acquisition of subsidiary undertakings 54 (451) (36) (2,421)Sale of Group undertakings – – 13Sale of other Group undertakings 51 (1) 42 307Net cash inflow/(outflow) fromacquisitions and disposals (612) 6 (2,101)Equity dividend paid: (1,796) (1,254) (1,217)
Net cash outflow before financing (3,174) (368) (820)Financing: eIssue of loan capital and other subordinated liabilities(net of expenses) 2,173 3,019 2,211Redemption/repurchase of loan capital and othersubordinated liabilities (376) (715) (212)Issue of ordinary shares 135 210 195Redemption of preference shares – (148) (149)Issue of shares to minority interests 35 – –Net cash inflow from financing 1,967 2,366 2,045
(Decrease)/Increase in cash 53 (1,207) 1,998 1,225
The note numbers refer to the notes on pages 128 to 220, whereas the note letters refer to those on pages 230 to 232.
229Barclays PLC Annual Report 2002
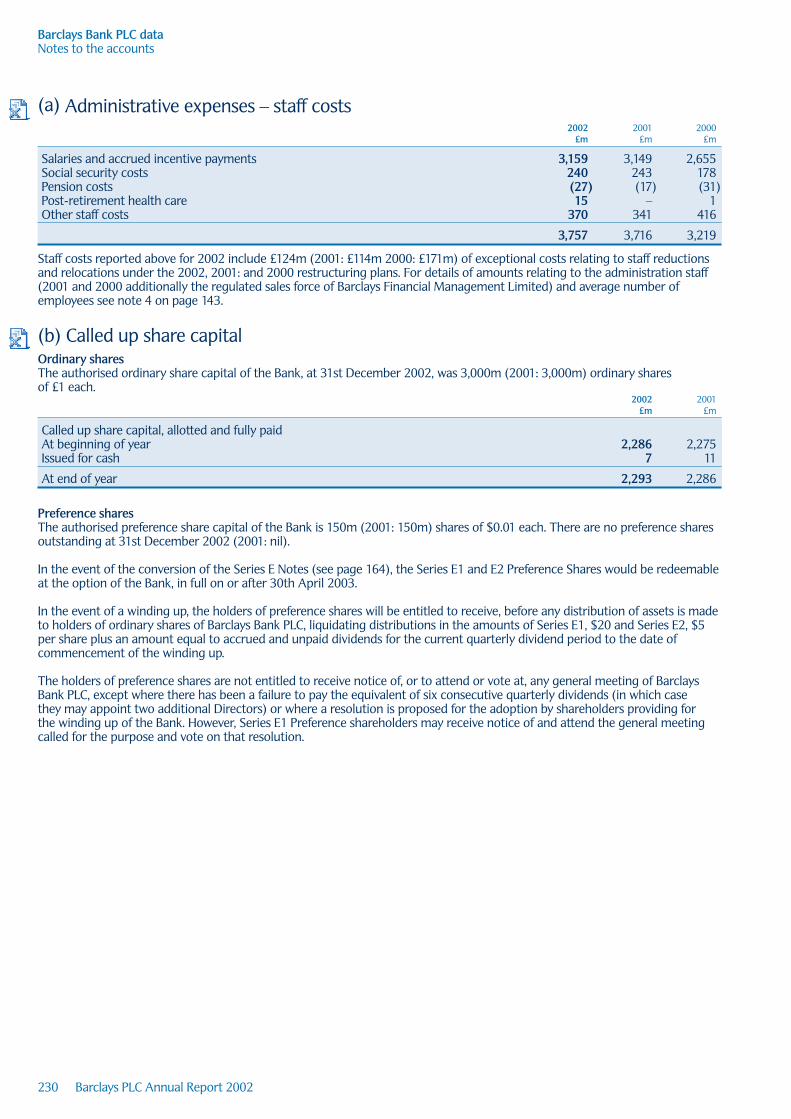
Barclays Bank PLC dataNotes to the accounts
(a) Administrative expenses – staff costs2002 2001 2000
£m £m £m
Salaries and accrued incentive payments 3,159 3,149 2,655Social security costs 240 243 178Pension costs (27) (17) (31)Post-retirement health care 15 – 1Other staff costs 370 341 416
3,757 3,716 3,219
Staff costs reported above for 2002 include £124m (2001: £114m 2000: £171m) of exceptional costs relating to staff reductionsand relocations under the 2002, 2001: and 2000 restructuring plans. For details of amounts relating to the administration staff(2001 and 2000 additionally the regulated sales force of Barclays Financial Management Limited) and average number ofemployees see note 4 on page 143.
(b) Called up share capitalOrdinary sharesThe authorised ordinary share capital of the Bank, at 31st December 2002, was 3,000m (2001: 3,000m) ordinary sharesof £1 each.
2002 2001£m £m
Called up share capital, allotted and fully paidAt beginning of year 2,286 2,275Issued for cash 7 11
At end of year 2,293 2,286
Preference sharesThe authorised preference share capital of the Bank is 150m (2001: 150m) shares of $0.01 each. There are no preference sharesoutstanding at 31st December 2002 (2001: nil).
In the event of the conversion of the Series E Notes (see page 164), the Series E1 and E2 Preference Shares would be redeemableat the option of the Bank, in full on or after 30th April 2003.
In the event of a winding up, the holders of preference shares will be entitled to receive, before any distribution of assets is madeto holders of ordinary shares of Barclays Bank PLC, liquidating distributions in the amounts of Series E1, $20 and Series E2, $5per share plus an amount equal to accrued and unpaid dividends for the current quarterly dividend period to the date ofcommencement of the winding up.
The holders of preference shares are not entitled to receive notice of, or to attend or vote at, any general meeting of BarclaysBank PLC, except where there has been a failure to pay the equivalent of six consecutive quarterly dividends (in which case they may appoint two additional Directors) or where a resolution is proposed for the adoption by shareholders providing for the winding up of the Bank. However, Series E1 Preference shareholders may receive notice of and attend the general meetingcalled for the purpose and vote on that resolution.
230 Barclays PLC Annual Report 2002

Barclays Bank PLC dataNotes to the accounts
(c) Dividends2002 2001 2000
£m £m £m
On ordinary sharesInterim dividends 1,010 635 733Final interim dividend 788 682 619
1,798 1,317 1,352
These dividends are paid to enable Barclays PLC to fund its dividends to its shareholders and, in 2002, to fund the repurchase by Barclays PLC of ordinary share capital at a total cost of £546m (2001: total cost of £101m), and to fund contributions of £46m(2001: £105m) made by Barclays PLC to the QUEST (see page 140) to enable the purchase of new Barclays PLC ordinary shareson the exercise of options under the SAYE Share Option Scheme.
Series D1 and Series D2 Preference shares were redeemed on 29th March 2001. Dividends paid in respect of these preferenceshares were $7m (£5m) in 2001 and $35m (£24m) in 2000.
In the event of the conversion of the Series E Notes, the annual dividends, expressed as a percentage of the liquidation values, on the Series E1 and E2 Preference Shares would be 9.25%.
(d) Reconciliation of operating profit to net cash flowfrom operating activities
2002 2001 2000£m £m £m
Net cash inflow from operating activities of Barclays PLC (see note 50) 7,391 3,799 8,486Increase in balance due by Barclays Bank PLC to Barclays PLC 56 32 13
Net cash inflow from operating activities of Barclays Bank PLC 7,447 3,831 8,499
(e) Changes in financing during the yearUndated Dated
loan loan Ordinary Share Minoritycapital capital shares premium interests
£m £m £m £m £m
Barclays Bank PLCAt beginning of year (restated) 5,054 4,933 2,286 5,475 134Exchange rate and other movements (220) (27) – – (13)Net cash inflow from financing 1,844 (47) 7 128 35
At end of year 6,678 4,859 2,293 5,603 156
(f ) Segmental analysis2002 2001 2000
restated restated
£m % £m % £m %
By geographical segments (a)Attributable profitUK 2,023 90 1,925 79 2,014 82Other European Union 284 13 347 14 252 10United States (161) (7) 48 2 41 2Rest of the World 82 4 129 5 162 6
2,228 100 2,449 100 2,469 100
Note(a) For the basis of the geographical analysis, see Analyses by geographical segments and classes of business on page 134.
231Barclays PLC Annual Report 2002

Barclays Bank PLC dataNotes to the accounts
(g) Differences between UK and US accounting principles – Barclays Bank PLCThe following table summarises the significant adjustments to consolidated attributable profit (net income under US GAAP) and shareholders’ funds (shareholders’ equity under US GAAP) which would result from the application of US GAAP insteadof UK GAAP.
2002 2001 2000£m £m £m
Net income (US GAAP) of Barclays PLC Group (from page 203) 2,476 2,695 2,195Preference share dividends and other appropriations ofBarclays Bank PLC 104 102 57Share compensation charge in Barclays Bank PLCshown as reserve movement in Barclays PLC (2) (2) –
Net income (US GAAP) of Barclays Bank PLC Group 2,578 2,795 2,252
2002 2001Note £m £m
Shareholders’ funds (UK GAAP) of Barclays Bank PLC Group 15,205 14,485Goodwill (a) 298 71Core deposit intangible (b) (140) (76)Pension cost (c) (848) (462)Post-retirement benefits (c) (50) (32)Leasing – lessor (166) (159)Leasing – lessee – 10Deferred tax (e) – 32Share compensation schemes (f ) – (191)Shareholders’ interest in the long-term assurance fund (g) (549) (658)Revaluation of property ( j) (241) (313)Fair value on securities ( i ) 515 387Dividend payable 788 682Extinguishment of liabilities (159) –Provisions for restructuring of business ( l ) 16 38Internal use software (n) 81 288Derivatives (p) 1,273 628Loan origination fees 91 60Fair value amortisation credit (a) 17 9Reserve Capital Instruments 1,771 1,872Tax effect on the above UK/US GAAP reconciling items (56) (26)
Shareholders’ equity (US GAAP) of Barclays Bank PLC Group 17,846 16,645
The notes refer to those parts of note 63 on pages 204 to 218.
232 Barclays PLC Annual Report 2002

Barclays Bank PLC dataFinancial data
2002 2001 2000 1999 1998restated restated restated restated
Selected financial statistics % % % % %
Attributable profit as a percentage of:average total assets (note (a)) 0.5 0.6 0.8 0.7 0.6average shareholders’ funds 14.7 17.3 24.6 21.2 17.0Average shareholders’ funds as apercentage of average total assets (note (a)) 3.5 3.7 3.3 3.5 3.3
Selected profit and loss account data £m £m £m £m £m
Interest receivable 12,044 13,458 11,788 9,320 9,952Interest payable 5,839 7,492 6,682 4,696 5,644Profit on redemption/repurchase of loan capital – – 2 3 3Non-interest income 5,122 5,176 4,386 3,769 3,063Operating expenses 6,626 6,556 5,492 5,144 4,915Provisions – bad and doubtful debts 1,484 1,149 817 621 492
– contingent liabilities and commitments 1 1 (1) 1 76Loss from joint ventures (5) (1) (1) (1) –(Loss)/income from associated undertakings (5) (8) (7) (13) 22Loss on sale or termination of BZW businesses – – – (30) (3)(Loss)/profit on disposal of other Group undertakings (3) (4) 214 (108) 4Write-down of fixed asset investments – – – – (4)Profit before tax 3,203 3,423 3,392 2,478 1,910Attributable profit 2,228 2,449 2,469 1,799 1,369
Selected balance sheet data £m £m £m £m £m
Shareholders’ funds 15,205 14,485 13,183 8,493 7,854Dated and undated loan capital 11,537 9,987 7,720 4,597 3,734Deposits by banks, customer accounts and debt securities in issue 304,817 273,073 240,607 191,781 161,049Loans and advances to banks and customers 260,572 228,382 198,536 156,194 132,722Total assets 403,066 356,612 316,186 254,830 219,514
Note(a) For the purposes of this summary, the retail life-fund assets attributable to policyholders have been excluded from averagetotal assets.
233Barclays PLC Annual Report 2002

US GAAP financial data
US GAAP financial data The following financial information has been adjusted from data prepared under UK GAAP to reflect significant differences fromaccounting principles generally accepted in the United States (US GAAP). See note 63 for an explanation of these differences.
Selected financial statistics2002(b) 2002 2001 2000 1999 1998
¢ p p p p p
Barclays PLC GroupEarnings per 25p ordinary share 60.2 37.4 40.5 36.3 28.3 22.7Dividends per 25p ordinary share 27.9 17.3 15.3 13.1 11.3 9.8Book value per 25p ordinary share 390 242 246 196 138 129
% % % % %Net income as a percentage of:average total assets 0.52 0.60 0.62 0.62 0.53average shareholders’ equity 16.57 19.00 22.72 20.82 17.84Dividends as a percentage of net income 44.67 37.63 35.49 39.88 43.13Average shareholders’ equity as a percentageof average total assets 3.12 3.16 2.75 2.96 3.00
Barclays Bank PLC GroupNet income as a percentage of:average total assets 0.54 0.62 0.64 0.63 0.54average shareholders’ equity 15.60 17.73 21.37 20.43 17.85Average shareholders’ equity as apercentage of average total assets 3.44 3.52 3.00 3.06 3.05
Selected financial statement data2002 2002 2001 2000 1999 1998
$m £m £m £m £m £m
Net income (note (a)):Barclays PLC Group 3,986 2,476 2,695 2,195 1,695 1,370Barclays Bank PLC Group 4,151 2,578 2,795 2,252 1,723 1,395Shareholders’ equity (note (a)):Barclays PLC Group 25,874 16,015 14,813 13,029 8,262 7,781Barclays Bank PLC Group 28,732 17,846 16,645 14,513 8,537 8,083Total assets (note (a)):Barclays PLC Group 791,260 491,466 413,580 368,980 277,868 228,610Barclays Bank PLC Group 791,453 491,586 413,586 368,985 277,873 228,653
Notes(a) Net income and shareholders’ equity have been adjusted to reflect significant differences between UK and US GAAP, as shownon pages 203 and 232 to the accounts. Total assets have been adjusted to reflect such differences together with adjustments setout in footnotes (u) and (x) to note 63.
(b) The dollar financial information has been translated for convenience at the rate of $1.61 to £1, the noon buying rate for cable transfers in New York City, payable in pounds sterling, at 31st December 2002.
234 Barclays PLC Annual Report 2002

Shareholder information
Shareholder information Dividends on the ordinary shares of Barclays PLCBarclays PLC has paid dividends on its ordinary shares every year without interruption since its incorporation in 1896.
The dividends declared for each of the last five years were:
Pence per 25p ordinary share (a)2002 2001 2000 1999 1998
Interim 6.350 5.750 5.000 4.375 3.875Final 12.000 10.875 9.500 8.125 6.875
18.350 16.625 14.500 12.500 10.750
US Dollars per 25p ordinary share (a)2002 2001 2000 1999 1998
Interim 0.10 0.08 0.07 0.07 0.06Final 0.19 0.16 0.13 0.12 0.11
0.29 0.24 0.20 0.19 0.17
The gross dividends applicable to an American Depositary Share (ADS) representing four ordinary shares, before deduction ofwithholding tax, but including the UK imputed tax credit for dividends paid before 6th April 1999 (see Taxation of US holders(page 240)) are as follows.
US Dollars per American Depositary Shares2002 2001 2000 1999 1998
Interim 0.40 0.34 0.29 0.29 0.33Final 0.76 0.64 0.54 0.51 0.44
1.16 0.98 0.83 0.80 0.77
Dividends expressed in dollars are translated at the noon buying rates in New York City for cable transfers in pounds sterling ascertified for customs purposes by the Federal Reserve Bank of New York (the ‘noon buying rate’) for the days on which dividendsare paid, except for the 2002 final dividend, payable in the UK on 28th April 2003, which is translated at noon buying rateapplicable on 3rd March 2003, the latest practical date for inclusion in this report. No representation is made that pounds sterlingamounts have been, or could have been, or could be, converted into dollars at these rates.
(a) On 25th April 2002, the sub division of each ordinary share of £1 each (issued and unissued) into four ordinary shares of 25peach was approved by the shareholders and dealings in the new shares commenced on 29th April 2002. All numbers in the tablesare presented as if the sub division had applied to all periods.
235Barclays PLC Annual Report 2002

Shareholder information
236 Barclays PLC Annual Report 2002
Trading market for ordinary shares of Barclays PLCThe nominal capital of Barclays PLC is divided into 9,996,000,000 ordinary shares of 25p each (ordinary shares) and 1,000,000staff shares of £1 each (staff shares). At the close of business on 31st December 2002, 6,575,507,329 25p ordinary shares and875,000 staff shares were outstanding.
The principal trading market for Barclays PLC ordinary shares is the London Stock Exchange. Ordinary share listings were alsoobtained on the Tokyo Stock Exchange with effect from 1st August 1986 and the New York Stock Exchange (NYSE) with effectfrom 9th September 1986.
Trading on the NYSE is in the form of ADSs under the symbol ‘BCS’. Each ADS represents four 25p ordinary shares and isevidenced by an American Depositary Receipt (ADR). The ADR depositary is The Bank of New York. Details of trading activityare published in the stock tables of leading daily newspapers in the United States.
There were 789 recorded holders (including 112 ADR holders) of ordinary shares with US addresses at 31st December 2002,whose shareholdings represented approximately 1.46% of total outstanding ordinary shares on that date. Since certain of theordinary shares and ADRs were held by brokers or other nominees, the number of recorded holders in the US may not berepresentative of the number of beneficial holders or of their country of residence.
The following table shows the high and low sales prices for the ordinary shares of 25p during the periods indicated, based onmid-market prices at close of business on the London Stock Exchange and the high and low sale prices for ADSs as reportedon the NYSE composite tape.
From 29th January 2001, decimal pricing was introduced for trading on the NYSE.
25p ordinary shares American Depositary Shares
High Low High Lowp p US$ US$
2002By month:December 465 370 29.75 23.55November 478 428 30.42 26.90October 476 388 30.00 23.81September 464 355 28.40 21.37August 486 410 30.30 25.11July 558 417 34.48 25.00
By quarter:Fourth quarter 478 370 30.42 23.55Third quarter 558 355 34.48 21.37Second quarter 624 521 38.00 30.83First quarter 576 516 34.00 29.67
2001Fourth quarter 570 461 33.64 27.25Third quarter 571 379 33.27 22.25Second quarter 575 520 34.13 29.88First quarter 582 471 34.13 27.00
2002 624 355 38.00 21.372001 582 379 34.12 22.252000 528 334 32.19 22.721999 502 322 32.18 22.711998 487 209 32.21 14.59
The high and low prices for 25p ordinary shares and American depositary shares in January 2003 were 398p and 329p andUS$25.87 and US$21.56 respectively.
NoteThis section incorporates information on the prices at which securities of Barclays PLC and Barclays Bank PLC have traded.It is emphasised that past performance cannot be relied upon as a guide to future performance.

Shareholder information
237Barclays PLC Annual Report 2002
Shareholdings at 31st December 2002(a)
Shares heldas a
Shareholders percentagePercentage Number of of issued
of total shares held ordinaryNumber holders (millions) shares
Classification of shareholdersPersonal holders 887,865 97.50 844.4 12.84Banks and nominee companies 20,133 2.20 5,395.9 82.06Other companies 2,263 0.25 200.9 3.06Insurance companies 336 0.04 82.9 1.26Pension funds 38 0.01 51.4 0.78
Totals 910,635 100 6,575.5 100
Shareholding range1-100 26,795 2.94 1.3 0.02101-250 374,752 41.15 79.9 1.22251-500 257,507 28.28 91.1 1.39501-1,000 117,045 12.85 81.5 1.241,001-5,000 99,254 10.90 199.6 3.035,001-10,000 17,957 1.97 126.9 1.9310,001-25,000 11,551 1.27 175.2 2.6625,001-50,000 2,964 0.33 101.2 1.5450,001 and over 2,810 0.31 5,718.8 86.97
Totals 910,635 100 6,575.5 100
USA holdings 789 0.09 95.7 1.46
(a) These figures include Barclays Sharestore members.
Shareholder information
Memorandum and Articles of AssociationThe Company was incorporated in England and Wales on20th July 1896 under the Companies Acts 1862 to 1890 as acompany limited by shares and was re-registered in 1982 asa public limited company under the Companies Acts 1948 to 1980. The Company is registered under company number48839. The Company was re-registered as Barclays PLC on1st January 1985.
The objects of the Company are set out in full in clause 4 ofits memorandum of association which provides, among otherthings, that the Company’s objects are to carry on the businessof an investment and holding company in all respects.
DirectorsA Director may not vote or count towards the quorum on any resolution concerning any proposal in which he (or anyperson connected with him) has a material interest (other thanby virtue of his interest in securities of the Company) or if hehas a duty which conflicts or may conflict with the interests of the Company, unless the resolution relates to any proposal:
(i) to indemnify a Director in respect of any obligationincurred for the benefit of the Company (or any other memberof the Group);
(ii) to indemnify a third party in respect of any obligation forwhich the Director has personally assumed responsibility;
(iii) to indemnify a Director for any liability which he mayincur in the performance of his duties or to obtain insuranceagainst such a liability;
(iv) involving the acquisition by a Director of any securitiesof the Company pursuant to an offer to existing holders ofsecurities or to the public;
(v) that the Director underwrite any issue of securitiesof the Company (or any of its subsidiaries);
(vi) concerning any other company in which the Director isinterested as an officer or creditor or shareholder, but only ifhe owns less than 1% of either the issued equity share capitalor of the voting rights of that company;
(vii) concerning any superannuation fund or retirement, death or disability benefits scheme or employees sharescheme, so long as any such fund or scheme does not giveadditional advantages to the Directors which are not grantedto the employees who are in the fund or scheme; and
(viii) concerning any other arrangement for the benefit ofemployees of the Company or any other member of the Groupunder which the Director benefits in a similar manner to theemployees concerned and which does not give the Directorany advantage which the employees to whom the arrangementrelates would not receive.
A Director may not vote or be counted in the quorum onany resolution which concerns his own employment withthe Company or any other company in which the Companyis interested.
The Directors may exercise all the powers of the Companyto borrow money.
238 Barclays PLC Annual Report 2002
A Director must retire from office at the conclusion of the firstannual general meeting after he reaches the age of 70.
A Director is required to hold an interest in ordinary shareshaving a nominal value of at least £500. A Director may actbefore acquiring those shares but must acquire the qualificationshares within two months after his or her appointment.
At each annual general meeting one-third of the Directors forthe time being (rounded down if necessary) are required toretire from office.
Classes of shareThe Company has two classes of shares, ordinary shares andstaff shares, to which the provisions set out below apply.
(a) Dividends Under English law, dividends are payable on the Company’sordinary shares only out of profits available for distribution,as determined in accordance with accounting principlesgenerally accepted in the UK and by the Companies Act 1985.The Company in general meeting may declare dividends byordinary resolution, but such dividend may not exceed theamount recommended by the Directors. The Directors may pay interim or final dividends if it appears they are justified by the Company’s financial position.
The profits which are resolved to be distributed in respectof any financial period are applied first in payment of a fixeddividend of 20% per annum on the staff shares and then inpayment of dividends on the ordinary shares.
If a dividend is not claimed after 12 years of it becomingpayable, it is forfeited and reverts to the Company.
The Directors may, with the approval of an ordinary resolutionof the Company, offer shareholders the right to chose toreceive an allotment of new ordinary shares credited as fullypaid instead of cash in respect of all or part of any dividend.
(b) Voting Every member who is present in person or represented atany general meeting of the Company and who is entitledto vote has one vote on a show of hands. On a poll, everymember who is present or represented has one vote forevery share held.
If any sum remains unpaid in relation to a member’s shareholding,that member is not entitled to vote that share unless the boardotherwise determines.
If any member, or any other person appearing to be interestedin any shares in the Company, is served with a notice underSection 212 of the Companies Act 1985 and does not supplythe Company with the information required in the notice, then the Board, in its absolute discretion, may direct that that member shall not be entitled to attend or vote at anymeeting of the Company.
(c) Liquidation In the event of any return of capital on liquidation the ordinaryshares and the staff shares rank equally in proportion to the amounts paid up or credited as paid up on the shares of each class, except that in the event of a winding up of theCompany the holders of the staff shares are only entitled toparticipate in the surplus assets available for distribution upto the amount paid up on the staff shares plus 10%.

Shareholder information
(d) Redemption provisionsSubject to the Companies Act 1985, any share may be issuedon terms that it is, at the option of the Company or the holderof such share, redeemable. The Company has no redeemableshares in issue.
(e) Calls on capital The Directors may make calls upon the members in respectof any monies unpaid on their shares. A person upon whoma call is made remains liable even if the shares in respect ofwhich the call is made have been transferred.
(f ) Variation of rights The rights attached to any class of shares may be varied with the sanction of an extraordinary resolution passed at aseparate meeting of the holders of the shares of that class.
Annual and extraordinary general meetings The Company is required to hold a general meeting each yearas its annual general meeting in addition to other meetings(called extraordinary general meetings) as the Directors thinkfit. The type of the meeting will be specified in the noticecalling it. Not more than 15 months may elapse between thedate of one annual general meeting and the next.
In the case of an annual general meeting or a meeting for the passing of a special resolution (requiring the consent of a 75% majority) 21 clear days’ notice is required. In other cases14 clear days’ notice is required. The notice must specify theplace, the date and the hour of the meeting, and the generalnature of the business to be transacted.
Subject as noted in (b) above, all shareholders are entitled toattend and vote at general meetings. The articles of associationdo, however, provide that arrangements may be made forsimultaneous attendance at a general meeting at a place otherthan that specified in the notice of meeting, in which casesome shareholders may be excluded from the specified place.
Limitations on foreign shareholdersThere are no limitations imposed by English law or theCompany’s memorandum or articles of association on theright of non-residents or foreign persons to hold or vote theCompany’s ordinary shares other than the limitations thatwould generally apply to all of the Company’s shareholders.
TaxationThe following is a summary of the principal tax consequencesfor holders of ordinary shares of Barclays PLC, preferenceshares of the Bank, ADSs representing such ordinary shares orpreference shares, who are citizens or residents of the UK orUnited States, or otherwise who are subject to UK tax or USfederal income tax on a net income basis in respect of suchsecurities. It is not, however, a comprehensive analysis of all the potential tax consequences for such holders andinvestors are advised to consult their tax advisers regarding the tax implications of their particular holdings, including the consequences under applicable state and local law. Unlessotherwise noted, the statements of tax laws set out below are based on the laws in force as at 12th February 2003 andare subject to any subsequent changes in UK or US law. Inparticular any announcements made in the Chancellor’s UKBudget, the date of which has not been announced but isexpected to be in March or April 2003, or in any double taxconvention between the US and the UK.
As discussed below, a new double tax convention between theUS and the UK has been signed, but not yet ratified. In addition,this section is based in part upon the representations of theADR Depositary and the assumption that each obligation ofthe Deposit Agreement and any related agreement will beperformed in accordance with its terms.
For the purposes of the current US-UK double tax conventionsrelating to income tax (the Income Tax Convention) and estateand gift tax (the Estate Tax Convention) and for the purposes ofthe US Internal Revenue Code of 1986, as amended (the Code),the holders of ADSs are treated as owners of the underlyingordinary shares or preference shares, as the case may be.
Taxation of UK holders Taxation of dividends In accordance with UK law, Barclays PLC and the Bank paydividends on ordinary shares and preference shares withoutany deduction or withholding tax in respect of any taxesimposed by the UK government or any UK taxing authority.
If the shareholder is a UK resident individual liable to incometax only at the basic rate or the lower rate, then there will beno further tax liability in respect of the dividend received. If,however, the individual shareholder is subject to income tax atthe higher rate (currently 40%), there will be a further liabilityto tax. Higher rate taxpayers are taxable on dividend income ata special rate of (currently 32.5%) against which can be offseta tax credit of one-ninth of the dividend paid. Tax credits areno longer repayable to shareholders with no tax liability.
Taxation of shares under the Dividend Reinvestment Plan Where a shareholder elects to purchase shares using their cash dividend, the individual will be liable for income tax on dividends reinvested in the Plan on the same basis as if they had received the cash and arranged the investmentthemselves. They should accordingly include the dividendreceived in their annual tax return in the normal way. The taxconsequences for a UK individual are the same as described in ‘Taxation of dividends’ above.
Taxation of capital gains Where shares are disposed of by open market sale, a capitalgain may result if the disposal proceeds exceed the sum of the base cost of the shares sold and any other allowabledeductions such as share dealing costs, indexation relief (up to 5th April 1998) and taper relief (generally on shares held at 16th March 1998 and subsequent acquisitions). To arrive atthe total base cost of any Barclays PLC shares held, the amountsubscribed for rights taken up in 1985 and 1988 must beadded to the cost of all other shares held. For this purpose,current legislation permits the market valuation at 31st March1982 to be substituted for the original cost of sharespurchased before that date.
The calculations required to compute chargeable capital gains, particularly taper and indexation reliefs, may be complex.Capital gains may also arise from the gifting of shares toconnected parties such as relatives (although not spouses) and family trusts. Shareholders are advised to consult theirpersonal financial adviser if further information regarding apossible tax liability in respect of their holdings of Barclays PLCshares is required.
Stamp duty On the purchase of shares, stamp duty or stamp duty reservetax at the rate of 0.5% is normally payable on the purchaseprice of the shares.
239Barclays PLC Annual Report 2002

Shareholder information
Inheritance taxAn individual may be liable to inheritance tax on the transferof ordinary shares or preference shares. Where an individual is liable, inheritance tax may be charged on the amount bywhich the value of his or her estate is reduced as a result ofany transfer by way of gift or other gratuitous transactionmade by them or treated as made by them.
Taxation of US holders Taxation of dividends Under the Income Tax Convention, a beneficial owner ofordinary shares or preference shares who is a resident of theUnited States and not a resident of the UK, whose holding isnot effectively connected with a permanent establishment orfixed base in the UK and who is not subject to special rules(such as those that apply to US tax-exempt entities and certaininvestment or holding companies, 25% of the capital of whichis held directly or indirectly by persons that are not individualresidents or nationals of the United States (a US holder)) hasgenerally been entitled to receive a refund from the UK InlandRevenue, in addition to any dividend paid by Barclays PLC orthe Bank, of an amount equal to the tax credit available to UKresident individuals, less a withholding tax equal to 15% of theaggregate of the tax credit and the dividend.
For dividends paid on or after 6th April 1999, the tax credit has been reduced to one-ninth of the dividend paid, althoughthe withholding rate remains at 15% (but not to exceed theamount of the tax credit). Thus, US holders generally are nolonger entitled to a refund of the tax credit as of that date orare entitled only to a residual refund equal to less than 1% ofthe amount of the dividend. In respect of dividends paid after6th April 1999 any US holder entitled to such refund must, inorder to obtain it, file a claim for payment in the manner, andat the time, specified by the procedures established by the UK Inland Revenue. Dividends received by a US holder will be foreign source income for US federal income tax purposesin the amount equal to the US dollar value of the payment(generally including the related tax credit amount if IRS Form8833 is appropriately filed) as determined by the spot poundsterling/US dollar exchange rate, on the date of such payment.Dividends generally will not be eligible for the ‘dividendsreceived’ deduction allowed to US corporations under theCode. Subject to certain limitations, UK tax withheld frompayments will be available as a credit against US tax (assumingsuch US holder claims the benefits of the Income TaxConvention with respect to such dividends).
On 24th July 2001, the United States of America and theUnited Kingdom signed a new income tax treaty (the NewTreaty) that, if ratified, would replace the existing Income Tax Convention. The New Treaty would make a number ofimportant changes. In particular, under the New Treaty, USholders would not be entitled to the UK tax credit available to UK resident individuals and accordingly there would be noimposition of UK withholding tax and no associated UnitedStates foreign tax credit. The New Treaty would generally beeffective, in respect of taxes withheld at source, for amountspaid or credited on or after the first day of the second monthafter the New Treaty is ratified. Other provisions of the NewTreaty would take effect on the 1st of January next followingthe date of ratification. If the New Treaty is ratified, the rules of the Existing Treaty would remain in effect until theeffective dates described above. However, a US holder would be entitled to elect to have the Existing Treaty apply in itsentirety for a period of 12 months after the effective dates of the New Treaty.
Taxation of capital gains Generally, US holders will not be subject to UK tax, but will besubject to US tax on capital gains realised on the sale or otherdisposition of ordinary shares, preference shares or ADSs(assuming such shares are held as capital assets).
Taxation of premium on redemption or purchase of shares No refund of tax will be available under the Income TaxConvention in respect of any premium paid on a redemption of preference shares by the Bank or on a purchase by BarclaysPLC of its own shares.
For US tax purposes, redemption premium generally will betreated as an additional amount realised in the calculation of gain or loss.
Stamp duty No UK stamp duty is payable on the transfer of an ADS,provided that the separate instrument of transfer is notexecuted in, and remains at all times outside, the UK.
Estate and gift tax Under the Estate Tax Convention, a US holder generally is notsubject to UK inheritance tax.
Exchange controls and other limitationsaffecting security holdersOther than certain emergency restrictions which may be inforce from time to time, there are currently no UK laws, decreesor regulations which would affect the transfer of capital orremittance of dividends, interest and other payments to holdersof Barclays securities who are not residents of the UK. There arealso no restrictions under the Articles of Association of eitherBarclays PLC or the Bank, or under current UK laws, which limitthe right of non-resident or foreign owners, to hold Barclayssecurities or, when entitled to vote, to do so.
Sub-division of ordinary sharesFollowing approval by shareholders at the 2002 AGM, eachissued and unissued ordinary share of £1 each of Barclays PLCwas divided into four ordinary shares of 25p each. Applicationswere made for the listing of, and admission to trade in, the newordinary shares of 25p each on the London Stock Exchange,The New York Stock Exchange and the Tokyo Stock Exchange.Dealings in the new ordinary shares of 25p each commencedon 29th April 2002.
240 Barclays PLC Annual Report 2002

Shareholder information
Documents on displayIt is possible to read and copy documents that have been filedby Barclays PLC and Barclays Bank PLC with the US Securitiesand Exchange Commission at the US Securities and ExchangeCommission’s public reference room located at 450 5th Street,NW, Washington, DC20549. Please call the US Securities and Exchange Commission at 1-800-SEC-0330 for furtherinformation on the public reference rooms and their copy charges. Filings with the US Securities and ExchangeCommission are also available to the public from commercialdocument retrieval services, and in the website maintained bythe SEC at www.sec.gov.
Shareholder enquiriesInvestors who have any questions about their investment inBarclays, or about Barclays in general, may write to:
Head of Investor RelationsBarclays PLC54 Lombard StreetLondon EC3P 3AH
or, in the United States of America,
The Corporate Communications DepartmentBarclays Bank PLC222 BroadwayNew York, NY 10038, USA
Registered and Head Office:54 Lombard StreetLondon EC3P 3AHTel: 020 7699 5000
Registrar:The Registrar to Barclays PLC PO Box 82The PavilionsBridgwater RoadBristol BS99 7NHTel: 0870 702 0196E-mail: [email protected]
ADR Depositary:The Bank of New YorkPO Box 11258Church Street StationNew YorkNY 10286-1258Tel: 1-888-BNY-ADRS (toll-free for US domestic callers) or 610312 5315E-mail: [email protected]
241Barclays PLC Annual Report 2002

242 Barclays PLC Annual Report 2002
Group senior managementand principal offices
Barclays Bank PLC54 Lombard StreetLondonEC3P 3AHTel: 020 7699 5000
Sir Peter Middleton GCB ChairmanMatthew Barrett Group Chief Executive
Group Executive CommitteeMatthew Barrett Group Chief ExecutiveRoger Davis Chief Executive, Business BankingBob Diamond Chief Executive, Barclays CapitalGary Dibb Group Chief Administrative OfficerGary Hoffman Chief Executive,BarclaycardBob Hunter Chief Executive, BarclaysPrivate Clients (until 31st March 2003)Naguib Kheraj Chief Executive, BarclaysPrivate Clients (from 31st March 2003)Chris Lendrum Group Executive DirectorRobert Nimmo Group Risk DirectorDavid Roberts Chief Executive, Personal Financial ServicesJohn Varley Group Finance DirectorDavid Weymouth Chief InformationOfficer
Group Central Functions54 Lombard StreetLondonEC3P 3AHTel: 020 7699 5000
Jon Anderson Chief AccountantGraham Brammer Group PropertyServices DirectorAllan Barr Director, SolutionsRachel Belsham Initiative Leader, Core UK Near Term PriorityToby Broome Commercial ServicesDirectorAndrew Bruce Group Credit Risk DirectorLeigh Bruce Communications DirectorMatthew Cooper Director Group MoneyLaundering PreventionJohn Cotton Director, Canary WharfProgrammeMike Davis Director of Public Policy
Lawrence Dickinson Group SecretaryGary Dibb Group Chief Administrative OfficerRobert East Programme Director,Productivity and Cost ProgrammeAllan Fielder HR Business Partner forGroup Central FunctionsPeter Gallant Group TreasurerJohn Gilbert Finance and Business Risk DirectorSimon Gulliford Group MarketingDirectorBrian Harte Group Compliance DirectorPaul Hartwell Chief Operating Officer,Group RiskPeter Herbert Group Director, Strategy and PlanningKathy Lisson Director of Operational TransformationIan Menzies-Conacher Group TaxationDirectorGeoffrey Mitchell Director, Finance ProjectsRobert Nimmo Group Risk DirectorDavid Postings Managing Director, EnableValerie Scoular Group Human Resources DirectorDavid Storey Director, Group InternalAuditHoward Trust Group General Counsel Cathy Turner Head of Investor RelationsColin Walklin Director, Group FinanceDavid Weymouth Chief Information Officer
Personal Financial Services54 Lombard StreetLondonEC3P 3AHTel: 020 7699 5000
David Roberts Chief Executive OfficerPhilip Barr Director Human ResourcesJohn Crane Director ProductionRobin Dickie Chief Operating OfficerAndrew Gillespie Marketing DirectorJohn Little Director RiskFrederic Nze* Director ConsumerFinanceLynne Peacock* Chief ExecutiveWoolwich & Regulated ProductsTony Prestedge* Director MortgagesEamon Slevin* Director GeneralInsuranceChris Willford Director Finance &Planning
Barclays Private ClientsMurray House1 Royal Mint CourtLondonEC3N 4HHTel: 020 7977 7000
Bob Hunter Chief ExecutiveBob Bashford Risk DirectorBob Dench* Managing Director,Investment Management.Alex Dyce Country Manager, PortugalJohn Eaton* Managing Director,International BankingJacobo Gonzalez-Robatto* ManagingDirector, Iberia and Country Manager,SpainMichael Murray Chief Operating OfficerMike Pedersen* Managing Director,Private BankingMichael Pinder* Managing Director,Premier BankingGordon Rankin Market DevelopmentDirectorPascal Roché* Country Manager, FranceMark Wells Human Resources Director
Barclaycard1234 Pavilion DriveNorthamptonNN4 7SGTel: 01604 234 234
Gary Hoffman Chief Executive OfficerPeter Crook* Managing DirectorBarclaycard UKMark Evans* Managing DirectorBarclaycard CorporateBarry Fergus* Managing DirectorBarclaycard InternationalJohn Sands Director Human ResourcesRichard Sommers Finance Director
Business Banking54 Lombard StreetLondonEC3P 3AHTel: 020 7699 5000
Roger Davis Chief ExecutiveWai Au Chief Operating OfficerJohn Callender* Managing Director,Asset and Sales FinancingAlastair Camp* Managing Director,Medium Business and AgriculturePeter Harvey* Managing Director, Larger BusinessMike Rogers* Managing Director, Small BusinessAndy Simmonds Business Risk DirectorMark Wells Human Resources Director
Group senior management and principal offices
*Strategic Business Unit Head
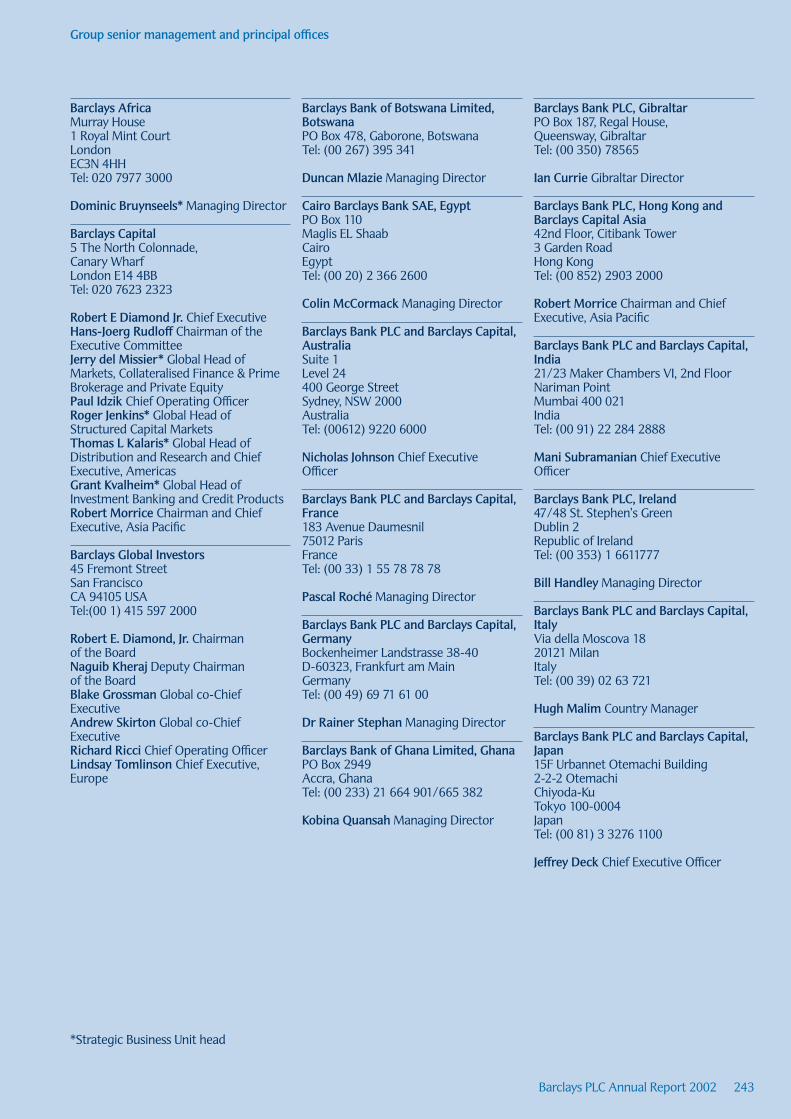
243Barclays PLC Annual Report 2002
Barclays AfricaMurray House1 Royal Mint CourtLondonEC3N 4HHTel: 020 7977 3000
Dominic Bruynseels* Managing Director
Barclays Capital5 The North Colonnade,Canary WharfLondon E14 4BBTel: 020 7623 2323
Robert E Diamond Jr. Chief ExecutiveHans-Joerg Rudloff Chairman of theExecutive CommitteeJerry del Missier* Global Head ofMarkets, Collateralised Finance & PrimeBrokerage and Private EquityPaul Idzik Chief Operating OfficerRoger Jenkins* Global Head ofStructured Capital MarketsThomas L Kalaris* Global Head ofDistribution and Research and ChiefExecutive, Americas Grant Kvalheim* Global Head ofInvestment Banking and Credit ProductsRobert Morrice Chairman and ChiefExecutive, Asia Pacific
Barclays Global Investors45 Fremont StreetSan FranciscoCA 94105 USATel:(00 1) 415 597 2000
Robert E. Diamond, Jr. Chairman of the BoardNaguib Kheraj Deputy Chairman of the BoardBlake Grossman Global co-ChiefExecutiveAndrew Skirton Global co-ChiefExecutive Richard Ricci Chief Operating OfficerLindsay Tomlinson Chief Executive,Europe
Barclays Bank of Botswana Limited,BotswanaPO Box 478, Gaborone, BotswanaTel: (00 267) 395 341
Duncan Mlazie Managing Director
Cairo Barclays Bank SAE, EgyptPO Box 110Maglis EL ShaabCairoEgyptTel: (00 20) 2 366 2600
Colin McCormack Managing Director
Barclays Bank PLC and Barclays Capital,AustraliaSuite 1Level 24400 George StreetSydney, NSW 2000AustraliaTel: (00612) 9220 6000
Nicholas Johnson Chief Executive Officer
Barclays Bank PLC and Barclays Capital,France183 Avenue Daumesnil75012 ParisFranceTel: (00 33) 1 55 78 78 78
Pascal Roché Managing Director
Barclays Bank PLC and Barclays Capital,GermanyBockenheimer Landstrasse 38-40D-60323, Frankfurt am MainGermanyTel: (00 49) 69 71 61 00
Dr Rainer Stephan Managing Director
Barclays Bank of Ghana Limited, GhanaPO Box 2949Accra, GhanaTel: (00 233) 21 664 901/665 382
Kobina Quansah Managing Director
Barclays Bank PLC, GibraltarPO Box 187, Regal House,Queensway, GibraltarTel: (00 350) 78565
Ian Currie Gibraltar Director
Barclays Bank PLC, Hong Kong andBarclays Capital Asia42nd Floor, Citibank Tower3 Garden RoadHong KongTel: (00 852) 2903 2000
Robert Morrice Chairman and ChiefExecutive, Asia Pacific
Barclays Bank PLC and Barclays Capital,India21/23 Maker Chambers VI, 2nd FloorNariman PointMumbai 400 021IndiaTel: (00 91) 22 284 2888
Mani Subramanian Chief ExecutiveOfficer
Barclays Bank PLC, Ireland47/48 St. Stephen’s GreenDublin 2Republic of IrelandTel: (00 353) 1 6611777
Bill Handley Managing Director
Barclays Bank PLC and Barclays Capital,ItalyVia della Moscova 1820121 MilanItalyTel: (00 39) 02 63 721
Hugh Malim Country Manager
Barclays Bank PLC and Barclays Capital,Japan15F Urbannet Otemachi Building2-2-2 OtemachiChiyoda-KuTokyo 100-0004JapanTel: (00 81) 3 3276 1100
Jeffrey Deck Chief Executive Officer
Group senior management and principal offices
*Strategic Business Unit head

Barclays Bank of Kenya Limited, KenyaPO Box 30120NairobiKenyaTel: (00 254) 2 332 230
Adan Mohamed Managing Director
Barclays Bank PLC and Barclays Capital,Latin American Regional Office1111 Brickell AvenueMiamiFlorida 33131USATel: (00 1) 305 533 3333
Enrique Arias Deputy Chief ExecutiveOfficer
Barclays Bank PLC, MauritiusPO Box 284Port LouisMauritiusTel: (00 230) 2071800
Jacques De Navacelle Managing Director
Barclays Bank PLC, PortugalAvenida da Republica50-3rd Floor1050-196 LisbonPortugalTel: (00 351) 21 7911100
Alex Dyce Country Manager
Barclays Bank (Seychelles) Limited,SeychellesPO Box 167Mahe, SeychellesTel: (00 248) 383838
Paul Freer Managing Director
Barclays Bank PLC and Barclays Capital,Singapore23 Church Street13-08 Capital SquareSingapore 049 481Tel: (00 65) 395 3000
Quek Suan Kiat Branch Manager
Barclays Bank PLC and Barclays Capital,South Africa8 Rivonia RoadIllovo 2196JohannesburgSouth AfricaTel: (00 27) 11 772 7000
Isaac Takawira Country ManagingDirector
Barclays Bank PLC and Barclays CapitalSecurities Limited, Korea23rd Floor, Seoul Finance Center84 Tapeyungro 1-gaChung-guSeoul 100-768KoreaTel: (00 822) 2126 2600
Jin Sool Joo Managing Director
Barclays Bank SA and Barclays BankPLC, SpainPlaza de Colon 128046 MadridSpainTel: (00 34) 91 336 1975
Jacobo Gonzalez-Robatto ManagingDirectorPedro Santaella Managing Director,Barclays Capital
Barclays Bank (Suisse) S.A.PO Box 3941CH-1211 Geneva 3SwitzerlandTel: (00 41) 22 81 95 11
Michael Morley Chief Executive Officer
Barclays Bank Tanzania Limited,TanzaniaPO Box 5137, TDFL BuildingOhio Street, Dar es SalaamTanzaniaTel: (00 255) 22 2129381
Mark Petchell Managing Director
Barclays Bank PLC and Barclays Capital,USA200 Park AvenueNew York, NY 10166USATel: (00 1) 212 412 4000
Thomas L Kalaris Chief Executive
Barclays Global Investors, N.A.45 Fremont StreetSan FranciscoCA 94105 USATel: (00 1) 415 597 2000
Blake Grossman Co-Chief ExecutiveAndrew Skirton Co-Chief Executive
Barclays Bank of Uganda Limited,UgandaPO Box 2971KampalaUgandaTel: (00 256) 78218110
Frank Griffiths Managing Director
Barclays Bank of Zambia Limited, ZambiaKafue HouseCairo RoadLusakaZambiaTel: (00 260) 1 228 244
Margaret Mwanakatwe ManagingDirector
Barclays Bank of Zimbabwe Limited,ZimbabwePO Box 1279Jason Mayo AvenueHarareZimbabweTel: (00 263) 4 758 280
Alec Jongwe Managing Director
Woolwich plcWatling StreetBexleyheathKentDA6 7RRTel: 020 8298 5000
Lynne Peacock* Chief Executive
Group senior management and principal offices
*Strategic Business Unit head
244 Barclays PLC Annual Report 2002

Registered No. 48839This document contains certain forward-looking statements within themeaning of section 21E of the US Securities Exchange Act of 1934, asamended and section 27A of the US Securities Act of 1933, as amended with respect to certain of the Group’s plans and its current goals andexpectations relating to its future financial condition and performance.
The Group may also make forward-looking statements in other writtenmaterials, including other documents filed with or furnished to the SEC. In addition, the Group’s senior management may make forward-lookingstatements orally to analysts, investors, representatives of the media andothers. In particular, among other statements, certain statements in theFinancial Review and Business Description with regard to managementobjectives, trends in results of operations, margins, costs, return on equity,risk management, and competition are forward looking in nature. Theseforward-looking statements can be identified by the fact that they do not
relate only to historical or current facts. Forward-looking statements often use words such as “anticipate,” “target,” “expect,” “estimate,” “intend,” “plan,” “goal,” “believe,” or other words of similar meaning.
By their nature, forward-looking statements involve risk and uncertaintybecause they relate to events and depend on circumstances that will occur in the future. The Group’s actual future results may differ materially fromthose set out in the Group’s forward-looking statements. There are manyfactors that could cause actual results and developments to differ materiallyfrom those expressed or implied by these forward-looking statements. Anyforward-looking statements made by or on behalf of the Group speak only as of the date they are made. Barclays does not undertake to update forward-looking statements to reflect any changes in the Group’s expectations withregard thereto or any changes in events, conditions or circumstances onwhich any such statement is based. The reader should, however, consult anyfurther disclosures Barclays may make in documents it files with the SEC.
Section 1Review
1 Introduction2 Chairman’s Statement5 Group Chief Executive’s
Statement8 Financial Performance
Group Finance Director14 The Leadership Team
Section 2Impact
18 Corporate SocialResponsibility
32 Directors and officers of Barclays PLC andBarclays Bank PLC
35 Directors’ report37 Corporate governance
report40 Barclays report on
remuneration52 Accountability and Audit53 Presentation of
information54 Risk management
Section 3Results
87 Financial Data90 Business description96 Financial review123 Other information126 Auditors’ reports128 Consolidated accounts
Barclays PLC235 Shareholder information242 Group senior
management andprincipal offices

Barclays PLCAnnual Report 2002
Barclays PLCHead Office54 Lombard StreetLondon EC3P 3AHTel 020 7699 5000www.barclays.com
a
a
Barclays PLC Annual Report
2002
9955212