Embed Size (px)
Citation preview

U.S. Public Finance
Expression of Interest for the Delivery of an
Initial Operating Segment
California High-Speed Rail Authority
RFEI HSR #15-02
September 28, 2015

John McCray-Goldsmith Director 555 California Street, 30th Floor San Francisco, CA 94104 (415) 274-5374 [email protected]
September 28, 2015 Ms. Rebecca Harnagel Director of Design & Construction California High-Speed Rail Authority 770 L Street, Suite 620 MS 2 Sacramento, CA 95814 Dear Ms. Harnagel: This Letter of Transmittal accompanies the attached Expression of Interest from Barclays in response to RFEI HSR #15-02. Barclays is submitting this expression of interest individually. I lead Barclays’ transportation infrastructure finance practice in the Western Region from the Firm’s San Francisco office, and will serve as our main point of contact for the Authority:
John McCray-Goldsmith Director Barclays 555 California Street, 30th Floor San Francisco, CA 94104 [email protected] 415-274-5374 (office) 510-504-2508 (cell)
We look forward to the opportunity to bring our broader team to meet with you as part of the follow-up process to the RFEI. Sincerely,
John McCray-Goldsmith Director

Response to CHSRA RFEI HSR#15-02
September 28, 2015
Table of Contents Page
Letter of Transmittal
11.3 Firm Experience and Team Structure 1
11.7 Funding and Financing Questions 8
Appendix 1: Barclays’ MSCI Green Bond Index
Appendix 2: Barclays’ California High Speed Rail Authority Coverage Team
Appendix 3: Cap-and-Trade Basics: Mechanics of the Program
Appendix 4: CARB Auction Actual and Projected Results
Response to CHSRA RFEI HSR#15-02
Page 1 of 23 September 28, 2015
The EOI should include a brief statement describing the Respondent’s experience with similar projects and similar services. To the extent that the Respondent is submitting an EOI as part of a joint venture or consortium, then the EOI shall include a description of the proposed team structure, including what strengths and experiences each entity brings to the overall team.
11.3 Firm Experience and Team Structure
Introduction:
Barclays Bank PLC (“Barclays Bank”) is a publicly traded U.K.-based bank that was founded in 1690. Barclays Bank operates in over 50 countries and employs nearly 140,000 people worldwide. Barclays Capital Inc. (“Barclays”) is the U.S.-based investment banking arm of Barclays Bank and was incorporated in the State of Connecticut in 1980. The firm is headquartered in New York, with 15 registered domestic branch offices in 13 U.S. cities including Los Angeles and San Francisco. Barclays is a registered securities broker-dealer and futures commission merchant and employs 24,000 people worldwide. Barclays is pleased to continue our engagement with the Authority on the development of financing approaches to support the completion of an initial operating segment (IOS) of the railroad via our response to this RFEI. As a firm we believe we bring the Authority a unique set of capabilities that we commit to the solution of the challenges facing the Authority. These include our global experience in the high-speed rail sector, our worldwide P3 experience, our leadership in P3 financings in the US rail sector, our presence in the climate bond market and climate finance field, and our work as a bond underwriter for the State Treasurer’s Office—particularly our work leading the development of new credit structures including the $18 billion Economic Recovery Bond program and a unique structure for an enhanced truck weight fees financing. Barclays’ Global High-Speed Rail Experience:
As a global investment banking firm and the world’s leading underwriter of fixed income securities1
, Barclays has been engaged with government sponsors of high-speed rail projects worldwide in roles including financial advisor, equity investor, debt holder, bond underwriter and concessionaire /consortium member. The firm has also served as banker and underwriter to high-speed rail manufacturing, engineering and construction firms accessing the capital markets. Our worldwide experience includes the following engagements:
• Barclays was joint bookrunner for a recent offshore bond financing for the China Railway Engineering Corporation, one of two state-owned firms that have built China’s 16,000 km high-speed rail network.
• In January of this year, Barclays brought to market a €1 billion ten-year Eurobond issue for Adif AV, the Spanish state-owned high-speed rail system developer, and led
1 The Bond Buyer: #1 Global Debt House (2015); Bloomberg: #2 Global Debt Issuance (As of 9/9/15); Institutional Investor: #1 Credit Products in the Americas (2014)

Response to CHSRA RFEI HSR#15-02
Page 2 of 23 September 28, 2015
another €600m, seven-year note issue which came to market September 15, 2015, part of the funding program for Spain’s $15 billion rail capital expenditure program over the next five years. Adif is the state-owned developer, builder and operator of Spain’s 2,265 km high-speed rail network, the second-largest in the world following China.
• Barclays is an equity investor, debt holder and
debt underwriter for Gautrain, South Africa’s high-speed (160 km/h) train link between Johannesburg and Pretoria which opened just before the 2010 World Cup. Barclays’ subsidiary Absa Capital was an original member of Bombela, the DBFOM concessionaire which included Bombardier, Absa, and a local construction firm. The South African government makes declining availability payments based on a ridership target enumerated in the 20-year concession agreement.
• In the UK, Barclays’ current Head of Global Transportation
and Logistics was heavily involved in the creation and execution of the 1998 government rescue/restructuring transaction during the construction phase of the original 1996 Channel Tunnel Rail Link / High-Speed 1 (HS1) contract. In that case the original revenue risk model failed due to overoptimistic operating revenue forecasts for the Eurostar service to Paris and Brussels which was to have supported the financing of HS1. In 2010 Barclays advised a bidding consortium in a subsequent HS1 restructuring where the government sold a thirty-year concession which was ultimately awarded to Ontario Teachers/Borealis.
• Barclays has been engaged in early high-speed rail development efforts in the US including
a 2011 effort to raise capital in the private placement market for All Aboard Florida, and as a member of the financial advisory team for the California High-Speed Rail Authority from 2006-2009, during the period when Proposition 1A was proposed and adopted by California voters.
Climate Finance Leadership:
• Given the importance of climate change policy as a driver both for the Authority’s mission of carbon emission reduction and funding from the State’s Greenhouse Gas Revenue Fund (GGRF), Barclays has organized a team which brings the Authority unique experience and insight on the history, financeability and global context of the State’s cap and trade auction revenues under AB32. Our team includes our New York-based bankers Theodore Roosevelt IV and Steven Berkenfeld, both of whom have been involved at a senior level in climate change policy development and implementation over the last decade through their leadership of Barclays’ Cleantech Initiative and their non-profit board chairmanships of the Pew Center on Global Climate Change/C2ES (which advised the State on the development

Response to CHSRA RFEI HSR#15-02
Page 3 of 23 September 28, 2015
of its cap and trade program) and the Sierra Club Foundation. Their deep backgrounds and credibility with carbon emission reduction finance mechanisms will be a critical addition to the Authority’s effort to interpret the financeability of the California cap-and-trade revenue stream to the market.
• Barclays has a strong presence in the global Green Bond market as a member institution of
the Climate Bond Initiative, underwriter of Kfw’s £500 million issuance, Unibail Rodamco’s €500 million deal, and holder of over $1.6 billion of Green Bonds in the firm’s own portfolio. We are also the publisher of the monthly Barclays/MSCI Green Bond Index (See Appendix 1).
Barclays’ Public Private Partnership Financing and Transaction Advisory Experience • Barclays is a global leader in conceptualizing, structuring and executing innovative
financing solutions for public infrastructure projects. We are dedicated to the transportation project finance sector in particular, focusing on non-recourse, corporate-backed and other non-traditional financing solutions for such projects. As such, we have participated as advisor and/or debt arranger in all of the major domestic, transit, toll road, airport and multi-modal transportation projects that have incorporated alternative financing and/or ownership structures. We work with our public sector clients as direct issuers of innovative debt structures and through structured public-private partnership (“P3”) solutions as advisor and underwriter to private developers. In summary, we have the expertise, capabilities and, most importantly, experience to deliver the most creative and tailored financing solutions.
• Our capabilities in non-traditional finance are specialized in the structuring and placement
of all types of capital, including senior debt, junior debt and equity. The Firm is a leader in the market for project-based tax-exempt Private Activity Bonds (“PABs”) for P3s, non-recourse Government Purpose Bonds for single asset or single project-backed financings, and taxable private placements. Furthermore, we have leading expertise in all P3/concession structures, IRS qualified management agreements, conduit-based issuances and in procuring and negotiating federal loans. In Figure 1, we present select recent experience with financing structures and advisory assignments on major public sector infrastructure projects.

Response to CHSRA RFEI HSR#15-02
Page 4 of 23 September 28, 2015
Figure1: Barclays’ Selected P3 Experience
Transportation Project Finance and New Credit Structures: Market “Firsts”
• Barclays has a long history of success in delivering the most innovative financing solutions to our transportation clients and has led most of the “market firsts” in non-traditional finance, including the following transactions:
Figure 2: Non-Traditional Financing “Firsts”
First Transit
P3
First Domestic Airport
Terminal Privatization
First High-Occupancy Toll Lanes
Project
First Federal Highway
Administration GARVEEs
First TIFIA Loan Refinanced After
Bankruptcy
First TIFIA Loan

Response to CHSRA RFEI HSR#15-02
Page 5 of 23 September 28, 2015
Case Study: First US Rail P3—Denver Transit Partners / Eagle P3 Project • Barclays advised and provided volume underwriting
commitments to the P3 concessionaire Denver Transit Partners (DTP) through the development of their bid for the Project, and worked with DTP and the project sponsor, the Regional Transportation District (Colorado), to structure, optimize and execute the related debt financing post-award. Barclays served as bookrunning senior manager on the tax-exempt private activity bond (“PABs”) offering for the project.
• The project is being developed by DTP under a 34-year
DBFOM concession agreement in exchange for certain construction progress payments and availability payments from RTD. The District will retain responsibility for setting and collecting all fares related to the Project, and will compensate the concessionaire through monthly payments linked to the availability and performance of the Project components. A portion of these payments will benefit from a direct lien on dedicated voter-approved RTD FasTracks sales tax revenues, while the balance will be subject to annual appropriation by RTD.
• The transaction financed a major component of the Regional Transportation District
(RTD)’s larger FasTracks Plan to build a safe, reliable regional transit system and includes development of 35 miles of new commuter rail lines. The project encompasses a route between Denver International Airport and Denver Union Station (DUS), a commuter rail maintenance facility, and implementation of interconnection infrastructure and upgrades at DUS.
• The final capital structure included $397 million in tax-exempt PABs rated Baa3/NR/BBB-,
$54 million in private equity, and $1.18 billion of public investment and proceeds of a TIFIA loan. This landmark financing was the first transit public-private partnership in the United Sates, the first project in the FTA’s Public-Private Partnership Pilot Program (“Penta-P”) to reach financial close and the first transit project to utilize SAFETEA-LU authorized surface transportation tax-exempt private activity bonds as a source of funding.
Barclays’ California Regional Rail Experience:
• Barclays is deeply engaged in the transportation finance sector throughout California, particularly with regional rail authorities that have been beneficiaries of Prop 1A funding. These agencies will be partners with the Authority’s statewide modernization, connectivity and bookend program, including Caltrain/Peninsula Corridor Joint Powers Board, the Orange County Transportation Authority, the Los Angeles County Metropolitan Transportation Commission, Santa Clara Valley Transportation Authority, Sacramento Transportation Authority, and Metrolink JPA members including the San Diego County

Response to CHSRA RFEI HSR#15-02
Page 6 of 23 September 28, 2015
Regional Transportation Commission, San Bernardino County Transportation Commission and the Riverside County Transportation Commission (See Figure 3 below).
Figure 3: Leadership in California Rail Connectivity Financings
Barclays is a Leading Underwriter for the State of California.
Barclays has been one of the leading underwriters for bonds issued by the State of California and its agencies during the past fifteen years, supporting the State with our balance sheet when necessary. We offered the State more than $1 billion in support for the State’s cash flow needs in 2011 and took over $125 million of securities into inventory to support a $1.8 billion General Obligation Bond offering we co-led in 2012. In recognition of our banking skill, the State has frequently chosen Barclays to manage its most complex financings. In addition to serving as senior manager for over $18 billion of Economic Recovery Bonds (ERBs) issued between 2003 and 2011 (described in greater detail below), Barclays introduced the University of California’s General Revenue Bond and Academic Medical Center credits in a series of transactions beginning in 2004, including a $2.3 billion restructuring of all of the lease revenue bond debt issued on behalf of the University by the State Public Works Board in 2013. In 2015 alone, Barclays co-led a $1.9 billion refinancing of the Golden State Tobacco Corporation’s asset backed bonds secured by the State’s share of Tobacco Settlement Revenues, and a $2.8 billion issue for UC, including a $500 million taxable “Century” bond that matures in 2115.

Response to CHSRA RFEI HSR#15-02
Page 7 of 23 September 28, 2015
Figure 2: Barclays’ Commitment to Serving the State of California
Designing a New Credit for the State of California: Case Study
$18 Billion State of California Economic Recovery Bonds (all as Bookrunning Senior Manager)
$10,896,080,000 Series 2004ABC $3,435,615,000 Refunding Series 2009AB $3,179,260,000 Series 2008AB $438,635,000 Refunding Series 2011
• In 2003, California voters approved the use of a special sales tax to back a new bond program to refinance the State’s multi-billion dollar budget deficit. The team at Barclays is proud to have served as senior managing underwriter for all $18 billion of Economic Recovery Bonds (“ERBs”) since the inception of the program in 2004. The State’s $10.9 billion inaugural sale of Series 2004AB ERBs was at the time the largest single offering of long-term, tax-exempt bonds ever sold. The bonds were secured by a new ¼ of 1% statewide sales and use tax and constituted the first issuance of statewide sales tax bonds in California. Barclays designed and implemented an effective strategy to convince the rating agencies and investors to view the ERBs as a superior credit to the State’s general obligation bond. In the process we conducted an in-depth analysis of the stability of the sales tax, performed numerous stress scenarios, and provided extensive follow-up to the rating agencies. As a result, the agencies became comfortable with an annually ascending debt service structure and absence of a traditional debt service reserve fund. The ERBs received ratings of Aa3/AA-/A+, significantly higher than the State's general obligation ratings of Baa1/BBB/BBB.

Response to CHSRA RFEI HSR#15-02
Page 8 of 23 September 28, 2015
Barclays’ California High-Speed Rail Authority Coverage Team
• Barclays’ California-based coverage of the Authority is led from our San Francisco office by Western Region Group Head Tony Hughes, Managing Director. Michael Gomez, Director, leads and manages the Firm’s relationship with the State of California via the Office of the State Treasurer. Rob Hillman, Director, specializes in the introduction of new credits to the market and has pioneered new credit issues for the State including the structures for the $18 billion Economic Recovery Bond program and his recent work on the Enhanced Transportation G.O. Bond structure. John McCray-Goldsmith, Director, leads the Firm’s Western Region Transportation Infrastructure Finance Practice and has led debt financings for most of the Authority’s regional rail connectivity partners. Michael Fleishman, Director has led our banking efforts on multi-billion dollar enterprise financings around the State.
• Theodore Roosevelt IV, Managing Director, is Chairman of Barclays’ Clean Tech Initiative
and chaired the Pew Center on Global Climate Change’s work on the cap-and-trade mechanism which was shared with CARB during the scoping process for the California program. Steven Berkenfeld, Managing Director, co-heads the Barclays Clean Tech Initiative and leads the Firm’s banking effort for Emerging Industrial Technology companies. Chris Brooks, Managing Director, is based in London and is Head of Global Transportation and Logistics. Chris has served as banker to bid teams and to the UK government on two restructurings of HS1. Steve Howard, Director, leads the Firm’s P3 effort for public sector entities in the US, led the first US rail transit P3 financing for the $1.6 billion Denver FasTracks Eagle P3 Light Rail Project in 2010 and is currently supporting a bid team for the Maryland Transit Administration’s Purple Line project. Notable transactions include: $1.1 billion Port of Miami Tunnel Project (the first availability payment-based structure in the US) $296 million Next Generation Kentucky Information Highway Project (the first broadband P3 project in the US) and $734 million Carlsbad Desalination Plant Project-the largest water P3 financing in the US.
1. Given the delivery approach and available funding sources, do you foresee any issues with raising the necessary financing to fund the IOS-South project scope? IOS-North project scope? Both? What are the limiting factors to the amount of financing that could be raised?
11.7 Funding and Financing Questions
2. What changes, if any, would you recommend be made to the existing funding sources?
What impact would these changes have on raising financing? 3. Given the delivery approach and available funding sources, is an availability payment
mechanism appropriate? Could financing be raised based on future revenue and ridership (i.e., a revenue concession)? Would a revenue concession delivery strategy better achieve the Authority’s objectives?

Response to CHSRA RFEI HSR#15-02
Page 9 of 23 September 28, 2015
Summary of Barclays’ Position:
The Authority’s share of cap-and-trade revenues can be leveraged to meet a $10-12 billion funding gap for an IOS. We discuss some of the legal, legislative and financing strategies that the Authority would employ to reach the goal of a stand-alone cap-and-trade financing. This determination is based on our belief that the political momentum is in place to assure the extension of the cap and trade program in law beyond 2020 and through 2050, and that the volume and volatility of the future revenue stream will support long-term financings. No long-term stand-alone cap-and-trade financing is possible until four threshold issues are resolved:
• CARB and CHSRA must prevail against pending legal challenges to the cap-and-trade auctions and to the use of GGRF revenues for the high-speed rail project,
• The Authority must create the “plumbing” in law to support borrowing against GGRF revenues
• The Legislature and CARB, respectively, must extend the cap-and-trade program in law and regulation beyond 2020
• The Legislature must protect the 25% of GGRF revenue flowing to the Authority from future impairment by the Legislature as long as financing obligations are outstanding
If these threshold issues are resolved, we conclude that the Authority will have the ability to finance the project with cap-and-trade revenues based on our own view that:
• Cap-and-trade program threshold issues will likely be resolved by August of 2017 • Cap and trade will continue to 2050 • Cap-and-trade revenues through 2030 will be stable and substantial • The market will come to accept ten-year cap-and-trade renewal cycle risk We address financing capacity constraints and offer an approach that would increase the Authority’s ability to leverage its cap-and-trade revenues:
• Ten-year planning and regulatory cycles governing cap and trade • Changes to auction revenue drivers that are made in the decennial regulatory process • Potential revenue volatility inherent in the cap-and-trade auction process itself • Investor debt service coverage requirements • Future market conditions • A revenue floor and priority of payment from the GGRF would strengthen the credit quality
of payments to concessionaires and lenders and greatly boost borrowing capacity
Response to CHSRA RFEI HSR#15-02
Page 10 of 23 September 28, 2015
Project Funding Requirements
The Authority’s proposed delivery approach for the IOS scope is a single contract financed on an availability payment mechanism. Capital costs, net of milestone payments paid from the remaining uncommitted $4.2 billion of Prop 1A General Obligation bond proceeds, would be raised by the concessionaire and secured by availability payments made from the Authority’s cap and trade revenues. Taking into account committed and uncommitted funding in hand from ARRA, Prop 1A, and cap and trade funds, the funding gap for completion of the IOS South, for example, as provided in the 2014 business plan and reconfirmed in the March, 2015 SB 1029 report to the Legislature, is on the order of $16 billion. That funding gap is based on engineers’ estimates and could be reduced by an estimated 25% ($4 billion) through competition among bidders for the construction contracts, scope management, risk transfer, and design and phasing decisions (forfeiting station builds, running fewer trains, etc.). For the sake of discussion here, we discuss a plan to generate cap-and-trade proceeds in the range of $10 billion to build an IOS. Cap-and-Trade Basics: Mechanics of the Program that Drive the Revenue Stream
The cap-and-trade revenue stream that will be presented to concessionaires and investors is the product of an auction process under parameters that have been under development at least since 2005. California's implementation of a cap and trade program to reduce greenhouse gas emissions economy-wide started with a 2005 executive order by Governor Schwarzenegger setting a 2050 target for greenhouse gas emissions at 80% of 1990 emission levels. Assembly Bill 32—the California Global Warming Solutions Act—was passed the following year. The California system follows earlier efforts in other jurisdictions to implement cap-and-trade programs, including the European Union Emissions Trading System (EU ETS), the nine-state Regional Greenhouse Gas Initiative (RGGI) in the northeastern US, and similar national and regional mechanisms around the world. AB 32 authorized creation of a cap-and trade system and delegated authority to the California Air Resources Board (CARB) to promulgate regulations and to run the system. Phase-in of the program began with the first auction of emissions allowances sold on November 14, 2012. In Appendix 3, we offer a short discussion of the auction market design to provide context for some of our later references to the impact on the Authority’s financings of the cap-and-trade program design, and potential forthcoming changes to that design. Proceeds from the allowances sold by the state are on track to generate about $2.5 billion this year for the GGRF. The last two quarterly auctions have each generated about $625m. In Appendix 4, we provide our own review of the auction history and projections of auction revenues through the end of FY 2016. The current cap-and-trade regulations run through 2020. New regulations and parameters for the 2021-2030 period, including quantifying the 2030 cap, the slope of the glide path to 2030, and the number of free allowances to be allocated to covered entities, will be written and

Response to CHSRA RFEI HSR#15-02
Page 11 of 23 September 28, 2015
implemented before August of 2017, the date of the first auction in the final compliance period (2018-2020). Four Threshold Issues Must be Resolved on the Way to Executing a Stand-Alone Cap and Trade Financing.
Lenders and concessionaires receiving cap and trade revenues will be concerned about the following threshold issues which must be resolved before a stand-alone cap-and-trade revenue financing of any size can take place: • CARB and the Authority must successfully defend against pending litigation challenging the
legality of the cap and trade program and the legality of using GGRF revenues to build the high-speed rail system,
• The Authority, in cooperation with the Legislature, must establish legal authority and mechanics in law to pledge cap and trade revenues to concessionaires and to issue debt,
• The Legislature must enable the extension of the cap-and-trade program beyond the current end-date of 2020 established in AB 32, and
• The Legislature must provide in law that it will not impair the 25% allocation of cap-and-trade revenues assigned to the Authority in SB 862 through the life of a long-term financing secured by those revenues.
Barclays sees a path ahead for resolving all these issues. Under the Authority’s proposed delivery approach, an initial cap-and-trade financing would not take place until 2018 or 2019 at the earliest (following the ROD for the IOS and procurement of a concessionaire). This target date provides time for resolution of the legislative and regulatory issues surrounding a cap-and-trade financing discussed below by the summer of 2017, before financing proceeds are required by the project. Issue #1: Litigation Threatens Cap and Trade and the Use of GGRF Funds by CHSRA
Two pending lawsuits compromise the cap-and-trade revenue stream that the Authority would use to finance the high-speed rail project. Broadly, these suits in state courts challenge the authority of State entities to: i) run a cap-and-trade program, ii) sell emission allowances in the cap-and-trade program’s auctions, and iii) use auction revenues for the high-speed rail project. Two lawsuits will either have to be resolved or mitigated before a stand-alone financing could reasonably proceed: Morning Star Packing: This litigation against CARB, which consolidates 2013 challenges
to the cap-and-trade program from the California Chamber of Commerce and the National Association of Manufacturers, is currently in the briefing process before the State of California Third Appellate District Court of Appeal. The plaintiffs argue that auction revenues in the Greenhouse Gas Reduction Fund amount to a tax under Proposition 13, that auctions and reserve sales of allowances are not authorized by AB 32, and that statutes enacted after 2012 that provide for disposition of auction proceeds are invalid

Response to CHSRA RFEI HSR#15-02
Page 12 of 23 September 28, 2015
since they were not passed by two-thirds supermajority vote mandated by Prop 26 in 2010.
The Transportation Solutions Defense and Education Fund (TANSDEF) has been
challenging the high-speed rail project in the courts since 2008, first with its opposition to the Pacheco Pass route. TRANSDEF is now litigating an action filed in 2014 with the Superior Court for the County of Fresno against CARB and CHSRA asking the court to invalidate and declare improper and illegal “any and all actions taken by the California Legislature to fund the HSR Project with funds in the Greenhouse Gas Reduction Fund, and specifically any legislative appropriation for the HSR project made in reliance upon the inclusion of the HSR project in the [First Update to CARB’s Climate Change Scoping Plan].” TRANSDEF argues that the EIR for the project underestimates construction impacts, in part by ignoring greenhouse gasses produced in the cement manufacturing process required for construction of the project, and that CARB has erred in including the project in its scoping plan under AB32. The case was recently moved to the Sacramento Superior Court and an initial hearing date has not yet been set.
Issue #2: Create a Financing Vehicle in Law to Support GGRF Borrowing
To the extent the Authority seeks to create capacity to make availability payments over the long term or to directly issue cap-and-trade debt obligations, the Authority’s existing authority to issue debt “secured by pledges of state funds, federal grants, or project revenues” outlined in PUC Section 185036 is a bare-bones authorization which needs to be fleshed out to enumerate, for example, which bond law can be used for issuance, authority to pledge GGRF funds payable to the Authority pursuant to SB 862, authority to issue under an indenture or resolution, agent of sale, permissible final maturity, preconditions to issuance, authorization steps, duty and charge to collect revenue, etc. Issue #3: Absence of Clear Legislative Authority to Extend Cap and Trade Beyond 2020
We continue to conclude that there is presently no clear legislative authority for CARB to run a cap-and-trade program beyond 2020. AB 32 defines the “Statewide greenhouse gas emissions limit” as the 2020 limit determined by CARB (section 38505 (n)). This limit stays in effect beyond 2020 unless amended or repealed (sections 38551 (a) and (b)), but Section 38562 (c) provides that a market-based mechanism (cap-and-trade) can only be “applicable” from January 1, 2012 to January 31, 2020. That reading is reinforced by recent sympathetic legislative action—AB 1288 (as introduced) was going to strike the 12/31/2020 limit on applicability of a market-based mechanism in 38562 (c), but the bill was entirely rewritten to add two members to CARB appointed by the legislature and dropped the cap-and-trade language. SB 32 as introduced would have set emission limits in law for 2030 and 2050, reinforcing the existing executive orders from 2005 and 2015 with the same targets; but the bill was withdrawn at the end of the session. Legislative attempts to both provide CARB the authority to run the cap-and-trade

Response to CHSRA RFEI HSR#15-02
Page 13 of 23 September 28, 2015
program indefinitely and to set intermediate targets for 2030 and 2050 were introduced and then either modified or withdrawn this year. AB 32 may be interpreted to permit CARB to proceed with a cap-and-trade program beyond 2020 without any further legislative action, but we believe a failure by the Legislature to clearly provide for an extension in law would detract from the Authority’s ability to leverage long-term commitments of the revenue stream. Setting 2030 and 2050 Emission Reduction Targets in Law is an Essential Legislative Pre-Condition to a Long-Term Cap-and-Trade Financing
A key component to a functioning cap and trade system is the declining cap, which should have the effect of driving up the price of allowances and incentivize the development of alternatives. The only cap currently established in law is the 2020 target of reducing emissions to 1990 levels established by AB 32, quantified by CARB as 334.2 million metric tons of emissions by covered entities in 2020. Targets for 2030 and 2050 have been established by Executive Order, but have not been passed by the Legislature and established in law. As we note above, the current legal authority for cap-and-trade under section 38562 (c) of AB 32 appears to expire in 2020. Litigation is currently underway in the California Supreme Court challenging the authority of Governor Schwarzenegger’s executive order which set the 2050 greenhouse gas emissions target as non-binding in law for SANDAG’s programmatic EIR for CEQA purposes (Cleveland National Forest Foundation / Sierra Club v SANDAG). It would be far better from an investor perspective to have the targets established by the Legislature through the expected final maturity date of a long-term borrowing to support the project vs. CARB relying for authority on executive orders. Senator Pavley’s SB 32 as amended when it was withdrawn on September 10 would set in law a 2030 target of 40% below 1990 levels (reinforcing Governor Brown’s executive order which set the same target). The bill was withdrawn in the final days of the legislative session after winning approval in the Senate and passing the Assembly Natural Resources and Appropriations committees. SB 32 will be taken up again in January as a two-year bill where it left off at the end of this year’s session.
Issue #4. Legislative Commitment to Provide a Minimum of 25% of Cap and Trade Revenues to the Authority as Long as Debt is Outstanding is an Essential Component of the Security Package to Lenders.
Potential investors and concessionaires will be concerned that the 25% allocation of GGRF funds to the Authority put into law in 2014 with the passage of SB 862 is subject to change at any time by the Legislature. Indeed, the first bill introduced in the Senate during the special legislative session on transportation funding called by Governor Brown was SBX1 2 (Huff) which would strip GGRF funding going to CHSRA and redirect it to road repairs.

Response to CHSRA RFEI HSR#15-02
Page 14 of 23 September 28, 2015
Putting contract and bondholder protections into state law to guarantee revenue or coverage levels while debt is outstanding is a common practice. For example, Barclays was engaged as Senior Managing Underwriter by the State to create a new low-cost financing mechanism to borrow directly against highway weight fees paid by trucks and currently used to reimburse the state’s General Fund for transportation-related, General Obligation bond debt service. As part of that process, state law was amended in 2013 with a covenant guaranteeing that weight fees would be transferred to the debt service fund of any enhanced weight fees bonds for the life of the financing. In the case of the SB 862 allocation of 25% to CHSRA, a similar legislative covenant would maintain a minimum allocation to the Authority of 25% of GGRF revenues and transfer those funds to the Authority as long as any debt obligations secured by those revenues are outstanding. Barclays Concludes that Once these Threshold Issues Are Addressed, a Pledge of Cap-and-Trade Revenues Will Support a Long-Term Financing Program. Conclusion #1: Cap and Trade is Well-Established and Will Continue to 2050
Like any new credit, the financeability of the cap-and-trade revenue stream will be influenced by context and perception by the market of the effectiveness, usefulness and flexibility of the program. As action on climate change ramps up nationally and globally, cap and trade is at the center of the most comprehensive efforts being taken to reduce greenhouse gas emissions. Although the California cap-and-trade program went into effect on January 1, 2012 and the first allowances were auctioned in November of 2012, the cap-and-trade mechanism used as a tool for emission reductions was first implemented in the US on the federal level in 1990 by the Bush I administration to attack the acid rain problem. The UK pilot cap-and-trade program started in 2002; the European ETS program was started in 2005, and the RGGI went into effect in 2009. China’s national carbon market is scheduled to come online in 2017, combining its seven existing provincial pilot cap-and-trade programs into a single coordinated effort. Seventeen cap-and-trade programs currently function worldwide2
.
The EPA’s new Clean Power Plan announced this August includes the use of the cap-and-trade mechanism for all states as a compliance option for meeting their 2030 emission reduction targets. Cap and trade is not a novel mechanism that is still undergoing a test phase, but an established mechanism with clear advantages, a track record and a growth trajectory. California’s program is also linked internationally with Quebec, and is in the process of linking auctions with the province of Ontario next year (which will bring 80% of Canadian emissions into the cap-and-trade program). A statewide ballot initiative in 2010 to repeal AB 32 as a jobs killer in the depths of the recession (Prop 23) failed with a vote of 62% opposed. Current
2 Emissions Trading Worldwide: ICAP Status Report 2015

Response to CHSRA RFEI HSR#15-02
Page 15 of 23 September 28, 2015
political debate in California is focused on the depth of future greenhouse gas cuts, but accepts cap and trade as a permanent policy mechanism. We don’t see it being rolled back. Conclusion #2: The Upcoming AB 32 Scoping Plan Renewal and Cap-and-Trade Program Revisions for 2030 Will Set the Stage for Continued Revenues of at Least $500m a Year for the Authority
On October 1, CARB begins the formal processes for updating the AB 32 Scoping Plan and amending the cap-and-trade program regulations to take into account the Governor’s executive order setting a target of 2030 emissions at 40% of 1990 levels. Both the Scoping Plan and the 2030 cap are prerequisites for a post-2020 program. Though many modifications to the cap-and-trade rules and parameters will be made, we conclude that these changes will be around the margins and will not have dramatic effects on the main revenue drivers. We expect to continue to see full subscription of state-owned allowances offered at auction at the floor price or higher. In the following table, we address each of the program areas subject to change in the upcoming regulatory process and Barclays’ view of its impact on financeability:
[The remainder of this page is intentionally left blank.]

Response to CH
SRA RFEI H
SR#15-02
Page 16 of 23
Requested by September 28, 2015
Potential Regulatory Change Expected Im
pact on Cap-and-Trade Revenues and Financing Prospects
Setting the post-2020 cap (expressed in m
illions of metric tons
of CO2 equivalent em
issions)
Deeper G
HG
cuts will reduce the num
ber of allowances available m
ore quickly and push allow
ance prices higher. The net effect on revenue may be neutral.
Expanding or narrowing the
definition of entities subject to the cap
We expect the program
scope to remain unchanged, i.e. no changes in basic ground rules
defining what entities are subject to the cap.
Modifying the offset program
Offsets w
ill be easier to obtain, which w
ill have a downw
ard effect on prices, but will have little
impact on revenues as offsets are lim
ited to 8% of com
pliance requirements. Liberalizing the 8%
lim
it would put further dow
nward pressure on prices. Expanded offset options w
ill expand the num
ber of parties with an econom
ic interest in maintaining the program
going forward.
Procedures for linking auctions with
other cap-and-trade programs
Ontario w
ill come online and additional linkages w
ith other US states that may be driven by the
EPA’s Clean Pow
er Plan will increase m
arket efficiency and may exert dow
nward pressure on
allowance prices. M
ore linkages will increase entrenchm
ent of the program and m
ake program
renewals m
ore likely. As linkanges increase, “leakage” m
ay be less likely, resulting in fewer free
allowances allotted to industrial entities.
Revisions to cap and trade to help California com
ply with the new
US EPA
111(d) (Clean Power Plan) rule
Using cap and trade to comply w
ith the Clean Power Plan adds to institutional m
omentum
of the program
going forward by tying it to federal energy policy.
Am
endments to the auction cost-
containment reserve and m
arket oversight provisions
Academ
ics have identified potential flaws in the m
arket design which w
ould manifest during
demand spikes. Potential solutions including changing holding lim
its, allowing greater flexibility
in use of allowances already held, increasing auction frequency, and strengthening upper lim
its on prices (including setting a hard ceiling price). These changes are intended to increase m
arket efficiency and low
er compliance costs and w
ould put downw
ard pressure on prices.
Revising the allocation of free em
issions allowances to covered
entities
Reducing the number of allow
ances allocated for free and increasing the number of allow
ances sold by the State w
ould increase revenues and have little to no effect on prices (see discussion below
). We expect only m
arginal changes to the number of free allow
ances offered through 2030.

Response to CHSRA RFEI HSR#15-02
Page 17 of 23 September 28, 2015
Most Allowances Are Currently Allocated by CARB for Free. Will There be Fewer Free Allowances Allocated After 2020, and Significantly Higher Auction Revenues? The supply of allowances to be auctioned by the State between now and 2020 is essentially fixed and can be calculated based on publicly available information including the 2020 cap, annual emission histories of the covered entities, the leakage table in the cap-and-trade regulations, and efficiency factors for covered entities in the industrial sector. The volume of allowances that will be auctioned by CARB equals the annual cap minus the number of free allowances provided to covered entities minus the number of allowances held in the cost containment reserve. CARB currently provides about half of all allowances to covered entities under the cap for free and only auctions the remainder. If CARB were to begin providing fewer free allowances and selling more allowances at auction, program revenues would rise (to the extent the 5% minimum annual floor price increase offsets the annual rate of decrease in the cap). Based on the dynamics of the allocation of free allowances across the three sectors of covered entities discussed below, we don’t anticipate a dramatic rise in the number of State-owned allowances going into the auctions between now and 2030: • The motor fuel sector, which is the largest sector under the cap, receives no free
allowances currently, and we don’t foresee a change to that policy, which passes the cost of carbon through to fuel consumers.
• The regulated investor owned utilities sector receives almost its entire allowance
requirement for free, must auction those allowances and return the proceeds to ratepayers, and in addition must purchase allowances to meet compliance requirements. There is a social equity dimension to this program design which we believe will stay in place through 2030.
• The industrial sector, which accounts for less than a third of all emissions, receives most of
its allowances for free currently, and is the only sector subject to reduction in the number of free allowances in the 2020-2030 regulations. The number of free allowances will be adjusted based on a new “leakage study” which is currently underway. The leakage study will evaluate the likelihood of emitters leaving California to produce in non-regulated states. Emitters with a high likelihood of pulling up stakes and moving are provided more free allowances; those deemed less subject to departure may have the amount of free allowances reduced. Even a dramatic reduction in the number of free allowances going to the industrial sector, which we see as unlikely, would result in a relatively small overall increase in the total number of State-owned allowances to be sold.
Overall, we expect little change in the supply of State owned allowances sold at auction (except for the gradual annual lowering of the cap). Even if the auction-clearing prices

Response to CHSRA RFEI HSR#15-02
Page 18 of 23 September 28, 2015
continue to hug the (escalating) mandatory floor price, we believe the Authority’s expectation of receiving a minimum of $500m a year from the program is reasonable. Continuing economic recovery and growth in the covered sector could drive allowance prices up, as could the formal extension of the program to 2030. Because covered entities can “bank” allowances—i.e. hold them indefinitely beyond the first compliance period when they can be used—a ten-year extension of the program would make banked allowances usable for an extended period and increase their value. The summer of 2017 is the practical deadline for CARB to obtain legislative authority for extending cap and trade beyond 2020, quantifying a 2030 cap, and defining program parameters through 2030. Any amendments to existing rules and steps to extend the program beyond 2020 should be in place before the August, 2017 auction, which immediately precedes the beginning of the third cap-and-trade compliance period (2018-2020). Because each quarterly auction includes both “current vintage” allowances, which can be used for emissions in the current compliance period, and an “advance auction” of “future vintage” allowances which can only be used beginning in the subsequent compliance period, 2017 is a practical deadline for extending the program beyond 2020 so that market participants in the August 2017 auction can buy current vintage allowances for the third compliance period (2018-2020), and future vintage allowances for the fourth compliance period (2021-202?). Conclusion #3: The Market Will Come to Accept the Ten-Year Cap-and-Trade Renewal Cycle Risk
Cap-and-trade revenues are a “passive revenue stream” in financing terms, driven by environmental policy, not by a rate covenant. In this way, a cap and trade financing is more like a financing secured by federal highway grant revenues, tobacco litigation settlement payments or excise tax revenues, where revenues are the outcome of a process unrelated to the financing. The State and the Authority do not have the ability to maintain or increase cap-and-trade revenues to match debt service requirements (a “rate covenant”); the revenues are a product of a process designed to lower greenhouse gas emissions. There are ample precedents for the market lending against passive revenue streams for shorter or longer terms, with longer final maturities becoming possible as the market understanding of the political and economic drivers of the revenue streams matures. The GARVEE bond market, for example, will go out as long as 18 years on the expectation that the economy is dependent enough on highway infrastructure and the FHWA revenue stream that the necessary legislative action will be taken over multiple reauthorization cycles to continue the program regardless of political issues. We believe a similar narrative can and will be crafted for cap-and-trade based on a growing dependence of various state programs on GGRF revenues, perception of increasing impacts of climate change and consensus on climate science, and the spread of cap-and-trade as a known mechanism for achieving GHG reduction mandates.

Response to CHSRA RFEI HSR#15-02
Page 19 of 23 September 28, 2015
Addressing Cap-and-Trade Financing Capacity Constraints
Based on our conclusion above that the Authority may reasonably expect to receive a minimum of $500m of cap-and-trade revenues through 2030 once the four threshold issues are resolved, the Authority could theoretically maximize its financing capacity by dedicating 100% of those funds to debt service in a financing with 1.0x debt service coverage. Assuming a borrowing cost of 4% to 6% and a standard reserve requirement, the most that could be generated from such a financing would be $3.9 to $4.6 billion, short of the funding gap for an IOS. In this section we discuss approaches to extending final maturities beyond 2030, increasing leveragability and improving credit quality, all of which would expand financing capacity. Capacity Constraint #1: Ten-Year Planning and Regulatory Cycles Governing Cap-and-Trade May Limit Final Maturities and Raise Borrowing Costs for Longer Financings.
Even if the threshold litigation and legislative authority issues are resolved, and if the 2021-2030 regulation is configured in a way to assure high revenue generation, we expect those changes only to apply for a ten-year period. We expect important revisions to the regulations governing California’s cap-and trade-program to be made every ten years, for several reasons. Parameters of California’s cap and trade program are determined in the global context of the UN Framework Convention on Climate Change (UNFCCC) adopted in Rio de Janeiro in 1992, well before both Governor Schwarzenneger’s 2005 executive order establishing a 2050 target of reducing greenhouse gas emissions in California to 80% of 1990 levels, and before the passage of AB 32 in 2006. The 195 governments that have ratified the UNFCCC are meeting in Paris in December of this year in their 21st Conference of the Parties (COP 21) in an attempt to come to an agreement on deeper emissions cuts and an enforcement mechanism driven by increasing certainty in the scientific community that aggressive action on emissions is required to mitigate increasing damage from anthropogenic climate change.3
Several recent policy moves, including Governor Brown’s April 29, 2015 Executive Order B-30-15 setting a 2030 emissions target of 40% below 1990 levels, the passage of SB 350 earlier this month, and attempts to codify 2030 and 2050 emission reduction targets in law (SB 32) and to modify AB 32 to extend the use of cap and trade beyond 2020 (AB 1288), were all driven in part by the desire to take a leadership position at COP 21 with aggressive action on climate change.
The UNFCCC targets greenhouse gas reductions in ten-year increments, beginning with an initial target set in 1994 for some countries to reduce emissions to 1990 levels by 2000. These decennial targets provide industry with known timeframes and market certainty for planning and unlocking clean energy investments, particularly industries covered by the 17 local, regional, national and international cap and trade programs currently in operation globally. The RGGI has established a 2020 cap and is considering extending the program to 2030. The EU Emissions Trading System currently operates under rules in place through 2020 and has
3 See Intergovernmental Panel on Climate Change, Fifth Assessment Report, 2014 https://www.ipcc.ch/report/ar5/

Response to CHSRA RFEI HSR#15-02
Page 20 of 23 September 28, 2015
adopted a target of achieving emission reductions of 40% below 1990 levels by 2030. This is, not coincidentally, the same target Governor Brown set in his executive order. 2030 is also a key compliance date in the EPA’s Clean Power Plan finalized on August 3, 2015 (again looking ahead to COP 21 in December), which requires GHG emission cuts of 32% by 2030, and permits states to create or join cap-and-trade programs in order to comply with that 2030 target. While we believe investors will become comfortable with a ten-year renewal cycle, our experience with similar credits is that it may take time for a sense of inevitability of the program extensions to permeate the market, and the inherent uncertainty related to each renewal will require higher coverage requirements to enable extension of the final maturity of a cap-and-trade financing beyond 2030. Capacity Constraint #2. Investors will Demand a Revenue Coverage Cushion to Mitigate Uncertainties Inherent in the Cap-and-Trade Market Itself and the Decennial Renewal Cycle.
Debt capacity will be expanded or diminished in proportion to the debt service coverage provided to lenders in the bond structure. If the Authority receives $500m a year from the GGRF and then either the Authority or a concessionaire issues debt with 1.5x coverage of revenues over debt service, capacity for a borrowing through 2030 issued in 2018 would be roughly $2.6 billion4
. If the coverage cushion could instead be created by pledging revenues for repayment over and above the $500m going to the Authority—for example, from some or all of the remaining 75% of GGRF revenues allocated to other projects and programs under SB 862—the 25% of GGRF revenues reaching the Authority could be more fully leveraged.
A Revenue Floor and First Priority Distribution of Revenues to the Authority from the GGRF vs. the Current Receipt of a Fixed Percentage of GGRF Revenues would Have a Powerful Affect on Borrowing Capacity.
Assuming total GGRF revenues will be a minimum of $2 billion annually going forward (vs. expected revenues this fiscal year of about $2.5 billion), a modification of the SB 862 formula which guaranteed the Authority the greater of: i) a fixed revenue amount (a “floor”) of say $500m, or ii) 25% of annual GGRF revenues, and which further directed that all GGRF revenues be paid to the Authority before any revenues are allocated to other recipients, would greatly boost the Authority’s borrowing capacity against essentially the same revenue stream it currently receives. In effect, other GGRF recipients would be backstopping and protecting the high-speed rail project (and its investors) by potentially giving up revenue in a year with an overall GGRF revenue downturn below $2 bn to ensure lenders are repaid. Investors or concessionaires, on the other hand, would enjoy up to a four times coverage ratio from expected revenues on a fully leveraged financing of the Authority’s 25% share of revenues if 100% of GGRF revenues were directed to funding the Authority’s $500m revenue floor.
4 Assumptions: Issue Dated: 12/1/18, Interest Rate: 5.00% , Due: 1/1/31

Response to CHSRA RFEI HSR#15-02
Page 21 of 23 September 28, 2015
A scaled-back version of this approach would be to use the currently un-allocated 40% of GGRF revenues for this purpose, under an arrangement where the Authority would receive the greater of i) 65% of GGRF revenues each year until it has accumulated $500m, or ii) 25% of GGRF revenues. Once the Authority receives its “floor revenue amount”, payouts from the GGRF would begin to the other recipients of the currently undesignated 40%. At year-end, if total GGRF revenues exceed $2 billion, the Authority would receive a true-up payment to keep it at 25% of total revenues for the year. If total GGRF revenues fall below $2 billion, the recipients of the 40% would end up receiving less than 40% for that year. The Authority would be able to commit all $500m of its expected payments to debt service with an effective coverage level of 2.6 times expected annual revenues (65% of GGRF would be $1.3 billion, divided by the Authority’s $500m, yielding a coverage ratio or cushion of 2.6 times). Total GGRF revenues for the year could fall from $2 billion to $700m and the Authority would still be able to make a $500m debt service or availability payment. In other words, the Authority would be able to pledge to bondholders and concessionaires 65% of GGRF revenues to cover a maximum Authority obligation of 25% of GGRF revenues. The coverage benefit and capacity improvement from this “revenue floor” approach would inure only to debt issued directly by the Authority. A concessionaire receiving a fixed schedule of availability payments from the Authority would enjoy the credit enhancement on the payments it receives, but would still have to provide debt service coverage to bondholders on debt sold by the project company building the railroad, reducing borrowing capacity. Indicative Financing Capacities Under Various Final Maturity, Revenue Coverage and Interest Rate Scenarios:
The Authority’s financing capacity from the stream of 25% of GGRF revenues will be determined by several key drivers:
1. Revenue: Annual revenue generated by the auction of state-owned allowances and available to repay lenders is an absolute constraint on financing capacity. The more revenue available and pledged to lenders, the larger the borrowing capacity.
2. Final Maturity of a Borrowing: Longer final maturities enable the Authority to commit more money to debt service and to increase borrowing amounts. The final maturity for a cap-and-trade financing will be a function of how many ten-year regulatory cycles investors will be comfortable spanning and will be related to the debt service coverage level on a financing.
3. Debt Service Coverage: Lenders will require a financing structure that provides a pledged revenue cushion over and above the annual debt service payment due from the Authority to protect investors from fluctuations in the GGRF revenue stream over time. The higher the debt service coverage ratio in a financing structure (annual pledged revenues divided by annual debt service), the lower the borrowing capacity. The

Response to CHSRA RFEI HSR#15-02
Page 22 of 23 September 28, 2015
coverage ratio is also generally related to the borrowing cost—the higher the coverage ratio, the lower the borrowing cost. The coverage level will also be related to the final maturity as a higher coverage level protects investors from increasing uncertainty inherent in multiple decennial program renewals.
4. Interest Rates: The Authority’s borrowing cost expressed in terms of an interest rate will reflecting general market conditions at the time of a borrowing and the degree of risk investors assign to the likelihood of being repaid by the Authority. In general, the longer the final maturity of a borrowing, the higher the interest rate.
Financing Capacity Sensitivity Analysis:
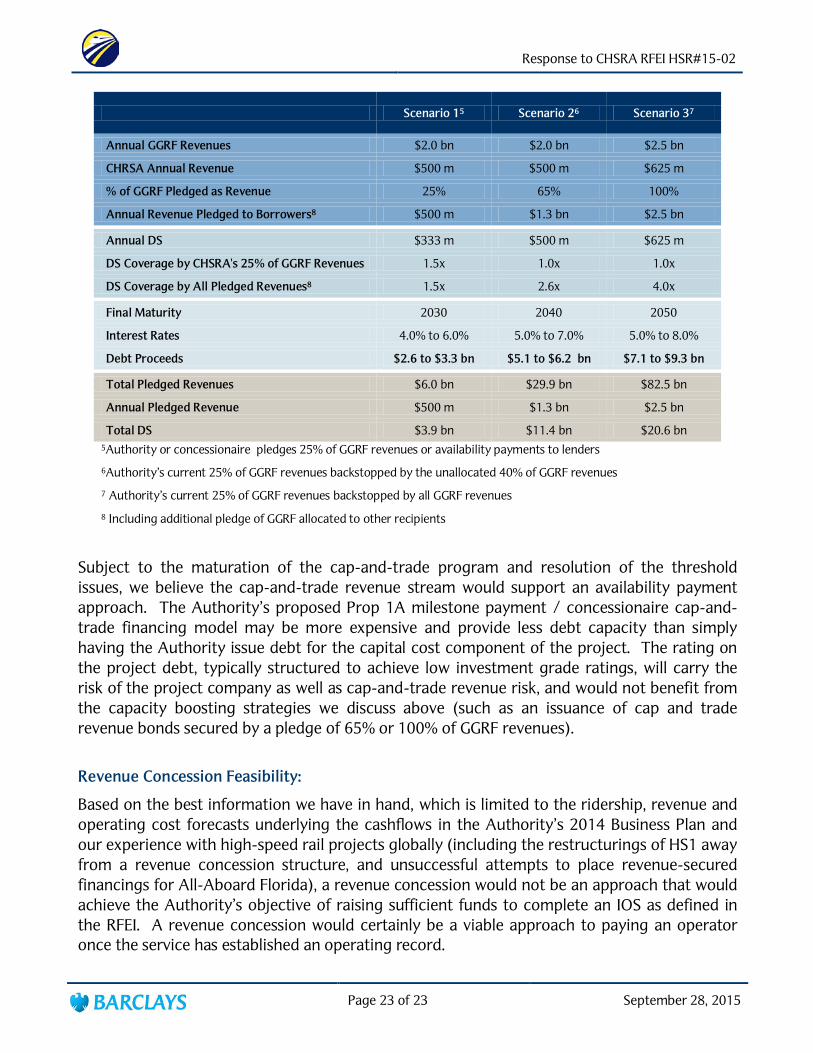
Over the next two years, these factors will come into greater focus as threshold issues are resolved. The Authority’s GGRF financing capacity could fall within a wide range depending on the outcomes of each factor. In the following table, we summarize three scenarios which we have selected to illustrate the relative impact of each factor, and potential outcomes in terms of borrowing capacity. These scenarios are by no means exhaustive of all possible outcomes, which could be lower or greater than what we’ve offered here.
We summarize several potential outcomes of the financing capacity of the Authority’s cap-and-trade revenue stream in the following table. For each of the three scenarios we offer a range of potential interest rate costs more as an illustration of the sensitivity of borrowing capacity to changes in market environments than as a projection of what those rates would actually be.
• Scenario One assumes a financing with revenues pledged through 2030, annual revenues of $500m a year reflecting total annual GGRF revenues of $2 billion, and a coverage ratio of 1.5x, so only $333m a year is spent on debt service. This case represents a scenario where the Authority provides a modest coverage level to investors and is only able to borrow through the next ten-year cap-and-trade cycle.
• Scenario Two assumes a revenue floor is in place backed by 65% of GGRF revenues, which helps investors become comfortable taking program renewal risk in 2030 and extending the final maturity to 2040. This allows the Authority to fully leverage its $500m a year for twenty years.
• Scenario Three assumes a revenue floor is in place backed by 100% of GGRF revenues, and investors become comfortable lending through 2050. In this case we also make a more optimistic revenue assumption that the revenue floor is set at $625 million annually, which is the number we believe the Authority is on track to receive in the current fiscal year and reflects an assumption that ongoing total GGRF revenues will be $2.5 billion annually.
Response to CHSRA RFEI HSR#15-02
Page 23 of 23 September 28, 2015
Subject to the maturation of the cap-and-trade program and resolution of the threshold issues, we believe the cap-and-trade revenue stream would support an availability payment approach. The Authority’s proposed Prop 1A milestone payment / concessionaire cap-and-trade financing model may be more expensive and provide less debt capacity than simply having the Authority issue debt for the capital cost component of the project. The rating on the project debt, typically structured to achieve low investment grade ratings, will carry the risk of the project company as well as cap-and-trade revenue risk, and would not benefit from the capacity boosting strategies we discuss above (such as an issuance of cap and trade revenue bonds secured by a pledge of 65% or 100% of GGRF revenues).
Revenue Concession Feasibility:
Based on the best information we have in hand, which is limited to the ridership, revenue and operating cost forecasts underlying the cashflows in the Authority’s 2014 Business Plan and our experience with high-speed rail projects globally (including the restructurings of HS1 away from a revenue concession structure, and unsuccessful attempts to place revenue-secured financings for All-Aboard Florida), a revenue concession would not be an approach that would achieve the Authority’s objective of raising sufficient funds to complete an IOS as defined in the RFEI. A revenue concession would certainly be a viable approach to paying an operator once the service has established an operating record.
Scenario 15 Scenario 26 Scenario 37
Annual GGRF Revenues $2.0 bn $2.0 bn $2.5 bn
CHRSA Annual Revenue $500 m $500 m $625 m
% of GGRF Pledged as Revenue 25% 65% 100%
Annual Revenue Pledged to Borrowers8 $500 m $1.3 bn $2.5 bn
Annual DS $333 m $500 m $625 m
DS Coverage by CHSRA's 25% of GGRF Revenues 1.5x 1.0x 1.0x
DS Coverage by All Pledged Revenues8 1.5x 2.6x 4.0x
Final Maturity 2030 2040 2050
Interest Rates 4.0% to 6.0% 5.0% to 7.0% 5.0% to 8.0%
Debt Proceeds $2.6 to $3.3 bn $5.1 to $6.2 bn $7.1 to $9.3 bn
Total Pledged Revenues $6.0 bn $29.9 bn $82.5 bn
Annual Pledged Revenue $500 m $1.3 bn $2.5 bn
Total DS $3.9 bn $11.4 bn $20.6 bn 5Authority or concessionaire pledges 25% of GGRF revenues or availability payments to lenders
6Authority’s current 25% of GGRF revenues backstopped by the unallocated 40% of GGRF revenues
7 Authority’s current 25% of GGRF revenues backstopped by all GGRF revenues
8 Including additional pledge of GGRF allocated to other recipients

Appendix 1
BARCLAYS’ MSCI GREEN BOND INDEX

Response to CHSRA RFEI HSR#15-02
Appendix 1 September 28, 2015

Appendix 2
BARCLAYS’ CALIFORNIA HIGH SPEED RAIL AUTHORITY COVERAGE TEAM

Response to CHSRA RFEI HSR#15-02
Appendix 2 September 28, 2015
Tony Hughes, Managing Director and Western Region Manager, has been providing investment banking services to state and local governments in the western states since 1983 and has structuring expertise that includes long-term fixed rate and variable rate revenue bonds, general obligation bonds, toll revenue bonds, sales tax-backed special purpose bonds, certificates of participation, lease revenue bonds and tax and revenue anticipation notes. Since 1983, Tony has senior managed over $80 billion worth of transactions including two Institutional Investor “Deals of the Year,” three Bond Buyer “Deals of the Year” and several transactions that were the first of their kind including the first taxable municipal offering, the first foreign currency denominated municipal transaction and the first non-recourse financing for a start-up toll road.
Tony received his bachelor's degree in Mathematics from the University of California, Los Angeles and an MBA degree in Finance from the University of California, Berkeley. Prior to becoming an investment banker, Tony was a middle and high school math teacher. He currently serves as a member of the Public Finance Department’s six-member Operating Committee.
Theodore Roosevelt IV, Managing Director, is based in New York and currently serves as Chairman of the firm’s Clean Tech Initiative and is a Co-Chair of Barclays’ Military Services Network.
Mr. Roosevelt joined Barclays when it acquired the North American assets of Lehman Brothers in September 2008. He started work with Lehman in 1972 as a general banker in domestic corporate finance. In 1977, following Lehman Brothers’ merger with Kuhn Loeb, Mr. Roosevelt was assigned to the International Department and also worked in the Firm’s Government Advisory Group. He joined the Short and Medium Term Corporate Finance Department in 1982 and was appointed manager of the department in 1985. He was named a Managing Director in 1984, and, in January 1991 he was asked to focus on the development of the Firm’s international business. He was elected Chairman of the Board of Directors of Lehman Brothers Financial Products Inc. in 1994, and Chairman of the Board of Directors of Lehman Brothers Derivative Products Inc. in 1998. In February 2007, he was appointed Chairman of Lehman Brothers’

Response to CHSRA RFEI HSR#15-02
Appendix 2 September 28, 2015
Council on Climate Change.
Mr. Roosevelt received his AB from Harvard in 1965. Immediately following, he joined the Navy as an officer in Underwater Demolition Team Eleven and had two tours of duty in Vietnam. Following his active duty, he joined the Department of State as a Foreign Service Officer. In 1972, Mr. Roosevelt received his MBA from Harvard Business School.
Mr. Roosevelt is Board Chair of the Center for Climate and Energy Solutions (C2ES), Secretary of The Climate Reality Project, a member of the Governing Council of the Wilderness Society, and a Trustee for the American Museum of Natural History. He was an Advisory Committee Member on the MIT study “The Future of Natural Gas”; and the on the Advisory Committee for the Council on Foreign Relations Special Report “The Future of US Special Operations.” Currently he is a committee member for the National Academy of Sciences on Accelerating Deployment of Clean Energy Technologies. He is also a member of the Council on Foreign Relations, The Economic Club of New York, and a Governor of the Foreign Policy Association. He is Chairman Emeritus of the National League of Conservation Voters and had been and served as Trustee for Trout Unlimited and the World Resource Institute. Steven Berkenfeld, Managing Director, currently chairs the Equities Commitment Committee and the Fairness Opinion Committee, is co-head of the Firm’s Cleantech Initiative, leads the banking effort for Emerging Industrial Technology companies, and serves as a senior advisor to the Industrial Group and the M&A Group. He also is chair of the Investment Bank’s Reputational Risk Committee.
Prior to joining Barclays Capital in September 2008, Steven had spent over 21 years at Lehman Brothers. His most recent responsibilities were as (i) Chairman of the Firm’s Transaction Approval Committees for Investment Banking, including Commitment Committee, Bridge Loan Committee, Fairness Opinion Committee and Strategic Acquisition Review Committee, (ii) the Global Head of Legal, Compliance and Audit and (iii) Chief Investment Officer for Lehman Brothers’ Principal Investing activities and Chairman of the Firm’s Investment Committee.
From 2001 through 2005, Steven was Chief Investment Officer of Lehman Brothers’ Private Equity Division, with responsibilities including serving as Chairman of the Firm’s Investment Committee, reviewing and approving all potential principal investment opportunities for Lehman Brothers’ Private Equity Funds and assisting in the execution of transactions for each of the Private Equity asset classes. Earlier in his career at Lehman Brothers, Steven had responsibility for all legal matters relating to Lehman Brothers' Investment Banking and Private Equity activities, as well as many of its Fixed Income and Equities businesses.
Prior to joining Lehman Brothers in 1987, Steven was an associate at the law firm of Fried, Frank, Harris, Shriver & Jacobson engaged primarily in mergers & acquisitions and leveraged buy-outs. He holds a J.D. from Columbia Law School and a B.S. from Cornell University.
Steven is Chairman of the Board of Directors of the Sierra Club Foundation. He also is a member of the Board of Directors of Green City Force. In addition, Steven is the sponsor of the Employment Sustainability Initiative on Employment and Technology at the ILR School of Cornell University, and is actively engaged in various projects relating to the “Future Of Work.”

Response to CHSRA RFEI HSR#15-02
Appendix 2 September 28, 2015
Chris Brooks, Managing Director, based in the Firm’s Industrials Group in London is Barclays’ Head of Global Transport & Logistics. He was co-founder or the transport sector group at Rothschild, growing that business both in Europe and in Asia, becoming Global Co-Head of Transport in 2006. From 2004 to 2006, he was Rothschild’s Head of M&A for Asia. Prior to Rothschild, Chris spent 3 years at Deutsche Morgan Grenfell, and before that qualified as a Chartered Accountant with PricewaterhouseCoopers. He has over 20 years investment banking experience and has been a transport banker since 1995. Chris graduated from Leeds University with a degree in Economics and Accounting and is a Fellow of the Institute of Chartered Accountants. Stephen Howard, Director, has 30 years of experience financing a broad range of infrastructure projects for public and private clients. Steve’s non-recourse project finance experience spans all sectors, including transportation, water, and social infrastructure. His team acted as financial advisor, senior managing underwriter, and equity placement agent for the $925 million Poseidon Resources Water Desalination Plant and Pipeline project in Carlsbad, CA. In 2011, Steve led the advisory team to SANDAG on its acquisition of the Southbay Expressway (California’s State Route 125) funded by a post-bankruptcy senior debt and TIFIA loan restructuring.
Under Steve’s direction, Barclays acted as the senior bookrunner to the private concessionaire for the $1.5 billion Goethals Bridge Replacement Project connecting Staten Island and New Jersey, the $1.3 billion North Tarrant Expressway – Segment 3A-3B managed lanes project financing, the $2.1 billion Midtown Tunnel/Elizabeth River Crossing Project and the $1.6 billion Denver FasTracks Eagle P3 Light Rail Project. His other recent infrastructure advisory experience includes negotiating the TIFIA loan for the Port of Miami Tunnel Project on behalf of the private sponsors, advising a private bidder on the Texas SH-121 P3 Project, IH-635 Managed Lanes P3 Project, the $4 billion Indiana Toll Road concession and the $1.2 billion International Arrivals Terminal 4 Redevelopment Project at John F. Kennedy Airport. Steve is a graduate of the Columbia University Graduate School of Business Administration and University of New Hampshire Whittemore School of Business and Economics.
John McCray-Goldsmith, Director, is our San Francisco-based Western Region Transportation Finance practice head, and will serve as the firm’s point of contact for the Authority. John joined the firm in 1998 and brings over 17 years of financing experience with surface transportation clients. He is the leading investment banker for California’s “Self-Help Counties,” having completed negotiated senior-managed sales tax revenue bond financings for a total par amount of over $8 billion. Since 2004, he has served as senior managing underwriter, remarketing agent, swap counterparty, LOC provider, direct placement counterparty and TIFIA advisor for 13 California Self-Help county transportation authorities.
John’s experience with toll revenue bonds and TIFIA loans includes his service on the Bay Area Toll Authority’s senior manager team since 2005. In May of 2012, he led SANDAG’s $420 million Series 2012 TransNet financing which reimbursed SANDAG for the cash portion of their payment to purchase SR-125/Southbay Expressway and worked on the restructuring of the $145m TIFIA loan which had sprung to senior lien status in bankruptcy. In 2012 he advised LACMTA during negotiations of the $545 million TIFIA Crenshaw Line loan, and he served as a book-running

Response to CHSRA RFEI HSR#15-02
Appendix 2 September 28, 2015
senior manager on the restructuring of the OCTA SR-91 Express Lanes toll revenue bonds in 2013. His current senior-manager assignments include a federal grant-secured financing for Guam, a restructuring of the Alameda Corridor Transportation Authority Bonds, the Otay Mesa East International Port of Entry project financing in San Diego, the Long Beach Civic Center project financing, and co-senior manager on the Riverside County Transportation Authority’s I-15 Managed Lane Project. He senior managed the two inaugural bond sales totaling $350 million for the Sonoma Marin Area Rail Transit District (SMART) to fund construction of its initial operating segment, a financing program which won the Bond Buyer’s Western Region Deal of the Year Award in 2012. In 2014, he led the rating process for the Alameda County Transportation Commission’s $160 million financing of the BART extension to the Oakland International Airport, securing the first AAA-rating Fitch provided to a Self-Help County. John holds MBA and Master of City and Regional Planning degrees from the University of California at Berkeley, and a B.A. in Government from Cornell University.
Michael Gomez, Director, manages the firm’s general municipal business in California. He has 30 years of experience in public finance and has senior managed over $18 billion in financings for a wide variety of general government and municipal enterprise issuers. His senior managed experience in California encompasses a broad range of issuers and industry areas including the State of California, counties (Alameda, Contra Costa, Kings, Los Angeles, Madera, Riverside, Sacramento, San Mateo, San Bernardino, Stanislaus and Ventura), cities (San Jose, San Diego, South San Francisco, Fresno), education (University of California, California State Universities, San Francisco Unified School District), water/wastewater (San Jose-Santa Clara Clean Water Authority, City of San Diego, Stockton Water Supply Project) transportation (AC Transit, BART, BATA, Caltrain, Samtrans, Santa Clara VTA, SMART, Port of Oakland), and special transportation tax issuers (Contra Costa Transportation Authority, Sacramento Transportation Authority, San Bernardino County Transportation Authority), among others. He holds B.A. and MBA degrees from Stanford University. Robert Hillman, Director, has structured more than $50 billion of financings for municipal issuers across the country, and brings structuring and quantitative expertise to the Authority. Rob has spent the majority of his 16-year banking career providing structuring solutions for large, complex issuers such as the State of California (including nearly $18 billion of sales tax-backed Economic Recovery Bonds), the University of California system, the Commonwealth of Puerto Rico, Government of Guam, and the City of New York. Rob has provided debt solutions for transportation issuers including the San Francisco International Airport, the Puerto Rico Highway and Transportation Authority, the Metropolitan Washington Airports Authority, and Phoenix International Airport, among others. His expertise leading multi-billion dollar toll road financing programs includes senior manager roles on the $1.7 billion sale for the Central Texas Turnpike System this year, and $3.7 billion for the Transportation Corridor Agencies in 2013 and 2014. Rob holds a B.A. in Economics from Brandeis University and an M.S. in Mathematics from New York University. Michael Fleishman, Director, will lead the team’s analytical and quantitative efforts and provide banking support for the Commission. Michael has worked in our New York-based Debt Strategies

Response to CHSRA RFEI HSR#15-02
Appendix 2 September 28, 2015
Group, and brings seven years of experience working with transportation sector clients. From 2013 to present he has worked with the Barclays team that served as senior manager for $3.7 billion of toll revenue bonds issued by the Transportation Corridor Agencies of Orange County, CA. These landmark transactions represented the largest toll revenue transactions in the industry during this period, and completely restructured the debt portfolios for the San Joaquin Hills and Foothill/Eastern toll roads. In addition, Michael has worked with the Bay Area Toll Authority, SANDAG (on their SR-125 toll road acquisition and Transnet credits), Sonoma-Marin Area Rail Transit District, and the Riverside County Transportation Commission. These projects have included fixed and variable rate new money financings, refundings/restructurings, and commodity hedging strategies in the transportation sector. Michael holds master’s degrees from Stanford University and the Haas School of Business. Jeff Mathews, Vice President, has eight years of experience in investment banking and financial advisory for infrastructure projects, acquisitions and restructurings. Jeff brings expertise in the structuring of public-private partnerships (“P3s”) for development projects and in sell-side and buy-side M&A for infrastructure assets with particular experience in the transportation, water, and social infrastructure subsectors. His notable P3 experience includes advising and/or underwriting sponsor clients’ bids for the Goethals Bridge Replacement Project, the North Tarrant Expressway Phase II HOT Lanes Project, Midtown Tunnel P3 Project, the Presidio Parkway P3 Project, the Long Beach Courthouse P3, Bermuda Hospital P3, Port Mann & Highway 1 Project, Edmonton Ring Road, and the Golden Ears Bridge, as well as acquisitions and financings in the power and renewable sectors. Jeff is a graduate of Washington University in St. Louis. Ahmad Thomas, Vice President, brings the Authority more than a decade of experience serving public entities in California. He was previously a senior policy aide to U.S. Senator Dianne Feinstein on Capitol Hill. Ahmad is Barclays’ regional project manager, and has served as co-lead banker and credit specialist for a number of issuers including the State of California, California State Public Works Board, Sacramento Transportation Authority, San Mateo County Transit District, and the Alameda County Transportation Commission. Melinda Marino, Analyst, joined Barclays’ Western Region Public Finance team in February of 2015 after graduating from the University of Southern California with a B.S and Masters in Public Administration, concentrating in Financial Services. Melinda will provide quantitative and banking support to the Authority, and holds FINRA Series 7, Series 63 and Series 52 licenses.

Appendix 3
CAP-AND-TRADE BASICS: MECHANICS OF THE PROGRAM

Response to CHSRA RFEI HSR#15-02
Appendix 3 September 28, 2015
Cap-and-Trade Basics: Mechanics of the Program that Drives the Revenue Stream
Leading up to the first auction of emission allowances, CARB performed a statewide inventory of all greenhouse gas emissions, and then quantified an emissions cap. The cap-and-trade program creates a number of emissions allowances equal to the cap, both measured in metric tons of CO2 equivalent. That cap declines by 3.3% (or about 12 million metric tons) a year out to 2020. Entities covered by the program include electricity suppliers, large industrial entities and transportation fuel suppliers, and collectively account for 85% of all California greenhouse gas emissions. These “covered entities” must surrender allowances to CARB every few years, retroactively covering all emissions for a given two- to three-year “compliance period.” Each entity can emit an unlimited amount of greenhouse gases, as long as they obtain and surrender that number of allowances at the end of each compliance period. Up to 8% of an entity’s compliance requirement can be met by purchasing “offsets” (reductions of emissions from an uncapped sector equal to the emissions of a regulated entity—such as biogas digesters on livestock farms or forestry projects). Overall, though, the sum of all emissions from covered entities cannot exceed the cap/total number of allowances allotted by CARB. Investor-owned utilities and industrial entities currently obtain most of their allowances for free from CARB, and about half of all allowances available under the cap are auctioned quarterly by the State. Proceeds from those sales are deposited to the Greenhouse Gas Reduction Fund (GGRF). For some entities in the food processing industry, the number of free allowances is scheduled to decline in 2018, and those formerly freely allotted allowances will be offered at auction. Entities may buy and sell allowances on a regulated secondary market. Price of the allowances is determined at auction, subject to a minimum floor price that escalates annually at 5% per year plus CPI. Price spikes are stabilized by a reserve of 4% of all allowances in a “containment reserve”, which is available in a special auction at three fixed price tiers which began at $40 per ton and escalate annually. Bidders may purchase allowances for the current compliance period or for the forthcoming compliance period. Most auctions to date have cleared very close to the floor price, which is about $12 per ton. Almost all of the allowances offered for sale by the State have been sold. The secondary market is trading very close to the quarterly auction clearing prices. Price drivers on the supply side include volume of allowances available (affected by declining cap and number of free allowances provided to covered entities, both of which are political decisions). Demand from both covered- and non-covered entities (i.e. financial entities and speculators, which are permitted to bid in the auctions and participate in the secondary market) is driven by availability of technology and production processes for reducing emissions that are cheaper than buying allowances, economic growth and contraction, and to a smaller degree availability of “offsets” (offsets are currently in undersupply—not enough offsets exist to fill the 8% limit available to covered entities to meet compliance requirements).

Appendix 4
CARB AUCTION RESULTS AND PROJECTIONS

Response to CHSRA RFEI HSR#15-02
Appendix 4 Requested by September 28, 2015
Current State Current State Future State Future StateAuction Current Future Owned Owned Clearing Floor Owned Owned Total CHSRA
Date Vintage Vintage Allowances Allowances Price Price Allowances Allowances Revenue 25%Offered Sold Offered Sold
2013 Nov-12 2013 2015 - - $10.09 $10.00 39,450,000 5,576,000 $10.00 $55,760,0002013 Feb-13 2013 2016 2,670,422 2,670,422 $13.62 $10.71 9,560,000 4,440,000 $10.71 $83,923,5482013 May-13 2013 2016 2,649,631 2,649,631 $14.00 $10.71 9,560,000 7,515,000 $10.71 $117,580,484Total 5,320,053 5,320,053 58,570,000 17,531,000 $257,264,032 162.8 N/A
2014 Aug-13 2013 2016 2,649,632 2,649,632 $12.22 $10.71 9,560,000 9,560,000 $11.10 $138,494,5032014 Nov-13 2013 2016 2,672,774 2,672,774 $11.48 $10.71 9,560,000 9,560,000 $11.10 $136,799,4462014 Feb-14 2014 2017 2,206,243 2,206,243 $11.48 $11.34 9,260,000 9,260,000 $11.38 $130,706,4702014 May-14 2014 2017 2,206,242 2,206,242 $11.50 $11.34 9,260,000 4,036,000 $11.34 $71,140,023Total 9,734,891 9,734,891 37,640,000 32,416,000 $477,140,441 159.7 N/A
2015 Aug-14 2014 2017 2,206,242 2,206,242 $11.50 $11.34 9,260,000 6,470,000 $11.34 $98,741,5832015 Nov-14 2014 2017 2,206,243 2,206,243 $12.10 $11.34 9,260,000 9,260,000 $11.86 $136,519,1402015 Feb-15 2015 2018 42,698,426 42,698,426 $12.21 $12.10 8,957,500 8,957,500 $12.10 $629,733,5312015 May-15 2015 2018 42,698,426 42,698,426 $12.29 $12.10 8,957,500 8,425,537 $12.10 $626,712,653Total 89,809,337 89,809,337 36,435,000 33,113,037 $1,491,706,908 394.50 N/A
2016 Aug-15 2015 2018 42,698,426 42,698,426 $12.52 $12.10 8,957,500 8,957,500 $12.30 $644,761,5442016 Nov-15 2015 2018 42,698,426 $12.10 $12.10 8,957,500 8,957,500 $12.10 $625,036,7052016 Feb-16 2016 2019 37,301,574 $12.83 $12.83 8,657,500 8,657,500 $12.83 $589,654,9192016 May-16 2016 2019 37,301,574 $12.83 $12.83 8,657,500 8,657,500 $12.83 $589,654,919Total 160,000,000 35,230,000 35,230,000 $2,449,108,087 382.40 612,277,022$
2013 Actual Results
Fiscal Year
Ending
Blue: CARB estimate of number of state-owned allowances to be sold
Source: CARB Auction Results http://www.arb.ca.gov/cc/capandtrade/auction/auction_archive.htm1 Barclays' Projected Floor Prices assume an annual growth rate of 6% (CPI=1%, fixed rate=5%)
Future Vintage
Price
2016 Actual and Projected Results
2015 Actual Results
2014 Actual Results
CARB Auction Results and Projections
Annual MMTCO2e
Cap