Embed Size (px)
Citation preview

Barbarians at the Gate:
Disruptors in Aviation

2
Air travel is remarkably resilient
Source: Boeing

3
Utilization and Load Factors at all-time highs
100
105
110
2010 2011 2012 2013 2014
Passenger Airline Utilization, Indexed with
2004=100
70%
75%
80%
2010 2011 2012 2013 2014
World Passenger Load Factors
Source: Boeing.

4
Source: International Air Transport Association estimates.
2016: Industry outlook per region

5
Aircraft market outlook 2015-2034
SUPPLY Deliveries: ~6-7% of fleet Other factors: ~1%
DEMAND Industry Growth ~5% Replacement: ~2-3%
Source: Boeing.

6
Supply: Replace older, less efficient planes
Source: Boeing
7
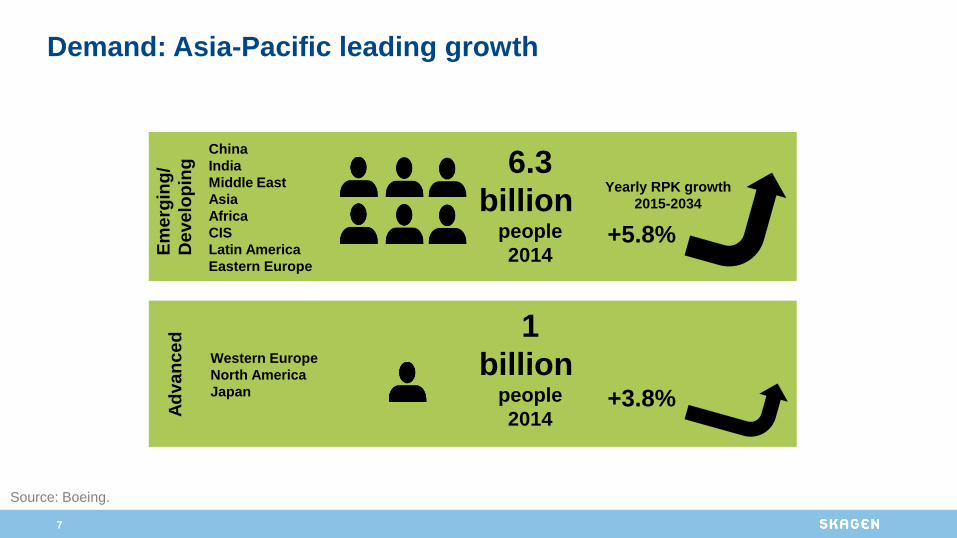
Demand: Asia-Pacific leading growth
China
India
Middle East
Asia
Africa
CIS
Latin America
Eastern Europe
6.3
billion people
2014
Yearly RPK growth
2015-2034
+5.8%
Western Europe
North America
Japan
1
billion people
2014+3.8%
Ad
va
nc
ed
Em
erg
ing
/
De
ve
lop
ing
Source: Boeing.

8
Top 3 megatrend growth drivers
Demographic
shifts
Technological
advances
Shift in global
economic power
82%
59%
77%
81% 41%60%
Airline CEOs All CEOs
Source: PricewaterhouseCoopers.

9
“We fly anything, anywhere, anytime”

10
“Disruptive Innovation” – Now a popular term
0
20
40
60
80
100
120
2007 2008 2009 2010 2011 2012 2013 2014 2015
Art
icle
men
tion
s p
er
mon
th in E
ng
lish
on
th
e inte
rnet
Source: Google Trends

11
Incumbent

12
Higher
PRODUCT
PERFORMANCE
Lower
Source: HBR article «What is distuptive innovation?"
Time
New entrant
13

14
AirAsia
15
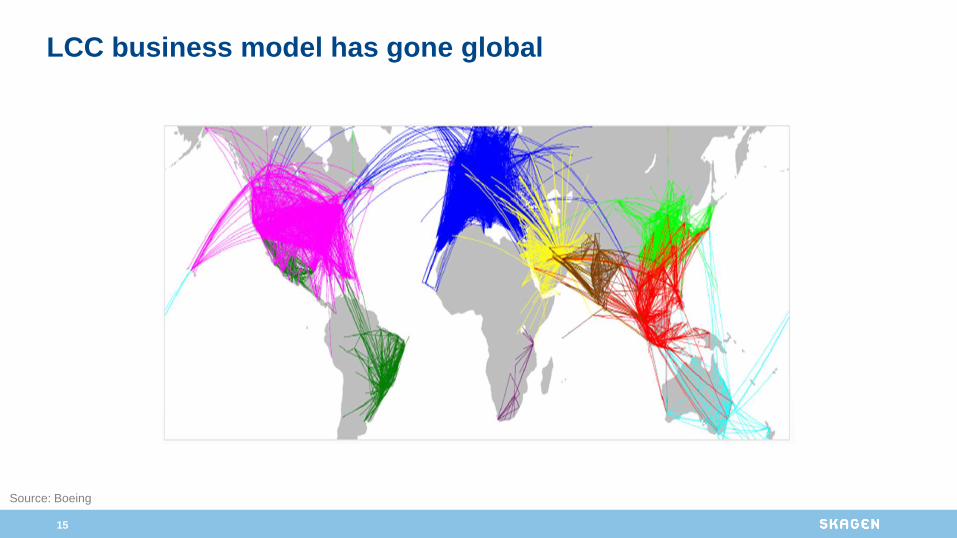
LCC business model has gone global
Source: Boeing
16
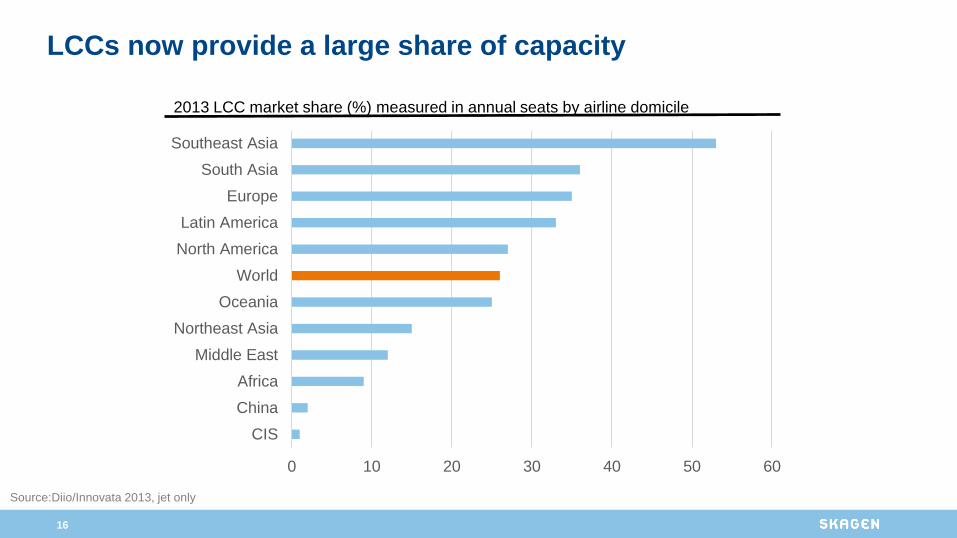
LCCs now provide a large share of capacity
0 10 20 30 40 50 60
CIS
China
Africa
Middle East
Northeast Asia
Oceania
World
North America
Latin America
Europe
South Asia
Southeast Asia
2013 LCC market share (%) measured in annual seats by airline domicile
Source:Diio/Innovata 2013, jet only

17
425 471 480
264263247 259
444
3 977
2 936
2 001
1 120
4 721
2034
3 670
Europe
Emerging
countries
North
America
20242004
1 792
2014
2 704
History Forecast
Middle Class set to Double in EM by 2034
6.4 bln 7.2 bln 8.0 bln 8.6 bln
World population growthSource: Oxford Economics, Airbus GMF 2015

18
10x Telenor Arena enter middle class each day

19
Stock price performance 2010-2015

20
0 5 10 15
AirAsia
Lufthansa
Air France - KLM
SAS
Norwegian Air
Southwest
EasyJet
RyanAir
P/E 2016e
0 5 10
SAS
Lufthansa
Air France - KLM
Southwest
EasyJet
AirAsia
RyanAir
Norwegian Air
EV/EBITDA 2016e
Source: Bloomberg.
Big variations among company valuations
21
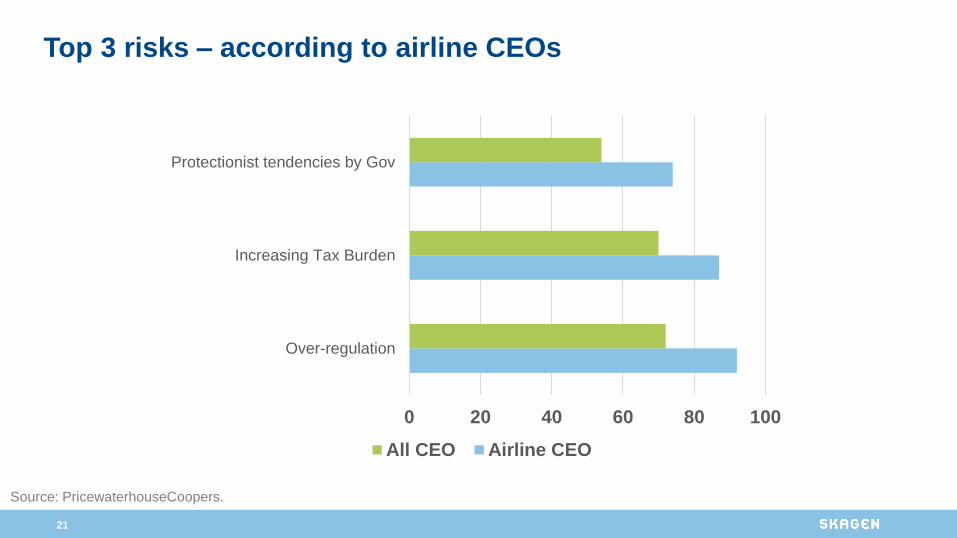
Top 3 risks – according to airline CEOs
0 20 40 60 80 100
Over-regulation
Increasing Tax Burden
Protectionist tendencies by Gov
All CEO Airline CEO
Source: PricewaterhouseCoopers.

22
All about the CASK
0,25 0,250,3
0,42
0,49 0,49
0,590,62
0,74
0
0,1
0,2
0,3
0,4
0,5
0,6
0,7
0,8
2014 (full-year reports) in NOK
Source: Swedbank research.

23

24

25
And the winners are…
Strong Management
Cost Advantage
Scale
Financing


![Patrons and Barbarians[1]](https://img.dokumen.tips/doc/110x75/62863c16d2f70e7d1c352926/patrons-and-barbarians1.jpg)