Embed Size (px)
Citation preview

feel the futureAnnual Report 2012
Bank of Georgia Holdings PLC 84 Brook Street, London W1K 5EH UK
Bank o
f Geo
rgia H
old
ings P
LC A
nnual Rep
ort 2012

This report is printed on material that is manufactured from ECF (Elemental Chlorine Free) pulp sourced from certified and well-managed forests and is FSC certified (Forest Stewardship Council). This brochure is 100% recyclable and biodegradable and is printed using vegetable oil based inks.
Designed and produced by Carnegie Orr +44 (0)20 7610 6140 www.carnegieorr.com
For more information on our values see
Pg 4
For more information on our product innovation see
Pg 8
For more information about our Governance see
Pg 68
For more information on our Executive Management team see
Pg 70
Values
Our values keeps us one step ahead, they are integral to the progress and performance of our business.
Team spiriT
passion
innoVaTion
respecT
courage
These values are what makes us unique, helping us feel the future.
Bank of georgia Holdings pLc (“BgH” or “Bank of georgia Holdings”) is a uK-incorporated holding company of Jsc Bank of georgia (the “Bank” or “Bank of georgia”) representing the Bank’s subsidiaries making up a group of companies (the “group”). Bank of georgia is the leading bank in georgia based on total assets (with a 36.7% market share), total gross loans (with a 35.4% market share) and total customer deposits (with a 33.1% market share) as of 31 December 2012.
The Bank has one of the largest distribution networks in georgia, with 194 branches, the largest aTm network in georgia, and a full-service remote banking platform. Bank of georgia offers a broad range of corporate banking, retail banking, asset and wealth management, insurance and brokerage services to its clients. information on Bank of georgia can be found on www.bankofgeorgia.ge and information on Bank of georgia Holdings can be found on www.bogh.co.uk
Products and ServicesWe strive to deliver a high level of customer service through various channels and by offering a new type of banking through constant product innovation.
express BanKing
premium BanKing
morTgages anD creDiT carDs
corporaTe BanKing
asseT anD WeaLTH managemenT
LiFe anD non-LiFe insurance
These help our customers to have access as and when they need our services no matter where they may be.
Governance
We are leaders in delivering strong governance and providing clarity and transparency to all stakeholders.
cusTomers
sHareHoLDers
empLoyees
communiTies
We recognise that good governance makes good business sense, helping us increase performance as we continue to expand.
Team
Our focused Executive Management team are driving the business through thought leadership and recognising opportunities.
LeaDing posiTion
capTure groWTH
increase porTFoLio
maximise reTurns
We aim to continue delivering sound performance for our customers, shareholders and communities we operate in.
Delivering Profitable

* Adjusted for the impact of the one-off Belarusian Rouble (BYR) hedge gains in 2011.** Bank of Georgia standalone.
Operational highlights**
Overview1 Financial highlights
2 Chairman’s statement
6 At a glance
10 Our history
14 Our strategy
18 Market review
20 Key performance indicators (Summary)
Performance22 Chief Executive Officer’s
statement
24 Key performance indicators
28 Business review – Overview of financial results
36 Segment discussions
46 Principal risks and uncertainties
56 Risk management
66 Social responsibility
Governance68 The Board of Directors
70 Executive Management of the Group
72 Chairman’s Corporate Governance Statement
73 Corporate Governance Report
77 Audit Committee Report
80 Directors’ Report on Remuneration
90 Nomination Committee Report
92 Directors’ Report
Financial Statements96 Contents
97 Independent Auditor’s Report: To the members of Bank of Georgia Holdings PLC
98 Standalone statement of financial position
99 Consolidated statement of financial position
100 Consolidated income statement
102 Consolidated statement of comprehensive income
103 Consolidated statement of changes in equity
104 Consolidated statement of cash flows
106 Notes to consolidated financial statements
Additional Information177 Abbreviations
178 Glossary
180 Shareholder information
Financial highlights of Bank of Georgia Holdings PLC Contents
Revenue (GEL mln)
498.32011: 408.7* +21.9%*
Net operating income (GEL mln)
232.42011: 201.4 +15.4%
Cost to income ratio
44.4%2011: 48.5%
Earnings per share (GEL)
5.222011: 4.44 +17.6%
Net loans to customers (GEL mln)
3,092.32011: 2,616.4 +18.2%
Total equity (GEL mln)
1,059.52011: 812.6 +30.4%
Tier I Capital adequacy ratio (BIS)
22.0%2011: 19.9%
Operating income before cost of credit risk (GEL mln)
277.12011: 223.6 +23.9%
Profit (GEL mln)
179.62011: 135.7 +32.3%
Return on average equity
19.1%2011: 18.3%
Total assets (GEL mln)
5,655.62011: 4,665.3 +21.2%
Client deposits (GEL mln)
2,622.92011: 2,554.1 +2.7%
Book value per share (GEL)
30.332011: 25.98 +16.7%
Leverage
4.3 (times)2011: 4.7
Branches
1942011: 158
Employees
3,7342011: 3,364
Number of cards
825,5002011: 663,205
ATMs/Express Pay terminals
478/2212011: 426/99
OverviewPerform
anceGovernance
Financial Statements
Additional Information
Bank of Georgia Holdings PLC Annual Report 2012 1

For more information about the market overview see
Pg 18
Welcome to Bank of Georgia Holdings
In 2012, Bank of Georgia Holdings has made strong progress in a number of areas that underpin future growth in its revenues, earnings and delivering value to its shareholders. The Board is delighted with the Group’s progress in a year in which it delivered record earnings of GEL 179.6 million.
Our executive management team, led by Irakli Gilauri, has developed and implemented a growth-focused strategy that is generating high levels of business and earnings growth, with strong profitability and returns whilst maintaining a conservative balance sheet with high levels of capital and liquidity – levels that are substantially in excess of minimum regulatory requirements. This strategy clearly works and, as a result, the Group continues to get stronger and stronger.
On behalf of the entire Board, I thank Irakli and the management team for plotting and maintaining the sound strategic course – with challenging goals – for Bank of Georgia. Irakli’s personal integrity and commitment to the values of the Group are clearly recognised, highly regarded and reflected throughout the organisation.
In my letter to shareholders last year I talked about Georgia’s recent progress in the eradication of corruption and in delivering market-oriented reforms that have underpinned Georgia’s macroeconomic development over the last decade. This economic progress has continued to be delivered throughout 2012 and into 2013, notwithstanding a period of uncertainty around the time of the country’s parliamentary elections in October 2012.
In 2012, Georgia remained firmly on the path of economic growth, recording an estimated 6.1% real GDP growth during the year. This economic growth reflects three main pillars: Georgia’s economic liberalisation and strong fiscal and monetary framework, ongoing macro-economic stability and Georgia’s welcoming business environment resulting from recent growth oriented reforms.
Neil JaninChairman of Bank of Georgia Holdings
Four reasons why we are the leading bank in Georgia 1. Our values drive our business2. Our products and services are
right for the market we are in3. We have a strong and robust
governance structure4. Our Executive Management
team is focused on delivering results
Overview: Chairman’s statement
2 Bank of Georgia Holdings PLC Annual Report 2012

For more information on our Group performance see
Pg 28
Growth in tourism continues to be an important driver of Georgia’s economic progress, with the number of foreign visitors growing by 56% to a total of an estimated 4.4 million visitors in 2012 compared to 2011. Net remittances and foreign direct investment remained robust and are expected to continue to be so into 2013 and beyond. In January and February 2013, the number of foreign visitors continued to increase significantly with 37% year-on-year growth compared to January and February 2012.
Georgia benefits significantly from its liberal economic policies and its positioning as the logistics and tourism hub for the Caucasus region. The country’s Liberty Act ensures the continuation of the country’s credible fiscal and monetary policy framework. With effect from 2014, Georgia’s government expenditure as a percentage of GDP will be capped at 30%, the budget deficit as a percentage of GDP will be capped at 3%, and overall Government debt to GDP will be capped at 60%. In addition, recent growth oriented economic reforms, such as eradication of regulation and red tape and eradication of administrative corruption, among others, will continue to benefit the economy for years to come.
2012 was also a breakthrough period in the Deep and Comprehensive Free Trade Area negotiations with the European Commission, which is now expected to lead to the successful conclusion of negotiations during 2013, and to the initiation of free trade with the European Union within two years.
In December 2012, the Parliament of Georgia approved Georgia’s state budget for 2013. The budget revenues are projected at GEL 7.4 billion, while the total state expenditure budget (including acquisition of non-financial assets) is expected to be GEL 7.9 billion. The forecast budget deficit, as a percentage of GDP, is 2.9%, and Government debt to GDP is targeted to be 33.1%. Real GDP growth is budgeted to be c.6%, and average inflation is expected to be c.3%.
Whilst 2012 was another year of economic progress in Georgia, it is in the political sphere that a truly remarkable breakthrough was achieved. Following the victory of the Georgian Dream coalition in the October 2012 parliamentary elections, there was a relatively smooth transition to a Government run by the Georgian Dream coalition – a rare democratic achievement among former members of the post-Soviet CIS. The new Government is now clearly ‘up and running’, progress is being demonstrated in many areas and it is encouraging to see good levels of inward investment continue, high and growing levels of tourists visiting Georgia and, perhaps most notably, significant signs of a substantial improvement in both diplomatic and economic relations with Russia – over time I believe this will be extremely beneficial to the people and economy of Georgia. Whilst the last October elections plainly represented a significant source of uncertainty for businesses and consumers in Georgia, having seen these more recent developments in the country, it feels like this period of uncertainly is now behind us.
Bank of Georgia Holdings PLC Annual Report 2012 3
OverviewPerform
anceGovernance
Financial Statements
Additional Information

Throughout 2012, Bank of Georgia has remained firm and true to its core values and principles. Among the many reasons why Bank of Georgia continues to be, by any measure, the leading bank in Georgia, I would highlight these:
– Our key values drive our business – Our products and services are appropriate for the markets in which we operate
– We have a strong and robust governance structure, and – Our executive management remains clearly focused on delivering high quality, sustainable, results.
The Group recognises that we live in a time when the external environment constantly challenges us to develop innovative solutions that drive both value for our customers and sustainable profits for our shareholders. Many of the ways in which the Group is responding to this challenge are explored in greater detail in the Chief Executive’s statement and elsewhere in this Annual Report. I will mention only a few of the key areas of progress made by the Group. In Retail Banking, our Express Banking strategy is revolutionising Georgian financial services markets and is increasingly been used to bring more, previously unbanked, customers into the banking sector.
PassionTo be pro-active, result driven and constantly the best
CourageTo explore new areas, take reasonable risks and make opportunities come true
RespectTo build long-term client relationships based on consideration, professionalism and trust
InnovationTo think outside the box, constantly challenge the status quo and to come up with fresh ideas
Team SpiritTo achieve outstanding results together, as one, united and uncompromising team
Our values keeps us one step ahead
Overview: Chairman’s statement continued
Values
4 Bank of Georgia Holdings PLC Annual Report 2012

Management’s focus on cost efficiency and delivering positive operational leverage is also an important strategic priority. By constantly looking to improve efficiency, and focusing on leveraging new technologies and efficiencies such as Straight-Through Processing, the Bank again delivered revenue growth that is more than double the rate of expense growth.
In a maturing financial services market, which we expect to be characterised over the next decade by falling interest rates, management has made reducing the Group’s cost of funds a priority. Over the last 12 months this has been highlighted by a strong focus on reducing deposit rates across all business sectors, as well as the issuance of a five-year Eurobond in July 2012 which, when combined, supported both a significantly reduced cost of funds and, consequently, an increase in the Bank’s net interest margin. This emphasis on strong balance sheet management will, I believe, continue to support strong margins over the next few years.
Our strong earnings performance and level of profitability has produced high rates of internal capital generation. Our capital ratios substantially exceed our current capital requirements and proposed future needs. This has enabled the Board to recommend a more than doubled dividend of GEL 1.50 per share, and announce an expected dividend payout ratio going forward of 25%-40% of earnings.
Finally, our listing on the premium segment of the London Stock Exchange in February 2012 has achieved its key objectives. The average daily liquidity of Bank of Georgia Holdings shares has increased substantially, the Group has improved access to global capital markets and we have experienced a significant diversification of our institutional shareholder base, with particularly noticeable increases in our UK and US shareholder bases. The value of these improvements was both demonstrated and further enhanced in March 2013 by the successful placement of a 10% equity holding by East Capital Financials Fund, which is in the process of closing.
The Board believes that both Georgia and Bank of Georgia remain well positioned to build on the successes of 2012, in 2013 and beyond. The Bank of Georgia business model has a demonstrated flexibility and ability to generate high quality organic growth in a number of different economic environments. Georgia’s economy is in good shape and I cannot think of a bank better placed to take advantage of the opportunities that will arise in our core businesses over the next few years.
Neil JaninChairman of Bank of Georgia Holdings 10 April 2013
For more information on our Governance see
Pg 68
For more information on our Social Responsibility see
Pg 66
Bank of Georgia Holdings PLC Annual Report 2012 5
OverviewPerform
anceGovernance
Financial Statements
Additional Information

Our products and services
Building a strong brand across our services
The structure of our business
Bank of Georgia Holdings is a UK-Incorporated holding company of JSC Bank of Georgia, representing the Bank’s ultimate parent company and together with the Bank’s subsidiaries making up a group of companies. BGH was incorporated under the laws of England and Wales in October 2011 and became the parent holding company of the Group on 28 February 2012 upon the successful completion of the tender offer by BGH whereby it acquired 98.35% of the issued share capital of Bank of Georgia (“Tender Offer”). On the same day, the shares of BGH were admitted to the premium listing segment of the Official List of the UK Listing Authority and to trading on the London Stock Exchange plc’s Main Market for listed securities (“LSE”).
Bank of GeorgiaBank of Georgia is a commercial bank established in December 1994 under the laws of Georgia. The Bank is the Group’s main operating unit and accounts for most of the Bank’s activities.
Bank of Georgia is the leading bank in Georgia based on total assets (with 36.7% market share), total gross loans (with 35.4% market share), total client deposits (with 33.1% market share) and equity (with 39.7% market share) as of 31 December 2012. As the country’s largest lender, Bank of Georgia provides a broad range of banking products and services to more than one million clients in its distribution network of 194 branches, 478 ATMs, 221 Express Pay terminals, a full-service remote banking platform and a modern call centre. The Group also provides leasing, asset and wealth management, insurance and brokerage services to its clients in Georgia.
The Group’s activities are organised into three main businesses that are strategic, synergistic and non-core. Strategic businesses comprise Retail Banking, Corporate Banking provided by Bank of Georgia as well as Asset and Wealth Management (“AWM”). Synergistic businesses comprise Insurance and Healthcare and Affordable Housing. Non-core businesses are banking operations in Belarus through Belarusky Narodny Bank (“BNB”), and Joint Stock Company Liberty Consumer (“Liberty Consumer”), a Georgia-focused investment company.
Retail BankingBank of Georgia operates the largest retail bank in Georgia, with market share of 32.4%, based on loans to individuals and a 30.6% based on deposits from individuals as of 31 December 2012. Retail Banking, the largest provider of personal loans in the country, provides services to more than one million clients in Georgia and more than 2,000 sales forces assist clients with their checking, savings accounts, money-transfers, mortgage loans, consumer loans, micro and SME business loans, Point of Sale (“POS”) loans, automobile loans, pawn loans and other banking services through 194 branches across the country.
Corporate BankingCorporate Banking is the country’s largest corporate lender and delivers extensive sector knowledge, local expertise and dedicated service to more than 7,600 corporate clients in Georgia. Corporate Banking extends loans and other credit facilities to its corporate clients representing various sectors of the economy, which, among others, include retail and wholesale trade, industry and state, pharmaceuticals and healthcare. Corporate Banking provides leasing services through the Group’s wholly-owned subsidiary Georgian Leasing Company (“GLC”) and encompasses the country’s leading trade finance business and most recently launched Research Department.
Asset and Wealth ManagementBank of Georgia’s Asset and Wealth Management business attracts deposits from wealthy local and international clients. AWM clients include institutions and high net-worth individuals from more than 60 countries. In line with the Group’s strategy of expanding the sale of wealth management products and services internationally, the Bank has set up representative offices in Tel Aviv, London and Budapest which provide information services to Asset and Wealth Management clients.
Overview: At a glance
6 Bank of Georgia Holdings PLC Annual Report 2012

37%*Bank of Georgia market share as of 31 December 2012
34%*Aldagi BCI market share as of 30 September 2012
Our products and services
Aldagi BCI (Insurance and Healthcare)The Group provides insurance and healthcare products and services through its wholly-owned subsidiary Aldagi BCI. Aldagi BCI’s healthcare business consists of ‘My Family Clinic’, Georgia’s leading healthcare provider, operating a chain of healthcare centres in Georgia in line with the Group’s strategy of vertically integrating its insurance and healthcare businesses. Aldagi BCI is Georgia’s leading provider of life and non-life insurance products, based on a market share of 33.1% of the life and 33.5% of the non-life insurance markets as of 30 September 2012 (based on gross insurance premium revenue). Its healthcare operation owns and operates 6 outpatient clinics and 26 hospitals in Georgia, predominantly in Western Georgia.
Affordable HousingThe Affordable Housing business consists of the Group’s wholly owned subsidiary m2 Real Estate (formerly SBRE), which develops and sells affordable residential apartments and also holds investment properties repossessed by the Bank from defaulted borrowers and manages those properties. m2 Real Estate business is in place to support the Group’s strategic retail mortgage lending business and to capitalise on the current unsatisfied demand for affordable housing stock in Tbilisi. The Group outsources the construction and architecture works and focuses on project management and sales, which is supported by the Bank’s well-established brand name and superior distribution channels assisting it in marketing its properties and mortgage products.
Non-coreThe Group’s non-core businesses comprise Belarusky BNB the Group’s subsidiary in Belarus and Liberty Consumer. Through BNB the Group provides retail banking and corporate banking services in Belarus. Most of the Group’s other investments are held through Liberty Consumer, a Georgia-focused investment company in which the Bank holds a 67% stake. In order for the Group to focus on its strategic businesses, the Group intends to exit from its other non-core operations, including Liberty Consumer and, in due course, its interest in BNB.
For the full list of JSC Bank of Georgia subsidiaries please see Note 2 of the Consolidated Financial Statements.
* Market share data throughout the Annual Report is based on the information provided by the National Bank of Georgia (“NBG”). For Bank of Georgia, market share represents market share based on total assets on a standalone basis, as of 31 December 2012, unless noted otherwise. For Aldagi BCI, market share is provided based on the gross insurance premium revenue as of 30 September 2012.
Share in the Group’s consolidated assets
Affordable Housing 2% BNB 3%
Retail Banking, Corporate Banking and Asset and Wealth Management (Bank of Georgia) 87% Insurance and Healthcare (Aldagi BCI) 6%
Other 2%
1,063,207 Total number of customers across our Georgian banking businesses in 2012
Retail Banking Building customer-driven franchise through segment approach, while shifting customers to electronic channels to capture an unbanked portion of the population and improve efficiency
Asset and Wealth Management Aims to build regional asset management business on the existing wealth management platform
Insurance and Healthcare Aldagi BCI, the leading vertically integrated healthcare and insurance service provider to capitalise on the rapidly growing insurance and healthcare markets in Georgia through the Group’s superior network and cross selling capabilities
Corporate Banking Having achieved leadership in corporate banking sector, the Corporate Banking business is focused on fee generating business including advisory services
Affordable Housing Supporting the Group’s strategic mortgage lending business while capitalising on high demand for housing
Bank of Georgia Holdings PLC Annual Report 2012 7
OverviewPerform
anceGovernance
Financial Statements
Additional Information

ProductsLoans/GDP
40
30
20
10
0
31.8% 33.4%30.2%28.8%31.4%
27.0%
14.9%9.8%
9.2%
03 04 05 06 07 08 09 10 11 12
19.4%
Offering a new type of banking through constant product innovationBank of Georgia customers can use 194 bank branches, 478 ATMs and 221 Express Pay terminals across the country as well as online and mobile services.
In a short time, we have made dramatic progress in providing customers with a great banking experience through innovative technology and client-oriented services.
For more information about Express Banking see
Pg 39
Source: NBG
8 Bank of Georgia Holdings PLC Annual Report 2012

Products
Bank of Georgia Holdings PLC Annual Report 2012 9
OverviewPerform
anceGovernance
Financial Statements
Additional Information
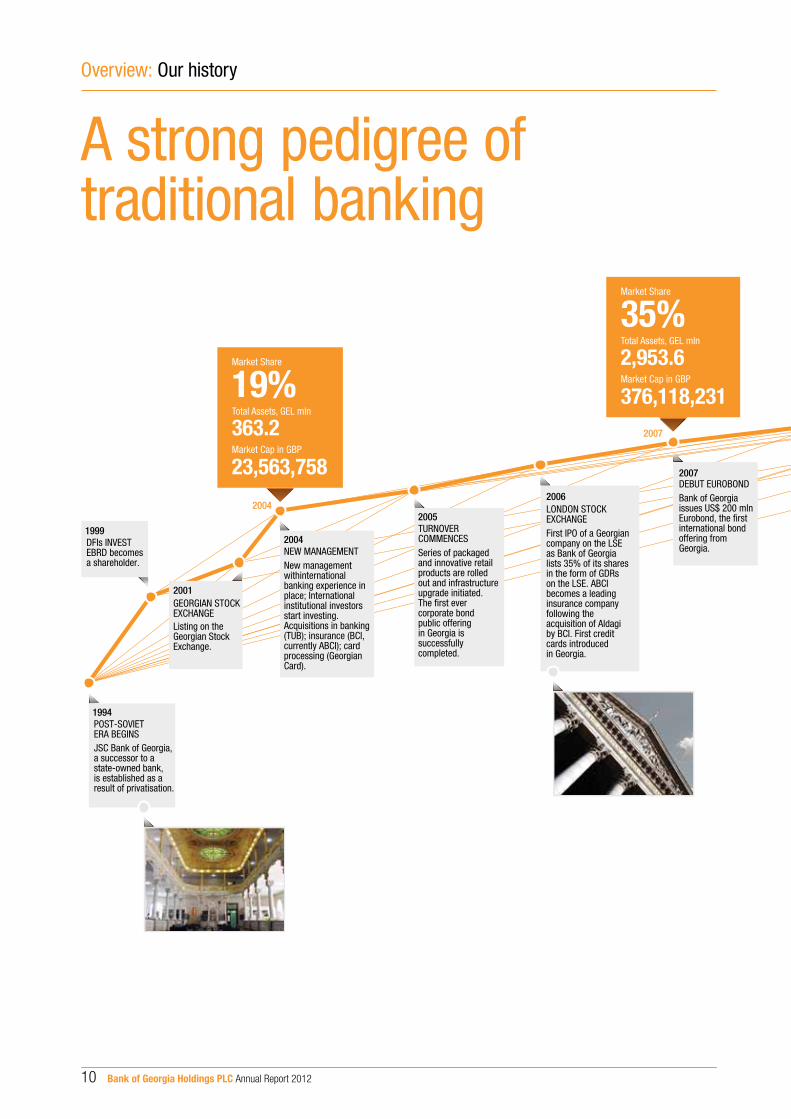
19%Market Share
Total Assets, GEL mln
363.2
23,563,758Market Cap in GBP
35%Market Share
Total Assets, GEL mln
2,953.6
376,118,231Market Cap in GBP
36%Market Share
Total Assets, GEL mln
4,665.3
250,459,652Market Cap in GBP
37%Market Share
Total Assets, GEL mln
5,655.6
524,544,698*
Market Cap in GBP
LONDON STOCKEXCHANGE First IPO of a Georgiancompany on the LSEas Bank of Georgialists 35% of its sharesin the form of GDRs on the LSE. ABCI becomes a leadinginsurance companyfollowing the acquisition of Aldagiby BCI. First creditcards introducedin Georgia.
DEBUT EUROBONDBank of Georgiaissues US$ 200 mlnEurobond, the �rst international bondoffering fromGeorgia.
INVESTING INGROWTHNew integratedinternet and mobilebanking platformlaunched; entering Belarus, through acquisition of BNB; becomesexclusive partner of American Expressin Georgia.
BANK OF GEORGIAHOLDINGS PLC BGH incorporated underthe laws of Englandand Wales. BGH launchesTender Offer to the Bank’s shareholders.
IN GEORGIA: Express Bankinglaunched to further advance the Bank’sretail banking franchise.Aldagi BCI steps upvertical integration ofinsurance and healthcare sector; New branding promiseintroduced: Feel the Future
SOLO BANKINGLaunches Solobanking to target mass af�uentsegment of the population. Investments in IT platform.International wealth management launched, �rst representativeof�ce opened inTel Aviv.
NEW STRATEGYFocus on Georgia anddiversi�cation of revenue sources
PREMIUM LISTING ONTHE LSE MAIN MARKETBGH �oats on thepremium segment ofthe LSE after 98%+shareholders accept theTender Offer. Becomescomponent ofFTSE 250 index.
2007
2004
POST-SOVIETERA BEGINS JSC Bank of Georgia, a successor to a state-owned bank, is established as aresult of privatisation.
1994
NEW MANAGEMENTNew management withinternational banking experience inplace; Internationalinstitutional investorsstart investing.Acquisitions in banking(TUB); insurance (BCI,currently ABCI); cardprocessing (GeorgianCard).
2004DFIs INVESTEBRD becomesa shareholder.
1999
GEORGIAN STOCKEXCHANGE Listing on theGeorgian StockExchange.
2001
2006
2007
2008
2011
2009
2010
2012
TURNOVERCOMMENCES Series of packagedand innovative retailproducts are rolledout and infrastructureupgrade initiated.The �rst evercorporate bondpublic offering in Georgia issuccessfully completed.
2005
2011
2012
A strong pedigree of traditional banking
Overview: Our history
10 Bank of Georgia Holdings PLC Annual Report 2012

19%Market Share
Total Assets, GEL mln
363.2
23,563,758Market Cap in GBP
35%Market Share
Total Assets, GEL mln
2,953.6
376,118,231Market Cap in GBP
36%Market Share
Total Assets, GEL mln
4,665.3
250,459,652Market Cap in GBP
37%Market Share
Total Assets, GEL mln
5,655.6
524,544,698*
Market Cap in GBP
LONDON STOCKEXCHANGE First IPO of a Georgiancompany on the LSEas Bank of Georgialists 35% of its sharesin the form of GDRs on the LSE. ABCI becomes a leadinginsurance companyfollowing the acquisition of Aldagiby BCI. First creditcards introducedin Georgia.
DEBUT EUROBONDBank of Georgiaissues US$ 200 mlnEurobond, the �rst international bondoffering fromGeorgia.
INVESTING INGROWTHNew integratedinternet and mobilebanking platformlaunched; entering Belarus, through acquisition of BNB; becomesexclusive partner of American Expressin Georgia.
BANK OF GEORGIAHOLDINGS PLC BGH incorporated underthe laws of Englandand Wales. BGH launchesTender Offer to the Bank’s shareholders.
IN GEORGIA: Express Bankinglaunched to further advance the Bank’sretail banking franchise.Aldagi BCI steps upvertical integration ofinsurance and healthcare sector; New branding promiseintroduced: Feel the Future
SOLO BANKINGLaunches Solobanking to target mass af�uentsegment of the population. Investments in IT platform.International wealth management launched, �rst representativeof�ce opened inTel Aviv.
NEW STRATEGYFocus on Georgia anddiversi�cation of revenue sources
PREMIUM LISTING ONTHE LSE MAIN MARKETBGH �oats on thepremium segment ofthe LSE after 98%+shareholders accept theTender Offer. Becomescomponent ofFTSE 250 index.
2007
2004
POST-SOVIETERA BEGINS JSC Bank of Georgia, a successor to a state-owned bank, is established as aresult of privatisation.
1994
NEW MANAGEMENTNew management withinternational banking experience inplace; Internationalinstitutional investorsstart investing.Acquisitions in banking(TUB); insurance (BCI,currently ABCI); cardprocessing (GeorgianCard).
2004DFIs INVESTEBRD becomesa shareholder.
1999
GEORGIAN STOCKEXCHANGE Listing on theGeorgian StockExchange.
2001
2006
2007
2008
2011
2009
2010
2012
TURNOVERCOMMENCES Series of packagedand innovative retailproducts are rolledout and infrastructureupgrade initiated.The �rst evercorporate bondpublic offering in Georgia issuccessfully completed.
2005
2011
2012
* Market capitalisation as of 31 March 2013.
Bank of Georgia Holdings PLC Annual Report 2012 11
OverviewPerform
anceGovernance
Financial Statements
Additional Information

Governance
Leaders in delivering strong Governance
The Group has demonstrated its unwavering commitment to strong governance through its listing on the premium segment of the LSE, thereby complying with the stringent corporate governance requirements associated with the premium listing on the LSE. The BGH Board of Directors consists of prominent and well-experienced directors with diverse backgrounds who support and add value to the Group.
For more information about Governance see
Pg 68
12 Bank of Georgia Holdings PLC Annual Report 2012

Governance
OverviewPerform
anceGovernance
Financial Statements
Additional Information
Bank of Georgia Holdings PLC Annual Report 2012 13

Delivering against our strategy
Strategic pillar Measure 2012 performance Outlook
1. Maintain its leading position in the growing and still underpenetrated Georgian banking market
Market share by assets 36.7%2011: 35.6%
Strongly positioned to maintain the leading position on the Georgian market
2. Focus on profitable growth
Return on Average Equity (ROAE) 19.1%
2011: 18.3%
Maintain ROAE of c.20% through profitable growth
3. Increase the portfolio while maintaining asset quality
Net loan book growth 18.2%2011: 10.6%
Capitalise on superior distribution and cross selling opportunities coupled with the Bank’s prudent risk management policies to achieve high quality growth
4. Continue prudent liability management by means of optimising cost of funds and diversification of the funding base
Cost of funds 7.3%2011: 8.0%
Well positioned to attract low cost deposits through its strong franchise in Georgia and key selected international markets through representative offices while maintaining superior access to capital on international markets
5. Focus on advancing payment systems and IT investments; increase operational efficiency
Cost/Income Ratio 44.4%2011: 48.5%
Intensify shift to efficient and cost effective payment systems through electronic channels
6. Achieve growth and capture synergies in the Georgian insurance, healthcare and affordable housing sectors
Contribution of non-interest income to total revenue 43.0%
2011: 41.5%1
Further develop non-banking businesses to increase non-interest income contribution to group revenue
7. Dividend policy Dividend per share GEL1.52
2011: GEL 0.7
Maintain a dividend payout ratio in the 25-40% range
1 Adjusted for one-off gain from Belarusian currency hedge in 2011.2 The Board intends to recommend dividend per share of GEL 1.5 for 2013 at the 2013 AGM.
Overview: Our strategy
14 Bank of Georgia Holdings PLC Annual Report 2012

ONE BRAND, ONE NETWORK
LSE PREMIUM LISTING
ASSET & WEALTH
MANAGEMENT
CORPORATEBANKING
INSURANCE &HEALTHCARE
RETAILBANKING
LARGE SCALE & DISTRIBUTION
NETWORK
STRONG FRANCHISE
WELL DEVELOPED ELECTRONICCHANNELS
UNMATCHEDLOCAL EXPERTISE
CROSS-SELLINGNETWORK
EXPERIENCED MANAGEMENT
TEAM
UNIQUE EXPOSURE TO GEORGIA
AFFORDABLEHOUSING
Our business model
For more information about the market overview see
Pg 18
A strategy for growthThe Group aims to capitalise on the growing Georgian economy and underpenetrated banking sector through its superior franchise, access to capital and well managed business model coupled with corporate governance that meets the standards for a premium listed company on the LSE.
Our business modelThe Group runs a fully integrated business model, capitalising on its superior franchise, access to capital, largest scale through its distribution networks and unmatched local expertise to constantly identify new revenue streams and efficiency generating services.
The Bank is well capitalised with a solid balance sheet and generates solid profitability, providing steady return to shareholder’s equity, aiming to pay dividends regularly.
Bank of Georgia Holdings PLC Annual Report 2012 15
OverviewPerform
anceGovernance
Financial Statements
Additional Information

The Executive Management team drives the business through thought leadershipBank of Georgia’s management team consists of western educated professionals with in-depth local knowledge and extensive global banking experience. Our executive management team, alongside our dedicated employees, has a proven track record of delivering sound performance for our customers, shareholders and communities we operate in.
Every day, the Bank’s 3,734* employees are working to provide exceptional service to make sure customers have the products and advice they need.
For more information on our Executive Management team see
Pg 70
* Bank of Georgia’s banking business standalone.
16 Bank of Georgia Holdings PLC Annual Report 2012

OverviewFinancial Statem
entsAdditional Inform
ationGovernance
Performance
Bank of Georgia Holdings PLC Annual Report 2012 17

Overview: Market review
GDP composition*, 2012
Agriculture, huntingand forestry; �shing 8%
Manufacturing 11%
Wholesale andretail trade 17%Hotels and restaurants 2%Transport 8%
Electricity, gas andwater supply 3%Construction 7%
Communication 3% Financialintermediation 3%
Education 5%Health and social work 6%Other 11%
*Estimates
Real Estate 5%PublicAdministration 11%
Gross domestic product20
0
-5
10
5
15
03Nominal GDP (USD bln)
04 05 06 07 08 09 10 11 12E 13F Real GDP Growth (%)
11.1
5.99.6
9.4
12.3
2.3
-3.8
6.3
7.26.1 5.5
4.0 5.16.4
7.8
10.212.8
10.8
14.411.6
15.817.3
An encouraging economic outlook
Liberty Act (with effect from 1 January 2014):
– Government expenditure capped at 30% of GDP
– Budget deficit capped at 3% of GDP – Government debt to GDP capped at 60% of GDP
A snapshotGeorgia’s economic performance reflects economic liberalisation, ongoing macro-economic stability and Georgia’s business-friendly environment that have resulted from the growth-oriented reforms of the last decade. Such reforms, initiated in 2003-2004, included eradication of administrative corruption, downsizing bureaucracies, reforming public services and simplifying the business environment. Almost a decade later, Georgia stands out as a country with one of the lowest corruption and crime rates in the world, well-functioning public institutions and a growing private sector positioned to continue benefiting from the strong fundamentals of the growth economy and inward investments. With only six taxes that are currently imposed, of which the corporate tax rate is 15% and personal income tax 20%, Georgia is truly one of the world’s most “friendly” tax regimes. In the 2013 World Bank/International Finance Corporation’s “Doing Business Report”, Georgia was ranked 9th in the world (a significant improvement from 115th in 2005).
Georgia’s geographic location between land-locked, energy-rich countries and the European markets has largely determined the hub economy role for the country. The country is an important energy transit hub, hosting several pipelines one of which is Baku-Tbilisi-Ceyhan pipeline, transporting Azerbaijani crude oil through Georgia to Turkey. One of the three ports on Georgia’s Black Sea coast is owned and managed by Denmark’s A.P. Moeller-Maersk.
Since 2003, Georgia has delivered real GDP compounded annual growth rate (“CAGR”) of over 6% per annum. The composition of Georgia’s GDP is quite diverse, with the largest sector – trade – representing 17% of GDP, with manufacturing (c. 11%), agriculture (c. 8%), transportation (c. 8%), construction (c. 7%) and hospitality (c. 2%) all representing strong sectors of
the economy. A significant portion of the trade is attributed to the business of re-exporting cars that are sent to various destinations from Georgian ports.
In addition, hydroelectric power and several large scale infrastructure projects have become one of the key drivers of the economy. If harnessed, Georgia could produce 32 TWh of hydropower annually, 4x more than currently. The extra capacities would allow 6.3 TWh exports by 2020. Such growth will be supported by the completions of new hydroprojects and transmission lines to Turkey, increasing total transmission capacity to Turkey by 7.6x times.
Foreign Direct Investment (“FDI”) is diversified across various sectors, supporting ongoing investments in capital intensive areas (such as hydropower transmission assets among others). Since the onset of the structural reforms, the country observed substantial FDI inflows, which averaged approximately 10% of GDP from 2003 to 2011. Over the past few years, FDI and net remittances, the latter being a traditionally reliable source of FX inflows from approximately one million Georgians living abroad accounting for approximately 7.0% of GDP (2003-2011 average), have more than covered the relatively high current account deficit.
The structure of inflows that drive Georgia’s economy has changed in recent years, reflecting the diversification (and growth) of sources of funds flowing into the country. Tourism is increasingly becoming a significant income source for Georgia, as investments into infrastructure and hospitality sectors of the past several years, resulted in the significant increase in number of visitors (c. 300,000 visitors in 2003 compare to an estimated 4.4 million visitors in 2012). The tourist inflows are now on par with the FDI and remittances, accounting for approximately 7.1% of GDP in 2011.
Source: NBG, Geostat, 2013 Forecast by IMF.
18 Bank of Georgia Holdings PLC Annual Report 2012

Public debt as % of GDP
100
203040506070
26%31%
41% 42%37% 35%
Total public debt as % of GDP External public as % of GDP
32%40%
35%27%
21%17%
24%32% 34%
29% 28%
45%
63%
03 04 05 06 07 08 09 10 11 12F
51%
Banking sector assets, loans and deposits
03 04 05 06 07 08 09 10 11 12
14.412.7
GEL bln
8.28.77.4
7.7
Assets CAGR 30.2%Total assets: GEL 14.4 blnGross loans/GDP: 33.4%Total deposits/GDP: 31.3%
+13.2%16
12
8
4
0
Assets Deposits Loans
Georgia has relatively low levels* of household, business and government debts (13.8%, 19.6% and 32.6% of GDP, respectively) compared to many Western countries, a factor that in combination with strong economic growth makes it a unique market.
2012In 2012, Georgia remained firmly on the path of continued economic growth, recording an estimated 6.1% real GDP growth during the year. Economic growth was stronger in the first half of the year compared to the second half of the year. The slowdown in the second half reflected lower corporate investment levels in both the pre and post parliamentary election period.
The annual growth in 2012 was underpinned by strong growth in the construction and manufacturing sectors (2012 real growth of 11.4% and 16.4% respectively), while financial intermediation, hospitality businesses and communication grew by 15.0%, 11.8% and 9.6%, respectively.
Fiscal and monetary policies remained broadly unchanged during the year, and the Georgian Lari exchange rate remained largely unchanged to the US Dollar, reflecting continuing stability in the Georgian macroeconomic environment. The Government’s budget deficit, an estimated 2.9% for 2012, was maintained at the expected level. This level was consistent with government plans to bring the budget deficit down from 9.2% in 2009, to under 3.0% from 2013 onwards.
The total National Bank of Georgia reserves continued to grow, reaching a record high of US$ 2.9 billion in December 2012, covering 4.4 months of 2012 import of goods and services. In addition, the National Bank of Georgia has continued to increase its US Dollar reserves in the first few months of 2013.
The Government continues to diligently manage its foreign debt portfolio and further decreased its foreign sovereign debt to an estimated 27.6% of GDP in 2012, compared to 44.9% in 2003, and 33.6% in 2010.
Inflation, as measured by the Consumer Prices Index, (“CPI”) remained below recent trend levels, resulting in a year-end annual deflation of an estimated 1.4%.
The current account deficit for the year was an estimated 11.5% of GDP, reflecting continued extensive investments. This deficit continues to be comfortably financed by foreign inflows of capital. The growth in services exports continued to be significant, with the number of foreign visitors growing
by 56% to a total of approximately 4.4 million visitors in 2012. Net remittances grew by 5.0% in 2012 reaching US$ 1.2 billion. FDI for the year totalled an estimated US$ 865 million.
Georgia continues to benefit significantly from its liberal economic policies and its positioning as the logistics and tourism hub for the Caucasus region. The country’s Liberty Act, will ensure the continuation of the country’s credible fiscal and monetary policy framework. Free Trade Agreements with the US and Europe are expected to lead to the increase both Georgian exports to these markets and the inward investments to the country.
In December 2012, the Parliament of Georgia (the “Parliament”) approved Georgia’s state budget for 2013. The budget revenues are projected at GEL 7.4 billion, while the total state expenditure budget (including acquisition of non financial assets) is expected to be GEL 7.9 billion. The forecast budget deficit, as a percentage of GDP, is 2.9%, and Government debt to GDP is targeted to be 33.1%. Real GDP growth is budgeted to be c. 6%, and average inflation is expected to be c. 3% in 2013.
Georgian Banking and Insurance SectorsThe Georgian financial services sector is one of the most solid contributors to economic growth of the country, with banking assets accounting for 54.9% of GDP in 2012 and growing at an average growth rate of c. 30.4% during the past decade. Despite a high growth rate the banking sector penetration remains low with loans/GDP and deposit/GDP ratios at 33.4% and 31.3%, respectively. The banking system is entirely privately owned and is quite concentrated with two largest banks accounting for 62.5% of total assets. The NBG is the regulator of the whole financial sector and it supervises the banking sector, the securities market and insurance companies.
The Georgian insurance sector is represented by 14 insurance companies, with Aldagi BCI being the largest player on the market followed by Vienna Insurance Group companies. Like the banking sector, the insurance market remains under penetrated with premiums-to-GDP ratio of 1.7%.
Sources: Geostat, Government of Georgia, Ministry of Finance of Georgia, NBG, Georgian National Tourist Agency, IMF
* Extended by Georgian commercial banks to the households and businesses, respectively, per NBG
Source: Geostat. Source: NBG, Ministry of Finance.
Bank of Georgia Holdings PLC Annual Report 2012 19
OverviewPerform
anceGovernance
Financial Statements
Additional Information

Measuring our strategic performance
As a Group we analyse our performance against various measures. Key Performance Indicators, (“KPIs”) are used to evaluate our business against our strategic objectives. Such KPIs allow Executive Management and the Board to assess performance and manage performance improvement on a regular basis.
DescriptionThe growing return on average equity demonstrates the strength of the Bank’s earnings power, reflecting the solid performance across businesses, reduced cost of funds and improving efficiency.
MeasurementProfit attributable to shareholders of the Group divided by monthly average total equity attributable to shareholders of the Group. Total equity attributable to shareholders is made up of share capital, additional paid-in capital, treasury shares, retained earnings and other reserves.
OutlookWe aim to deliver diversified revenue growth and a return on average equity of c. 20% over the medium term.
DescriptionThe significant improvement in the cost to income ratio over the past two years was a result of profitable growth and growing efficiencies throughout the business with costs increasing at considerably lower rates compared to revenue growth (2012: 5.2% cost growth compared to 21.9%* revenue growth).
MeasurementOperating expenses divided by revenue.
OutlookWe are well-positioned to continue benefiting from economies of scale, supported by the roll-out of Express Banking, and to keep delivering positive operating leverage over the medium term.
* Adjusted for one-off gain from BYR hedge in 2011
Return on average equity
20
0
10
5
1513.5%
18.3% 19.1%
201220112010
19.1%2011: 18.3%
Cost to Income Ratio
60
0
30
15
4557.4%
48.5%44.4%
201220112010
44.4%2011: 48.5%
Returns Efficiency
Overview: Key Performance Indicators (Summary)
Strong profitability and prudent capital management
Cost-efficiency through scale, earnings and result driven organisation
20 Bank of Georgia Holdings PLC Annual Report 2012

DescriptionThe improvement in the capital position came predominantly from strong internal capital generation. Strong capital generating capability allowed the Board to significantly increase the annual dividend recommendation for 2012 and to announce a dividend payout ratio of 25%-40% in 2013 and beyond.
MeasurementBIS Tier I Capital adequacy ratio: Tier I Capital divided by risk weighted assets; Total Capital adequacy ratio: Total Capital (sum of Tier I Capital and Tier II Capital less deductions from Capital) divided by risk weighted assets.
NBG Tier I Capital adequacy ratio: Tier I Capital divided by risk weighted assets; Total Capital adequacy ratio: Total Regulatory Capital (sum of Tier I Capital and Tier II Capital less deductions from Capital) divided by risk weighted assets.
OutlookContinue prudent capital management with the view of maintaining Tier I Capital ratio (BIS) of c.20%.
For more information on differences between IFRS and NBG Capital ratios see page 35.
Tier I Capital ratio
40
0
20
10
30
17.5%19.9% 22.0%
13.0%10.5%
13.8%
201220112010BIS NBG
22.0%2011: 19.9%
DescriptionThe growth of the net loan book over the last three years was a result of the Bank’s ability to successfully capitalise on the rapidly growing Georgian economy through its superior franchise, distribution channels and cross-selling networks. The loan book grew 18.2% in 2012 (19.2% in terms of US$, which is the issuing currency for the majority of loans).
MeasurementNet loans to customers and net finance lease receivables compared to the same period of the prior year.
OutlookAs we deliver strong income growth, we remain focused on achieving a double-digit growth of our loan book, without compromising asset quality to ensure that such growth is not achieved at the expense of future impairment.
Net loan portfolio growth
60
0
30
15
45 41.0%
10.6%18.2%
201220112010
18.2%2011: 10.6%
Growth Capital
For more information about the financial results see
Pg 28
Deliver long-term sustainable growth
Maintaining excellent capital position
Bank of Georgia Holdings PLC Annual Report 2012 21
OverviewPerform
anceGovernance
Financial Statements
Additional Information

Leveraging our offer for the long term
Irakli GilauriChief Executive Officer of Bank of Georgia Holdings
In 2012 your Company reported another record profit of GEL 179.6 million, an increase of 32.3% from the profit delivered by Bank of Georgia in 2011. This strong progress continues to reflect the strength of the Bank’s earnings power and resulted in a ROAE of 19.1%, up from 18.3%, and EPS growth of 17.6% to GEL 5.22, reflecting a strong business performance, significantly reduced cost of funds and improved efficiency across the business.
On 28 February 2012, Bank of Georgia Holdings started trading on the LSE Main Market and in June 2012 became a FTSE 250 constituent company. This has markedly improved the liquidity of your stock, positively affecting the price of BGEO LN, which grew 86.0% since the premium listing almost one year ago on the back of an average trading volume of approximately 103,000 shares per day (GBP 1.5 million). We have a well-diversified shareholder base which includes our long-time investors across various geographies and the addition of many new non-emerging markets focused institutional investors, who now make up approximately 15% of our investor base. As the Chairman mentions in his statement, we were particularly pleased with the recent successful placing of the East Capital private equity stake, with a diverse range of high quality institutional investors.
Performance: Chief Executive Officer’s statement
2012 was a momentous year for Georgia as well. Following the parliamentary elections in October 2012, we witnessed a democratic passing of power for the first time in the country’s history. The new government has asserted its commitment to improve further Georgia’s investor and business friendly policies and in December 2012 the newly-elected Parliament approved a well-balanced budget for 2013 that forecasts 6% real GDP growth, further improvements in general government debt ratios and a continuous focus on infrastructure sector development. In Q4 2012, the uncertainty in respect of the change of political leadership resulted in a relative slow-down of corporate business lending growth throughout the Georgian banking sector. While we may continue to see this trend of slower growth over the next few months, we have been encouraged by higher levels of business activity in the first few months of 2013.
Our revenue in 2012 totalled GEL 498.3 million, up 21.9% (revenue adjusted for a one-off currency hedge gain in 2011) compared to 2011. The significant increase in revenue was due to the robust performance of our businesses and the effects of our diversified sources of growth. Strong interest income was driven by growth in both the retail and corporate loan books, especially in the first nine months of the year. Fee income increased 14.8% to GEL 86.5 million, reflecting our leadership in money transmission payments and the superior fee generating capabilities of our Corporate Banking business. We enjoy an estimated 50% market share in card acquiring business in Georgia, have unmatched client reach through the largest network of ATMs and Express Pay terminals and American Express card exclusivity in Georgia. During 2012, Bank of Georgia launched contactless Express cards for the first time in Georgia, and further developed our Express cards and associated loyalty programmes that are unique in Georgia and increasingly serve as the metro, bus and mini-bus transportation payment systems. The Bank has also significantly enhanced its already market leading branch network, adding 30 Express branches to bring the total Express and Metro branches to 63, and also more than doubled the number of Express Pay terminals, which are increasingly being used for bank transactions such as credit card and consumer loan repayments, cash deposits, utility bill payments and mobile telephone top up payments.
Our Insurance and Healthcare businesses, which had an eventful year in terms of M&A activity, contributed 11.0% to the consolidated revenue and 8.7% to the consolidated profit and is becoming an increasingly meaningful source of the Bank’s income.
22 Bank of Georgia Holdings PLC Annual Report 2012

Our affordable housing business successfully completed its pilot project, contributing GEL 15.5 million to the mortgage loan book and m2 Real Estate, our real estate subsidiary, realised a profit of GEL 1.7 million. Non-interest income amounted to 43.0% of revenue, an achievement that is particularly striking compared to four years ago, when this ratio stood at 34.3%.
We have become more efficient. For the past five quarters we have consistently delivered strong positive operating leverage, as our operating costs have regularly increased at only half the rate of our revenue growth. Several factors behind this achievement are described below.
We successfully strengthened and expanded further our retail franchise through our Express Banking strategy, which entails the rollout out of cost-efficient small-sized express branches, avoiding the need to build costly flagship branches, to continue to serve our ever-increasing client base. With Express Banking in place, we have pushed further the ongoing shift to transactional banking by means of a wide-range of electronic channels, away from regular or flagship branches, which are now focusing on selling more value-added products and services. We have continued to invest in IT to minimise and, in certain cases, eliminate document flow, and stepped-up optimisation of the centralised retail banking back office. These developments coupled with the ongoing cost control measures that we already have in place, have resulted in a substantial improvement in the Retail Banking cost to income ratio to 44% from 51% last year while the Corporate Banking cost to income ratio improved to 33% from 43% in 2011. The increasing benefits we are delivering from these improved efficiencies are expected to underpin further improvements in our cost to income ratio over the next few years. It has been a rewarding and exciting experience to observe the effects of economies of scale.
Credit quality has continued to be robust, albeit the cost of credit risk was at the top end of our expected range, increasing by GEL 22.5 million to GEL 44.7 million, or 1.3% of the loan book. This largely reflected the absence of last year’s releases and recoveries, and an increase in the Retail Banking impairment charge as a result of the job reductions made by a large payroll client during the first half of the year. We did however see an increase in corporate provisions in the fourth quarter, reflecting the impact of a provision of GEL 14.2 million relating to one single corporate credit. This was offset however by the impact of the 2008 and 2009 stress years dropping out of our Retail Banking provision methodology.
Buttressing the Chairman’s comments in his letter, I would also like to highlight the excellent progress we have made against our liability management objectives. Throughout the year we have consistently sought to optimise our funding structure and cost base. Our strong branding and pre-eminence in the retail segment has enabled aggressive deposit pricing on the back of the Bank’s growing retail deposit base, while the more competitive corporate environment led to the outflow of expensive Lari corporate deposits, allowing us to replace them with less-costly long-term international borrowing. The funding profile of Corporate Banking has improved markedly as the Corporate Banking cost of deposits declined to a historic low of 6.2% in the fourth quarter of 2012, also benefiting from superior access to trade finance lines, which provides substantially cheaper long-term
funding. Overall, the Bank’s cost of funds decreased to 7.3% from 8.0% last year, and was as low as 6.6% in the fourth quarter of 2012.
In 2013, we do not expect any changes to the fundamentals of our business strategy. We intend to continue to focus on the Georgian market, with Retail Banking and Corporate Banking driving profitability. The full effects of our recent scaling up of the business are still to be realised, as more customers shift to electronic channels. The introduction of a sophisticated CRM system will enhance product penetration and boost revenues per client, thus further improving our efficiency.
In Corporate Banking we intend to expand our export and trade finance businesses and to build on our strong fee generating capabilities, supported by research and advisory services. We are set to build our regional asset management business on the currently of assets under management US$365.3 million-strong wealth management platform.
The potential health insurance reform in Georgia, the structure of which is still under consideration, envisages the provision of basic healthcare coverage for the entire Georgian population in addition to existing state-subsidised socially vulnerable groups. We expect these reforms to be a positive factor for the healthcare revenues of Aldagi BCI, the country’s leading healthcare provider.
While we are pleased with our progress in cost optimisation in 2012, we see lots of opportunities to further improve efficiency and to ensure that our costs continue to increase at a lower rate than our revenue growth. In 2013, we will be vigilant of our asset quality and continue to enhance our risk management practices.
At the end of December 2012, the Bank’s Total Capital ratio, on a Basel I basis, was 27.0% and the Tier I Capital ratio was 22.0%. This reflects a very strong capital position with capital ratios significantly exceeding the Bank’s minimum capital requirements. The Group is well positioned to improve its performance in 2013 and this, combined with continued strong profitability and capital ratios, has led the Board to review the Group’s dividend policy. The Board has decided to recommend an annual dividend of GEL 1.5 per share payable in British Sterling at the prevailing rate subject to approval by shareholders at the AGM. This represents a significant increase of 114.3%, compared to the annual dividend of GEL 0.70 per share last year, a payout ratio of 28.7% and a dividend yield for shareholders of 5.5%, calculated based on the Group’s 2012 results and using the 31 December 2012 share price of GBP 10.30. Going forward, the Board will aim to maintain a dividend payout ratio in the 25%-40% range.
The success of the Group continues to be built on the strong contributions of thousands within the management and employee teams, and I am grateful for all their efforts and achievements during 2012. Their consistently superior work over the last few years has, I am confident, positioned Bank of Georgia to continue to perform strongly in the future, as the leading bank in Georgia.
Irakli GilauriChief Executive Officer of Bank of Georgia Holdings10 April 2013
Bank of Georgia Holdings PLC Annual Report 2012 23
OverviewPerform
anceGovernance
Financial Statements
Additional Information

Performance: Key performance indicators
Net interest margin is calculated as net interest income divided by monthly average interest earning assets. Interest earning assets include: amounts due from credit institutions, debt securities and net loans to customers and net finance lease receivables.
Net Interest Margin
12
0
6
3
9 8.8%7.8% 7.9%
201220112010
7.9%2011: 7.8%
Profit before income tax expense is calculated in accordance with IFRS and represents revenue less operating expenses, cost of credit risk and net non-operating expenses.
Pro�t before income tax GEL million
250
0
150
100
50
200
98.4
172.1
212.8
201220112010
212.82011: 172.1
Profit attributable to shareholders divided by monthly average total equity attributable to shareholders. Total equity attributable to shareholders is made up of share capital, additional paid-in capital, treasury shares, retained earnings and other reserves.
Return on average equity
20
0
10
5
1513.5%
18.3% 19.1%
201220112010
19.1%2011: 18.3%
A strong performance
Returns measures:Returns KPIsThe strength of the Group’s banking franchise and continuous diversification of revenue sources is reflected in the 2012 ROAE of 19.1%, an increase from 18.3% in 2011 and the 17.6% increase in EPS to GEL 5.22 at the end of the year. Net Interest Margin (“NIM”) remains robust, which is a result of the decrease in cost of funds following targeted liability management during the year. The healthy growth of the loan book, increasing share of non-interest income, strong margins and improving cost efficiency translated into 23.7% growth in Profit before Income Tax (“PBT”), one of the primary profitability measures used by management to assess the performance of the Group. Strong capital generation of the Group, prompted the Board to recommend a 114% increase in dividend payment to GEL 1.5 equivalent in GBP per share for 2012 (2011: GEL 0.7).
In 2013 and beyond, we will continue to focus on the profitable earnings growth, to be driven by good levels of customer lending growth without compromising asset quality, an increase in the share of non-interest income in the revenue as we grow fee generating businesses and expand our insurance and healthcare operations.
24 Bank of Georgia Holdings PLC Annual Report 2012

For more information about our performance see
Pg 28
* The following GEL/GBP exchange rates are used for presenting GBP amounts: 2012: GEL 2.5189/GBP as of 31 March 2013, 2011: GEL 2.5626/GBP as of 25 June 2012, the currency conversion date for the year 2011; 2010: GEL 2.7393/GBP as of 31 December 2010 for the presentation purposes (2010 dividends were paid in GEL to shareholders of Bank of Georgia).
Dividends per share, GEL*
2.0
0
1.0
0.5
1.5
0.300.11
0.70
0.27
1.50
0.60
201220112010GEL GBP
1.502011: 0.70
Operating expenses divided by revenue.
Cost to Income Ratio
60
0
30
15
4557.4%
48.5%44.4%
201220112010
44.4%2011: 48.5%
Profit attributable to shareholders divided by weighted average number of outstanding shares.
EPS, GEL per share
6.0
0
3.0
1.5
4.5
2.78
4.445.22
201220112010
5.222011: 4.44
Efficiency KPIsThe Cost to Income ratio has been steadily improving over the last three years as a result of ongoing cost efficiency measures undertaken by the Bank. These measures have, among others, included various investments in IT aimed at optimisation of workflow processes, as well as the introduction of a new Express Banking model, which has given a boost to cost efficient transactional banking by using electronic channels. On the flip side, revenue grew at a rate of more than four times the rate of cost growth (21.9%* compared to 5.2%), as a result of robust growth across all business segments of the Group, including its insurance and healthcare businesses.
Positive operating leverage is one of the key execution priorities for the management in order to ensure that revenues increase at a faster rate than costs on an ongoing basis.
* Adjusted for a one-off gain from BYR hedge in 2011.
Returns measures:
Efficiency measures:
Bank of Georgia Holdings PLC Annual Report 2012 25
OverviewPerform
anceGovernance
Financial Statements
Additional Information

Performance: Key performance indicators continued
Net loans to customers and net finance leases receivables divided by amounts due to customers and DFIs.
Net Loan to customer fundsand DFIs
100
0
50
25
75
91.2%79.1%
91.9%
201220112010
91.9%2011: 79.1%
Net loans to customers and net finance leases receivables at the end of the period compared to the same period of the prior year.
Net loan portfolio growth
60
0
30
15
45 41.0%
10.6%18.2%
201220112010
18.2%2011: 10.6%
Operating leverage is measured as percentage change in revenue less percentage change in operating expenses. For 2011, the revenue has been adjusted for the one-off currency gain from the BYR in the amount of GEL 25.1 million.
Operating leverage
25
0
10
5
20
1515.3%
12.4%
16.7%
201220112010
16.7%2011: 12.4%
Growth measures:
Growth KPIs The loan book growth was driven by strong lending momentum in both the retail and corporate businesses, which saw a 10.4% and 23.1% growth in lending, respectively. The demand for corporate lending has been subdued in the fourth quarter of 2012 and beginning of 2013, however a pick-up in corporate lending is expected to take place in the second half of the year and to contribute to the double digit growth of net loan book over the medium term.
The strong funding position allowed us to comfortably finance the loan book growth while decreasing funding costs. We ended 2012 with a strong liability structure, with client deposits accounting for 57.1% of liabilities and the loan to deposit and Developmental Financial Institutions (“DFIs”) ratio at comfortable level of 91.9%.
26 Bank of Georgia Holdings PLC Annual Report 2012

Leverage is calculated as total liabilities divided by total equity.
Leverage (times)
8.0
0
4.0
2.0
6.04.8 4.7 4.3
201220112010
4.32011: 4.7
BIS Total Capital adequacy ratio: Total Capital (sum of Tier I Capital and Tier II Capital less deductions from capital) divided by risk weighted assets.
NBG Total Capital adequacy ratio: Total regulatory capital (sum of Tier I Capital and Tier II Capital less deductions from capital) divided by risk weighted assets.
Total Capital Ratio
26.6% 28.5% 27.0%
14.5% 16.2% 16.2%
40
0
20
10
30
201220112010BIS NBG
27.0%2011: 28.5%
For more information on BIS and NBG Capital ratios please see
Pg 35
Capital KPIsWe further strengthened our capital position as reflected in the robust Tier I Capital (BIS) ratio of 22.0%. The improvement in the capital position came from strong capital generation on the back of increasing risk weighted assets. Strong capital generating capability allowed us to increase the annual dividend payment for 2012 and to announce that BGH targets a dividend payout of between 25%-40% range going forward, subject to market conditions and the Group’s performance. Risk weighted assets increased 24.6%, reflecting the increase in interest earning assets during the year, while Tier I Capital (BIS) increased by 37.8%, as a result of higher retained earnings and the conversion of the European Bank for Reconstruction and Development (“EBRD”) and International Finance Corporation (“IFC”) subordinated and convertible loans into Bank of Georgia’s equity, subsequently acquired by BGH upon the completion of the Tender Offer. In 2013 and beyond, we intend to maintain strong capital ratios, well above the regulatory requirements.
BIS Tier I Capital adequacy ratio: Tier I Capital divided by risk weighted assets.
NBG Tier I Capital adequacy ratio: Tier I Capital divided by risk weighted assets.
Tier I Capital ratio
40
0
20
10
30
17.5%19.9% 22.0%
13.0%10.5%
13.8%
201220112010BIS NBG
22.0%2011: 19.9%
Capital measures:
Bank of Georgia Holdings PLC Annual Report 2012 27
OverviewPerform
anceGovernance
Financial Statements
Additional Information

Performance: Business review – Overview of financial results
Overview of Financial Results
Highlights and achievements in 2012 – Disciplined execution of the Group’s strategy translating into a consistently strong earnings performance during the period
– Delivered strong profitability, with stable Net Interest Margin at 7.9%; reduced cost of funds 7.3% (2011: 8.0%), ROAA of 3.5% and ROAE of 19.1%
– Well-diversified revenue base, with non-interest income increasing by 26.4%*, accounting for 43% of total revenues
– Positive operating leverage maintained with costs growing at less than half growth rate compared to revenue as the Bank continues to invest in the business growth; Cost to Income ratio improved to 44.4% (2011: 48.5%)
– Prudent approach to risk management resulting in good credit quality across the businesses
– Robust, conservative balance sheet, with strong liquidity and well-diversified funding sources as liquid assets accounted for 28.7% of total assets and 58.6% of liabilities came from customer funds and 14.6% from DFIs
– Strong capital position maintained with Tier I Capital Ratio of 22.0%
– Strong performances from the Bank’s businesses in Georgia, mainly attributed to the growth and improved efficiencies of Retail Banking and Corporate Banking
– Excellent progress in developing synergistic businesses: Insurance and Healthcare businesses contributed 11.0% to the Group’s revenue; Affordable Housing reported its first profit.
Priorities for 2013 – We aim to continue the disciplined execution of our strategy, focusing on the growing Georgian market through further developing our core businesses of Retail Banking (particularly payment systems), Corporate Banking and Asset and Wealth Management and grow further our non-interest income through maximising potential of synergistic businesses, such as the Insurance and Healthcare businesses of Aldagi BCI and affordable housing projects
– We aim to continue to maintain positive operating leverage
– We aim to decrease our cost of funds
– We are committed to continue our prudent capital management to deliver a 20% return on average shareholders’ equity, and a Tier I Capital Ratio of 20% under Basel I, on the back of growth of our businesses. We have announced our intention to pay annual dividends in the range of 25-40% to our shareholders
* Excluding the effect of foreign currency gain from the BYR hedge in 2011.
7.9%Stable Net Interest Margin
26.4%*Increase of non-interest income
44.4%Cost to income ratio
22.0%Tier I Capital ratio
28 Bank of Georgia Holdings PLC Annual Report 2012

Consolidated results discussionThe following discussion may not contain all the information that is important to readers of this Annual Report. The entirety of this Annual Report should be read for a more complete understanding of the events, risks and uncertainties affecting the Group, including liquidity, market, credit and operational risks.
Consolidated summary income statementYear ended
Income Statement Summary31 December
201231 December
2011 Change
GEL thousands, unless otherwise noted
Net interest income 284,117 239,285 18.7%Net non-interest income 214,138 194,468 10.1%Revenue 498,255 433,753 14.9%Operating expenses (221,152) (210,165) 5.2%Operating income before cost of credit risk 277,103 223,588 23.9%Cost of credit risk (44,717) (22,196) 101.5%Net operating income 232,386 201,392 15.4%Net non-operating expense (19,634) (29,338) -33.1%Net loss from discontinued operations – (15,219) -100.0%Profit 179,552 135,710 32.3%
Selected Financial StatisticsBasic Earnings Per Share 5.22 4.44ROAA (Return on average assets) 3.5% 3.2%ROAE (Return on average equity) 19.1% 18.3%Dividends per ordinary share, GEL 1.50 0.70
GEL/US$ exchange rate, period end 1.6567 1.6703GEL/GBP exchange rate, period end 2.6653 2.5776
OverviewFor the year ended 31 December 2012, the Group delivered a profit of GEL 179.6 million, an increase of 32.3% against the profit for the year ended 31 December 2011. This strong progress continues to reflect the strength of the Bank’s earnings power and resulted in a return on average equity of 19.1%, which is an increase from 18.3% for 2011, and earnings per share growth of 17.6% to GEL 5.22 per share, reflecting a strong business performance, significantly reduced cost of funding and improved efficiency across the business.
RevenueThe Group maintained strong growth momentum across all main revenue items in 2012, delivering record revenue of GEL 498.3 million, a 14.9% increase compared to 2011. Adjusted for the impact of the last year’s one-off BYR currency hedge gains, total revenue increased by 21.9% compared to 2011.
The key driver of this solid revenue growth was net interest income, which increased by 18.7% to GEL 284.1 million. Net interest income before interest rate swaps grew 22.0% to GEL 285.8 million, a result of healthy growth of the consolidated loan book, largely stable loan yields (2012: 17.5%; 2011: 17.6%) and reduced funding costs (2012: 7.3%; 2011: 8.0%).
Bank of Georgia Holdings PLC Annual Report 2012 29
OverviewPerform
anceGovernance
Financial Statements
Additional Information

Performance: Business review – Overview of financial results continued
Net Interest MarginYear ended
GEL thousands, unless otherwise noted31 December
201231 December
2011 Change
Net interest income 284,117 239,285 18.7%Net Interest Margin 7.9% 7.8% 1.3%
Average interest earning assets 3,614,921 3,082,850 17.3%Average interest bearing liabilities 3,904,874 3,292,724 18.6%Average customer funds outstanding 2,772,597 2,217,275 25.0%
Monthly averages are used for calculation of average interest-earning assets, average interest bearing liabilities and average customer funds.
The Group’s NIM for the year ended 31 December 2012 remained broadly flat at 7.9% compared to 31 December 2011, reflecting the loan book growth, reduced cost of funding due to deposit rate cuts and repayment of costly international borrowings, which more than offset the impact of the carrying cost of the Eurobond issued in July 2012 and the increase of average customer funds outstanding in 2012 compared to 2011.
Net non-interest incomeYear ended
GEL thousands, unless otherwise noted31 December
201231 December
2011 Change
Net fee and commission income 86,487 75,337 14.8%Net insurance revenue 34,138 17,738 92.5%Net healthcare revenue 23,346 2,458 NMFOther operating non-interest income* 70,167 73,879 -5.0%Net non-interest income excluding one-off gain from BYR hedge 214,138 169,412 26.4%Gain from BYR hedge – 25,056 -100.0%Net non-interest income 214,138 194,468 10.1%
* Other operating non-interest income includes net gains from foreign currencies, net revenue from sale of goods of the Group’s non-banking subsidiaries and other operating income of the Group.
In a positive shift towards diversifying revenue sources, net non-interest income (excluding the effects of one-off gains from the BYR currency hedge in 2011) grew 26.4% in 2012, boosted by the net insurance and net healthcare revenues, a result of a combination of organic growth and acquisitions by Aldagi BCI, the Group’s insurance and healthcare subsidiary. Net insurance revenue almost doubled to GEL 34.1 million, net healthcare revenue grew nearly tenfold to GEL 23.3 million. The two businesses together contributing 11.0% to the consolidated revenue in 2012, compared to 4.7% in 2011.
An increase in the level of economic activity in 2012 had a positive effect on the activity of the Group’s clients across all lines of settlement operations, including the Group’s card business operations, guarantees and letters of credit and cash operations. The growth of our Express Banking service, through which the Group delivers extremely cost-effective self-service transactional and remote banking facilities, has supported strong growth in banking operations. As a result, net fee and commission income grew 14.8% to GEL 86.5 million in 2012.
Other operating non-interest income, adjusted for one-off gains from the Belarusian Ruble currency hedge, decreased 5.0% to GEL 70.2 million, as a result of a 3.5% decline in net gain from foreign currencies reflecting the slowdown in economic activity in the second half of 2012 and a 4.4% decrease in other operating income. Affordable Housing and the Group’s non-core segments contributed GEL 4.4 million and GEL 9.6 million respectively to other operating income in 2012. Overall, other operating non-interest income declined by 29.1% year-on-year, due to the one-off gain of GEL 25.1 million on the BYR currency hedge in 2011.
Net non-interest income amounted to 43.0% of total revenue compared to 41.5% in 2011 (excluding the one-off gains from BYR hedge in 2011).
30 Bank of Georgia Holdings PLC Annual Report 2012

Net operating income, cost of credit risk, profit for the periodYear ended
GEL thousands, unless otherwise noted31 December
201231 December
2011 Change
Salaries and other employee benefits (122,556) (114,622) 6.9%General and administrative expenses (67,041) (61,942) 8.2%Depreciation and amortisation expenses (28,606) (27,254) 5.0%Other operating expenses (2,949) (6,347) -53.5%Operating expenses (221,152) (210,165) 5.2%
Operating income before cost of credit risk 277,103 223,588 23.9%
During 2012, the Group’s operating expenses increased by 5.2% to GEL 221.2 million, significantly lagging behind the revenue growth rate of 14.9%. Adjusted for the one-off BYR hedge gain in 2011, operating leverage was 16.7% in 2012. The increase in expenses primarily reflected a 6.9% increase in salaries and other employee benefits as a result of the Group’s headcount growth to service the Group’s increased revenue base over the course of 2012. General and administrative expenses for the reporting period grew by 8.2% to GEL 67.0 million, which included expenditure on new branches, distribution channels such as ATMs and Express Pay terminals, and marketing costs. The cost to income ratio improved further to 44.4% in 2012 from 48.5%, benefiting from ongoing cost efficiency measures undertaken by the Group. When adjusted for the one-off revenue gains in 2011, the cost to income ratio improved substantially from 51.4% adjusted for Belarusian Ruble hedge gains to 44.4%, reflecting significant underlying cost efficiency improvements.
The Group’s operating income before the cost of credit risk increased by 23.9%, to GEL 277.1 million.
Cost of credit riskYear ended
GEL thousands, unless otherwise noted31 December
201231 December
2011 Change
Impairment charge on loans to customers (39,186) (23,216) 68.8%Impairment charge on finance lease receivables (495) (317) 56.2%Impairment reversal (charge) on other assets and provisions (5,036) 1,337 NMFCost of credit risk (44,717) (22,196) 101.5%
Net operating income 232,386 201,392 15.4%
The cost of credit risk increased by GEL 22.5 million to GEL 44.7 million in 2012, reflecting the absence of the previous year’s recoveries, the increase in the Retail Banking impairment charge as a result of job reductions made in a large payroll client during the first half of 2012 and the increase in the Corporate Banking cost of risk in the second half of 2012, predominantly due to provisions attributed to a single corporate client in the fourth quarter of 2012. In the fourth quarter of 2012, the Group recognised an impairment charge of GEL 14.2 million (increasing respective allowance for losses to 50% of total balance sheet exposure) in respect to one of the larger corporate clients of the Group in the infrastructure sector, with a total exposure of GEL 58.8 million, of which GEL 36.2 million comprises a loan and GEL 22.6 million off-balance sheet guarantee. Bankruptcy procedures have been initiated against the borrower, and while the Group expects to be able to recover the un-provisioned amount of the loan from the borrower’s assets (including pledged collateral) in the bankruptcy proceeding it will continue to assess objective evidence of further impairment of the overall exposure in 2013. These factors, which negatively affected the cost of risk, were partially offset by the effects of a change in the collective assessment methodology.
The loss experience used to determine the appropriate collective assessment rates was changed from seven years to three years in Retail Banking in 2012. As a result of the foregoing, in 2012 cost of risk amounted to 1.3%, compared to 0.9% in 2011. The allowance for loan impairment was GEL 110.5 million or 3.5% of total gross loans as at 31 December 2012, compared to 4.2% as at 31 December 2011.
The Group’s Non-performing loans (“NPLs”) increased to GEL 126.3 million as at 31 December 2012 from GEL 100.3 million a year earlier, reflecting the addition of the above-mentioned corporate client. NPLs are defined as the principal and interest on loans overdue for more than 90 days and any additional losses estimated by Execuitve Management. The Bank’s NPLs to total gross loans ratio was 3.9% as at 31 December 2012, an increase from 3.7% in 2011, while NPL coverage ratio, including discounted value of collateral was 87.5% at 31 December 2012. NPL coverage ratio excluding discounted value of collateral was 110% at 31 December 2012.
Bank of Georgia Holdings PLC Annual Report 2012 31
OverviewPerform
anceGovernance
Financial Statements
Additional Information

Performance: Business review – Overview of financial results continued
The Bank’s net operating income totalled GEL 232.4 million, a 15.4% increase compared to 2011. Adjusted for the one-off gain in 2011, net operating income in 2012 increased 31.8% compared to 2011.
Profit before income tax expense and ProfitYear ended
GEL thousands, unless otherwise noted31 December
201231 December
2011 Change
Net non-operating expenses (19,634) (29,338) -33.1%Profit before income tax expense 212,752 172,054 23.7%
Income tax expense (33,200) (21,125) 57.2%Profit from continuing operations 179,552 150,929 19.0%
Net loss from discontinued operations – (15,219) -100.0%
Profit 179,552 135,710 32.3%
In 2012, the Bank’s net non-operating expenses declined to GEL 19.6 million from GEL 29.3 million in 2011. The non-operating expenses in 2012 were largely incurred for the purposes of the Tender Offer and premium listing.
As a result of the foregoing, profit before income tax from continuing operations in 2012 totalled GEL 212.8 million, an increase of GEL 40.7 million, or 23.7%, compared to 2011. After income tax expense of GEL 33.2 million, the Group’s profit for the period was GEL 179.6 million, an increase of GEL 28.6 million, or 19.0%, while profit for the period adjusted for the net loss from discontinued operations in 2011 increased 32.3% to GEL 179.6 million compared to 2011.
Balance sheet overviewYear ended
GEL thousands, unless otherwise noted31 December
201231 December
2011 Change
Cash and cash equivalents 762,827 628,731 21.3%Amounts due from credit institutions 396,559 289,530 37.0%
Investment securities 463,960 419,576 10.6%Loans to customers and finance lease receivables 3,092,320 2,616,361 18.2%Investments in associates 2,441 3,014 -19.0%Investment property 160,353 101,686 57.7%Property and equipment 430,877 348,110 23.8%Goodwill 45,657 46,195 -1.2%Other assets* 300,601 212,058 41.8%Total assets 5,655,595 4,665,261 21.2%
Amounts due to customers, of which: 2,693,025 2,735,222 -1.5% Client deposits 2,622,911 2,554,084 2.7% Promissory notes issued 70,114 181,138 -61.3%Amounts due to credit institutions 1,657,162 921,172 79.9%Other liabilities** 245,896 196,264 25.3%Total liabilities 4,596,083 3,852,658 19.3%
Total equity attributable to shareholders of the Group 1,011,074 772,530 30.9%Non-controlling interests 48,438 40,073 20.9%Total equity 1,059,512 812,603 30.4%Total liabilities and equity 5,655,595 4,665,261 21.2%
Loan yield 17.5% 17.6%Cost of funds 7.3% 8.0%Cost of client deposits 7.3% 7.6%Liquid assets as percent of total assets 28.7% 28.7%Liquid assets as percentage of total liabilities 35.3% 34.8%NBG liquidity ratio 41.1% 37.8%Leverage (times) 4.3 4.7
* Includes intangible assets, income tax assets, prepayments and other assets.** Includes income tax liabilities, provisions and other liabilities.
32 Bank of Georgia Holdings PLC Annual Report 2012

As at 31 December 2012, the Group’s total assets were GEL 5,655.6 million, an increase of 21.2% compared to 31 December 2011. The annual growth in total assets reflects a strong growth in net loan book, which increased by GEL 476.0 million or 18.2% compared to 2011. On a constant currency basis, the net loan book grew by 19.2% compared to 2011.
The Group’s liquid assets, which comprise high quality assets including NBG certificates of deposit, Georgian government treasury bills and bonds and interbank deposits and cash and cash equivalents, grew by 21.3% to GEL 1,624.3 million at 31 December 2012. The funds raised as a result of the Eurobond issuance by Bank of Georgia in July 2012 contributed to the significant increase in the liquidity pool.
The growth of the Group’s loan book during the course of 2012 was driven by a 10.4% increase in Retail Banking lending to GEL 1,348.3 million and a 23.1% increase in Corporate Banking lending to GEL 1,696.3 million. Approximately 87.1% of the Group’s loan book was collateralised as of 31 December 2012 (2011: 85.0%). Loans denominated in foreign currencies (primarily in US dollars) accounted for 68.3% of the Group’s net loan book as at 31 December 2012, compared to 69.6% as at 31 December 2011.
Total liabilities Total liabilities amounted to GEL 4,596.1 million, an increase of 19.3% in 2012, driven by the growth in borrowed funds, which increased 42.0% to GEL 1,225.8 million as a result of the Eurobond issued in July 2012. The Group’s average customer funds grew 25.0% to GEL 2,772.6 million during 2012, while the deposit rate cuts during the course of 2012 led to a reduction of the more costly GEL denominated deposit base, decreasing customer funds to GEL 2,693.0 million as at 31 December 2012, a 1.5% decrease compared to 31 December 2011. Client deposits denominated in foreign currency accounted for 68.7% of the Group’s total client deposits as at 31 December 2012 (2011: 59.1%).
Shareholders’ equityTotal equity amounted to GEL 1,059.5 million, a 16.3% increase since 28 February 2012, when Bank of Georgia Holdings acquired 98.3% of the entire issued capital of Bank of Georgia as a result of the Tender Offer which was completed in February 2012. Total equity increased by GEL 246.9 million compared to Bank of Georgia’s total equity as at 31 December 2011, the increase reflecting the inclusion of the current year’s profit and the conversion of loan notes by EBRD and IFC into equity in February 2012. (See Notes 18 and 20 of the accompanying Consolidated Financial Statements).
The Group’s book value per share on 31 December 2012 was GEL 30.33 (US$18.31/£11.38) and GEL 25.98 (US$15.55/£10.08) as at 31 December 2011.
Liquidity, funding and capital managementYear ended
GEL thousands, unless otherwise noted31 December
201231 December
2011 Change
Amounts due to credit institutions, of which: 1,657,162 921,172 79.9% Borrowed funds 1,225,793 863,004 42.0% Inter-bank loans and deposits 431,369 58,168 NMFCustomer funds 2,693,025 2,735,222 -1.5% Client deposits 2,622,911 2,554,084 2.7% Promissory notes 70,114 181,138 -61.3%Net Loans/Customer Funds 114.8% 95.7%Net Loans/Customer Funds and DFIs 91.9% 79.1%Liquid assets 1,624,317 1,338,952 21.3%
Liquid assets as percentage of total assets 28.7% 28.7%Liquid assets as percentage of total liabilities 35.3% 34.8%NBG liquidity ratio 41.1% 37.8%
The Bank continues to maintain a strong liquidity position, considerably in excess of the NBG’s conservative regulatory requirements. The liquidity ratio, as per requirements of the NBG, was 41.1% against the required minimum of 30%, while liquid assets, comprised of cash and cash equivalents, investment securities consisting of NBG certificates of deposit, government treasury bills and bonds and interbank deposits accounted for 28.7% of total assets and 35.3% of total liabilities as at 31 December 2012.
Bank of Georgia Holdings PLC Annual Report 2012 33
OverviewPerform
anceGovernance
Financial Statements
Additional Information

Performance: Business review – Overview of financial results continued
The composition of the Bank’s balance sheet reflects its aim to maintain a diversified funding base, while optimising funding costs. Customer lending was largely funded by customer deposits, as the increase of the average client loans by GEL 441.9 million in 2012 compares to the increase of average customer funds by GEL 555.3 million. The strong trend of client deposit inflows in the first half of 2012 was reversed in the second half of 2012, as reduced deposit pricing led to lower customer account balances of corporate clients in particular in the fourth quarter of 2012. The targeted deposit repricing resulted in the further reduction in the cost of client deposits to 7.3% in 2012 from 7.6% in 2011.
The change in the funding structure also reflected the issuance of the five-year Eurobond in July 2012, which accounted for 34.3% of the borrowed funds and 9.2% of total liabilities. Long-term lending from DFIs accounted for 54.9% of the Bank’s borrowed funds and 14.6% of total liabilities, translating into good quality long-term less expensive funding source for the Group.
Reflecting the continued discipline with deposit pricing, the cost of client deposits declined from 7.6% in 2011 to 7.3% in 2012. Cost of funds from credit institutions decreased by 161 basis points to 7.2% in 2012, largely as a result of repayment of costly international borrowings. As a result of targeted liability management during the year, Cost of funds declined from 8.0% in 2011 to 7.3% in 2012. Net loans to customer funds and long-term DFI funding ratio was 91.9% as at 31 December 2012 (2011: 79.1%), while net loans to customer funds ratio was 114.8% (2011: 95.7%).
Capital Adequacy (BIS)Year ended
GEL thousands, unless otherwise noted31 December
201231 December
2011 Change
Ordinary shares 36,513 32,878 11.1%Share premium 608,546 473,732 28.5%Retained earnings 408,538 257,767 58.5%Tier I Capital 1,053,597 764,377 37.8%General loan loss provisions 59,823 47,993 24.6%Revaluation reserves 13,717 14,478 -5.3%Subordinated debt 211,591 317,830 -33.4%Tier II Capital 285,132 380,301 -25.0%Deductions from capital (46,121) (49,341) -6.5%Total Capital 1,292,608 1,095,337 18.0%Risk-weighted assets 4,785,870 3,839,462 24.6%Tier I Capital adequacy ratio (BIS) 22.0% 19.9%Total Capital adequacy ratio (BIS) 27.0% 28.5%
The Bank ended 2012 with an extremely strong capital position with robust Tier I Capital ratio (BIS) of 22.0%. This is a further improvement from the 19.9% Tier I Capital of the Group in 2011.
Risk-weighted assets increased 24.6% to GEL 4,785.9 million, reflecting the increase in interest earning assets during 2012, while Tier I Capital (BIS) increased by GEL 289.2 million, due to the generated retained profits and the conversion of the EBRD and IFC subordinated and convertible loans into Bank of Georgia’s equity, subsequently acquired by BGH upon the completion of the Tender Offer. Total Capital resources increased by GEL 197.3 million.
34 Bank of Georgia Holdings PLC Annual Report 2012

Regulatory Capital and Capital Adequacy (NBG) Year ended
GEL thousands, unless otherwise noted31 December
201231 December
2011 Change
Ordinary shares 36,049 29,731 21.2%Share premium 555,903 460,737 20.7%Retained earnings 188,749 62,836 200.4%Less: Intangible Assets (40,821) (41,066) -0.6%Tier I Capital 739,880 512,238 44.4%Current year profit 134,349 152,835 -12.1%General loan loss provisions 63,827 54,871 16.3%Subordinated debt 191,509 256,119 -25.2%Tier II Capital 389,685 463,825 -16.0%Deductions from capital (262,616) (184,323) 42.5%Total Capital 866,949 791,740 9.5%Risk-weighted assets 5,352,187 4,872,931 9.8%Tier I Capital adequacy ratio (NBG) 13.8% 10.5%Total Capital adequacy ratio (NBG) 16.2% 16.2%
Per NBG, the Bank ended 2012 with a very strong capital position with robust Tier I Capital ratio of 13.8%, as opposed to the minimal 8% required by NBG. This is a further improvement from the 10.5% Tier I Capital ratio of the Bank in 2011. Tier I Capital increased by GEL 227.6 million, due to the generated retained profits and due to the conversion of the EBRD and IFC subordinated and convertible loans into the Bank’s equity. Total Capital per NBG increased by GEL 75.2 million, affected by a decline in subordinated debt due to repayments.
Risk weighted assets increased by 9.8% to GEL 5,352.2 million, reflecting the increase in interest earning assets.
Among other differences between BIS and NBG capital regulations, the key ones are summarised below:
– BIS is based on Group consolidated audited IFRS numbers, while NBG is based on Bank standalone unaudited numbers per NBG standards;
– Per NBG standard, 175% total risk weighting (including both credit risk and market risk) is applied to loans denominated in foreign currency (with an exception for export-related income of a borrower), while a maximum of 100% total risk weighting is applied to such loans under Basel.
– Current year profit per the NBG is part of Tier II Capital and moves to Tier I Capital at the start of the next year, while per BIS current year profit is part of total retained earnings and, therefore, included in Tier I of current year.
Bank of Georgia Holdings PLC Annual Report 2012 35
OverviewPerform
anceGovernance
Financial Statements
Additional Information

Share in the Group’s revenue*
*Excludes inter-segment eliminations.
49%Retail Banking
Performance: Segment discussions
Financial performanceYear end
GEL thousands, unless otherwise noted
31 Dec2012
31 Dec2011 Change
Net interest income 174,360 144,396 20.8%
Net fee and commission income 53,563 49,512 8.2%
Net gain from foreign currencies 14,985 12,992 15.3%
Other operating non-interest income 3,365 3,996 -15.8%
Revenue 246,273 210,896 16.8%
Operating expenses (109,041) (107,936) 1.0%
Operating income before cost of credit risk 137,232 102,960 33.3%
Cost of credit risk (12,482) 2,575 NMF
Net non-operating expense (6,828) (6,224) 9.7%
Profit before Income tax expense 117,922 99,311 18.7%
Income tax expense (16,392) (9,582) 71.1%
Profit from continuing operations 101,530 89,729 13.2%
Net loss from discontinued operations – (7,183) 100.0%
Profit 101,530 82,546 23.0%
Net loans, standalone 1,348,331 1,221,443 10.4%
Client deposits, standalone 816,709 707,136 15.5%
Loan yield 21.4% 21.0%
Cost of deposits 6.1% 6.7%
Cost/income ratio 44.3% 51.2%
In 2012, Retail Banking revenue growth of 16.8% was largely driven by an increase in net interest income, reflecting the strong growth of the retail net loan book. Loan yield increased by 36 basis points to 21.4%, while cost of deposits decreased from 6.7% in 2011 to 6.1% in 2012, benefiting from the Bank’s leadership in Georgia’s retail segment. Net fees and commission income increased to GEL 53.6 million as a result of a growth of the Bank’s card operations, boosted by the launch of the Bank’s Express Banking franchise.
Strong positive operating leverage was achieved as operating expenses grew by 1.0% being significantly less than the retail revenue growth of 16.8%. Increased efficiencies of scale, supported by the build-out of the Bank’s Express Banking franchise and prudent cost control measures, resulted in a markedly improved Retail Banking cost to income ratio, which was 44.3% in 2012 compared to 51.2% in 2011.
The cost of credit risk of GEL 12.5 million was largely attributed to the consumer loan and credit card portfolio, reflecting provisions and impairments on credit card and consumer loan balances of employees of the large payroll client that implemented a significant layoff during the course of 2012.
Deposits from retail clients increased by 15.5% to GEL 816.7 million, US dollar-denominated deposits decreased to 69.4% of retail deposits as at 31 December 2012 compared to 73.2% as at 31 December 2011.
Bank of Georgia is the largest retail banking services provider in Georgia, offering a wide-range of products and services including consumer loans, mortgage loans, overdrafts, credit card facilities and other credit facilities as well as funds transfer and settlement services and handling customer multicurrency deposits for both individuals and legal entities. Retail Banking encompasses the mass affluent segment, retail mass markets, SMEs and micro businesses, serving more than one million customers through its leading branch and ATM networks in Georgia.
Highlights – Increased number of Express Pay terminals from 99 to 221 – Added 30 Express branches bringing the total Express branches and Metro branches to 63 (of which 24 are Metro branches)
– Issued 534,147 debit cards and 61,466 credit cards in 2012 bringing total number of debit cards and credit cards outstanding to 718,239 and 107,261, respectively
– Outstanding number of Retail Banking clients totalled 1,054,248
– Acquired 1,685 new clients in the Solo business line, the Bank’s mass affluent sub-brand in 2012. As of 31 December 2012, the number of Solo clients reached 5,413
– POS footprint: as of 31 December 2012, 231 desks at 474 contracted merchants
– POS terminals outstanding reached 3,725, up 31.7% y-o-y
Outlook – Intensify the shift to remote payment systems and capture emerging bankable population through the Bank’s wide-range of electronic channels and through Express Banking offering
– Differentiate product and services offering for different segments
– Step-up optimisation of the centralised Retail Banking back office to eliminate document flow and introduce sophisticated Customer Relationship Manamgent (“CRM”) system to increase penetration within the Bank’s client base
Retail Banking
The Bank is strongly positioned for new client acquisition through its strategy of segment approach
36 Bank of Georgia Holdings PLC Annual Report 2012

Gross loan portfolio breakdown
Mortgage loans 27.4% Micro and agro �nancing loans and SME loans 26.8%
Pawn loans 5.5%Automobile loans 1.7%POS loans 2.2%
General consumer loans 25.7%Credit Cards and Overdrafts 10.7%
Superior client reach
Cross selling networks
RETAIL SOLO
SME &MICRO EXPRESS
MASS AFFLUENT
MASS/EMERGING
RETAIL
GENERAL RETAIL
SMALL AND MEDIUM BUSINESSES
SEGMENT APPROACH AT THE HEART OF OUR
RETAIL PHILOSOPHY
Gross loan portfolioMortgage loans. Typical mortgage loan has a tenor of 10 years and all mortgage loans are secured by a first-ranking mortgage of the real estate purchased and/or a mortgage/pledge of alternative property or other collateral.
Micro-financing and SME loans are loans to businesses with annual turnover of less than GEL 5.0 million. Micro-financing loans result in the Bank’s exposure under GEL 33,000 (US$20,000); SME loans result in the Bank’s exposure over GEL 33,000 (US$20,000) to GEL 830,000 (US$500,000).
General consumer loans are offered as fixed-term, fixed-instalment loans to be used for general purposes. The maximum principal amount of a consumer loan secured by real estate is capped at GEL 50,000, with a maximum maturity of five years.
Banking cards. The Bank issues debit cards, often with overdrafts, to its retail banking customers in conjunction with universal current accounts, as well as credit cards.
Automobile loans. The Bank has agreements with various automobile dealers in connection with providing loans for the purchase of fully-insured vehicles.
Pawn loans are loans made to retail banking customers that are secured by precious metals and gems deposited by the customer. Pawn loans are offered as fixed-term loans to be used for general purposes and may be given for a period of up to three months with a right of extension at the end of the period.
POS loans are express loans offered for consumer goods sold at merchant stores.
Total Retail gross loans GEL 1,364 mln
SOLOA premier banking service 5,413 clients
EXPRESSTransactional banking format for mass retail 39 Express branches 24 Metro branches
RETAILTraditional banking for existing customers
SME & MICROPersonalised service to Micro and SME customers 10,331 clients 42 point of sales
Bank of Georgia Retail Banking philosophy
Bank of Georgia Holdings PLC Annual Report 2012 37
OverviewPerform
anceGovernance
Financial Statements
Additional Information

2005 2009Capturing Georgian mass retail segment
Segment approach
Strategic milestones
Rollout of wide range of retail products
Solo Banking, SME
American Express exclusivity
Product line up
Multicurrency current accounts, POS loans, Consumer loans, Orange Credit Card, Money Transfers System, Hypo+(mortgage), Micro loan+, Auto+, Student Card, Pawn loans
Investment Deposit
Premium Deposit, American Express Rewards, Electronic Saving Box, Instant issue cards, express credit, digital corners
Distribution channels
56 Branches, 47 ATMs, Telephone Banking
141 Branches, 382 ATMs, Telephone Banking, Internet Banking, Mobile Banking
2012 Leadership in payments:– Sole provider of metro, bus and minibus
transportation system payments– Acquiring network of 50%+
market share– Contactless card with loyalty programme– Express Pay terminals
Era of transactional banking
Strategic milestones
Express Banking
Product line up
Contactless Card, first time in Georgia,
American Express business card
Mobile banking application for iPhones and androids
Distribution channels
194 Branches
478 ATMs
Telephone Banking
Internet Banking
Mobile Banking
221 Express Pay terminals
Performance: Segment discussions continued
Condensed history of Bank of Georgia’s Retail Banking evolutionBank of Georgia has a track record of transforming the Georgian banking sector through its innovative products and the use of technology thus acquiring the leading market reputation for performance and service
38 Bank of Georgia Holdings PLC Annual Report 2012

Express BankingThrough its Express Banking strategy, Bank of Georgia is at the forefront of the move from traditional to transactional banking
New channels driving growth
Strategic rationale
Transactional shift to new channels
Express branchesSmall branches to free up flagship branches for higher value added services and minimise capex. Services include ATMs, Express Pay terminals and internet banking
Cost-efficient growth of the franchise
Express cardExclusive travel card for metro, minibuses and buses (linked to current account) aiming to decrease physical currency translating into the Bank’s low cost current account
Boost current account balances
Mobile bankingFirst bank in Georgia to launch applications for mobile banking (iPhone and Android)
Increased use of electronic channels
Internet bankingTransactions through internet banking have increased 36% in 2012 and expected to grow further
Decrease cost of funds
Express pay terminalsMoving transactional banking away from branches. Express Pay terminals for transactional banking: utility payments, money transfers, currency conversions, etc
Capture emerging client base
Branches vs Remote Channels* Number of transactions (millions)
10.69.4
+14%
+74%
12.0
16.3
20122011Branches Remote channels
* Excluding POS terminal transactions and internet payments
Number of transactions (millions)
2011 2012
4.9
8.7 9.111.0
+21%
+36%+47%
+77%
3.04.4
1.4 2.0
Express Pay terminal
ATMs POSterminal
Internet banking
Volume of transactions (GEL, millions)
2011 2012
Express Pay terminal
ATMs POSterminal
Internet banking
53.0157.2
1,694.82,036.8
+20%
+66%+37%+197%
246.6336.8
142.5236.0
Bank of Georgia Holdings PLC Annual Report 2012 39
OverviewPerform
anceGovernance
Financial Statements
Additional Information

Share in the Group’s revenue*
31%Corporate Banking
*Excludes inter-segment eliminations.
Performance: Segment discussions continued
Financial performanceYear end
GEL thousands, unless otherwise noted
31 Dec2012
31 Dec2011 Change
Net interest income 92,276 77,900 18.5%
Net fee and commission income 28,701 20,559 39.6%
Net gain from foreign currencies 29,819 27,383 8.9%
Other operating non-interest income 3,996 5,275 -24.2%
Revenue 154,792 131,117 18.1%
Operating expenses (51,323) (56,282) -8.8%
Operating income before cost of credit risk 103,469 74,835 38.3%
Cost of credit risk (29,490) (21,553) 36.8%
Net non-operating expense (8,415) (6,318) 33.2%
Profit before Income tax expense 65,564 46,964 39.6%
Income tax expense (9,936) (4,896) 102.9%
Profit from continuing operations 55,628 42,068 32.2%
Net loss from discontinued operations – (7,807) -100.0%
Profit 55,628 34,261 62.4%
Net loans, standalone 1,696,325 1,378,147 23.1%
Client deposits, standalone 1,148,913 1,383,983 -17.0%
Loan yield 13.9% 14.4%
Cost of deposits 7.2% 7.1%
Cost/income ratio 33.2% 42.9%
The 18.1% growth of Corporate Banking revenue during 2012 was driven by an 18.5% growth in net interest income and strong growth of net fees and commission income, in line with the Group’s focus on further developing its fee generating business for corporate clients. Net gains from foreign currencies rose, reflecting the increase in volumes of foreign currency conversions by the Bank’s corporate clients. Further improvements in operating efficiency resulted in an 8.8% decrease in Corporate Banking operating costs, translating into an improved Corporate Banking cost to income ratio of 33.2%, compared with 42.9% in 2011. Corporate Banking cost of credit risk increased to GEL 29.5 million from GEL 21.6 million in 2011.
Corporate Banking posted profit before income tax expense of GEL 65.6 million, an increase of 39.6% compared to 2011.
Corporate Banking net loans increased by 23.1%, to GEL 1,696.3 million, while Corporate Banking client deposits decreased as a result of targeted outflow of costly GEL denominated corporate deposits following the deposit re-pricing during 2012. The resulting reduction of corporate cost of deposits to 6.2% in the fourth quarter of 2012 has not been reflected in the full year ratio. US dollar denominated deposits represented 50.2% of corporate deposits, up from 38.4% in 2011.
Corporate Banking business in Georgia comprises of loans and other credit facilities to the country’s large corporate clients as well as other legal entities generating revenue of more than GEL 5 million. The services include fund transfers and settlements services, currency conversion operations, trade finance services and documentary operations as well as handling savings and term deposits for corporate and institutional customers. Corporate Banking business also includes finance lease facilities provided by the Group’s leasing operations GLC.
Highlights – Increased the number of corporate clients using the Bank’s payroll services from 2,387 to 3,429. As of 31 December 2012, the number of individual clients serviced through the corporate payroll programmes administered by the Bank amounted to 204,629
– Launched Bank of Georgia Research and initiated research coverage of Georgian Electricity Sector, Georgian Oil and Gas Corporation, Georgian Railway, and issued notes on Georgian State Budget and the Tourism Sector as of the date of this Annual Report
– Increased the aggregate trade finance limits from international partner credit institutions from US$178.4 million equivalent to US$ 308.8 million diversified across different currencies (US$, EUR, CHF). The number of partner credit institutions that opened trade finance lines with the Bank increased from 10 to 14
– Guarantees and letters of credit portfolio grew to GEL 573.4 million
Outlook – Achieve sustainable growth and benefit from strong momentum in the Georgian corporate segment
– Focus on sectors traditionally less banked in Georgia i.e. decrease share in construction and real estate and increase penetration in pharmaceuticals & healthcare, hospitality and education, while concentrating on quality as we continue coverage build-up
– Increase focus on cross selling networks between different departments of the Bank and capitalise on the Research department’s comprehensive insight of the under researched sectors of the Georgian economy
Corporate Banking
40 Bank of Georgia Holdings PLC Annual Report 2012
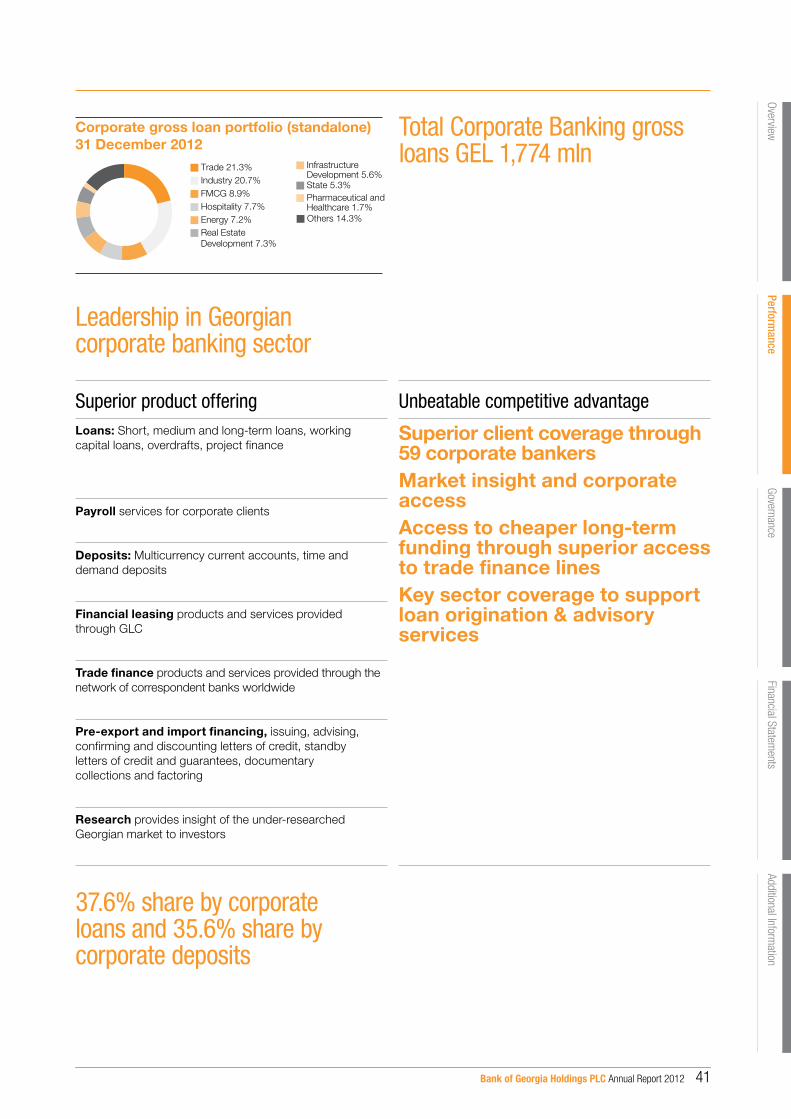
Leadership in Georgian corporate banking sector
37.6% share by corporate loans and 35.6% share by corporate deposits
Superior product offering Unbeatable competitive advantageLoans: Short, medium and long-term loans, working capital loans, overdrafts, project finance
Superior client coverage through 59 corporate bankersMarket insight and corporate accessAccess to cheaper long-term funding through superior access to trade finance linesKey sector coverage to support loan origination & advisory services
Payroll services for corporate clients
Deposits: Multicurrency current accounts, time and demand deposits
Financial leasing products and services provided through GLC
Trade finance products and services provided through the network of correspondent banks worldwide
Pre-export and import financing, issuing, advising, confirming and discounting letters of credit, standby letters of credit and guarantees, documentary collections and factoring
Research provides insight of the under-researched Georgian market to investors
Corporate gross loan portfolio (standalone)31 December 2012
Trade 21.3%
Hospitality 7.7%
Industry 20.7%
Energy 7.2%
FMCG 8.9%
Others 14.3%
Real Estate Development 7.3%
Infrastructure Development 5.6%
Pharmaceutical and Healthcare 1.7%
State 5.3%
Total Corporate Banking gross loans GEL 1,774 mln
Bank of Georgia Holdings PLC Annual Report 2012 41
OverviewPerform
anceGovernance
Financial Statements
Additional Information

Share in the Group’s revenue*
3%Asset and Wealth
Management
*Excludes inter-segment eliminations.
Performance: Segment discussions continued
Financial performanceYear end
GEL thousands, unless otherwise noted
31 Dec2012
31 Dec2011 Change
Net interest income 12,644 6,000 110.7%
Net fee and commission income 523 604 -13.4%Net gain from foreign currencies 682 740 -7.8%Other operating non-interest income 73 24 NMFRevenue 13,922 7,368 89.0%
Operating expenses (4,665) (3,967) 17.6%Operating income before cost of credit risk 9,257 3,401 172.2%
Cost of credit risk 727 87 NMFNet non-operating expense (305) (197) 54.8%Profit before Income tax expense 9,679 3,291 194.1%Income tax expense (1,339) (318) NMFProfit from continuing operations 8,340 2,973 180.5%Net loss from discontinued operations – (229) -100.0%
Profit 8,340 2,744 198.9%
Net loans, standalone 38,644 35,774 8.0%Client deposits, standalone 605,183 454,178 33.2%Loan yield 11.3% 12.7%Cost of deposits 8.9% 9.9%Cost/income ratio 33.5% 53.8%
Reflecting the strong growth of Assets under Management in 2012, net interest income more than doubled to GEL 12.6 million translating into an 89.0% growth in revenue to GEL 13.9 million. Profit before income tax expense of the Asset and Wealth Management business grew from GEL 3.3 million in 2011 to GEL 9.7 million, as a result of considerably higher revenue growth compared to operating costs, which increased 17.6% to GEL 4.7 million. Client deposits of the Wealth Management business grew by GEL 151.0 million, or 33.2%, to GEL 605.2 million.
Representative Offices:Tel Aviv (since February 2009) London (since August 2010) Budapest (since September 2012)
The Group’s Asset and Wealth Management business provides private banking services to resident and non-resident clients by ensuring an individual approach and exclusivity in providing banking services such as holding the clients’ savings and term deposits, fund transfers, currency exchange and settlement operations. In addition, wealth management involves providing AWM services to its clients through a wide range of investment opportunities and specifically designed investment products.
The Group’s strategy is to expand asset and wealth management products internationally by establishing its presence in selected markets.
Private banking products and services – Individual approach through a dedicated private banker – Support of a customer service associate – Service package of Asset & Wealth Management – OneCard Visa Infinite, American Express International cards
– Deposits and credit solutions – Remote banking – Investment management
Highlights – Added multiple currency Certificates of Deposit (CD) product offering in December 2012 (official launch January 2013). As of 31 March 2013, the amount of CDs issued to AWM clients reached GEL 41.6 million
– Increased number of clients served from 1,298 in 2011 to 1,352 in 2012. The AWM business currently serves over 1,300 clients from more than 60 countries
– Client funds attracted grew by 33.2% to GEL 605.2 million
Outlook – Build asset management business – Continue to expand overseas presence to attract funding and decrease deposit costs
– Launch a regional fixed income fund to invest in local and foreign currency fixed income instruments in Georgia, Azerbaijan and Armenia
AWM client funds have grown threefold to GEL 605 mln since 2009
Asset and Wealth Management
42 Bank of Georgia Holdings PLC Annual Report 2012

Share in the Group’s revenue*
11%Aldagi BCI
*Excludes inter-segment eliminations.
Insurance and Healthcare
Aldagi BCI, the Group’s wholly owned subsidiary, provides life and non-life insurance products and services in Georgia. Aldagi BCI’s healthcare business consists of My Family Clinic, Georgia’s leading healthcare provider, operating a chain of healthcare centres in Georgia, in line with the Group’s strategy of vertically integrating its insurance and healthcare businesses.
Highlights – Acquired Imedi L, the third largest insurance and healthcare business in Georgia to become the undisputed leader in the Georgian insurance market with a 33.5% market share (based on gross insurance premium revenue)
– Increased number of insurance clients from 220,000 to 607,000
Outlook – The Group aims to increase Aldagi BCI’s revenue contribution to group revenue and maintain its leading position on the Georgian insurance market
Financial performanceYear end 31 Dec 2012 Year end 31 Dec 2011 Change
GEL thousands, unless otherwise noted Insu
ran
ce
He
alt
hc
are
Elim
inat
ions
Tota
l
Insu
ran
ce
He
alt
hc
are
Elim
inat
ions
Tota
l
Insu
ran
ce
He
alt
hc
are
Tota
l
Gross premiums written 127,922 – – 127,922 61,845 – – 61,845 106.8% – 106.8%
Net interest income (expense) 1,825 (6,481) – (4,656) (249) (143) – (392) NMF NMF NMF
Net fee and commission expenses (107) – – (107) – – – – – – –
Net insurance revenue 29,661 – 6,422 36,083 17,725 – 1,900 19,625 67.3% – 83.9%
Net healthcare revenue (loss) – 29,768 (6,422) 23,346 – 4,358 (1,900) 2,458 – NMF NMF
Net gain (loss) from foreign currencies 238 (1,090) – (852) (779) – – (779) NMF – 9.4%
Other operating non-interest income 1,000 257 (209) 1,048 1,294 802 – 2,096 –22.7% –68.0% –50.0%
Revenue 32,617 22,454 (209) 54,862 17,991 5,017 – 23,008 81.3% NMF 138.4%
Operating expenses (17,437) (17,917) 209 (35,145) (12,382) (3,582) – (15,964) 40.8% NMF 120.2%
Operating income before cost of credit risk 15,180 4,537 – 19,717 5,609 1,435 – 7,044 170.6% NMF 179.9%
Cost of credit risk (1,502) (802) – (2,304) (1,885) – – (1,885) –20.3% – 22.2%
Net non-operating income – 440 – 440 702 1,402 – 2,104 –100.0% –68.6% –79.1%
Profit before income tax expense 13,678 4,175 – 17,853 4,426 2,837 – 7,263 NMF 47.2% 145.8%
Income tax expense (2,068) (242) – (2,310) (702) (43) – (745) 194.6% NMF NMF
Profit 11,610 3,933 – 15,543 3,724 2,794 – 6,518 NMF 40.8% 138.5%
Cost/income ratio 53.5% 79.8% 64.1% 68.8% 71.4% 69.4%
In 2012, insurance and healthcare revenue increased to GEL 54.9 million from GEL 23.0 million in 2011, reflecting the growth of both the insurance and healthcare businesses through organic growth as well as through acquisitions. The Bank’s insurance business doubled gross premiums written during the period and saw improvements in insurance claims management as a result of the successful integration of Imedi L Insurance. Operating costs growth of 40.8% compares to an 81.3% growth
of revenue, resulting in a strong increase of 170.6% in operating income before the cost of credit risk of the insurance operation. Revenue from the healthcare segment grew from GEL 5.0 million in 2011 to GEL 22.5 million in 2012, driving the significant growth of operating income before cost of risk in the healthcare business from GEL 1.4 million to GEL 4.5 million in 2012. The profit of Aldagi BCI for the year ended 31 December 2012 was GEL 16.4 million before segment adjustments.
– Largest player on the Georgian insurance market Aldagi BCI is well-positioned for growth as the demand for insurance products increases and through cross selling and up-selling insurance products will leverage the Bank’s superior distribution network
– Aldagi BCI aims to capitalise on the growing healthcare industry and to capture a majority of healthcare spending in Georgia
Aldagi BCI
InsuranceProducts ShareHealthcare 63.0%Casco 12.0%Property 10.2%Life 3.6%General Liability 2.0%Travel 1.5%Cargo 1.4%Motor Third Party liabilities (MTPL) 1.4%Aviation Hull 1.4%Professional Indemnity 0.7%Personal Accident (PA) 0.7%Motor Personal Accident (MPA) 0.5%Guarantees 0.5%Forwarder’s Liability 0.4%Employer’s Liability 0.3%Financial Risks 0.3%Marine Hull 0.1%
Healthcare JSC My Family Clinic
6 outpatient clinics
26 hospitals and clinics
919 hospital beds
1,501,000+ clients served by hospitals
607,000 health insurance
policy holders
Bank of Georgia Holdings PLC Annual Report 2012 43
OverviewPerform
anceGovernance
Financial Statements
Additional Information

Share in the Group’s revenue*
1%Afordable Housing
*Excludes inter-segment eliminations.
Performance: Segment discussions continued
Affordable Housing
The Affordable Housing business consists of the Bank’s wholly owned subsidiary m2 Real Estate, which develops and sells affordable real residential apartments and also holds investment properties repossessed by the Bank from defaulted borrowers and manages those properties. With the aim to improve liquidity of these repossessed real estate assets and stimulate the Group’s mortgage lending business capitalising on the market opportunity in the affordable housing segment in Georgia, the Group develops and leases such real estate assets through m2 Real Estate. m2 Real Estate outsources the construction and architecture works and focuses on project management and sales of apartments and mortgages through its well-established branch network and sales force, thus representing a synergistic business for the Group’s mortgage business.
Second projectConstruction of a second project of 522 apartment building with a total buildable area of 63,247 square meters in progress. 227 pre-sold. The total sales from this project amounted to US$18.2 million as of 31 December 2012.
Financial performanceYear end 31 Dec 2012 Year end 31 Dec 2011 Change
GEL thousands, unless otherwise noted
m2 Real Estate Mortgages Total
m2 Real Estate Mortgages Total
m2 Real Estate Mortgages Total
Net interest income (expense) (276) 423 147 (840) 35 (805) -67.1% NMF NMFNet fee and commission income 196 – 196 – – – – – –Net loss from foreign currencies (145) – (145) (51) – (51) 184.3% – 184.3%Other operating non-interest income 4,378 – 4,378 3,378 – 3,378 29.6% – 29.6%Revenue 4,153 423 4,576 2,487 35 2,522 67.0% NMF 81.4%Operating expenses (2,381) – (2,381) (2,029) – (2,029) 17.3% – 17.3%Operating income before cost of credit risk 1,772 423 2,195 458 35 493 NMF NMF NMFCost of credit risk – (219) (219) – (32) (32) – NMF NMFNet non-operating income 282 – 282 8 – 8 NMF – NMFProfit before Income tax benefit 2,054 204 2,258 466 3 469 NMF NMF NMFIncome tax benefit (expense) (307) – (307) 178 – 178 NMF – NMFProfit 1,747 204 1,951 644 3 647 171.3% NMF NMFCost/income ratio 57.3% – 52.0% 81.6% – 80.5%
Recognised other operating income of GEL 4.4 million for its pilot project, which includes revenues from sale of apartments and rentals, compared to other operating income of GEL 3.4 million in 2011.
Cash balance (comprising cash and cash equivalents and amounts due from credit institutions) of m2 Real Estate as of 31 December 2012 amounted to GEL 23.3 million.
Highlights – Total mortgage loans extended under pilot project of the Affordable Housing amounted to GEL equivalent of US$4.1 million. Number of mortgages sold: 71
– Total mortgage loans extended under the second Affordable Housing project amounted to US$6.9 million as of 31 December 2012. Number of mortgages sold: 113
– Drew down two tranches each in the amount of US$5 million of the US$20 million financing raised from FMO, Dutch Development Bank
Outlook – Targeted IRR of 30%+ – Aiming to cash out in 2015 and discontinue business – Three projects in pipeline with total buildable area c. 150,000 sq.m
Pilot projectPilot project of 123 apartment building with a total buildable area of 15,015 square meters completed; 117 of the units pre-sold. The total sales from the pilot project amounted to US$8.6 million.
44 Bank of Georgia Holdings PLC Annual Report 2012

Share in the Group’s revenue*
4%BNB
*Excludes inter-segment eliminations.
Financial performanceYear end
GEL thousands31 Dec
201231 Dec
2011 Change
Net interest income 12,074 13,183 -8.4%
Net fee and commission income 3,809 2,028 87.8%Net gain from foreign currencies 5,306 35,764 -85.2%Other operating non-interest income 68 (15) NMFRevenue 21,257 50,960 -58.3%
Operating expenses (10,327) (13,321) -22.5%Operating income before cost of credit risk 10,930 37,639 -71.0%Cost of credit risk (1,306) (1,398) -6.6%Net non-operating expense (443) (18,225) -97.6%Profit before Income tax expense 9,181 18,016 -49.0%Income tax expense (2,367) (6,009) -60.6%Profit 6,814 12,007 -43.2%
Cost/income ratio 48.6% 26.1%
In 2012, BNB reported good results attributed to strong growth in fee and commission income and decline in operating costs during the period. The performance of BNB in 2012 resulted in a ROAE of 16.4%, which was an increase against 4.1% as at 31 December 2010, but was a decrease against 35.4% as at 31 December 2011, having been affected by hyperinflation in Belarus and currency hedge. BNB’s net loan book increased by 142.8% to GEL 117.3 million, while client funds amounted to GEL 105.2 million, an increase of 144.5% compared to 2011.
As at 31 December 2012, BNB’s total assets were GEL 185.9 million, net loan book at GEL 117.3 million, and client deposits at GEL 105.2 million, representing 3.3%, 3.8% and 4.0% of the Group’s total assets, loan book and client deposits, respectively.
The Group’s Belarus banking business is operated through its subsidiary BNB, which was one of the first privately owned commercial banks in Belarus, established in 1992. As of 31 December 2012, the Group owned a 79.99% stake in BNB. 19.99% of BNB is owned by International Finance Corporation. BNB offers retail and corporate banking services principally to SMEs. SMEs are defined as entities who have a total annual turnover of less than GEL 8.3 million (US$5.0 million) or the equivalent, microloan clients and middle-income retail banking customers.
Through BNB, the Group provides retail banking and corporate banking services in Belarus.
Highlights – As of 31 December 2012, BNB was the 19th bank in Belarus by assets (2011: 23rd) and 13th by profit (2011: 20th)
– Increased revenues from trade finance operations by 54% to US$0.7 million
– Stepped up plastic card issuance by 71% year-on-year to 20,000 cards outstanding as of 31 December 2012
– Signed micro, small and medium enterprises (“MSME”) US$ 8 million credit line facility with EBRD
BNB
19th*Position in Belarus by assets
13thPosition in Belarus by profit
* Market shares for BNB by NBRB.
Bank of Georgia Holdings PLC Annual Report 2012 45
OverviewPerform
anceGovernance
Financial Statements
Additional Information

Performance: Principal Risks and Uncertainties
Principal Risk and Uncertainties
The following discussion sets forth certain risks and uncertainties that the Group believes are material. If any of the following risks actually occur, the Group’s business, financial condition, results of operations or prospects could be materially affected. The risks and uncertainties described below may not be the only ones the Group faces. Additional risks and uncertainties, including those that the Group is currently not aware of or deems immaterial, may also result in decreased revenues, incurred expenses or other events that could result in a decline in the value of the Group’s securities.
Macroeconomic risks and political risks related to GeorgiaDifficult global economic conditions have had, and may continue to have, a material adverse effect on the GroupThe Group conducts its operations mainly in Georgia, where most of its customers and assets are located. Nevertheless, the Group’s business and performance are affected by global macroeconomic and market conditions. In 2008, the global economy entered the most severe downturn in 80 years, with the financial services industry facing unprecedented turmoil. A shortage of liquidity, limited availability of funding, pressure on capital, deteriorating asset quality and significant price volatility across a wide range of asset classes put financial institutions, including the Group under considerable pressure. Many developed economies entered into recession and growth slowed in many emerging economies, including Georgia.
The financial crisis was accompanied by a number of related developments, including an erosion of confidence in financial institutions, increased currency volatility, increased counterparty risk and the risk of systemic failures. Such circumstances have caused disruptions in financial markets worldwide, leading to liquidity and funding difficulties in the international banking system. Access to capital, the credit markets, FDI and other forms of liquidity was significantly impaired and the cost of financing for financial institutions increased considerably. As a result, the cost of borrowing in the wholesale debt markets increased for the Group, the debt capital markets were effectively closed or severely restricted to banks in emerging markets and certain international financial institutions owned by national governments, including the EBRD and the IFC, became the principal source of long-term funding for the Group. The financial crisis also had a significant adverse effect on the valuation of assets and the capital position of many financial institutions globally.
Although global markets showed signs of improvement in 2010 and in the first half of 2011, during the second half of 2011 and in 2012, there has been turmoil in the European banking system and a deterioration of sovereign credit of a number of European countries including Greece, Ireland, Italy, Spain, Portugal and Cyprus. In addition, during 2012 there were concerns that these countries may experience “double-dip” or prolonged recessions. These developments have created an unfavourable environment for the banking sector globally and in Georgia and could have a material adverse effect on the Group’s business, financial condition and results of operations.
Regional tensions could have an adverse effect on the local economy and the GroupGeorgia, which is bordered by Russia, Azerbaijan, Armenia and Turkey, could be adversely affected by political unrest within its borders and in surrounding countries. In particular, Georgia has had ongoing disputes in the breakaway regions of Abkhazia and the Tskhinvali Region/South Ossetia and with Russia since the restoration of its independence in 1991. These disputes have led to sporadic violence and breaches of peace-keeping operations. Most recently, in August 2008, the conflict in the Tskhinvali Region/South Ossetia escalated as Georgian troops engaged with local militias and Russian forces that crossed the international border, and Georgia declared a state of war (the “2008 Conflict”). Although Georgia and Russia signed a French-brokered ceasefire that called for the withdrawal of Russian forces later that month, Russia recognised independence of the breakaway regions and Russian troops continue to occupy Abkhazia and the Tskhinvali Region/South Ossetia and tensions continue. In addition, relations between Georgia’s neighbours, Azerbaijan and Armenia, remain tense and there are sporadic instances of violence between these two countries. Russia is opposed to the eastward enlargement of the North Atlantic Treaty Organisation, potentially including ex-Soviet republics, such as Georgia. The Georgian government has taken certain steps towards improving relations with Russia, however these have not currently resulted in any formal or legal changes in the relationship between the two countries. Any future deterioration or worsening of Georgia’s relationship with Russia, including any major changes in Georgia’s relations with Western governments and institutions, in particular in terms of national security, Georgia’s importance to Western energy supplies, the amount of aid granted to Georgia or the ability of Georgian manufacturers to access world export markets, or a significant deterioration in relations between Azerbaijan and Armenia, may have a negative effect on the political and economic stability of Georgia, which could have an adverse effect on the Group.
46 Bank of Georgia Holdings PLC Annual Report 2012

As most of the Group’s businesses operate only within Georgia, the Group’s success is dependent on a number of economic, political and other factors affecting Georgia that are beyond its controlFor the year ended 31 December 2012, 96.2% of the Group’s total consolidated profit was derived from its business in Georgia. Therefore, macroeconomic factors relating to Georgia, such as GDP, inflation, interest and currency exchange rates, as well as unemployment, personal income and the financial condition of companies, have a material impact on loan losses, margins and customer demand for the Group’s products and services, which materially affects the Group’s business, financial condition and results of operations.
Georgia’s main economic activities include tourism, transit services, agriculture, mining, metals, machinery and chemicals. According to the Geostat, the country’s real GDP grew by 9.4% in 2006 and 12.3% in 2007 and, according to the Ministry of Finance of Georgia, this growth was largely based on strong inflows of FDI and robust spending by the Government of Georgia. However, the global economic downturn and the 2008 Conflict led to a decline in public spending and Georgia experienced a 57.9% reduction in FDI in 2009, compared to 2008, Real GDP in Georgia declined by 3.8% in 2009 compared with growth of real GDP by 2.3% in 2008 due to the global economic crisis, which led to deterioration in the employment market in Georgia and, in turn, contributed to a decrease in loans and a slowdown in the rate of growth of deposits in the Georgian banking sector. In addition, the Georgian banking sector began to experience a shortage of liquidity in the second half of 2008, which continued into the first half of 2009, increasing competition for retail deposits.
The economic slowdown in Georgia reduced the growth rate of the Group’s portfolio of retail and corporate loans. This in turn affected the Group’s net fee and commission income (and, to a certain extent, the Group’s net interest income, although net interest income was predominantly affected by a reduction in the size of the Group’s securities portfolio). Moreover, financing costs increased due to both the limited availability of funding on the inter-bank market, mainly driven by credit risk aversion, and increasing interest rates on bank deposits resulting from increasing competition in the deposit market, which also had a negative impact on the net interest income earned by the Group. In addition, the quality of the Group’s loan portfolio deteriorated as a result of the economic slowdown, which resulted in an increase in the Group’s loans past due more than 90 days. NPLs, defined as loans past due more than 90 days and any additional losses estimated by the management declined from GEL 117.6 million at 31 December 2010 to GEL 100.3 million as at 31 December 2011 and then increased to GEL 126.3 million as at 31 December 2012. FDI grew by 37.2% to US$ 1.1 billion in 2011 from 2010 and declined by 22.6% to an estimated US$ 865.2 million in 2012. Although the Georgian economy showed signs of improvement in 2010, 2011 and 2012, with real GDP growth of 6.3% in 2010, 7.2% in 2011, there can be no assurance that the recovery will continue or that there will not be a further deterioration in Georgia’s economy.
Market turmoil and economic deterioration in Georgia could also have a material adverse effect on the liquidity, businesses or financial condition of the Group’s borrowers, which could in turn, increase the Group’s NPL ratios, impair its loans and other financial assets and result in decreased demand for the Group’s products. In such an environment, consumer spending may decline and the value of assets used as collateral for the Group’s secured loans, including real estate, could also decrease significantly which could reduce recoveries on defaulting loans. Any of these conditions could have a material adverse effect on the Group’s business, financial condition and results of operations.
In addition, the Georgian economy is highly dollarised. Prior to 2008, the dollarisation rate of the banking system (defined as foreign currency deposits as a share of total deposits) had declined with foreign currency deposits accounting for approximately 64.4% of all client deposits as at 1 January 2008. As a result of the combined effects of the 2008 Conflict and the global financial crisis, however, the dollarisation rate increased to approximately 73.6% as at 1 January 2009, although it has since decreased to approximately 68.8% as at 1 January 2010, 67.0% as at 1 January 2011, 59.2% as at 1 January 2012 and increased to 63.8% as at 1 January 2013. Although the NBG has adopted measures to support the development of Georgia’s domestic money markets, the dollarisation rate could adversely impact on the effectiveness of the implementation of the NBG’s monetary and exchange rate policies, which could negatively impact the purchasing power of the Lari, restrict future growth in the GDP of Georgia and depress Georgia’s investment climate. Any of these effects could, in turn, have a material adverse effect on the Georgian economy and therefore an adverse effect on the Group.
Instability or a lack of growth in the domestic currency market may have an adverse effect on the development of Georgia’s economy and, in turn, have an adverse effect on the GroupAlthough the Lari is a fully convertible currency, there is generally no market outside Georgia for the exchange of Lari. A market exists within Georgia for the conversion of Lari into other currencies, but it is limited in size. According to the NBG, in 2012, the total volume of trading turnover in the Lari-US Dollar and Lari-Euro markets (excluding activities of the NBG) amounted to US$ 14.4 billion and €5.0 billion, respectively. According to the NBG, the NBG had US$ 2.8 billion in gross official reserves as at 31 December 2011 and US$ 2.9 billion as at 31 December 2012. While the Government of Georgia has stated that these reserves will be sufficient to sustain the domestic currency market in the short term, a lack of growth of this currency market may hamper the development of Georgia’s economy, which could have a material adverse effect on the businesses of the Group’s corporate customers and, in turn, a material adverse effect on the Group.
Bank of Georgia Holdings PLC Annual Report 2012 47
OverviewPerform
anceGovernance
Financial Statements
Additional Information

Performance: Principal Risks and Uncertainties continued
In addition, a lack of stability in the currency market may adversely affect Georgia’s economy. There was significant instability in the Lari to US dollar exchange rate following the Russian financial crisis of August 1998 and again following the 2008 Conflict. In November 2008, the NBG devalued the Lari by 16.1%, a measure aimed at alleviating the negative impact of the global financial crisis on the Georgian economy. While the Lari generally appreciated against the US dollar and other major international currencies from 2001 to 2008, the Lari then generally depreciated against the US dollar and other major international currencies until April 2011, since then the exchange rate has remained stable. The Lari/US dollar exchange rate was 1.7728 as at 31 December 2010, 1.6703 as at 31 December 2011 and 1.6567 as at 31 December 2012 The ability of the Government of Georgia and the NBG to limit any volatility of the Lari will depend on a number of political and economic factors, including the NBG’s and the Government’s ability to control inflation, the availability of foreign currency reserves and FDI and other currency inflows. Any failure to do so, or a major depreciation or further devaluation of the Lari, could adversely affect Georgia’s economy. According to the information provided by Geostat, annual inflation in Georgia, as measured by the end-of-period CPI in Georgia was 2.0% in 2011 and 11.2% in 2010. Inflation continued to rise in the first half of 2011, reaching 14.3% at 31 May 2011, but then decreased to 2.0% at 31 December 2011. This trend continued throughout 2012 with inflation turning into 1.4% deflation at 31 December 2012. There is no guarantee that the country will continue to remain unaffected by global increases in food prices. High and sustained inflation could lead to market instability, a financial crisis, a reduction in consumer purchasing power and erosion of consumer confidence. On the other hand, deflation, whilst increasing the purchasing power of the Lari, can adversely affect foreign investment and the Group’s profitability in its lending activities. Any of these events could lead to a deterioration in the performance of Georgia’s economy and negatively affect the businesses of the Group’s customers which could, in turn, have an adverse effect on the Group.
Political and governmental instability in Georgia could have a material adverse effect on the local economy and the GroupSince the restoration of its independence in 1991, Georgia has experienced an ongoing substantial political transformation from a constituent republic in a federal socialist state to an independent sovereign democracy.
At the most recent Georgian Parliamentary elections (which were held on 1 October 2012) the Georgian Dream coalition won the election by a majority of seats. The Georgian Dream party is generally seen to be business and investor friendly and to date, has implemented economic and fiscal policies which have generally been designed to liberalise the Georgian economy. The Georgian Dream coalition is led by Bidzina Ivanishvili, who was officially approved by the Parliament of Georgia (the “Parliament”) as the country’s new Prime Minister on 25 October 2012. Although the Georgian Dream Coalition won the 2012 Parliamentary elections and Bidzina Ivanishvili is the Prime Minister
and head of government, the leader of the United National Movement Party, Mikheil Saakashvili, is President of Georgia and head of state. Pursuant to the provisions of Georgia’s constitution (the “Constitution”), the Georgian President currently has the ability to veto legislation adopted by the Parliament. Georgia faces several challenges, one of which is the need to implement further economic and political reforms. However, there can be no assurance that these business and investor friendly reforms will continue or will not be reversed or that such reforms and economic growth will not be hindered as a result of any changes affecting the continuity or stability of the coalition government or as a result of a rejection of reform policies by the President, the Parliament or otherwise.
Mikheil Saakashvili has served as President of Georgia for two terms, having first been elected in January 2004. The next presidential elections are scheduled to be held in October 2013. However, pursuant to the provisions of the Constitution, President Saakashvili cannot stand for a third term in office. Should any protests or criticism arise in relation to the conduct or outcome of the 2013 Presidential election this may lead to political instability or disruption within Georgia.
Additionally, on 15 October 2010, the Parliament approved amendments to the Constitution which are intended to enhance the primary governing responsibility of the Parliament, increase the powers of the Prime Minister and reduce the powers of the Presidency. It is currently anticipated that the majority of these amendments to the Constitution will become effective after the 2013 Presidential election. However, although in March 2013 the Parliament has unanimously adopted certain amendments to the constitution thus limiting the powers of the President, there can be no assurance that the proposed favourable reforms in the healthcare and insurance business will continue, will not be reversed or will not otherwise be hindered. There can be no assurance that changes to Georgian Parliamentary, Presidential or Prime Ministerial powers will not create political disruptions or political instability or otherwise negatively affect the political climate in Georgia.
The Georgian Dream coalition government is currently in the process of preparing and finalising a range of new initiatives, including amendments to the Labour Code, anti-monopoly regulations, court system and changes to the regulation of the healthcare sector. The Group sees its healthcare and insurance business as one area of future growth for the Group. Current planned healthcare reform significantly increases the market available to the Group’s current and proposed activities.
Changes in governmental policy, including changes in the implementation or approach of previously announced government initiatives, could have a material adverse affect on the Group’s business, financial condition, results of operations and prospects.
The Group may experience increases in its income taxesDuring the three years ended 31 December 2012, the corporation income tax rate in Georgia was 15%. This tax rate is generally lower than the tax rate applicable to other of the Group’s peer companies, particularly
48 Bank of Georgia Holdings PLC Annual Report 2012

those operating in more developed Western countries. Furthermore, by virtue of the Economic Liberty Act passed by Parliament in July 2011 which enters into force on 1 January 2014 subject to certain exceptions, referenda are required to be held before raising taxes and tax rates. However, no assurance can be given that there will not in the future be an increase in corporate income tax in Georgia. Any significant increase in the rate of corporate income tax in Georgia or other changes in taxation policy could have a material adverse effect on the Group’s business, financial condition and results of operations.
Risks relating to the Group’s lending activitiesThe Group may not be able to maintain the quality of its loan portfolioThe quality of the Group’s loan portfolio is affected by changes in the creditworthiness of its customers, the ability of customers to repay their loans on time, the statutory priority of claims against customers and the Group’s ability to enforce its security interests on customers’ collateral should such customers fail to repay their loans and whether the value of such collateral is sufficient to cover the full amounts of those loans. In addition, the quality of the Group’s loan portfolio may deteriorate due to various other reasons, such as any negative developments in Georgia’s economy resulting in the financial distress or bankruptcy of the Group’s customers or the unavailability or limited availability of credit information concerning certain customers, and other factors, such as a failure of the Group’s risk management procedures or a rapid expansion of the Group’s loan portfolio. For example, during 2008 and 2009, the Group’s loan book quality was negatively affected by the economic slowdown in Georgia, Ukraine and Belarus, as well as by the 2008 Conflict. The Group’s loan impairment charges were to GEL 39.7 million in 2012 compared to GEL 23.5 million in 2011 and GEL 44.1 million in 2010. Also, as at 31 December 2012, 2011 and 2010, loans past-due more than 90 days accounted for 2.6%, 3.2% and 4.6% of total gross loans, respectively. NPLs accounted for 3.9% of gross loans as at 31 December 2012, 3.7% as at 31 December 2011 and 4.6% as at 31 December 2010. Loans that would otherwise be overdue or impaired whose terms (including as to principal and interest payment) have been renegotiated due to the borrower’s existing or possible inability to pay (“Renegotiated Loans”) accounted for 3.2% of total gross loans as at 31 December 2012 as compared to 4.5% and 10.9% as at 31 December 2011 and 2010, respectively. For more information regarding the credit quality of Renegotiated Loans, see “The Group’s risk management methods may provide ineffective at mitigating credit risk.” Although, the Board does not believe that there is a material risk that the Group’s loan portfolio quality will deteriorate in the next 12 months, there can be no assurance that in the longer term the Group’s loan portfolio quality will not deteriorate and that the Group’s loan impairment charges will not increase, which could, in turn, have an adverse effect on the Group’s business, financial condition and results of operations.
The Group’s loan portfolio for its corporate banking segment is highly concentrated, with the Group’s top ten corporate borrowers accounting for 17.4% of the Group’s total loan portfolio as at 31 December 2012 (gross of allowance for impairment). To the extent that the Group grows its loan portfolio by entering into additional arrangements with existing counterparties, it will increase its credit and general counterparty risk with respect to those counterparties.
Collateral values may declineAs at 31 December 2012, the Group held collateral against gross loans amounting to GEL 2,789.3 million, corresponding to 87.1% of the Group’s total gross loans. The main forms of collateral taken by the Group in its corporate lending are charges over real estate, equipment, inventory and trade receivables. The main form of collateral taken by the Group in its retail lending is a mortgage over residential property. In respect of mortgage loans which are secured by real estate, the Group imposes a loan-to-value (based on a liquidation value of the collateral) ratio of between 60% and 90% at the time the loan is advanced, depending on the value of the collateral. Downturns in the residential and commercial real estate markets or a general deterioration of economic conditions in the industries in which the Group’s customers operate, such as occurred during 2008 and 2009, may result in illiquidity and a decline in the value of the collateral securing the Group’s loans, including a decline to levels below the outstanding principal balance of those loans.
In addition, declining or unstable prices of collateral in Georgia may make it difficult for the Group to accurately value collateral held by it. If the fair value of the collateral held by the Group declines significantly in the future, the Group could be required to record additional provisions and could experience lower than expected recovery levels on collateralised loans past due more than 90 days which could, in turn, have a material adverse effect on the Group.
Significant changes or volatility in the Group’s net interest margin could have an adverse effect on the GroupThe Group derives the majority of its total net income from net interest income. As a result, the Group’s operations are affected by fluctuations in its net interest margin. In particular, the Group’s banking operations depend on the management of key factors which affect the Group’s net interest margin, such as interest rates, competition for loans and deposits, customer demand and costs of funding. These key factors are influenced by factors beyond the Group’s control, such as global and local economic conditions, the resources of the Group’s competitors and consumer confidence. Interest rates are highly sensitive to many factors beyond the Group’s control, including monetary policies and domestic and international economic and political conditions and the reserve policies of the NBG.
Bank of Georgia Holdings PLC Annual Report 2012 49
OverviewPerform
anceGovernance
Financial Statements
Additional Information

Performance: Principal Risks and Uncertainties continued
A mismatch of interest-earning assets and interest-bearing liabilities in any given period resulting from changes in any of the key factors outlined above, or otherwise, could reduce the Group’s net interest margin. The Group’s NIM was 7.9%, 7.8% and 8.8% in the years ended 31 December 2012, 2011 and 2010, respectively. The slight increase in the Group’s NIM in 2012 as compared to 2011 was due to the overall decrease of the Group’s cost of funding from 8.0% in 2011 to 7.3% in 2012, supported by a decrease in the proportion of Lari denominated customer deposits within total customer deposits in the second half of 2012 in particular. Any reduction in the Group’s NIM caused by changes in the key factors outlined above otherwise could have a material adverse effect on the Group’s net interest income, which could, in turn, have a material adverse effect on the Group.
In addition, any increase in interest rates may result in an increase in the instalment amounts paid by the Group’s customers. Such an increase may result in difficulties related to the repayment of the assumed loans, which in turn may lead to a decrease in the quality of the Group’s loan portfolio and an increase in impairment provisions for loans extended to the Group’s customers, which could have a material adverse effect on the Group’s business, financial condition and results of operations.
Currency fluctuations have affected, and may continue to affect, the GroupA substantial portion of the total assets of the Group, especially its loan portfolio (67.9% of its gross loans to customers as at 31 December 2012), is denominated in foreign currencies, primarily US Dollars, while the majority of customers who have their loans denominated in foreign currencies earn their income in Lari. Those customers are usually not protected against the fluctuations of the exchange rates of the Lari against the currency of the loan. Consequently, any depreciation of the Lari against the currency of the loan may result in difficulties in repayment of the loans, which may lead to a decrease in the quality of the Group’s loan portfolio and an increase in impairment provisions for loans extended to the Group’s customers, which may have a material adverse effect on the Group’s business, financial condition and results of operations.
In addition, the Group’s operations are affected by the Lari to Belarusian Rouble exchange rates as these affect the value of the Group’s equity interests in BNB, its Belarusian subsidiary, on a consolidated basis.
Depreciation of the Belarusian Rouble against the Lari has the effect of reducing BNB’s contribution to the Group’s consolidated capital. In May 2011, the Belarusian Rouble was devalued by 39.5% as compared to its value as at 30 April 2011, as measured against the US Dollar. As a result, the regulatory capital of BNB decreased below the minimum regulatory capital required to accept retail deposits (being €25 million, as required by the National Bank of Republic of Belarus). In the second half of 2011, the Belarusian Rouble depreciated further, as measured against the US dollar, and declined another
40.6% between 30 June 2011 and 31 December 2011. Accordingly, the regulatory capital of BNB decreased to €14.6 million (GEL 31.6 million) as at 31 December 2011. As at 1 January 2013, the regulatory capital of BNB was €17.3 million (GEL 37.8 million). The NBRB has granted a temporary waiver of the minimum regulatory capital requirement until 1 January 2014. The NBRB has also set a limit on the amount of deposits from individuals at GEL 49.5 million (which is the value of deposits from individuals of BNB as at 1 February 2013) until BNB regulatory capital reaches minimum required level of €25 million. As at 31 December 2011, as a result of the devaluation of the Belarusian Rouble, the Group recognised a write down of GEL 23.4 million, representing the full amount of BNB’s goodwill.
Any subsequent devaluation of the Belarusian Rouble could result in further declines in BNB’s regulatory capital. Although the Group seeks to minimise its open foreign currency positions through limits on the Group’s foreign currency positions in accordance with NBG regulations and through swap agreements, there can be no assurance that these measures will protect against foreign exchange risks since any additional depreciation of the Belarusian Rouble may lead to further erosion of the Group’s share capital and pressure on its capital adequacy ratios. The Group is subject to counterparty risk in respect of its swap agreements (including its currency swap agreement with the NBRB), as the Group’s counterparties may not honour their obligations under the relevant swap agreement.
If the Lari exchange rate against the US dollar or the Belarusian Rouble exchange rate against the Euro fluctuates, or any of the Group’s counterparties default on their obligations, this could lead to the Group suffering losses which could, in turn, have a material adverse effect on the Group’s business, financial condition and results of operations.
The Group’s risk management methods may prove ineffective at mitigating credit riskLosses relating to credit risk may arise if the risk management policies, procedures and assessment methods implemented by the Group to mitigate credit risk and to protect against credit losses prove less effective than expected. The Group employs qualitative tools and metrics for managing risk that are based on observed historical market behaviour. These tools and metrics may fail to predict future risk exposures, especially in periods of increased volatility or falling valuations or in periods in which there is a rapid expansion of the Group’s loan portfolio. In addition, even though the Group requires regular financial disclosure by its corporate customers’, customer financial statements may not always present a complete and accurate picture of each customer’s financial condition. Furthermore, some of the Group’s corporate customers may not have extensive or externally-verified credit histories, and their accounts may not be audited by a reputable external auditor. Therefore, notwithstanding the Group’s credit risk evaluation procedures, the Group may be unable to evaluate effectively the current financial condition of each prospective corporate borrower and to evaluate the ability
50 Bank of Georgia Holdings PLC Annual Report 2012

of such corporate borrower to repay its loans when due. Similarly, the financial condition of some private individuals transacting business with the Group is difficult to assess and predict, as some retail borrowers have no or very limited credit history. Accordingly, the risk management systems employed by the Group may prove insufficient in measuring and managing risks and this may have a material adverse effect on the Group’s business, financial condition and results of operations.
Additional risks arising principally from the Group’s banking activitiesThe Group faces liquidity riskThe Group becomes exposed to liquidity risk when the maturities of its assets and liabilities do not coincide. Liquidity risk is inherent in banking operations and can be heightened by a number of factors, including an over-reliance on, or an inability to access, a particular source of funding, changes in credit ratings or market-wide phenomena such as financial market instability and natural disasters. The Group seeks to manage its liquidity risk by, among other things, maintaining a diverse funding base comprising short-term sources of funding (including retail and corporate customer deposits, inter-bank borrowing and borrowing from the NBG) and longer-term sources of funding (including borrowing from international credit institutions, sales and purchases of securities and long-term debt securities). The Group’s current liquidity may be affected by unfavourable financial market conditions. If assets held by the Group in order to provide liquidity become illiquid or their value drops substantially, the Group may therefore be required, or may choose, to rely on other sources of funding to finance its operations and expected future growth. However, there is only a limited amount of funding available on the Georgian inter-bank market and the Group’s recourse to other funding sources may pose additional risks, including the possibility that other funding sources may be more expensive and less flexible. In addition, the Group’s ability to access such external funding sources is directly connected with the level of credit lines available to the Group, and this in turn is dependent on the Group’s financial and credit condition, as well as general market liquidity.
As at 31 December 2012, 2011 and 2010, 87.7%, 92.7%, and 92.8%, respectively, of the Group’s amounts due to customers had maturities of one year or less while 48.2%, 55.6% and 48.3%, respectively, were payable on demand. As at the same dates, the Group’s ratio of net loans to amounts due to customers was 114.8%, 95.7%, and 116.8%, respectively. In terms of current and short-term liquidity, the Group is exposed to the risk of unexpected, rapid withdrawal of deposits by its customers in large volumes. Circumstances in which customers are more likely to rapidly withdraw deposits in large volumes include a severe economic downturn, a loss in consumer confidence, an erosion of trust in financial institutions, or a period of social, economic or political instability. By way of example, the Group experienced a higher than usual volume of customer withdrawals in the period following the 2008 Conflict. See “Political and governmental instability in Georgia could have an adverse effect on the local economy
and the Group”. If a substantial portion of the Group’s customers rapidly or unexpectedly withdraw their demand or term deposits or do not roll over their term deposits upon maturity, this could have a material adverse effect on the Group.
The Group is subject to certain regulatory ratiosThe Bank, like all regulated financial institutions in Georgia, is required to comply with certain capital adequacy and regulatory ratios set by the NBG. Although in the past, the Bank’s investments to equity and investment plus fixed assets to equity financial ratios have been below the level set by the NBG, the NBG confirmed on 31 December 2009 that it would not impose any sanctions on the Bank as a result and the Bank has been in compliance with both of these financial ratios since February 2011.
In December 2010, the Basel Committee on Banking Supervision published the Basel III rules setting out certain changes to capital requirements applicable to banks. Implementation of the new, combined regulation based on Basel II and Basel III takes place at a national level, the NBG is currently in the process of implementing Basel II and Basel III in Georgia. On 17 January 2013, the NBG published a draft regulation for capital adequacy based on Basel II and Basel III, which makes adjustments to certain Basel II and Basel III rules, including those relating to foreign currency additional risk weights, specific measurements and risk estimates. The Group had expected that the Basel III requirements are phased in over a period of time commencing in April 2013. However, the NBG has notified the Bank about the delay in the implementation of Basel II and Basel III until 1 January 2014. The NBG is expected to publish an updated implementation schedule in due course. As the implementation of Basel II and Basel III will be the subject of rules that have yet to be adopted in Georgia, the Group cannot predict the impact such rules will have on the Group’s overall capital requirements.
In addition, BNB is licensed by the NBRB and is required to comply with certain capital adequacy ratios and minimum share capital requirements set by the NBRB. Although BNB has the minimum level of regulatory capital required by NBRB to conduct banking operations in Belarus (the minimum level for this purposes is set at the equivalent of €5 million and, as at 31 December 2012, the regulatory capital of BNB was €17.3 million), BNB has not had the minimum level of regulatory capital required by NBRB in order to hold deposits from individuals (set at the equivalent of €25 million for this purpose) since May 2011. Although BNB has received a temporary waiver effective until 1 January 2014 in respect of this breach, there is no assurance that BNB will be able to comply with the minimum level of regulatory capital required by NBRB by 1 January 2014, or that it will be able to obtain a further waiver from the NBRB thereafter. For further information see “Currency fluctuation have affected, and may continue to affect, the Group”. If BNB’s level of regulatory capital remains below the minimum level required by the NBRB after the temporary waiver expires and no new waiver is obtained, the NBRB may revoke BNB’s licence to accept retail deposits. As at 31 December 2012, BNB had GEL 49.7 million in deposits from individuals, representing 1.9% of the Group’s total customer deposits and 1.1% of total liabilities.
Bank of Georgia Holdings PLC Annual Report 2012 51
OverviewPerform
anceGovernance
Financial Statements
Additional Information

Performance: Principal Risks and Uncertainties continued
Save for BNB not having the minimum level of regulatory capital required by the NBRB in order to hold retail deposits, the Group is not in breach of any applicable capital adequacy or regulatory ratios and the Board believes that the Group overall has adequate capital for at least the next 12 to 18 months. However, the Group’s ability to comply with applicable capital adequacy and regulatory ratios could be affected by a number of factors, some of which are beyond the Group’s control, including:
– an increase of the Bank’s risk-weighted assets; – the Group’s ability to raise capital; – losses resulting from a deterioration in the Group’s asset quality, a reduction in income levels, an increase in expenses or a combination of all of the above;
– a decline in the values of the Group’s securities portfolio; – changes in accounting rules or in the guidelines regarding the calculation of the capital adequacy ratios; and
– increases in minimum capital adequacy ratios imposed by the NBG.
Failure to maintain the minimum capital adequacy and other regulatory ratios may have a material adverse effect on the Group. Moreover, a breach of regulatory requirements relating to the minimum capital adequacy and other regulatory ratios may result in entities in the Group being subject to regulatory or administrative sanctions, which could impact the Group’s ability to conduct its business, result in an increase in the operating costs of the Group and loss of reputation which could have a material adverse effect on the Group’s financial condition.
The Group’s businesses are subject to substantial regulation and oversight and future changes in regulation, fiscal or other policies are unpredictable
Currently, the Bank is required to comply with Georgian banking regulations. In addition to mandatory capital adequacy ratios, the NBG is authorised to set lending limits and other economic ratios in Georgia, with which the Bank is required to comply. Under Georgian banking regulations, the Bank is required to, among other things, comply with minimum reserve requirements and mandatory financial ratios and file periodic reports. In addition to its banking operations, the Group also provides other regulated financial services and offers financing products, including brokerage and pension fund operations, as well as insurance and healthcare products through its insurance and healthcare subsidiary and services that are subject to governmental supervision. Additionally, the business, financial condition and results of operations of the Group’s activities in Belarus are affected by legal regulations, instructions and recommendations, including those issued by the NBRB and the NBG, including those which seek to implement Basel III into national law. See “The Group is subject to certain regulatory ratios”.
Future changes in regulation, fiscal or other policies are unpredictable and there is often a delay between the announcement of a change and the publication of detailed rules relating to such change. For example, the NBG has indicated that it is considering introducing a new liquidity framework in Georgia but has yet to confirm the details or
timing for the implementation of such liquidity framework. There can be no assurance that the current regulatory environment in which the Group operates will not be subject to significant change in the future, including change as a result of a change in government in Georgia or Belarus, or that the Group will be able to comply with any or all resulting regulations. See “Political and governmental stability in Georgia could have an adverse effect on the local economy and the Group”.
The Group is subject to operational risk inherent in its business activitiesThe Group is subject to the risk of incurring losses or undue costs due to the inadequacies or failure of internal processes or systems or human error, or from errors made during the execution or performance of operations, clerical or record-keeping errors, business disruptions (caused by various factors such as software or hardware failures and communication breakdowns), failure to execute outsourced activities, criminal activities (including credit fraud and electronic crimes), unauthorised transactions, robbery and damage to assets.
Although the Board believes that the Group’s risk management policies and procedures (which are designed to identify and analyse relevant risks to the Group’s business, prescribe appropriate limits to various risk areas and monitor the level and incidence of such risks on an on-going basis) are adequate and that the Group is currently in compliance in all material respects with all laws, standards and recommendations applicable to the Group, any failure of the Group’s risk management system to detect unidentified or unanticipated risks, or to correct operational risks, or any failure of third parties adequately to perform outsourced activities could have a material adverse effect on the Group’s business, financial condition and results of operations.
Risks affecting the Group’s non-banking activitiesThe Group’s insurance subsidiary, Aldagi BCI, is subject to the risks inherent in the insurance industry
Aldagi BCI, operates in the property and casualty, life and health insurance industry. In the ordinary course of business, Aldagi BCI seeks to reduce losses that may arise from catastrophes or other events through reinsurance. Under such reinsurance arrangements, reinsurers assume a portion of the losses and related expenses, however, Aldagi BCI remains liable as the direct insurer on all risks reinsured. Consequently, ceded reinsurance arrangements do not eliminate Aldagi BCI’s obligation to pay under its insurance policy for losses insured, which could cause a material increase in Aldagi BCI’s liabilities and a reduction in its profitability. Moreover, Aldagi BCI is subject to its reinsurers’ credit risk and solvency and their willingness to make payments under the terms of reinsurance arrangements with respect to its ability to recover amounts due from them.
52 Bank of Georgia Holdings PLC Annual Report 2012

Although Aldagi BCI adheres to strict reinsurance policies and periodically evaluates the financial condition of its reinsurers to minimise its exposure to significant losses from reinsurer insolvencies, reinsurers may become financially unsound by the time their financial obligations become due. The inability of any reinsurer to meet its financial obligations to Aldagi BCI could negatively impact Aldagi BCI’s financial condition and results of operations. In addition, the availability, amount and cost of reinsurance depend on general market conditions which may fluctuate. Reinsurance may not be available to Aldagi BCI at commercially reasonable rates, or at all, and any decrease in the amount of Aldagi BCI’s reinsurance will increase its risk of loss.
In accordance with industry practices and accounting regulatory requirements, Aldagi BCI establishes reserves for reported claims, incurred but not reported claims and unearned premiums. Reserves do not represent an exact calculation of liability, but instead represent estimates of what the ultimate settlement and administration of claims will cost based on an assessment of facts and circumstances then known, review of historical settlement patterns, estimates of trends in claims severity, frequency of claims, legal theories of liability and other factors. There can be no assurance that actual claims will not materially exceed its claims reserves and have a material effect on its financial condition and results of operations.
The Group’s real estate subsidiary, m2 Real Estate, is subject to the risks of developing and selling real estateThe Group’s real estate subsidiary m2 Real Estate, is primarily engaged in developing affordable residential properties for sale and rent. Real estate property investments are subject to varying degrees of risk which affect the level of income from the value of properties including:
– changes in the Georgian economic climate; – local conditions such as a surplus of similar properties or a reduction in demand for the property;
– the attractiveness of the property to tenants and purchasers;
– occupancy rates and the ability to collect rent from tenants;
– laws, governmental regulations, including environmental regulation, tax laws and insurance; and
– acts of nature, such as earthquakes, floods and other extreme weather events that may damage the property.
In addition, m2 Real Estate’s projects are subject to the general risks associated with construction and development, including:
– cost overruns due to increased material, labour or other costs, which could make completion of the project unprofitable;
– the inability to obtain, or delays in obtaining, required zoning, land-use, building, occupancy, and other governmental permits and authorisations, which could result in increased costs and could require m2 Real Estate to abandon a project entirely; and
– m2 Real Estate may be unable to complete construction and leasing of a property on schedule.
Any of these factors could have a material adverse effect on the financial condition and operating results of m2 Real Estate which may have an adverse effect on the Group’s financial condition and results of operations.
Other risks affecting the GroupThe Group may not successfully implement its strategyThe Group aims to achieve long-term sustainable growth and profitability through a secure, modern and universal banking model, as well as to maintain and enhance its leading market position in Georgia. In addition, the Group’s strategy is to diversify its business through the addition of businesses that have strong synergies with its banking operations. Furthermore, the Bank is concentrating on the Georgian market and the Bank’s subsidiary, Joint Stock Company BG Capital (“BG Capital”), has exited from its brokerage operations in Ukraine and Belarus. In addition, the Group intends to exit from its other non-core operations, including through the sale of Liberty Consumer and its interest in BNB. The Group may seek to pursue selective acquisitions in Georgia.
There can be no assurance that the Group will be able to achieve its major strategic objectives, including in respect of its synergistic businesses, such as insurance and healthcare, which may be affected by market conditions, potential legal and regulatory impediments and other factors, or that it will be able to exit from its non-core operations at a satisfactory price, or at all. Any failure by the Group to achieve its strategic objectives could have a material adverse impact on the Group’s reputation, business, financial condition and results of operations.
The Group faces competitionIn recent years the Georgian banking sector has become increasingly competitive. According to the NBG, as at December 2012 there were 20 commercial banks, of which 18 are foreign controlled. The Group competes with a number of these banks, including TBC Bank, ProCredit Bank, Bank Republic and VTB Georgia. In particular, as ProCredit Bank has a large market share in respect of SME and micro finance loans, the Group faces competition from ProCredit Bank in relation to SME and micro financing in Georgia. TBC Bank and Bank Republic are the Bank’s principal competitors in the corporate sector. In addition, both the mortgage market and the market for the provision of financial services to high net worth individuals are highly competitive in Georgia, with some competitors in the mortgage market implementing aggressive pricing policies in order to retain or build their market share. Additionally, in Belarus, the Group competes with a wide range of local (including state-owned) and international banks.
There can be no assurance that the current regulatory environment in which the Group operates in respect of competition and anti-monopoly matters will not be subject to significant change in the future. Anti-monopoly matters are currently handled by the NBG. However, as part of the Georgian Government’s anti-monopoly policies, it may, in the future, seek to legislate or regulate competition and
Bank of Georgia Holdings PLC Annual Report 2012 53
OverviewPerform
anceGovernance
Financial Statements
Additional Information
Performance: Principal Risks and Uncertainties continued
anti-monopoly matters in the Georgian banking industry and as part of any such changes, it is possible that anti-monopoly regulation could be enforced by a governmental agency other than NBG. The Group cannot predict whether Parliament will seek to do this, or if they did, what such laws or regulations would be. In addition, the Group cannot predict whether it would be able to comply with any or all such laws or regulations.
In addition, although there are currently no anti-monopoly regulations in Georgia that establish market share limits, there can be no assurance that such anti-monopoly limitations will not be introduced in Georgia in the future. Given the current high market share maintained by the Group, the introduction of any anti-monopoly restrictions may have an effect on the growth rates of the Group, restrict the Group’s ability to make future acquisitions, or lead to the Group being compulsorily required to sell some of its assets or exit or reduce business areas.
Increased competition may have a negative impact on the Group’s ability to sustain its margin and fee levels, particularly if the Group’s competitors possess greater financial resources (especially in the case of banks with foreign capital investment or banks which are branches of non-resident foreign banks, by way of access to funding from foreign capital or their parent entity), access to lower-cost funding and a broader offering of products than the Group, or if the Group’s competitors merged to significantly enhance their financial resources, access to funding and product offerings. Unlike most of its competitors, the Group has a relatively wide shareholder base and does not have an international financial institution as a majority shareholder. In 2008 and 2009, the Group’s financing costs increased (which in turn had a negative impact on the net interest income earned by the Group) due to, among other things, increasing interest rates on bank deposits resulting from increasing competition in the deposit market. In addition, increasing competition could lead to significant pressure on the Group’s market share. Increasing competition in the banking industry has already led to and may, in the future, continue to lead to increased pricing pressures on the Group’s products and services, which could have a material adverse effect on the Group’s business financial condition and results of operations.
The Group depends on its key management and qualified personnelThe Group’s current senior management team includes a number of persons that the Board believes contribute significant experience and expertise in the banking and other industries in which the Group operates. The Group’s ability to continue to retain, motivate and attract qualified and experienced banking and management personnel is vital to the Group’s business. There can be no assurance that the Group will be able to successfully recruit and retain the necessary qualified personnel. The loss or diminution in the services of members of the Group’s seniormanagement team or an inability to recruit, train or retain necessary personnel could have a material adverse effect on the Group.
The Group’s insurance policies may not cover, or fully cover, certain types of lossesThe Group generally maintains insurance policies covering its assets, operations and certain employees in line with general business practices in Georgia. The Group seeks to insure against a range of risks including fire, lightning, flooding, theft, vandalism and third-party liability. The Group also maintains Bankers’ Blanket Bond and directors’ and officers’ liability insurance. However, there can be no assurance that all types of potential losses are insured or that policy limits would be adequate to cover them. Any uninsured loss or a loss in excess of insured limits could adversely affect the Group’s existing operations and could have an adverse effect on the Group’s financial condition and results of operations.
The Group faces certain risks associated with conducting international operationsThe Group has historically made investments in Ukraine and Belarus. The Group’s financial results in 2009 were adversely affected by a goodwill write-down in the amount of GEL 73.1 million, predominantly due to the write-off of the entire goodwill associated with BG Bank, as a result of a weak economic environment in Ukraine and high loan and finance lease receivables impairment charges in respect of BG Bank in 2008 and 2009. In February 2011, the Group disposed of its 80% interest in BG Bank. The Group’s financial results in 2011 were adversely affected by a goodwill write down in the amount of GEL 23.4 million, due to the write off of the entire goodwill associated with BNB, as a result of a material devaluation of the Belarusian Rouble. For further information, see “Currency fluctuations have affected and may continue to affect the Group”.
As part of its revised strategy to concentrate on the Georgian market the Group disposed of an 80% equity interest in BG Bank (in respect of which the remaining GEL 7.6 million (US$ 4.6 million) instalment of the purchase price has been fully provisioned and written off as of 31 December 2012. The Group will continue to seek to exit from its international operations (including its interest in BG Bank and, in due course, BNB) at an appropriate time. While it holds these assets, the Group will continue to be subject to risks relating to these operations including certain political and economic risks, compliance risks and foreign currency exchange risks, as well as the risk of failure to market adequately to potential customers in other countries. Any failure to manage such risks may cause the Group to incur increased liabilities which could have a material adverse effect on the Group’s business, financial condition and results of operations.
54 Bank of Georgia Holdings PLC Annual Report 2012

If the Group fails to comply with any applicable regulations relating to, or the Group is associated with, money laundering or terrorist financing, this could have an adverse effect on the GroupAlthough the Group has implemented comprehensive anti-money laundering (“AML”), “know-your-customer”, “know your corresponding bank” and “know your employee” policies, and is in the process of implementing such policies throughout its financial subsidiaries (including insurance and brokerage subsidiaries), which are monitored by its AML Compliance Department, and adheres to all requirements under applicable legislation aimed at preventing it being used as a vehicle to facilitate money laundering, there can be no assurance that these measures will be effective. If the Group fails to comply with timely reporting requirements or other AML regulations or is associated with money laundering or terrorist financing, this could have a material adverse effect on the Group’s business, financial condition and results of operations. In addition, involvement in such activities may carry criminal or regulatory fines and sanctions.
The uncertainties of the judicial system in Georgia, or any arbitrary or discriminatory state action taken in Georgia in the future, may have a material adverse effect on the local economy, which could and in turn, have an adverse effect on the GroupGeorgia is still developing an adequate legal framework required for the proper functioning of a market economy. For example, in Georgia, several fundamental civil, criminal, tax, administrative and commercial laws have only recently become effective. The recent nature of much of Georgian legislation and the rapid evolution of the Georgian legal system place the quality and the enforceability of laws in doubt and result in ambiguities and inconsistencies in their application.
In addition, the court system in Georgia is understaffed and has been undergoing significant reforms. Judges and courts in Georgia are generally less experienced in the area of business and corporate law than is the case in certain other countries, particularly in Europe and the United States. Most court decisions are not easily available to the general public, and enforcement of court judgments may, in practice, be difficult in Georgia. The uncertainties of the Georgian judicial system could have a negative effect on the Georgian economy, could have a material adverse effect on the Group’s business, financial condition and results of operations. In addition, to varying degrees, the same uncertainties of the judicial system in Georgia as discussed above apply to Belarus.
Uncertainties in the tax system in Georgia may result in the Group facing tax adjustments or fines in the future and there may be changes in current tax laws and policies
In Georgia, tax laws have not been in force for significant periods of time compared to more developed market economies, and often result in unclear or non-existent implementing regulations. Moreover, such tax laws are subject to frequent changes and amendments, which can result in unusual complexities for the Group and its business
generally. A new Tax Code was adopted in Georgia on 17 September 2010 and came into effect on 1 January 2011. Differing opinions regarding the interpretation of various provisions exist both among and within governmental ministries and organisations, including the tax authorities, creating uncertainties, inconsistencies and areas of conflict. While the new Tax Code provides for the Georgian tax authorities to provide advance tax rulings on tax issues raised, thereby reducing the uncertainty regarding interpretation, it is possible that the relevant authorities could take differing positions with regard to interpretative issues, which may result in the Group facing tax adjustments or fines. In addition, there can be no assurance that the current tax laws or government tax policies will not be subject to change in the future, including any changes introduced as a result of a change of government. See “Political and governmental instability in Georgia could have an adverse effect on the local economy and the Group”. Such changes could include the introduction of new taxes, an increase in the tax rates applicable to the Group or its customers or the introduction of a bank levy. Any such changes in the tax laws or governmental tax policies may have a material adverse effect on the Group. In addition, to varying degrees, the same uncertainties of the tax system in Georgia apply to Belarus.
There are additional risks associated with investing in emerging markets such as GeorgiaEmerging markets may have higher volatility, limited liquidity, a narrower export base and are subject to more frequent changes in the political, economic, social, legal and regulatory environment than more mature markets. Emerging economies are subject to rapid change and are particularly vulnerable to market conditions and economic downturns elsewhere in the world.
In addition, international investors’ reactions to events occurring in one emerging market country or region sometimes appear to demonstrate a contagion effect, in which an entire region or class of investment is disfavoured by investors. If such a contagion effect occurs, Georgia could be adversely affected by negative economic or financial developments in other emerging market countries. Georgia has been adversely affected by contagion effects in the past, including following the 1998 Russian financial crisis and the more recent global financial crisis. No assurance can be given that it will not be affected by similar effects in the future.
Financial or political instability in emerging markets also tends to have a material adverse effect on the capital markets of emerging economies and the wider economy as investors generally move their money to more developed markets, which may be considered to be more stable. These risks may be compounded by incomplete, unreliable, unavailable or untimely economic and statistical data on Georgia.
Bank of Georgia Holdings PLC Annual Report 2012 55
OverviewPerform
anceGovernance
Financial Statements
Additional Information

Managing risk effectively
Performance: Risk Management
The following discussion may not contain all the information that is important to readers of this Annual Report. For additional information relating to the risk management process and procedures of the Group, please refer to the Note 27 of the accompanying Consolidated Financial Statements.
Risk Management PolicyManagement of risk is fundamental to the banking business and is an essential element of the Bank’s operations. The Risk Management Policy adopted by BGH sets out the manner in which BGH identifies, assesses, manages and monitors the risk programme for BGH, the Bank and its other subsidiaries. The Bank seeks to manage its overall risk exposure by continuously improving its risk management policies and systems.
The main objectives of the Risk Management Policy are to:
– Set out the Group’s risk management bodies; – Set out the Group’s risk management and risk reporting procedures;
– Define roles and responsibilities within the Group in relation to risk;
– Identify and define the nature and extent of the Group’s significant risks;
– Formulate the Group’s risk appetite; – Ensure that identified risks are monitored and mitigated where possible; and
– Ensure that identified risks are properly reported, both internally and externally.
ResponsibilitiesResponsibility for the implementation risk of management procedures within the Group lies at all levels of the Group from BGH Board of Directors to business managers and risk managers. The distribution of responsibilities ensures that risk/return decisions are taken at the appropriate level.
BGH Risk Management Policy is available on the website:
http://bogh.co.uk/en/corporate-governance
All decisions related to risk and risk management reside at the BGH Board level, rather than being delegated to a separate Risk Committee, allowing each Director to contribute meaningfully to the risk management of the Group. The BGH Board is responsible for setting the Group’s risk philosophy and appetite and approving the overall risk management strategy and policy of the Group. It is responsible for maintaining sound system of internal control that supports the achievement of its goals and objectives.
The BGH Board is also responsible for overseeing the establishment, implementation and review of the Group’s risk management systems and, to this end, has delegated certain risk management functions to different executive boards, executive committees and management of its subsidiaries, as deemed necessary. At least once a year, the BGH Board conducts a review of the effectiveness of the Group’s risk management and internal control systems, including the Risk Management Policy. The review covers all material controls, including financial, operational and compliance controls.
The Audit Committee of BGH is responsible for assessing the role and effectiveness of the internal audit function as well as keeping under review the Group’s internal controls and systems for assessing and mitigating financial and non-financial risks. (Please see further details on the Audit Committee on page 77.)
Bank of Georgia’s risk management procedures are designed to identify and analyse relevant risks to its business, prescribe appropriate limits to various risk areas and to monitor the level and incidence of such risks on an ongoing basis. The Bank regularly reviews its risk analysis processes in order to institute improvements which are required in light of the development and growth of its business and the varying nature of the risks which the Bank faces in its day-to-day business.
56 Bank of Georgia Holdings PLC Annual Report 2012

The Bank’s risk management system is based on the principle of continually assessing risk throughout the life of any operation and includes such stages as:
– risk identification; – quality and quantity assessment of a particular risk; – determination of an acceptable risk level; – placement of limits and creation of reserves; – use of collateral; – ongoing monitoring and control allowing efficient adjustments in case of any negative changes in the conditions on which the preliminary risk assessment was made; and
– analysis of efficiency of the risk management system.
The major risks inherent in the Bank’s operations are liquidity risk, market risk (including currency exchange rate risk and interest rate risk), credit risk, operational risk and legal risk.
The Supervisory Board is responsible for the overall risk management approach and for approving risk strategies and principals and is ultimately responsible for identifying and controlling risks. It approves the Bank’s Credit Policies, which outline credit risk control and monitoring procedures and the Bank’s credit risk management systems and approves certain decisions which fall outside the scope of the Credit Committees’ authority (including approvals of single group borrower lending exposure exceeding US$ 25.0 million). The Bank Management Board presents a comprehensive credit risk report and market risk report to the Bank’s Supervisory Board for their review on a quarterly basis.
The Audit Committee has overall responsibility for developing and implementing overall risk assessment and risk mitigation strategies, principles, frameworks, policies and limits. It is responsible for fundamental risk issues and manages and monitors compliance of relevant risk management decisions with the Bank’s risk management policy, covering but not limited to: macroeconomic and environmental risks, general control environment, manual and application controls, risks of intentionally or unintentional misstatements, risk of fraud or misappropriation of assets, information security, anti-money laundering, information technology risks, etc. The Bank Audit Committee facilitates
the activities of the internal audit and external auditors of the Bank. The Bank Internal Audit also reviews AML policies and procedures and presents audit reports on AML to the Audit Committee on a quarterly basis. The Bank Audit Committee is elected and directly monitored by the Bank Supervisory Board.
The Management Board has overall responsibility for the Bank’s asset, liability and risk management activities, policies and procedures. The Management Board delegates individual risk management functions to each of the various decision making and execution bodies within the Bank.
Treasury is responsible for managing the Bank’s assets and liabilities and the overall financial structure and is also primarily responsible for managing funding and liquidity risks of the Bank.
The Internal Audit department ensures that the Bank’s policies conform to current legislation and regulation and professional norms and ethics. The Internal Audit department is responsible for monitoring and assessing the adequacy of compliance with internal procedures at all levels of the Bank’s management. This department regularly inspects the integrity, reliability and compliance with applicable law of operations conducted by departments of the Bank that are responsible for risk management, and regularly reviews the reliability of the Bank’s information technology systems in accordance with a predetermined schedule. It also assesses the reliability and integrity of financial information and monitors the Bank’s internal controls and reporting procedures. The Internal Audit department is independent from the Bank Management Board. The Head of the Internal Audit department is appointed by the Bank Supervisory Board and reports findings and recommendations directly to both the Bank and BGH Audit Committees.
The principal function of the Internal Audit department is to reduce the levels of operational and other risks, audit the Bank’s internal control systems, and detect any infringements or errors on the part of the Bank’s departments and divisions.
Risk Management Bodies of Bank of Georgia*
Management Board
Audit Committee
Internal Audit
Supervisory Board of Bank of Georgia
Credit Risk Management Legal Financial Risk
ManagementAnti-Money Laundering
Operational Risk Management Treasury
Credit Committees
Asset and Liabilities Management
Committee (ALCO)
* Bank of Georgia is the principal subsidiary of Bank of Georgia Holdings.
Bank of Georgia Holdings PLC Annual Report 2012 57
OverviewPerform
anceGovernance
Financial Statements
Additional Information

Performance: Risk Management continued
As part of its auditing procedures, the Internal Audit department is responsible for the following:
– identifying and assessing potential risks regarding the Bank’s operations;
– reviewing the adequacy of the existing controls established in order to ensure compliance with the Bank’s policies, plans, procedures and business objectives;
– developing internal auditing standards and methodologies;
– carrying out planned and random inspections of the Bank’s branches and subdivisions and auditing its subsidiaries;
– analysing the quality of the Bank’s products; – participating in external audits and inspections by the NBG;
– making recommendations to management on the basis of external and internal audits to improve internal controls;
– monitoring the compliance of the Bank with the NBG regulations; and
– monitoring the implementation of auditors’ recommendations.
The Internal Audit Department applies a risk-based audit approach to assess the significant risks that impact the Bank’s business, how (and how well) those risks are managed and controlled, what measures are used to monitor the process, the reliability of the Bank’s key performance indicators and management information and the efficiency of the process.
Credit Committees. The Bank’s Credit Committees are at the centre of the Bank’s lending and approval process. The Credit Committees supervise and manage the Bank’s credit risks. The Credit Committees supervise and manage the Bank’s credit risks in respect of retail loans (which, for risk management purposes include wealth management loans) and corporate loans. Each Credit Committee approves individual loan transactions and establishes credit risk categories and provisioning rates on such transactions.
Subcommittee Chair Approval limit for Retail Banking loans (US$)
Tier I Risk Manager of the relevant Credit Risk Management
Less than US$150,000
Tier II Deputy Head of Credit Risk Management department
Between US$150,000 and US$300,000 for retail loans
Tier III Director of the Credit Risk Management department
Between US$300,000 and US$2.0 million
Tier IV CEO/CRO Greater than US$2.0 million
Subcommittee Chair Approval limit for Corporate Banking loans (US$)
Tier I Risk Manager of the relevant Credit Risk Management
Less than US$500,000 (US$200,000 for new issuer
Tier II Head of the Credit Risk Analysis unit Between US$500,000 and US$1.5 million (or between US$200,000 and US$750,000 for a new borrower)
Tier III CEO/CRO Greater than US$1.5 million (or greater than US$750,000 for a new borrower)
Credit Committee tiers of subcommittees
The Deputy CEO, Chief Risk Officer, or CRO and the Credit Risk Management department review the credit quality of the loan portfolio, set provisioning rates and, in consultation with the Bank’s CEO and the Deputy CEO, Finance, adopt decisions on the acceleration and write-off, on a monthly basis. Each Credit Committee is comprised of tiers of subcommittees. The Credit Committee for retail loans comprises four tiers of subcommittee.
All exposures to single Corporate Banking borrowers over US$25.0 million require approval by the Supervisory Board. Each of the subcommittees of the Credit Committees make their decisions by a majority vote of their respective members.
The Bank’s Micro and SME Credit Committee approves loans resulting in the Bank’s overall exposure of up to US$ 500,000, while decisions on loans under US$ 100,000 are made at the branch level pursuant to joint approval by the Director of the Micro and SME Lending department or group leader.
The Bank has in place a Problem Loan Recovery Committee, which manages the Bank’s exposures to problem loans and reports to the Deputy CEO, Chief Risk Officer. The Deputy CEO, Chief Risk Officer also chairs the committee which oversees loans which are the subject of litigation. The Problem Loan Recovery Committee is chaired by one of the following: (1) the heads of the Problem Loan Management department; (2) the heads of the Risk departments; or (3) the Deputy CEO, Chief Risk Officer, depending on the level of exposure.
The Corporate Recovery Committee is responsible for monitoring all of the Bank’s exposures to loans that are being managed by the Corporate Recovery Department. The Corporate Recovery Committee is chaired by the Deputy CEO, Chief Risk Officer.
58 Bank of Georgia Holdings PLC Annual Report 2012

The Asset and Liabilities Management Committee (“ALCO”) is the core risk management body that establishes policies and guidelines with respect to capital adequacy, market risks and respective limits, funding liquidity risk and respective limits, interest rate and prepayment risks and respective limits, money market general terms and credit exposure limits, designs and implements respective risk management and stress testing models in practice and regularly monitors compliance with the pre-set risk limits, approves treasury deals with non-standard terms.
Specifically, ALCO: – Sets money-market credit exposure/lending limits; – Sets open currency position limits with respect to overnight and intraday positions
– Establishes stop-loss limits for foreign currency operations and securities;
– Monitors compliance with the established risk management models for foreign exchange risk, interest rate risk and funding liquidity risk;
– Sets ranges of interest rates for different maturities at which the Bank may place its liquid assets and attracts funding; and
– Reviews different stress tests and capital adequacy models prepared by the Finance Department.
The ALCO is chaired by the CEO and at any time deemed necessary, with decisions made by a majority vote of its members. ALCO members include the CEO, Deputy CEO Finance, Deputy CEO, Chief Risk Officer, Deputy CEO Corporate Banking, Deputy CEO, Retail Banking, Deputy CEO, Asset and Wealth Management, the Head of the Financial Department, the Head of the Financial Risk Management Unit of the Finance Department, the Head of the Treasury Department and the Head of the Funding Department. The ALCO reviews financial reports and indices including the Bank’s limits/ratios, balance sheet, statement of operations, maturity gap, interest rate gap, currency gap, foreign exchange risk, interest risk and funding liquidity risk reports, total cash flow analyses, customer cash flow analysis, concentration risk analysis, for the past periods as well as future projections and forecasts, other financial analysis and further growth projections on a monthly basis.
Regulatory capital requirements in Georgia are set by NBG and are applied to the Bank, on a stand-alone basis. NBG requires the Bank to maintain a minimum Total Capital adequacy ratio of 12% of risk-weighted assets and a minimum Tier I Capital adequacy ratio of 8% of risk-weighted assets, both computed based on the Bank’s stand-alone special purpose financial statements prepared in accordance with NBG regulations and pronouncements. The Bank also follows Basel I capital adequacy regulations on its own, having established respective minimal internal ratios of 16% for Total Capital and 10% for Tier I Capital, as opposed to 8% and 6% of original Basel I pronouncement, respectively. ALCO is the key governing body for the Capital adequacy management as well as for the respective risks identification and management. ALCO establishes limits and reviews actual performance over those limits for both, NBG as well as Basel I capital adequacy regulations. Finance Department is in charge of regular monthly monitoring and reporting over NBG and Basel I capital adequacy compliance with original pronouncements
as well as with ALCO policies. Capital adequacy management is an integral part of the Bank’s actual monthly reporting as well as the Bank’s annual and semi-annual budget approval and budget review processes. Finance Department prepares NBG and Basel I capital adequacy actual reports as well as their forecasts and budgets, as well as different stress scenarios for both regulations, while ALCO and the Management Board regularly review them, identify risks, issue recommendations or propose amendment measure.
The Legal department’s principal purposes are to ensure the Bank’s activities conform to applicable legislation and to minimise losses from the materialisation of legal risks. The Legal department is responsible for the application and development of mechanisms for identifying legal risks in the Bank’s activities in a timely manner, investigation of the Bank’s activities in order to identify any legal risks, planning and implementation of all necessary actions for the elimination of identified legal risks, participation in legal proceedings on behalf of the Bank where necessary and investigating possibilities for increasing the effectiveness of the Bank’s legal documentation and its implementation in the Bank’s daily activities. The Legal department is also responsible for providing legal support to structural units of the Bank.
The Anti-Money Laundering Compliance department is responsible for the implementation of the Bank’s AML programme (including the development of AML policies and procedures, transaction monitoring and reporting and employee training) throughout the Bank and its subsidiaries. The AML programme is based on recommendations and requirements of Georgian and international organisations including the Financial Action Task Force on Money Laundering and the Office of Foreign Assets Control of the United States Department of the Treasury. The Bank’s Internal Audit department audits the AML Compliance department and monitors implementation of the AML programme. It is fully independent of all other business functions within the Bank.
The Bank and BGH have policies and procedures aimed at preventing money laundering and terrorist financing, including a general anti-money laundering policy and rules on counteracting money laundering and financing of individuals and legal entities engaged in terrorist activities and in the case of the Bank, procedures for reporting to the Financial Monitoring Service of Georgia (“FMS”), a legal entity of public law. The FMS was established in 2003 and serves as Georgia’s financial intelligence unit. These procedures aim to, among other things, minimise the risk of the Bank being used as a vehicle for money laundering or terrorist financing, protect the Bank from financing and reputation risks of being associated with money laundering or terrorist financing activities and ensure that banking services are provided only to bona fide clients.
The Bank has also implemented specific policies and procedures in order to satisfy the requirements of the EU’s Third Directive, which requires financial institutions to identify and verify the identity of its customers and their beneficial owners and monitor its customers’ transactions, while taking into account a risked-based approach.
Bank of Georgia Holdings PLC Annual Report 2012 59
OverviewPerform
anceGovernance
Financial Statements
Additional Information
Performance: Risk Management continued
Adopting a risk-based approach implies the adoption of a risk management process for dealing with money laundering and terrorist financing. This process encompasses recognising the existence of risks, undertaking an assessment of those risks and developing strategies to manage and mitigate the identified risks. The Bank uses a risk assessment matrix based on the client, sector, country and product risk. The Bank has a general AML policy; “know your customer” procedures that require it to identify its clients, verify their identity and their ultimate beneficial owners as well as the economic rationale of their transactions; “know your correspondent bank” procedures that involve careful screening of prospective correspondent banks’ AML policies; and “know your employee” procedures to prevent its employees’ involvement in money laundering and financing terrorism.
The Bank’s risk-based approach means that it applies enhanced due diligence procedures if it determines that there is a significant risk that particular clients are engaged in money laundering and financing terrorism.
The Bank carries out transaction monitoring using profiling and rules-based methodologies. Customer profiling is used to identify unusual patterns of activity by comparing current patterns with previous transactions by the same customer or peer group. Under the rule-based methodology, certain types of transactions over GEL 30,000 or its equivalent in foreign currencies as well as transactions involving certain high-risk, non-cooperative or suspicious jurisdictions are subject to monitoring and reporting.
Implementation of Risk Management SystemThe Bank’s risk management system is implemented by the Finance Department and the Treasury, Credit Risk Management, Operational Risk Management and Control, Legal, AML Compliance and Security Departments and other departments. The Reporting and Analysis unit and the Financial Risk Management unit of the Finance Department report to the Head of the Finance Department. The Finance Department and the Treasury Department report to the Deputy CEO, Finance. The Credit Risk Management (Corporate Banking Portfolio Analysis) and Operational Risk Management and Control Departments report to the Deputy CEO, Chief Risk Officer.
The Retail Credit Risk Management Department reports to the Deputy CEO, Retail Banking and Deputy CEO, Chief Risk Officer. The Legal and AML Compliance Departments report to the Deputy CEO, Legal. The Financial Risk Management unit of the Finance department, in coordination with the Treasury, implements the Bank’s market risk policies by ensuring compliance with established open currency position limits, counterparty limits, and the interest rate policy set by the ALCO. The Treasury department manages foreign currency exchange, money market, securities portfolio and derivatives operations and monitors compliance with the limits set by the ALCO for these operations. The Treasury Department is also responsible for management of short-term liquidity and treasury cash flow and monitors the volumes of cash in the Bank’s ATMs and at its branches.
The Credit Risk Management department manages credit risks with respect to particular borrowers and assesses overall loan portfolio risks. It is responsible for ensuring compliance with the Bank’s Credit Policies, management of the quality of the Bank’s loan portfolio and filing and loan administration.
The Operational Risk Management and Control Department is responsible for identification and assessment of operational risk categories within the Bank’s processes and operations. It is also responsible for detecting critical risk areas or groups of operations with an increased risk level and developing internal control procedures to address these risks, including (among others) business-process optimisation schemes, including document circulation, information streams, distribution of functions, permissions and responsibility.
The Legal Department monitors all changes in relevant laws and regulations, and ensures that those changes are properly reflected in the Bank’s procedures, instructions, manuals, templates and other relevant documentation. It also disseminates information on legislative changes to all relevant departments within the Bank. The Legal department also participates in drafting laws and regulatory documents upon request of legislators and regulators, certain associations and other professional bodies. The Legal department is responsible for registering the collateral taken by the Bank, monitored by the credit administration and documentation unit.
The Tax Compliance unit of the Finance Department focuses on the Bank’s relationship with the tax authorities and provides practical advice and monitors tax compliance across the Group.
Each of the foregoing departments is provided with policies and/or manuals that are approved by the Bank Management Board and/or the Bank Supervisory Board. The manuals and policies include comprehensive guidance for each stage of a transaction, including, but not limited to, manuals outlining asset and liability management policies, foreign exchange operations procedures, fixed income investment guidelines, retail banking operations procedures, the deposit policy and the credit policies.
Risk Types, Monitoring and Mitigation ProceduresThe Bank measures risk using a method which reflects both the expected loss likely to arise in normal circumstances and unexpected losses, which are an estimate of the ultimate actual loss based on different forecasting models. These models use probabilities derived from historical experience, adjusted from time to time to reflect the economic environment. The Bank also runs worst case scenarios that could arise in the event that those extreme events, however unlikely, do, in fact, occur.
Monitoring and controlling risks is primarily performed based on limits established by the Bank. These limits reflect the business strategy and market environment of the Bank as well as the level of risk that it is willing to accept, with additional emphasis on selected industries. The Bank also conducts ongoing monitoring and control allowing efficient adjustments in case of any unexpected changes in the
60 Bank of Georgia Holdings PLC Annual Report 2012

conditions on which the preliminary risk assessment was made. In addition the Bank monitors and measures the overall risk bearing capacity in relation to the aggregate risk exposure across all risks types and activities.
Risk Management ReportingThe Group maintains a management reporting system which requires the Credit Risk Management Department, the Finance Department, the Treasury Department, the Operational Risk Management Department and other relevant departments of relevant subsidiaries of the Group to prepare certain reports on a daily, monthly, quarterly and annual basis. On a daily basis, a statement of operations, balance sheet and Treasury Report (providing open foreign currency positions, cash flows, limits and balances on correspondent accounts) and confirmation that there has been compliance with mandatory financial ratios is provided by each department. On a monthly basis, a report on the structural liquidity gap, a report on interest rate risk, monthly financial statements and a management and supervisory board report containing analysis of the Group’s performance against the budgets are provided to the Management Board. On a quarterly basis, credit risk and operational risk report is submitted to the Management Board and to the Supervisory Board.
Information compiled from all the business area of the Bank is examined and processed in order to analyse, control and identify risks early. This information is presented and explained to the Bank Management Board, and the head of each business division. The report includes aggregate credit exposure, liquidity ratios and risk profile changes. Senior management assesses the appropriateness of the allowance for credit losses on a monthly basis. The Bank Management Board and Bank Supervisory Board receive a comprehensive risk report once a quarter which is designed to provide all the necessary information to assess and draw conclusions on the Bank’s risk exposure.
Risk Mitigation and Excessive Risk ConcentrationAs part of its overall risk management, the Bank uses derivatives and other instruments to manage exposures resulting from changes in interest rates and foreign currencies. While these are intended for hedging, these do not qualify for hedge accounting.
The Bank actively uses collateral to reduce its credit risks.
Concentrations arise when a number of counterparties, or related entities or shareholders, are engaged in similar business activities, or activities in the same geographic region, or have similar economic features that would cause their ability to meet contractual obligations to be similarly affected by changes in economic, political or other conditions.
Concentrations indicate the relative sensitivity of the Bank’s performance to developments affecting a particular industry or geographical location. In order to avoid excessive concentrations of risks, the Bank focuses on maintaining a diversified portfolio. Identified concentrations of credit risks are controlled and managed accordingly.
Liquidity RiskDefinitionLiquidity risk is the risk that the Bank will be unable to meet its payment obligations when they fall due under normal and stress circumstances.
Monitoring Liquidity risk is managed through the ALCO-approved liquidity framework. Treasury manages liquidity on a daily basis. In order to manage liquidity risk, it performs daily monitoring of future expected cash flows on clients’ and banking operations, which is a part of the assets/liabilities management process. The Finance department prepares and submits monthly reports to the ALCO. The ALCO monitors the proportion of maturing funds available to meet deposit withdrawals and the amounts of interbank and other borrowing facilities that should be in place to cover withdrawals at unexpected levels of demand.
The liquidity risk management framework models the ability of the Bank to fund its business under both normal conditions and during a crisis situation. The Bank has developed a model based on the Basel III liquidity guidelines. This approach is designed to ensure that the funding framework is sufficiently flexible to ensure liquidity under a wide range of market conditions. The liquidity management framework is reviewed from time to time to ensure it is appropriate to the Bank’s current and planned activities. Such review encompasses the funding scenarios modelled, the modeling approach, wholesale funding capacity, limit determination and minimum holdings of liquid assets. The liquidity framework is reviewed by the ALCO prior to approval by the Bank Management Board.
The Finance Department also undertakes an annual funding review that outlines the current funding strategy for the coming year. This review encompasses trends in global debt markets, funding alternatives, peer analysis, estimation of the Bank’s upcoming funding requirements, estimated market funding capacity and a funding risk analysis. The annual funding plan is reviewed by the Bank Management Board and approved by the Bank Supervisory Board as part of the annual budget. The Funding and Treasury departments also review, from time to time, different funding options and assess the refinancing risks of such options.
Liquidity position is at a comfortable level well above the regulatory requirements
Bank of Georgia Holdings PLC Annual Report 2012 61
OverviewPerform
anceGovernance
Financial Statements
Additional Information

Performance: Risk Management continued
MitigationThe Bank’s capability to discharge its liabilities is dependent on its ability to realise an equivalent amount of assets within the same period of time. The Bank maintains a portfolio of highly marketable and diverse assets that it believes can be easily liquidated in the event of an unforeseen interruption of cash flow. It also has committed lines of credit that it can access to meet its liquidity needs. Georgian commercial banks are entitled to get one week NBG’s refinancing facility by pledging NBG certificates of deposit, Georgian Government Securities or mortgage loans denominated in Georgian Lari. In addition, the Bank maintains a cash deposit (an obligatory reserve) with the NBG, the amount of which depends on the level of customer funds attracted. As of 31 December 2012, in line with the NBG’s requirements, 15% of customer deposits in foreign currencies are set aside as minimum mandatory reserves. In addition, the Bank maintains a minimum average balance of 10% of its customer deposits in Georgian Lari at its correspondent account at the NBG. For wholesale funding, the NBG requires the Bank to set aside 15% of its unsubordinated foreign currency wholesale funding for borrowings with remaining maturity of less than one year, 5% for borrowings with a remaining maturity of more than one year (but less than two years) and 10% of its unsubordinated Georgian Lari wholesale funding with a remaining maturity of less than one year. The NBG’s liquidity ratio (average liquid assets during the month as defined by the NBG divided by average-borrowed funds with effective maturity of more than six months plus certain off balance sheet commitments maturing within six months) stood at 41.1% against the required minimum of 30%.
FundingDiversification of funding is an important component of the Bank’s liquidity management strategy. The principal sources of liquidity are debt issues, client funds (including client deposits or amounts due to customers and promissory notes), borrowings (including borrowings from Developmental Financial Institutions), interbank deposits, principal repayments of loans, interest income and fees and commissions income. As of 31 December 2012, all of Bank of Georgia’s funding was unsecured as it was bound by negative pledge commitments to its lenders.
Client deposits are a consistent source of funding for Bank of Georgia. As of 31 December 2012, client deposits (including deposits of individuals) were GEL 2,622.9 million, or 57.1% of total liabilities (31 December 2011: GEL 2,554.1 million and 66.3%, respectively). In accordance with the Georgian legislation, the Bank is obliged to repay such deposits upon demand of a depositor. In case of early withdrawal, the interest on deposit is foregone or reduced. As of 31 December 2012, the Group’s total consolidated amounts due to customers were GEL 2,693.0 million and represented 58.6% of the Group’s total liabilities.
Funding flexibility is also provided by Bank of Georgia’s ability to raise wholesale funding from international markets.
Borrowed funds reached GEL 1,225.8 million as of 31 December 2012, or 26.7% of total liabilities (31 December 2011: GEL 863.0 million, or 22.4% of total liabilities). In July 2012, the Bank issued US$250 million 7.75% Notes due in 2017. In addition, during 2012, Bank of Georgia has signed loan agreements for the aggregate amount of GEL 96.0 million with IFC and Kreditanstalt fuer Wiederaufbau (“KfW”). As of 31 December 2012, the 83.8% of the Bank’s borrowed funds had a maturity of more than one year.
In addition, Bank of Georgia has trade finance lines from various international financial institutions and credit lines for interbank-operations from both Georgian and non-resident banks. As of 31 December 2012, the Bank had aggregate trade finance limits from international partner credit institutions of US$308.8 million equivalent diversified across different currencies (US$, EUR, CHF) (31 December 2011: US$178.4). The number of partner credit institutions that has opened trade finance lines the bank was 14 in 2012. (2011: 10).
For further information on liquidity risk and funding management please see Note 27 of the Notes to the Consolidated Financial Statements.
Market RiskDefinitionThe Bank is exposed to market risk (including currency exchange rate risk and interest rate risk), which is the risk that the fair value or future cash flows of financial instruments will fluctuate due to changes in market variables. Market risk exposure arises from open positions in fixed income and currencies, all of which are exposed to market fluctuations.
Borrowed funds maturity breakdown
US$, millions 2013 2014 2015 2016 2017 2018 2019
Eurobonds – – – – 247.3 – –Senior loans 72.4 66.9 57.8 35.2 26.1 11.5 3.0Subordinated loans – – – – 35.0 40.0 50.1Promissory notes 38.3 1.8 – – – – –Total 110.7 68.7 57.8 35.2 308.4 51.5 53.1% of Total assets as of 31 December 2012 3.2 2.0 1.7 1.0 9.0 1.5 1.6
62 Bank of Georgia Holdings PLC Annual Report 2012

Within limits approved by the Bank Supervisory Board, the ALCO approves ranges of interest rates for different maturities at which the Bank may place assets and attract liabilities. Compliance with the Bank’s interest rate policy is monitored by the Head of the Financial Risk Management unit of the Finance department and the Head of the Treasury department.
In May 2009, the Bank entered into an ISDA Master Agreement with IFC, pursuant to which from time to time the Bank enters into interest rate swaps with IFC to hedge its US Dollar interest rate risk on its outstanding long-term borrowings.
The Bank is also subject to prepayment risk, which is the risk that the Bank will incur a financial loss because its customers and counterparties repay or request repayment earlier than expected, such as fixed rate mortgages when interest rates fall. The Group reviews the prior history of early repayments by calculating the weighted average rate of early repayments across each credit product, individually, applying these historical rates to the outstanding carrying amount of each loan product as at the reporting date and by further multiplying the product by the weighted average effective annual interest rates per each product. This allows the Bank to calculate the expected amount of unforeseen losses in case of early repayments.
Credit RiskDefinitionCredit risk is the risk that a borrower or counterparty will be unable to pay amounts in full when due. Credit risk arises mainly in the context of the Bank’s lending activities.
MitigationThe general principles of the Bank’s credit policy are outlined in the Credit Policies. The Credit Policies also outline credit risk control and monitoring procedures and the Bank’s credit risk management systems. The Credit Policies are reviewed annually, or more frequently if necessary. For example, as a result of previous reviews, new procedures addressing the standards and methodology for loan loss provisioning pursuant to IFRS requirements were implemented, new loan restructuring tools were introduced and the loan terms were tightened. The Bank also uses the NBG’s provisioning methodology in order to comply with NBG requirements.
The Bank manages its credit risk by placing limits on the amount of risk accepted with respect to individual corporate borrowers or groups of related borrowers, liability of insurance companies, types of banking operations and by complying with the exposure limits established by the NBG. The Bank monitors the market value of collateral, requests additional collateral in accordance with the underlying agreement, and monitors the market value of collateral obtained during its review of the adequacy of the allowance for the loan impairment. The Bank also mitigates its credit risk by obtaining collateral and using other security arrangements. The exposure to individual corporate borrowers (including financial institutions) is further restricted by sub-limits covering on and off-balance sheet exposures and daily delivery risk limits with respect to trading terms such as foreign exchange contracts.
MitigationThe general principles of the Bank’s market risk management policy are set by the ALCO. The Bank aims to limit and reduce the amount of possible losses on open market positions which may be incurred by the Bank due to negative changes in currency exchange rates and interest rates. The Bank classifies exposures to market risk into either trading or non-trading positions. The Bank has no trading positions. Non-trading positions are managed and monitored using sensitivity analysis. In order to address these risks, the ALCO specifically establishes limits on open foreign currency positions, individually by currency as well as in aggregate. The limits are controlled by Treasury and monitored by Finance Department and ALCO as well.
Currency Exchange Rate Risk. Currency exchange rate risk is the risk that the value of a financial instrument will fluctuate due to changes in foreign currency exchange rates. The Bank is exposed to the effects of fluctuation in the prevailing foreign currency exchange rates on its financial position.
MitigationThe Bank’s currency risk is controlled through aggregate open currency positions and respective limits. Its open currency positions are managed by the Treasury department and Finance department on a day-to-day basis and are monitored by the Head of Treasury on a real-time basis. The ALCO sets open currency position limits with respect to both overnight and intraday positions and stop-loss limits. Currently, the Bank’s proprietary trading position is limited by the ALCO. The open currency position is also limited by ALCO to a maximum of 15.0% of the Bank’s NBG total regulatory capital. The ALCO limit of 15.0% is more conservative than NBG, which allows banks to keep open positions of up to 20.0% of regulatory capital. The Bank additionally limits open foreign currency positions, for individual currencies other than US Dollars and Lari, to 1% of the NBG regulatory capital. The Bank also applies sensitivity stress tests to its open currency positions to estimate potential negative impact on its net assets and earnings.
Interest Rate Risk. The Bank has exposure to interest rate risk as a result of lending at fixed interest rates in amounts and for periods which differ from those of term borrowings at fixed and floating interest rates. Interest margins on assets and liabilities having different maturities may increase or decrease as a result of changes in market interest rates.
MitigationSimilarly to other Georgian banks, the majority of the Bank’s assets and deposits have fixed interest rates. In order to minimise interest rate risk, the Bank monitors its interest rate (repricing) gap and maintains an interest rate margin (net interest income before impairment of interest earning assets divided by average interest earning assets) sufficient to cover operational expenses and risk premium.
Bank of Georgia Holdings PLC Annual Report 2012 63
OverviewPerform
anceGovernance
Financial Statements
Additional Information

Performance: Risk Management continued
The Credit Committees approve individual transactions, establish credit risk categories and provisioning rates in respect of such transactions. The Deputy CEO, Chief Risk Officer and Credit Risk Management department reviews the credit quality of the portfolio and sets provisioning rates, in consultation with the Bank’s CEO and Deputy CEO, Finance, on a monthly basis.
The Bank’s credit quality review process provides early identification of possible changes in the creditworthiness of counterparties, including regulator collateral revisions. Counterparty limits are established by the use of a credit risk classification system, which assigns each counterparty a risk rating. Risk ratings are subject to regular revision. The credit quality review process allows the Bank to assess the potential loss as a result of the risks to which it is exposed and take corrective action.
The Bank makes available to its customers guarantees/letters of credit which may require that the bank make payments on their behalf. Such payments are collected from customers based on the terms of the guarantee/letter of credit. They expose the Bank to similar risks to loans and these are mitigated by the same control processes and policies.
Loan approval proceduresThe procedures for approving loans, monitoring loan quality and for extending, refinancing and/or restructuring existing loans are set out in the Bank’s Credit Policies that are approved by the Supervisory Board of the Bank and/or the Management Board of the Bank. The Credit Committees approve individual transactions and establish credit risk categories and provisioning rates.
The Bank evaluates corporate banking clients on the basis of their credit history, business operations, market position, management, level of shareholder support, financial condition, proposed business and financing plan and on the quality of the collateral offered. The appropriate level of the relevant Credit Committee is responsible for making decision for loan approval based on credit memorandum, and where appropriate, credit risk managers’ report. The loan approval procedures for retail banking loans depend on the type of retail lending product. Applications for consumer loans, including credit cards, and auto loans are treated under the “scoring” approval procedure. While certain loans of up to GEL 6,000 are approved by the scoring system, the appropriate Credit Committee will determine the amount, terms and conditions of other loans. Applications for mortgage loans by retail banking clients are completed by the mortgage loan officer and submitted to the Credit Risk Manager, who evaluates the credit risks and determines the amount, terms and conditions of the loan, which must be approved at the appropriate Credit Committee level. In the case of micro-financing loans, officers evaluate loan applications, prepare a project analysis and submit proposals to the appropriate Credit Committee which makes the final decision. Credit Committee members have equal voting authority and decisions are approved by a simple majority of votes.
Since 2004, the Bank, jointly with certain other Georgian banks and with the Creditinfo Group, a provider of credit information solutions, established JSC Credit Information Georgia (“CIG”), that serves a centralised credit bureau in Georgia. Since 2009, all the participating banks share and contribute positive and negative customer credit information with CIG.
CollateralThe Bank typically requires credit support or collateral as security for the loans and credit facilities that it grants. The main forms of credit support are guarantees and rights to claim amounts on the borrower’s current account with the Bank or other assets. The main forms of collateral for corporate lending are charges over real estate properties, equipment, inventory and trade receivables and the main form of collateral for retail lending is a mortgage over residential property. In the case of corporate loans, the Bank usually requires a personal guarantee (surety) from the borrower’s shareholders. Under the Bank’s internal guidelines, collateral should be provided (where it is required) to cover outstanding liabilities during the entire duration of a transaction. As of 31 December 2012, 87.1% of the Group’s loans to clients were collateralised. An evaluation report of the proposed collateral is prepared by the Asset Appraisal and Disposal department and submitted to the appropriate Credit Committee, together with the loan application and credit risk manager’s report. When evaluating collateral, the Bank discounts the market value of the assets to reflect the liquidation value of the collateral.
MeasurementThe Bank’s compliance with credit risk exposure limits is monitored by the Credit Risk Management department on a continuous basis. Exposure and limits are subject to annual or more frequent review. The Bank establishes provisions for impairment losses of financial assets when there is objective evidence that a financial asset or group of financial assets is impaired. The Bank creates provisions by reference to the particular borrower’s financial condition and the number of days the relevant loan is overdue. If in a subsequent period the amount of the impairment loss decreases and the decrease can be related objectively to an event occurring after the impairment was recognised, the previously recognised impairment loss is reversed by an adjusted provision account. The determination of provisions for impairment losses is based on an analysis of the assets at risk and reflects the amount which, in the judgment of the Bank’s management, is adequate to provide for losses incurred. Provisions are made as a result of an individual appraisal of financial assets.
The Bank has conservative credit approval processes and underwriting criteria, all of which are intended to maintain the quality of its assets as its loan portfolio grows
64 Bank of Georgia Holdings PLC Annual Report 2012

Provisions are made against gross loan amounts and accrued interest. Under the Bank’s internal loan loss allowance methodology, which is based upon IFRS requirements, the Bank categorises its loan portfolio into significant and non-significant loans. Significant loans are defined as loans in the amount of GEL 600,000 or more and non-significant loans are defined as loans less than GEL 600,000. The Credit Risk Management department makes an individual assessment of significant loans and loans with category a rating are given a collective assessment rate. All significant loans other than category A are provisioned individually depending on the category they fall in. Categories are determined according to borrower’s financial performance business performance, leverage, credit history, quality of management and shareholders’ support. In addition, the loan to collateral ratio and quality of collateral may affect the provisioning rates of individually assessed loans. All non-significant loans are divided into different groups (for example mortgage, consumer, micro-financing loans).
All loans in range of GEL 100,000–600,000 with overdue days more then 10 days are provisioned individually and non-significant loans that are overdue more than 30 days are provisioned individually based on overdue days. All non-impaired non-significant loans, as well as non-impaired prime rated significant loans, are assessed collectively within the sub-loan portfolio categories based upon historical loss rates. Non-significant loans which are overdue for more then 150 days are written off automatically, except for mortgage loans which, since June 2009, are written off once overdue for more than 365 days. Significant loans may be written-off following an assessment by the Deputy CEO, Chief Risk Officer and the Credit Risk Management department, in consultation with the Bank’s CEO and Deputy CEO, Finance.
Operational RiskDefinitionOperational risk is the risk of loss arising from systems failure, human error, fraud or external events. When controls fail to perform, operational risks can cause damage to reputation, have legal or regulatory implications, or lead to financial loss.
For more information on credit risk please see Note 27 of the Notes to Consolidated Financial Statements. Pg 159
MitigationThe Bank is exposed to operational risks, arising out of the various operational activities in which it is engaged. The Bank cannot expect to eliminate all operational risks, but through a control framework and by monitoring and responding to potential risks, the Bank aims to manage the risks. Controls include effective segregation of duties, access, authorisation and reconciliation procedures, staff education and training and assessment processes, including the use of internal audit. The Bank manages its operational risks by establishing, monitoring and continuously improving its policies and procedures relating to the various aspects of the Bank’s cash, payments, accounting, trading and core processing operations and data backup and disaster recovery arrangements.
The Bank has an integrated control framework encompassing operational risk management and control, AML compliance, corporate and information security and physical security, each of which is managed by a separate department, and an internal audit function for the Bank Group.
The Operational Risk Management and Control Department is responsible for identification and assessment of operational risk categories within the Bank’s processes and operations, detecting critical risk areas or groups of operations with an increased risk level, developing response actions and the imposition of restrictions in critical risk zones to neutralise identified risk and developing business-process optimisation schemes, including document circulation, information streams, distribution of functions, permissions and responsibilities. The Operational Risk Management and Control department is also responsible for developing and updating policies and procedures and ensuring that these policies and procedures meet legal and regulatory requirements and help to ensure that material operating risks are within acceptable levels. It also monitors and periodically reviews the Bank’s internal control systems to detect errors or infringements by the Bank’s departments and divisions. The Head of the Operational Risk Management department, who reports to the Deputy CEO, Chief Risk Officer is responsible for the oversight of the Bank’s operational risks.
As of 31 December 2012, 87.1% of the Group’s loans to clients were collateralised
Bank of Georgia Holdings PLC Annual Report 2012 65
OverviewPerform
anceGovernance
Financial Statements
Additional Information

Performance: Social responsibility
As the leading financial institution in the country with over one million customers, we are uniquely placed to make a lasting impact on the communities we operate in and to promote sustainable growth in the economy.
CustomersWe put our existing customers at heart of our business operations maintaining excellent customer service while at the same time developing innovative products and underpenetrated services that meet customers’ evolving needs. However, as an emerging market economy, the Georgian banking sector still remains underpenetrated creating challenges to make banking products accessible in an efficient and responsible manner to existing and potential customers.
The Express Banking service from Bank of Georgia, which is based on a concept of transactional, low cost banking through electronic channels (see page 39) aims to make banking products accessible to a larger part of the population.
EmployeesBank of Georgia’s continued success depends on its employees, who build valuable relationships with our clients. As the leading financial institution in Georgia, we are committed to recruiting and retaining the best talent in the country through attractive salary packages, a clear bonus structure and training programmes aimed at professional development.
– Bank of Georgia conducts employee satisfaction surveys to improve working environment, effectively address any grievances and to improve customer focus through employee feedback
– In 2012, the Bank provided 12,506 training hours to the Bank’s 2,240 employees and 10% of employees received promotion during the year
– Bank of Georgia promotes gender diversity across the Group and we are proud that 62% of the Bank’s employees are female
Community engagementAs the largest financial institution and one of the top employers in the country, the Bank seeks to play an active role in social issues present in the communities the bank operates in.
– Bank of Georgia partnered up with IFC to provide credit to SMEs owned by women and thus support women’s inclusion in business
– Bank of Georgia partnered up with EBRD to provide financing the SME sector with energo-credit, which means financing enterprises to upgrade their old, inefficient machinery to decrease their energy use and switch to energy efficient low polluting technologies
– With more than half of the country’s population employed in the agricultural sector, Bank of Georgia is committed to provide cheap financing to Georgian farmers. To this end, the Bank launched an agro-credit facility with favourable terms in 2012. The facility is complemented with the Bank’s new initiative in agriculture insurance, which in Georgia is in its early stage of development and will allow Georgian farmers to have a better access to banking products.
Sponsorships In 2012, Bank of Georgia continued sponsoring Basketball club Tbilisi Dynamo and TEDx – a non-profit organisation which holds conferences devoted to sharing ideas.
CharityBank of Georgia has been actively making charitable donations in 2012, donating money to various reputable charity organisations in Georgia including The First Step Foundation that supports children with special needs, Oncology Centre, Catharsis – support for elderly, SOS Children’s Village, etc.
Bank of Georgia’s slogan Feel the Future reflects our role in building a better future for our customers, employees and communities across the country. Creating sustainable value for our shareholders is interlinked with the well-being and prosperity of our stakeholders
Feel the Future
66 Bank of Georgia Holdings PLC Annual Report 2012

Environmental ResponsibilityThrough Bank of Georgia Future Foundation, the Bank has partnered up with the Caucasus Nature Fund and the Georgian Agency of Protected Areas to support one of the most treasured national parks in Georgia (Borjomi-Kharagauli National Park). The Bank has been supporting the fund for the fourth year in a row.
Moreover, Bank of Georgia recognises that its operations can have direct and indirect impacts on the environment and the community in which it operates. The Bank’s objective is to responsibly manage the environmental and social risks associated with its operations in order to minimise impacts on the environment and its stakeholders.
The Group is committed to conducting its business in an environmentally, socially responsible and sustainable manner in order to reduce the environmental impact of its operations while at the same time improving social performance in order to enhance long-term returns to its shareholders. In maintaining international best practice in environmental and social risk management, the Group is committed to ensuring that its clients and customers are also fulfilling their environmental and social responsibilities.
With regard to our customers and clients, the Group regards compliance with applicable environmental, health and safety and labour regulations and the use of sound environmental, health and safety, and labour practices as important factors in demonstrating effective corporate governance. The Board has adopted an Environmental and Social Policy, which describes the Group’s commitment to sustainable finance as an integral component of responsible corporate governance and implementation of environmental and social risk management procedures in connection with its commercial activities (including without limitation commercial lending). The Environmental and Social Responsibility Policy is available on the Company’s website http://bogh.co.uk/en/corporate-governance.
In order to ensure that the Bank of Georgia and its customers operate in an environmentally and socially responsible manner, the Management Board of the Bank has adopted Environmental and Social Responsibility Policy and Risk Management Procedures, which are in line with the requirements of the Bank’s DFI partners, such as IFC, EBRD, ADB, etc.
Borjomi Kharagauli National Park is one of the largest National Parks in Europe covering more than 76,000 hectares of native forest. Bank of Georgia finances maintenance costs of the park thus contributing to preservation of the diversity of wild nature areas of Georgia.
The Bank contributed a total of GEL 1.4 million to charities and sponsorships
Agency of Protected Areas
Bank of Georgia Holdings PLC Annual Report 2012 67
OverviewPerform
anceGovernance
Financial Statements
Additional Information
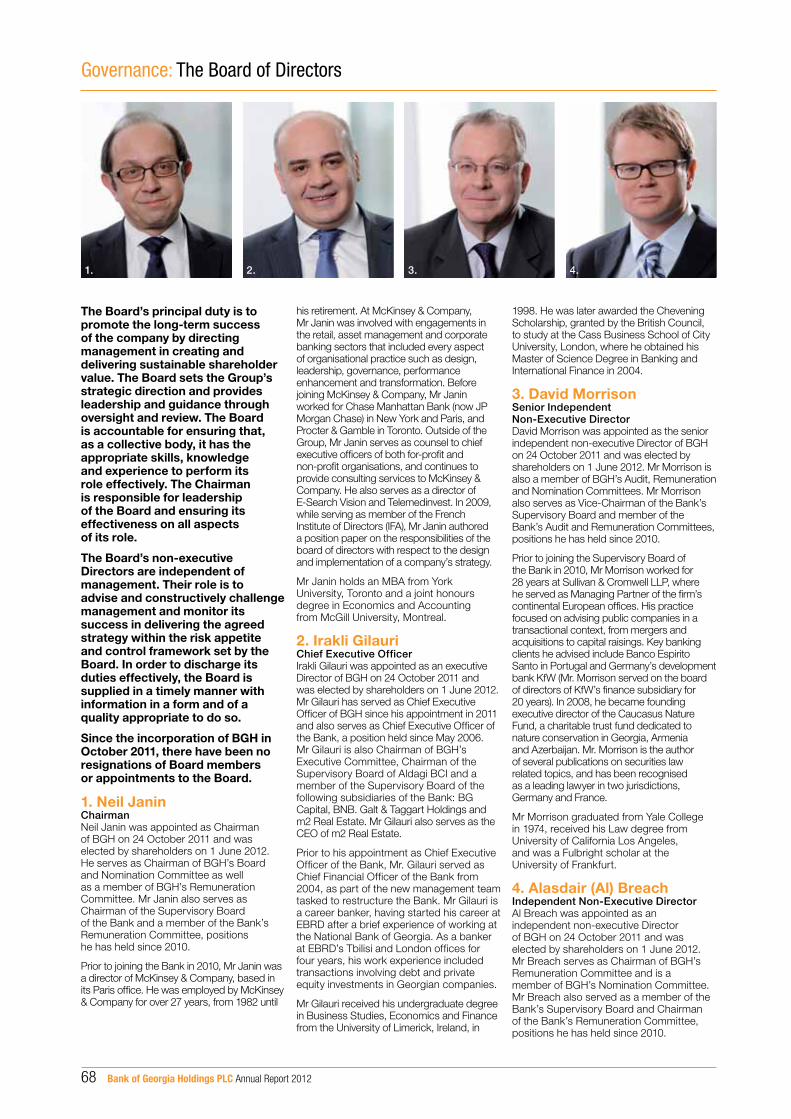
Governance: The Board of Directors
The Board’s principal duty is to promote the long-term success of the company by directing management in creating and delivering sustainable shareholder value. The Board sets the Group’s strategic direction and provides leadership and guidance through oversight and review. The Board is accountable for ensuring that, as a collective body, it has the appropriate skills, knowledge and experience to perform its role effectively. The Chairman is responsible for leadership of the Board and ensuring its effectiveness on all aspects of its role.
The Board’s non-executive Directors are independent of management. Their role is to advise and constructively challenge management and monitor its success in delivering the agreed strategy within the risk appetite and control framework set by the Board. In order to discharge its duties effectively, the Board is supplied in a timely manner with information in a form and of a quality appropriate to do so.
Since the incorporation of BGH in October 2011, there have been no resignations of Board members or appointments to the Board.
1. Neil JaninChairmanNeil Janin was appointed as Chairman of BGH on 24 October 2011 and was elected by shareholders on 1 June 2012. He serves as Chairman of BGH’s Board and Nomination Committee as well as a member of BGH’s Remuneration Committee. Mr Janin also serves as Chairman of the Supervisory Board of the Bank and a member of the Bank’s Remuneration Committee, positions he has held since 2010.
Prior to joining the Bank in 2010, Mr Janin was a director of McKinsey & Company, based in its Paris office. He was employed by McKinsey & Company for over 27 years, from 1982 until
his retirement. At McKinsey & Company, Mr Janin was involved with engagements in the retail, asset management and corporate banking sectors that included every aspect of organisational practice such as design, leadership, governance, performance enhancement and transformation. Before joining McKinsey & Company, Mr Janin worked for Chase Manhattan Bank (now JP Morgan Chase) in New York and Paris, and Procter & Gamble in Toronto. Outside of the Group, Mr Janin serves as counsel to chief executive officers of both for-profit and non-profit organisations, and continues to provide consulting services to McKinsey & Company. He also serves as a director of E-Search Vision and Telemedinvest. In 2009, while serving as member of the French Institute of Directors (IFA), Mr Janin authored a position paper on the responsibilities of the board of directors with respect to the design and implementation of a company’s strategy.
Mr Janin holds an MBA from York University, Toronto and a joint honours degree in Economics and Accounting from McGill University, Montreal.
2. Irakli Gilauri Chief Executive OfficerIrakli Gilauri was appointed as an executive Director of BGH on 24 October 2011 and was elected by shareholders on 1 June 2012. Mr Gilauri has served as Chief Executive Officer of BGH since his appointment in 2011 and also serves as Chief Executive Officer of the Bank, a position held since May 2006. Mr Gilauri is also Chairman of BGH’s Executive Committee, Chairman of the Supervisory Board of Aldagi BCI and a member of the Supervisory Board of the following subsidiaries of the Bank: BG Capital, BNB. Galt & Taggart Holdings and m2 Real Estate. Mr Gilauri also serves as the CEO of m2 Real Estate.
Prior to his appointment as Chief Executive Officer of the Bank, Mr. Gilauri served as Chief Financial Officer of the Bank from 2004, as part of the new management team tasked to restructure the Bank. Mr Gilauri is a career banker, having started his career at EBRD after a brief experience of working at the National Bank of Georgia. As a banker at EBRD’s Tbilisi and London offices for four years, his work experience included transactions involving debt and private equity investments in Georgian companies.
Mr Gilauri received his undergraduate degree in Business Studies, Economics and Finance from the University of Limerick, Ireland, in
1998. He was later awarded the Chevening Scholarship, granted by the British Council, to study at the Cass Business School of City University, London, where he obtained his Master of Science Degree in Banking and International Finance in 2004.
3. David MorrisonSenior Independent Non-Executive DirectorDavid Morrison was appointed as the senior independent non-executive Director of BGH on 24 October 2011 and was elected by shareholders on 1 June 2012. Mr Morrison is also a member of BGH’s Audit, Remuneration and Nomination Committees. Mr Morrison also serves as Vice-Chairman of the Bank’s Supervisory Board and member of the Bank’s Audit and Remuneration Committees, positions he has held since 2010.
Prior to joining the Supervisory Board of the Bank in 2010, Mr Morrison worked for 28 years at Sullivan & Cromwell LLP, where he served as Managing Partner of the firm’s continental European offices. His practice focused on advising public companies in a transactional context, from mergers and acquisitions to capital raisings. Key banking clients he advised include Banco Espirito Santo in Portugal and Germany’s development bank KfW (Mr. Morrison served on the board of directors of KfW’s finance subsidiary for 20 years). In 2008, he became founding executive director of the Caucasus Nature Fund, a charitable trust fund dedicated to nature conservation in Georgia, Armenia and Azerbaijan. Mr. Morrison is the author of several publications on securities law related topics, and has been recognised as a leading lawyer in two jurisdictions, Germany and France.
Mr Morrison graduated from Yale College in 1974, received his Law degree from University of California Los Angeles, and was a Fulbright scholar at the University of Frankfurt.
4. Alasdair (Al) BreachIndependent Non-Executive DirectorAl Breach was appointed as an independent non-executive Director of BGH on 24 October 2011 and was elected by shareholders on 1 June 2012. Mr Breach serves as Chairman of BGH’s Remuneration Committee and is a member of BGH’s Nomination Committee. Mr Breach also served as a member of the Bank’s Supervisory Board and Chairman of the Bank’s Remuneration Committee, positions he has held since 2010.
1. 2. 3. 4.
68 Bank of Georgia Holdings PLC Annual Report 2012

Mr Breach runs Furka Advisors, a Swiss-based asset management firm, is a significant shareholder in Gemmstock Growth Fund and is the co-founder of The Browser.com, a-web-based curator of current affairs writing, established in 2008. He also serves on the board of Vostok Nafta Investment Ltd. and MFX Solutions. In January 2003, Mr Breach joined Brunswick UBS (later UBS Russia) as Chief Economist, and later additionally became Head of Research and MD until October 2007. From 1998 to 2002, Mr Breach was Russia and FSU economist at Goldman Sachs, based in Moscow.
Mr Breach obtained an MSc in Economics from the London School of Economics and a degree in Mathematics with Philosophy from Edinburgh University.
5. Hanna-Leena (Hanna) LoikkanenNon-Executive DirectorHanna Loikkanen was appointed as a non-executive Director of BGH on 24 October 2011 and was elected by shareholders on 1 June 2012. Ms Loikkanen serves as a member of BGH’s Nomination Committee and has served as a member of the Bank’s Supervisory Board since 2010.
Ms Loikkanen has over 18 years of experience in working with financial institutions in Russia and Eastern Europe. She has been the Chief Representative and Head of the Private Equity team at East Capital, a Swedish asset management company in Moscow, since November 2007. Ms Loikkanen previously held the position of Country Manager and Chief Executive Officer at FIM Group in Russia, a Finnish investment bank, where she was responsible for setting up and running the Bank’s brokerage and corporate finance operations in Russia. Before joining FIM Group, Ms Loikkanen worked for Nordea Finance for four years in various management positions in Poland, the Baltic States and Finland. Earlier in her career, Ms Loikkanen worked for Merita Bank in St. Petersburg as Chief Representative as well as SEB in Moscow.
Ms Loikkanen currently also serves as a director of East Capital Explorer Investments AB, RDF AG, EEDF AG, Laomar Ltd, Locko Bank CJSC, Locko Invest CJSC, Probusiness Bank CJSC, Morgan & Stout CJSC and AKI Bank CJSC.
She holds a Master’s degree in Economics and Business Administration from the Helsinki School of Economics.
6. Allan HirstIndependent Non-Executive DirectorAllan Hirst was appointed as an independent non-executive Director of BGH on 24 October 2011 and was elected by shareholders on 1 June 2012. Mr Hirst serves as Chairman of BGH’s Audit Committee and a member of BGH’s Nomination Committee. Mr Hirst also serves as a member of the Bank’s Supervisory Board, a position he has held since 2006, and as Chairman of the Bank’s Audit Committee, a position he has held since 2010.
Prior to joining the Bank, Mr Hirst was employed by Citibank N.A. for nearly 25 years until his retirement in February 2005. At Citibank, he led the Bank’s expansion into Central and Eastern Europe, Russia and Central Asia. From 1999 to 2004, Mr Hirst served as President and Managing Director of ZAO Citibank Russia, with oversight over the bank’s operations in the CIS. Prior to moving to Russia, Mr Hirst worked in various senior capacities at Citibank, including as division executive in the Middle East and Indian Sub-continent and as division executive responsible for establishing the bank’s network in Central and Eastern Europe. Mr Hirst additionally serves as non-executive director of the Financial Services Volunteer Corps and Phico Therapeutics. He is also a member of Executive Committee of the Board of the FSVC.
Mr. Hirst received an MBA from University of Texas.
7. Kakhaber (Kaha)-KiknavelidzeIndependent Non-Executive DirectorKaha Kiknavelidze was appointed as an independent non-executive Director of BGH on 24 October 2011 and was elected by shareholders on 1 June 2012. Mr Kiknavelidze also serves as a member of BGH’s Audit and Nomination Committees. Mr Kiknavelidze also serves as a member of the Bank’s Supervisory Board and Audit Committee, positions he has held since 2008.
Mr Kiknavelidze is the managing partner of Rioni Capital Partners LLP, the investment management company, a company he founded in 2007. Mr Kiknavelidze has over 15 years of experience in the equity markets, including serving as Executive Director of UBS where he supervised the Russian oil and gas research team. Prior to joining UBS, he spent eight years at Troika Dialog, initially covering metals and mining and the utilities sectors and later, as deputy head of research and associate partner, leading the oil and gas team. Mr Kiknavelidze started his career at the Bank as a Financial Manager in 1994.
Mr Kiknavelidze received his undergraduate degree in Economics with honours from the Georgian Agrarian University in Tbilisi, Georgia and received his MBA from Emory University in the United States.
8. Ian HagueNon-Executive DirectorIan Hague was appointed as a non-executive Director of BGH on 24 October 2011 and was elected by shareholders on 1 June 2012. Mr. Hague is a member of BGH’s Nomination Committee and has served as a member of the Bank’s Supervisory Board since 2004.
Mr. Hague is the Managing Partner and co-founder of Firebird Management LLC, a New York-based investment fund since 1994. Prior to this, he worked for the United Nations Secretariat. Mr. Hague currently also serves as a Director for Global Gold, NBD Bank, SDM Bank, Elise Holdings, Lexik Holdings, Amber Trust and Amber Trust II.
Mr. Hague received his undergraduate degree from Wesleyan University in 1983 and was awarded a Masters degree from Monterey Institute of International Studies. He has also conducted graduate work at Columbia University’s Harriman Institute.
6. 7. 8.5.
Bank of Georgia Holdings PLC Annual Report 2012 69
OverviewPerform
anceGovernance
Financial Statements
Additional Information

Governance: Management of the Group
1. Irakli GilauriChief Executive Officer
See details on page 68.
2. Nikoloz Gamkrelidze Deputy CEO, FinancePrior to joining the Group in October 2012 as Chief Financial Officer, Nikoloz served for five years as CEO of the largest insurance company in Georgia, Aldagi BCI. From-2005 until 2007, Nikoloz served as CEO of “My Family Clinic”. Nikoloz managed several World Bank Health development projects. He has 10 years’ experience in healthcare management and insurance. He graduated from Tbilisi State Medical University and received his master’s degree in International Health Management from Imperial College London, Tanaka Business School.
3. Mikheil Gomarteli Deputy CEO, Retail BankingMikheil joined the Group in 1997 and has 18 years of retail banking experience. Having developed his career at Bank of Georgia, Mikheil is responsible for Bank of Georgia’s retail banking business, a position he has held since February 2009. Mikheil’s various senior management positions include Co-Head of Retail Banking, Head of Business Development, Head of Strategy and Planning, Head of Branch Management and Sales Coordination, Head of Branch Management and Marketing and Head of Banking Products and Marketing. Mikheil received his degree in Economics from Tbilisi State University.
4. Archil Gachechiladze*Deputy CEO, Corporate BankingBefore joining the Group in October 2009, Archil worked at Lehman Brothers Private Equity in London. Archil’s nine years experience in the financial services sector includes Salford Equity Partners (US$350 million fund with offices in London, Moscow, Belgrade and Tbilisi), EBRD in Tbilisi and London, as a Senior Financial Analyst at KPMG Barents in Tbilisi, and as a Team Leader for the World Bank’s CERMA Project in Tbilisi. Archil is a CFA Charterholder and a member of the CFA Society in the United Kingdom. He received an MBA with distinction from Cornell University and undergraduate degrees in Economics and Law from Tbilisi State University.
* Archil will assume Deputy CEO, Asset and Wealth Management responsibilities from May 2013.
1. 2. 3. 4.
70 Bank of Georgia Holdings PLC Annual Report 2012

5. Vasil Revishvili, Deputy CEO**Deputy CEO, Asset and Wealth Management*Vasil joined the Group in August 2008 as Head of Structured Products, before becoming Head of Wealth Management in 2009 and his appointment as Deputy CEO in June 2011. Vasil has a range of experience across the financial services sector both in Georgia and internationally. Prior to returning to Georgia in 2008, Vasil worked for four years at Pictet Asset Management in London and Geneva as Head of the Investment Risk Unit, and later as a Senior Investment Manager in the Balanced and Quantitative Investment Team. Before that, Vasil held various positions at the EU-TACIS Counterparty Fund, the Georgian Investment Centre and World Bank Tbilisi Water Project. Vasil received a Master’s degree in finance with distinction from the London Business School and an undergraduate degree in applied mathematics and computer sciences from Tbilisi State University. Vasil is also a designated Financial Risk Manager by the Global Association of Risk Professionals.
** Vasil will leave Bank of Georgia in May 2013. Archil Gachechiladze will assume Asset Wealth Management responsibilities.
6. Avto NamicheishviliDeputy CEO, LegalAvto joined the Group as General Legal Counsel in March 2007 and was appointed as Deputy CEO, Legal in July 2008. Avto’s experience within the Group includes eight mergers and acquisitions in the Georgian financial sector, two international acquisitions, two IPOs including the premium listing on the London Stock Exchange in 2012 and the listing of Bank of Georgia GDRs on the London Stock Exchange in 2006, where he acted in the capacity of adviser to the first IPO from Georgia. Before joining the Group, Avto was a partner at Begiashvili & Co. Limited, a leading Georgian law firm, where he acted as the Bank’s external legal advisor from 2004. Avto received undergraduate degrees in law and international economic relations from Tbilisi State University and received a graduate degree (LLM) in International Business Law from Central European University, Hungary. Avto is also a member of the BGH Executive Committee.
7. Sulkhan GvaliaDeputy CEO, Chief Risk Officer***Sulkhan joined the Group in January 2005 as Deputy CEO, Risk following the Bank’s acquisition of TUB, a mid-sized bank in Georgia co-founded by him in 1995. Sulkhan has almost 21 years of banking experience holding management positions in risk, credit finance, strategy and treasury. His experience includes 11 credit risk management years and 15 years’ credit committee membership. Sulkhan received his undergraduate law degree from Tbilisi State University.
*** Sulkhan will assume Deputy CEO, Corporate Banking responsibilities from May 2013.
8. Irakli BurdiladzeDeputy CEO, Affordable HousingIrakli joined the Group in 2006 and prior to his appointment as Deputy CEO in June 2010, Affordable Housing, served as COO and CFO of the Bank. Prior to joining the Bank, Irakli served as CFO of the GMT Group, a leading real estate developer and operator in Georgia. As CFO, Irakli was responsible for the Group’s capital raising efforts and transaction structuring. Irakli received a graduate degree in International Economics and International Relations from the Johns Hopkins University School of Advanced International Studies and an undergraduate degree in International Relations from the Tbilisi State University.
9. Murtaz KikoriaCEO, Aldagi BCIMurtaz was appointed as CEO of Aldagi BCI in October 2012. Murtaz joined the Group in August 2008 and has served in various managerial positions within the Group including Deputy CEO, Finance, Deputy CEO in charge of Compliance; Deputy CEO in charge of Investments and Strategic Projects and the Acting CEO of BG Bank Ukraine. Murtaz has also held the position of Chairman of the Bank Audit Committee. Prior to joining the Group, Murtaz served as a Senior Banker at EBRD. His 20 years of banking career includes the position as Head of Banking Supervision and Regulation at the National Bank of Georgia from 2001 and 2005. Murtaz received an undergraduate degree from Tbilisi State University in Economics, specialising in Finance and Credit. Murtaz also serves as a member of the Supervisory Board of BG Bank.
5. 6. 7. 8. 9.
Bank of Georgia Holdings PLC Annual Report 2012 71
OverviewPerform
anceGovernance
Financial Statements
Additional Information

A robust governance structure-underpins the delivery of our strategic objectivesNeil JaninChairman of Bank of Georgia Holdings
As a FTSE 250 company with a premium listing on the London Stock Exchange, it is our Board’s responsibility both to practise high standards of corporate governance and to contribute to promoting an environment where robust processes are in place. Such processes need to be underpinned by the right culture, values and behaviours permeating throughout the Group based on openness, transparency and accountability, as well as constructive challenge and collaboration. Our Board and its Committees play a particularly important role by setting the tone at the top, and I and the Chief Executive Officer are responsible for seeing that this culture trickles down.
We review the Group’s corporate governance policies, structures and practices on an annual basis in order to ensure that they are up to date and being effectively implemented. In 2012, the review focused on the matters reserved for the Board, each Board Committee’s Terms of Reference, and ways in which we could improve the connections between our Board and its Committees.
During 2012 we also focused on the future nature, shape and composition of the Board. We adopted term limits for our Board members and developed a multi-year Board succession plan that we believe will maintain the Board’s current high level of effectiveness. As a result, it is likely that there will be Board changes within the next two years.
We believe that there are many factors to consider when seeking to maximise a board’s effectiveness through its composition. It is necessary for the Board to have the expertise and knowledge that are most appropriate for the Group’s current and future business activities, as well as individuals with sufficient time to devote to the Board (both in stable and challenging times) and who are able to offer a broad range of diverse perspectives to the Board, including both by way of geographic representation and gender diversity.
Dear Shareholder,
In 2012 we also focused on the policy for executive remuneration in order to ensure that the compensation structure aligns management with shareholders, whereby long-term shareholder value is increased.
Good corporate governance contributes to the long-term success of a company, creating trust and engagement between the company and its stakeholders. The Group is committed to its customers and clients and works tirelessly to act ethically and responsibly in each and every of its business transactions.
We also strive to create an inclusive environment for all employees which helps us attract, retain and develop the best talent, and creates an environment where a diverse range of people are motivated to be at their best every day. We have a performance-based culture, which enables us to sustain strong business performance for the long term.
We continuously work to promote greater and more effective engagement with our shareholders. On behalf of the Board, the Supervisory Board, the Chief Executive Officer and Chief Financial Officer, supported by the Investor Relations department, regularly meet with institutional investors and analysts throughout the year. The Board receives regular reports from the Investor Relations department on its activities, and in particular on the feedback being received from investors, analysts and advisers. In 2013, we will continue to further enhance our engagement with shareholders.
I firmly believe our Board is committed to the highest standards of corporate governance and will continue to develop its skills and capabilities as well as promote the long-term success of the Group over the course of 2013 and beyond.
Neil JaninChairman 10 April 2013
Governance: Chairman’s Corporate Governance Statement
72 Bank of Georgia Holdings PLC Annual Report 2012

Governance: Corporate Governance Report
The Board is committed to high standards of corporate governance and has implemented a framework for corporate governance which it considers to be appropriate for BGH. This framework is reviewed on an annual basis as part of the performance evaluation process and will be reviewed in light of any changes to BGH’s strategy. The Corporate Governance Code (the “Code”), published in June 2010 by the Financial Reporting Council, applies to disclosures in this statement. The Code is available to download from www.frc.org.uk
The Financial Conduct Authority requires all listed companies to disclose how they have complied with the provisions of the Code. This Corporate Governance statement, together with the Director’s Responsibility Statement, the Going Concern Statement and the Statement of Compliance all of which are set out on page 95, indicate how BGH has complied with the principles of good governance of the Code and its requirements on internal control.
The BoardWhat is the role of the Board?Our principal duty, collectively, is to promote the long-term success of the Group by directing management in creating and delivering sustainable shareholder value. We do this by setting the strategy and overseeing its implementation by management. While our ultimate focus is long-term growth, we also need to deliver on short-term objectives and we seek to ensure that management strikes the right balance between the two.
We are mindful of our wider obligations and consider the impact our decisions will have on the Group’s various stakeholders, such as our employees, our shareholders, our customers and clients, the environment and our community as a whole. In setting and monitoring the execution of our strategy, we aim to ensure that we maintain an effective system of internal control and that management maintains an effective risk management and oversight process across the Group, so that growth is delivered in a controlled and sustainable way.
In order to ensure that we meet our responsibilities, specific key decisions have been reserved for approval by the Board. These include decisions on the Group’s strategy, approval of risk appetite and capital and liquidity matters, Board membership, financial results and governance issues. A full formal schedule of matters specifically reserved to the Board can be found on our website, at http://www.bogh.co.uk/en/corporate-governance
Board – Chairman, One Executive Director and Six Non-Executive Directors
Board Committee Oversight
Management
Board Nomination Committee
(Chairman, six non-executive Directors, four of whom are independent)
Board Audit Committee
(Three independent non-executive Directors)
Board Remuneration Committee
(Two independent non-executive Directors and the Chairman)
Chief Executive and Chief Financial Officer
Bank of Georgia Holdings PLC Annual Report 2012 73
OverviewPerform
anceGovernance
Financial Statements
Additional Information

To assist us in carrying out our functions and to ensure there is independent oversight of financial, audit and internal control issues, review of remuneration, share plans and other incentives as well as oversight and review of Board and executive succession planning, the Board has delegated certain responsibilities to Board Committees. Each Board Committee has agreed Terms of Reference, which are approved by the Board. Copies of each Committee’s Terms of Reference can be found on our website, at http://www.bogh.co.uk/en/corporate-governance
The Board has decided that all decisions regarding risk and risk management will remain at the Board level as opposed to being delegated to a separate Risk Committee. This arrangement has proven to be successful, allowing each Director to provide meaningful input into the risk management of the Group.
The Chairman of each Board Committee reports to the Board on the matters discussed at Board Committee meetings. You will find later in this section reports from the Chairman of each Board Committee on the Committee’s activities in 2012 and priorities for 2013.
How does the Board operate?We normally meet five times a year. We meet more frequently when the need arises and, in 2012, we arranged and held 10 additional meetings at short notice to discuss other matters relevant to the Board. In total, we met as a Board 15 times during the year. All Directors make every effort to attend each meeting, whether in person, by telephone or by video conference, unless circumstances, such as illness or prior commitments prevent them from doing so. In such instances, they are able to provide the Chairman ahead of the meeting with any views or comments they may have on the matters to be discussed.
The Chairman also seeks input from the non-executive Directors ahead of each Board meeting in order to ensure that any particular matters raised by non-executive Directors are discussed at the meeting. In addition, the Chairman meets with the Company Secretary after each meeting to agree the actions to be followed up and to discuss how effective the meeting was.
Each Director committed an appropriate amount of time to their duties in 2012 and the non-executive Directors met the time commitment specified in their letters of appointment.
Details of Board meeting attendance in 2012 are as follows:
Board Attendance Independent
Scheduled Meetings Eligible to
Attend
Scheduled Meetings Attended
Additional Meetings Eligible to
Attend
Additional Meetings Attended
ChairmanNeil Janin N/A 5 5 10 10Executive DirectorIrakli Gilauri No 5 5 10 10Non-Executive DirectorsDavid Morrison Yes 5 5 10 10Allan Hirst Yes 5 5 10 10Alasdair Breach Yes 5 5 10 9Kaha Kiknavelidze Yes 5 5 10 9Ian Hague No 5 4 10 10Hanna Loikkanen No 5 5 10 10Company SecretaryKate Bennett Rea, on behalf of KB Rea Ltd.
Please note that the members of the Board of BGH are identical to the members of the Supervisory Board of the Bank. Over the course of 2012, 54 meetings of the Supervisory Board were held in person or via teleconference.
Governance: Corporate Governance Report continued
74 Bank of Georgia Holdings PLC Annual Report 2012

What makes our Board effective?Our Board has primary responsibility for ensuring that, as a collective body, it has the appropriate skills, knowledge and experience to perform its role effectively. We take an integrated approach to effective corporate governance, which is underpinned by openness, transparency and accountability, as well as constructive challenge and collaboration.
Key to ensuring the Board’s effectiveness is enabling Directors’ full access to information and management across the Group. The Chairman and non-executive Directors frequently conduct site visits and interact with staff at all levels. This gives them opportunities to see the culture and values of the organisation in action and also provides context to the formal information that they receive for Board meetings.
The Board consistently probes, questions and explores the logic behind management actions both in formal Board meetings and other informal interactions. The Chairman plays a particularly important role by ensuring that all Board members have the opportunity to contribute fully in all Board discussions. Given the collaborative nature of the Board, Board members feel that they can speak their minds freely and constructively challenge management as well as other members of the Board. This atmosphere enhances the Board’s overall effectiveness.
Board Size, Composition and QualificationWe have determined that the optimum Board size for BGH is seven to 10 members. We currently have eight Board members: the Chairman, the Chief Executive Officer and six non-executive Directors. A list of individual Directors and their biographies and qualifications are set out on pages 68 to 69. Details of Board Committee membership are set out on page 76 of this Annual Report.
The size and composition of a board and the qualifications of its members have a significant impact on how effective that board is. We regularly review the balance of skills we have on the Board, as well as the Board’s size and composition, both in terms of what we need now and what we might need to be successful in the future. Our aim is to ensure that we have the right mix for constructive group discussion and, ultimately, effective Board decisions.
We recognise the benefits of diversity on the Board and the current members of the Board have the wide range of skills and experience required to govern the Group. Our Board includes one woman and its members collectively represent five different nationalities. We welcomed and comprehensively discussed Lord Davies’ report entitled “Women on Boards”. We have commenced a full review of our Board’s composition, looking forward to 2015 and beyond. This review is being facilitated through our Nomination Committee. Geographic and gender diversity together with key technical expertise in banking, risk, accountancy, finance, technology and international business will form core components of our Board succession planning. Balancing all of these factors to maintain an effective Board is a delicate matter and we do not believe that imposing quotas is appropriate in this context.
Director IndependenceWe consider non-executive Director independence on a bi-annual basis as well as part of each Director’s performance evaluation. The Board is satisfied that the majority of our non-executive Directors are independent and that therefore there is a balance of independent to non-independent Directors in the context of the Group.
Evaluation of Board PerformanceIn order to improve the effectiveness of the Board, each Board Committee and each individual Director, we undertake on an annual basis a formal and rigorous effectiveness review.
The Board believes that it continues to operate effectively. There is a high level of engagement from our non-executive Directors and meaningful interaction with the Chief Executive Officer and senior management. In the 2012 Board effectiveness review, both the non-executive Directors and executive Director commented that the Board dynamics remain conducive to the provision and receipt of constructive challenge within the context of our unitary board approach.
The results from the 2012 Board effectiveness review acknowledged that the Board Committee structure is effective, with excellent Committee chairmanship and that appropriate feedback is provided to the Board as a whole. It was recognised that the Board as a whole has been able to focus more broadly on strategic issues as a result of the increased delegation to the Board Committees. In 2013, we will continue to focus upon and evolve our approach to ensuring these critical connections between the Board and its Committees.
In addition to reviewing the Board’s overall effectiveness, each Director discussed his or her self-assessment with the Chairman on a one-to-one basis. These discussions included details of time commitment (including, where relevant, the potential impact of outside interests held by each Director), other broader contributions to the Board as well as desired future training and development. Future engagement plans were discussed, providing a guideline for the activities that Director intends to undertake over the next 12 to 18 months.
Succession Planning and Board AppointmentsWe believe that effective succession planning mitigates the risks associated with the departure or absence of well-qualified and experienced individuals. We recognise this and our aim is to ensure that the Board and management are always well resourced, with the right people in terms of skills and experience, in order to effectively and successfully deliver our strategy. We also recognise that, even though new faces bring fresh ideas and perspective to how things are done, continued tenure brings a depth of Group-specific knowledge that is important to retain.
Bank of Georgia Holdings PLC Annual Report 2012 75
OverviewPerform
anceGovernance
Financial Statements
Additional Information

We have a number of Directors that have served between three and six years on the Board. Given the complexity of banking, the volatile macroeconomic environment and changing political landscape in Georgia, we believe that it is important to retain a core of Directors with long-standing knowledge of the Group while still ensuring that the Board’s composition is regularly refreshed. During 2012, the Board (through its Nomination Committee) focused heavily on its future composition with an emphasis both on executive and non-executive succession planning. We have developed a succession plan aimed at ensuring a smooth transition through to 2015 and beyond.
The Board Nomination Committee is responsible for both executive and non-executive Director succession planning and recommends new appointments to the Board. There is a formal, rigorous and transparent procedure for the appointment of new Directors to the Board. More detail on the role of the Board Nomination Committee is given in the report below.
Non-executive Directors’ Terms of AppointmentOn appointment, our non-executive Directors are given a letter of appointment that sets out the terms and conditions of their directorship, including the fees payable and the expected time commitment. Each non-executive Director is expected to commit approximately three to four days per month to the role. An additional time commitment is required to fulfil their roles as Board Committee members and/or Board Committee chairmen, as applicable. We are confident that all non-executive Directors dedicate the amount of time necessary to contribute to the effectiveness of the Board.
Directors’ external activities and conflicts of interestOur Directors have a statutory duty to avoid situations in which they have or may have interests that conflict with those of the Group, unless that conflict is first authorised by the Directors. This includes potential conflicts that may arise when a Director takes up a position with another company. We recognise the importance of the experience, value and knowledge that can be brought to the Board by Directors undertaking other roles or activities. Our Directors are obliged to obtain authorisation prior to doing so and it is their responsibility to ensure that they will be able to meet the time commitment we expect of them and that the additional role will not impact their effectiveness as a Director.
Our Articles of Association allow the Board to authorise potential conflicts, and we have a comprehensive procedure in place to deal with any actual or potential conflict of interest. The Board takes into consideration all the circumstances and deals with each appointment on its individual merit.
All potential conflicts approved by the Board are recorded in an Interests Register, which is reviewed bi-annually by the Board. Following a review of the Interests Register in 2012, the Board concluded that all the potential conflicts as registered have been considered thoroughly and appropriately.
Director Re-electionAt our 2012 AGM, in line with the Code, we moved to the practice of proposing each Director for annual re-election at BGH’s AGM and will follow this practice again in 2013. Following a performance evaluation of each Director and the Board as a whole, we can confirm that all the Directors submitting themselves for re-election are considered by the Board to be fully effective.
Board induction and professional developmentWe have a Director induction and ongoing development programme in place that is tailored to the needs of each Director. All Directors most recently undertook comprehensive training in February 2012 at the time of listing and ongoing training is provided. At each Director evaluation, the Chairman and Director agree a tailored development programme and the Chairman reviews the performance of each Director annually. Delivery against the agreed development programme is a key component of this review. The Chairman and non-executive Directors are supported by dedicated corporate secretariat resources and through specialist advice on corporate governance matters.
Board Committees The Board currently has three primary Committees: the Audit Committee, the Remuneration Committee and the Nomination Committee. The Audit Committee is responsible for the oversight and review of financial, audit and internal disclosure issues. The Remuneration Committee is tasked with the oversight and review of remuneration, share plans and other incentives. The Nomination Committee is responsible for the oversight and review of Board and executive succession planning.
Our Board has made a conscious decision to delegate a broader range of issues to the Board Committees in order for the Board to focus more heavily on strategy, but has ensured effective connections between the Committees and the Board so as to ensure openness and transparency.
Current Membership of the Board Committees
Audit Committee
Remuneration Committee
Nomination Committee
Neil Janin Member ChairmanDavid Morrison Member Member MemberAllan Hirst Chairman MemberAlasdair Breach Chairman MemberKaha Kiknavelidze Member MemberIan Hague MemberHanna Loikkanen Member
Governance: Corporate Governance Report continued
76 Bank of Georgia Holdings PLC Annual Report 2012

In 2012, we heavily focused on the enhancement and close oversight of our internal audit and compliance functions, which has resulted in a fully integrated control framework. We addressed staffing of both the internal audit and compliance departments of the Bank and provided all necessary resources to ensure that each department is better equipped to deliver fully on its objectives.
A detailed description of the Audit Committee’s responsibilities and effectiveness is provided in greater detail below.
Who is on the Audit Committee and what are its responsibilities?Membership of the Committee and attendance at meetings held in 2012 are shown in the table below. Each member role of the Committee has a depth of expertise and, collectively, the Committee has considerable financial and financial services experience on which to draw. The biographies and qualifications of the members of the Audit Committee are set out on pages 68 to 69 of this Annual Report.
Member Independent
Meetings Eligible to
AttendMeetings Attended
Allan Hirst (Chairman) Yes 9 9David Morrison Yes 9 8Kaha Kiknavelidze Yes 9 8
Secretary
Kate Bennett Rea, on behalf of KB Rea Ltd.
Other attendees at Committee meetings from time to time include the Chief Executive Director, the Finance Director, the Head of Internal Audit and the Head of Compliance of the Bank. The external auditor attends the majority of meetings and the Committee also holds regular private sessions with the Head of Internal Audit, the Head of Compliance and the external auditor. These sessions, which are not attended by management, allow the Committee to discuss any issues of concern in more detail and directly with the audit teams.
In summary, the Committee’s role is to:
– monitor the integrity of the Group’s financial reporting and satisfy itself that any significant financial judgements made by management are sound;
– monitor the Group’s internal controls, including internal financial controls;
– monitor and review the activities and performance of the internal and external auditor, including monitoring their independence, objectivity and compliance with the Group’s policy on non-audit services;
– engage with and ensure effective communication with the Board, Head of Internal Audit, the external auditor and shareholders;
– review and monitor conflicts of interests for each Director; and
– monitor and review the effectiveness of the Group’s policies and procedures relating to compliance, whistleblowing and fraud.
The Committee’s full Terms of Reference are available from the corporate governance section of our website, at http://www.bogh.co.uk/en/corporate-governance
Governance: Audit Committee Report
Allan Hirst, Chairman of the Board Audit Committee, gives his personal view of the Board Audit Committee’s activities during 2012Allan HirstChairman of Audit Committee
Chairman’s Overview
Bank of Georgia Holdings PLC Annual Report 2012 77
OverviewPerform
anceGovernance
Financial Statements
Additional Information

How did the Audit Committee discharge its responsibilities in 2012?Financial Reporting Over the course of 2012, the Committee considered the financial control framework within the Group. We have discussed and sought assurance that the effects on the Group’s business of the continued volatility in financial markets (including reduced supply of credit) are being closely monitored. We have also considered impairment generally and compliance with International Financial Reporting Standards within the Group. The Committee has also considered management’s recommendations in respect of provisions for bad and doubtful debts and any other provisions for losses and charges as reported in the Group’s half-year and full-year results. We also considered management’s assessment in determining that the going concern basis for preparing those financial statements was appropriate and are satisfied that we have considered for disclosure all material relevant issues that have been raised by management during the year.
Internal ControlThe Code requires the Board to at least annually conduct a review of the adequacy of the Group’s systems of internal control and report to shareholders that it has done so. The Board has undertaken a full review of all the aspects of the Turnbull Guidance for Directors, as revised in October 2005 (the Turnbull Guidance) under which the Board is responsible for the Group’s system of internal control and for reviewing its effectiveness.
Our role is to carefully review the effectiveness of the Group’s risk management systems and internal controls. We do this by reviewing reports on control issues from the internal audit and compliance functions of the Group. During 2012, we conducted a review of the effectiveness of the Group’s risk management systems and internal controls. We have also discussed control environment issues, their root causes and management’s response and follow-up activities. In addition, we work to ensure that the resourcing requirements of both the internal audit and compliance functions are met so as to enable each department to deliver on its objectives.
Objectivity and Independence of the External AuditorOne of our key responsibilities is to monitor and review the objectivity and independence of our external auditor. This includes having in place a policy to govern the non-audit services that may be provided by the external auditor, which sets out the circumstances in which the external auditor may be permitted to undertake non-audit services. Allowable services are pre-approved up to £100,000. Any permissible non-audit service that exceeds this threshold requires approval from the Committee and must be robustly justified and, if appropriate, tendered, before it is approved.
The Committee’s policy on tax advisory services is to not use the auditor unless there is a very strong case for not seeking an alternative supplier. If non-audit services are undertaken by the auditor, the Committee receives a quarterly report on such non-audit services so that it can monitor the types of services being provided and the fees incurred. On an annual basis, the Audit Committee reviews the Group policy on the provision of non-audit services in order to ensure compliance with its terms.
A breakdown of the fees paid to the auditor for non-audit work may be found in Note 24 of the Consolidated Financial Statements.
Further details of the non-audit services that are prohibited or allowed under our policy can be found on our website, at http://www.bogh.co.uk/en/corporate-governance
Oversight of Internal Audit and External AuditInternal AuditWe are responsible for monitoring the effectiveness of the internal audit function and ensuring it is adequately resourced and focused on the right issues. We also review and approve the annual Internal Audit plan.
During 2012, we received regular reports from Internal Audit, which set out the Internal Audit function’s view of the control environment and performance against key indicators. We have also reviewed and monitored management’s responsiveness to Internal Audit’s findings and recommendations. We also specifically evaluated the resources available to the Internal Audit function and any adjustments to be made to the Internal Audit plan, including changes to methodology.
Internal Audit’s self-assessment of conformance, which we reviewed in the fourth quarter of 2012, evidenced the fact that the function generally conforms to the standards set by the Institute of Internal Auditors.
External AuditIt is our responsibility to monitor the performance, objectivity and independence of the external auditor and recommend to the Board the appointment or re-appointment or removal of the external auditor. We also agree the audit plan with the external auditor to ensure that the areas of focus are appropriate.
Ernst & Young LLP (E&Y) was appointed as our Group statutory auditor by shareholders at our 2012 AGM, following a tender process and subsequent Committee and Board recommendation. During the course of the year, we have discussed with E&Y the business and financial risks and have sought assurance that these risks have been properly addressed in the audit strategy and plan that has been reviewed by the Committee. We have sought assurance and are comfortable that no undue pressure has been asserted on the level of audit fees so as to ensure that there is no risk to audit work being conducted effectively.
Governance: Audit Committee Report continued
78 Bank of Georgia Holdings PLC Annual Report 2012

We conducted a review of the performance and effectiveness of E&Y, which included an assessment of its independence and objectivity. Over the course of the year, the Committee has scrutinised the audit process and the quality and experience of the audit partners and senior team members engaged in the audit.
In conducting the review, the Committee was seeking to gain assurance that E&Y has conducted a comprehensive, appropriate and effective audit. Following such review, the Committee found that E&Y was considered to be effective, objective and independent in its role as Group statutory auditor. The Committee will recommend to the Board and to shareholders that E&Y should be re-appointed as the Group’s auditor at the 2013 AGM.
On a regular basis the Committee meets separately with E&Y, the Deputy CEO, Finance, Head of Internal Audit and Head of Compliance. These meetings allow Committee members to discuss freely matters relating to the statutory auditor’s remit and issues arising from the audit.
EffectivenessThe performance of the Committee is reviewed each year as part of the Board Effectiveness Review, both by the Committee itself and by the Board as a whole. In carrying out this review, the Committee considered best practice recommendations.
The 2012 review concluded that the Committee continues to operate effectively. Areas where we could enhance our performance include ensuring that the form and content of information presented to the Committee is appropriate given the Committee’s busy agenda and we have put together an action plan to address the findings.
Ongoing Training and Development Over the course of the year, the Committee received ongoing training from the Company Secretary, and other professional firms, including Freshfields Bruckhaus Deringer. These sessions covered control effectiveness, financial reporting processes as well as best practice. The Audit Committee will continue its ongoing training to further enhance its effectiveness.
Looking ahead to 2013For 2013, the Committee’s areas of focus will continue to be influenced by the impact of the challenging economic environment and political climate in Georgia. The Committee will continue to enhance the Group’s systems, processes and controls in order to ensure effective operation consistently throughout the Group, in line with the Group’s growth and in response to changes in regulatory requirements. The Committee will also continue to scrutinise the audit process to ensure satisfaction with the quality and coverage of the work done by Internal Audit and the Group’s statutory auditor.
Allan HirstChairman Board Audit Committee10 April 2013
Bank of Georgia Holdings PLC Annual Report 2012 79
OverviewPerform
anceGovernance
Financial Statements
Additional Information

Governance: Directors’ Report on Remuneration
In 2012, the BGH Remuneration Committee’s most important action was to evaluate and re-confirm at the Group level the merits of the existing executive management compensation policy of the Bank and its principal subsidiaries, which was originally adopted in 2010.
In 2010, in the aftermath of the financial crisis, the Bank’s executive management contracts were expiring, allowing the Remuneration Committee and Supervisory Board to formulate a compensation policy reflecting the core principles of the Bank and taking into account the lessons learned from the crisis. In particular, the Bank’s key objective was to create a compensation policy that focused on long-term shareholder value and the avoidance of excessive risk-taking. The Bank’s new policy sought to avoid the pitfalls in the compensation structures prevalent in the United States and Western Europe, which were characterised by high cash bonuses (oftentimes forming over 50% of an employee’s total compensation). That system too frequently rewarded short-term results and promoted high stakes risk-taking at stakeholder, and ultimately taxpayer, expense.
The management compensation policy developed by the Remuneration Committee and adopted by the Supervisory Board in this context (the “Policy”) placed particular focus on the compensation of the Group’s executive management team, comprising approximately seven to 10 people at any given time and including the Bank’s CEO, Irakli Gilauri. When the holding company structure was implemented in 2012, the Policy continued to apply to executives at the Bank and, with his dual role as the CEO of the Bank and BGH (and BGH’s sole Executive Director), to the bulk of Irakli’s compensation in respect of the Bank.
The core principles upon which the Policy is based are the following:
– management should be rewarded only for good performance, taking into account the overall performance of the Group and individual performance;
– management should be incentivised to protect the Group’s long-term performance and guard against taking risks that endanger the long-term stability of the Group; and
– banks prosper over the long term with management compensation structures that allow executives to see themselves as “partners”, i.e., long term participants in and owners of the Bank.
As discussed in greater detail in the Remuneration Overview directly below, the Policy provides for a three-part remuneration structure, comprised of a modest yet competitive fixed cash salary, fixed contingent deferred share compensation and discretionary contingent deferred share compensation. In 2012, the fixed cash salary (including other benefits), fixed contingent deferred share compensation and discretionary contingent deferred share compensation comprised on average 15%, 47% and 38%, respectively, of an executive’s total remuneration package (calculated on an average basis for all those who were members of the executive management team in 2012, and excluding the CEO). The emphasis on share-based compensation, which takes the form of nil-cost options to acquire shares in BGH, has created a culture among executives that prioritises the long-term success of the Group by closely aligning management’s with shareholders’ interests.
The only vesting condition of both the fixed and discretionary contingent deferred share compensation is continued employment within the Group or leaving on a “good leaver” basis.
The most important work of BGH’s Remuneration Committee in 2012 was to evaluate the merits and results of the Group’s management compensation policy, previously adopted in 2010Al BreachChairman of Remuneration Committee
Chairman’s Overview
80 Bank of Georgia Holdings PLC Annual Report 2012

An executive is not considered a “good leaver” (a) if the executive is dismissed for cause, (b) upon the expiration of his or her contract the executive refuses to accept a new service agreement upon substantially similar terms, or (c) if the executive departs the Group other than for good reason (such as breach of a service contract by the company which is not cured during the remedy period), change of control, death, retirement at normal retirement age, disability, injury or redundancy. In addition, the Supervisory Board may, in its discretion in exceptional circumstances, treat an executive as a good leaver in circumstances other than those listed above.
Generally, if the executive is not a good leaver, the unvested portion of his or her contingent deferred share compensation will lapse. If the executive remains employed with the Group or is a good leaver, unvested fixed and discretionary contingent deferred share compensation continues to vest during the respective vesting period. In addition, any unvested fixed and discretionary contingent deferred share compensation vests immediately upon the occurrence of certain events, including death, termination of the contract by the executive for good reason and the occurrence of a change of control (which is defined as a person or a group of people owning more than 50% of the issued voting shares of the Bank or BGH), or upon a decision by the BGH Board or the Supervisory Board that an executive is a good leaver.
The Group’s Policy in effect means that our executives earn rights to acquire shares in BGH through continuing commitment to the Group, and lose the unvested portion of those rights if they leave and are not considered a good leaver e.g. the executive resigns during the term of his contract whether to take up employment elsewhere or otherwise, the executive refuses to renew the contract at the end of the term of the contract or if the Group terminates the employment of the executive for cause.
The Remuneration Committee believes that the compensation of management and a financial institution’s ownership structure is crucial to laying the foundation for the long-term success of an institution. Our experience so far suggests that linking much of management’s remuneration to the stability and growth of the Group is helping to:
– ensure that management is dedicated to strong financial performance;
– entrench a culture of hard work and loyalty to the Group; and
– reward calculated risk-taking that is focused on long-term stability and growth.
Accordingly, in early February 2013, the Committee and the Board re-confirmed their commitment to the terms of the Policy, with the addition of a dividend equalisation mechanism, as described in greater detail below. The Remuneration Committee and the Board believe that the merits of the Policy have been made even clearer in light of the continuing executive compensation developments in banking and other industries since the start of the financial crisis.
Remuneration OverviewThis Directors’ Report on Remuneration and the accompanying Consolidated Financial Statements have been drawn up from the date of incorporation of BGH (14 October 2011)
to 31 December 2012. The accompanying Consolidated Financial Statements are prepared as if the Group is a continuation of the pre-existing group of companies with the Bank as its ultimate parent. The comparative financial statements as at and for the years ended 31 December 2011 and 31 December 2010 are that of the group of companies consolidated with the Bank as its ultimate parent.
With the exception of Irakli Gilauri (who is eligible to receive discretionary contingent deferred share compensation in respect of his Bank service contract), BGH Directors do not receive bonuses or share-based compensation based on performance. The remuneration in respect of Directors of BGH, in their capacity as such, is not linked to any performance conditions and BGH does not currently have any plans to modify the remuneration of its Directors to include any performance conditions. Notwithstanding the above, each BGH Director is carefully evaluated on an annual basis to ensure that his or her performance continues to provide a positive contribution to the Group.
The Group’s executive management team comprises the CEO of BGH and the Bank and the Bank’s deputy CEOs responsible for the following directions: Finance, Retail Banking, Corporate Banking, Wealth Management, Risk, Legal and Affordable Housing, as well as the CEO of Aldagi BCI (each an “executive”).
Irakli Gilauri serves as CEO of BGH and the Bank. He has two separate service agreements, one with BGH signed on 15 December 2011 under which he is paid a fixed cash salary of US$250,000, and one with the Bank signed on 25 May 2010 under which he receives a fixed cash salary of US$187,500 as well as fixed and discretionary contingent deferred share compensation.
Irakli Gilauri’s current service agreement with BGH continues until terminated by either party upon four months’ written notice or by BGH with immediate effect by payment in lieu of notice (where such payment in lieu of notice shall be solely in respect of fixed cash salary under the BGH service agreement).
Irakli’s current service agreement with the Bank has been renewed with effect from 1 May 2013 (the “2013 service agreement”) for a term of three years until 1 May 2016, unless terminated by Irakli upon three months’ written notice or by the Bank with immediate effect, which is the same termination provision as the current service agreement.
BGH and the Bank, as the case may be, may terminate the executive’s employment early without notice or pay in lieu of notice in the case of, among other circumstances, his dishonesty, gross misconduct, conviction of an offence (other than traffic related) or becoming of unsound mind.
If Irakli’s service contract with the Bank is terminated other than for cause or is not renewed on substantially similar terms at the expiry of the term of the contract, Irakli is entitled to a separation payment approximately equal to 12 months’ base annual salary under the Bank service agreement. In addition, upon termination of the service agreement with the Bank for any reason, the executive shall be entitled to all vested fixed and discretionary contingent deferred share compensation and may also be entitled to unvested awards of the same, subject to the vesting provisions summarised below.
Bank of Georgia Holdings PLC Annual Report 2012 81
OverviewPerform
anceGovernance
Financial Statements
Additional Information

Executive RemunerationIn accordance with the Policy, executive compensation comprises the following:
1. Competitive yet modest fixed cash salary;2. Fixed contingent deferred share compensation – this takes the form of annual awards of nil-cost options over such
number of shares in BGH as is stipulated in the executive’s service agreement. Awards vest over the five-year period that follows the beginning of the year (the work year) in respect of which the share award is granted (0% of the options vest in the first year following the work year, 20% of the options vest in each of the second, third and fourth years following the work year, and 40% vest in the fifth year following the work year); and
3. Discretionary contingent deferred share compensation. This takes the form of annual awards of nil-cost options over such number of shares in BGH as is determined annually by the Supervisory Board in its sole discretion, based on the performance of the Bank and the executive. Awards vest over a two-year period following the end of work year (50% of the options vest at the beginning of each of the second and third years following the work year).
A critical element in the overall structure of the compensation is that there are no cash bonuses and the only vesting condition of both the fixed and discretionary contingent deferred share compensation is continued employment with the Group or “good leaver” status as described above.
The following table provides the fixed cash salary, fixed contingent deferred share compensation and discretionary contingent deferred share compensation for the CEO and other members of executive management of the Bank in respect of 2012. Detailed information regarding the holdings of ordinary shares in BGH of executive management can be found on page 86 of this Annual Report. The information below related to Irakli Gilauri has been audited by Ernst & Young LLP in accordance with statutory and regulatory requirements.
Irakli Gilauri
Nikoloz Gamkrelidze
ArchilGachechiladze
Mikheil Gomarteli
Sulkhan Gvalia
Vasil Revishvili
Avto Namicheishvili
Murtaz Kikoria
IrakliBurdiladze
Fixed cash salary (US$)(1)(2) 451,587 127,015 174,483 129,615 149,557 149,561 149,561 137,480 129,615Number of fixed contingent deferred BGH shares 90,000 25,000 30,000 25,000 25,000 30,000 30,000 25,000 25,000Value of fixed contingent deferred share compensation (US$)(1)(3)(5) 1,491,358 414,266 497,119 414,266 414,266 497,119 497,119 414,266 414,266Number of discretionary contingent deferred BGH shares 30,000 27,000 27,000 27,000 22,000 – 27,000 20,000 20,000Value of discretionary contingent deferred share compensation (US$)(1)(4)(5) 497,119 447,407 447,407 447,407 364,554 – 447,407 331,413 331,413Other benefits (US$)(1)(6) 2,288 1,087 2,252 1,873 2,148 1,911 2,060 2,011 1,813
Total Remuneration (US$)(1)(5) 2,442,352 989,776 1,121,262 993,162 930,526 648,591 1,096,148 885,170 877,107
1. Please note that the Bank reports in Lari. All figures provided above in US Dollars have been converted for convenience from Lari to US Dollars using an exchange rate of GEL 1.6567 per US$1.00, being the official Lari to US Dollar exchange rate as reported by the NBG on 31 December 2012 and have been rounded to the nearest US Dollar. Although the amount of each executive’s salary is presented in US Dollars in the table above, these salaries are paid in Lari in Georgia and in GBP in the UK, and therefore accounted for in such currencies. These accounting values in Lari and GBP, for the purposes of the above presentation, have been translated into US Dollars at the 2012 year-end official exchange rate of NBG.
2. Irakli Gilauri’s BGH salary was cash only in the amount of US$233,037, and is included in the figure in this table.
3. For presentation purposes in the table above, the values of the fixed contingent deferred shares are calculated as the full number of grant shares multiplied by US$16.6, which was the market value of a BGH share as at 31 December 2012. However, for IFRS purposes, grant values of these shares are based on the market values of the same shares at the respective grant dates. The grant date of the fixed contingent deferred shares was the date of signature of the executive’s contract, which was 25 May 2010 for Irakli Gilauri and 29 March 2010 for all other executives listed in the table above. The share price in US Dollars as at 25 May 2010 and 29 March 2010, was US$10.2 and US$10.6, respectively. Fixed contingent deferred share compensation is subject to a five-year vesting period as described above.
Governance: Directors’ Report on Remuneration continued
82 Bank of Georgia Holdings PLC Annual Report 2012

4. For presentation purposes in the table above, the values of the discretionary shares are calculated as the full number of grant shares multiplied by US$16.6, the market value of a BGH share on 31 December 2012. However, for IFRS purposes, grant values of these shares are based on the market values of the same shares at the respective grant dates. The grant date of the discretionary contingent deferred shares for all executives was 15 February 2013, the date of award by the Board. The share price in US Dollars as at that date was US$21.5. Discretionary contingent deferred share compensation is subject to two-year vesting as described above.
5. Because (as described in detail above) the share-based compensation is deferred and contingent, an economic valuation of the compensation award would discount for those factors. In that sense, the total value of remuneration is overstated in the above table. The actual value of the share-based compensation and thus an executive’s total remuneration in respect of a given year will depend on the number of shares that vest in that year and the value of the shares at the time they vest or are sold, which could be a value greater or lesser than the value of the shares at 31 December 2012.
6. Other benefits include payments in respect of the Executive’s medical and life and incapacity insurance.
The following table sets out details of the nil-cost options over BGH shares which have been granted to Irakli Gilauri. This information has been audited by Ernst & Young LLP in accordance with statutory and regulatory requirements.
Number of BGH shares underlying Options
Name of grant Date of
grantVesting
DateExpiry
Date
Price paid for
grant (£)
Exercise price
(£)
Share price on
date of exercise
(£)
Held at 1 Jan 2012
Awarded during
2012
Exercised during
2012
Lapsed during
2012
Held at 31 Dec
2012
Fixed contingent deferred share compensation in respect with year ended 31 December 2011
1 Mar 2012 20% oneach of
1 January2013,2014
and 2015; 40% on
1 January 2016
Footnote1 Nil Nil – 90,000 – – 90,000
In respect with year ended 31 December 2010
8 Nov 2011 20% on each of
1 January 2012, 2013
and 2014; 40% on
1 January 2015
Footnote1 Nil Nil 10.40 90,000 – (18,000) – 72,000
Discretionary contingent deferred share compensation in respect with year ended 31 December 2011
1 Mar 2012 50% on each of
1 Jan 2013 and
1 Jan 2014
Footnote1 Nil Nil – 34,000 – – 34,000
In respect with year ended 31 December 2010
8 Nov 2011 50% on each of
1 Jan 2012 and
1 Jan 2013
Footnote1 Nil Nil 20,000 – – – 20,000
In respect with year ended 31 December 2009
8 Nov 2011 25% on each of
1 Jan 2012, 2013, 2014
and 2015
Footnote1 Nil Nil 10.40 120,000 – (60,000) – 60,000
In respect with year ended 31 December 2008
4 Nov 2009 33% on each of
1 Jan 2010 and 2011,
34% on 1 Jan 2012
Footnote1 Nil Nil 10.40 119,565 – (99,565) – 20,000
In respect with year ended 31 December 2008
10 Sep 2009 33% on each of
1 Jan 2010 and 2011,
34% on 1 Jan 2012
Footnote1 Nil Nil 10.40 25,000 (25,000) – –
Grand total 374,565 124,000 (202,565) – 296,000
1. Tenth anniversary from the vesting date.
Irakli’s gain on the exercise of his share options was GBP 1,685,341 in 2012. The gain is defined as the difference between (a) the market price of the shares on the date on which the option was exercised and (b) the price actually paid for the shares, which is nil in this particular case, as indicated in the table above.
Bank of Georgia Holdings PLC Annual Report 2012 83
OverviewPerform
anceGovernance
Financial Statements
Additional Information
The market price of BGH shares during 2012 ranged from £9.30 to £13.30 per BGH share and the closing market price of a BGH share on 31 December 2012 was £10.30.
With effect from 14 February 2013, outstanding share options are subject to the dividend equalisation mechanism described below in respect of all dividends paid on or after such date.
The only vesting condition for Irakli’s fixed and discretionary contingent deferred share compensation is continued employment within the Group or leaving on a “good leaver” basis. The CEO is not considered a “good leaver”, and all his unvested fixed and discretionary awards shall lapse (unless the Supervisory Board determines otherwise), if he is dismissed for cause or departs from the Group other than for good reason.
If the 2013 service agreement with the Bank expires and is not renewed upon substantially similar terms but Irakli is offered membership of the board of the Bank and/or of BGH, 50% of each of his unvested awards shall vest immediately and the remaining 50% shall (where he accepts the offer of board membership) continue to vest as normal or (where he refuses such offer) may, at the CEO’s discretion, either continue to vest as normal or the CEO may acquire some or all of the underlying shares for a specified price in accordance with the terms of the service agreement. If the CEO accepts the offer of Board membership, any remaining unvested awards when he ceases to be a board member shall, at his discretion, either continue to vest as normal or the underlying shares may be acquired for the specified price.
Any unvested awards shall vest immediately if ceases to be an executive by reason of death, disability, injury, redundancy or retirement at normal retirement age; if there is a change of control of the Bank or BGH; if the 2013 service agreement is terminated by the Bank other than for cause or by Irakli for good reason; or if it expires and neither a renewed agreement nor Board membership is offered.
Any unvested awards granted under Irakli’s 2010 service agreement with the Bank shall vest immediately on termination of the 2013 service agreement for any reason, except that (i) if the agreement is terminated by the Bank for cause, any unvested awards shall (unless the Supervisory Board determines otherwise) lapse, and (ii) if it is terminated by Irakli for any reason other than for good reason (and unless the Supervisory Board determines otherwise to his advantage), 50% of each of the unvested awards shall vest immediately and the remaining 50% shall, at his discretion, either continue to vest as normal or the underlying shares may be acquired for the specified price.
Governance: Directors’ Report on Remuneration continued
As provided in greater detail in the table above and based on BGH share market value as of 31 December 2012, Irakli Gilauri’s compensation package for 2012 comprised an aggregate fixed cash salary (from BGH and the Bank) of US$ 451,587, a fixed contingent deferred share compensation award of 90,000 shares in BGH (with a value of US$ 1,491,358) and a discretionary contingent deferred share compensation award (in respect of the Bank’s and Irakli’s performance during the year 2012) of 30,000 shares in BGH (with a value of US$ 497,119). These elements comprised 19%, 61% and 20% of his total compensation package, respectively.
The average fixed cash salary for the executive management team (excluding Irakli Gilauri) in 2012 was US$143,361 and comprised on average 15% of an executive’s average compensation package. The fixed cash salary is structured to be a small portion of the overall compensation package, yet competitive enough to attract talent to the Group.
The average fixed contingent deferred share compensation for the executive management team (excluding Irakli Gilauri) in 2012 was 26,875 shares (with a value of US$445,336) and comprised on average 47% of an executive’s average compensation package. Fixed contingent deferred share compensation is not performance based and consequently, forms a fixed portion of an executive’s compensation package. All fixed contingent deferred share compensation is subject to a five-year vesting period as outlined above. With 40% of an executive’s fixed contingent deferred shares vesting in the fifth year following the beginning of the work year, executive management are further motivated to focus on the long-term success of the Group.
The average discretionary contingent share compensation for the executive management team (excluding Irakli Gilauri) in 2012 was 21,250 shares (with a value of US$ 352,126) and comprised on average 38% of an Executive’s average compensation package.
The aggregate pool of shares available for discretionary contingent deferred share compensation is determined by the Remuneration Committee annually, based on a number of criteria including: (a) the overall performance of the Group over the year in respect of which the awards are to be granted, particularly its profitability; (b) the performance of the Bank relative to its competitors in Georgia and in the light of overall global market conditions; and (c) the market value of the shares at time of grant.
84 Bank of Georgia Holdings PLC Annual Report 2012

In determining the number of shares over which individual discretionary contingent deferred share compensation awards will be granted, the Remuneration Committee evaluates the executive’s role and its importance to the Group as well as the individual key performance indicators (KPIs) assigned to the executive, which reflect the executive’s required contribution to the Group’s overall key strategic and financial objectives. For the 2012 financial year, these objectives included: (a) financial objectives (e.g. operating profit, operating leverage, earnings per share, return on equity and return on assets); (b) business growth objectives (e.g. customer lending growth, client deposit growth, and fee and commission generation); (c) risk management objectives (e.g. capital strength, liquidity management and cost of credit risk); and (d) people development objectives (e.g. succession planning, training and development). In addition, the Remuneration Committee considers the executive’s “360 degree evaluation”, which is an exhaustive annual internal peer review system. In the case of the CEO, the Supervisory Board also assesses the CEO’s contribution and how he met his KPIs. In the case of other members of executive management, the CEO also discusses with the Remuneration Committee the executive’s individual contributions and how he or she met the KPIs.
The Remuneration Committee’s policy is that discretionary contingent deferred share compensation will comprise less than 50% of an executive’s total compensation package.
The Code, which requires disclosure of the compensation arrangements for all directors of premium listed companies on the London Stock Exchange, recommends for share-based compensation of directors a minimum three-year vesting period, challenging performance conditions reflecting the company’s objectives, phased grants and clawback provisions. As mentioned above, the only Director of BGH who is eligible for any share-based compensation is the CEO, Irakli Gilauri, in his capacity as CEO of the Bank. When assessing his compensation arrangements as CEO of BGH, we also take into account the remuneration that he receives in his capacity as CEO of the Bank, which comprises a fixed salary and fixed and discretionary contingent deferred share compensation. Irakli’s fixed contingent deferred share compensation takes the form of awards over 90,000 shares per annum. As described above, Irakli’s fixed contingent deferred share compensation is subject to vesting over a five-year period while his discretionary contingent deferred share compensation awards is subject to vesting over a two-year period. In compliance with the Code, awards of both fixed and discretionary contingent deferred share compensation are phased (in that they are granted annually). While vesting is contingent, there are no clawback provisions. The number of shares awarded as discretionary contingent deferred share compensation in respect of any year is performance-based, but there are no performance conditions (other than continued employment or leaving as a good leaver) for the vesting of such awards. For fixed contingent deferred share compensation, the number of shares awarded annually is determined in the executive’s service agreement.
Although the terms of the CEO’s share-based compensation are not in line with the vesting recommendations of the Code, the Committee strongly believes that, with its high composition of both fixed and discretionary contingent deferred share compensation, Irakli’s overall Bank compensation package satisfies the spirit of the Code. The weighted average vesting period of Irakli’s fixed and discretionary contingent deferred share compensation awarded in respect of 2012 is 3.5 years while the weighted average vesting period for all of executive management (including Irakli) fixed and discretionary deferred share compensation awarded in respect of 2012 is 3.2 years.
The Policy adopted by the Committee, the Board and the Supervisory Board of the Bank in February 2013 contains a dividend equalisation mechanism whereby members of the executive management team who have been awarded fixed or discretionary contingent deferred share compensation which has not yet vested, will receive, at the time the contingent deferred shares actually vest, cash payments equal to the dividends paid on the underlying shares between the date of grant and the vesting date. Such dividend payments will be paid in Lari, converted from GBP using the exchange rate as at the date dividends were paid to other shareholders. This dividend equalisation mechanism applies to all unvested contingent deferred share compensation granted.
In addition to the compensation outlined above and in accordance with the Group’s policy, the executive management team (including Irakli Gilauri) also receive benefits, which include medical insurance, life assurance, company car and participation in a pension scheme whereby the executive and the Bank each contribute a minimum of 1.0% of his or her gross monthly salary to the Bank’s defined contribution pension scheme and the Bank contributes an additional 1.0%. Should the executive decide to make an additional contribution to the pension fund, the Bank will match by contributing in a proportion of 0.2 to 1, up to a maximum of 1% of the executive’s monthly gross salary. The average value of total benefits received by a member of the executive management team (including Irakli Gilauri) per year is US$2,000. Non-Executive Directors do not receive any pension or other benefits.
In 2012, the Bank’s aggregate contributions to Irakli Gilauri’s pension fund were US$2,186.
Bank of Georgia Holdings PLC Annual Report 2012 85
OverviewPerform
anceGovernance
Financial Statements
Additional Information

Management HoldingsThe following table shows the holdings of executive management of BGH shares as at 31 December 2012 and as at the date of this Annual Report.
Irakli
GilauriNikoloz
GamkrelidzeArchil
GachechiladzeMikheil
GomarteliSulkhan
GvaliaVasil
RevishviliAvto
NamicheishviliMurtaz Kikoria
Irakli Burdiladze
Vested holdings as at 31 December 2012 206,431 33 – 38,867 54,304 – 84,488 23,000 –
Shares options (awarded but not yet vested) as at 31 December 2012 296,000 23,292 112,167 108,250 100,500 102,250 156,333 109,000 93,000
Executive’s ownership (vested holdings and share options (awarded but not yet vested) as at 31 December 2012) 502,431 23,325 112,167 147,117 154,804 102,250 240,821 132,000 93,000
Vested holdings as of the date of the Annual Report 109,431 – 11,333 54,867 67,404 15,200 81,954 37,000 –
Share options (awarded but not yet vested), as of the date of the Annual Report 293,000 66,417 115,000 101,500 93,000 79,500 116,500 89,000 88,500
Executive’s ownership (vested holdings and share options (awarded but not yet vested) as of the date of the Annual Report) 402,431 66,417 126,333 156,367 160,404 94,700 198,454 126,000 88,500
Non-Executive Director Letters of Appointment In accordance with the Group’s policy, each of the non-executive Directors (listed below) entered into a Letter of Appointment on 15 December 2011 for an initial term of three years of which 16 months is unexpired, although each Director stands for re-election at each AGM, in accordance with the recommendation of the Corporate Governance Code. Each Letter of Appointment provides for a one-month notice period although BGH may terminate the appointment with immediate effect without notice or pay in lieu of notice if the Director has committed any serious breach or non-observance of his or her obligations to BGH, is guilty of fraud or dishonesty, brings BGH or him/herself into disrepute or is disqualified as acting as a director, among other circumstances. Upon termination, the only compensation a non-executive Director is entitled to are accrued fees as at the date of termination together with reimbursement of properly incurred expenses incurred prior to the termination date.
Governance: Directors’ Report on Remuneration continued
86 Bank of Georgia Holdings PLC Annual Report 2012
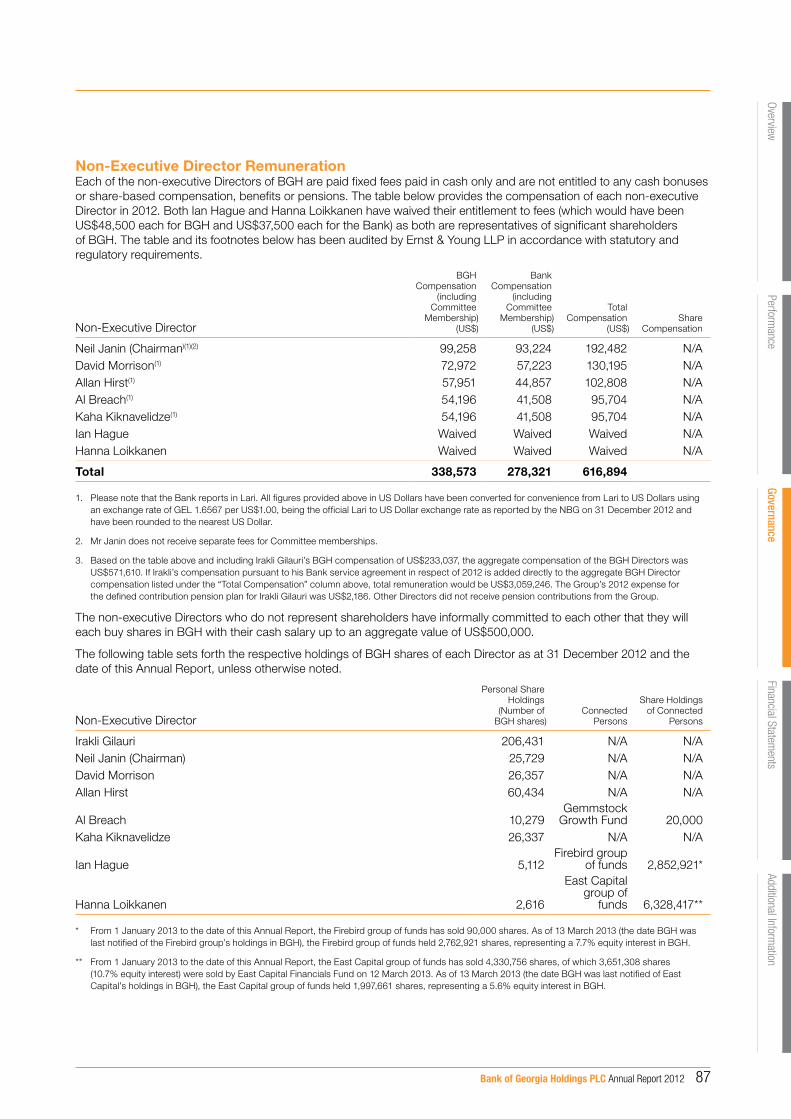
Non-Executive Director RemunerationEach of the non-executive Directors of BGH are paid fixed fees paid in cash only and are not entitled to any cash bonuses or share-based compensation, benefits or pensions. The table below provides the compensation of each non-executive Director in 2012. Both Ian Hague and Hanna Loikkanen have waived their entitlement to fees (which would have been US$48,500 each for BGH and US$37,500 each for the Bank) as both are representatives of significant shareholders of BGH. The table and its footnotes below has been audited by Ernst & Young LLP in accordance with statutory and regulatory requirements.
Non-Executive Director
BGH Compensation
(including Committee
Membership) (US$)
Bank Compensation
(including Committee
Membership) (US$)
Total Compensation
(US$)Share
Compensation
Neil Janin (Chairman)(1)(2) 99,258 93,224 192,482 N/ADavid Morrison(1) 72,972 57,223 130,195 N/AAllan Hirst(1) 57,951 44,857 102,808 N/AAl Breach(1) 54,196 41,508 95,704 N/AKaha Kiknavelidze(1) 54,196 41,508 95,704 N/AIan Hague Waived Waived Waived N/AHanna Loikkanen Waived Waived Waived N/A
Total 338,573 278,321 616,894
1. Please note that the Bank reports in Lari. All figures provided above in US Dollars have been converted for convenience from Lari to US Dollars using an exchange rate of GEL 1.6567 per US$1.00, being the official Lari to US Dollar exchange rate as reported by the NBG on 31 December 2012 and have been rounded to the nearest US Dollar.
2. Mr Janin does not receive separate fees for Committee memberships.
3. Based on the table above and including Irakli Gilauri’s BGH compensation of US$233,037, the aggregate compensation of the BGH Directors was US$571,610. If Irakli’s compensation pursuant to his Bank service agreement in respect of 2012 is added directly to the aggregate BGH Director compensation listed under the “Total Compensation” column above, total remuneration would be US$3,059,246. The Group’s 2012 expense for the defined contribution pension plan for Irakli Gilauri was US$2,186. Other Directors did not receive pension contributions from the Group.
The non-executive Directors who do not represent shareholders have informally committed to each other that they will each buy shares in BGH with their cash salary up to an aggregate value of US$500,000.
The following table sets forth the respective holdings of BGH shares of each Director as at 31 December 2012 and the date of this Annual Report, unless otherwise noted.
Non-Executive Director
Personal Share Holdings
(Number of BGH shares)
Connected Persons
Share Holdings of Connected
Persons
Irakli Gilauri 206,431 N/A N/ANeil Janin (Chairman) 25,729 N/A N/ADavid Morrison 26,357 N/A N/AAllan Hirst 60,434 N/A N/A
Al Breach 10,279Gemmstock
Growth Fund 20,000Kaha Kiknavelidze 26,337 N/A N/A
Ian Hague 5,112Firebird group
of funds 2,852,921*
Hanna Loikkanen 2,616
East Capital group of
funds 6,328,417**
* From 1 January 2013 to the date of this Annual Report, the Firebird group of funds has sold 90,000 shares. As of 13 March 2013 (the date BGH was last notified of the Firebird group’s holdings in BGH), the Firebird group of funds held 2,762,921 shares, representing a 7.7% equity interest in BGH.
** From 1 January 2013 to the date of this Annual Report, the East Capital group of funds has sold 4,330,756 shares, of which 3,651,308 shares (10.7% equity interest) were sold by East Capital Financials Fund on 12 March 2013. As of 13 March 2013 (the date BGH was last notified of East Capital’s holdings in BGH), the East Capital group of funds held 1,997,661 shares, representing a 5.6% equity interest in BGH.
Bank of Georgia Holdings PLC Annual Report 2012 87
OverviewPerform
anceGovernance
Financial Statements
Additional Information

Who is on the Remuneration Committee and what are its responsibilities?Membership of the Committee and attendance at meetings held in 2012 are shown in the table below.
Member Independent
Meetings Eligible to
AttendMeetings
Attended
Al Breach (Chairman) Yes 3 3
Neil Janin No 3 3
David Morrison Yes 3 3
Secretary
Kate Bennett Rea, on behalf of KB Rea Ltd.
Neil Janin, the Chairman of BGH and a member of the Remuneration Committee, was considered independent at the time that Neil was appointed as Chairman of BGH.
Other attendees at Committee meetings from time to time include other Board members and Avto Namichieshvili (Deputy CEO, Legal at the Bank). Attendees at Remuneration Committee meetings do not participate in discussions related to their own remuneration.
In summary, the Committee’s role is to:
– recommend to the Board the remuneration strategy and policy for the Chairman of the Board, Executive and Non-Executive Directors, members of the executive management team, other senior employees of the Group and consultants to the Board;
– determine the overall compensation structure for the Chairman of the Board, CEO and executive management, the terms of employment and remuneration for Directors and executive management, including termination provisions;
– review the effectiveness of the remuneration policy, giving due regard to the financial and commercial health of the Group, while ensuring that Directors and executive management are fairly rewarded for their individual contribution (based on comprehensive evaluations) to the Group’s overall performance;
– approve the number of shares to be held in trust and made available for both fixed and discretionary deferred share compensation as well as ratify the discretionary contingent share compensation of the CEO and members of executive management, taking into consideration the individual executive’s performance against previously agreed objectives and the financial condition of the Group; and
– oversee changes in employee benefit structures within the Group.
The Committee’s full Terms of Reference are available from the corporate governance section of our website, http://www.bogh.co.uk/en/corporate-governance
How did the Remuneration Committee discharge its responsibilities in 2012?For 2012, the Remuneration Committee considered the following matters in line with its remit:
– performance measures and targets to be applied to discretionary contingent deferred share compensation in 2012;
– the individual performance of each member of the executive management team against set performance targets;
– in line with the Group’s Policy, determine whether discretionary contingent deferred share compensation should be granted;
– consideration of advisory bodies’ and institutional investors’ current guidelines on executive compensation, and assessment of the risk environment surrounding the Group’s current remuneration arrangements;
– fixing compensation arrangements and agreeing executive management team contracts for the period beginning May 2013 for 2.5 or 3.5 year periods, in order to ensure that all executive management team contracts do not come up for renewal at the same time;
– analysing the pay and employment conditions of employees of the Group and taking these into account when determining executive compensation for the period beginning May 2013 for the duration of executive management contracts, including comparing changes in pay and employment conditions across the Group as a whole versus the proposed pay and employment conditions of all levels of management;
– review of the Committee’s performance and its Terms of Reference; and
– approval of the 2012 Directors’ Remuneration Report.
EffectivenessThe performance of the Committee is reviewed each year as part of the Board Effectiveness Review, both by the Committee itself and by the Board as a whole. In carrying out this review, the Committee considered best practice recommendations.
The 2012 review concluded that the Committee continues to operate effectively.
Governance: Directors’ Report on Remuneration continued
88 Bank of Georgia Holdings PLC Annual Report 2012

Total Shareholder ReturnBank of Georgia TSR vs. the FTSE indices TSR
Jun-12 Aug-12 Dec-12Oct-12 Feb-13Apr-12Feb-12
BGEO(RI) FTSE100(RI)
150
0
120
100
90
80
110
140
130
FTSE250(RI) FTALLSH(RI)
Bank of Georgia TSR performance for the period was 48.55%.
FTSE 100 performance for the period was 12.99%.
FTSE 250 performance for the period was 24.69%.
FTSE All-Share performance for the period was 14.75%.
Bank of Georgia vs. FTSE 100 for the period was 35.57%.
Bank of Georgia vs. FTSE 250 for the period was 23.87%.
Bank of Georgia vs. FTSE All-Share for the period was 33.80%.
The graph above compares the Total Shareholder Return (TSR) of Bank of Georgia Holdings PLC with the companies comprising the FTSE All-Share Index and the FTSE 250 Index for the period since BGH’s listing on the Premium Segment of the LSE on 28 February 2012. These indices were chosen for comparison because BGH has been a member of both indices for the majority of the period since its listing on 28 February 2012.
Ongoing Training and DevelopmentOver the course of the year, the Committee received ongoing training from the Company Secretary and other external professional firms. These sessions principally covered corporate governance best practice and investor remuneration guidance. The Committee will continue its ongoing training to further enhance its effectiveness.
Looking Ahead to 2013In 2013, the Committee’s focus will be on ensuring that the overall compensation structure for the CEO and executive management team and other senior employees of the Group remain appropriate in order to motivate executives while enhancing long-term shareholder value. The Committee is open to constructive suggestions from shareholders regarding the Group’s remuneration strategy and policy.
On behalf of the Board.
Al BreachChairman Board Remuneration Committee 10 April 2013
Bank of Georgia Holdings PLC Annual Report 2012 89
OverviewPerform
anceGovernance
Financial Statements
Additional Information

In 2012, key highlights of our work included:
– the development of succession plans for the Chairman, Chief Executive Officer, all non-executive Directors and key senior managers;
– evaluation of several candidates for new independent Directorial roles; and
– consideration of the issue of diversity, in light of the Lord Davies’ Report on gender diversity of boards.
Who is on the Nomination Committee and what are its responsibilities?Membership of the Committee and attendance at meetings held in 2012 are shown in the table.
Member Independent
Meetings Eligible to
AttendMeetings Attended
Neil Janin (Chairman) N/A 3 3David Morrison Yes 3 3Allan Hirst Yes 3 3Alasdair Breach Yes 3 3Kaha Kiknavelidze Yes 3 3Ian Hague No 3 3Hanna Loikkanen No 3 3
Secretary
Kate Bennett Rea, on behalf of KB Rea Ltd.
In summary, the Committee’s role is to:
– review the composition of the Board and Board Committees to ensure they are appropriately constituted and balanced in terms of skills and experience and to recommend to the Board the appointment of new Directors;
– develop and consider succession plans for the Chairman, Chief Executive Officer, non-executive Directors and key senior managerial roles;
– monitor issues and developments; and – agree the process for the annual Board Effectiveness Review and track the progress of any actions arising.
The Committee’s full Terms of Reference are available from the section of our website, http://www.bogh.co.uk/en/corporate-governance
Governance: Nomination Committee Report
Neil Janin, Chairman of the Board Nomination Committee, gives his personal view of the Board Nomination Committee’s activities during 2012Neil JaninChairman of Nomination Committee
Chairman’s Overview
90 Bank of Georgia Holdings PLC Annual Report 2012

How did the Nomination Committee discharge its responsibilities in 2012?The Committee reviewed the structure, size and composition of the Board and the Board Committees, looking at the need to refresh the Board, the balance and diversity of skills and experience on the Board and planning ahead for new Board appointments as well as future retirements. We undertook a skills analysis and considered the skills that are likely to be required in the future. In light of this analysis, we have begun to interview candidates for non-executive Directorial roles.
The Committee also discussed and developed succession plans for the Chairman, Chief Executive Officer, non-executive Directors and key senior managerial roles. As most of our Directors have served between three and six years, we will look to refresh the Board over the next few years, based on the skills required for the Group. As part of this discussion, the Committee reviewed and discussed the outcome of the Lord Davies’ Report on the proportion of women on boards and diversity in general. The Group has historically placed a high emphasis on diversity and will continue to do so looking forward. Geographic and gender diversity together with key technical expertise in banking, risk, accountancy, finance, technology and international business all form core components of our Board succession planning. Balancing all of these factors to maintain an effective Board is a delicate matter and we do not believe that imposing quotas is appropriate in this context.
Throughout the year, we have undertaken training in order to remain up to date on significant developments and how these might impact the Group.
To ensure that the Committee is operating effectively, we carried out our Committee review at the time of the Board Effectiveness Review. The Committee is reviewed by the members themselves as well as by the Board as a whole. Following the review, the Committee was found to be operating effectively.
Looking ahead to 2013For 2013, the Committee will continue to focus on succession planning and Board and Committee refreshment. We will also look to have greater visibility of potential candidates for key senior positions with the Group. We will continue to review and monitor Board and Board Committee composition against our skills and experience requirements and diversity guidance.
Neil JaninChairmanBoard Nomination Committee10 April 2013
Bank of Georgia Holdings PLC Annual Report 2012 91
OverviewPerform
anceGovernance
Financial Statements
Additional Information
Governance: Directors’ Report
Principal Activities and Business ReviewBGH is the holding company for the Group. The Group operates globally and is principally engaged in the core businesses of retail banking, corporate banking, asset and wealth management as well as the synergistic businesses of insurance and healthcare and affordable housing.
We are required to present a fair review of our business during the financial year ended 31 December 2012, our position at year-end and a description of the principal risks and uncertainties that we face. This review enables shareholders to assess how the Directors have performed their duties under the Companies Act 2006.
The Directors’ Report and the accompanying Consolidated Financial Statements have been drawn up from the date of incorporation of BGH (14 October 2011) to 31 December 2012. The accompanying Consolidated Financial Statements are prepared as if the Group is a continuation of the pre-existing group of companies with the Bank as its ultimate parent. The comparative financial statements as at and for the years ended 31 December 2011 and 31 December 2010 are that of the group of companies consolidated with the Bank as its ultimate parent.
The information required for the business review and certain other disclosers can be found in this Directors’ Report and the following sections of the Annual Report, which are incorporated in this Directors’ Report:
Chairman’s statement: pages 2 to 5
Group Chief Executive’s Review: pages 22 to 23
Strategy: pages 14 to 15
Market review: pages 18 to 19
Key performance indicators: pages 24 to 27
Business review – Overview of financial results: pages 28 to 35
Segment discussions: pages 36 to 45
Risk management: pages 56 to 65
Risks and uncertainties: pages 46 to 55
Corporate Governance Report: pages 73 to 76
Directors’ Report on Remuneration: pages 80 to 89
Articles of AssociationBGH’s Articles of Association may only be amended by a special resolution at a general meeting of shareholders. The Articles of Association are available on BGH’s website http://www.bogh.co.uk/en/corporate-governance
Share CapitalBGH was incorporated on 14 October 2011 (company number 07811410). At incorporation, the issued and fully paid-up capital was £50,001, comprised of one subscriber share and 50,000 redeemable shares.
On 20 December 2011, in connection with the introduction of BGH as the new holding company for the Group, BGH issued a Prospectus detailing the tender offer of one BGH ordinary share for each ordinary share of Bank of Georgia, whether held in the form of an ordinary share or a global depositary receipt, in connection with an application for admission to the premium listing segment of the Official List of the UK Listing Authority and to trading on the London Stock Exchange.
The tender offer was successful, and admission to the Official List of the UK Listing Authority and to trading on the London Stock Exchange took place on 28 February 2012. Upon the first issue of BGH shares to existing holders, the one subscriber share and 50,000 redeemable shares were acquired by the BGH for nil consideration and cancelled, resulting in a share capital of 35,909,383 ordinary shares, with a nominal value of £6.00 each.
BGH capitalised the full amount standing to the credit of the merger reserve and applied the sum so capitalised in issuing Class A shares credited as fully paid to the holders who validly accepted the tender offer. The Class A shares were non-voting , not entitled to any profit or assets or return of capital in the event of winding up and could be redeemed without prior notice from BGH.
Following admission, the Directors applied to the High Court of Justice of England and Wales to undertake a reduction of capital in order to create distributable reserves for BGH. On 20 March 2012, the Court Order approving the reduction of capital was registered with the Registrar of Companies and the nominal value of each of the ordinary shares in the capital of BGH was reduced from £6.00 to £0.01 and the reduction of capital created distributable reserves of approximately £299.5 million for BGH. At the same time as the registration of the capital reduction, BGH redeemed and cancelled all Class A shares and, as a result, BGH’s ordinary shares represented and continue to represent 100% of the total issued share capital of BGH.
On a show of hands, each member present at our general meeting has the right to one vote. On a poll, each member is entitled to one vote for every ordinary share held.
Persons with direct or indirect interests in BGH shares or the ability to exercise voting rights over at least 10%, 25% or 50% (or such other percentages as a regulatory authority may determine from time to time) of the shares in any regulated Group company, must notify BGH as well as satisfy and comply with all regulatory requirements, as described in BGH’s Articles of Association.
The Directors are not aware of any agreements between holders of BGH’s shares that may result in restrictions on the transfer of securities or on voting rights. No person has any special rights of control over BGH’s share capital and all issued shares are fully paid.
92 Bank of Georgia Holdings PLC Annual Report 2012

BGH may, by ordinary resolution, upon the recommendation of the Board, capitalise all or any part of an amount standing to the credit of a reserve or fund to be set free for distribution provided that amounts from the share premium account, capital redemption reserve or any profits not available for distribution should be applied only in paying up unissued shares to be allotted to members credited as fully paid and no unrealised profits shall be applied in paying up debentures of BGH or any amount unpaid on any share in the capital of BGH.
At the 2012 AGM, BGH was granted authority by shareholders to purchase up to 10% of BGH’s issued share capital. In 2012, no ordinary shares were purchased by BGH. This authority will expire at this year’s AGM. As such, a special resolution is proposed in the Notice of AGM seeking shareholder approval to renew this authority.
At the 2012 AGM, the Directors were also given the power to allot ordinary shares in BGH up to an amount approximately equal to two-thirds of the issued share capital of BGH (excluding treasury shares). This authority will expire at this year’s AGM. As such, an ordinary resolution is proposed in the Notice of AGM seeking shareholder approval to renew this authority.
In addition, at the 2012 AGM, the Directors were given the power to issue shares up to the equivalent of 5% of BGH’s issued share capital, including shares held in treasury, on a non-pre-emptive basis to ordinary shareholders. This authority will expire at this year’s AGM. As such, a special resolution is proposed in the Notice of AGM seeking shareholder approval to renew this authority.
Detailed explanatory notes to these resolutions will be set out in the Notice of AGM mailed to shareholders on or about 18 April 2013 and available on BGH’s website http:www.bogh.co.uk/en/investors
Other than the above, we have no current intention of issuing further share capital and no issue will be made which would effectively alter control of BGH without prior approval of shareholders in a general meeting.
Results and DividendsBGH may by ordinary resolution declare dividends provided that no such dividend shall exceed the amount recommended by BGH’s Directors. The Directors may also pay interim dividends as appearto be justified by the profits of BGH available for distribution.
As BGH is a holding company, BGH relies primarily on dividends and other statutorily and contractually permissible payments from its subsidiaries to generate revenues necessary to meet its obligations and pay dividend to its shareholders.
As a result of the Bank’s strong financial performance and condition, BGH, as a controlling shareholder of the Bank has approved an annual dividend of GEL 1.5 on 5 April 2013 for the year ended 31 December 2012, which will be paid by the Bank to its shareholders (including BGH) in May 2013. The BGH Board has recently recommended an annual dividend of GEL 1.5 payable in Sterling, which is subject to shareholders approval at the AGM. If approved it is intended that the dividend will be paid in sterling on 19 June 2013 to shareholders on the UK register of members at the close of business in the UK (6:00 pm London time) on 7 June 2013.
Powers of DirectorsThe Directors may exercise all powers of BGH subject to applicable legislation and regulation and BGH’s Articles of Association.
Conflicts of InterestIn accordance with the Companies Act 2006, the Directors have adopted a policy and procedure for the disclosure and authorisation (if appropriate) of conflicts of interest, and these have been followed during 2012.
Appointment and Retirement of DirectorsThe appointment and replacement of Directors is governed by BGH’s Articles of Association, the Code, the Companies Act 2006 and related legislation. The Articles may only be amended by a special resolution of the shareholders.
The Board has the power to appoint additional Directors or to fill a casual vacancy amongst the Directors. Under the Articles of Association, any such Director holds office only until the next AGM and may offer himself/herself for re-election. The Articles of Association also require that at each AGM at least one-third of the Directors retire by rotation. The retiring Directors are eligible to stand for re-election. We note that the Corporate Governance Code recommends that all Directors of FTSE 350 companies should be subject to annual re-election. We abide by this recommendation and, as a result, we will all stand for re-election at the AGM.
Directors’ RemunerationDirectors’ fees are determined by the Board from time to time. Directors’ fees (as distinct from any salary, remuneration or other amount payable to a Director pursuant to other provisions of the Articles of Association or otherwise) may not exceed £750,000 per annum in aggregate or such higher amounts as may from time to time be determined by ordinary resolution of BGH. The fees paid to the Directors pursuant to their letters of appointment are shown on page 87 of this Annual Report.
Bank of Georgia Holdings PLC Annual Report 2012 93
OverviewPerform
anceGovernance
Financial Statements
Additional Information
Directors’ InterestsThe Directors’ beneficial interests in ordinary shares of BGH as at 31 December 2012 are shown on page 87 of this Annual Report.
IndemnitySubject to applicable legislation, every current and former Director or other officer of BGH (other than any person engaged by the company as auditor) shall be indemnified by BGH against any liability in relation to BGH, other than (broadly) any liability to BGH or a member of the Group, or any criminal or regulatory fine.
Related Party TransactionsDetails of related party transactions are set out in Note 30 to the Consolidated Financial Statements on page 174 of this Annual Report.
Significant Contracts and AgreementsAt no time during the year did any Director hold a material interest in any contracts of significance with BGH or any subsidiary of the Group. BGH is not party to any significant agreements that would take effect, alter or terminate following a change of control of BGH.
Political donationsThe Group did not make any political donations or expenditures during 2012.
Major Interests in Shares The following table lists shareholders with voting rights of more than 3% as of 31 December 2012 and 31 March 2013. The 31 March 2013 information has been derived from source available to BGH, primarily through regulatory filings.
The respective regulatory filings by shareholders are available on the BGH website: http://bogh.co.uk/en/announcements/bank-of-georgia-holdings-plc/press-releases and the London Stock Exchange website: http://www.londonstockexchange.com/news/news/finance.htm
Community InvestmentWe are committed to building a sustainable business and a more sustainable society, and recognise our responsibility to invest in the communities in which we operate. We made a total investment of GEL 1.4 million in charities, sponsorships, community organisations and causes across our footprint during the year.
Creditor payment policyThe Group is committed to maintaining good commercial relationships with its suppliers. The Bank is responsible for agreeing, and then bringing attention to, terms and conditions with its suppliers. The Group’s policy is to pay creditors in accordance with agreed terms and conditions, provided the supplier has complied with them. BGH is a holding company and does not trade. Therefore, it is not considered meaningful to give a number of days’ purchases outstanding for BGH as at 31 December 2012.
Code of Conduct and EthicsThe Board has adopted a Code of Conduct and Ethics relating to the lawful and ethical conduct of the business, supported by the Group’s core values. The Code of Conduct has been communicated to all Directors and employees, all of whom are expected to observe high standards of integrity and fair dealing in relation to customers, staff and regulators in the communities in which the Group operates. Our Code of Conduct is available on our website http://www.bogh.co.uk/en/corporate-governance
Environmental and Social Responsibility PolicyThe Board has adopted an Environmental and Social Responsibility Policy, which aims to ensure that high standards of responsible business are maintained and that an effective control framework is in place. This policy focuses on our operational impact, sustainable finance and communication. Our Environmental and Social Responsibility Policy is available on our website http:www.bogh.co.uk/en/corporate-governance-framework/policies
Governance: Directors’ Report continued
As of 31 March 2013 As of 31 December 2012
ShareholderNo of Voting
Rights% of Voting
RightsNo of Voting
Rights% of Voting
Rights
Firebird Group of Funds 2,762,921 7.69% 2,852,921 7.94%Royal Bank of Canada 2,018,159 5.62% 2,414,414 6.72%East Capital Group of Funds 1,997,661 5.56% 6,328,417 17.62%European Bank for Reconstruction and Development 1,817,503 5.06% 1,817,503 5.06%International Finance Corporation 1,817,503 5.06% 1,817,503 5.06%Templeton Asset Management Ltd. 1,804,440 5.02% 1,808,940 5.04%Wellington Management Company 1,748,609 4.87% – –Prosperity Capital Management 1,078,817 3.00%Others 21,942,587 61.11% 17,790,868 49.56%Total 35,909,383 100.00% 35,909,383 100.00%
94 Bank of Georgia Holdings PLC Annual Report 2012

Annual General MeetingOur AGM will be held at 10:00 am (London time) on Thursday, 23 May 2013 at Freshfields Bruckhaus Deringer LLP, 65 Fleet Street, London EC4Y 1HS. Details of the business to be conducted at the AGM are contained in the Notice of AGM.
Going ConcernThe Group’s business, together with the factors likely to affect its future development, performance and position are described in the Business review – Overview of financial results, segment discussions, principal risks and uncertainties of this Annual Report (on pages 28 to 55).
The financial position of the Group, its cash flows, liquidity position and borrowing facilities are described in the Risk Management on pages 56 to 65. In addition Note 27 to the Consolidated Financial Statements includes details of the Group’s financial instruments and its risk profile.
A description of the Group’s risks and risk management are also outlined in the Risks and Uncertainties and Risk Management sections on pages 46 to 65.
The Group has considerable financial resources to meet its financial needs. The Directors believe that the Group is well positioned to manage its risks successfully in the current uncertain economic environment.
After making enquiries, the Directors have a reasonable expectation that BGH and the Group have adequate resources to continue in operational existence for the foreseeable future. Accordingly, they continue to adopt the going concern basis in preparing the accompanying Consolidated Financial Statements.
Statement of Directors’ Responsibilities We are responsible for preparing the Annual Report and the accompanying Consolidated Financial Statements in accordance with applicable law and regulations. Company law requires us to prepare financial statements for each financial year. Under the law, we have elected to prepare the accompanying Consolidated Financial Statements in accordance with International Financial Reporting Standards (IFRS) as adopted by the European Union and applicable law.
Under company law, we must not approve the accompanying Consolidated Financial Statements unless we are satisfied that they give a true and fair view of the state of affairs of the Group and BGH and of the profit or loss of the Group and BGH for that period.
In preparing the accompanying Consolidated Financial Statements, we are required to:
a) select suitable accounting policies and then apply them consistently;
b) make judgements and estimates that are reasonable and prudent;
c) state whether they have been prepared in accordance with IFRS as adopted by the European Union, subject to any material departures disclosed and explained in the financial statements; and
d) prepare the financial statements on the going concern basis unless it is inappropriate to presume that the Company will continue in business.
We are also responsible for keeping adequate accounting records that are sufficient to show and explain BGH’s and the Group’s transactions, to disclose with reasonable accuracy at any time the financial position of BGH and the Group and to enable us to ensure that the financial statements and the Directors’ Remuneration Report comply with the Companies Act 2006 and, as regards the Group financial statements, Article 4 of the IAS Regulation.
We have further responsibility for safeguarding the assets of BGH and the Group and for taking reasonable steps for the prevention and detection of fraud and other irregularities.
We are also responsible for the maintenance and integrity of BGH’s website. Legislation in the United Kingdom governing the preparation and dissemination of financial statements may differ from legislation in other jurisdictions.
Directors’ Responsibility StatementEach of the us listed in the Board of Directors section of this Annual Report confirms that to the best of his/her knowledge:
(a) the accompanying Consolidated Financial Statements, prepared in accordance with International Financial Reporting Standards as adopted by the European Union, give a true and fair view of the assets, liabilities, financial position and profit or loss of BGH and the Group as a whole; and
(b) the Directors’ Report includes a fair review of the development and performance of the business and the position of BGH and Group as a whole, together with a description of the principal risks and uncertainties that they face.
In accordance with section 418(2) of the Companies Act 2006, each of us that held office at the date of the approval of this Directors’ Report confirms that, so far as he/she is aware, there is no relevant audit information of which BGH’s auditors are unaware and each of us has taken all reasonable steps to ascertain any relevant audit information and ensure that the Group statutory auditors are aware of such information.
Statement of ComplianceAs BGH is listed on the London Stock Exchange, we comply with the UK Corporate Governance Code, save for Section D.1.1, which is described in greater detail in the Directors’ Remuneration Report of this Annual Report.
By order of the Board
Kate Bennett Rea, on behalf of KB Rea Ltd.Company Secretary10 April 2013
Bank of Georgia Holdings PLC Annual Report 2012 95
OverviewPerform
anceGovernance
Financial Statements
Additional Information

96 Bank of Georgia Holdings PLC Annual Report 2012
Contents
Independent Auditors’ Report:To the members of Bank of Georgia Holdings PLC 97
Financial Statements:Standalone statement of financial position 98
Consolidated statement of financial position 99
Consolidated income statement 100
Consolidated statement of comprehensive income 102
Consolidated statement of changes in equity 103
Consolidated statement of cash flows 104
Notes to consolidated financial statements
1. Principal Activities 106
2. Basis of Preparation 107
3. Summary of Significant Accounting Policies 111
4. Significant Accounting Judgements and Estimates 125
5. Business Combinations 126
6. Segment Information 127
7. Cash and Cash Equivalents 134
8. Amounts Due from Credit Institutions 134
9. Investment Securities Available-for-Sale 134
10. Loans to Customers 135
11. Finance Lease Receivables 138
12. Investment Properties 138
13. Property and Equipment 139
14. Goodwill 142
15. Taxation 144
16. Other Assets and Other Liabilities 148
17. Amounts Due to Customers 149
18. Amounts Due to Credit Institutions 150
19. Commitments and Contingencies 151
20. Equity 152
21. Net Fee and Commission Income 154
22. Net Insurance Revenue 155
23. Net Healthcare Revenue 155
24. Salaries and Other Employee Benefits, and General and Administrative Expenses 156
25. Net Non-operating Expenses 157
26. Share-based Payments 158
27. Risk Management 159
28. Fair Values of Financial Instruments 169
29. Maturity Analysis of Financial Assets and Liabilities 172
30. Related Party Disclosures 174
31. Capital Adequacy 176
Additional Information:Abbreviations 177
Glossary 178
Shareholder information 180

Bank of Georgia Holdings PLC Annual Report 2012 97
OverviewPerform
anceGovernance
Financial Statements
Additional Information
– the parent company financial statements have been properly prepared in accordance with IFRSs as adopted by the European Union and as applied in accordance with the provisions of the Companies Act 2006; and
– the financial statements have been prepared in accordance with the requirements of the Companies Act 2006 and, as regards the group financial statements, Article 4 of the IAS Regulation.
Opinion on other matters prescribed by the Companies Act 2006In our opinion:
– the part of the Directors’ Remuneration Report to be audited has been properly prepared in accordance with the Companies Act 2006; and
– the information given in the Directors’ Report for the financial year for which the financial statements are prepared is consistent with the financial statements.
Matters on which we are required to report by exceptionWe have nothing to report in respect of the following:
Under the Companies Act 2006 we are required to report to you if, in our opinion:
– adequate accounting records have not been kept by the parent company, or returns adequate for our audit have not been received from branches not visited by us; or
– the parent company financial statements and the part of the Directors’ Remuneration Report to be audited are not in agreement with the accounting records and returns; or
– certain disclosures of directors’ remuneration specified by law are not made; or
– we have not received all the information and explanations we require for our audit.
Under the Listing Rules we are required to review:
– the directors’ statement, set out on page 95, in relation to going concern;
– the part of the Corporate Governance Statement relating to the company’s compliance with the nine provisions of the UK Corporate Governance Code specified for our review; and
– certain elements of the report to shareholders by the Board on directors’ remuneration.
Andrew McIntyre Senior statutory auditor For and on behalf of Ernst & Young LLP, Statutory Auditor London
10 April 2013Notes:1. The maintenance and integrity of the Bank of Georgia Holdings PLC
website is the responsibility of the directors; the work carried out by the auditors does not involve consideration of these matters and, accordingly, the auditors accept no responsibility for any changes that may have occurred to the financial statements since they were initially presented on the website.
2. Legislation in the United Kingdom governing the preparation and dissemination of financial statements may differ from legislation in other jurisdictions.
Independent Auditor’s Report: To the members of Bank of Georgia Holdings PLC
We have audited the financial statements of Bank of Georgia Holdings PLC for the year ended 31 December 2012 which comprise the Standalone statement of financial position, Consolidated statement of financial position, Consolidated income statement, Consolidated statement of comprehensive income, Consolidated statement of changes in equity, Consolidated statement of cash flows and the related notes 1 to 31. The financial reporting framework that has been applied in their preparation is applicable law and International Financial Reporting Standards (IFRSs) as adopted by the European Union and, as regards the parent company financial statements, as applied in accordance with the provisions of the Companies Act 2006.
This report is made solely to the company’s members, as a body, in accordance with Chapter 3 of Part 16 of the Companies Act 2006. Our audit work has been undertaken so that we might state to the company’s members those matters we are required to state to them in an auditor’s report and for no other purpose. To the fullest extent permitted by law, we do not accept or assume responsibility to anyone other than the company and the company’s members as a body, for our audit work, for this report, or for the opinions we have formed.
Respective responsibilities of directors and auditorAs explained more fully in the Directors’ Responsibilities Statement set out on page 95, the directors are responsible for the preparation of the financial statements and for being satisfied that they give a true and fair view. Our responsibility is to audit and express an opinion on the financial statements in accordance with applicable law and International Standards on Auditing (UK and Ireland). Those standards require us to comply with the Auditing Practices Board’s Ethical Standards for Auditors.
Scope of the audit of the financial statementsAn audit involves obtaining evidence about the amounts and disclosures in the financial statements sufficient to give reasonable assurance that the financial statements are free from material misstatement, whether caused by fraud or error. This includes an assessment of: whether the accounting policies are appropriate to the group’s and the parent company’s circumstances and have been consistently applied and adequately disclosed; the reasonableness of significant accounting estimates made by the directors; and the overall presentation of the financial statements. In addition, we read all the financial and non-financial information in the annual report to identify material inconsistencies with the audited financial statements. If we become aware of any apparent material misstatements or inconsistencies we consider the implications for our report.
Opinion on financial statementsIn our opinion:
– the financial statements give a true and fair view of the state of the Group’s and of the parent company’s affairs as at 31 December 2012 and of the Group’s profit for the year then ended;
– the Group financial statements have been properly prepared in accordance with IFRSs as adopted by the European Union;

98 Bank of Georgia Holdings PLC Annual Report 2012
Financial Statements: Standalone statement of financial position
As at 31 December 2012
(Thousands of Georgian Lari)
Notes 2012
AssetsCash and cash equivalents 12,309Investments in subsidiaries 2 799,389Other assets 38
Total assets 811,736
LiabilitiesOther liabilities 14,019
Total liabilities 14,019
EquityShare capital 957Other reserves 416Retained earnings 796,344
Total equity 797,717
Total liabilities and equity 811,736
Signed and authorised for release on behalf of the Board of Directors:
Irakli GilauriChief Executive Officer 10 April 2013
Company registered number: 7811410
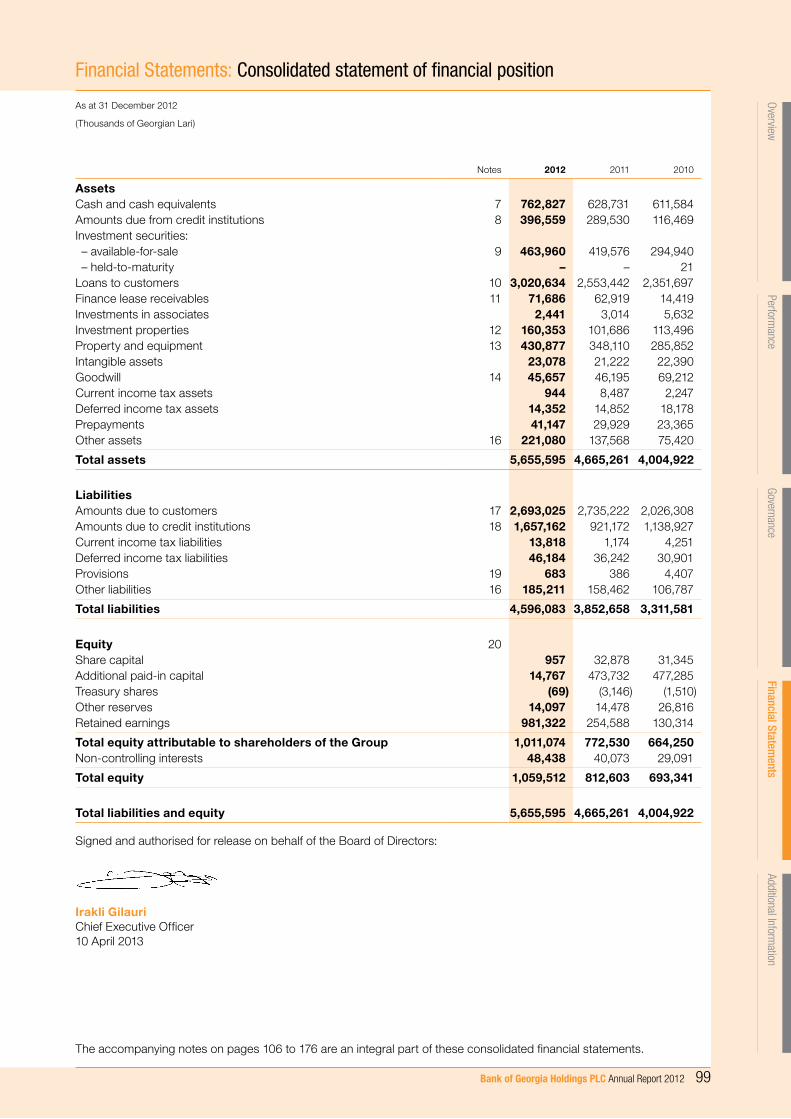
OverviewPerform
anceGovernance
Financial Statements
Additional Information
Bank of Georgia Holdings PLC Annual Report 2012 99
Financial Statements: Consolidated statement of financial position
As at 31 December 2012
(Thousands of Georgian Lari)
Notes 2012 2011 2010
AssetsCash and cash equivalents 7 762,827 628,731 611,584Amounts due from credit institutions 8 396,559 289,530 116,469Investment securities: – available-for-sale 9 463,960 419,576 294,940 – held-to-maturity – – 21Loans to customers 10 3,020,634 2,553,442 2,351,697Finance lease receivables 11 71,686 62,919 14,419Investments in associates 2,441 3,014 5,632Investment properties 12 160,353 101,686 113,496Property and equipment 13 430,877 348,110 285,852Intangible assets 23,078 21,222 22,390Goodwill 14 45,657 46,195 69,212Current income tax assets 944 8,487 2,247Deferred income tax assets 14,352 14,852 18,178Prepayments 41,147 29,929 23,365Other assets 16 221,080 137,568 75,420
Total assets 5,655,595 4,665,261 4,004,922
LiabilitiesAmounts due to customers 17 2,693,025 2,735,222 2,026,308Amounts due to credit institutions 18 1,657,162 921,172 1,138,927Current income tax liabilities 13,818 1,174 4,251Deferred income tax liabilities 46,184 36,242 30,901Provisions 19 683 386 4,407Other liabilities 16 185,211 158,462 106,787
Total liabilities 4,596,083 3,852,658 3,311,581
Equity 20Share capital 957 32,878 31,345Additional paid-in capital 14,767 473,732 477,285Treasury shares (69) (3,146) (1,510)Other reserves 14,097 14,478 26,816Retained earnings 981,322 254,588 130,314
Total equity attributable to shareholders of the Group 1,011,074 772,530 664,250Non-controlling interests 48,438 40,073 29,091
Total equity 1,059,512 812,603 693,341
Total liabilities and equity 5,655,595 4,665,261 4,004,922
Signed and authorised for release on behalf of the Board of Directors:
Irakli GilauriChief Executive Officer 10 April 2013
The accompanying notes on pages 106 to 176 are an integral part of these consolidated financial statements.

100 Bank of Georgia Holdings PLC Annual Report 2012
Financial Statements: Consolidated income statement
For the year ended 31 December 2012
(Thousands of Georgian Lari)
Notes 2012 2011 2010
Interest income Loans to customers 509,339 438,989 389,402 Investment securities – available-for-sale 33,950 37,701 7,287 Amounts due from credit institutions 15,813 18,103 9,795 Finance lease receivables 8,701 6,565 4,159 Investment securities – held-to-maturity – – 12,498
567,803 501,358 423,141
Interest expense Amounts due to customers (202,484) (167,294) (114,968) Amounts due to credit institutions (79,492) (99,763) (91,829)
(281,976) (267,057) (206,797)
Net interest income before net (losses) gains from interest rate swaps 285,827 234,301 216,344
Net (losses) gains from interest rate swaps (1,710) 4,984 (7,826)
Net interest income 284,117 239,285 208,518
Fee and commission income 109,278 93,541 74,265Fee and commission expense (22,791) (18,204) (10,845)
Net fee and commission income 21 86,487 75,337 63,420
Net insurance premiums earned 91,176 46,396 44,561Net insurance claims incurred (57,038) (28,658) (27,898)
Net insurance revenue 22 34,138 17,738 16,663
Healthcare revenue 54,376 5,700 2,208Cost of healthcare services (31,030) (3,242) (1,632)
Net healthcare revenue 23 23,346 2,458 576
Revenue from sale of goods 41,533 22,470 18,144Cost of sales (30,868) (12,109) (9,050)
Net revenue from sale of goods 10,665 10,361 9,094
Net gains from trading securities and investment securities available-for-sale 2,308 1,382 2,006Net gains from revaluation of investment properties 12 – 1,984 350Net gains from foreign currencies: – dealing 33,389 45,694 33,651 – translation differences 16,182 30,747 98Other operating income 7,623 8,767 10,625
Other operating non-interest income 59,502 88,574 46,730
Revenue 498,255 433,753 345,001
The accompanying notes on pages 106 to 176 are an integral part of these consolidated financial statements.
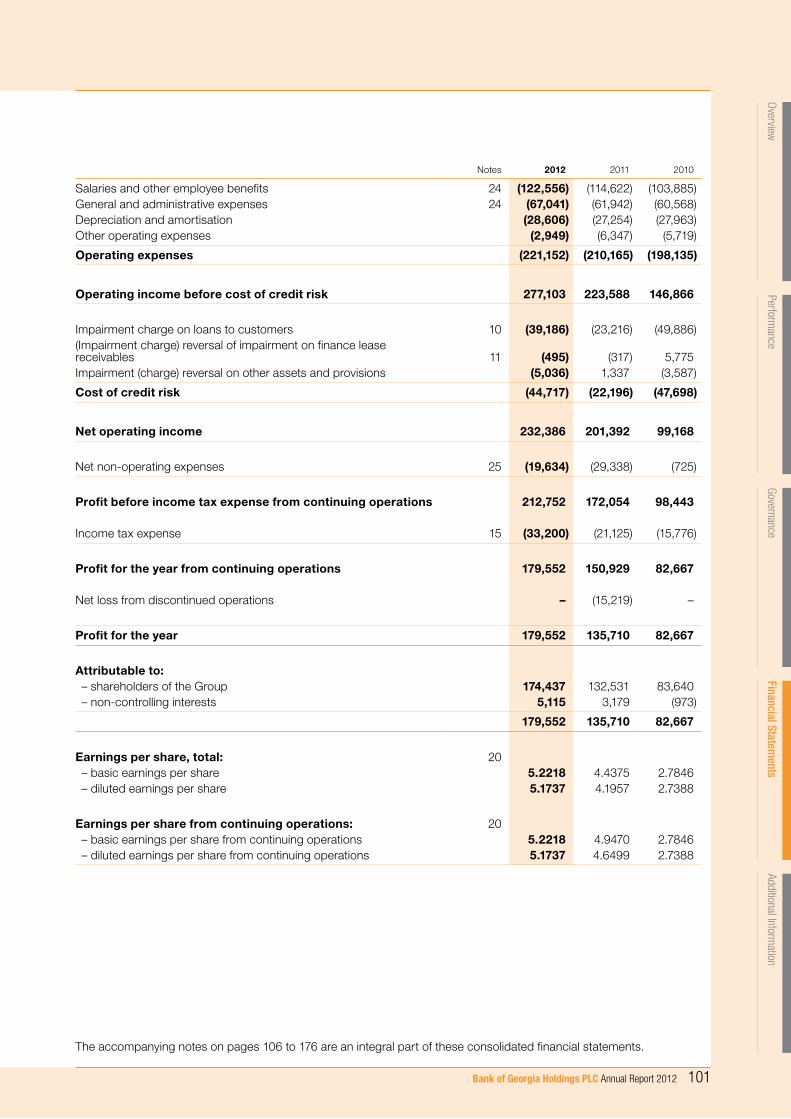
OverviewPerform
anceGovernance
Financial Statements
Additional Information
Bank of Georgia Holdings PLC Annual Report 2012 101
Notes 2012 2011 2010
Salaries and other employee benefits 24 (122,556) (114,622) (103,885)General and administrative expenses 24 (67,041) (61,942) (60,568)Depreciation and amortisation (28,606) (27,254) (27,963)Other operating expenses (2,949) (6,347) (5,719)
Operating expenses (221,152) (210,165) (198,135)
Operating income before cost of credit risk 277,103 223,588 146,866
Impairment charge on loans to customers 10 (39,186) (23,216) (49,886)(Impairment charge) reversal of impairment on finance lease receivables 11 (495) (317) 5,775Impairment (charge) reversal on other assets and provisions (5,036) 1,337 (3,587)
Cost of credit risk (44,717) (22,196) (47,698)
Net operating income 232,386 201,392 99,168
Net non-operating expenses 25 (19,634) (29,338) (725)
Profit before income tax expense from continuing operations 212,752 172,054 98,443
Income tax expense 15 (33,200) (21,125) (15,776)
Profit for the year from continuing operations 179,552 150,929 82,667
Net loss from discontinued operations – (15,219) –
Profit for the year 179,552 135,710 82,667
Attributable to: – shareholders of the Group 174,437 132,531 83,640 – non-controlling interests 5,115 3,179 (973)
179,552 135,710 82,667
Earnings per share, total: 20 – basic earnings per share 5.2218 4.4375 2.7846 – diluted earnings per share 5.1737 4.1957 2.7388
Earnings per share from continuing operations: 20 – basic earnings per share from continuing operations 5.2218 4.9470 2.7846 – diluted earnings per share from continuing operations 5.1737 4.6499 2.7388
The accompanying notes on pages 106 to 176 are an integral part of these consolidated financial statements.

102 Bank of Georgia Holdings PLC Annual Report 2012
Financial Statements: Consolidated statement of comprehensive income
For the year ended 31 December 2012
(Thousands of Georgian Lari)
Notes 2012 2011 2010
Profit for the year from continuing operations 179,552 150,929 82,667
Net loss from discontinued operations – (15,219) –
Profit for the year 179,552 135,710 82,667
Other comprehensive (loss) income from continuing operations – Revaluation of property and equipment 13 – 1,285 (2,859) – Revaluation of available-for-sale securities 960 3,511 6,077 – Realised gain on available-for-sale securities reclassified to the
consolidated income statement (2,075) (1,721) (789) – Gain (loss) from currency translation differences 172 (52,493) 5,116Income tax relating to components of other comprehensive income 15 690 5,581 206
Other comprehensive (loss) income for the year from continuing operations, net of tax (253) (43,837) 7,751
Other comprehensive gain from discontinued operations – 24,254 –
Other comprehensive (loss) income for the year, net of tax (253) (19,583) 7,751
Total comprehensive income for the year from continuing operations 179,299 107,092 90,418Total comprehensive income for the year from discontinued operations – 9,035 –
Total comprehensive income for the year 179,299 116,127 90,418
Attributable to: – shareholders of the Group 174,304 121,045 89,830 – non-controlling interests 4,995 (4,918) 588
179,299 116,127 90,418
The accompanying notes on pages 106 to 176 are an integral part of these consolidated financial statements.

OverviewPerform
anceGovernance
Financial Statements
Additional Information
Bank of Georgia Holdings PLC Annual Report 2012 103
For the year ended 31 December 2012
(Thousands of Georgian Lari)
Financial Statements: Consolidated statement of changes in equity
Attributable to shareholders of the Group
Sharecapital
Additional paid-incapital
Treasury shares
Other reserves
Retained earnings Total
Non-controlling
interestsTotal
equity
31 December 2009 31,306 478,779 (1,677) 24,387 46,163 578,958 19,459 598,417
Total comprehensive income – – – 7,942 81,888 89,830 588 90,418Depreciation of revaluation reserve, net of tax – – – (2,263) 2,263 – – –Increase in share capital arising from share-based payments (Note 20) 39 8,497 610 – – 9,146 – 9,146Acquisition of additional interests in existing subsidiaries by non-controlling shareholders – – – – – – 11,973 11,973Acquisition of non-controlling interests in existing subsidiaries – – – (3,250) – (3,250) (6,854) (10,104)Non-controlling interests arising on acquisition of subsidiary – – – – – – 3,925 3,925Sale of treasury shares – 7,104 448 – – 7,552 – 7,552Purchase of treasury shares – (17,095) (891) – – (17,986) – (17,986)
31 December 2010 31,345 477,285 (1,510) 26,816 130,314 664,250 29,091 693,341
Total comprehensive income – – – (9,208) 130,253 121,045 (4,918) 116,127Depreciation of revaluation reserve, net of tax – – – (3,190) 3,190 – – –Increase in share capital arising from share-based payments (Note 20) 33 2,716 148 – – 2,897 – 2,897Increase in share capital from issuance of GDRs (Note 20) 1,500 – (1,500) – – – – –Dividends to shareholders of the Group (Note 20) – – – – (9,169) (9,169) – (9,169)Acquisition of additional interests in existing subsidiaries by non-controlling shareholders – – – 60 – 60 2,453 2,513Non-controlling interests arising on acquisition of subsidiary – – – – – – 13,447 13,447Sale of treasury shares – 26,777 1,268 – – 28,045 – 28,045Purchase of treasury shares – (33,046) (1,552) – – (34,598) – (34,598)
31 December 2011 32,878 473,732 (3,146) 14,478 254,588 772,530 40,073 812,603
Total comprehensive income – – – (465) 174,769 174,304 4,995 179,299Depreciation of revaluation reserve, net of tax – – – (622) 622 – – –Increase in share capital arising from share-based payments – 30,213 602 – – 30,815 – 30,815Issue of share capital (Note 20) 3,635 70,313 – – – 73,948 – 73,948Conversion of shares following the Tender Offer (35,570) 23,983 2,507 (497) (4,589) (14,166) 14,166 –Capital reductions – (582,388) – – 582,388 – – –GBP-GEL translation effect 14 2,828 (4) – (2,838) – – –Transactions costs recognised directly in equity – (3,325) – – – (3,325) – (3,325)Dividends to shareholders of the Group (Note 20) – – – – (23,618) (23,618) – (23,618)Dilution of interests in subsidiaries – – – 15 – 15 128 143Acquisition of additional interests in existing subsidiaries by non-controlling shareholders – – – (86) – (86) 749 663Acquisition of non-controlling interests in existing subsidiaries – – – 1,274 – 1,274 (11,673) (10,399)Sale of treasury shares – 89 5 – – 94 – 94Purchase of treasury shares – (678) (33) – – (711) – (711)
31 December 2012 957 14,767 (69) 14,097 981,322 1,011,074 48,438 1,059,512
The accompanying notes on pages 106 to 176 are an integral part of these consolidated financial statements.

104 Bank of Georgia Holdings PLC Annual Report 2012
Financial Statements: Consolidated statement of cash flows
For the year ended 31 December 2012
(Thousands of Georgian Lari)
Notes 2012 2011 2010
Cash flows from operating activitiesInterest received 553,090 494,782 412,407Interest paid (270,691) (244,478) (194,622)Fees and commissions received 109,278 93,541 74,265Fees and commissions paid (22,791) (18,204) (10,845)Insurance premiums received 79,007 46,070 46,159Insurance claims paid (55,197) (26,106) (32,007)Healthcare revenue received 54,376 5,700 2,208Cost of healthcare services paid (31,030) (3,242) (1,632)Revenue received from sale of goods 41,533 22,470 18,144Cost of sales of goods (30,868) (12,109) (9,050)Net realised gains (losses) from trading securities 375 (236) 2,267Net realised gains from investment securities available-for-sale 2,075 1,721 789Net realised gains from foreign currencies 33,389 45,694 33,651Recoveries of loans to customers previously written off 10 29,979 28,849 42,739Other income received (expenses paid) 5,949 15,266 (1,819)Salaries and other employee benefits paid (110,639) (96,011) (93,204)General and administrative and operating expenses paid (68,340) (69,269) (70,906)
Cash flows from operating activities before changes in operating assets and liabilities 319,495 284,438 218,544Net (increase) decrease in operating assets Amounts due from credit institutions (99,925) (179,682) (45,090)Loans to customers (562,345) (239,413) (813,482)Finance lease receivables (9,262) (49,095) 8,252Prepayments and other assets (59,339) (63,668) 100Net increase (decrease) in operating liabilitiesAmounts due to credit institutions 761,167 (213,068) 190,994Amounts due to customers (52,871) 708,242 731,184Other liabilities (28,243) (32,707) 21,981
Net cash flows from operating activities before income tax 268,677 215,047 312,483Income tax paid (3,282) (7,000) (3,144)
Net cash flows from operating activities 265,395 208,047 309,339
Cash flows (used in) from investing activitiesAcquisition of subsidiaries, net of cash acquired 5 (9,008) 408 (139)Proceeds from sale of subsidiary – 8,747 –Proceeds from sale of investment securities: available-for-sale 221,973 20,625 1,518Purchase of investment securities (265,320) (138,529) (28,769)Proceeds from sale of investments in associates 170 332 –Proceeds from sale of investment properties 12 15,622 7,889 5,490Proceeds from sale of property and equipment and intangible assets – – 13,312 Purchase of property and equipment and intangible assets (60,443) (76,239) (41,839)
Net cash flows used in investing activities (97,443) (176,767) (50,427)
The accompanying notes on pages 106 to 176 are an integral part of these consolidated financial statements.

OverviewPerform
anceGovernance
Financial Statements
Additional Information
Bank of Georgia Holdings PLC Annual Report 2012 105
Notes 2012 2011 2010
Cash flows (used in) from financing activities Dividends paid (23,618) (9,169) –Purchase of treasury shares (711) (34,598) (17,986)Sale of treasury shares 94 28,044 7,552Proceeds from sale of non-controlling interest in existing subsidiary 663 2,453 –Purchase of additional interests by non-controlling shareholders – – 11,973Purchase of additional interests in existing subsidiaries, net of cash acquired (10,399) – (6,854)
Net cash used in financing activities (33,971) (13,270) (5,315)
Effect of exchange rates changes on cash and cash equivalents 115 (863) 98
Net increase in cash and cash equivalents 134,096 17,147 253,695
Cash and cash equivalents, beginning 7 628,731 611,584 357,889
Cash and cash equivalents, ending 7 762,827 628,731 611,584
The accompanying notes on pages 106 to 176 are an integral part of these consolidated financial statements.

106 Bank of Georgia Holdings PLC Annual Report 2012
(Thousands of Georgian Lari)
1. Principal ActivitiesJSC Bank of Georgia (the “Bank”) was established on 21 October 1994 as a joint stock company (“JSC”) under the laws of Georgia. The Bank operates under a general banking license issued by the National Bank of Georgia (“NBG”; the Central Bank of Georgia) on 15 December 1994.
The Bank accepts deposits from the public and extends credit, transfers payments in Georgia and internationally and exchanges currencies. Its main office is in Tbilisi, Georgia. At 31 December 2012 the Bank has 194 operating outlets in all major cities of Georgia (31 December 2011: 158, 31 December 2010: 142). The Bank’s registered legal address is 29a Gagarini Street, Tbilisi 0160, Georgia.
The Bank is the parent of a group of companies incorporated in Georgia and Belarus. Primary business activities include providing banking, leasing, insurance, healthcare, brokerage and wealth management services, to corporate and individual customers.
In December 2011, Bank of Georgia Holdings PLC (“BGH”), a public limited liability company newly incorporated in England and Wales, launched the Tender Offer (the “Tender Offer”) to exchange its entire ordinary share capital for an equivalent number of the Bank’s ordinary shares and thus to acquire the entire issued and to be issued share capital, including those shares represented by Global Depositary Receipts (“GDRs”), of the Bank. Following the successful completion of the Tender Offer on 28 February 2012 and subsequent acquisitions of the Bank’s remaining shares held by non-controlling shareholders by the Bank, BGH holds 99.62% of the share capital of the Bank as at 31 December 2012, representing the Bank’s ultimate parent company. Together with the Bank’s subsidiaries, BGH makes up a group of companies (the “Group”). The list of the companies included in the Group is provided in Note 2. The shares of BGH (“BGH Shares”) were admitted to the premium listing segment of the Official List of the UK Listing Authority and admitted to trading on the London Stock Exchange PLC’s Main Market for listed securities effective 28 February 2012 (the “Admission”, Note 20). The Bank is the Group’s main operating unit and accounts for most of the Group’s activities.
Bank of Georgia Holdings PLC’s registered legal address is 84 Brook Street, London, United Kingdom W1K 5EH. Registered number of BGH is 7811410.
The treasury shares kept by the Bank for the purposes of its future employee share-based compensation, as of the Tender Offer expiration date have been fully converted into the BGH newly issued shares.
As at 31 December 2012, 31 December 2011 and 31 December 2010, the following shareholders owned more than 4% of the total outstanding shares of the Group. Other shareholders individually owned less than 4% of the outstanding shares.
Shareholder31 December
2012 31 December
2011 31 December
2010
East Capital Financial Institutions 17.62%* 4.16% 4.36%Firebird Management LLC 7.94% – –Royal Bank of Canada 6.72% – –Euopean Bank for Reconstruction and Development 5.06% – –International Finance Corporation 5.06% – –Franklin Templeton Investment 5.04% – –Bank of New York (Nominees), Limited*** – 91.45% 90.50%Others 52.56% 4.39% 5.14%
Total** 100.00% 100.00% 100.00%
* Includes shares held by East Capital Private Equity AB and East Capital Asset Management AB.
** For the purposes of calculating percentage of shareholding, the denominator includes total number of issued shares, which includes shares held in the trust for the share-based compensation purposes of the Bank.
*** In 2010 and 2011 all GDR holders’ interests were held through Bank of New York (Nominees), Limited (the custodian).
Financial Statements: Notes to consolidated financial statements

OverviewPerform
anceGovernance
Financial Statements
Additional Information
Bank of Georgia Holdings PLC Annual Report 2012 107
As at 31 December 2012, the members of the Supervisory Board and Management Board owned 540,987 shares (or 1.51%; 2011: 474,246 shares and GDRs or 1.44%, 2010: 448,232 shares and GDRs or 1.43%) of the Group. Interests of the members of the Supervisory Board and Management Board were as follows:
Shareholder31 December 2012,
shares held31 December 2011,
shares and GDRs held31 December 2010,
shares and GDRs held
Irakli Gilauri 206,431 194,379 200,379Avto Namicheishvili 84,488 39,823 34,823Allan Hirst 60,434 60,434 56,311Sulkhan Gvalia 54,304 58,638 60,638Mikheil Gomarteli 38,867 10,634 10,634David Morrison 26,357 20,357 15,351Kaha Kiknavelidze 26,337 26,337 22,509Neil Janin 25,729 15,729 3,945Al Breach 10,279 10,279 6,527Ian Hague 5,112 5,112 1,578Hanna Loikkanen 2,616 2,616 –Nikoloz Gamkrelidze* 33 – –Archil Gachechiladze – 10,000 3,700Irakli Burdiladze – – 17,504Giorgi Chiladze** – 14,000 14,333Vasil Revishvili*** – 5,908 –
Total 540,987 474,246 448,232
* Joined the Management Board upon his appointment as Deputy CEO, Finance in October 2012.
** Resigned from the Management Board of the Bank on 26 March 2012.
*** In February 2013, the Bank announced that service contract of Vasil Revishvili will not be extended after its expiration on 1 May 2013.
As a result of the conversion of the Bank’s shares into BGH shares in February 2012 and following the cancellation of GDR Programme in June 2012, the Group has no GDRs outstanding as at 31 December 2012.
2. Basis of PreparationGeneralThese financial statements have been drawn up from the date of incorporation of BGH (14 October 2011) to 31 December 2012. In accordance with the exemption permitted under section 408 of the Companies Act 2006, the standalone income statement of BGH is not presented as part of these accounts. These consolidated financial statements are prepared as if the Group is a continuation of the pre-existing group of companies with the Bank as its ultimate parent. Comparative financial statements as at and for the years ended 31 December 2011 and 31 December 2010 are that of the group of companies consolidated with the Bank as its ultimate parent. Standalone profit of BGH for the year ended 31 December 2012 was GEL 22,476.
These consolidated financial statements have been prepared in accordance with International Financial Reporting Standards (“IFRS”) as adopted by the European Union (“EU”) and International Financial Reporting Interpretations Committee (“IFRIC”) interpretations issued by the International Accounting Standards Board (“IASB”) effective for 2012 reporting and with those parts of the Companies Act 2006 applicable to companies reporting under IFRS.
The Bank and its Georgian-based subsidiaries are required to maintain their records and prepare their financial statements for regulatory purposes in Georgian Lari, while BGH and the Bank’s subsidiaries established outside of Georgia are in their respective local currencies. These consolidated financial statements are prepared under the historical cost convention except for the measurement at fair value of financial assets and liabilities held for trading, available-for-sale securities, investment properties and revalued property and equipment. No interest income or expense arose in relation to financial assets or liabilities at fair value through profit or loss.
These consolidated financial statements are presented in thousands of Georgian Lari (“GEL”), except per-share amounts and unless otherwise indicated.
Going concernThe BGH’s Board of Directors has made an assessment of the Group’s ability to continue as a going concern and is satisfied that it has the resources to continue in business for the foreseeable future. Furthermore, management is not aware of any material uncertainties that may cast significant doubt upon the Group’s ability to continue as a going concern. Therefore, the financial statements continue to be prepared on the going concern basis.

108 Bank of Georgia Holdings PLC Annual Report 2012
(Thousands of Georgian Lari)
2. Basis of Preparation (continued)Subsidiaries and associatesBGH has invested GEL 799,389 in the Bank, and holds a 99.62% stake in the Bank as at 31 December 2012. The consolidated financial statements as at 31 December 2012, 31 December 2011 and 31 December 2010 include the following subsidiaries and associates:
Proportion of voting rights and ordinary share capital held
Subsidiaries 31 December
201231 December
201131 December
2010Country of
incorporation IndustryDate of
incorporationDate of
acquisition
JSC Bank of Georgia(g) 99.62% – – Georgia Banking 21/10/1994 –
Georgia Investments, LLC 100.0% – – Georgia Various 17/02/2012 –
PJSC Bank Pershyi (formerly known as JSC BG Bank)(h)
19.4% 19.4% 99.4% Ukraine Banking 26/01/1994 01/10/2007
Valimed, Unitarnoe Predpreyatie (originally LLC)
– (a) 100.0% Belarus Investment 14/09/2000 03/06/2008
JSC BG Capital (Georgia) (formerly known as JSC Galt and Taggart Securities)
100.0% 100.0% 100.0% Georgia Brokerage and asset management
19/12/1995 28/12/2004
Benderlock Investments Limited
100.0% 100.0% 100.0% Cyprus Investments 12/05/2009 13/10/2009
BG Tax Advisory, LLC (b) 100.0% 100.0% Georgia Tax consulting
25/09/2007 –
BG Commodities (Georgia), LLC
– (c) 100.0% Georgia Commodity Trading
16/04/2009 –
BG Commodities (Ukraine), LLC
(d) 100.0% 100.0% Ukraine Commodity Trading
24/11/2009 –
Galt and Taggart Holdings Limited
100.0% 100.0% 100.0% Cyprus Investment 03/07/2006 –
BG Trading Limited 100.0% 100.0% 100.0% Cyprus Investment 26/03/2007 –
BG Capital (Ukraine), LLC
(d) 100.0% 100.0% Ukraine Brokerage 23/10/2006 –
BG Capital (Belarus), LLC
100.0% 100.0% 100.0% Belarus Brokerage 19/02/2008 –
Brooksby Investments Limited
100.0% 100.0% 100.0% Cyprus Investments 04/03/2008 18/06/2008
JSC Belarusky Narodny Bank
79.99% 79.99% 79.99% Belarus Banking 16/04/1992 03/06/2008
BNB Leasing, LLC 99.9% 99.9% 99.9% Belarus Leasing 30/03/2006 03/06/2008
JSC Insurance Company Aldagi BCI
100.0% 100.0% 100.0% Georgia Insurance 22/06/2007 –
Biznes Centri Kazbegze, LLC
100.0% 100.0% – Georgia Various 22/06/2010 01/10/2011
JSC My Family Clinic 51.0% 51.0% 100.0% Georgia Healthcare 03/10/2005 –
JSC Kutaisi St. Nicholas Surgical and Oncological Hospital (Formerly known as JSC Kutaisi St. Nicholas Surgery Hospital )
71.87% 55.0% 55.0% Georgia Medical services
03/11/2000 20/05/2008
Kutaisi Regional Clinical Hospital, LLC
100.0% 100.0% 100.0% Georgia Medical services
19/07/2010 01/10/2010
JSC Zugdidi multi profile Clinical Hospital “Republic”
100.0% 100.0% – Georgia Medical services
11/06/1998 29/11/2011
Financial Statements: Notes to consolidated financial statements continued

OverviewPerform
anceGovernance
Financial Statements
Additional Information
Bank of Georgia Holdings PLC Annual Report 2012 109
Proportion of voting rights and ordinary share capital held
Subsidiaries 31 December
201231 December
201131 December
2010Country of
incorporation IndustryDate of
incorporationDate of
acquisition
JSC Kutaisi County Treatment and Diagnostic Center for Mothers and Children
66.7% 66.7% – Georgia Medical services
05/05/2003 29/11/2011
JSC Chkhorotskhu Regional Central Hospital
100.0% 100.0% – Georgia Medical services
30/11/1999 29/11/2011
Academician Z. Tskhakaia National Center of Intervention Medicine of Western Georgia, LLC
66.7% 66.7% – Georgia Medical services
15/10/2004 09/12/2011
E.K. Pipia Central Hospital of Tsalenjikha, LLC
100.0% 100.0% – Georgia Medical services
01/09/1999 09/12/2011
Martvili Multi profile Hospital, LLC
100.0% 100.0% – Georgia Medical services
17/03/2000 09/12/2011
Abasha Outpatient-Polyclinic Union, LLC
100.0% 100.0% – Georgia Medical services
16/03/2000 09/12/2011
Tskaltubo Regional Hospital, LLC
66.7% 66.7% – Georgia Medical services
29/09/1999 09/12/2011
Khobi Central Regional Hospital, LLC
100.0% 100.0% – Georgia Medical services
13/07/2000 09/12/2011
Imedi L Dent, LLC 100.0% – – Georgia Medicine 17/01/2005 01/05/2012
Aliance, LLC 100.0% – – Georgia Various 01/03/2000 01/05/2012
Green Way, LLC 100.0% – – Georgia Various 09/08/2008 01/05/2012
Centromed, LLC 100.0% – – Georgia Medicine 09/07/2010 01/05/2012
Unimed Achara, LLC 100.0% – – Georgia Medicine 29/06/2010 01/05/2012
Unimedi Samtskhe, LLC 100.0% – – Georgia Medicine 29/06/2010 01/05/2012
Unimedi Kakheti, LLC 100.0% – – Georgia Medicine 29/06/2010 01/05/2012
Georgian Leasing Company, LLC
100.0% 100.0% 100.0% Georgia Leasing 29/10/2001 31/12/2004
JSC GC Holdings (formerly LLC)
100.0% 100.0% 100.0% Georgia Investment 29/10/2007 –
JSC Georgian Card 56.2% 71.78% 71.78% Georgia Card processing
17/01/1997 20/10/2004
Direct Debit Georgia, LLC
100.0% 100.0% 100.0% Georgia Electronic payment services
07/03/2006 –
MetroNet, LLC 100.0% 100.0% 100.0% Georgia Commu-nicationservices
23/04/2007 –
JSC Liberty Consumer 67.49% 67.08% 65.3% Georgia Investment 24/05/2006 –
JSC Teliani Valley 51.23% 51.14% 52.33% Georgia Winery 30/06/2000 28/02/2007
Teliani Trading (Georgia), LLC
100.0% 100.0% 100.0% Georgia Distribution 10/01/2006 27/03/2007
Teliani Trading (Ukraine), LLC
100.0% 100.0% 100.0% Ukraine Distribution 03/10/2006 31/12/2007
Le Caucase, LLC 100.0% 100.0% 100.0% Georgia Cognac Production
23/09/2006 20/03/2007
Kupa, LLC 70.0% 70.0% 70.0% Georgia Oak Barrel Production
12/10/2006 20/03/2007

110 Bank of Georgia Holdings PLC Annual Report 2012
(Thousands of Georgian Lari)
2. Basis of Preparation (continued)
Subsidiaries and associates (continued)
Proportion of voting rights and ordinary share capital held
Subsidiaries31 December
201231 December
201131 December
2010Country of
incorporation IndustryDate of
incorporationDate of
acquisition
JSC Intertour 99.94% 97.02% 97.02% Georgia Travel agency
29/03/1996 25/04/2006
Intertour Ukraine, LLC – (a) 100.0% Ukraine Travel agency
19/02/2010 –
Holiday Travel, LLC (e) 100.0% 100.0% Georgia Travel agency
11/02/2005 04/09/2006
JSC Prime Fitness 100.0% 100.0% 100.0% Georgia Fitness centre
03/07/2006 –
Planeta Forte, LLC (f) 51.0% 51.0% Georgia Newspaper Retail
31/10/1995 01/01/2009
JSC SB Real Estate 100.0% 100.0% 100.0% Georgia Real estate 27/09/2006 –
Caucasus Autohause, LLC
100.0% 100.0% – Georgia Real estate 29/03/2011 –
Tamarashvili 13, LLC 100.0% 100.0% – Georgia Real estate 03/11/2011 –
JSC Galt and Taggart Holdings (Georgia)
100.0% 100.0% 100.0% Georgia Investment 04/11/2008 –
Metro Service +, LLC 100.0% 100.0% 100.0% Georgia Business servicing
10/05/2006 –
Georgia Financial Investments, LLC
100.0% 100.0% 100.0% Israel Information Sharing and Market Research
09/02/2009 –
Bank of Georgia Representative Office UK Limited
100.0% 100.0% 100.0% United Kingdom
Information Sharing and Market Research
17/08/2010 –
Professional Basketball Club Dinamo Tbilisi, LLC
100.0% 100.0% – Georgia Investment 01/10/2011 –
JSC United Securities Registrar of Georgia
100.0% 100.0% 100.0% Georgia Registrar 29/05/2006 –
Bank of Georgia Representative Office Hungary
100.0% – – Hungary Repre- sentative Office
18/06/2012 –
(a) No longer Group subsidiary due to sale in 2011.
(b) Merged to JSC BG Capital (Georgia) in 2012.
(c) BG Commodities (Georgia), LLC merged to JSC BG Capital in 2011.
(d) Had been liquidated in 2012.
(e) Merged to JSC Intertour in 2012.
(f) No longer Group subsidiary due to sale in 2012.
(g) JSC Bank of Georgia was the ultimate parent in 2011 and 2010.
(h) No longer Group subsidiary due to disposal of controlling stake in 2011.
Financial Statements: Notes to consolidated financial statements continued

OverviewPerform
anceGovernance
Financial Statements
Additional Information
Bank of Georgia Holdings PLC Annual Report 2012 111
Proportion of voting rights and ordinary share capital held
Associates31 December
201231 December
201131 December
2010Country of
incorporation IndustryDate of
incorporationDate of
acquisition
JSC N Tour 30.0% 30.0% 30.0% Georgia Travel services
01/11/2001 29/05/2008
JSC Hotels and Restaurants Management Group – m/Group
10.0% 25.0% 25.0% Georgia Food retail 30/05/2005 29/05/2008
JSC iCall 27.0% 27.0% 27.0% Georgia Call center 22/03/2005 22/11/2006
JSC Caucasus Automotive Retail
– 30.0% 36.1% Georgia Car retail 18/04/2008 02/05/2008
Style +, LLC 32.5% 32.5% 32.5% Georgia Advertising 01/08/2005 07/08/2008
3. Summary of Significant Accounting PoliciesAdoption of new or revised standards and interpretationsThe Group has adopted the following amended IFRS during the year:
Amendments to IFRS 7 “Financial Instruments: Disclosures”The Amendments were issued in October 2010 and are effective for annual periods beginning on or after 1 July 2011. The amendment requires additional disclosure about financial assets that have been transferred to enable the users of the Group’s financial statements to evaluate the risk exposures relating to those assets. The amendment has no impact on the Group’s disclosures, financial position or performance.
Other amendments resulting from Improvements to the following standards did not have any impact on the accounting policies, financial position or performance of the Group:
– IAS 12 Income Taxes (Amendment) – Deferred Taxes: Recovery of Underlying Assets – IFRS 1 First-Time Adoption of International Financial Reporting Standards (Amendment) – Severe Hyperinflation and Removal of Fixed Dates for First-Time Adopter
Basis of consolidationSubsidiaries, which are those entities in which the Group has an interest of more than one half of the voting rights, or otherwise has power to exercise control over their operating and financial activities, are consolidated. Subsidiaries are consolidated from the date on which control is transferred to the Group and are no longer consolidated from the date that control ceases. All intra-group transactions, balances and unrealised gains on transactions between group companies are eliminated in full; unrealised losses are also eliminated unless the transaction provides evidence of an impairment of the asset transferred. When necessary, accounting policies for subsidiaries have been changed to ensure consistency with the policies adopted by the Group.
Business combinations are accounted for using the acquisition method. The cost of an acquisition is measured as the aggregate of the consideration transferred, measured at acquisition date fair value and the amount of any non-controlling interests in the acquiree. For each business combination, the Group measures the non-controlling interests in the acquiree either at fair value or at the proportionate share of the acquiree’s identifiable net assets. Acquisition costs incurred are expensed.
When the Group acquires a business, it assesses the financial assets and liabilities assumed for appropriate classification and designation in accordance with the contractual terms, economic circumstances and pertinent conditions as at the acquisition date. This includes the separation of embedded derivatives in host contracts by the acquiree.

112 Bank of Georgia Holdings PLC Annual Report 2012
(Thousands of Georgian Lari)
3. Summary of Significant Accounting Policies (continued) If the business combination is achieved in stages, the acquisition date fair value of the Group’s previously held equity interest in the acquiree is remeasured to fair value as at the acquisition date through profit or loss.
Any contingent consideration to be transferred by the Group is recognised at fair value at the acquisition date. Subsequent changes to the fair value of the contingent consideration which is deemed to be an asset or liability, will be recognised in accordance with IAS 39 either in profit or loss or as change to other comprehensive income. If the contingent consideration is classified as equity, it shall not be remeasured until it is finally settled within equity.
Goodwill is initially measured at cost being the excess of the consideration transferred over the Group’s net identifiable assets acquired and liabilities assumed. If this consideration is lower than the fair value of the net assets of the subsidiary acquired, the difference is recognised in profit or loss. After initial recognition, goodwill is measured at cost less any accumulated impairment losses. For the purpose of impairment testing, goodwill acquired in a business combination is, from the acquisition date, allocated to each of the Group’s cash generating units that are expected to benefit from the combination, irrespective of whether other assets or liabilities of the acquiree are assigned to those units.
Where goodwill forms part of a cash-generating unit and part of the operation within that unit is disposed of, the goodwill associated with the operation disposed of is included in the carrying amount of the operation when determining the gain or loss on disposal of the operation. Goodwill disposed of in this circumstance is measured based on the relative values of the operation disposed of and the portion of the cash-generating unit retained.
Investments in associatesAssociates are entities in which the Group generally has between 20% and 50% of the voting rights, or is otherwise able to exercise significant influence, but which it does not control or jointly control. Investments in associates are accounted for under the equity method and are initially recognised at cost, including goodwill. Subsequent changes in the carrying value reflect the post-acquisition changes in the Group’s share of net assets of the associate. The Group’s share of its associates’ profits or losses is recognised in the consolidated income statement, and its share of movements in reserves is recognised in other comprehensive income. However, when the Group’s share of losses in an associate equals or exceeds its interest in the associate, the Group does not recognise further losses, unless the Group is obliged to make further payments to, or on behalf of, the associate.
Unrealised gains on transactions between the Group and its associates are eliminated to the extent of the Group’s interest in the associates; unrealised losses are also eliminated unless the transaction provides evidence of an impairment of the asset transferred.
Financial assetsInitial recognitionFinancial assets in the scope of IAS 39 are classified as either financial assets at fair value through profit or loss, loans and receivables, held-to-maturity investments, or available-for-sale financial assets, as appropriate. When financial assets are recognised initially, they are measured at fair value, plus, in the case of investments not at fair value through profit or loss, directly attributable transaction costs. The Group determines the classification of its financial assets upon initial recognition.
Date of recognitionAll regular way purchases and sales of financial assets are recognised on the trade date i.e. the date that the Group commits to purchase or sell the asset. Regular way purchases or sales are purchases or sales of financial assets that require delivery of assets within the period generally established by regulation or convention in the marketplace.
Financial Statements: Notes to consolidated financial statements continued

OverviewPerform
anceGovernance
Financial Statements
Additional Information
Bank of Georgia Holdings PLC Annual Report 2012 113
Loans and receivablesLoans and receivables are non-derivative financial assets with fixed or determinable payments that are not quoted in an active market. They are not entered into with the intention of immediate or short-term resale and are not classified as trading securities or designated as investment securities available-for-sale. Such assets are carried at amortised cost using the effective interest method. This calculation includes all fees paid or received between parties to the contract that are an integral part of the effective interest rate, transaction costs and all other premiums and discounts. For investments carried at amortised cost, gains and losses are recognised in the consolidated income statement when the investments are impaired, as well as through the amortisation process. Gains and losses are recognised in the consolidated income statement when the loans and receivables are derecognised or impaired, as well as through the amortisation process.
Available-for-sale financial assetsAvailable-for-sale financial assets are those non-derivative financial assets that are designated as available-for-sale or are not classified in any of the three preceding categories. After initial recognition available-for-sale financial assets are measured at fair value with gains or losses being recognised in other comprehensive income until the investment is derecognised or until the investment is determined to be impaired at which time the cumulative gain or loss previously reported in other comprehensive income is reclassified to the consolidated income statement. However, interest calculated using the effective interest method is recognised in the consolidated income statement.
Determination of fair valueThe fair value of financial instruments that are actively traded in organised financial markets is determined by reference to quoted market bid prices for long positions and ask price for short positions at the close of business on the reporting date, without any deduction for transaction costs.
For all other financial instruments where there is no active market, fair value is determined using valuation techniques. Valuation techniques include using recent arm’s length market transactions, which are determined not to be a result of a forced transaction, involuntary liquidation or distress sale, reference to the current market value of similar instrument, discounted cash flow analysis and other relevant valuation models.
OffsettingFinancial assets and liabilities are offset and the net amount is reported in the consolidated statement of financial position when there is a legally enforceable right to set off the recognised amounts and there is an intention to settle on a net basis, or to realise the asset and settle the liability simultaneously.
Cash and cash equivalentsCash and cash equivalents consist of cash on hand, amounts due from central banks, excluding obligatory reserves with central banks, and amounts due from credit institutions that mature within ninety days of the date of origination and are free from contractual encumbrances.
Derivative financial instrumentsIn the normal course of business, the Group enters into various derivative financial instruments including forwards, swaps and options in the foreign exchange and capital markets. Such financial instruments are initially recognised in accordance with the policy for initial recognition of financial instruments and are subsequently measured at fair value. The fair values are estimated based on quoted market prices or pricing models that take into account the current market and contractual prices of the underlying instruments and other factors. Derivatives are carried as assets when their fair value is positive and as liabilities when it is negative. Gains and losses resulting from these instruments are included in the consolidated income statement as gains less losses from interest rate swaps and gains less losses from foreign currencies translation differences, depending on the nature of the instrument.
BorrowingsIssued financial instruments or their components are classified as liabilities, where the substance of the contractual arrangement results in the group having an obligation either to deliver cash or another financial asset to the holder, or to satisfy the obligation other than by the exchange of a fixed amount of each or another financial asset for a fixed number of own equity instruments. Such instruments include amounts due to credit institutions and amounts due to customers (including promissory notes issued). These are initially recognised at the fair value of the consideration received less directly attributable transaction costs. After initial recognition, borrowings are subsequently measured at amortised cost using the effective interest method. Gains and losses are recognised in the consolidated income statement when the borrowings are derecognised as well as through the amortisation process.

114 Bank of Georgia Holdings PLC Annual Report 2012
(Thousands of Georgian Lari)
3. Summary of Significant Accounting Policies (continued) If the Group purchases its own debt, it is removed from the statement of financial position and the difference between the carrying amount of the liability and the consideration paid is recognised in the consolidated income statement.
Subordinated debtSubordinated debt represents long-term funds attracted by the Bank on the international financial markets or domestic market. The holders of subordinated debt would be subordinate to all other creditors to receive repayment on debt in case of the Bank liquidation. Subordinated debt is carried at amortised cost.
Leasesi. Finance – Group as lessorThe Group recognises finance lease receivables in the consolidated statement of financial position at a value equal to the net investment in the lease, starting from the date of commencement of the lease term. In calculating the present value of the minimum lease payments the discount factor used is the interest rate implicit in the lease. Initial direct costs are included in the initial measurement of the finance lease receivables. Lease payments received are apportioned between the finance income and the reduction of the outstanding lease receivable. Finance income is based on a pattern reflecting a constant periodic rate of return on the net investment outstanding.
ii. Operating – Group as lessee Leases of assets under which the risks and rewards of ownership are effectively retained by the lessor are classified as operating leases. Lease payments under an operating lease are recognised as expenses on a straight-line basis over the lease term and included into other administrative and operating expenses.
iii. Operating – Group as lessorThe Group presents assets subject to operating leases in the consolidated statement of financial position according to the nature of the asset. Lease income from operating leases is recognised in the consolidated income statement on a straight-line basis over the lease term as other income. The aggregate cost of incentives provided to lessees is recognised as a reduction of rental income over the lease term on a straight-line basis. Initial direct costs incurred specifically to earn revenues from an operating lease are added to the carrying amount of the leased asset.
Impairment of financial assetsThe Group assesses at each reporting date whether there is any objective evidence that a financial asset or group of financial assets is impaired.
A financial asset or a group of financial assets is deemed to be impaired if, and only if, there is objective evidence of impairment as a result of one or more events that has occurred after the initial recognition of the asset (an incurred ‘loss event’) and that loss event (or events) has an impact on the estimated future cash flows of the financial asset or the group of financial assets that can be reliably estimated. Evidence of impairment may include indications that the borrower or a group of borrowers is experiencing significant financial difficulty, default or delinquency in interest or principal payments, the probability that they will enter bankruptcy or other financial reorganisation and where observable data indicate that there is a measurable decrease in the estimated future cash flows, such as changes in arrears or economic conditions that correlate with defaults.
Amounts due from credit institutions and loans to customersFor amounts due from credit institutions and loans to customers carried at amortised cost, the Group first assesses individually whether objective evidence of impairment exists individually for financial assets that are individually significant, or collectively for financial assets that are not individually significant. If the Group determines that no objective evidence of impairment exists for an individually assessed financial asset, whether significant or not, it includes the asset in a group of financial assets with similar credit risks characteristics and collectively assesses them for impairment. Assets that are individually assessed for impairment and for which an impairment loss is, or continues to be, recognised are not included in a collective assessment of impairment.
If there is objective evidence that an impairment loss has been incurred, the amount of the loss is measured as the difference between the asset’s carrying amount and the present value of estimated future cash flows (excluding future expected credit losses that have not yet been incurred). The carrying amount of the asset is reduced through the use of an allowance account and the amount of the loss is recognised in the consolidated income statement. Interest income continues to be accrued on the reduced carrying amount based on the original effective interest rate of the asset. Loans together with the associated allowance are written off when there is no realistic prospect of future recovery and all collateral has been realised or has been transferred to the Group. If, in a subsequent year, the amount of the estimated impairment loss increases or decreases because of an event occurring after the impairment was recognised, the previously recognised impairment loss is increased or reduced by adjusting the allowance account. If a future write-off is later recovered, the recovery is credited to the consolidated income statement.
Financial Statements: Notes to consolidated financial statements continued

OverviewPerform
anceGovernance
Financial Statements
Additional Information
Bank of Georgia Holdings PLC Annual Report 2012 115
The present value of the estimated future cash flows is discounted at the financial asset’s original effective interest rate. If a loan has a variable interest rate, the discount rate for measuring any impairment loss is the current effective interest rate. The calculation of the present value of the estimated future cash flows of a collateralised financial asset reflects the cash flows that may result from foreclosure less costs for obtaining and selling the collateral, whether or not foreclosure is probable.
For the purpose of a collective evaluation of impairment, financial assets are grouped on the basis of the Group’s internal credit grading system that considers credit risk characteristics such as asset type, industry, geographical location, collateral type, past-due status and other relevant factors.
Future cash flows on a group of financial assets that are collectively evaluated for impairment are estimated on the basis of historical loss experience for assets with credit risk characteristics similar to those in the Group. Historical loss experience is adjusted on the basis of current observable data to reflect the effects of current conditions that did not affect the years on which the historical loss experience is based and to remove the effects of conditions in the historical period that do not exist currently. Estimates of changes in future cash flows reflect, and are directionally consistent with, changes in related observable data from year to year (such as changes in unemployment rates, property prices, commodity prices, payment status, or other factors that are indicative of incurred losses in the group or their magnitude). The methodology and assumptions used for estimating future cash flows are reviewed regularly to reduce any differences between loss estimates and actual loss experience.
Write-off of loans to customersAll retail loans, except mortgages, are written off when overdue by more than 365 days. Retail mortgage loans are written off when overdue by more than 150 days. Write off of corporate loans overdue by more than 150 days is subject to management discretion and is evaluated on a case by case basis, taking into account the current and expected positions of the loan/borrower.
Available-for-sale financial assetsFor available-for-sale financial investments, the Group assesses at each reporting date whether there is objective evidence that an investment or a group of investments is impaired.
In the case of equity investments classified as available-for-sale, objective evidence would include a significant or prolonged decline in the fair value of the investment below its cost. Where there is evidence of impairment, the cumulative loss – measured as the difference between the acquisition cost and the current fair value, less any impairment loss on that investment previously recognised in the consolidated income statement – is reclassified from other comprehensive income to the consolidated income statement. Impairment losses on equity investments are not reversed through the consolidated income statement; increases in their fair value after impairment are recognised in other comprehensive income.
In the case of debt instruments classified as available-for-sale, impairment is assessed based on the same criteria as financial assets carried at amortised cost. Future interest income is based on the reduced carrying amount and is accrued using the rate of interest used to discount the future cash flows for the purpose of measuring the impairment loss. The interest income is recorded in the consolidated income statement. If, in a subsequent year, the fair value of a debt instrument increases and the increase can be objectively related to an event occurring after the impairment loss was recognised in the consolidated income statement, the impairment loss is reversed through the consolidated income statement.
Renegotiated loansRenegotiated loans comprise carrying amount of financial assets that would otherwise be past due or impaired whose terms have been renegotiated.
Where possible, the Group seeks to restructure loans rather than to take possession of collateral. This may involve extending the payment arrangements and the agreement of new loan conditions.
The accounting treatment of such restructuring is as follows:
– If the currency of the loan has been changed the old loan is derecognised and the new loan is recognised.
– If the loan restructuring is not caused by the financial difficulties of the borrower the Group uses the same approach as for financial liabilities described below.
– If the loan restructuring is due to the financial difficulties of the borrower and the loan is impaired after restructuring, the Group recognises the difference between the present value of the new cash flows discounted using the original effective interest rate and the carrying amount before restructuring in the provision charges for the period. In cases where the loan is not impaired after restructuring, the Group recalculates the effective interest rate.

116 Bank of Georgia Holdings PLC Annual Report 2012
(Thousands of Georgian Lari)
3. Summary of Significant Accounting Policies (continued) Once the terms have been renegotiated, the loan is no longer considered past due. Management continuously reviews renegotiated loans to ensure that all criteria are met and that future payments are likely to occur. The loans continue to be subject to an individual or collective impairment assessment, calculated using the loan’s original or current effective interest rate.
Derecognition of financial assets and liabilitiesFinancial assetsA financial asset (or, where applicable, a part of a financial asset or part of a group of similar financial assets) is derecognised where:
– the rights to receive cash flows from the asset have expired;
– the Group has transferred its rights to receive cash flows from the asset, or retained the right to receive cash flows from the asset, but has assumed an obligation to pay them in full without material delay to a third party under a ‘pass-through’ arrangement; and
– the Group either (a) has transferred substantially all the risks and rewards of the asset, or (b) has neither transferred nor retained substantially all the risks and rewards of the asset, but has transferred control of the asset.
Where the Group has transferred its rights to receive cash flows from an asset and has neither transferred nor retained substantially all the risks and rewards of the asset nor transferred control of the asset, the asset is recognised to the extent of the Group’s continuing involvement in the asset. Continuing involvement that takes the form of a guarantee over the transferred asset is measured at the lower of the original carrying amount of the asset and the maximum amount of consideration that the Group could be required to repay.
Where continuing involvement takes the form of a written and/or purchased option (including a cash-settled option or similar provision) on the transferred asset, the extent of the Group’s continuing involvement is the amount of the transferred asset that the Group may repurchase, except that in the case of a written put option (including a cash-settled option or similar provision) on an asset measured at fair value, the extent of the Group’s continuing involvement is limited to the lower of the fair value of the transferred asset and the option exercise price.
Financial liabilitiesA financial liability is derecognised when the obligation under the liability is discharged or cancelled or expires.
Where an existing financial liability is replaced by another from the same lender on substantially different terms, or the terms of an existing liability are substantially modified, such an exchange or modification is treated as a derecognition of the original liability and the recognition of a new liability, and the difference in the respective carrying amounts is recognised in the consolidated income statement.
Financial guaranteesIn the ordinary course of business, the Group gives financial guarantees, consisting of letters of credit, guarantees and acceptances. Financial guarantees are initially recognised in the consolidated financial statements at fair value, in ‘Other liabilities’, being the premium received. Subsequent to initial recognition, the Group’s liability under each guarantee is measured at the higher of the amortised premium and the best estimate of expenditure required to settle any financial obligation arising as a result of the guarantee.
Any increase in the liability relating to financial guarantees is taken to the consolidated income statement. The premium received is recognised in the consolidated income statement on a straight-line basis over the life of the guarantee.
TaxationThe current income tax expense is calculated in accordance with the regulations in force in the respective territories that the Bank and its Subsidiaries operate.
Deferred tax assets and liabilities are calculated in respect of temporary differences using the liability method. Deferred income taxes are provided for all temporary differences arising between the tax bases of assets and liabilities and their carrying values for financial reporting purposes, except where the deferred income tax arises from the initial recognition of goodwill or of an asset or liability in a transaction that is not a business combination and, at the time of the transaction, affects neither the accounting profit nor taxable profit or loss.
A deferred tax asset is recorded only to the extent that it is probable that taxable profit will be available against which the deductible temporary differences can be utilised. Deferred tax assets and liabilities are measured at tax rates that are expected to apply to the period when the asset is realised or the liability is settled, based on tax rates that have been enacted or substantively enacted at the reporting date.
Financial Statements: Notes to consolidated financial statements continued

OverviewPerform
anceGovernance
Financial Statements
Additional Information
Bank of Georgia Holdings PLC Annual Report 2012 117
Deferred income tax is provided on temporary differences arising on investments in subsidiaries, associates and joint ventures, except where the timing of the reversal of the temporary difference can be controlled and it is probable that the temporary difference will not reverse in the foreseeable future.
Georgia, Ukraine, Belarus and Cyprus also have various operating taxes that are assessed on the Group’s activities. These taxes are included as a component of other operating expenses.
Investment propertiesThe Group holds certain properties as investments to earn rental income, generate capital appreciation or both. Investment properties are measured initially at cost, including subsequent costs. Subsequent to initial recognition, Investment properties is stated to fair value. Gains or losses arising from changes in fair values of investment properties are included in the consolidated income statement as “Net gains from revaluation of investment properties”.
Property and equipmentProperty and equipment, except for buildings, is carried at cost less accumulated depreciation and any accumulated impairment in value. Such cost includes the cost of replacing part of equipment when that cost is incurred if the recognition criteria are met. Buildings are measured at fair value less depreciation and impairment charged subsequent to the date of the revaluation.
The carrying values of property and equipment are reviewed for impairment when events or changes in circumstances indicate that the carrying value may not be recoverable.
Following initial recognition at cost, buildings are carried at a revalued amount, which is the fair value at the date of the revaluation less any subsequent accumulated depreciation and subsequent accumulated impairment losses. Valuations are performed frequently enough to ensure that the fair value of a revalued asset does not differ materially from its carrying amount.
Accumulated depreciation as at the revaluation date is eliminated against the gross carrying amount of the asset and the net amount is restated to the revalued amount of the asset. Any revaluation surplus is credited to the revaluation reserve for property and equipment included in other comprehensive income, except to the extent that it reverses a revaluation decrease of the same asset previously recognised in the consolidated income statement, in which case the increase is recognised in the consolidated income statement. A revaluation deficit is recognised in the consolidated income statement, except that a deficit directly offsetting a previous surplus on the same asset is directly offset against the surplus in the revaluation reserve for property and equipment.
An annual transfer from the revaluation reserve for property and equipment to retained earnings is made for the difference between depreciation based on the revalued carrying amount of the assets and depreciation based on the assets original cost. Additionally, accumulated depreciation as at the revaluation date is eliminated against the gross carrying amount of the asset and the net amount is restated to the devalued amount of the asset. Upon disposal, any revaluation reserve relating to the particular asset being sold is transferred to retained earnings.
Depreciation of an asset, including assets under construction, commences from the date the asset is ready and available for use. Depreciation is calculated on a straight-line basis over the following estimated useful lives:
Years
Buildings Up to 100Furniture and fixtures 10Computers and office equipment 5Motor vehicles 5
The asset’s residual values, useful lives and methods are reviewed, and adjusted as appropriate, at each financial year-end.
Leasehold improvements are amortised over the life of the related leased asset.
Costs related to repairs and renewals are charged when incurred and included in other operating expenses, unless they qualify for capitalisation.
GoodwillGoodwill acquired in a business combination is initially measured at cost, being the excess of the consideration transferred over the Group’s net identifiable assets acquired and liabilities assumed. Goodwill on an acquisition of a subsidiary is included in intangible assets. Goodwill on an acquisition of an associate is included in the investments in associates. Following initial recognition, goodwill is measured at cost less any accumulated impairment losses.
Goodwill is reviewed for impairment, annually or more frequently if events or changes in circumstances indicate that the carrying amount may be impaired.

118 Bank of Georgia Holdings PLC Annual Report 2012
(Thousands of Georgian Lari)
Financial Statements: Notes to consolidated financial statements continued
3. Summary of Significant Accounting Policies (continued) For the purpose of impairment testing, goodwill acquired in a business combination is, from the acquisition date, allocated to each of the Group’s cash-generating units, or groups of cash-generating units, that are expected to benefit from the synergies of the combination, irrespective of whether other assets or liabilities of the Group are assigned to those units or groups of units. Each unit or group of units to which the goodwill is so allocated:
– represents the lowest level within the Group at which the goodwill is monitored for internal management purposes; and
– is not larger than a segment as defined in IFRS 8 “Operating Segments”.
Impairment is determined by assessing the recoverable amount of the cash-generating unit (group of cash-generating units), to which the goodwill relates. Where the recoverable amount of the cash-generating unit (group of cash-generating units) is less than the carrying amount, an impairment loss is recognised. Impairment losses cannot be reversed in future periods.
Intangible assetsThe Group’s intangible assets include computer software and licences.
Intangible assets acquired separately are measured on initial recognition at cost. The cost of intangible assets acquired in a business combination is fair value as at the date of acquisition. Following initial recognition, intangible assets are carried at cost less any accumulated amortisation and any accumulated impairment losses. The useful lives of intangible assets are assessed to be either finite or indefinite. Intangible assets with finite lives are amortised over the useful economic lives of 4 to 10 years and assessed for impairment whenever there is an indication that the intangible asset may be impaired. Amortisation periods and methods for intangible assets with finite useful lives are reviewed at least at each financial year-end.
Intangible assets with indefinite useful lives are not amortised, but tested for impairment annually either individually or at the cash-generating unit level.
Costs associated with maintaining computer software programs are recorded as an expense as incurred. Software development costs (relating to the design and testing of new or substantially improved software) are recognised as intangible assets only when the Group can demonstrate the technical feasibility of completing the software so that it will be available for use or sale, its intention to complete and its ability to use or sell the asset, how the asset will generate future economic benefits, the availability of resources to complete and the ability to measure reliably the expenditure during the development. Other software development costs are recognised as an expense as incurred.
Insurance and reinsurance receivablesInsurance and reinsurance receivables are recognised based upon insurance policy terms and measured at cost. The carrying value of insurance and reinsurance receivables is reviewed for impairment whenever events or circumstances indicate that the carrying amount may not be recoverable, with any impairment loss recorded in the consolidated statement of income.
Reinsurance receivables primarily include balances due from both insurance and reinsurance companies for ceded insurance liabilities. Premiums on reinsurance assumed are recognised as revenue in the same manner as they would be if the reinsurance were considered direct business, taking into account the product classification of the reinsured business. Amounts due to reinsurers are estimated in a manner consistent with the associated reinsured policies and in accordance with the reinsurance contract. Premiums ceded and claims reimbursed are presented on a gross basis.
An impairment review is performed on all reinsurance assets when an indication of impairment occurs. Reinsurance receivables are impaired only if there is objective evidence that the Group may not receive all amounts due to it under the terms of the contract that this can be measured reliably.
Insurance liabilitiesGeneral insurance liabilitiesGeneral insurance contract liabilities are based on the estimated ultimate cost of all claims incurred but not settled at the reporting date, whether reported or not, together with related claims handling costs and reduction for the expected value of salvage and other recoveries. Significant delays can be experienced in the notification and settlement of certain types of general insurance claims, particularly in respect of liability business, environmental and pollution exposures – therefore the ultimate cost of which cannot be known with certainty at the reporting date.
Provision for unearned premiumsThe proportion of written premiums, gross of commission payable to intermediaries, attributable to subsequent periods is deferred as unearned premium. The change in the provision for unearned premium is taken to the consolidated income statement in order that revenue is recognised over the period of risk or, for annuities, the amount of expected future benefit payments.

OverviewPerform
anceGovernance
Financial Statements
Additional Information
Bank of Georgia Holdings PLC Annual Report 2012 119
Liability adequacy testAt each reporting date, a liability adequacy test is performed, to ensure the adequacy of unearned premiums net of related deferred acquisition costs. In performing the test, current best estimates of future contractual cash flows, claims handling and policy administration expenses, as well as investment income from assets backing such liabilities, are used. Any inadequacy is immediately charged to the consolidated income statement by establishing an unexpired risk provision.
ProvisionsProvisions are recognised when the Group has a present legal or constructive obligation as a result of past events, and it is probable that an outflow of resources embodying economic benefits will be required to settle the obligation and a reliable estimate of the amount of obligation can be made.
Provisions for the risk of incurring losses on off-balance sheet commitments is estimated regularly based on the past history of actual losses incurred on these commitments.
Retirement and other employee benefit obligationsThe Group provides management and employees of the Group with private pension plans. These are defined contribution pension plans covering substantially all full-time employees of the Group. The Group collects contributions from its employees. When an employee reaches the pension age, aggregated contributions, plus any earnings earned on the employee’s behalf are paid to the employee according to the schedule agreed with the employee. Aggregated amounts are distributed during the period when the employee will receive accumulated contributions.
Share-based payment transactionsEmployees (including senior executives) of the Group receive share-based remuneration, whereby employees render services as consideration for the equity instruments (“equity settled transactions”).
Equity-settled transactions The cost of equity settled transactions with employees is measured by reference to the fair value at the date on which they are granted.
The cost of equity settled transactions is recognised together with the corresponding increase in equity, over the period in which the performance and/or service conditions are fulfilled, ending on the date when the relevant employee is fully entitled to the award (“the vesting date”). The cumulative expense recognised for equity settled transactions at each reporting date until the vesting date reflects the extent to which the vesting period has expired and the Group’s best estimate of the number of equity instruments that will ultimately vest. The consolidated income statement charge or credit for the period represents the movement in cumulative expense recognised as at the beginning and end of that period.
No expense is recognised for the awards that do not ultimately vest except for the awards where vesting is conditional upon market conditions (a condition linked to the price of the BGH’s shares) which are treated as vesting irrespective whether the market condition is satisfied, provided that all other performance conditions are satisfied.
Where the terms of an equity-settled award are modified, the minimum expense is recognised as if the terms had not been modified. An additional expense is recognised for any modification which increases the total fair value of the share-based payment arrangement, or is otherwise beneficial to the employee as measured at the date of the modification.
Where an equity-settled award is cancelled, it is treated as if it has vested on the date of cancellation, and any expense not yet recognised for the award is recognised immediately. However, if a new award is substituted for the cancelled award, and designated as the replacement award on the date that it is granted, the cancelled and the new awards are treated as if they were a modification of the original award, as described in the previous paragraph.
Share capitalShare capitalOrdinary shares are classified as equity. External costs directly attributable to the issue of new shares, other than on a business combination, are shown as a deduction from the proceeds in equity. Any excess of the fair value of consideration received over the par value of shares issued is recognised as additional paid-in capital.
Treasury sharesWhere BGH or its subsidiaries purchase BGH’s shares, the consideration paid, including any attributable transaction costs, net of income taxes, is deducted from total equity as treasury shares until they are cancelled or reissued. Where such shares are subsequently sold or reissued, any consideration received is included in equity. Treasury shares are stated at par value, with adjustment of premiums against additional paid-in capital.
Dividends Dividends are recognised as a liability and deducted from equity at the reporting date only if they are declared before or on the reporting date. Dividends are disclosed when they are proposed before the reporting date or proposed or declared after the reporting date but before the consolidated financial statements are authorised for issue.
ContingenciesContingent liabilities are not recognised in the consolidated statement of financial position but are disclosed unless the possibility of any outflow in settlement is remote. A contingent asset is not recognised in the consolidated statement of financial position but disclosed when an inflow of economic benefits is probable.

120 Bank of Georgia Holdings PLC Annual Report 2012
(Thousands of Georgian Lari)
Financial Statements: Notes to consolidated financial statements continued
3. Summary of Significant Accounting Policies (continued) Income and expense recognitionRevenue is recognised to the extent that it is probable that the economic benefits will flow to the Group and the revenue can be reliably measured. The following specific recognition criteria must also be met before revenue and expense is recognised:
Interest and similar income and expenseFor all financial instruments measured at amortised cost and interest bearing securities classified as trading or available-for-sale, interest income or expense is recorded at the effective interest rate, which is the rate that exactly discounts estimated future cash payments or receipts through the expected life of the financial instrument or a shorter period, where appropriate, to the net carrying amount of the financial asset or financial liability. The calculation takes into account all contractual terms of the financial instrument (for example, prepayment options) and includes any fees or incremental costs that are directly attributable to the instrument and are an integral part of the effective interest rate, but not future credit losses. The carrying amount of the financial asset or financial liability is adjusted if the Group revises its estimates of payments or receipts. The adjusted carrying amount is calculated based on the original effective interest rate and the change in carrying amount is recorded as interest income or expense.
Once the recorded value of a financial asset or a group of similar financial assets has been reduced due to an impairment loss, interest income continues to be recognised using the original effective interest rate applied to the new carrying amount.
Fee and commission incomeThe Group earns fee and commission income from a diverse range of services it provides to its customers. Fee income can be divided into the following two categories:
Fee income earned from services that are provided over a certain period of timeFees earned for the provision of services over a period of time are accrued over that period. These fees include commission incomes and asset management, custody and other management and advisory fees. Loan commitment fees for loans that are likely to be drawn down and other credit related fees are deferred (together with any incremental costs) and recognised as an adjustment to the effective interest rate on the loan.
Fee income from providing transaction servicesFees arising from negotiating or participating in the negotiation of a transaction for a third party – such as the arrangement of the acquisition of shares or other securities or the purchase or sale of businesses – are recognised on completion of the underlying transaction. Fees or components of fees that are linked to a certain performance are recognised after fulfilling the corresponding criteria.
Dividend incomeRevenue is recognised when the Group’s right to receive the payment is established.
Insurance premium incomeFor non-life insurance business, premiums written are recognised at policy inception and earned on a pro rata basis over the term of the related policy coverage. Estimates of premiums written as at the reporting date but not yet received, are assessed based on estimates from underwriting or past experience and are included in premiums earned.
Insurance claims General insurance claims incurred include all claim losses occurring during the year, whether reported or not, including the related handling costs and reduction for the value of salvage and other recoveries and any adjustments to claims outstanding from previous years.
Healthcare revenueHealthcare revenue is recognised to the extent that it is probable that the economic benefits will flow to the Group and the revenue can be reliably measured on an accruals basis. When services are provided in exchange for dissimilar goods or services, the revenue is measured at the fair value of the goods or services received, adjusted by the amount of any cash or cash equivalent transferred. When the fair value of the goods or services received cannot be measured reliably, the revenue is measured at the fair value of the goods of services given up, adjusted by the amount of any cash or cash equivalents transferred.
Revenue from sale of goodsRevenue from sale of goods comprises revenue from sale of a completed property and other finished goods.
Revenue from sale of a completed property is recognised when the significant risks and rewards of ownership of the real estate have been transferred to the buyer. If, however, the legal terms of the contract are such that the construction represents the continuous transfer of work in progress to the purchaser, the percentage of completion method of revenue recognition is applied and revenue is recognised as work progresses.
Revenue from the sale of other finished goods is recognised when the significant risks and rewards of ownership of the goods have passed to the buyer, usually on delivery of the goods.

OverviewPerform
anceGovernance
Financial Statements
Additional Information
Bank of Georgia Holdings PLC Annual Report 2012 121
Continuous transfer of work in progress is applied when: (a) the buyer controls the work in progress, typically when the land on which the development is taking place is owned by the final customer and (b) all significant risks and rewards of ownership of the work in progress in its present state are transferred to the buyer as construction progresses, typically when buyer cannot put the incomplete property back to the Group. In such situations, the percentage of work completed is measured based on the costs incurred up until the end of the reporting period as a proportion of total costs expected to be incurred.
ReclassificationsDue to the increased material size of healthcare business and other revenues from sale of goods, separate captions have been added to the income statement with a summary of these revenues and respective direct costs. The following reclassifications have been made to the year ended 31 December 2011 and 31 December 2010 consolidated income statements to conform with the year ended 31 December 2012 presentational requirements:
Year Ended Consolidated Income Statement:As previously
reported ReclassificationAs
reclassified
31 December 2011 Healthcare revenue – 5,700 5,70031 December 2011 Revenue from sale of goods – 22,470 22,47031 December 2011 Other operating income 29,052 (20,285) 8,76731 December 2011 Cost of healthcare services – (3,242) (3,242)31 December 2011 Cost of sales – (12,109) (12,109)31 December 2011 Salaries and other employee benefits (119,111) 4,489 (114,622)31 December 2011 Other operating expenses (9,324) 2,977 (6,347)
31 December 2010 Healthcare revenue – 2,208 2,20831 December 2010 Revenue from sale of goods – 18,144 18,14431 December 2010 Other operating income 21,927 (11,302) 10,62531 December 2010 Cost of healthcare services – (1,632) (1,632)31 December 2010 Cost of sales – (9,050) (9,050)31 December 2010 Salaries and other employee benefits (104,551) 666 (103,885)31 December 2010 General and administrative expenses (61,000) 432 (60,568)31 December 2010 Other operating expenses (6,253) 534 (5,719)
As a result of reclassifications made in the consolidated income statement for the year ended 31 December 2011 and 31 December 2010, the following reclassifications have been made to the year ended 31 December 2011 and 31 December 2010 consolidated statements of cash flows as well, in order to conform with the year ended 31 December 2012 presentational requirements:
Year Ended Consolidated Statement of Cash Flows:As previously
reported ReclassificationAs
reclassified
31 December 2011 Healthcare revenue received – 5,700 5,70031 December 2011 Revenue received from sale of goods – 22,470 22,47031 December 2011 Other operating income received
(expenses paid) 35,551 (20,285) 15,26631 December 2011 Cost of healthcare services paid – (3,242) (3,242)31 December 2011 Cost of sales of goods – (12,109) (12,109)31 December 2011 Salaries and other employee
benefits paid (100,500) 4,489 (96,011)31 December 2011 General and administrative and operating
expenses paid (72,246) 2,977 (69,269)
31 December 2010 Healthcare revenue received – 2,208 2,20831 December 2010 Revenue received from sale of goods – 18,144 18,14431 December 2010 Other operating income received
(expenses paid) 9,483 (11,302) (1,819)31 December 2010 Cost of healthcare services paid – (1,632) (1,632)31 December 2010 Cost of sales of goods – (9,050) (9,050)31 December 2010 Salaries and other employee benefits
paid (93,870) 666 (93,204)31 December 2010 General and administrative and operating
expenses paid (71,872) 966 (70,906)

122 Bank of Georgia Holdings PLC Annual Report 2012
(Thousands of Georgian Lari)
Financial Statements: Notes to consolidated financial statements continued
3. Summary of Significant Accounting Policies (continued) Functional, reporting currencies and foreign currency translationThe consolidated financial statements are presented in Georgian Lari, which is the Group’s presentation currency. BGH’s functional currency is British Pound Sterling. The Bank’s functional currency is US Dollar. Each entity in the Group determines its own functional currency and items included in the financial statements of each entity are measured using that functional currency. Transactions in foreign currencies are initially recorded in the functional currency, converted at the rate of exchange ruling at the date of the transaction. Monetary assets and liabilities denominated in foreign currencies are retranslated into the functional currency at the functional currency’s rate of exchange ruling at the reporting date. Gains and losses resulting from the translation of foreign currency transactions are recognised in the consolidated income statement as gains less losses from foreign currencies – translation differences. Non-monetary items that are measured in terms of historical cost in a foreign currency are translated using the exchange rates as at the dates of the initial transactions. Non-monetary items measured at fair value in a foreign currency are translated using the exchange rates at the date when the fair value was determined.
Differences between the contractual exchange rate of a certain transaction and the NBG exchange rate on the date of the transaction are included in gains less losses from foreign currencies (dealing). The official NBG exchange rates at 31 December 2012, 31 December 2011 and 31 December 2010 were:
Lari to GBP
Lari to US$
Lari to EUR
Lari to UAH
(10)
Lari to BYR(10,000)
31 December 2012
2.6653 1.6567 2.1825 2.0727 1.9811
31 December 2011
2.5776 1.6703 2.1614 2.0905 2.0004
31 December 2010
2.7393 1.7728 2.3500 2.2272 5.9093
As at the reporting date, the assets and liabilities of the entities whose functional currency is different from the presentation currency of the Group are translated into Georgian Lari at the rate of exchange ruling at the reporting date and, their income statements are translated at the weighted average exchange rates for the year. The exchange differences arising on the translation are taken to other comprehensive income. On disposal of a subsidiary or an associate whose functional currency is different from the presentation currency of the Group, the deferred cumulative amount recognised in other comprehensive income relating to that particular entity is recognised in the consolidated income statement.
Any goodwill arising on the acquisition of a foreign operation and any fair value adjustments to the carrying amounts of assets and liabilities arising on the acquisition are treated as assets and liabilities of the foreign operations and translated at closing rate.
Hyperinflation accountingWith effect from 1 January 2011, the Belarusian economy has been considered to be hyperinflationary in accordance with the criteria in IAS 29 “Financial Reporting in Hyperinflationary Economies” (“IAS 29”). The standard requires that the financial statements prepared in the currency of a hyperinflationary economy be stated in terms of the measuring unit current at the reporting date.
In applying IAS 29, the Bank’s subsidiaries in Belarus, JSC Belarusky Narodny Bank (“BNB”) and BNB Leasing, LLC, have used conversion factors derived from the Belarusian consumer price index (“CPI”), published by the State Committee on Statistics of the Republic of Belarus. The CPIs for the six year period and respective conversion factors after Belarus previously ceased to be considered hyperinflationary on 1 January 2006 are as follows:
Year Index, %Conversion
Factors
2006 106.6 390.22007 112.1 348.52008 113.3 307.22009 110.1 279.62010 109.9 254.12011 208.7 121.82012 121.8 100.0
All income and expenses, profits and losses are recalculated by applying the relevant adjustment factors. Monetary assets and liabilities are not recalculated because they are already expressed in terms of the monetary unit current as at the reporting date. Non-monetary assets and liabilities (items which are not already expressed in terms of the monetary unit current as at the reporting date) are recalculated by applying the relevant index. The effect of inflation on BNB’s net non-monetary position is included in the income statement in net non-operating expenses.
Standards and interpretations that are issued but not yet effectiveUp to the date of approval of the consolidated financial statements, certain new standards, interpretations and amendments to existing standards have been published that are not yet effective for the current reporting period and which the Group has not early adopted, as follows:

OverviewPerform
anceGovernance
Financial Statements
Additional Information
Bank of Georgia Holdings PLC Annual Report 2012 123
IFRS 9 “Financial Instruments”IFRS 9, as issued, reflects the first phase of the IASB’s work on the replacement of IAS 39 and applies to the classification and measurement of financial assets and financial liabilities as defined in IAS 39. The standard was initially effective for annual periods beginning on or after 1 January 2013, but Amendments to IFRS 9 mandatory Effective Date of IFRS 9 and Transition Disclosures, issued in December 2011, moved the mandatory effective date to 1 January 2015. In subsequent phases, the IASB will address hedge accounting and impairment of financial assets. The Group will quantify the effect of the adoption of the first phase of IFRS 9 in conjunction with the other phases, at the time the other phases are issued, to present a comprehensive picture.
IFRS 10 Consolidated Financial StatementsIFRS 10 establishes a single control model that applies to all entities including special purpose entities. The changes introduced by IFRS 10 will require management to exercise significant judgment to determine which entities are controlled, and therefore, are required to be consolidated by a parent, compared with the requirements that were in IAS 27. In addition IFRS 10 introduces specific application guidance for agency relationships. IFRS 10 replaces the portion of IAS 27 Consolidated and Separate Financial Statements that addresses the accounting for consolidated financial statements. It also includes the issues raised in SIC-12 Consolidation — Special Purpose Entities. It is effective for annual periods beginning on or after 1 January 2014. Earlier application is permitted. The Group is currently evaluating the possible effect of the adoption of IFRS 10 on its financial position and performance.
IFRS 11 Joint ArrangementsIFRS 11 removes the option to account for jointly controlled entities (JCEs) using proportionate consolidation. Instead, JCEs that meet the definition of a joint venture must be accounted for using the equity method. IFRS 11 supersedes IAS 31 Interests in Joint Ventures and SIC-13 Jointly Controlled Entities—Non-monetary Contributions by Venturers and is effective for annual periods beginning on or after 1 January 2014. Earlier application is permitted. The Group expects that adoption of IFRS 11 will have no effect on its financial position and performance.
IFRS 12 Disclosure of Interests in Other EntitiesIFRS 12 is effective for annual periods beginning on or after 1 January 2014. IFRS 12 includes all of the disclosures that were previously in IAS 27 related to consolidated financial statements, as well as all of the disclosures that were previously included in IAS 31 and IAS 28. These disclosures relate to an entity’s interests in subsidiaries, joint arrangements, associates and structured entities. A number of new disclosures are also required. In particular, the Group will need to disclose more information about the consolidated and unconsolidated structured entities with which it is involved or which it has sponsored. However, the standard will have no impact on Group’s financial position or performance.
IFRS 13 Fair Value Measurement IFRS 13 establishes a single source of guidance under IFRS for all fair value measurements. IFRS 13 does not change when an entity is required to use fair value, but rather provides guidance on how to measure fair value under IFRS when fair value is required or permitted. IFRS 13 is effective for annual periods beginning on or after 1 January 2013. Earlier application is permitted. The adoption of the IFRS 13 may have effect on the measurement of the Group’s assets and liabilities accounted for at fair value. The Group is currently evaluating the possible effect of the adoption of IFRS 13 on its financial position and performance.
IAS 27 Separate Financial Statements (as revised in 2011)As a consequence of the new IFRS 10 and IFRS 12, what remains of IAS 27 is limited to accounting for subsidiaries, jointly controlled entities, and associates in separate financial statements. The amendment is effective for annual periods beginning on or after 1 January 2013.
IAS 28 Investments in Associates and Joint Ventures (as revised in 2011)As a consequence of the new IFRS 11 and IFRS 12, IAS 28 has been renamed IAS 28 Investments in Associates and Joint Ventures, and describes the application of the equity method to investments in joint ventures in addition to associates. The amendment is effective for annual periods beginning on or after 1 January 2013.

124 Bank of Georgia Holdings PLC Annual Report 2012
(Thousands of Georgian Lari)
Financial Statements: Notes to consolidated financial statements continued
3. Summary of Significant Accounting Policies (continued) Amendments to IAS 19 Employee BenefitsThe IASB has published amendments to IAS 19 Employee Benefits, effective for annual periods beginning on or after 1 January 2013, which involve major changes to the accounting for employee benefits, including the removal of the option for deferred recognition of changes in pension plan assets and liabilities (known as the “corridor approach”). In addition, these amendments will limit the changes in the net pension asset (liability) recognised in profit or loss to net interest income (expense) and service costs. The Group expects that these amendments will have no impact on the Group’s financial position.
Amendments to IAS 1 Changes to the Presentation of Other Comprehensive IncomeThe amendments to IAS 1 change the grouping of items presented in other comprehensive income. Items that could be reclassified (or recycled) to profit or loss at a future point in time (for example, net losses or gains on available-for-sale financial assets) would be presented separately from items that will never be reclassified (for example, revaluation of buildings). The amendment affects presentation only and has no impact on the Group’s financial position or performance. The amendment is effective for annual periods beginning on or after 1 July 2012.
Amendments to IFRS 7 Disclosures – Offsetting Financial assets and Financial Liabilities These amendments require an entity to disclose information about rights to set-off and related arrangements (e.g. collateral agreements). The disclosures would provide users with information that is useful in evaluating the effect of netting arrangements on an entity’s financial position. The new disclosures are required for all recognised financial instruments that are set off in accordance with IAS 32 Financial Instruments: Presentation. The disclosures also apply to recognised financial instruments that are subject to an enforceable master netting arrangement or similar agreements, irrespective of whether they are set off in accordance with IAS 32. These amendments will not impact the Group’s financial position or performance and are effective for annual periods beginning on or after 1 January 2013.
Amendments to IAS 32 – Offsetting Financial Assets and Financial LiabilitiesThese amendments clarify the meaning of “currently has a legally enforceable right to set-off”. It will be necessary to assess the impact on the Group by reviewing settlement procedures and legal documentation to ensure that offsetting is still possible in cases where it has been achieved in the past. In certain cases, offsetting may no longer be achieved. In other cases, contracts may have to be renegotiated. The requirement that the right of set-off be available for all counterparties to the netting agreement may prove to be a challenge for contracts where only one party has the right to offset in the event of default.
The amendments also clarify the application of the IAS 32 offsetting criteria to settlement systems (such as central clearing house systems) which apply gross settlement mechanisms that are not simultaneous. While many settlement systems are expected to meet the new criteria, some may not. As the impact of the adoption depends on the Group’s examination of the operational procedures applied by the central clearing houses and settlement systems it deals with to determine if they meet the new criteria, it is not practical to quantify the effects now, but the Group will be evaluating the impact between now and the effective date.
These amendments will become effective for annual periods beginning on or after 1 January 2014.
Amendment to IFRS 1 – Government loansThese amendments require first-time adopters to apply the requirements of IAS 20 Accounting for Government Grants and Disclosure of Government Assistance, prospectively to government loans existing at the date of transition to IFRS. The amendment will have no impact on the Group.

Bank of Georgia Holdings PLC Annual Report 2012 125
OverviewPerform
anceGovernance
Financial Statements
Additional Information
Improvements to IFRSThe amendments are effective for annual periods beginning on or after 1 January 2013. They will not have an impact on the Group.
– IFRS 1 First-time Adoption of International Financial Reporting Standards: This improvement clarifies that an entity that stopped applying IFRS in the past and chooses, or is required, to apply IFRS, has the option to re-apply IFRS 1. If IFRS 1 is not re-applied, an entity must retrospectively restate its financial statements as if it had never stopped applying IFRS.
– IAS 1 Presentation of Financial Statements: This improvement clarifies the difference between voluntary additional comparative information and the minimum required comparative information. Generally, the minimum required comparative information is the previous period.
– IAS 16 Property Plant and Equipment: This improvement clarifies that major spare parts and servicing equipment that meet the definition of property; plant and equipment are not inventory.
– IAS 32 Financial Instruments, Presentation: This improvement clarifies that income taxes arising from distributions to equity holders are accounted for in accordance with IAS 12 Income Taxes.
– IAS 34 Interim Financial Reporting: The amendment aligns the disclosure requirements for total segment assets with total segment liabilities in interim financial statements. This clarification also ensures that interim disclosures are aligned with annual disclosures.
4. Significant Accounting Judgements and EstimatesIn the process of applying the Group’s accounting policies, the Board of Directors and management use their judgement and make estimates in determining the amounts recognised in the consolidated financial statements. The most significant judgements and estimates are as follows:
Fair value of financial instrumentsWhere the fair values of financial assets and financial liabilities recorded in the consolidated statement of financial position cannot be derived from active markets, they are determined using a variety of valuation techniques that include the use of mathematical models. The input to these models is taken from observable markets where possible, but where this is not feasible, a degree of judgment is required in establishing fair values.
Measurement of fair value of investment properties and property and equipment The fair value of investment properties and buildings included in property and equipment is determined by independent professionally qualified appraisers. Fair value is determined using a combination of the internal capitalisation method (also known as discounted future cash flow method) and the sales comparison method.
The estimates described above are subject to change as new transaction data and market evidence become available.
Allowance for impairment of loans and receivables and finance lease receivables The Group regularly reviews its loans and receivables and finance lease receivables to assess impairment. The Group uses its judgement to estimate the amount of any impairment loss in cases where a borrower is in financial difficulties and there are few available sources of historical data relating to similar borrowers. Similarly, the Group estimates changes in future cash flows based on the observable data indicating that there has been an adverse change in the payment status of borrowers in a group, or national or local economic conditions that correlate with defaults on assets in the group. Management uses estimates based on historical loss experience for assets with credit risk characteristics and objective evidence of impairment similar to those in the group of loans and receivables. The Group uses its judgement to adjust observable data for a group of loans or receivables to reflect current circumstances.
The Group considers the fair value of collateral when estimating the amount of impairment loss for collateralised loans and receivables and finance lease receivables. Management monitors market value of collateral on a regular basis. Management uses its experienced judgement or independent opinion to adjust the fair value to reflect current circumstances. The amount and type of collateral required depends on the assessment of credit risk of the counterparty.
In order to exclude post 2008 Georgia-Russia war and global financial crisis extraordinary trends from the assessment of collective impairment of loans, the Bank amended its approach in 2012. Namely, the historical loss rates that are applied for collective impairment are now calculated based on three-year history of net losses (including reversals) as opposed to five-seven-year history of net losses under previous approach. The impact of this change on profit from continuing operations before income tax expense for the year ended 31 December 2012 is GEL 20.1 million.

126 Bank of Georgia Holdings PLC Annual Report 2012
(Thousands of Georgian Lari)
Financial Statements: Notes to consolidated financial statements continued
5. Business Combinations Acquisitions in 2012JSC Insurance Company Imedi L InternationalOn 24 April 2012 JSC Insurance Company Aldagi BCI (“Acquirer”), a wholly owned subsidiary of the Group, fully acquired Meta LLC, which owned 51% of JSC Insurance Company Imedi L International (“Acquiree”), an insurance company operating in Georgia, thus acquiring control over the Acquiree. On 30 April 2012 the Acquirer purchased a 34% stake in the Acquiree from the European Bank for Reconstruction and Development (EBRD). On 21 May 2012 the Acquirer purchased 89.58% shares in Imedi L Holding LLC, which owned 9.6% of the Acquiree’s shares, thus bringing the total ownership stake in the Acquiree to 94.6%. On 24 July 2012 the remaining stake of the Acquiree were purchased from LTD Saimedo. On 16 November 2012 the Acquiree was merged with the Acquirer. The fair values of identifiable assets, liabilities and contingent liabilities acquired, and goodwill arising from the Acquiree as at the date of acquisition were:
Fair value recognised on
acquisition
Cash and cash equivalents 617Amounts due from credit institutions 7,042Insurance premiums receivable1 19,438Reinsurance assets 795Property and equipment 55,460Intangible assets 113Deferred acquisition costs 1,241Other assets 7,810
92,516
Amounts owed to credit institutions 6,355Insurance contracts liabilities 31,542Other insurance liabilities 1,861Pension benefit obligations 46Current income tax liabilities 46Accruals and deferred income 2,181Other liabilities 14,491
56,522
Total identifiable net assets 35,994
Goodwill arising on business combination (Note 14) 482
Consideration given2 36,476
The net cash outflow on acquisition was as follows:
2012
Cash paid 9,625Cash acquired with the subsidiary (617)
Net cash outflow 9,008
1 The fair value of the insurance premium receivables amounted to GEL 19,438. The gross amount of receivables is GEL 24,825. GEL 5,387 of the premium receivables has been impaired.
2 Consideration comprised of GEL 26,879 pre-existing loan to JSC Insurance Company Imedi L International less GEL 28 pre-existing deposit and cash payments of GEL 9,625.
The Group decided to increase their presence and investment in Georgia’s underpenetrated and growing insurance and healthcare sector, by acquiring the country’s third largest insurance company, thus securing a leading position in the sector. Management considers that the deal will have a positive impact on the value of the Group.
Since the acquisition date, the Group recorded GEL 306,038 and GEL 106,522 of revenue and profit, respectively. In the same period, GEL 9,263 and GEL 2,806 of revenue and profit, respectively comes from the Acquiree. If the combination had taken place at the beginning of the period, the Group would have recorded GEL 335,052 and GEL 103,460 of revenue and profit respectively.
The primary factor that contributed to the cost of the business combination that resulted in the recognition of goodwill was the positive synergy brought into the Group’s operations.

OverviewPerform
anceGovernance
Financial Statements
Additional Information
Bank of Georgia Holdings PLC Annual Report 2012 127
6. Segment InformationFor management purposes, the Group is organised into the following operating segments based on products and services as follows:
Retail Banking (excluding Retail Banking of BG Bank and BNB)
Principally providing consumer loans, mortgage loans, overdrafts, credit card facilities and other credit facilities as well as funds transfer and settlement services, and handling customers’ deposits for both, individuals as well as legal entities, encompassing mass affluent segment, retail mass markets, small & medium enterprises and micro businesses.
Corporate Banking (excluding Corporate Banking of BG Bank and BNB)
Principally providing loans and other credit facilities to large VIP as well as other legal entities, larger than SME and Micro, finance lease facilities provided by Georgian Leasing Company LLC, as well as providing funds transfers and settlement services, trade finance services and documentary operations support, handling saving and term deposits for corporate and institutional customers.
Wealth Management Principally providing private banking services to resident as well as non-resident wealthy individuals as well as their direct family members by ensuring individually distinguished approach and exclusivity in rendering common banking services such as fund transfers, currency exchange or settlement operations, or holding their savings and term deposits; Wealth Management involves providing wealth and asset management services to same individuals through different investment opportunities and specifically designed investment products.
Corporate Centre Principally providing back office services to all operating segments of the Group as well as holding all principal investments in subsidiaries.
Insurance Principally providing wide-scale non-life insurance services to corporate clients and insured individuals.
Healthcare Principally providing wide-scale healthcare services to clients and insured individuals.
Affordable Housing Comprising JSC SB Real Estate, principally developing and selling affordable residential apartments and also, holding investment properties repossessed by the Bank from defaulted borrowers and managing those properties.
BG Capital Principally providing brokerage, custody and corporate finance services, mostly to wealthy or mass affluent individuals as well as to corporate customers.
BNB & BGB Comprising JSC Belarusky Narodny Bank and JSC BG Bank (disposed of in February 2011), nowadays principally providing retail and corporate banking services in Belarus.
Liberty Consumer Principally holding private equity investments in several non-core business enterprises, such as winery, fitness centre, travel agencies, outdoor or indoor advertising company, regional car dealership, hotels and restaurants management chain and other smaller investments, all designated for disposal.
Other Comprising JSC Galt & Taggart Holding Georgia, a shell company, principally holding investments in subsidiaries of the Bank on behalf of the Bank.
For purposes of further consolidation of these operating segments and for more comprehensive presentation in these consolidated financial statements, Management has further grouped them into large segments, classified as: Strategic, Synergistic and Non-Core.
Management monitors the operating results of its business units separately for the purpose of making decisions about resource allocation and performance assessment. Segment performance, as explained in the table below, is measured in the same manner as profit or loss in the consolidated financial statements.
Transactions between operating segments are on an arm’s length basis in a manner similar to transactions with third parties.

128 Bank of Georgia Holdings PLC Annual Report 2012
(Thousands of Georgian Lari)
Financial Statements: Notes to consolidated financial statements continued
6. Segment Information (continued)The following tables present income statement and certain asset and liability information regarding the Group’s operating segments as at and for the year ended 31 December 2012:
Strategic Synergistic Non-Core
Corporate banking
Retail banking
Wealthmanagement
Corporate center Insurance Healthcare
AffordableHousing
BG Capital BNB
LibertyConsumer Other
Inter- segment
transactions and balances Total
Net interest income (expense) 92,276 174,360 12,644 – 1,825 (6,481) 147 21 12,074 (578) (2,171) – 284,117Net fees and commission income (expense) 28,701 53,563 523 (581) (107) – 196 456 3,809 (61) (12) – 86,487Net insurance revenue – – – – 29,661 – – – – – – 4,477 34,138Net healthcare revenue – – – – – 29,768 – – – – – (6,422) 23,346Net revenue from sale of goods – – – – – – 2,936 – – 7,729 – – 10,665Net gains (losses) from foreign currencies 29,819 14,985 682 – 238 (1,090) (145) (64) 5,306 (154) (6) – 49,571Other revenues 3,996 3,365 73 – 1,000 257 1,442 240 68 217 1,630 (2,357) 9,931
Revenue 154,792 246,273 13,922 (581) 32,617 22,454 4,576 653 21,257 7,153 (559) (4,302) 498,255
Operating expenses (51,323) (109,041) (4,665) (2,613) (17,437) (17,917) (2,381) (1,155) (10,327) (5,934) (2,661) 4,302 (221,152)
Operating income before cost of credit risk 103,469 137,232 9,257 (3,194) 15,180 4,537 2,195 (502) 10,930 1,219 (3,220) – 277,103
Cost of credit risk (29,490) (12,482) 727 – (1,502) (802) (219) – (1,306) (136) – 493 (44,717)
Net operating income 73,979 124,750 9,984 (3,194) 13,678 3,735 1,976 (502) 9,624 1,083 (3,220) 493 232,386
Net non-operating (expenses) income (8,415) (6,828) (305) – – 440 282 – (443) (4,365) – – (19,634)
Profit before income tax (expense) benefit 65,564 117,922 9,679 (3,194) 13,678 4,175 2,258 (502) 9,181 (3,282) (3,220) 493 212,752
Income tax (expense) benefit (9,936) (16,392) (1,339) – (2,068) (242) (307) (95) (2,367) (889) 435 – (33,200)
Profit for the year 55,628 101,530 8,340 (3,194) 11,610 3,933 1,951 (597) 6,814 (4,171) (2,785) 493 179,552
Assets and liabilitiesTotal assets 2,573,498 2,474,052 43,169 18,716 186,717 170,415 105,899 22,394 185,859 37,924 21,951 (184,999) 5,655,595Total liabilities 1,974,163 1,708,617 605,183 2,335 151,287 113,203 42,838 16,431 139,356 12,114 17,049 (186,493) 4,596,083
Other segment informationProperty and equipment 5,886 20,593 438 – 3,581 25,769 203 197 340 1,616 1,563 – 60,186Intangible assets 906 3,678 50 – 441 150 20 3 186 266 1 – 5,701
Capital expenditure 6,792 24,271 488 – 4,022 25,919 223 200 526 1,882 1,564 – 65,887Depreciation (4,160) (14,412) (316) – (699) (3,342) (121) (15) (910) (940) (112) – (25,027)Amortisation (667) (2,643) (37) – (101) – – (6) (116) (6) (3) – (3,579)Impairment – (15) – – – – – – – (939) – – (954)Investments in associates – – – – – – – – – 2,441 – – 2,441Share of loss of associates – – – – – – – – – (149) – – (149)

OverviewPerform
anceGovernance
Financial Statements
Additional Information
Bank of Georgia Holdings PLC Annual Report 2012 129
6. Segment Information (continued)The following tables present income statement and certain asset and liability information regarding the Group’s operating segments as at and for the year ended 31 December 2012:
Strategic Synergistic Non-Core
Corporate banking
Retail banking
Wealthmanagement
Corporate center Insurance Healthcare
AffordableHousing
BG Capital BNB
LibertyConsumer Other
Inter- segment
transactions and balances Total
Net interest income (expense) 92,276 174,360 12,644 – 1,825 (6,481) 147 21 12,074 (578) (2,171) – 284,117Net fees and commission income (expense) 28,701 53,563 523 (581) (107) – 196 456 3,809 (61) (12) – 86,487Net insurance revenue – – – – 29,661 – – – – – – 4,477 34,138Net healthcare revenue – – – – – 29,768 – – – – – (6,422) 23,346Net revenue from sale of goods – – – – – – 2,936 – – 7,729 – – 10,665Net gains (losses) from foreign currencies 29,819 14,985 682 – 238 (1,090) (145) (64) 5,306 (154) (6) – 49,571Other revenues 3,996 3,365 73 – 1,000 257 1,442 240 68 217 1,630 (2,357) 9,931
Revenue 154,792 246,273 13,922 (581) 32,617 22,454 4,576 653 21,257 7,153 (559) (4,302) 498,255
Operating expenses (51,323) (109,041) (4,665) (2,613) (17,437) (17,917) (2,381) (1,155) (10,327) (5,934) (2,661) 4,302 (221,152)
Operating income before cost of credit risk 103,469 137,232 9,257 (3,194) 15,180 4,537 2,195 (502) 10,930 1,219 (3,220) – 277,103
Cost of credit risk (29,490) (12,482) 727 – (1,502) (802) (219) – (1,306) (136) – 493 (44,717)
Net operating income 73,979 124,750 9,984 (3,194) 13,678 3,735 1,976 (502) 9,624 1,083 (3,220) 493 232,386
Net non-operating (expenses) income (8,415) (6,828) (305) – – 440 282 – (443) (4,365) – – (19,634)
Profit before income tax (expense) benefit 65,564 117,922 9,679 (3,194) 13,678 4,175 2,258 (502) 9,181 (3,282) (3,220) 493 212,752
Income tax (expense) benefit (9,936) (16,392) (1,339) – (2,068) (242) (307) (95) (2,367) (889) 435 – (33,200)
Profit for the year 55,628 101,530 8,340 (3,194) 11,610 3,933 1,951 (597) 6,814 (4,171) (2,785) 493 179,552
Assets and liabilitiesTotal assets 2,573,498 2,474,052 43,169 18,716 186,717 170,415 105,899 22,394 185,859 37,924 21,951 (184,999) 5,655,595Total liabilities 1,974,163 1,708,617 605,183 2,335 151,287 113,203 42,838 16,431 139,356 12,114 17,049 (186,493) 4,596,083
Other segment informationProperty and equipment 5,886 20,593 438 – 3,581 25,769 203 197 340 1,616 1,563 – 60,186Intangible assets 906 3,678 50 – 441 150 20 3 186 266 1 – 5,701
Capital expenditure 6,792 24,271 488 – 4,022 25,919 223 200 526 1,882 1,564 – 65,887Depreciation (4,160) (14,412) (316) – (699) (3,342) (121) (15) (910) (940) (112) – (25,027)Amortisation (667) (2,643) (37) – (101) – – (6) (116) (6) (3) – (3,579)Impairment – (15) – – – – – – – (939) – – (954)Investments in associates – – – – – – – – – 2,441 – – 2,441Share of loss of associates – – – – – – – – – (149) – – (149)

130 Bank of Georgia Holdings PLC Annual Report 2012
6. Segment Information (continued)The following tables present income statement and certain asset and liability information regarding the Group’s operating segments as at and for the year ended 31 December 2011:
Strategic Synergistic Non-Core
Corporate banking
Retail banking
Wealthmanagement
Corporate center Insurance Healthcare
Affordable Housing
BG Capital BNB*
LibertyConsumer Other
Inter- segment
transactions and balances Total
Net interest income (expense) 77,900 144,396 6,000 – (249) (143) (805) 205 13,183 (1,202) – – 239,285Net fees and commission income 20,559 49,512 604 – – – – 2,634 2,028 – – – 75,337Net insurance revenue – – – – 17,725 – – – – – – 13 17,738Net healthcare revenue – – – – – 4,358 – – – – – (1,900) 2,458Net revenue from sale of goods – – – – – – – – – 10,361 – – 10,361Net gains (losses) from foreign currencies 27,383 12,992 740 – (779) – (51) 685 35,764 (293) – – 76,441Other revenues 5,275 3,996 24 – 1,294 802 3,378 196 (15) 710 85 (3,612) 12,133
Revenue 131,117 210,896 7,368 – 17,991 5,017 2,522 3,720 50,960 9,576 85 (5,499) 433,753
Operating expenses (56,282) (107,936) (3,967) – (12,382) (3,582) (2,029) (4,792) (13,321) (11,110) (263) 5,599 (210,165)
Operating income before cost of credit risk 74,835 102,960 3,401 – 5,609 1,435 493 (1,072) 37,639 (1,534) (178) – 223,588
Cost of credit risk (21,553) 2,575 87 – (1,885) – (32) – (1,398) (335) – 345 (22,196)
Net operating income 53,282 105,535 3,488 – 3,724 1,435 461 (1,072) 36,241 (1,869) (178) 345 201,392
Net non-operating (expenses) income (6,318) (6,224) (197) – 702 1,402 8 – (18,225) (486) – – (29,338)
Profit before income tax (expense) benefit from continuing operations 46,964 99,311 3,291 – 4,426 2,837 469 (1,072) 18,016 (2,355) (178) 345 172,054
Income tax (expense) benefit (4,896) (9,582) (318) – (702) (43) 178 31 (6,009) 36 180 – (21,125)
Profit for the period from continuing operations 42,068 89,729 2,973 – 3,724 2,794 647 (1,041) 12,007 (2,319) 2 345 150,929
Net loss from discontinued operations (7,807) (7,183) (229) – – – – – – – – – (15,219)
Profit for the year 34,261 82,546 2,744 – 3,724 2,794 647 (1,041) 12,007 (2,319) 2 345 135,710
Assets and liabilitiesTotal assets 2,181,069 2,166,428 40,447 6,596 98,832 73,378 74,620 20,319 94,328 45,367 534 (136,657) 4,665,261Total liabilities 2,014,512 1,278,311 454,178 1,163 76,891 50,862 32,125 13,394 56,947 11,926 7 (137,658) 3,852,658
Other segment informationProperty and equipment 12,992 34,638 663 – 1,814 13,085 11,233 89 1,418 831 – – 76,763Intangible assets 1,524 4,283 77 – 267 29 15 12 168 68 – – 6,443
Capital expenditure 14,516 38,921 740 – 2,081 13,114 11,248 101 1,586 899 – – 83,206Depreciation 5,342 14,283 255 – 679 208 71 120 1,641 994 – – 23,593Amortisation 822 2,572 38 – 48 – – 17 161 3 – – 3,661Impairment – – – 23,394 – – – – – – – – 23,394Investments in associates – – – – – – – – – 3,014 – – 3,014Share of loss of associates – – – – – – – – – (487) – – (487)
* JSC Belarusky Narodny Bank (BNB) and JSC BG BANK (BGB).
(Thousands of Georgian Lari)
Financial Statements: Notes to consolidated financial statements continued

OverviewPerform
anceGovernance
Financial Statements
Additional Information
Bank of Georgia Holdings PLC Annual Report 2012 131
6. Segment Information (continued)The following tables present income statement and certain asset and liability information regarding the Group’s operating segments as at and for the year ended 31 December 2011:
Strategic Synergistic Non-Core
Corporate banking
Retail banking
Wealthmanagement
Corporate center Insurance Healthcare
Affordable Housing
BG Capital BNB*
LibertyConsumer Other
Inter- segment
transactions and balances Total
Net interest income (expense) 77,900 144,396 6,000 – (249) (143) (805) 205 13,183 (1,202) – – 239,285Net fees and commission income 20,559 49,512 604 – – – – 2,634 2,028 – – – 75,337Net insurance revenue – – – – 17,725 – – – – – – 13 17,738Net healthcare revenue – – – – – 4,358 – – – – – (1,900) 2,458Net revenue from sale of goods – – – – – – – – – 10,361 – – 10,361Net gains (losses) from foreign currencies 27,383 12,992 740 – (779) – (51) 685 35,764 (293) – – 76,441Other revenues 5,275 3,996 24 – 1,294 802 3,378 196 (15) 710 85 (3,612) 12,133
Revenue 131,117 210,896 7,368 – 17,991 5,017 2,522 3,720 50,960 9,576 85 (5,499) 433,753
Operating expenses (56,282) (107,936) (3,967) – (12,382) (3,582) (2,029) (4,792) (13,321) (11,110) (263) 5,599 (210,165)
Operating income before cost of credit risk 74,835 102,960 3,401 – 5,609 1,435 493 (1,072) 37,639 (1,534) (178) – 223,588
Cost of credit risk (21,553) 2,575 87 – (1,885) – (32) – (1,398) (335) – 345 (22,196)
Net operating income 53,282 105,535 3,488 – 3,724 1,435 461 (1,072) 36,241 (1,869) (178) 345 201,392
Net non-operating (expenses) income (6,318) (6,224) (197) – 702 1,402 8 – (18,225) (486) – – (29,338)
Profit before income tax (expense) benefit from continuing operations 46,964 99,311 3,291 – 4,426 2,837 469 (1,072) 18,016 (2,355) (178) 345 172,054
Income tax (expense) benefit (4,896) (9,582) (318) – (702) (43) 178 31 (6,009) 36 180 – (21,125)
Profit for the period from continuing operations 42,068 89,729 2,973 – 3,724 2,794 647 (1,041) 12,007 (2,319) 2 345 150,929
Net loss from discontinued operations (7,807) (7,183) (229) – – – – – – – – – (15,219)
Profit for the year 34,261 82,546 2,744 – 3,724 2,794 647 (1,041) 12,007 (2,319) 2 345 135,710
Assets and liabilitiesTotal assets 2,181,069 2,166,428 40,447 6,596 98,832 73,378 74,620 20,319 94,328 45,367 534 (136,657) 4,665,261Total liabilities 2,014,512 1,278,311 454,178 1,163 76,891 50,862 32,125 13,394 56,947 11,926 7 (137,658) 3,852,658
Other segment informationProperty and equipment 12,992 34,638 663 – 1,814 13,085 11,233 89 1,418 831 – – 76,763Intangible assets 1,524 4,283 77 – 267 29 15 12 168 68 – – 6,443
Capital expenditure 14,516 38,921 740 – 2,081 13,114 11,248 101 1,586 899 – – 83,206Depreciation 5,342 14,283 255 – 679 208 71 120 1,641 994 – – 23,593Amortisation 822 2,572 38 – 48 – – 17 161 3 – – 3,661Impairment – – – 23,394 – – – – – – – – 23,394Investments in associates – – – – – – – – – 3,014 – – 3,014Share of loss of associates – – – – – – – – – (487) – – (487)
* JSC Belarusky Narodny Bank (BNB) and JSC BG BANK (BGB).

132 Bank of Georgia Holdings PLC Annual Report 2012
Financial Statements: Notes to consolidated financial statements continued
(Thousands of Georgian Lari)
6. Segment Information (continued)The following tables present income statement and certain asset and liability information regarding the Group’s operating segments as at and for the year ended 31 December 2010:
Strategic Synergistic Non-Core
TotalCorporate
bankingRetail
bankingWealth
managementCorporate
center Insurance HealthcareAffordable
Housing BG Capital BNB*Liberty
Consumer Other
Inter- segment
transactions and balances
Net interest income (expense) 76,023 112,175 3,054 – (789) 62 (2,590) 548 21,094 (1,059) – – 208,518Net fees and commission income 16,152 42,475 487 – 86 – – 1,270 2,950 – – – 63,420Net insurance revenue – – – – 15,808 – – – – – – 855 16,663Net healthcare revenue – – – – – 3,238 – – – – – (2,662) 576Net revenue from sale of goods – – – – – – – – – 9,094 – – 9,094Net gains (losses) from foreign currencies 21,382 9,233 641 – 267 – (2,539) 2,057 2,646 (92) 154 – 33,749Other revenues 2,965 5,343 139 – 376 218 3,173 3,085 495 (456) – (2,357) 12,981
Revenue 116,522 169,226 4,321 – 15,748 3,518 (1,956) 6,960 27,185 7,487 154 (4,164) 345,001
Operating expenses (43,011) (98,404) (4,876) – (11,112) (1,934) (1,791) (5,406) (26,288) (9,476) (1) 4,164 (198,135)
Operating income before cost of credit risk 73,511 70,822 (555) – 4,636 1,584 (3,747) 1,554 897 (1,989) 153 – 146,866
Cost of credit risk (11,517) (29,574) 2,630 – (540) – – – (4,502) (3,423) – (772) (47,698)
Net operating income 61,994 41,248 2,075 – 4,096 1,584 (3,747) 1,554 (3,605) (5,412) 153 (772) 99,168
Net non-operating (expenses) income (393) (570) (17) – – – – – – 255 – – (725)
Profit before income tax (expense) benefit 61,601 40,678 2,058 – 4,096 1,584 (3,747) 1,554 (3,605) (5,157) 153 (772) 98,443
Income tax (expense) benefit (9,878) (5,936) (338) – (630) (32) 128 78 38 806 (12) – (15,776)
Profit for the year 51,723 34,742 1,720 – 3,466 1,552 (3,619) 1,632 (3,567) (4,351) 141 (772) 82,667
Assets and liabilitiesTotal assets 1,718,334 1,743,326 43,083 – 77,357 11,523 33,594 20,843 378,392 47,278 2 (68,810) 4,004,922Total liabilities 1,577,555 1,184,560 261,638 – 58,893 4,673 3,355 11,975 264,600 13,786 11 (69,465) 3,311,581Other segment informationProperty and equipment 6,157 19,006 482 – 401 2,889 34 144 6,743 578 – – 36,434Intangible assets 1,347 3,540 85 – 35 4 6 3 355 3,473 – – 8,848
Capital expenditure 7,504 22,546 567 – 436 2,893 40 147 7,098 4,051 – – 45,282Depreciation (5,523) (15,479) (487) – (482) (152) (125) (163) (1,190) (909) – – (24,510)Amortisation (644) (2,387) (49) – (29) – – (29) (305) (10) – – (3,453)Impairment (120) (307) (8) – – – – – – – – – (435)Investments in associates – – – – – – – – – 5,632 – – 5,632Share of profit of associates – – – – – – – – – 255 – – 255
* JSC Belarusky Narodny Bank (BNB) and JSC BG BANK (BGB).

OverviewPerform
anceGovernance
Financial Statements
Additional Information
Bank of Georgia Holdings PLC Annual Report 2012 133
6. Segment Information (continued)The following tables present income statement and certain asset and liability information regarding the Group’s operating segments as at and for the year ended 31 December 2010:
Strategic Synergistic Non-Core
TotalCorporate
bankingRetail
bankingWealth
managementCorporate
center Insurance HealthcareAffordable
Housing BG Capital BNB*Liberty
Consumer Other
Inter- segment
transactions and balances
Net interest income (expense) 76,023 112,175 3,054 – (789) 62 (2,590) 548 21,094 (1,059) – – 208,518Net fees and commission income 16,152 42,475 487 – 86 – – 1,270 2,950 – – – 63,420Net insurance revenue – – – – 15,808 – – – – – – 855 16,663Net healthcare revenue – – – – – 3,238 – – – – – (2,662) 576Net revenue from sale of goods – – – – – – – – – 9,094 – – 9,094Net gains (losses) from foreign currencies 21,382 9,233 641 – 267 – (2,539) 2,057 2,646 (92) 154 – 33,749Other revenues 2,965 5,343 139 – 376 218 3,173 3,085 495 (456) – (2,357) 12,981
Revenue 116,522 169,226 4,321 – 15,748 3,518 (1,956) 6,960 27,185 7,487 154 (4,164) 345,001
Operating expenses (43,011) (98,404) (4,876) – (11,112) (1,934) (1,791) (5,406) (26,288) (9,476) (1) 4,164 (198,135)
Operating income before cost of credit risk 73,511 70,822 (555) – 4,636 1,584 (3,747) 1,554 897 (1,989) 153 – 146,866
Cost of credit risk (11,517) (29,574) 2,630 – (540) – – – (4,502) (3,423) – (772) (47,698)
Net operating income 61,994 41,248 2,075 – 4,096 1,584 (3,747) 1,554 (3,605) (5,412) 153 (772) 99,168
Net non-operating (expenses) income (393) (570) (17) – – – – – – 255 – – (725)
Profit before income tax (expense) benefit 61,601 40,678 2,058 – 4,096 1,584 (3,747) 1,554 (3,605) (5,157) 153 (772) 98,443
Income tax (expense) benefit (9,878) (5,936) (338) – (630) (32) 128 78 38 806 (12) – (15,776)
Profit for the year 51,723 34,742 1,720 – 3,466 1,552 (3,619) 1,632 (3,567) (4,351) 141 (772) 82,667
Assets and liabilitiesTotal assets 1,718,334 1,743,326 43,083 – 77,357 11,523 33,594 20,843 378,392 47,278 2 (68,810) 4,004,922Total liabilities 1,577,555 1,184,560 261,638 – 58,893 4,673 3,355 11,975 264,600 13,786 11 (69,465) 3,311,581Other segment informationProperty and equipment 6,157 19,006 482 – 401 2,889 34 144 6,743 578 – – 36,434Intangible assets 1,347 3,540 85 – 35 4 6 3 355 3,473 – – 8,848
Capital expenditure 7,504 22,546 567 – 436 2,893 40 147 7,098 4,051 – – 45,282Depreciation (5,523) (15,479) (487) – (482) (152) (125) (163) (1,190) (909) – – (24,510)Amortisation (644) (2,387) (49) – (29) – – (29) (305) (10) – – (3,453)Impairment (120) (307) (8) – – – – – – – – – (435)Investments in associates – – – – – – – – – 5,632 – – 5,632Share of profit of associates – – – – – – – – – 255 – – 255
* JSC Belarusky Narodny Bank (BNB) and JSC BG BANK (BGB).
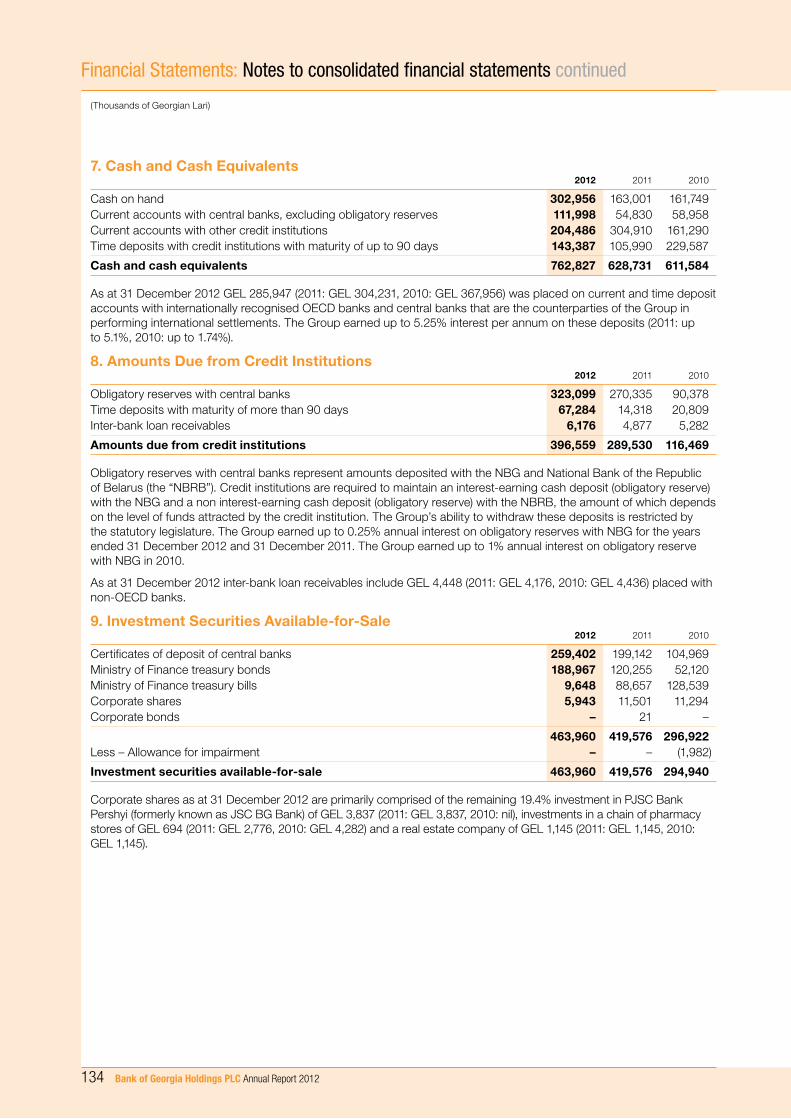
134 Bank of Georgia Holdings PLC Annual Report 2012
Financial Statements: Notes to consolidated financial statements continued
(Thousands of Georgian Lari)
7. Cash and Cash Equivalents2012 2011 2010
Cash on hand 302,956 163,001 161,749Current accounts with central banks, excluding obligatory reserves 111,998 54,830 58,958Current accounts with other credit institutions 204,486 304,910 161,290Time deposits with credit institutions with maturity of up to 90 days 143,387 105,990 229,587
Cash and cash equivalents 762,827 628,731 611,584
As at 31 December 2012 GEL 285,947 (2011: GEL 304,231, 2010: GEL 367,956) was placed on current and time deposit accounts with internationally recognised OECD banks and central banks that are the counterparties of the Group in performing international settlements. The Group earned up to 5.25% interest per annum on these deposits (2011: up to 5.1%, 2010: up to 1.74%).
8. Amounts Due from Credit Institutions2012 2011 2010
Obligatory reserves with central banks 323,099 270,335 90,378Time deposits with maturity of more than 90 days 67,284 14,318 20,809Inter-bank loan receivables 6,176 4,877 5,282
Amounts due from credit institutions 396,559 289,530 116,469
Obligatory reserves with central banks represent amounts deposited with the NBG and National Bank of the Republic of Belarus (the “NBRB”). Credit institutions are required to maintain an interest-earning cash deposit (obligatory reserve) with the NBG and a non interest-earning cash deposit (obligatory reserve) with the NBRB, the amount of which depends on the level of funds attracted by the credit institution. The Group’s ability to withdraw these deposits is restricted by the statutory legislature. The Group earned up to 0.25% annual interest on obligatory reserves with NBG for the years ended 31 December 2012 and 31 December 2011. The Group earned up to 1% annual interest on obligatory reserve with NBG in 2010.
As at 31 December 2012 inter-bank loan receivables include GEL 4,448 (2011: GEL 4,176, 2010: GEL 4,436) placed with non-OECD banks.
9. Investment Securities Available-for-Sale2012 2011 2010
Certificates of deposit of central banks 259,402 199,142 104,969Ministry of Finance treasury bonds 188,967 120,255 52,120Ministry of Finance treasury bills 9,648 88,657 128,539Corporate shares 5,943 11,501 11,294Corporate bonds – 21 –
463,960 419,576 296,922Less – Allowance for impairment – – (1,982)
Investment securities available-for-sale 463,960 419,576 294,940
Corporate shares as at 31 December 2012 are primarily comprised of the remaining 19.4% investment in PJSC Bank Pershyi (formerly known as JSC BG Bank) of GEL 3,837 (2011: GEL 3,837, 2010: nil), investments in a chain of pharmacy stores of GEL 694 (2011: GEL 2,776, 2010: GEL 4,282) and a real estate company of GEL 1,145 (2011: GEL 1,145, 2010: GEL 1,145).
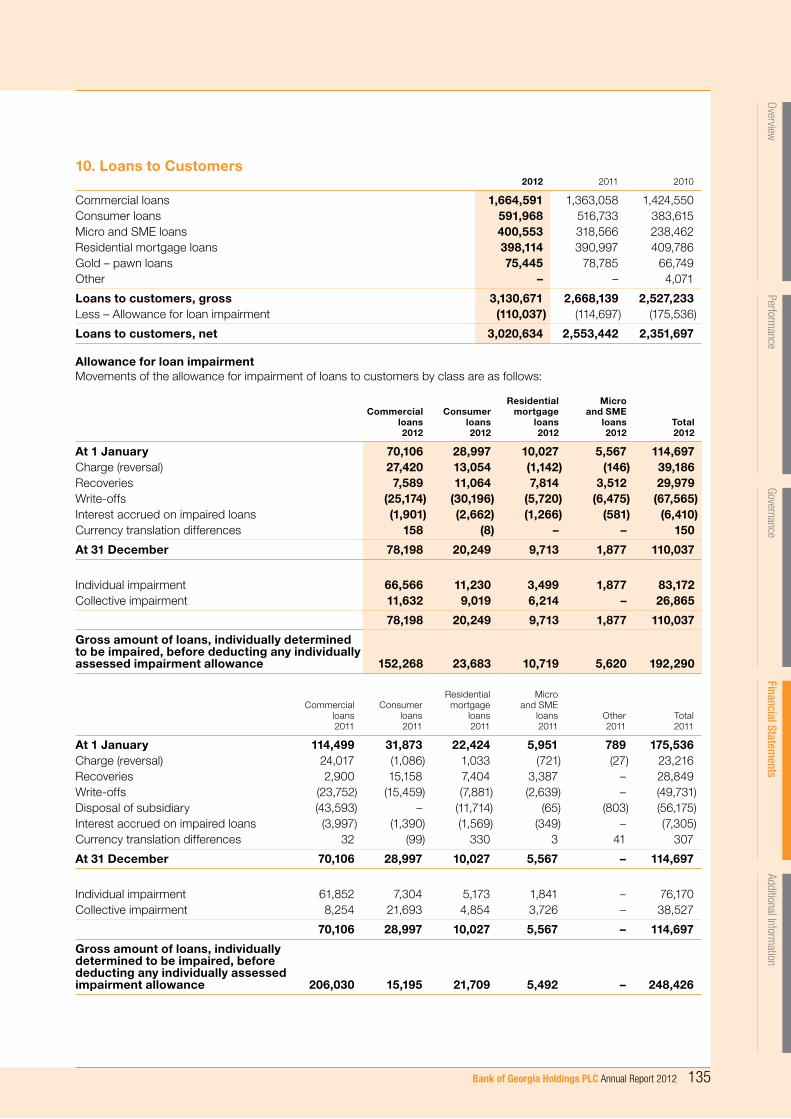
OverviewPerform
anceGovernance
Financial Statements
Additional Information
Bank of Georgia Holdings PLC Annual Report 2012 135
10. Loans to Customers2012 2011 2010
Commercial loans 1,664,591 1,363,058 1,424,550Consumer loans 591,968 516,733 383,615Micro and SME loans 400,553 318,566 238,462Residential mortgage loans 398,114 390,997 409,786Gold – pawn loans 75,445 78,785 66,749Other – – 4,071
Loans to customers, gross 3,130,671 2,668,139 2,527,233Less – Allowance for loan impairment (110,037) (114,697) (175,536)
Loans to customers, net 3,020,634 2,553,442 2,351,697
Allowance for loan impairmentMovements of the allowance for impairment of loans to customers by class are as follows:
Commercialloans2012
Consumerloans2012
Residentialmortgage
loans2012
Microand SME
loans2012
Total2012
At 1 January 70,106 28,997 10,027 5,567 114,697Charge (reversal) 27,420 13,054 (1,142) (146) 39,186Recoveries 7,589 11,064 7,814 3,512 29,979Write-offs (25,174) (30,196) (5,720) (6,475) (67,565)Interest accrued on impaired loans (1,901) (2,662) (1,266) (581) (6,410)Currency translation differences 158 (8) – – 150
At 31 December 78,198 20,249 9,713 1,877 110,037
Individual impairment 66,566 11,230 3,499 1,877 83,172Collective impairment 11,632 9,019 6,214 – 26,865
78,198 20,249 9,713 1,877 110,037
Gross amount of loans, individually determined to be impaired, before deducting any individually assessed impairment allowance 152,268 23,683 10,719 5,620 192,290
Commercialloans2011
Consumerloans2011
Residentialmortgage
loans2011
Microand SME
loans2011
Other2011
Total2011
At 1 January 114,499 31,873 22,424 5,951 789 175,536Charge (reversal) 24,017 (1,086) 1,033 (721) (27) 23,216Recoveries 2,900 15,158 7,404 3,387 – 28,849Write-offs (23,752) (15,459) (7,881) (2,639) – (49,731)Disposal of subsidiary (43,593) – (11,714) (65) (803) (56,175)Interest accrued on impaired loans (3,997) (1,390) (1,569) (349) – (7,305)Currency translation differences 32 (99) 330 3 41 307
At 31 December 70,106 28,997 10,027 5,567 – 114,697
Individual impairment 61,852 7,304 5,173 1,841 – 76,170Collective impairment 8,254 21,693 4,854 3,726 – 38,527
70,106 28,997 10,027 5,567 – 114,697
Gross amount of loans, individually determined to be impaired, before deducting any individually assessed impairment allowance 206,030 15,195 21,709 5,492 – 248,426

136 Bank of Georgia Holdings PLC Annual Report 2012
Financial Statements: Notes to consolidated financial statements continued
(Thousands of Georgian Lari)
10. Loans to Customers (continued)
Commercial loans2010
Consumer loans2010
Residentialmortgage
loans2010
Microand SME
loans2010
Others2010
Total2010
At 1 January 82,042 54,989 23,490 3,788 2,177 166,486
Charge (reversal) 23,932 7,571 18,440 1,474 (1,531) 49,886
Recoveries 21,090 15,208 3,249 3,150 42 42,739
Write-offs (13,074) (42,798) (19,441) (2,138) – (77,451)
Interest accrued on impaired loans (1,392) (3,306) (3,681) (360) – (8,739)
Currency translation differences 1,901 209 367 37 101 2,615
At 31 December 114,499 31,873 22,424 5,951 789 175,536
Individual impairment 68,145 13,148 16,606 2,433 315 100,647
Collective impairment 46,354 18,725 5,818 3,518 474 74,889
114,499 31,873 22,424 5,951 789 175,536
Gross amount of loans, individually determined to be impaired, before deducting any individually assessed impairment allowance 192,778 21,996 51,585 9,051 973 276,383
Individually impaired loansInterest income accrued on loans, for which individual impairment allowances have been recognised as at 31 December 2012 comprised GEL 13,844 (2011: GEL 14,914, 2010: GEL 18,640).
Collateral and other credit enhancements The amount and type of collateral required depends on an assessment of the credit risk of the counterparty. Guidelines are implemented regarding the acceptability of types of collateral and valuation parameters.
The main types of collateral obtained are as follows:
– For commercial lending, charges over real estate properties, equipment and machinery, corporate shares, inventory, trade receivables and third party corporate guarantees.
– For retail lending, mortgages over residential properties, cars, gold and jewellery and third party corporate guarantees.
Management requests additional collateral in accordance with the underlying agreement and monitors the market value of collateral obtained during its review of the adequacy of the allowance for loan impairment.
Concentration of loans to customersAs at 31 December 2012, the concentration of loans granted by the Group to the ten largest third party borrowers comprised GEL 544,466 accounting for 17% of the gross loan portfolio of the Group (2011: GEL 402,989 and 15% respectively, 2010: GEL 383,971 and 15% respectively). An allowance of GEL 20,702 (2011: GEL 7,033, 2010: GEL 3,837) was established against these loans.
As at 31 December 2012, the concentration of loans granted by the Group to the ten largest third party group of borrowers comprised GEL 791,529 accounting for 25% of the gross loan portfolio of the Group (2011: GEL 523,401 and 20% respectively, 2010: GEL 484,034 and 19% respectively). An allowance of GEL 7,118 (2011: GEL 10,980, 2010: GEL 17,479) was established against these loans.

OverviewPerform
anceGovernance
Financial Statements
Additional Information
Bank of Georgia Holdings PLC Annual Report 2012 137
Concentration of loans to customers (continued)As at 31 December 2012, 31 December 2011 and 31 December 2010 loans are principally issued within Georgia, and their distribution by industry sector was as follows:
2012 2011 2010
Individuals 1,233,614 1,132,740 1,006,046Trade and services 1,053,579 972,290 858,878Construction and development 218,103 228,412 274,623Mining 347,505 122,771 137,583Transport and communication 93,028 83,289 77,792Energy 28,296 65,360 62,424Agriculture 94,286 8,709 18,089Others 62,260 54,568 91,798
Loans to customers, gross 3,130,671 2,668,139 2,527,233Less – allowance for loan impairment (110,037) (114,697) (175,536)
Loans to customers, net 3,020,634 2,553,442 2,351,697
Loans have been extended to the following types of customers:
2012 2011 2010
Private companies 1,783,083 1,492,124 1,488,577Individuals 1,233,614 1,132,740 1,006,046State-owned entities 113,974 43,275 32,610
Loans to customers, gross 3,130,671 2,668,139 2,527,233Less – allowance for loan impairment (110,037) (114,697) (175,536)
Loans to customers, net 3,020,634 2,553,442 2,351,697
The following is a reconciliation of the individual and collective allowances for impairment losses on loans to customers for the years ended 31 December 2012, 31 December 2011 and 31 December 2010:
2012 2011 2010
Individual impairment
Collectiveimpairment Total
Individualimpairment
Collectiveimpairment Total
Individualimpairment
Collectiveimpairment Total
2012 2012 2012 2011 2011 2011 2010 2010 2010
At 1 January 76,170 38,527 114,697 100,647 74,889 175,536 140,894 25,592 166,486Charge (reversal) for the year 27,606 11,580 39,186 20,135 3,081 23,216 (8,950) 58,836 49,886Recoveries 21,296 8,683 29,979 16,563 12,286 28,849 25,247 17,492 42,739Write-offs (38,200) (29,365) (67,565) (39,342) (10,389) (49,731) (54,534) (22,917) (77,451)Disposal of subsidiary – – – (16,110) (40,065) (56,175) – – –Interest accrued on impaired loans to customers (3,853) (2,557) (6,410) (6,094) (1,211) (7,305) (7,216) (1,523) (8,739)Currency translation differences 153 (3) 150 371 (64) 307 5,206 (2,591) 2,615
At 31 December 83,172 26,865 110,037 76,170 38,527 114,697 100,647 74,889 175,536

138 Bank of Georgia Holdings PLC Annual Report 2012
(Thousands of Georgian Lari)
Financial Statements: Notes to consolidated financial statements continued
11. Finance Lease Receivables2012 2011 2010
Minimum lease payments receivable 88,416 82,682 18,521Less – Unearned finance lease income (16,223) (19,323) (3,514)
72,193 63,359 15,007Less – Allowance for impairment (507) (440) (588)
Finance lease receivables, net 71,686 62,919 14,419
The difference between the minimum lease payments to be received in the future and the finance lease receivables represents unearned finance income.
As at 31 December 2012, the concentration of investment in the largest lease comprised GEL 44,641 or 62% of total finance lease receivables (2011: GEL 47,792 or 75%, 2010: GEL 902 or 6%) and finance income received from it for the year ended 31 December 2012 comprised GEL 3,588 or 41% of total finance income from lease (2011: GEL 2,173 or 33%, 2010: GEL 186 or 4%).
Future minimum lease payments to be received after 31 December 2012, 31 December 2011 and 31 December 2010 are as follows:
2012 2011 2010
Within 1 year 25,425 18,485 10,266From 1 to 5 years 50,982 43,543 8,255More than 5 years 12,009 20,654 –
Minimum lease payment receivables 88,416 82,682 18,521
Movements of the allowance for impairment of finance lease receivables are as follows:
Finance lease receivables
2012
Finance lease receivables
2011
Finance lease receivables
2010
At 1 January 440 588 7,144Charge (Reversal) 495 317 (5,775)Amounts written-off (428) (193) (1,210)Currency translation differences – (272) 429
At 31 December 507 440 588
Individual impairment 102 93 232Collective impairment 405 347 356
507 440 588
Gross amount of lease receivables, individually determined to be impaired, before deducting any individually assessed impairment allowance 1,008 155 –
12. Investment Properties 2012 2011 2010
At 1 January 101,686 113,496 79,509 Additions* 62,138 16,565 35,146 Disposals (15,622) (7,889) (5,490)Disposals through sale of subsidiary – (13,654) –Net gains from revaluation of investment property – 1,984 350Transfers from (to) property and equipment and other assets (Note 13) 12,151 (8,816) 3,981
At 31 December 160,353 101,686 113,496
* Additions comprise foreclosed properties, no cash transactions were involved.

OverviewPerform
anceGovernance
Financial Statements
Additional Information
Bank of Georgia Holdings PLC Annual Report 2012 139
Investment properties are stated at fair value. The fair value represents the amount at which the assets could be exchanged between a knowledgeable, willing buyer and a knowledgeable, willing seller in an arm’s length transaction at the date of valuation, in accordance with International Valuation Standards Committee standards. The date of latest revaluation was 31 December 2011. As at 31 December 2012 the Group analysed market prices for its investment properties and concluded that the market prices were not materially different from their carrying value.
Rental income and direct operating expenses arising from investment properties comprise:
2012 2011 2010
Rental income 2,508 3,188 2,750 Direct operating expenses (102) (225) (136)
The entire amount of direct operating expenses participated in the generation of rental income during the respective years.
13. Property and EquipmentThe movements in property and equipment during the year ended 31 December 2012 were as follows:
Land &buildings
Furniture &fixtures
Computers &equipment
Motorvehicles
Leaseholdimprovements
Assets underconstruction Total
Cost or revalued amount31 December 2011 233,306 107,584 56,659 8,518 7,953 20,694 434,714Acquisition through business combinations (Note 5) 36,359 – 3,302 – – 15,799 55,460Additions 7,354 8,756 16,458 3,230 306 24,082 60,186Disposals (2,226) (2,272) (448) (2,105) (1,266) – (8,317)Disposals through sale of subsidiaries – (6) – (46) – – (52)Transfers 13,593 – – – 864 (14,457) –Transfers to investment properties (1,520) – – – – (10,631) (12,151)Transfers from (to) other assets 10 (14) 6,636 4 – 1,785 8,421Effect of hyperinflation 3,086 210 347 48 60 76 3,827Currency translation differences (1,208) (1,272) (223) (33) (78) (81) (2,895)
31 December 2012 288,754 112,986 82,731 9,616 7,839 37,267 539,193
Accumulated impairment31 December 2011 2,626 37 106 6 – – 2,775Impairment charge – 14 59 – – – 73Disposals through sale of subsidiaries – (15) (7) – – – (22)Effect of hyperinflation – – 123 – – – 123Currency translation differences (437) – (182) – – – (619)
31 December 2012 2,189 36 99 6 – – 2,330
Accumulated depreciation31 December 2011 1,746 43,476 28,913 6,464 3,230 – 83,829Depreciation charge 3,026 11,288 7,536 1,768 1,409 – 25,027Effect of hyperinflation 450 8 22 1 – – 481Currency translation difference (25) 19 71 9 52 – 126Transfers to other assets – (8) (122) – – – (130)Disposals 2 (373) (150) (1,834) (966) – (3,321)Disposals through sale of subsidiaries – (4) – (22) – – (26)
31 December 2012 5,199 54,406 36,270 6,386 3,725 – 105,986
Net book value:31 December 2011 228,934 64,071 27,640 2,048 4,723 20,694 348,110
31 December 2012 281,366 58,544 46,362 3,224 4,114 37,267 430,877

140 Bank of Georgia Holdings PLC Annual Report 2012
(Thousands of Georgian Lari)
Financial Statements: Notes to consolidated financial statements continued
13. Property and Equipment (continued)The movements in property and equipment during the year ended 31 December 2011 were as follows:
Land &buildings
Furniture &fixtures
Computers &equipment
Motorvehicles
Leaseholdimprovements
Assets underconstruction Total
Cost or revalued amount31 December 2010 150,516 100,559 42,183 8,341 7,530 42,766 351,895Acquisition through business combinations 26,055 1,958 9,461 260 – 646 38,380Additions 10,696 11,440 8,467 1,803 328 44,029 76,763Disposals (3,474) (293) (944) (716) (743) (686) (6,856)Disposals through sale of subsidiaries (5,735) (1,876) (1,192) (649) (175) (751) (10,378)Transfers 60,938 252 32 (122) 1,428 (62,528) –Transfers to investment properties (2,500) – – – – – (2,500)Revaluation (1,561) – – – – – (1,561)Effect of hyperinflation 9,474 439 703 153 99 172 11,040Currency translation differences (11,103) (4,895) (2,051) (552) (514) (2,954) (22,069)
31 December 2011 233,306 107,584 56,659 8,518 7,953 20,694 434,714
Accumulated impairment31 December 2010 2,222 262 118 14 – – 2,616Disposals through sale of subsidiaries (1,307) (261) (49) (13) – – (1,630)Effect of hyperinflation 2,186 34 81 7 – – 2,308Currency translation differences (475) 2 (44) (2) – – (519)
31 December 2011 2,626 37 106 6 – – 2,775
Accumulated depreciation31 December 2010 1,629 32,192 21,901 5,187 2,518 – 63,427Depreciation charge 2,204 11,626 6,447 1,951 1,365 – 23,593Effect of hyperinflation 35 112 286 55 9 – 497Currency translation differences (1,594) (47) 1,080 (20) (86) – (667)Disposals (83) (283) (694) (673) (546) – (2,279)Disposals through sale of subsidiaries (100) (124) (107) (36) (30) – (397)Revaluation (345) – – – – – (345)
31 December 2011 1,746 43,476 28,913 6,464 3,230 – 83,829
Net book value:31 December 2010 146,665 68,105 20,164 3,140 5,012 42,766 285,852
31 December 2011 228,934 64,071 27,640 2,048 4,723 20,694 348,110

OverviewPerform
anceGovernance
Financial Statements
Additional Information
Bank of Georgia Holdings PLC Annual Report 2012 141
The movements in property and equipment during the year ended 31 December 2010 were as follows:
Land &buildings
Furniture &fixtures
Computers &equipment
Motorvehicles
Leaseholdimprovements
Assets underconstruction Total
Cost or revalued amount31 December 2009 137,705 90,082 34,753 7,622 7,870 55,719 333,751Acquisition through business combinations 3,171 258 4,628 269 – 370 8,696Additions 805 11,250 2,824 585 830 20,140 36,434Disposals (2,224) (3,843) (643) (607) (2,315) (11,762) (21,394)Transfers 21,929 (17) (19) 196 994 (23,083) –Transfers to investment properties (3,714) – – – – (267) (3,981)Revaluation (9,365) – – – – – (9,365)Currency translation differences 2,209 2,829 640 276 151 1,649 7,754
31 December 2010 150,516 100,559 42,183 8,341 7,530 42,766 351,895
Accumulated impairment31 December 2009 3,435 262 200 14 – – 3,911Impairment charge 435 – – – – – 435Disposals (1,648) – (82) – – – (1,730)
31 December 2010 2,222 262 118 14 – – 2,616
Accumulated depreciation31 December 2009 4,463 23,870 16,173 3,680 2,925 – 51,111Depreciation charge 3,891 11,510 6,048 1,715 1,346 – 24,510Currency translation differences 103 31 6 19 – – 159Disposals (322) (3,219) (326) (227) (1,753) – (5,847)Revaluation (6,506) – – – – – (6,506)
31 December 2010 1,629 32,192 21,901 5,187 2,518 – 63,427
Net book value:31 December 2009 129,807 65,950 18,380 3,928 4,945 55,719 278,729
31 December 2010 146,665 68,105 20,164 3,140 5,012 42,766 285,852
Premises of the Group are subject to revaluation on a regular basis. The date of latest revaluation was 31 December 2010. As at 31 December 2012 and 31 December 2011 the Group analysed market prices for its premises and concluded that the market price of premises was not materially different from their carrying value.
If the buildings had been measured using the cost model, the carrying amounts of the buildings as at 31 December 2012, 31 December 2011 and 31 December 2010 would have been as follows:
2012 2011 2010
Cost 219,595 164,151 79,800Accumulated depreciation and impairment (11,465) (8,012) (7,550)
Net carrying amount 208,130 156,139 72,250

142 Bank of Georgia Holdings PLC Annual Report 2012
(Thousands of Georgian Lari)
Financial Statements: Notes to consolidated financial statements continued
14. GoodwillMovements in goodwill during the years ended 31 December 2012, 31 December 2011 and 31 December 2010, were as follows:
2012 2011 2010
Cost 1 January 74,645 142,284 138,849Acquisition through business combinations (Note 5) 482 377 3,435Disposals through sale of subsidiaries (1,020) (68,016) –
31 December 74,107 74,645 142,284
Accumulated impairment1 January 28,450 73,072 73,072Impairment charge 655 23,394 –Disposals through sale of subsidiaries (655) (68,016) –
31 December 28,450 28,450 73,072
Net book value:1 January 46,195 69,212 65,777
31 December 45,657 46,195 69,212
The impairment charge of goodwill in 2012 was in respect of JSC Intertour – GEL 655. The impairment charge of goodwill in 2011 was in respect of JSC Belarusky Narodny Bank – GEL 23,394. The main reason for impairment was insufficient future operating cash flows expected to be received per the forecasts of the respective cash generating units.
Impairment test for goodwillGoodwill acquired through business combinations with indefinite lives have been allocated to four individual cash-generating units, which are also reportable segments, for impairment testing: corporate banking, retail banking, insurance and liberty consumer.
The carrying amount of goodwill allocated to each of the cash-generating units is as follows:
2012 2011 2010
Insurance and Healthcare 19,821 19,339 18,962Retail banking 12,433 12,433 12,433Corporate banking 9,965 9,965 9,965Liberty Consumer 3,438 4,458 4,458BNB and BGB – – 23,394
Total 45,657 46,195 69,212
Key assumptions used in value-in-use calculationsThe recoverable amounts of the cash-generating units have been determined based on a value-in-use calculation, using cash flow projections based on financial budgets approved by senior management covering from one to three-year period. Discount rates were not adjusted for either a constant or a declining growth rate beyond the three-year periods covered in financial budgets.

OverviewPerform
anceGovernance
Financial Statements
Additional Information
Bank of Georgia Holdings PLC Annual Report 2012 143
The following rates were used by the Group for corporate banking and retail banking:
Corporate Banking Retail Banking
2012 %
2011 %
2010 %
2012 %
2011 %
2010%
Discount rate 8.5% 8.5% 8.9% 8.5% 8.5% 8.9%
The following rates were used by the Group for Insurance and Healthcare and Liberty Consumer:
Insurance and Healthcare Liberty Consumer
2012 %
2011 %
2010%
2012 %
2011 %
2010 %
Discount rate 13.3% 13.3% 12.6% 14.5% 14.5% 14.5%
The following rates were used by the Group for BNB and BGB:
BNB and BGB
2011 %
2010 %
Discount rate 8.5% 8.9%
Discount ratesDiscount rates reflect management’s estimate of return of capital employed (ROCE) required in each business. This is the benchmark used by management to assess operating performance and to evaluate future investment proposals. Discount rates are calculated by using WACC.

144 Bank of Georgia Holdings PLC Annual Report 2012
(Thousands of Georgian Lari)
Financial Statements: Notes to consolidated financial statements continued
15. TaxationThe corporate income tax (expense) benefit comprises:
2012 2011 2010
Current income tax (expense) benefit (23,469) 4,985 (12,365)Deferred income tax expense (9,731) (2,923) (3,411)
Income tax (expense) benefit (33,200) 2,062 (15,776)
Income tax expense attributable to continuing operations (33,200) (21,125) (15,776)Income tax benefit attributable to a discontinued operation – 23,187 –
Deferred income tax benefit from continuing operations in other comprehensive (loss) income 690 5,581 206Deferred income tax benefit from discontinued operations in other comprehensive (loss) income – 625 –
Total deferred income tax benefit recognised in other comprehensive (loss) income 690 6,206 206
Deferred tax related to items charged or credited to other comprehensive income during the years ended 31 December 2012, 2011 and 2010 was as follows:
2012 2011 2010
Currency translation differences 654 6,175 –Net losses on investment securities available-for-sale 36 124 146Revaluation of buildings – (93) (58)Other – – 118
Income tax benefit to other comprehensive income 690 6,206 206
The income tax rate applicable to most of the Group’s income is the income tax rate applicable to subsidiaries’ income which ranges from 15% to 23% (2011: from 15% to 23%, 2010: from 15% to 26%). A reconciliation between the expected and the actual taxation charge is provided below.

OverviewPerform
anceGovernance
Financial Statements
Additional Information
Bank of Georgia Holdings PLC Annual Report 2012 145
The effective income tax rate differs from the statutory income tax rates. As at 31 December 2012, 31 December 2011 and 31 December 2010 a reconciliation of the income tax expense based on statutory rates with the actual expense was as follows:
2012 2011 2010
Profit before income tax (expense) benefit from continuing operations 212,752 172,054 98,443Net loss before income tax benefit from discontinued operations – (38,406) –Profit before income tax (expense) benefit 212,752 133,648 98,443Statutory tax rate 15% 15% 15%
Theoretical income tax expense at statutory tax rate (31,913) (20,047) (14,766)Tax at the domestic rates applicable to profits in the respective country (1,417) (2,050) (291)Correction of prior year declarations – 8,408 –Loss on disposal of subsidiary* – 18,593 –Other operating income – – 229State securities at lower tax rates – – 564Non-deductible expenses – (3,509) (1,694)Other 130 667 182
Income tax (expense) benefit (33,200) 2,062 (15,776)
Income tax expense attributable to continuing operations (33,200) (21,125) (15,776)Income tax benefit attributable to a discontinued operation – 23,187 –
Income tax (expense) benefit (33,200) 2,062 (15,776)
* This is loss recognised in tax declaration of 2011 from disposal of PJSC Bank Pershyi (formerly known as JSC BG Bank).
Applicable taxes in Georgia and Belarus include corporate income tax (profit tax), individuals’ withholding taxes, property tax and value added tax, among others. However, regulations are often unclear or non-existent and few precedents have been established. This creates tax risks in Georgia and Belarus, substantially more significant than typically found in countries with more developed tax systems. Management believes that the Group is in substantial compliance with the tax laws affecting its operations. However, the risk remains that relevant authorities could take differing positions with regard to interpretative issues.

146 Bank of Georgia Holdings PLC Annual Report 2012
(Thousands of Georgian Lari)
15. Taxation (continued)Deferred tax assets and liabilities as at 31 December and their movements for the respective years follows:
Origination and reversal of temporary differences
Origination and reversal of temporary differences
Origination and reversal of temporary differences
2009
In theincome
statement
In othercomprehensive
income
Effect ofbusiness
combination 2010
In theincome
statement
In othercomprehensive
income
Effect ofbusiness
combinationDisposal ofsubsidiary 2011
In theincome
statement
In othercomprehensive
incomeDisposal ofsubsidiary 2012
Tax effect of deductible temporary differences:Amounts due to credit institutions – – – – – 1,264 – – – 1,264 (1,209) – – 55Investment securities: available-for-sale 911 20 279 – 1,210 (988) 522 – (7) 737 (749) 19 – 7Loans to customers 10,129 440 – – 10,569 (345) (36) – (10,188) – – – – –Allowance for loan impairment – – – – – 18 (9) – – 9 – (9) – –Allowance for loan impairment – – – – – – – – – – (12) 23 – 11Amounts due to customers – – – – – 26 (13) – – 13 85 – – 98Other insurance liabilities & pension fund obligations – – – – – 275 176 – – 451 (2) (179) – 270Investment properties 1,604 349 – – 1,953 (12) (1,604) – (337) – – – – –Reinsurance assets 372 (117) – – 255 – (27) – – 228 (228) – – –Insurance premiums receivables 1,697 – – – 1,697 – – – – 1,697 (373) – – 1,324Allowances for impairment and provisions for other losses 1,197 867 – – 2,064 – (722) – – 1,342 (283) – – 1,059Tax losses carried forward 19,492 (15,020) – – 4,472 3,714 5,181 – (1,035) 12,332 (2,417) (746) (24) 9,145Finance lease receivables 319 – – – 319 23 (35) – – 307 (34) (14) – 259Intangible assets 264 24 – – 288 28 (135) – – 181 11 – – 192Property and equipment 2,221 (20) 290 78 2,569 (33) (358) – – 2,178 (1,238) (7) – 933Other assets 822 147 34 – 1,003 81 (103) – (13) 968 460 (40) (26) 1,362Other liabilities 1,925 (698) – – 1,227 604 (83) – (218) 1,530 (909) (83) – 538
Gross deferred tax assets 40,953 (14,008) 603 78 27,626 4,655 2,754 – (11,798) 23,237 (6,898) (1,036) (50) 15,253Unrecognised deferred tax assets (131) 131 – – – – – – – – – – – –
Deferred tax assets 40,822 (13,877) 603 78 27,626 4,655 2,754 – (11,798) 23,237 (6,898) (1,036) (50) 15,253
Tax effect of taxable temporary differences:Fair value measurement of securities – 203 – – 203 – (203) – – –Amounts due to credit institutions 1,734 39 – – 1,773 (8) – – (31) 1,734 (1,662) – – 72Amounts due to customers 508 1,078 (119) – 1,467 (7) (8) – (942) 510 (510) – – –Securities available-for-sale 182 249 133 – 564 (1,157) 593 – – – (150) 390 – 240Loans to customers 20,879 (10,314) – – 10,565 (1,452) (91) – – 9,022 (14) – – 9,008Allowance for loan impairment – – – – – 622 (307) – – 315 (11) – – 304Reinsurance assets 27 13 – – 40 – (27) – – 13 63 – – 76Finance lease receivables – – – – – 9 (4) – – 5 (5) – – –Allowances for impairment and provisions for other losses – 770 – – 770 (13) (602) – – 155 (169) 14 – –Other insurance liabilities & pension fund obligations – 7 – – 7 218 179 – – 404 446 – – 850Property and equipment 22,451 (3,756) 348 379 19,422 6,474 (957) 1,167 57 26,163 3,309 310 – 29,782Investment properties 548 20 – – 568 1,697 (1,650) – – 615 (152) (2) – 461Intangible assets 2,412 1,364 – – 3,776 814 (175) – (99) 4,316 571 – – 4,887Other assets 783 (677) 35 – 141 1,163 (256) – – 1,048 399 (203) – 1,244Other liabilities 472 538 – 43 1,053 (782) 56 – – 327 718 (855) (29) 161Deferred tax liabilities 49,996 (10,466) 397 422 40,349 7,578 (3,452) 1,167 (1,015) 44,627 2,833 (346) (29) 47,085
Net deferred tax assets (liabilities) (9,174) (3,411) 206 (344) (12,723) (2,923) 6,206 (1,167) (10,783) (21,390) (9,731) (690) (21) (31,832)
Financial Statements: Notes to consolidated financial statements continued

OverviewPerform
anceGovernance
Financial Statements
Additional Information
Bank of Georgia Holdings PLC Annual Report 2012 147
15. Taxation (continued)Deferred tax assets and liabilities as at 31 December and their movements for the respective years follows:
Origination and reversal of temporary differences
Origination and reversal of temporary differences
Origination and reversal of temporary differences
2009
In theincome
statement
In othercomprehensive
income
Effect ofbusiness
combination 2010
In theincome
statement
In othercomprehensive
income
Effect ofbusiness
combinationDisposal ofsubsidiary 2011
In theincome
statement
In othercomprehensive
incomeDisposal ofsubsidiary 2012
Tax effect of deductible temporary differences:Amounts due to credit institutions – – – – – 1,264 – – – 1,264 (1,209) – – 55Investment securities: available-for-sale 911 20 279 – 1,210 (988) 522 – (7) 737 (749) 19 – 7Loans to customers 10,129 440 – – 10,569 (345) (36) – (10,188) – – – – –Allowance for loan impairment – – – – – 18 (9) – – 9 – (9) – –Allowance for loan impairment – – – – – – – – – – (12) 23 – 11Amounts due to customers – – – – – 26 (13) – – 13 85 – – 98Other insurance liabilities & pension fund obligations – – – – – 275 176 – – 451 (2) (179) – 270Investment properties 1,604 349 – – 1,953 (12) (1,604) – (337) – – – – –Reinsurance assets 372 (117) – – 255 – (27) – – 228 (228) – – –Insurance premiums receivables 1,697 – – – 1,697 – – – – 1,697 (373) – – 1,324Allowances for impairment and provisions for other losses 1,197 867 – – 2,064 – (722) – – 1,342 (283) – – 1,059Tax losses carried forward 19,492 (15,020) – – 4,472 3,714 5,181 – (1,035) 12,332 (2,417) (746) (24) 9,145Finance lease receivables 319 – – – 319 23 (35) – – 307 (34) (14) – 259Intangible assets 264 24 – – 288 28 (135) – – 181 11 – – 192Property and equipment 2,221 (20) 290 78 2,569 (33) (358) – – 2,178 (1,238) (7) – 933Other assets 822 147 34 – 1,003 81 (103) – (13) 968 460 (40) (26) 1,362Other liabilities 1,925 (698) – – 1,227 604 (83) – (218) 1,530 (909) (83) – 538
Gross deferred tax assets 40,953 (14,008) 603 78 27,626 4,655 2,754 – (11,798) 23,237 (6,898) (1,036) (50) 15,253Unrecognised deferred tax assets (131) 131 – – – – – – – – – – – –
Deferred tax assets 40,822 (13,877) 603 78 27,626 4,655 2,754 – (11,798) 23,237 (6,898) (1,036) (50) 15,253
Tax effect of taxable temporary differences:Fair value measurement of securities – 203 – – 203 – (203) – – –Amounts due to credit institutions 1,734 39 – – 1,773 (8) – – (31) 1,734 (1,662) – – 72Amounts due to customers 508 1,078 (119) – 1,467 (7) (8) – (942) 510 (510) – – –Securities available-for-sale 182 249 133 – 564 (1,157) 593 – – – (150) 390 – 240Loans to customers 20,879 (10,314) – – 10,565 (1,452) (91) – – 9,022 (14) – – 9,008Allowance for loan impairment – – – – – 622 (307) – – 315 (11) – – 304Reinsurance assets 27 13 – – 40 – (27) – – 13 63 – – 76Finance lease receivables – – – – – 9 (4) – – 5 (5) – – –Allowances for impairment and provisions for other losses – 770 – – 770 (13) (602) – – 155 (169) 14 – –Other insurance liabilities & pension fund obligations – 7 – – 7 218 179 – – 404 446 – – 850Property and equipment 22,451 (3,756) 348 379 19,422 6,474 (957) 1,167 57 26,163 3,309 310 – 29,782Investment properties 548 20 – – 568 1,697 (1,650) – – 615 (152) (2) – 461Intangible assets 2,412 1,364 – – 3,776 814 (175) – (99) 4,316 571 – – 4,887Other assets 783 (677) 35 – 141 1,163 (256) – – 1,048 399 (203) – 1,244Other liabilities 472 538 – 43 1,053 (782) 56 – – 327 718 (855) (29) 161Deferred tax liabilities 49,996 (10,466) 397 422 40,349 7,578 (3,452) 1,167 (1,015) 44,627 2,833 (346) (29) 47,085
Net deferred tax assets (liabilities) (9,174) (3,411) 206 (344) (12,723) (2,923) 6,206 (1,167) (10,783) (21,390) (9,731) (690) (21) (31,832)

148 Bank of Georgia Holdings PLC Annual Report 2012
Financial Statements: Notes to consolidated financial statements continued
(Thousands of Georgian Lari)
16. Other Assets and Other LiabilitiesOther assets comprise:
2012 2011 2010
Insurance premiums receivable 68,947 24,052 21,413Inventory 44,380 27,903 9,828Derivative financial assets 36,784 36,823 2,933Accounts receivable 25,559 24,126 17,093Settlements on operations 10,970 1,972 5,182Operating taxes receivable 9,883 4,683 1,793Reinsurance assets 8,279 8,859 7,307Receivables from money transfers 4,619 4,937 3,358Receivables from documentary operations 2,990 1,026 1,338Assets purchased for finance lease purposes 1,654 1,877 1,434Trading securities owned 971 1,115 1,218Foreclosed assets 900 169 1,049Receivables from sale of assets 872 663 797Operating lease receivables 547 309 266Prepayments for purchase of property and equipment – – 959Assets held-for-sale – – 314Other 18,101 6,556 2,447
235,455 145,070 78,729Less – Allowance for impairment of other assets (14,375) (7,502) (3,309)
Other assets 221,080 137,568 75,420
Inventories mainly comprises GEL 32,458 affordable housing apartments under construction (2011: GEL 19,151, 2010: GEL 3,036), GEL 5,698 medical supplies held by the healthcare segment (2011: GEL 2,368, 2010: GEL 271) and GEL 5,618 of winery business related materials and finished goods (2011: GEL 5,971, 2010: GEL 5,406).
Other liabilities comprise:
2012 2011 2010
Insurance contracts liabilities 79,839 35,009 32,695Deferred income and other accruals 32,167 8,915 3,268Accounts payable 14,350 35,025 2,617Accruals for employee compensation 14,093 40,825 25,111Other insurance liabilities 10,861 8,534 4,431Creditors 9,911 1,751 8,412Pension benefit obligations 8,758 6,353 4,949Derivative financial liabilities 4,867 15,856 17,525Other taxes payable 1,930 2,777 2,418Dividends payable 393 359 303Amounts payable for share acquisitions – 1 259Amounts payable for purchase of intangible assets – – 9Other 8,042 3,057 4,790
Other liabilities 185,211 158,462 106,787

OverviewPerform
anceGovernance
Financial Statements
Additional Information
Bank of Georgia Holdings PLC Annual Report 2012 149
The table below shows the fair values of derivative financial instruments, recorded as assets or liabilities, together with their notional amounts. The notional amount, recorded gross, is the amount of a derivative’s underlying asset or liability, reference rate or index and is the basis upon which changes in the value of derivatives are measured. The notional amounts indicate the volume of transactions outstanding at the year end and are not indicative of the credit risk.
2012
Notionalamount
Fair value
Asset Liability
Interest rate contractsForwards and Swaps – foreign 148,137 – 4,783
Foreign exchange contractsForwards and Swaps – domestic 41,693 542 –Forwards and Swaps – foreign 120,493 35,976 84
Equity/Commodity contractsCall options – foreign 3,313 266 –
Total derivative assets/liabilities 313,636 36,784 4,867
2011 2010
Notionalamount
Fair valueNotional amount
Fair value
Asset Liability Asset Liability
Interest rate contractsForwards and Swaps – foreign 263,309 – 9,542 338,369 – 14,527
Foreign exchange contractsForwards and Swaps – domestic 97,781 275 196 66,058 777 597Forwards and Swaps – foreign 255,348 35,850 5,791 – – –Options – foreign – – – 54,121 1,815 2,211
Equity/Commodity contractsCall options – foreign 5,010 698 – 3,014 341 –
Embedded derivatives from investment deposits – – 327 – – 190
Total derivative assets/liabilities 621,448 36,823 15,856 461,562 2,933 17,525
17. Amounts Due to CustomersThe amounts due to customers include the following:
2012 2011 2010
Time deposits 1,325,544 908,577 953,399Current accounts 1,297,367 1,645,507 1,051,299Promissory notes issued 70,114 181,138 21,610
Amounts due to customers 2,693,025 2,735,222 2,026,308
Held as security against letters of credit and guarantees (Note 19) 31,439 24,353 20,336
As at 31 December 2012, 31 December 2011 and 31 December 2010, promissory notes issued by the Group comprise the notes privately held by financial institutions being effectively equivalents of certificates of deposits with fixed maturity and fixed interest rate. The average effective maturity of the notes was 3 months (2011: 5 months, 2010: 10 months).
At 31 December 2012, amounts due to customers of GEL 462,815 (17%) were due to the 10 largest customers (2011: GEL 580,710 (21%), 2010: GEL 363,420 (18%)).
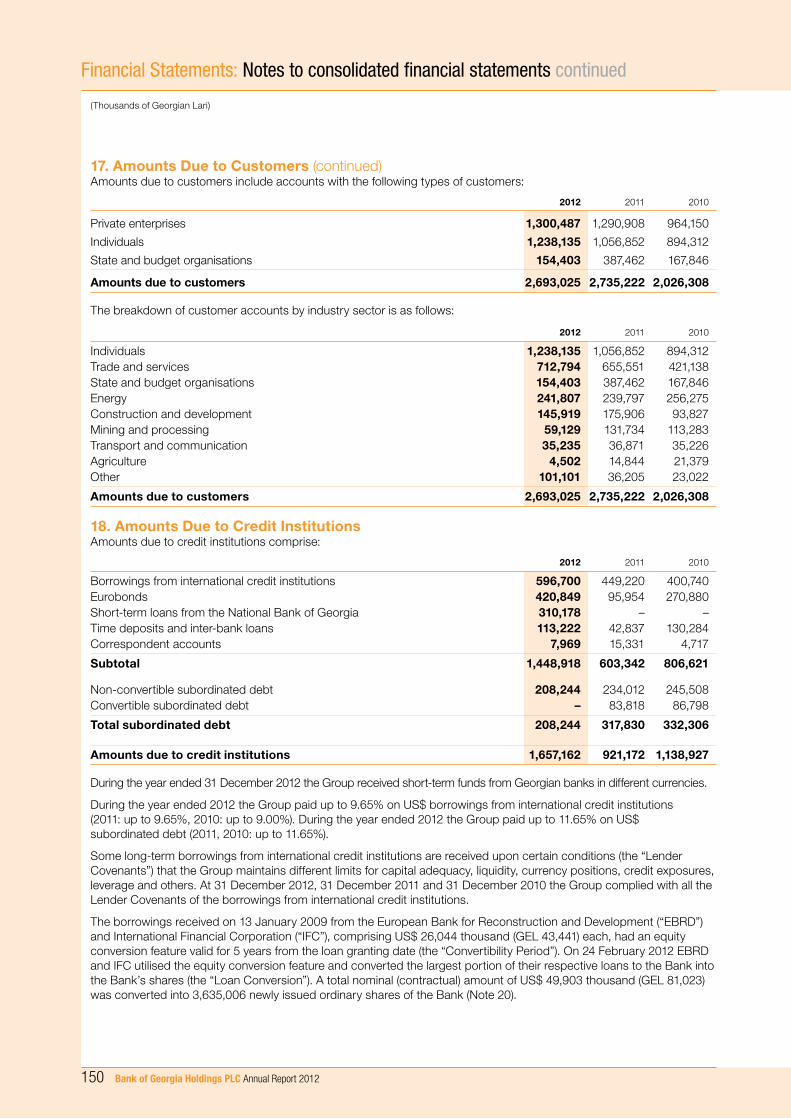
150 Bank of Georgia Holdings PLC Annual Report 2012
(Thousands of Georgian Lari)
Financial Statements: Notes to consolidated financial statements continued
17. Amounts Due to Customers (continued)Amounts due to customers include accounts with the following types of customers:
2012 2011 2010
Private enterprises 1,300,487 1,290,908 964,150
Individuals 1,238,135 1,056,852 894,312
State and budget organisations 154,403 387,462 167,846
Amounts due to customers 2,693,025 2,735,222 2,026,308
The breakdown of customer accounts by industry sector is as follows:
2012 2011 2010
Individuals 1,238,135 1,056,852 894,312Trade and services 712,794 655,551 421,138State and budget organisations 154,403 387,462 167,846Energy 241,807 239,797 256,275Construction and development 145,919 175,906 93,827Mining and processing 59,129 131,734 113,283Transport and communication 35,235 36,871 35,226Agriculture 4,502 14,844 21,379Other 101,101 36,205 23,022
Amounts due to customers 2,693,025 2,735,222 2,026,308
18. Amounts Due to Credit InstitutionsAmounts due to credit institutions comprise:
2012 2011 2010
Borrowings from international credit institutions 596,700 449,220 400,740Eurobonds 420,849 95,954 270,880Short-term loans from the National Bank of Georgia 310,178 – –Time deposits and inter-bank loans 113,222 42,837 130,284Correspondent accounts 7,969 15,331 4,717
Subtotal 1,448,918 603,342 806,621
Non-convertible subordinated debt 208,244 234,012 245,508Convertible subordinated debt – 83,818 86,798
Total subordinated debt 208,244 317,830 332,306
Amounts due to credit institutions 1,657,162 921,172 1,138,927
During the year ended 31 December 2012 the Group received short-term funds from Georgian banks in different currencies.
During the year ended 2012 the Group paid up to 9.65% on US$ borrowings from international credit institutions (2011: up to 9.65%, 2010: up to 9.00%). During the year ended 2012 the Group paid up to 11.65% on US$ subordinated debt (2011, 2010: up to 11.65%).
Some long-term borrowings from international credit institutions are received upon certain conditions (the “Lender Covenants”) that the Group maintains different limits for capital adequacy, liquidity, currency positions, credit exposures, leverage and others. At 31 December 2012, 31 December 2011 and 31 December 2010 the Group complied with all the Lender Covenants of the borrowings from international credit institutions.
The borrowings received on 13 January 2009 from the European Bank for Reconstruction and Development (“EBRD”) and International Financial Corporation (“IFC”), comprising US$ 26,044 thousand (GEL 43,441) each, had an equity conversion feature valid for 5 years from the loan granting date (the “Convertibility Period”). On 24 February 2012 EBRD and IFC utilised the equity conversion feature and converted the largest portion of their respective loans to the Bank into the Bank’s shares (the “Loan Conversion”). A total nominal (contractual) amount of US$ 49,903 thousand (GEL 81,023) was converted into 3,635,006 newly issued ordinary shares of the Bank (Note 20).

OverviewPerform
anceGovernance
Financial Statements
Additional Information
Bank of Georgia Holdings PLC Annual Report 2012 151
In accordance with the terms and conditions of the Loan Participation Notes due to BG Finance B.V. in 2012 (ISIN: XS0283756624; Common Code: 028375662), on 8 February 2012 (the “Maturity Date”) the Notes were redeemed in full. Notes with a par value of US$ 144,493 thousand (GEL 241,347) had been repurchased by the Bank prior to the Maturity Date, recognising a net of GEL 260 gain on early redemptions and the remaining Notes (with a par value of US$ 55,507 thousand, GEL 92,580) were repaid at the Maturity Date.
On 5 July 2012 the Bank completed the issuance of its US$ 250 million (GEL 411 million) 7.75% notes due 2017. The Regulation S/Rule 144A 5-year senior unsecured Notes carry a 7.75% coupon rate per annum, paid semi-annually, and were issued and sold at closing at a price of 99.491% of principal amount. Credit Suisse Securities (Europe) Limited, J.P. Morgan Securities Ltd. and Merrill Lynch International acted as Joint Lead Managers and Bookrunners for the Notes. Dechert LLP and Baker & McKenzie LLP acted as legal advisors to the Joint Lead Managers and the Bank, respectively. The Notes are rated BB- (Fitch)/Ba3 (Moody’s)/BB- (Standard & Poor’s). The Notes are listed on the Official List of the UK Listing Authority and admitted to trading on the London Stock Exchange’s Regulated Market.
19. Commitments and ContingenciesLegalIn the ordinary course of business, the Group is subject to legal actions and complaints. Management believes that the ultimate liability, if any, arising from such actions or complaints will not have a material adverse effect on the financial condition or the results of future operations of the Group.
Financial commitments and contingenciesAs at 31 December 2012, 31 December 2011 and 31 December 2010 the Group’s financial commitments and contingencies comprised the following:
2012 2011 2010
Credit-related commitments
Guarantees issued 502,511 463,393 374,230
Undrawn loan facilities 140,003 120,339 138,057
Letters of credit 100,023 70,224 58,779
742,537 653,956 571,066
Operating lease commitments
Not later than 1 year 5,666 5,040 7,016
Later than 1 year but not later than 5 years 11,722 9,979 13,984
Later than 5 years 2,172 3,122 6,037
19,560 18,141 27,037
Capital expenditure commitments 3,069 47,918 39,523
Less – Cash held as security against letters of credit and guarantees (Note 17) (31,439) (24,353) (20,336)
Less – Provisions (683) (386) (4,407)
Less – Receivables related to letters of credit – (515) –
Financial commitments and contingencies, net 733,044 694,761 612,883
As at 31 December 2012 capital expenditure represented the commitment for purchase of property and capital repairs of GEL 948 and software and other intangible assets of GEL 2,121. As at 31 December 2011 capital expenditures represented the commitment for purchase of property and capital repairs of GEL 41,119 and software and other intangible assets of GEL 6,799. As at 31 December 2010 capital expenditure represented the commitment for purchase of property and capital repairs of GEL 32,311 and software and other intangible assets of GEL 7,212.

152 Bank of Georgia Holdings PLC Annual Report 2012
(Thousands of Georgian Lari)
Financial Statements: Notes to consolidated financial statements continued
20. EquityShare capitalAs at 31 December 2012, issued share capital comprised 35,909,383 common shares, of which 35,909,383 were fully paid (31 December 2011: 43,308,125 authorised common shares, of which 32,877,547 were issued and fully paid, 31 December 2010: 43,308,125 authorised common shares, of which 31,344,860 were issued and fully paid). Each share has a nominal value of one (1) British Penny (31 December 2011 and 31 December 2010: one (1) Georgian Lari). Shares issued and outstanding as at 31 December 2012 are described below:
Number of sharesOrdinary
Amount of sharesOrdinary
31 December 2009 31,306,071 31,306Increase in share capital arising from share-based payments 38,789 39
31 December 2010 31,344,860 31,345Increase in share capital arising from issuance of GDRs 1,500,000 1,500Increase in share capital arising from share-based payments 32,687 33
31 December 2011 32,877,547 32,878
Issue of share capital (Note 18) 3,635,006 3,635Conversion of shares following the Tender Offer* (603,170) (36,513)Share capital adjustment for new nominal value** – 943Effect of translation of equity components to presentation currency – 14
31 December 2012 35,909,383 957
* 603,170 is the number of JSC Bank of Georgia shares that were not converted into Bank of Georgia Holdings PLC shares.
** GEL 943 is the nominal value of 35,909,383 Bank of Georgia Holdings PLC shares translated in GEL with the share conversion date official exchange rate.
On 24 February 2012 EBRD and IFC utilised the convertibility feature and converted US$ 49,903 thousand of their loans to the Bank into the Bank’s shares (Note 18). Total number of ordinary shares issued under this transaction comprised 3,635,006.
On 28 February 2012 the Group completed the Tender Offer under which 35,909,383 of the Bank’s shares then outstanding (or 98.35 per cent) were converted into 35,909,383 shares of BGH (Note 1).
Share capital of the Group was paid by the shareholders in Georgian Lari and they were entitled to dividends in Georgian Lari before the Tender Offer and are entitled to dividends in British Pound Sterling after the Tender Offer.
Capital ReductionFollowing the Admission (Note 1), the Directors of BGH undertook a reduction of capital in order to create distributable reserves for BGH. The original difference between the nominal value of BGH’s shares and the fair value of the Bank’s shares was credited to the merger reserve created in connection with the Tender Offer. It was the intention of BGH’s Directors that the maximum amount of distributable reserves should be created and therefore any merger reserve created in connection with the Tender Offer was capitalised into Class A shares. The Class A shares were allotted pro rata to holders of BGH shares. BGH Directors implemented a Court approved reduction of capital which reduced the original (Tender Offer) nominal value of BGH shares and cancelled all the Class A shares in issue resulting from the capitalisation of the merger reserve.
BGH shares had an original (Tender Offer) nominal value of GBP 6.00 per share. Following the reduction of capital the nominal value of BGH shares was reduced to GBP 0.01. Reduction of the capital created a new reserve on the statement of financial position of BGH (comprising the reduction of the original nominal value from GBP 6.00 to GBP 0.01 per share plus aggregate nominal amount of all of the Class A shares which were cancelled). The reduction of capital is a legal and accounting adjustment and did not, of itself, have any direct impact on the market value of BGH shares.
As a result of the capital reduction in BGH, the Group’s total additional paid-in capital outstanding at the time became distributable to the shareholders and was fully reclassified to retained earnings.
Treasury sharesThe number of treasury shares held by the Group as at 31 December 2012 comprised 2,576,747 (31 December 2011: 3,146,140, 31 December 2010: 1,509,086).

OverviewPerform
anceGovernance
Financial Statements
Additional Information
Bank of Georgia Holdings PLC Annual Report 2012 153
Treasury shares of GEL 69 as at 31 December 2012 comprise the Group’s shares owned by the Group (31 December 2011: GEL 1,208, 31 December 2010: GEL 1,072). Purchases and sales of treasury shares were conducted by BGH’s subsidiaries in the open market – the Bank, JSC BG Capital, BG Trading LLC, Galt and Taggart Holdings Limited LLC, GC Holdings LLC and JSC Insurance Company Aldagi BCI.
During the year ended 31 December 2011, an increase in share capital of GEL 1,500 was made for future share based compensation purposes. As a result, treasury shares amounting to GEL 1,938 as at 31 December 2011 (2010: GEL 438) were kept by the Group’s custodian – Abacus Corporate Trustee Limited, acting as the trustee of the Group. Starting 20 February 2012, all shares of the Bank kept by Abacus Corporate Trustee Limited were converted into the Group’s shares.
During the year ended 31 December 2011, 32,687 ordinary shares of GEL 33 par value and additional paid-in capital of GEL 620 have been vested as compensation to top management (2010: 38,789 ordinary shares of GEL 39 par value and additional paid-in capital of GEL 523).
DividendsOn 7 June 2012, the Directors of Bank of Georgia Holdings PLC declared an interim dividend for 2012 of Georgian Lari 0.7 per share. The currency conversion date was set at 25 June 2012, with the official GEL–GBP exchange rate of 2.5626, resulting in a GBP denominated interim dividend of 0.2732 per share. Payment of the total GEL 23,618 interim dividends was received by shareholders on 2 July 2012.
On 15 June 2011, the annual general meeting of shareholders of JSC Bank of Georgia declared 2011 dividends comprising Georgian Lari 0.3 per share, based on 2010 audited financial results. The declaration is effective from 1 July 2011. Payment of the total GEL 9,169 dividends was received by shareholders on 18 July 2011.
No dividends were declared nor paid during 2010.
Nature and purpose of other reservesRevaluation reserve for property and equipment The revaluation reserve for property and equipment is used to record increases in the fair value of buildings and decreases to the extent that such decrease relates to an increase on the same asset previously recognised in equity.
Unrealised gains (losses) on investment securities available-for-saleThis reserve records fair value changes on investments available-for-sale.
Unrealised gains (losses) from dilution or sale/acquisition of shares in existing subsidiariesThis reserve records unrealised gains (losses) from dilution or sale/acquisition of shares in existing subsidiaries.
Foreign currency translation reserveThe foreign currency translation reserve is used to record exchange differences arising from the translation of the financial statements of foreign subsidiaries.
Movements in other reserves during the years ended 31 December 2012, 31 December 2011 and 31 December 2010 are presented in the statements of other comprehensive income.

154 Bank of Georgia Holdings PLC Annual Report 2012
(Thousands of Georgian Lari)
Financial Statements: Notes to consolidated financial statements continued
20. Equity (continued)Earnings per share
2012 2011 2010
Basic earnings per share Profit for the year attributable to ordinary shareholders of the Group 174,437 132,531 83,640 Profit for the year from continuing operations attributable to ordinary shareholders of the Group 174,437 147,750 83,640
Weighted average number of ordinary shares outstanding during the year 33,405,181 29,866,366 30,037,041 Basic earnings per share 5.2218 4.4375 2.7846 Basic earnings per share from continuing operations 5.2218 4.9470 2.7846Dilution effect Interest expenses on convertible debt instruments, net of tax 1,116 8,029 8,143 Number of dilutive potential ordinary shares 526,381 3,635,006 3,474,614Diluted earnings per share Profit for the year attributable to ordinary shareholders of the Group 175,552 140,560 91,783 Profit for the year from continuing operations attributable to ordinary shareholders of the Group 175,552 155,779 91,783
Weighted average number of diluted ordinary shares outstanding during the year 33,931,562 33,501,372 33,511,655
Diluted earnings per share 5.1737 4.1957 2.7388 Diluted earnings per share from continuing operations 5.1737 4.6499 2.7388
During the years ended 31 December 2011 and 31 December 2010 dilutive potential ordinary shares were accounted for by convertible loans granted by EBRD and IFC.
On 24 February 2012 the Bank converted certain part of its loans taken from EBRD and IFC into 3,635,006 ordinary shares of the Bank (Note 18). Their conversion decreased earnings per share from continuing operations. However, it also reduced the Group’s interest expense on these debt instruments and increased the total profit attributable to ordinary shareholders of the Group.
21. Net Fee and Commission Income2012 2011 2010
Settlements operations 69,208 62,015 50,511Guarantees and letters of credit 26,846 17,528 12,362Cash operations 8,826 9,048 8,061Currency conversion operations 1,802 1,507 677Brokerage service fees 911 1,033 545Advisory – 1,668 1,129Other 1,685 742 980
Fee and commission income 109,278 93,541 74,265
Settlements operations (15,234) (12,255) (7,324)Guarantees and letters of credit (4,046) (1,856) (1,164)Cash operations (1,510) (2,424) (780)Insurance brokerage service fees (910) (543) (646)Currency conversion operations (73) (550) (14)Other (1,018) (576) (917)
Fee and commission expense (22,791) (18,204) (10,845)
Net fee and commission income 86,487 75,337 63,420

OverviewPerform
anceGovernance
Financial Statements
Additional Information
Bank of Georgia Holdings PLC Annual Report 2012 155
22. Net Insurance RevenueNet insurance premiums earned, net insurance claims incurred and respective net insurance revenue for the years ended 31 December 2012, 31 December 2011 and 31 December 2010 comprised:
2012 2011 2010
Life insurance contracts premium written 4,069 2,200 2,562General insurance contracts premium written 113,810 54,241 53,744
Total premiums written 117,879 56,441 56,306
Gross change in life provision (98) 82 96Gross change in general insurance contracts unearned premium provision (14,931) 135 (1,001)
Total gross premiums earned on insurance contracts 102,850 56,658 55,401
Reinsurers’ share of life insurance contracts premium written (658) (148) (1,321)Reinsurers’ share of general insurance contracts premium written (8,925) (9,750) (11,038)Reinsurers’ share of change in life provision (65) (183) (57)Reinsurers’ share of change in general insurance contracts unearned premium provision (2,026) (181) 1,576
Total reinsurers’ share of gross earned premiums on insurance contracts (11,674) (10,262) (10,840)
Net insurance premiums earned 91,176 46,396 44,561
Life insurance claims paid (539) (465) (1,272)General insurance claims paid (60,323) (30,850) (28,493)
Total insurance claims paid (60,862) (31,315) (29,765)
Reinsurers’ share of life insurance claims paid 84 428 988Reinsurers’ share of general insurance claims paid 1,282 1,186 1,497Gross change in total reserves for claims 1,742 774 (1,486)Reinsurers’ share of change in total reserves for claims 716 269 868
Net insurance claims incurred (57,038) (28,658) (27,898)
Net insurance revenue 34,138 17,738 16,663
23. Net Healthcare Revenue2012 2011 2010
Revenue from free flow (non-insured retail individuals) 21,133 1,847 501
Revenue from insurance companies 16,937 1,507 152
Revenue from government programmes 13,184 217 –
Other revenue from medical services 3,122 2,129 1,555
Healthcare revenue 54,376 5,700 2,208
Direct salary expenses (21,980) (1,938) (999)
Direct materials (6,799) (632) (139)
Expenses on medical service providers (2,081) (474) (351)
Other direct expenses (170) (198) (143)
Cost of healthcare services (31,030) (3,242) (1,632)
Net healthcare revenue 23,346 2,458 576

156 Bank of Georgia Holdings PLC Annual Report 2012
(Thousands of Georgian Lari)
24. Salaries and Other Employee Benefits, and General and Administrative Expenses2012 2011 2010
Salaries and bonuses (121,046) (113,214) (102,686)Social security costs (1,510) (1,408) (1,199)
Salaries and other employee benefits (122,556) (114,622) (103,885)
The average number of staff employed by the Group for the years ended 31 December 2012, 31 December 2011 and 31 December 2010 comprised:
2012 2011 2010
The Bank 3,523 3,229 2,921Insurance segment 459 324 309BNB segment* 290 338 728Other 750 758 758
Average number of staff employed excluding healthcare** 5,022 4,649 4,716
Healthcare segment 4,288 955 436
Average total number of staff employed 9,310 5,604 5,152
* JSC Belarusky Narodny Bank and JSC BG BANK (for 2011 and 2010).** Salary expenses on staff employed in the healthcare segment, are included in cost of healthcare services.
Salaries and bonuses include GEL 17,122, GEL 12,092 and GEL 8,920 of the Executives’ Equity Compensation Plan costs for the years ended 31 December 2012, 31 December 2011 and 31 December 2010, respectively, associated with the existing share-based compensation scheme approved in the Group (Notes 26 and 30).
2012 2011 2010
Repairs and maintenance (11,164) (6,330) (6,205)Legal and other professional services (10,055) (6,077) (6,149)Marketing and advertising (9,644) (15,614) (12,534)Occupancy and rent (9,644) (9,396) (10,082)Office supplies (8,358) (3,350) (3,786)Operating taxes (4,824) (4,464) (4,188)Communication (4,601) (4,679) (4,975)Corporate hospitality and entertainment (2,669) (1,889) (1,709)Security (1,964) (2,061) (3,055)Travel expenses (1,407) (2,412) (1,975)Personnel training and recruitment (854) (733) (416)Insurance (419) (232) (678)Penalties (318) (329) (178)Banking services (62) (874) (756)Other (1,058) (3,502) (3,882)
General and administrative expenses (67,041) (61,942) (60,568)
Financial Statements: Notes to consolidated financial statements continued
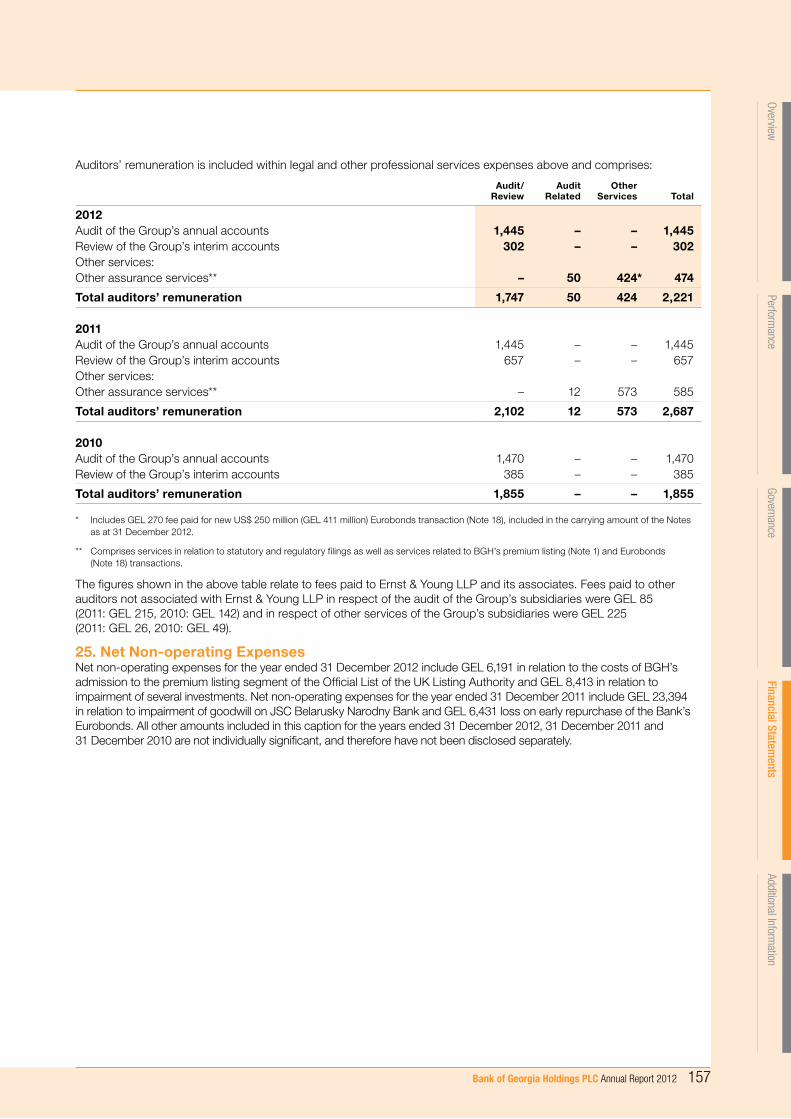
OverviewPerform
anceGovernance
Financial Statements
Additional Information
Bank of Georgia Holdings PLC Annual Report 2012 157
Auditors’ remuneration is included within legal and other professional services expenses above and comprises:
Audit/Review
AuditRelated
OtherServices Total
2012Audit of the Group’s annual accounts 1,445 – – 1,445Review of the Group’s interim accounts 302 – – 302Other services:Other assurance services** – 50 424* 474
Total auditors’ remuneration 1,747 50 424 2,221
2011Audit of the Group’s annual accounts 1,445 – – 1,445Review of the Group’s interim accounts 657 – – 657Other services:Other assurance services** – 12 573 585
Total auditors’ remuneration 2,102 12 573 2,687
2010Audit of the Group’s annual accounts 1,470 – – 1,470Review of the Group’s interim accounts 385 – – 385
Total auditors’ remuneration 1,855 – – 1,855
* Includes GEL 270 fee paid for new US$ 250 million (GEL 411 million) Eurobonds transaction (Note 18), included in the carrying amount of the Notes as at 31 December 2012.
** Comprises services in relation to statutory and regulatory filings as well as services related to BGH’s premium listing (Note 1) and Eurobonds (Note 18) transactions.
The figures shown in the above table relate to fees paid to Ernst & Young LLP and its associates. Fees paid to other auditors not associated with Ernst & Young LLP in respect of the audit of the Group’s subsidiaries were GEL 85 (2011: GEL 215, 2010: GEL 142) and in respect of other services of the Group’s subsidiaries were GEL 225 (2011: GEL 26, 2010: GEL 49).
25. Net Non-operating ExpensesNet non-operating expenses for the year ended 31 December 2012 include GEL 6,191 in relation to the costs of BGH’s admission to the premium listing segment of the Official List of the UK Listing Authority and GEL 8,413 in relation to impairment of several investments. Net non-operating expenses for the year ended 31 December 2011 include GEL 23,394 in relation to impairment of goodwill on JSC Belarusky Narodny Bank and GEL 6,431 loss on early repurchase of the Bank’s Eurobonds. All other amounts included in this caption for the years ended 31 December 2012, 31 December 2011 and 31 December 2010 are not individually significant, and therefore have not been disclosed separately.

158 Bank of Georgia Holdings PLC Annual Report 2012
(Thousands of Georgian Lari)
26. Share-based PaymentsExecutives’ Equity Compensation PlanAbacus Corporate Trustee Limited (the “Trustee”) acts as the trustee of the Group’s Executives’ Equity Compensation Plan (“EECP”).
In February 2010 the Bank’s Supervisory Board resolved to recommend to the Trustee to award 432,495 Bank’s ordinary shares in the form of restricted GDRs to the Group’s 19 executives pursuant to the EECP in respect of the year ended 31 December 2009. The awards are subject to three-year vesting, with a continuous employment being the only vesting condition. The Group considers 18 February 2010 as the grant date. The Group estimates that the fair value of the shares awarded on 18 February 2010 was Georgian Lari 17.29 per share.
Additionally, in March 2010 the Deputies of the CEO of the Bank and in May 2010 CEO of the Bank signed three-year fixed contingent share-based compensation agreements with the Bank for the total of 915,000 GDRs. The total amount of GDRs fixed to each executive will be awarded in three equal instalments during the 3 consecutive years starting January 2011, of which each award will be subject to a four-year vesting period. The Group considers 29 March 2010 as the grant date for the awards of the Deputies and 25 May 2010 as the grant date for the award of the CEO. The Group estimates that the fair value of the shares on 29 March 2010 was Georgian Lari 18.48 per share and the fair value of shares awarded on 25 May 2010 was Georgian Lari 18.16.
In February 2011 the Bank’s Supervisory Board resolved to award 143,500 ordinary shares in the form of GDRs to the members of the Management Board and 123,800 ordinary shares in the form of GDRs to the Group’s 24 executives. Shares awarded to the Management Board are subject to two-year vesting, while shares awarded to the other 24 executives are subject to three-year vesting, with a continuous employment being the only vesting condition for both awards. The Group considers 21 February 2011 as the grant date. The Group estimates that the fair value of the shares awarded on 21 February 2011 was Georgian Lari 35.86 per share.
In March 2012 the Bank’s Supervisory Board resolved to award 220,000 ordinary shares of BGH to the members of the Management Board and 262,443 ordinary shares of BGH to the Group’s 28 executives. Shares awarded to the Management Board are subject to two-year vesting, while shares awarded to the other 24 executives are subject to three-year vesting, with continuous employment being the only vesting condition for both awards. The Group considers 6 March 2012 as the grant date. The Group estimates that the fair value of the shares awarded on 6 March 2012 was Georgian Lari 26.07 per share.
The Bank grants share compensation to its mid-management employees too. In March 2012, in February 2011 and in February 2010, the Supervisory Board of the Bank resolved to award 42,600, 20,485 and nil ordinary shares to its mid-management employees, respectively. All these awards are subject to three-year vesting, with a continuous employment being the only vesting condition for all awards. The Group considers 6 March 2012, 21 February 2011 and 18 February 2010 as the grant dates of these awards, respectively. The Group estimates that the fair values of the shares awarded on 6 March 2012, 21 February 2011 and 18 February 2010 were Georgian Lari 26.07, 35.86 and 17.29 per share, respectively.
Summary Fair value of the shares granted at the measurement date is determined based on available market quotations.
The weighted average fair value of share-based awards at the grant date comprised Georgian Lari 22.92 per share in the year ended 31 December 2012 (31 December 2011: Georgian Lari 32.94 per share, 31 December 2010: Georgian Lari 17.96).
The Group’s total share-based payment expenses for the year ended 31 December 2012 comprised GEL 17,122 (31 December 2011: GEL 12,092, 31 December 2010: GEL 8,920) and are included in “salaries and other employee benefits”, as “salaries and bonuses”.
Below is the summary of the share-based payments related data:
2012 2011 2010
Total number of equity instruments awarded 792,443 333,584 1,380,707Among them, to top management* and the Board of Directors** 124,000 52,687 500,711Weighted average value at grant date, per share (GEL in full amount) 22.92 32.94 17.96Value at grant date, total (GEL) 18,162 10,989 24,802
Total expense recognised during the year (GEL) (Notes 26 and 30) (17,122) (12,092) (8,920)
* The Chairman and the Chief Executive Officer for the periods prior to 1 January 2011 and the Chief Executive Officer only since 1 January 2011.
** Supervisory Board of the Bank for 2011 and 2010.
Financial Statements: Notes to consolidated financial statements continued

Bank of Georgia Holdings PLC Annual Report 2012 159
OverviewPerform
anceGovernance
Financial Statements
Additional Information
27. Risk ManagementIntroductionRisk is inherent in the Group’s activities but it is managed through a process of ongoing identification, measurement and monitoring, subject to risk limits and other controls. This process of risk management is critical to the Group’s continuing profitability and each individual within the Group is accountable for the risk exposures relating to his or her responsibilities. The Group is exposed to credit risk, liquidity risk and market risk, the latter being subdivided into trading and non-trading risks. It is also subject to operational risks.
The independent risk control process does not include business risks such as changes in the environment, technology and industry. They are monitored through the Group’s strategic planning process.
Risk management structureAudit CommitteeThe Audit Committee is an independent body and is directly monitored by the Board. It has the overall responsibility for developing and implementation of overall risk assessment and risk mitigation strategies, principles, frameworks, policies and limits. The Audit Committee is responsible for the fundamental risk issues and manages and monitors relevant risk decisions covering, but not limited to: macroeconomic and environmental risks, general control environment, manual and application controls, risks of intentionally or unintentional misstatements, risk of fraud or misappropriation of assets, information security, anti-money laundering, information technology risks, etc.
Management BoardThe Management Board has the responsibility to monitor and manage entire risk process within the Group, on a regular basis, by assigning tasks, creating different executive committees, designing and setting up risk management policies and procedures as well as respective guidelines and controlling their implementation and performance of relevant departments and committees.
Bank Asset and Liability Management Committee The Bank’s Asset and Liability Management Committee (“ALCO”) is the core risk management body. It is responsible for managing the Bank’s assets and liabilities, all risks associated with them as well as overall financial structure of the Group. It is also primarily responsible for the funding, capital adequacy risk, liquidity risks and market risks of the Bank.
Internal AuditRisk management processes throughout the Group are audited annually by the internal audit function that examines both the adequacy of the procedures and the Group’s compliance with the procedures. Internal Audit discusses the results of all assessments with management, and reports its findings and recommendations to the Audit Committee.
Risk measurement and reporting systemsThe Group’s risks are measured using a method which reflects both the expected loss likely to arise in normal circumstances and unexpected losses, which are an estimate of the ultimate actual loss based on different forecasting models. The models make use of probabilities derived from historical experience, adjusted to reflect the economic environment. The Group runs three different basic scenarios, of which one is Base Case (forecast under normal business conditions) and the other two are Troubled and Distressed Scenarios, which are worse and the worst case scenarios, respectively, that would arise in the event that extreme events which are unlikely to occur do, in fact, occur.
Monitoring and controlling risks is primarily performed based on limits established by the Group. These limits reflect the business strategy and market environment of the Group as well as the level of risk that the Group is willing to accept, with additional emphasis on selected industries. In addition, the Group monitors and measures the overall risk bearing capacity in relation to the aggregate risk exposure across all risk types and activities.
Information compiled from all the businesses is examined and processed in order to analyse, control and identify early risks. This information is presented and explained to the Management Board, and the head of each business division. The reports include aggregate credit exposures and their limits, exceptions to those limits, liquidity ratios and liquidity limits, market risk ratios and their limits, and changes to the risk profile. Senior management assesses the appropriateness of the allowance for credit losses on a monthly basis. The Management Board receives a comprehensive Credit Risk report and ALCO report once a month. These reports are designed to provide all the necessary information to assess and conclude on the risks of the Group.
For all levels throughout the Group, specifically tailored risk reports are prepared and distributed in order to ensure that all business divisions have access to extensive, relevant and up-to-date information.
A daily briefing is given to the Management Board and all other relevant employees of the Group on the utilisation of market limits, proprietary investments and liquidity, plus any other risk developments.

160 Bank of Georgia Holdings PLC Annual Report 2012
(Thousands of Georgian Lari)
27. Risk Management (continued)Risk mitigationAs part of its overall risk management, the Group uses derivatives and other instruments to manage exposures resulting from changes in interest rates, foreign currencies, equity risks, credit risks, and exposures arising from forecast transactions. While these are intended for hedging, these do not qualify for hedge accounting.
The Group actively uses collateral to reduce its credit risks (see below for more detail).
Excessive risk concentrationConcentrations arise when a number of counterparties are engaged in similar business activities, or activities in the same geographic region, or these counterparties represent related parties to each other, or have similar economic features that would cause their ability to meet contractual obligations to be similarly affected by changes in economic, political or other conditions. Concentrations also involve combined, aggregate exposures of large and significant credits compared to the total outstanding balance of the respective financial instrument. Concentrations indicate the relative sensitivity of the Group’s performance to developments affecting a particular industry or geographical location.
In order to avoid excessive concentrations of risks, the Group’s policies and procedures include specific guidelines to focus on maintaining a diversified portfolio of both, financial assets as well as financial liabilities. Identified concentrations of credit risks or liquidity/repayment risks are controlled and managed accordingly.
Credit risk Credit risk is the risk that the Group will incur a loss because its customers, clients or counterparties failed to discharge their contractual obligations. The Group manages and controls credit risk by setting limits on the amount of risk it is willing to accept for individual counterparties and for geographical, industry, product and currency concentrations, and by monitoring exposures in relation to such limits.
The Group has established a credit quality review process to provide early identification of possible changes in the creditworthiness of counterparties, including regular collateral revisions. Counterparty limits are established by the use of a credit risk classification system, which assigns each counterparty a risk rating. Risk ratings are subject to regular revision.
The credit quality review process allows the Group to assess the potential loss as a result of the risks to which it is exposed and take corrective action.
Derivative financial instrumentsCredit risk arising from derivative financial instruments is, at any time, limited to those with positive fair values, as recorded in the statement of the financial position.
Credit-related commitments risksThe Group makes available to its customers guarantees which may require that the Group make payments on their behalf. Such payments are collected from customers based on the terms of the letter of credit. They expose the Group to similar risks to loans and these are mitigated by the same control processes and policies.
Financial Statements: Notes to consolidated financial statements continued

OverviewPerform
anceGovernance
Financial Statements
Additional Information
Bank of Georgia Holdings PLC Annual Report 2012 161
Credit quality per class of financial assetsThe credit quality of financial assets is managed by the Group through internal credit ratings. The table below shows the credit quality by class of asset for loan-related lines in the statement of financial position, based on the Group’s credit rating system.
Neither past due nor impairedPast due or individually
impaired Total31 December 2012 Notes High gradeStandard
gradeSub-standard
grade
Amounts due from credit institutions 8 396,559 – – – 396,559
Debt investment securities, available-for-sale 9 458,017 – – – 458,017
Loans to customers: 10 – Commercial loans 1,359,856 62,048 73,681 169,006 1,664,591 – Consumer loans 530,333 18,945 1,181 41,509 591,968 – Micro and SME loans 376,940 14,789 1,842 6,982 400,553 – Residential mortgage loans 358,742 18,692 3,305 17,375 398,114 – Gold – pawn loans 75,445 – – – 75,445
2,701,316 114,474 80,009 234,872 3,130,671
Finance lease receivables 11 19,153 1,770 440 50,830 72,193
Total 3,575,045 116,244 80,449 285,702 4,057,440
Neither past due nor impairedPast due orindividually
impaired Total31 December 2011 Notes High gradeStandard
gradeSub-standard
grade
Amounts due from credit institutions 8 289,530 – – – 289,530
Debt investment securities, available-for-sale 9 408,075 – – – 408,075
Loans to customers: 10 – Commercial loans 1,030,959 75,009 37,888 219,202 1,363,058 – Consumer loans 469,374 13,517 1,224 32,618 516,733 – Residential mortgage loans 344,593 12,872 1,477 32,055 390,997 – Micro and SME loans 306,124 5,031 1,494 5,917 318,566 – Gold – pawn loans 78,785 – – – 78,785
2,229,835 106,429 42,083 289,792 2,668,139
Finance lease receivables 11 57,647 4,222 913 577 63,359
Total 2,985,087 110,651 42,996 290,369 3,429,103

162 Bank of Georgia Holdings PLC Annual Report 2012
(Thousands of Georgian Lari)
27. Risk Management (continued)Neither past due nor impaired
Past due or individually
impaired Total31 December 2010 Notes High gradeStandard
gradeSub-standard
grade
Amounts due from credit institutions 8 115,622 847 – – 116,469
Debt investment securities: – Available-for-sale 9 285,628 – – – 285,628 – Held-to-maturity 21 – – – 21
285,649 – – – 285,649
Loans to customers: 10 – Commercial loans 924,320 254,675 42,449 203,106 1,424,550 – Consumer loans 324,474 13,889 9,251 62,172 409,786 – Residential mortgage loans 334,430 13,841 703 34,641 383,615 – Micro and SME loans 220,820 4,317 3,636 9,689 238,462 – Gold – pawn loans 66,749 – – – 66,749 – Other 2,168 696 7 1,200 4,071
1,872,961 287,418 56,046 310,808 2,527,233
Finance lease receivables 11 10,533 311 872 3,291 15,007
Total 2,284,765 288,576 56,918 314,099 2,944,358
Past due loans to customers, analysed by age below, include those that are past due by not more than a few days. These loans are not impaired.
It is the Group’s policy to maintain accurate and consistent risk ratings across the credit portfolio. This facilitates focused management of the applicable risks and the comparison of credit exposures across all lines of business, geographic regions and products. The rating system is supported by a variety of financial analytics to provide the main inputs for the measurement of counterparty risk. All internal risk ratings are tailored to the various categories and are derived in accordance with the Group’s rating policy. Attributable risk ratings are assessed and updated regularly.
The credit risk assessment policy for non-past due and individually non-impaired financial assets has been determined by the Group as follows:
– A financial asset that is neither past due nor impaired at the reporting date, but historically used to be past due no more than 30 days is assessed as a financial asset with High Grade;
– A financial asset that is neither past due nor impaired at the reporting date, but historically used to be past due more than 30 but less than 60 days is assessed as a financial asset with Standard Grade;
– A financial asset that is neither past due nor impaired at the reporting date, but historically used to be past due more than 60 days or borrower of this loan has at least an additional borrowing in past due more than 60 days as at reporting date is assessed as a financial asset with Sub-Standard Grade.
Financial Statements: Notes to consolidated financial statements continued

OverviewPerform
anceGovernance
Financial Statements
Additional Information
Bank of Georgia Holdings PLC Annual Report 2012 163
Aging analysis of past due but not impaired loans per class of financial assets
31 December 2012Less than
30 days31 to
60 days61 to
90 daysMore than
90 days Total
Loans to customers: – Consumer loans 17,803 13 5 5 17,826 – Commercial loans 634 1,534 7,891 6,679 16,738 – Residential mortgage loans 3,453 1,605 650 948 6,656 – Micro and SME loans 1,099 – – 263 1,362
Finance lease receivables 4,144 535 44850 293 49,822
Total 27,133 3,687 53,396 8,188 92,404
31 December 2011Less than
30 days31 to
60 days61 to
90 daysMore than
90 days Total
Loans to customers: – Consumer loans 17,399 24 – – 17,423 – Commercial loans 2,124 48 – 11,000 13,172 – Residential mortgage loans 8,345 645 56 1,300 10,346 – Micro and SME loans 425 – – – 425
Finance lease receivables 332 47 – 43 422
Total 28,625 764 56 12,343 41,788
31 December 2010Less than
30 days31 to
60 days61 to
90 daysMore than
90 days Total
Loans to customers: – Consumer loans 12,538 11 3 93 12,645 – Residential mortgage loans 6,967 1,387 275 1,956 10,585 – Commercial loans 2,925 – 2,115 5,290 10,330 – Micro and SME loans 503 6 128 – 637 – Other – 144 84 – 228
Finance lease receivables 1,212 – – 2,079 3,291
Total 24,145 1,548 2,605 9,418 37,716
See Notes 10 and 11 for more detailed information with respect to the allowance for impairment of loans to customers and finance lease receivables, respectively.
The Group specifically monitors performance of the loans with overdue payments in arrears for more than 90 days. The gross carrying value (i.e. carrying value before deducting any allowance for impairment) of such loans comprised GEL 82,524, GEL 87,836 and GEL 117,580 as at 31 December 2012, 31 December 2011 and 31 December 2010, respectively.

164 Bank of Georgia Holdings PLC Annual Report 2012
Financial Statements: Notes to consolidated financial statements continued
(Thousands of Georgian Lari)
27. Risk Management (continued)Carrying amount per class of financial assets whose terms have been renegotiatedThe table below shows the carrying amount for renegotiated financial assets, by class.
2012 2011 2010
Loans to customers: – Commercial loans 86,910 108,730 263,163 – Micro and SME loans 2,754 1,814 4,664 – Residential mortgage loans 7,312 7,453 4,386 – Consumer loans 1,573 960 2,092
Finance lease receivables 1,170 – 1,882
Total 99,719 118,957 276,187
Impairment assessment The main considerations for the loan impairment assessment include whether any payments of principal or interest are overdue by any number of days or there are any known difficulties in the cash flows of counterparties, credit rating downgrades, or infringement of the original terms of the contract. The Group addresses impairment assessment in two areas: individually assessed allowances and collectively assessed allowances. Loans are considered to be individually impaired if they are past due by more than only a few days or there are clear indications that the borrower already faces business, financial or other type of problems that hinder its/his/her ability to serve contractual obligations with the Group. Impairment for all such loans is assessed individually, rather than applying standard collective impairment rates based on just prior history of losses of the Group.
Individually assessed allowancesFor loan loss allowance determination purposes the Group considers all individually significant loans and classifies them between being individually impaired or not impaired. The allowance for those individually significant loans that are determined to be individually impaired (see definition above) is determined through individual assessment of the associated credit risk by assigning a proper credit rating. The allowances for non-significant loan that are determined to be individually impaired (see definition above) are also individually assessed. The allowance for losses for individually significant loans that are determined not to be individually impaired is assessed through the collective assessment approach described below. Items considered when determining allowance amounts include the sustainability of the counterparty’s business plan, its ability to improve performance once a financial difficulty has arisen, projected receipts and the expected dividend payout should bankruptcy ensue, the availability of other financial support and the realisable value of collateral, the timing of the expected cash flows and past history of the debt service of the borrower. Impairment losses are evaluated at each reporting date, unless unforeseen circumstances require more careful attention.
Collectively assessed allowancesAllowances are assessed collectively for all loans (including but not limited to credit cards, residential mortgages, and unsecured consumer lending, commercial lending, etc.), both, significant as well as non-significant, where there is not yet objective evidence of individual impairment (see definition above). Allowances are evaluated on each reporting date with each portfolio receiving a separate review.
The collective assessment takes into account the impairment that is likely to be present in the portfolio even though there is not yet objective evidence of the impairment in an individual assessment. Impairment losses are estimated by taking into consideration the following information: historical losses on the portfolio, current economic conditions, the appropriate delay between the time a loss is likely to have been uncured and the time it will be identified as requiring an individually assessed impairment allowance, and expected receipts and recoveries once impaired. Local management is responsible for deciding the length of this period which can extend for as long as one year, depending on a product. The impairment allowance is then reviewed by credit management to ensure alignment with the Group’s overall policy.
Financial guarantees and letters of credit are assessed and provision made in a similar manner as for loans.

OverviewPerform
anceGovernance
Financial Statements
Additional Information
Bank of Georgia Holdings PLC Annual Report 2012 165
The geographical concentration of the Group’s assets and liabilities is set out below:2012
Georgia OECD
CIS and other foreign
countries Total
Assets:Cash and cash equivalents 430,523 285,947 46,357 762,827Amounts due from credit institutions 340,177 23,659 32,723 396,559Investment securities available-for-sale 460,102 – 3,858 463,960Loans to customers 2,908,489 – 112,145 3,020,634Finance lease receivables 66,487 – 5,199 71,686All other assets 810,823 16,123 112,983 939,929
5,016,601 325,729 313,265 5,655,595
Liabilities:Amounts due to customers 1,854,152 265,838 573,035 2,693,025Amounts due to credit institutions 393,345 1,180,989 82,828 1,657,162All other liabilities 225,640 12,500 7,756 245,896
2,473,137 1,459,327 663,619 4,596,083
Net balance sheet position 2,543,464 (1,133,598) (350,354) 1,059,512
2011 2010
Georgia OECD
CIS andother
foreigncountries Total Georgia OECD
CIS andother
foreigncountries Total
Assets:Cash and cash equivalents 312,697 301,166 14,868 628,731 188,426 364,616 58,542 611,584Amounts due from credit institutions 282,353 387 6,790 289,530 91,715 14,538 10,216 116,469Investment securities: – available-for-sale 419,555 – 21 419,576 290,333 60 4,547 294,940– held-to-maturity – – – – 21 – – 21Loans to customers 2,508,545 – 44,897 2,553,442 2,135,962 8 215,727 2,351,697Finance lease receivables 59,479 – 3,440 62,919 10,036 – 4,383 14,419All other assets 691,047 253 19,763 711,063 498,175 9,508 108,109 615,792
4,273,676 301,806 89,779 4,665,261 3,214,668 388,730 401,524 4,004,922
Liabilities:Amounts due to customers 2,514,541 108,337 112,344 2,735,222 1,659,774 101,960 264,574 2,026,308Amounts due to credit institutions 42,761 788,067 90,344 921,172 145,398 962,691 30,838 1,138,927All other liabilities 193,198 – 3,066 196,264 135,794 4,232 6,320 146,346
2,750,500 896,404 205,754 3,852,658 1,940,966 1,068,883 301,732 3,311,581
Net balance sheet position 1,523,176 (594,598) (115,975) 812,603 1,273,702 (680,153) 99,792 693,341
Liquidity risk and funding managementLiquidity risk is the risk that the Group will be unable to meet its payment obligations when they fall due under normal and stress circumstances. To limit this risk, management has arranged diversified funding sources in addition to its core deposit base, manages assets with liquidity in mind, and monitors future cash flows and liquidity on a regular basis. This incorporates an assessment of expected cash flows and the availability of high grade collateral which could be used to secure additional funding if required.
The Group maintains a portfolio of highly marketable and diverse assets that can be easily liquidated in the event of an unforeseen interruption of cash flow. The Group also has committed lines of credit that it can access to meet liquidity needs. In addition, the Group maintains a cash deposit (obligatory reserve) with the NBG, the amount of which depends on the level of customer funds attracted.

166 Bank of Georgia Holdings PLC Annual Report 2012
Financial Statements: Notes to consolidated financial statements continued
(Thousands of Georgian Lari)
27. Risk Management (continued) The liquidity position is assessed and managed by the Group primarily on a standalone Bank basis, based on certain liquidity ratios established by the NBG. As at 31 December these ratios were as follows:
2012 % 2011 % 2010 %
Average liquidity ratio 40.0% 36.9% 35.6%Maximum liquidity ratio 49.1% 47.2% 44.5%Minimum liquidity ratio 31.1% 29.6% 29.1%
The average liquidity ratio is calculated on a standalone basis for JSC Bank of Georgia as the annual average (arithmetic mean) of daily liquidity ratios computed as the ratio of liquid assets to liabilities determined by the National Bank of Georgia as follows:
Liquid assets comprise cash, cash equivalents and other assets that are immediately convertible into cash. Those assets include investment securities issued by the Georgian Government plus Certificates of Deposit issued by NBG and do not include amounts due from credit institutions, other than inter-bank deposits, and/or debt securities of Governments and Central Banks of non-OECD countries, amounts in nostro accounts which are under lien, impaired inter-bank deposits; and amounts on obligatory reserve with NBG that are pledged due to borrowings from NBG.
Liabilities comprise the total balance sheet liabilities, less amounts due to credit institutions that are to be exercised or settled later than six months from the reporting date, plus off-balance sheet commitments with residual maturity subsequent to the reporting date of less than six months. Off-balance sheet commitments include all commitments except financial guarantees and letters of credit that are fully collateralised by cash covers in the Bank, and commitments due to dealing operations with foreign currencies. The maximum and minimum liquidity ratio are taken from historical data of the appropriate reporting years.
The Group also matches the maturity of financial assets and financial liabilities and imposes a maximum limit on negative gaps compared to the Bank’s standalone total regulatory capital calculated per NBG regulation. The ratios are assessed and monitored monthly and compared against set limits. In the case of deviations amendment strategies/actions are discussed and approved by ALCO.
The table below summarises the maturity profile of the Group’s financial liabilities based on contractual undiscounted repayment obligations. Repayments which are subject to notice are treated as if notice were to be given immediately. However, the Group expects that many customers will not request repayment on the earliest date the Bank could be required to pay and the table does not reflect the expected cash flows indicated by the Bank’s deposit retention history.
Financial liabilitiesAs at 31 December 2012
Less than3 months
3 to 12months
1 to 5years
Over5 years Total
Amounts due to customers 1,759,707 638,935 371,691 33,548 2,803,881Amounts due to credit institutions 465,376 221,460 1,108,551 177,950 1,973,337Other liabilities 28,359 76,982 9,356 – 114,697
Total undiscounted financial liabilities 2,253,442 937,377 1,489,598 211,498 4,891,915
Financial liabilitiesAs at 31 December 2011
Less than3 months
3 to 12months
1 to 5years
Over5 years Total
Amounts due to customers 1,908,942 654,219 236,243 13,543 2,812,947Amounts due to credit institutions 195,670 122,709 499,370 434,038 1,251,787Other liabilities 26,926 53,099 19,783 – 99,808
Total undiscounted financial liabilities 2,131,538 830,027 755,396 447,581 4,164,542
Financial liabilitiesAs at 31 December 2010
Less than3 months
3 to 12months
1 to 5years
Over5 years Total
Amounts due to customers 1,394,442 528,346 153,963 8,859 2,085,610Amounts due to credit institutions 151,404 145,753 780,504 530,547 1,608,208Other liabilities 8,049 33,571 15,649 4,949 62,218
Total undiscounted financial liabilities 1,553,895 707,670 950,116 544,355 3,756,036

OverviewPerform
anceGovernance
Financial Statements
Additional Information
Bank of Georgia Holdings PLC Annual Report 2012 167
The table below shows the contractual expiry by maturity of the Group’s financial commitments and contingencies.
Less than3 months
3 to 12months
1 to 5 years
Over5 years Total
31 December 2012 337,465 177,907 236,948 12,846 765,16631 December 2011 335,550 267,617 103,870 12,978 720,01531 December 2010 245,684 290,662 76,464 24,816 637,626
The Group expects that not all of the contingent liabilities or commitments will be drawn before expiry of the commitments.
The maturity analysis does not reflect the historical stability of current accounts. Their liquidation has historically taken place over a longer period than indicated in the tables above. These balances are included in amounts due in less than three months in the tables above.
Included in due to customers are term deposits of individuals. In accordance with the Georgian legislation, the Bank Group is obliged to repay such deposits upon demand of a depositor (Note 17).
Market riskMarket risk is the risk that the fair value or future cash flows of financial instruments will fluctuate due to changes in market variables such as interest rates, foreign exchanges, and equity prices. The Group classifies exposures to market risk into either trading or non-trading portfolios. Trading and non-trading positions are managed and monitored using sensitivity analysis.
Interest rate riskInterest rate risk arises from the possibility that changes in interest rates will affect future cash flows or the fair values of financial instruments. The following table demonstrates the sensitivity to a reasonable possible change in interest rates, with all other variables held constant, on the Group’s consolidated income statement.
The sensitivity of the consolidated income statement is the effect of the assumed changes in interest rates on the net interest income for the year, based on the floating rate non-trading financial assets and financial liabilities held at 31 December 2012. During the year ended 31 December 2012, year ended 31 December 2011 and year ended 31 December 2010, sensitivity analysis did not reveal any significant potential effect on the Group’s equity.
Currency
Increase inbasis points
2012
Sensitivity of netinterest income
2012
Sensitivity of othercomprehensive
income2012
GEL 0.17% (40) –US$ 0.01% (49) –
Currency
Decrease inbasis points
2012
Sensitivity of netinterest income
2012
Sensitivity of othercomprehensive
income2012
GEL 0.17% 40 –US$ 0.01% 49 –
Currency
Increase inbasis points
2011
Sensitivity of netinterest income
2011
Sensitivity of othercomprehensive
income2011
EUR 0.42% 101 –US$ 0.02% 51 –
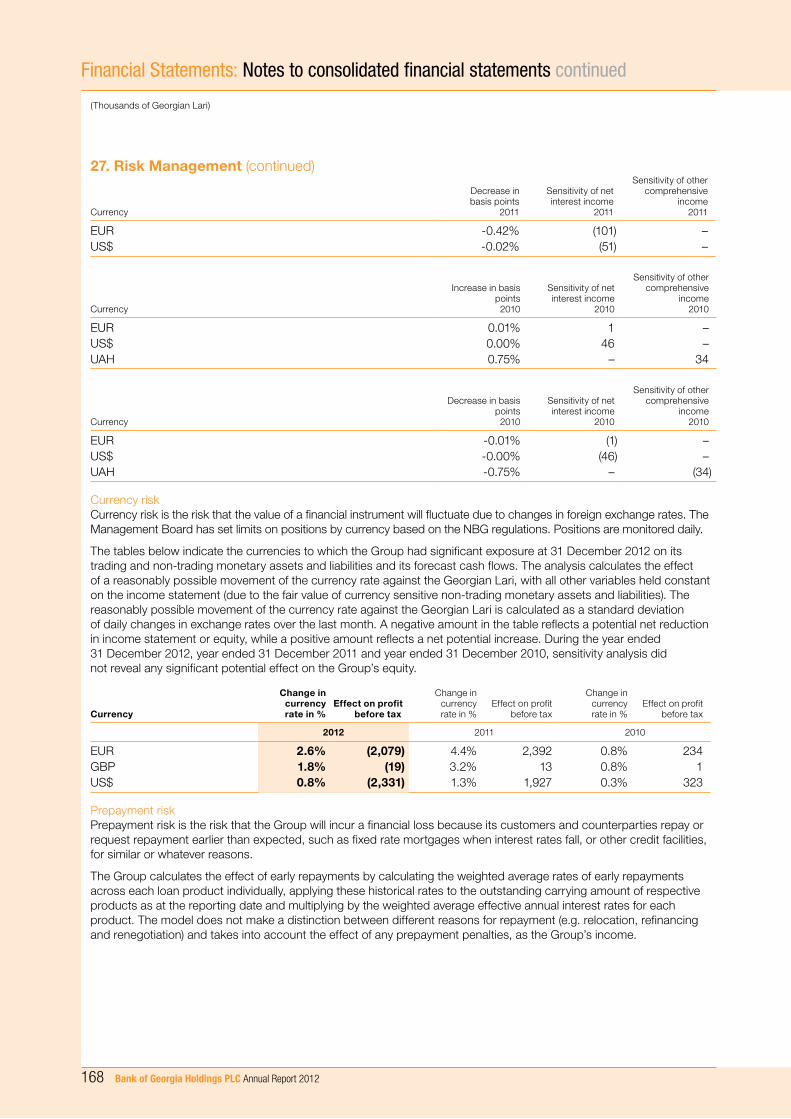
168 Bank of Georgia Holdings PLC Annual Report 2012
Financial Statements: Notes to consolidated financial statements continued
(Thousands of Georgian Lari)
27. Risk Management (continued)
Currency
Decrease inbasis points
2011
Sensitivity of netinterest income
2011
Sensitivity of othercomprehensive
income2011
EUR -0.42% (101) –US$ -0.02% (51) –
Currency
Increase in basispoints2010
Sensitivity of net interest income
2010
Sensitivity of othercomprehensive
income2010
EUR 0.01% 1 –US$ 0.00% 46 –UAH 0.75% – 34
Currency
Decrease in basis points2010
Sensitivity of net interest income
2010
Sensitivity of other comprehensive
income2010
EUR -0.01% (1) –US$ -0.00% (46) –UAH -0.75% – (34)
Currency riskCurrency risk is the risk that the value of a financial instrument will fluctuate due to changes in foreign exchange rates. The Management Board has set limits on positions by currency based on the NBG regulations. Positions are monitored daily.
The tables below indicate the currencies to which the Group had significant exposure at 31 December 2012 on its trading and non-trading monetary assets and liabilities and its forecast cash flows. The analysis calculates the effect of a reasonably possible movement of the currency rate against the Georgian Lari, with all other variables held constant on the income statement (due to the fair value of currency sensitive non-trading monetary assets and liabilities). The reasonably possible movement of the currency rate against the Georgian Lari is calculated as a standard deviation of daily changes in exchange rates over the last month. A negative amount in the table reflects a potential net reduction in income statement or equity, while a positive amount reflects a net potential increase. During the year ended 31 December 2012, year ended 31 December 2011 and year ended 31 December 2010, sensitivity analysis did not reveal any significant potential effect on the Group’s equity.
Currency
Change incurrency rate in %
Effect on profitbefore tax
Change incurrencyrate in %
Effect on profitbefore tax
Change incurrency rate in %
Effect on profitbefore tax
2012 2011 2010
EUR 2.6% (2,079) 4.4% 2,392 0.8% 234GBP 1.8% (19) 3.2% 13 0.8% 1US$ 0.8% (2,331) 1.3% 1,927 0.3% 323
Prepayment riskPrepayment risk is the risk that the Group will incur a financial loss because its customers and counterparties repay or request repayment earlier than expected, such as fixed rate mortgages when interest rates fall, or other credit facilities, for similar or whatever reasons.
The Group calculates the effect of early repayments by calculating the weighted average rates of early repayments across each loan product individually, applying these historical rates to the outstanding carrying amount of respective products as at the reporting date and multiplying by the weighted average effective annual interest rates for each product. The model does not make a distinction between different reasons for repayment (e.g. relocation, refinancing and renegotiation) and takes into account the effect of any prepayment penalties, as the Group’s income.

OverviewPerform
anceGovernance
Financial Statements
Additional Information
Bank of Georgia Holdings PLC Annual Report 2012 169
The estimated effect of prepayment risk on profit and equity of the Group for the year ended 31 December is as follows:
Effecton net
interestincome
2012 (3,971)
2011 (5,416)2010 (67,605)
Operational riskOperational risk is the risk of loss arising from systems failure, human error, fraud or external events. When controls fail to perform, operational risks can cause damage to reputation, have legal or regulatory implications, or lead to financial loss. The Group cannot expect to eliminate all operational risks, but through a control framework and by monitoring and responding to potential risks, the Group is able to manage the risks. Controls include effective segregation of duties, access, authorisation and reconciliation procedures, staff education and assessment processes, including the use of internal audit.
Operating environmentMost of the Group’s business in concentrated in Georgia. As an emerging market, Georgia does not possess a well-developed business and regulatory infrastructure that would generally exist in a more mature market economy. Operations in Georgia may involve risks that are not typically associated with those in developed markets (including the risk that the Georgian Lari is not freely convertible outside the country, and undeveloped debt and equity markets). However, over the last few years the Georgian government has made a number of developments that positively affect the overall investment climate of the country, specifically implementing the reforms necessary to create banking, judicial, taxation and regulatory systems. This includes the adoption of a new body of legislation (including new Tax Code and procedural laws). In the view of the Board, these steps contribute to mitigate the risks of doing business in Georgia.
The existing tendency aimed at the overall improvement of the business environment is expected to persist. The future stability of the Georgian economy is largely dependent upon these reforms and developments and the effectiveness of economic, financial and monetary measures undertaken by the Government. However, the Georgian economy is vulnerable to market downturns and economic slowdowns elsewhere in the world.
28. Fair Values of Financial InstrumentsFinancial instruments recorded at fair valueThe Group uses the following hierarchy for determining and disclosing the fair value of financial instruments by valuation technique:
– Level 1: quoted (unadjusted) prices in active markets for identical assets or liabilities; – Level 2: techniques for which all inputs which have a significant effect on the recorded fair value are observable, either directly or indirectly; and
– Level 3: techniques which use inputs which have a significant effect on the recorded fair value that are not based on observable market data.
The following table shows an analysis of financial instruments recorded at fair value by level of the fair value hierarchy:
Level 1 Level 2 Level 3
Total31 December
2012
Financial assetsInvestment securities available-for-sale 47 458,025 5,888 463,960Other assets – derivative financial assets – 36,784 – 36,784Other assets – trading securities owned 971 – – 971
1,018 494,809 5,888 501,715
Financial liabilities Other liabilities – derivative financial liabilities – 4,867 – 4,867
– 4,867 – 4,867

170 Bank of Georgia Holdings PLC Annual Report 2012
(Thousands of Georgian Lari)
28. Fair Values of Financial Instruments (continued)
Level 1 Level 2 Level 3
Total31 December
2011
Financial assetsInvestment securities available-for-sale 346 415,196 4,034 419,576Other assets – derivative financial assets 63 36,760 – 36,823Other assets – trading securities owned 1,115 – – 1,115
1,524 451,956 4,034 457,514
Financial liabilities Other liabilities – derivative financial liabilities 5,925 9,931 – 15,856
5,925 9,931 – 15,856
Level 1 Level 2 Level 3
Total31 December
2010
Financial assetsInvestment securities available-for-sale 4,958 284,573 5,409 294,940Other assets – derivative financial assets 2,250 683 – 2,933Other assets – trading securities owned 1,218 – – 1,218
8,426 285,256 5,409 299,091
Financial liabilities Other liabilities – derivative financial liabilities 2,211 15,314 – 17,525
2,211 15,314 – 17,525
The following is a description of the determination of fair value for financial instruments which are recorded at fair value using valuation techniques. These incorporate the Group’s estimate of assumptions that a market participant would make when valuing the instruments.
Derivative financial instrumentsDerivative financial instruments valued using a valuation technique with market observable inputs are mainly interest rate swaps, currency swaps and forward foreign exchange contracts. The most frequently applied valuation techniques include forward pricing and swap models, using present value calculations. The models incorporate various inputs including the credit quality of counterparties, foreign exchange spot and forward rates and interest rate curves.
Trading securities and investment securities available-for-saleTrading securities and investment securities available-for-sale valued using a valuation technique or pricing models primarily consist of unquoted equity and debt securities. These securities are valued using models which sometimes only incorporate data observable in the market and at other times use both observable and non-observable data. The non-observable inputs to the models include assumptions regarding the future financial performance of the investee, its risk profile, and economic assumptions regarding the industry and geographical jurisdiction in which the investee operates.
Movements in level 3 financial instruments measured at fair valueThe following tables show a reconciliation of the opening and closing amounts of Level 3 financial assets which are recorded at fair value:
At1 January
2010
Purchaseof AFS
securities
At 31 December
2010
Sale of AFS
securities
At31 December
2011
Sale of AFS
securities
Transfers from
level 2
At31 December
2012
Level 3 financial assetsEquity investment securities available-for-sale 4,265 1,144 5,409 (1,375) 4,034 (1,983) 3,837 5,888
The transfer of GEL 3,837 in 2012 was the 19.4% stake in PJSC Bank Pershyi. Gains or losses on level 3 financial instruments during year ended 31 December 2012 were nil.
Financial Statements: Notes to consolidated financial statements continued

Bank of Georgia Holdings PLC Annual Report 2012 171
OverviewPerform
anceGovernance
Financial Statements
Additional Information
Impact on fair value of level 3 financial instruments measured at fair value of changes to key assumptionsThe following table shows the impact on the fair value of level 3 instruments of using reasonably possible alternative assumptions:
Carryingamount
Effect of reasonablypossible alternative
assumptionsCarryingamount
Effect of reasonablypossible alternative
assumptionsCarryingamount
Effect of reasonablypossible alternative
assumptions
2012 2011 2010
Level 3 financial assetsEquity investments available-for-sale 5,888 +/- 886 4,034 +/- 607 5,409 +/- 814
In order to determine reasonably possible alternative assumptions the Group adjusted key unobservable model inputs as follows:
For equities, the Group adjusted the price-over-book-value multiple by increasing and decreasing the ratio by 10%, which is considered by the Group to be within a range of reasonably possible alternatives based on the price-over-book-value multiples used across peers within the same geographic area of the same industry.
Fair value of financial assets and liabilities not carried at fair valueSet out below is a comparison by class of the carrying amounts and fair values of the Group’s financial instruments that are carried in the financial statements. The table does not include the fair values of non-financial assets and non-financial liabilities.
Carryingvalue 2012
Fair value2012
Unrecognisedloss 2012
Financial assetsCash and cash equivalents 762,827 762,827 –Amounts due from credit institutions 396,559 396,559 –Loans to customers 3,020,634 2,995,632 (25,002)Finance lease receivables 71,686 71,686 –
Financial liabilitiesAmounts due to customers 2,693,025 2,707,231 (14,206)Amounts due to credit institutions 1,657,162 1,657,162 –
Total unrecognised change in unrealised fair value (39,208)
Carryingvalue 2011
Fair value2011
Unrecognisedgain (loss)
2011
Carryingvalue 2010
Fair value2010
Unrecognisedloss
2010
Financial assetsCash and cash equivalents 628,731 628,731 – 611,584 611,584 –Amounts due from credit institutions 289,530 289,530 – 116,469 116,469 –Investment securities held-to-maturity – – – 21 21 –Loans to customers 2,553,442 2,546,648 (6,794) 2,351,697 2,319,388 (32,309)Finance lease receivables 62,919 62,919 – 14,419 14,419 –
Financial liabilitiesAmounts due to customers 2,735,222 2,758,210 (22,988) 2,026,308 2,041,403 (15,095)Amounts due to credit institutions 921,172 921,172 – 1,138,927 1,138,927 –
Total unrecognised change in unrealised fair value (29,782) (47,404)

172 Bank of Georgia Holdings PLC Annual Report 2012
28. Fair Values of Financial Instruments (continued)The following describes the methodologies and assumptions used to determine fair values for those financial instruments which are not already recorded at fair value in the consolidated financial statements.
Assets for which fair value approximates carrying valueFor financial assets and financial liabilities that are liquid or have a short term maturity (less than thee months) it is assumed that the carrying amounts approximate to their fair value. This assumption is also applied to demand deposits, savings accounts without a specific maturity and variable rate financial instruments.
Fixed rate financial instrumentsThe fair value of fixed rate financial assets and liabilities carried at amortised cost are estimated by comparing market interest rates when they were first recognised with current market rates offered for similar financial instruments. The estimated fair value of fixed interest bearing deposits is based on discounted cash flows using prevailing money-market interest rates for debts with similar credit risk and maturity.
29. Maturity Analysis of Financial Assets and LiabilitiesThe table below shows an analysis of financial assets and liabilities according to when they are expected to be recovered or settled. See Note 27 “Risk management” for the Group’s contractual undiscounted repayment obligations.
2012
On Demand ≤ 3 Months ≤ 6 Months ≤ 1 Year ≤ 3 Years ≤ 5 Years > 5 Years Total
Financial assetsCash and cash equivalents 586,852 175,975 – – – – – 762,827Amounts due from credit institutions 322,871 48,143 5,790 4,557 9,136 4,448 1,614 396,559Investment securities available-for-sale 5,200 168,670 114,920 41,159 76,185 51,777 6,049 463,960Loans to customers – 605,509 312,302 624,819 923,503 361,248 193,253 3,020,634Finance lease receivables – 9,058 5,716 10,353 25,886 13,049 7,624 71,686
Total 914,923 1,007,355 438,728 680,888 1,034,710 430,522 208,540 4,715,666
Financial liabilitiesAmounts due to customers 355,835 453,796 214,743 1,337,512 283,000 39,694 8,445 2,693,025Amounts due to credit institutions 40,321 436,155 49,362 164,137 341,179 524,309 101,699 1,657,162
Total 396,156 889,951 264,105 1,501,649 624,179 564,003 110,144 4,350,187
Net 518,767 117,404 174,623 (820,761) 410,531 (133,481) 98,396 365,479
Financial Statements: Notes to consolidated financial statements continued

Bank of Georgia Holdings PLC Annual Report 2012 173
OverviewPerform
anceGovernance
Financial Statements
Additional Information
2011
On Demand ≤ 3 Months ≤ 6 Months ≤ 1 Year ≤ 3 Years ≤ 5 Years > 5 Years Total
Financial assetsCash and cash equivalents 526,706 102,025 – – – – – 628,731Amounts due from credit institutions 268,100 277 858 8,213 7,191 – 4,891 289,530Investment securities available-for-sale 23,607 146,809 114,167 55,596 65,893 13,500 4 419,576Loans to customers 2,245 498,214 258,886 471,732 723,420 345,412 253,533 2,553,442Finance lease receivables 218 5,196 3,990 7,363 20,871 12,667 12,614 62,919
Total 820,876 752,521 377,901 542,904 817,375 371,579 271,042 3,954,198
Financial liabilitiesAmounts due to customers 643,135 401,885 267,389 1,224,352 185,878 6,416 6,167 2,735,222Amounts due to credit institutions 26,936 158,368 27,832 51,985 181,448 118,839 355,764 921,172
Total 670,071 560,253 295,221 1,276,337 367,326 125,255 361,931 3,656,394
Net 150,805 192,268 82,680 (733,433) 450,049 246,324 (90,889) 297,804
2010
On Demand ≤ 3 Months ≤ 6 Months ≤ 1 Year ≤ 3 Years ≤ 5 Years > 5 Years Total
Financial assetsCash and cash equivalents 511,169 100,415 – – – – – 611,584Amounts due from credit institutions 68,443 27,017 4,843 7,404 4,210 – 4,552 116,469Investment securities: – available–for–sale 19,829 131,528 58,782 32,396 52,405 – – 294,940– held-to-maturity – – – 21 – – – 21
Loans to customers 9,425 504,875 252,605 425,009 582,586 341,819 235,378 2,351,697Finance lease receivables 142 3,265 2,192 3,229 4,922 669 – 14,419
Total 609,008 767,100 318,422 468,059 644,123 342,488 239,930 338,9130
Financial liabilitiesAmounts due to customers 269,673 414,905 139,635 1,057,158 129,691 9,363 5,883 2,026,308Amounts due to credit institutions 25,835 142,401 865 24,285 333,663 45,299 566,579 1,138,927
Total 295,508 557,306 140,500 1,081,443 463,354 54,662 572,462 3,165,235
Net 313,500 209,794 177,922 (613,384) 180,769 287,826 (332,532) 223,895
The Group’s capability to discharge its liabilities relies on its ability to realise equivalent assets within the same period of time. In the Georgian marketplace, where most of the Group’s business is concentrated, many short-term credits are granted with the expectation of renewing the loans at maturity. As such, the ultimate maturity of assets may be different from the analysis presented above. To reflect the historical stability of current accounts, the Group calculates the minimal daily balance of current accounts over the past two years and includes the amount in less than 1 year category in the table above. The remaining current accounts are included in on demand category.

174 Bank of Georgia Holdings PLC Annual Report 2012
29. Maturity Analysis of Financial Assets and Liabilities (continued)
The Group’s principal sources of liquidity are as follows:
– deposits; – borrowings from international credit institutions; – inter-bank deposit agreement; – debt issues; – proceeds from sale of securities; – principal repayments on loans; – interest income; and – fees and commissions income.
As at 31 December 2012 amounts due to customers amounted to GEL 2,693,025 (2011: GEL 2,735,222, 2010: GEL 2,026,308) and represented 59% (2011: 71%, 2010: 61%) of the Group’s total liabilities. These funds continue to provide a majority of the Group’s funding and represent a diversified and stable source of funds. As at 31 December 2012 amounts owed to credit institutions amounted to GEL 1,657,162 (2011: GEL 921,172, 2010: GEL 1,138,927) and represented 36% (2011: 24%, 2010: 34%) of total liabilities.
In the Board’s opinion, liquidity is sufficient to meet the Group’s present requirements.
30. Related Party DisclosuresIn accordance with IAS 24 “Related Party Disclosures”, parties are considered to be related if one party has the ability to control the other party or exercise significant influence over the other party in making financial or operational decisions. In considering each possible related party relationship, attention is directed to the substance of the relationship, not merely the legal form.
Related parties may enter into transactions which unrelated parties might not, and transactions between related parties may not be effected on the same terms, conditions and amounts as transactions between unrelated parties. All transactions with related parties disclosed below have been conducted on an arm’s length basis.
The volumes of related party transactions, outstanding balances at the year end, and related expenses and income for the year are as follows:
2012 2011 2010
Sh
areh
old
ers
Ass
oc
iate
s
Key
m
an
ag
em
en
t p
ers
on
ne
l*
Sha
reho
lder
s
Ass
ocia
tes*
*
Key
m
anag
emen
t p
erso
nnel
*
Sha
reho
lder
s
Ass
ocia
tes
Key
m
anag
emen
t p
erso
nnel
*Loans outstanding at 1 January, gross – 304 6,558 – 2,191 4,758 – 9,255 5,791 Loans issued during the year – – 7,457 – 954 7,951 – 624 7,125Loan repayments during the year – (259) (8,389) – (5,493) (6,663) – (707) (6,877)Other movements – (45) (490) – 2,652 512 – (6,981) (1,281)
Loans outstanding at 31 December, gross – – 5,136 – 304 6,558 – 2,191 4,758Less: allowance for impairment at 31 December – – 76 – 2 115 – (1,564) (119)
Loans outstanding at 31 December, net – – 5,212 – 306 6,673 – 627 4,639
Interest income on loans – 14 640 – 870 718 – 344 611Loan impairment charge – – (1) – 2 32 – 661 65
Deposits at 1 January 36,730 171 5,903 36,410 726 8,999 12,098 506 6,919 Deposits received during the year 5,373 11,040 28,561 35,365 24,660 21,574 41,646 16,185 36,658Deposits repaid during the year (29,494) (11,191) (25,264) (32,147) (25,229) (22,254) (16,851) (16,127) (33,522)Other movements (973) (3) 481 (2,898) 14 (2,416) (483) 162 (1,056)
Deposits at 31 December 11,636 17 9,681 36,730 171 5,903 36,410 726 8,999
Financial Statements: Notes to consolidated financial statements continued

Bank of Georgia Holdings PLC Annual Report 2012 175
OverviewPerform
anceGovernance
Financial Statements
Additional Information
2012 2011 2010
Sh
areh
old
ers
Ass
oc
iate
s
Key
m
an
ag
em
en
t p
ers
on
ne
l*
Sha
reho
lder
s
Ass
ocia
tes*
*
Key
m
anag
emen
t p
erso
nnel
*
Sha
reho
lder
s
Ass
ocia
tes
Key
m
anag
emen
t p
erso
nnel
*
Interest expense on deposits (1,738) (26) (612) (3,019) (33) (441) (1,681) (68) (471)Other income – – 121 693 – 78 1,671 – 69
Borrowings at 1 January – – – – – – – – –Conversion of convertible subordinated debts*** 264,481 – – – – – – – –Borrowings received during the year 16,470 – – – – – – – –Borrowings repaid during the year (56,506) – – – – – – – –Other movements 8,996 – – – – – – – –
Borrowings at 31 December 233,441 – – – – – – – –
Interest expense on borrowings (16,589) – – – – – – – –
Interest rate swaps**** at 1 January – – – – – – – – –
Conversion of convertible subordinated debts*** 6,882 – – – – – – – –
Payments during the year (3,040) – – – – – – – –
Other movements 942 – – – – – – – –
Interest rate swaps at 31 December 4,783 – – – – – – – –
Net loss from interest rate swaps (942) – – – – – – – –
* Key management personnel include members of BGH’s Board of Directors and Chief Executive Officer and Deputies of the Bank.
** During the year ended 31 December 2011 loans to two legal entities, controlling stakes of which were owned by a member of the Bank’s Management Board and a member of the Bank’s Supervisory Board, were outstanding. A total of GEL 775 interest income was recognised on these loans in the consolidated income statement for the year ended 31 December 2011. GEL 36 gross loan remained outstanding as at 31 December 2011 and was completely repaid during 2012.
*** On 24 February 2012 the EBRD and IFC utilised the equity conversion feature of subordinated convertible loans, becoming shareholders of the Group.
**** Interest rate swap agreements with IFC.
Compensation of key management personnel comprised the following:
2012 2011 2010
Salaries and other benefits 2,656 2,803 4,564– Among them, termination benefits – – 426Share-based payments compensation (Notes 24 and 26) 8,048 8,308 7,156– Among them, termination benefits – – 1,183Social security costs 24 37 31
Total key management compensation 10,728 11,148 11,751
Key management personnel do not receive cash settled compensation, except for fixed salaries. The major part of the total compensation is share-based (Note 26). The number of key management personnel at 31 December 2012 was 15 (31 December 2011: 16, 31 December 2010: 13).

176 Bank of Georgia Holdings PLC Annual Report 2012
31. Capital AdequacyThe Group maintains an actively managed capital base to cover risks inherent in the business. The adequacy of the Group’s capital is monitored using, among other measures, the ratios established by the NBG in supervising the Bank and the ratios established by the Basel Capital Accord 1988.
During year ended 31 December 2012, the Bank and the Group complied in full with all its externally imposed capital requirements.
The primary objectives of the Group’s capital management are to ensure that the Group complies with externally imposed capital requirements and that the Group maintains strong credit ratings and healthy capital ratios in order to support its business and to maximise shareholder value.
The Group manages its capital structure and makes adjustments to it in the light of changes in economic conditions and the risk characteristics of its activities. In order to maintain or adjust the capital structure, the Group may adjust the amount of dividend payment to shareholders, return capital to shareholders or issue capital securities. No changes were made in the objectives, policies and processes from previous years.
NBG capital adequacy ratioThe NBG requires banks to maintain a minimum capital adequacy ratio of 12% of risk-weighted assets, computed based on the Bank’s standalone special purpose financial statements prepared in accordance with NBG regulations and pronouncements. As at 31 December 2012, 31 December 2011 and 31 December 2010 the Bank’s capital adequacy ratio on this basis was as follows:
2012 2011 2010
Core capital 739,880 512,238 494,128Supplementary capital 389,685 463,825 423,389Less: Deductions from capital (262,616) (184,323) (367,418)Total regulatory capital 866,949 791,740 550,099
Risk-weighted assets 5,352,187 4,872,931 3,800,624
Total Capital adequacy ratio 16.2% 16.2% 14.5%
Regulatory capital consists of Core capital, which comprises share capital, additional paid-up capital, retained earnings including current year profit, foreign currency translation and non-controlling interests less accrued dividends, net long positions in own shares and goodwill. Certain adjustments are made to IFRS-based results and reserves, as prescribed by the NBG. The other component of regulatory capital is Supplementary capital, which includes subordinated long-term debt, preference shares and revaluation reserves.
Capital adequacy ratio under Basel Capital Accord 1988The Bank’s capital adequacy ratio based on the consolidated statement of financial position and computed in accordance with the Basel Capital Accord 1988, with subsequent amendments including the amendment to incorporate market risks, as at 31 December 2012, 31 December 2011 and 31 December 2010, was as follows:
2012 2011 2010
Tier I Capital 1,053,597 764,377 637,971Tier II Capital 285,132 380,301 404,788Less: Deductions from capital (46,121) (49,341) (70,722)
Total Capital 1,292,608 1,095,337 972,037
Risk-weighted assets 4,785,870 3,839,462 3,653,247
Total Capital ratio 27.0% 28.5% 26.6%Tier I Capital ratio 22.0% 19.9% 17.5%
Minimum capital adequacy ratio 8.0% 8.0% 8.0%
Financial Statements: Notes to consolidated financial statements continued

Bank of Georgia Holdings PLC Annual Report 2012 177
OverviewPerform
anceGovernance
Financial Statements
Additional Information
Additional Information: Abbreviations
ABCI Aldagi BCI
ADB Asian Development Bank
AGM Annual General Meeting
ALCO Asset and Liability Committee
AML Anti-Money Laundering
APA Agency of Protected Areas
ATMs Automated Teller Machines
AWM Asset and Wealth Management
BGH Bank of Georgia Holdings PLC
BNB Belarusky Narodny Bank
BYR Belarusian Rouble, national currency of the Republic of Belarus
CAGR Compounded Annual Growth Rate
CHF Swiss Franc, national currency of Switzerland
CPI Consumer Price Index
CRM Customer Relationship Management
DFI Developmental Financial Institutions
EBRD European Bank for Reconstruction and Development
EECP Executives’ Equity Compensation Plan
EPS Earnings per share
EUR Euro
FDI Foreign Direct Investment
GBP Great British Pound, national currency of the UK
GDP Gross Domestic Product
GDRs Global Depository Receipts
GEL Georgian Lari or Lari, national currency of Georgia
GLC Georgian Leasing Company
IAS International Accounting Standards
IASB International Accounting Standards Board
IFC International Finance Corporation
IFRS International Financial Reporting Standards
IMF International Monetary Fund
JSC Joint Stock Company
KfW Kreditanstalt fuer Wiederaufbau
KPIs Key Performance Indicators
LSE London Stock Exchange
MLN Million or mln
MPA Motor Personal Accident
MSME Micro Small and Medium Enterprise
MTPL Motor Third Party Liability Insurance
NBG National Bank of Georgia
NBRB National Bank of the Republic of Belarus
NIM Net Interest Margin
NMF Not Meaningful to Present
NPLs Non-Performing Loans
OECD Organisation for Economic Co-operation and Development
PA Personal Accident
POS Point of sale
PPP Purchasing Power Parity
ROAA Return on Average Assets
ROAE Return on Average Equity
SBRE SB Real Estate
SMEs Small and Medium Size Enterprises
TUB Tbiluniversal Bank, Georgia
UAH Ukrainian Hryvna, national currency of Ukraine
UK United Kingdom of Great Britain and Northern Ireland
US$ The US Dollar, national currency of the United States of America

178 Bank of Georgia Holdings PLC Annual Report 2012
Aldagi BCI (ABCI) Aldagi BCI is an insurance and healthcare subsidiary of JCS Bank of Georgia
Asset and Liability Committee (ALCO)
The core risk management body that establishes policies and guidelines with respect to various aspects of risk management strategy
Asian Development Bank (ADB) A regional development bank established to facilitate economic development of countries in Asia
Average Interest Earning Assets Calculated on a monthly basis; Interest earning assets excluding cash include: investment securities (but excluding corporate shares and other equity instruments) and loans to customers and finance lease receivables
Basic EPS Profit for the period from operations attributable to shareholders of the Bank divided by the weighted average number of outstanding ordinary shares over the same period
Belarusky Narodny Bank (BNB) Belarusian banking subsidiary of Bank of Georgia Group
BG Bank Currently PJSC Bank Pershyi. In February 2011, the Group disposed of an 80.0% equity interest in BG Bank
BG Capital The Bank’s wholly-owned subsidiary providing brokerage, custody and corporate finance services
BIS Tier I Capital Adequacy Ratio Tier I Capital divided by Total Risk Weighted Assets, both calculated in accordance with the requirements of Basel Accord I
BIS Total Capital Adequacy Ratio Total Capital divided by Total Risk Weighted Assets, both calculated in accordance with the requirements of Basel Accord I
Book value per share Total aquity attributable to shareholders of the Bank divided by net ordinary shares outstanding at period end; net ordinary shares outstanding equals total number of ordinary shares outstanding at period end less number of treasury shares at period end
Cost of funds Interest expense of the period (adjusted for the gains or losses from revaluation of interest rate derivatives) divided by monthly average interest bearing liabilities; Interest bearing liabilities include: amounts due to credit institutions and amounts due to customers
Cost/Income Ratio Operating non-interest expenses (or operating expenses) divided by revenue
Developmental Financial Institutions (DFIs)
Developmental financial institutions established (or chartered) by more than one country which are subject to international law and whose owners or shareholders are generally national governments, including, among others, the EBRD and IFC
Express Pay terminal A payment terminal enabling customers to make various payments remotely including utility bill payments and loan repayments at a wide variety of locations
Georgian Leasing Company (GLC) The Bank’s wholly-owned subsidiary through which it provides finance leasing services
Geostat National Statistics Office of Georgia
Global Depository Receipt (GDR) A certificate issued by a depositary bank, which represents ownership of an underlying number of shares
Gross loans In all sections of the Annual Report, except for the Consolidated Financial Statements, gross loans are defined as gross loans to customers and gross finance lease receivables
International Finance Corporation (IFC)
A member of the World Bank Group, the largest global development institution focused exclusively on the private sector in developing countries
Kreditanstalt fuer Wiederaufbau (KfW)
German-government owned development bank
Additional Information: Glossary

Bank of Georgia Holdings PLC Annual Report 2012 179
OverviewPerform
anceGovernance
Financial Statements
Additional Information
Liberty Consumer A Georgia-focused investment company in which the Bank holds a 65% stake
Loan yield Interest income from loans to customers and finance lease receivables divided by monthly average gross loans to customers and finance lease receivables
m2 Real Estate Real Estate business of the Group, formerly known as SB Real Estate
Market share(s) Market share data is based on the information provided by the National Bank of Georgia. For Bank of Georgia, market share represents market share based on total assets as of 31 December 2012 (unless noted otherwise) on a standalone basis. For Aldagi BCI, market share is provided based on the gross insurance premium revenue as of 30 September 2012
My Family Clinic Healthcare subsidiary of Aldagi BCI
NBG Tier I Capital adequacy ratio Tier I Capital a divided by Total Risk Weighted Assets, both calculated in accordance with the requirements the National Bank of Georgia instructions
NBG Total Capital adequacy ratio Total Capital divided by Total Risk Weighted Assets, both calculated in accordance with the requirements of the National Bank of Georgia instructions
Net Interest Margin (NIM) Net interest income of the period (adjusted for the gains or losses from revaluation of interest rate derivatives) divided by monthly average interest earning assets including cash for the same period; Interest earning assets including cash include: amounts due from credit institutions, investment securities (but excluding corporate shares and other equity instruments) and loans to customers and finance lease receivables
Net loans In all sections of the annual report, except for the consolidated audited financial statements, net loans are defined as gross loans to customers and finance lease receivables less allowance for impairment
Non-performing loans (NPLs) The principal and interest on loans overdue for more than 90 days and any additional losses estimated by management
Operating cost Other operating expenses
Operating leverage Percentage change in revenue less percentage change in operating non-interest expenses
Reserve For Loan Losses To Gross Loans
Allowance for impairment of loans and finance lease receivables divided by gross loans and finance lease receivables
Return On Average Total Assets (ROAA)
Profit for the period from continuing operations divided by monthly Average Total Assets for the same period
Return On Average Total Equity (ROAE)
Profit for the period from continuing operations attributable to shareholders of the Bank divided by monthly Average Equity attributable to shareholders of the Bank for the same period
TEDxTbilisi TEDxTbilisi is part of the global TEDx family of events. In the spirit of ideas worth spreading, TEDx is a program of local, self-organised events that bring people together to share a TED-like experience (www.ted.com). TED is a nonprofit organisation devoted to Ideas Worth Spreading. Started as a four-day conference in California 26 years ago, TED has grown to support those world-changing ideas with multiple initiatives
Tender Offer BGH a public limited liability company launched the tender offer to exchange its entire ordinary share capital for an equivalent number of the Bank’s ordinary shares and thus to acquire the entire issued and to be issued share capital, including those shares represented by GDRs, of the Bank in December 2011. Tender Offer was successfully completed in February 2012.
Weighted average number of ordinary shares
Average of daily outstanding number of shares less daily outstanding number of treasury shares
Weighted average diluted number of ordinary shares
Weighted average number of ordinary shares plus weighted average dilutive number of shares known to the management during the same period

180 Bank of Georgia Holdings PLC Annual Report 2012
Annual General MeetingThe Annual General Meeting of BGH (the “AGM”) will be held at 10:00 am (London time) on Thursday, 23 May 2013 at Freshfields Bruckhaus Deringer LLP, 65 Fleet Street, London EC4Y 1HS. Details of the business to be conducted at the AGM, are contained in the Notice of AGM which will be mailed to shareholders on or about 18 April 2013 and will be available on the BGH’s website: www.bogh.co.uk
Shareholder inquiriesBGH’s share register is maintained by Computershare. Any queries about the administration of holdings of ordinary shares, such as change of address or change of ownership should be directed to the address or telephone number immediately below. Holders of ordinary shares may also check details of their shareholding, subject to passing an identity check, by visiting the Registrar’s website www.investorcentre.co.uk
Computershare Pavilions, Bridgewater Road Bristol BS99 6ZY United Kingdom
+44 (0)870 873 5866
DividendsOn 8 April 2013, the Directors of BGH declared their intention to recommend an annual dividend in the amount of GEL 1.50 per share (payable in British Pounds Sterling), subject to approval by the shareholders at BGH’s AGM.
As a holding company whose principal assets are the shares of its subsidiaries, BGH relies primarily on dividends from its subsidiaries, principally the Bank to generate reserves necessary to pay dividends to its shareholders.
If the annual dividend is approved at BGH’s AGM on 23 May 2013, BGH envisions the following dividend timetable:
Ex-Dividend Date 5 June 2013 Record Date 7 June 2013 Currency Conversion Date 10 June 2013 Payment Date 19 June 2013
Share price informationAs of the date of this Annual Report, BGH shareholders can access both the latest and historical prices via our website, www.bogh.co.uk, as well as listings in the Financial Times.
Forward Looking StatementsWhere this Report contains forward-looking statements, these are made by the Directors in good faith based on the information available to them at the time of their approval of this Report. These statements should be treated with caution due to the inherent risks and uncertainties underlying any such forward-looking information. The Group cautions investors that a number of important factors, including those in this Report, could cause actual results to differ materially from those contained in any forward-looking statement. Such factors include, but are not limited to, those discussed under “Principal Risks and Uncertainties” on pages 46 to 55 of this Report.
Additional Information: Shareholder information

This report is printed on material that is manufactured from ECF (Elemental Chlorine Free) pulp sourced from certified and well-managed forests and is FSC certified (Forest Stewardship Council). This brochure is 100% recyclable and biodegradable and is printed using vegetable oil based inks.
Designed and produced by Carnegie Orr +44 (0)20 7610 6140 www.carnegieorr.com
For more information on our values see
Pg 4
For more information on our product innovation see
Pg 8
For more information about our Governance see
Pg 68
For more information on our Executive Management team see
Pg 70
Values
Our values keeps us one step ahead, they are integral to the progress and performance of our business.
Team spiriT
passion
innoVaTion
respecT
courage
These values are what makes us unique, helping us feel the future.
Bank of georgia Holdings pLc (“BgH” or “Bank of georgia Holdings”) is a uK-incorporated holding company of Jsc Bank of georgia (the “Bank” or “Bank of georgia”) representing the Bank’s subsidiaries making up a group of companies (the “group”). Bank of georgia is the leading bank in georgia based on total assets (with a 36.7% market share), total gross loans (with a 35.4% market share) and total customer deposits (with a 33.1% market share) as of 31 December 2012.
The Bank has one of the largest distribution networks in georgia, with 194 branches, the largest aTm network in georgia, and a full-service remote banking platform. Bank of georgia offers a broad range of corporate banking, retail banking, asset and wealth management, insurance and brokerage services to its clients. information on Bank of georgia can be found on www.bankofgeorgia.ge and information on Bank of georgia Holdings can be found on www.bogh.co.uk
Products and ServicesWe strive to deliver a high level of customer service through various channels and by offering a new type of banking through constant product innovation.
express BanKing
premium BanKing
morTgages anD creDiT carDs
corporaTe BanKing
asseT anD WeaLTH managemenT
LiFe anD non-LiFe insurance
These help our customers to have access as and when they need our services no matter where they may be.
Governance
We are leaders in delivering strong governance and providing clarity and transparency to all stakeholders.
cusTomers
sHareHoLDers
empLoyees
communiTies
We recognise that good governance makes good business sense, helping us increase performance as we continue to expand.
Team
Our focused Executive Management team are driving the business through thought leadership and recognising opportunities.
LeaDing posiTion
capTure groWTH
increase porTFoLio
maximise reTurns
We aim to continue delivering sound performance for our customers, shareholders and communities we operate in.
Delivering Profitable

feel the futureAnnual Report 2012
Bank of Georgia Holdings PLC 84 Brook Street, London W1K 5EH UK
Bank o
f Geo
rgia H
old
ings P
LC A
nnual Rep
ort 2012