Embed Size (px)
Citation preview

OECD Journal: Financial Market Trends 2014
Volume 2013/2
© OECD 2014
1
Bank business modelsand the Basel system: Complexity
and interconnectedness
by
Adrian Blundell-Wignall, Paul Atkinson and Caroline Roulet*
The main hallmarks of the global financial crisis were too-big-to-fail institutionstaking on too much risk with other people’s money: excess leverage and defaultpressure resulting from contagion and counterparty risk. This paper looks at whetherthe Basel III agreement addresses these issues effectively. Basel III has some veryuseful elements, notably a (much too light “back-up”) leverage ratio, a capital buffer,a proposal to deal with pro-cyclicality through dynamic provisioning based onexpected losses and liquidity and stable funding ratios. However, the paper showsthat Basel risk weighting and the use of internal bank models for determining themleads to systematic regulatory arbitrage that undermines its effectiveness. Empiricalevidence about the determinants of the riskiness of a bank (measured in this study bythe Distance-to-Default) shows that a simple leverage ratio vastly outperforms theBasel Tier 1 ratio. Furthermore, business model features (after controlling for macrofactors) have a huge impact. Derivatives origination, prime broking, etc., carry vastlydifferent risks to core deposit banking. Where such differences are present, it makeslittle sense to have a one-size-fits-all approach to capital rules. Capital rules makemore sense when fundamentally different businesses are separated.
JEL classification: G01, G15, G18, G20, G21, G24, G28
Keywords: Financial crisis, Basel III, derivatives, bank business models, distance-to-default, structural bank separation, banking reform, GSIFI banks
* Adrian Blundell-Wignall is the Special Advisor to the OECD Secretary-General on Financial Markets andDeputy Director of the OECD Directorate of Financial and Enterprise Affairs (www.oecd.org/daf/abw).Paul Atkinson is a former deputy director of the OECD and principal of NHA Economics. Caroline Rouletis an economist and analyst in the OECD Directorate of Financial and Enterprise Affairs. The authors aregrateful for comments made by Delegates at the October 2013 meeting of the OECD Committee onFinancial Markets. This work is published on the responsibility of the Secretary-General of the OECD.The opinions expressed and arguments employed herein are those of the author and do not necessarilyreflect the official views of the Organisation or of the governments of its member countries.
BANK BUSINESS MODELS AND THE BASEL SYSTEM: COMPLEXITY AND INTERCONNECTEDNESS
OECD JOURNAL: FINANCIAL MARKET TRENDS – VOLUME 2013/2 © OECD 20142
I. IntroductionThe Basel Committee on Banking Supervision (BCBS) has continued to lead the process
of bank micro-prudential reform since the global financial crisis in 2008-09, evolving a set of
proposals collectively referred to as Basel III.1 The latter is a vast improvement over Basel II,
which created an across-the-board cut in capital for banks prior to the largest crisis since the
1930s. The BCBS proceeded to revise Basel II by adding on to it a vast set of complex new
rules. The primary focus of the BCBS is on capital rules applied to risk-weighted assets; it has
not been charged with examining the structural business models of banks to which these
capital rules apply. By necessity the process has been one of policy “on the run”, which was
not able to benefit from any evidence-based research. As more and more data on banks since
the crisis comes to hand this situation is changing, and the relative importance of business
model factors and capital and liquidity rules in influencing the riskiness of banks can be
tested. This paper reviews the Basel III proposals, presents new evidence about the factors
determining the riskiness of banks, and asks whether structural reform of banks business
models is a necessary part of the reform process.
There are two broad paths to bank failure: fundamental insolvency and/or liquidity
crises typically arising from counterparty risk. A sudden decline in asset values (if properly
marked to market) can wipe out bank capital. But the very risk of this in a crisis makes
counterparties unwilling to lend, which is especially problematic when banks need cash
and/or liquid securities to meet margin calls for derivatives transactions, repos and other
collateral needs.2 This depends very much on the structural business model of banks. Bad
assets, on the other hand, are easier to hide, particularly when they are illiquid, rely on
mark-to-model valuations and/or are held to maturity in banking books.3 These assets
may take many years to mature, at which time their true recovery value is realised. If it is
below the previously reported value write-downs will follow, and this can go on for some
years after a crisis. Banks in this position (latent insolvency with bank and regulatory
forbearance) are often forced into deleveraging and asset sales. Less important banks are
sometimes forced to fail, though this discipline has been more common in the USA than in
Europe. Where banks are systemically important, governments do intervene to lessen the
deadweight losses to the economy from a systemic crisis, and this sort of implicit
guarantee can lead to the under-pricing of risk, causing leverage and counterparty risk to
be higher than it would otherwise be. The bank is rewarded if the strategy works and the
taxpayer bears the risk alongside shareholders if it fails.
Historically, policy makers have at times, particularly in the USA, combined capital rules
with policies that constrain the business models of banks (such as Glass-Steagall). But this
was gradually undermined by the great push for deregulation in the past few decades. At the
national level regulators are implementing the capital rules in different ways and are also
combining this with some attempts to constrain certain aspects of what banks actually
do, i.e. banks’ business models (Vickers, Volcker, Liikanen, and Swiss “separability”
requirements).4 This paper first looks at the Basel system historically, and then summarises

BANK BUSINESS MODELS AND THE BASEL SYSTEM: COMPLEXITY AND INTERCONNECTEDNESS
OECD JOURNAL: FINANCIAL MARKET TRENDS – VOLUME 2013/2 © OECD 2014 3
most of the key problems with it that contributed to the failure of regulation to avoid the
recent global financial crisis. In Section II the paper summarises the recent Basel III
proposals, and Section III critically analyses them. Section IV presents new empirical
evidence on leverage and business model features that make banks risky and hence need to
be addressed by regulation. That section argues that structural business model measures are
essential alongside capital rules for large banks. Finally, Section V, in concluding, provides a
summary of the main arguments. Annex A sets out the details the Basel III reforms, and
Annex B provides a set of stability results for the modelling of bank risk.
II. The Basel system historicallyCapital regulations under Basel I came into effect in December 1992 (after
development and consultations since 1988).5 The aims were to require banks to maintain
enough capital to absorb losses without causing systemic problems and to level the playing
field internationally (to avoid competitiveness conflicts). A minimum ratio of 4 per cent for
Tier 1 capital (which should mainly be equity less goodwill) to risk-weighted assets (RWA)
and 8 per cent for Tier 1 plus Tier 2 capital (certain subordinated debt, etc.).6 The Basel I risk
weights were fixed by the BCBS. A “revised framework’ known as Basel II was released in
June 20047 after many issues arose with Basel I, most notably that regulatory arbitrage was
rampant.8 Basel I gave banks the ability to control the amount of capital they required by
shifting between on-balance sheet assets with different weights, and by securitising assets
and shifting them off balance sheet – a form of disintermediation. Banks quickly
accumulated capital well in excess of the regulatory minimum, and capital requirements,
in effect, had no constraining impact on bank risk taking.
Basel II cut risk weights across the board and introduced an enormous moral hazard
into the pillar 1 capital rules for large complex banks by letting them use their own internal
risk models to determine the riskiness of assets to which risk weighting would apply. Total
RWA is based on a complex system of risk weighting that applies to “credit”; and adds on a
calculation of “market risk” (MR) and “operational” risk (OR), which are calculated
separately:
RWA = 12.5(OR + MR) + i wiAi [1]
where wi is the risk weight for asset i; and Ai is asset i; OR and MR are directly measured
and grossed up by 12.5 for 8 per cent equivalence; and credit risk is the sum of the various
asset classes, each weighted by its appropriate risk weight. Banks were to be able to choose
between: first, a simplified approach (for smaller institutions without the capacity to
model their business in risk terms) by using revised fixed weights; second, an approach
based on external ratings; and third, an internal ratings-based (IRB) approach for
sophisticated banks, driven by their own internal rating models. This paper focuses mostly
on the latter banks, which are central to the issues of counterparty risk and systemic
issues.
The IRB approach requires banks to specify the probability of default (PD) for each
individual credit, its loss-given-default (LGD), and the expected exposure at default (EED).
This requires highly-complex modelling and aggregation, and offers banks with the
necessary expertise the possibility of deriving more risk-sensitive weights. This approach
requires the approval of the bank’s supervisor. By proposing this system, the BCBS
contributed directly to the build-up of leverage that was one of the principle causes of the
crisis.

BANK BUSINESS MODELS AND THE BASEL SYSTEM: COMPLEXITY AND INTERCONNECTEDNESS
OECD JOURNAL: FINANCIAL MARKET TRENDS – VOLUME 2013/2 © OECD 20144
In previous studies Blundell-Wignall and Atkinson focused on several major problems
with the Basel II approach, notably: portfolio invariance (no penalty for concentration);9 the
assumption of a single global risk factor;10 pro-cyclicality of Basel; inconsistent internal
models used for calculating risk weights and subjective inputs; unclear and inconsistent
definitions (particularly capital); the inadequate treatment of interdependence risk
(especially in the area of derivatives);11 and the failure to deal with business models and
the problem of too-big-to-fail (TBTF) (so that pillar 3 could never work). This latter TBTF
aspect is important not so much because traders and shareholders are not punished by
failed strategies – they are – but rather because other risk-taking institutions can assume
that their counterparty positions will not default if the bank they deal with is TBTF. Risk
taking is under-priced as a consequence. This issue relates to the structure of banks and
their resolvability; while it directly affects the capital risked by a bank, it has not been the
main focus of the BCBS.
III. The Basel III reformsBasel III looks to deal with the above issues by raising the quality of capital; by adding
buffers for large banks; by adding charges for counterparty credit risk and by considering a
very weak leverage ratio.12 Basel III also aims to deal with liquidity coverage issues in the
light of problems that arose in relation to meeting counterparty commitments (derivatives
and repos in particular). It is also working on stable funding to avoid excessive dependence
on short-term wholesale funding to fund long-term assets. Greater monitoring and
disclosure to supervisors of risk factors (e.g. contractual mismatches) not otherwise
directly addressed in the regulations is also mentioned. The main elements of the Basel III
reforms are set out in Annex A.
In 2012 the BCBS launched the Regulatory Consistency Assessment Program (RCAP) to
monitor the consistency of the introduction of Basel III in national jurisdictions and to
provide analyses on the outcomes. The first set of findings published in January 2013 are of
some concern – they show considerable variation in the risk weighting of assets held in the
trading book due to factors other than risk exposure.13
National approaches recognise that Basel III is not enough
The FDIC in the USA has long pointed to the problems with the Basel risk-weighting
approach, which creates only the “illusion of capital adequacy”.14 The Collins Amendment to
the Dodd-Frank Act, drafted by the FDIC, removes trust-preferred securities from Tier 1
capital and establishes that there be two floors for insured deposit institutions, bank and
thrift holding companies and systemically important non-bank financial companies: i) not
less than the generally applicable risk-based capital leverage ratio requirements; and ii) not
quantitatively lower than these requirements as they were in effect for insured depository
institutions as of the date of the enactment of the bill. In July 2013 the FDIC and the US
Federal Reserve issued a joint statement referring to research that shows that the Basel III
3% leverage ratio would have done little to ameliorate the last crisis, and that 8 TBTF US
insured bank holding companies would have to meet a 5% leverage rule, and 6% for insured
depository institutions inside such groups, in order to be considered “well capitalized” for
prompt corrective action purposes. At the same time the Volcker Rule was enacted to take
up the issue of bank separation of certain risky business activities – the latter indicating
agreement with those believing that bank risk could not be left to the Basel III standards
alone.

BANK BUSINESS MODELS AND THE BASEL SYSTEM: COMPLEXITY AND INTERCONNECTEDNESS
OECD JOURNAL: FINANCIAL MARKET TRENDS – VOLUME 2013/2 © OECD 2014 5
The US has introduced the Comprehensive Capital Analysis and Review (CCAR)
exercise and approves the capital plans of 18 bank holding companies (BHC).15 The capital
required is based on rigorous stress testing exercises. The US has doubled the amount of
capital held by these 18 BHCs (to USD 792 bn at the end of 2012 from USD 393 bn in 2008).
In mid-December 2012 the USA has proposed rules to deal with the operation of large
foreign bank organizations (FBOs) in the USA.16 They will be required to create
intermediate holding companies (IHCs) comprising all US banking and non-banking
operations, and all US rules on leverage, separation, etc. will apply to the IHCs (but not to
branches). These IHCs would therefore (if the changes are implemented) face much
tougher rules than in their home countries: US Basel III application, liquidity and leverage
rules. These separated IHCs would also miss out on wider group netting benefits for
derivatives and repos. The equal treatment of IHCs is consistent with the OECD view that
all financial promises should be treated equally in regulations, at least in the USA.
The UK follows Basel III, but puts more weight on national micro and macro prudential
regulation to be conducted within the Bank of England. As with the USA, recent speeches
by the Bank of England have expressed grave reservations about the Basel III approach to
capital rules, and the need to look at bank business models alongside them.17 The
Prudential Regulatory Authority (PRA) is working with individual UK banks to implement
capital plans consistent with the recommendations of the Bank of England’s new Financial
Policy Committee (FPC). Where necessary, and based on stress tests, banks have to meet
capital standards more exacting than Basel III. Following Lloyds, RBS and Nationwide
reviews, the most recent plan announced for Barclays includes new capital issuance, a
disclosure plan for dividends and the achievement of a 3% leverage ratio by June 2014 –
some four years before the Basel III implementation of such a ratio. Recognising that
Basel III leaves business model risk issues on the table, the UK authorities have approved
the ring-fencing of retail banking in the Vickers report.
Europe’s CDR IV follows Basel III more closely than in most other jurisdictions.
However, following the 2011 stress tests, ministers at the EU summit in October of that
year, agreed that a subset of 71 banks in the stress test should meet a CET1 ratio of 9% by
30 June 2012. Europe also aims to move to a banking union with one rule book and a Single
Supervisory Mechanism. The ECB will be the main supervisor, working with national
authorities, though some uncertainty remains about the funding of a single resolution
fund. The ECB would notify the single resolution board, who would notify national
authorities and resolution would occur with a bail in of perhaps 8% of unsecured creditors.
As a pre-requisite for the ECB taking on this role there is to be a “Comprehensive
Assessment” of Europe’s Banks with capital needs assessed including dealing with
forbearance in respect to bad assets. The problem with respect to the “tougher” 9% goal
and the comprehensive assessment, is that banks can meet the target easily by adjusting
(with their models and use of derivatives) the ratio of RWA to total assets (TA). The Basel
ratio is not demanding due to this slippage, and greater credibility would be achieved is the
test was based on a clean leverage ratio concept. Europe too has recognised that Basel III
does not address business model risk issues with its Liikanen report.
Questions of capital and leverage must be considered alongside counterparty risk
arising from bank business model issues: they are interdependent. This view is based on
detailed empirical research using large panels of bank data.

BANK BUSINESS MODELS AND THE BASEL SYSTEM: COMPLEXITY AND INTERCONNECTEDNESS
OECD JOURNAL: FINANCIAL MARKET TRENDS – VOLUME 2013/2 © OECD 20146
Assessing Basel III
Basel III represents an advance over Basel II, and more capital being required; the
deductions from equity to improve the definition of capital; the measures to counter pro-
cyclicality; the revised LCR; and the NSFR idea might be singled out in this respect.
However, using the portfolio invariance principle to add linearly refinements to the Basel II
capital rules adds complexity without considering the business models of the banks to
which they apply. This process is like creating a map on a one-to-one scale, by adding on
more and more granular refinements. The above summary of some of the main features of
Basel III have been accompanied by countless detailed documentation, formulas
clarifications and extensions. This goes on continuously, and examples from mid-2013
alone include: revisions to the leverage ratio, loosening of the LCR rules, changes to the
capital regulations for exposures to CCPs; a clarification on bank equity investment in
funds; LCR disclosure standards; updating the method for identifying global systemically
important banks (G-SIBs) and suggesting higher loss absorbency requirements for them; a
consultative document for non-internal model methods for capitalising CCR exposures;
and much more. Since the Basel III reform process started there are literally thousands of
pages of additional documentation. This certainly adds to bank administrative costs,
where armies of analysts are employed in risk control and compliance divisions; but the
most important question really concerns whether despite all the complexity it is likely to
be the most effective approach to avoiding future crises.
There are two very basic problems with Basel III.
● First it is too complex, allowing large banks plenty of room to manipulate it both with their
models and derivatives thereby avoiding effective control on leverage. In this respect the
RCAP finding in January for the trading book risk weighting variations is no surprise.
● Second, notwithstanding all of the above rules, Basel III has not dealt with bank business
model issues that are at the heart of TBTF under-pricing of risk and the interconnectedness
that is associated with it. Instead the BCBS puts its faith into the capital and liquidity rules,
while moving derivatives towards exchanges and CCPs to handle counterparty risk and will
alleviate the need for banks to hold capital where this is achieved.
Complexity and leverage
The financial system is a system of promises, so the most basic regulatory principle
for financial markets should be that those promises are always treated in the same way, no
matter how they are measured with models, transformed and/or shifted around in the
global markets with derivatives. Basel III has continued with the Basel II IRB approach
relying on banks own modelling of the riskiness of assets for the capital rule, and hence
one should not be surprised that banks will report vastly different levels of capital to
support an identical portfolio of assets. In a sense there is always going to be different
Basel III for every bank in the world. Furthermore, banks can still shift the promises around
by transforming risk with derivatives (particularly CDS) to minimise their capital costs –
including shifting them beyond the jurisdiction of bank regulators – e.g. to the insurance or
hedge fund sectors in a least regulated jurisdiction. While the LCR and NSFR are still under
discussion, the approach suggested also relies on bank estimated payables and receivables
and depositor behaviour in crisis and non-crisis situations. It mimics the capital standards
approach by constructing ratio constraints, assigning weights, and relying on bank
modelling.
BANK BUSINESS MODELS AND THE BASEL SYSTEM: COMPLEXITY AND INTERCONNECTEDNESS
OECD JOURNAL: FINANCIAL MARKET TRENDS – VOLUME 2013/2 © OECD 2014 7
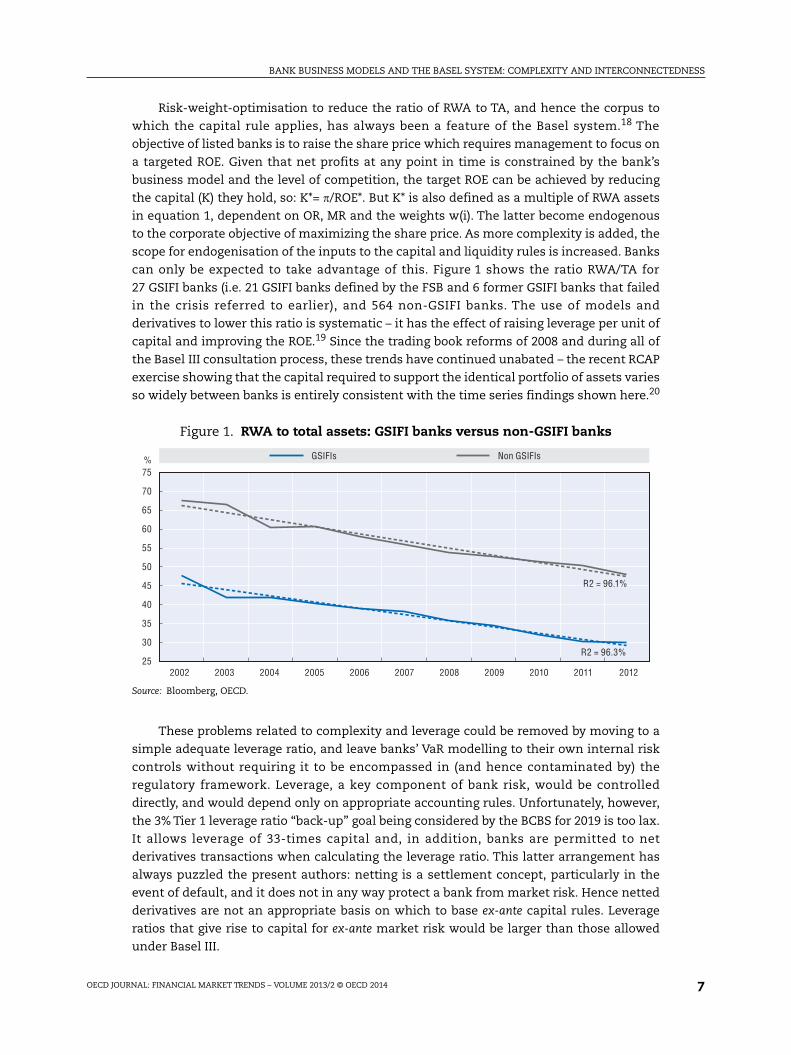
Risk-weight-optimisation to reduce the ratio of RWA to TA, and hence the corpus to
which the capital rule applies, has always been a feature of the Basel system.18 The
objective of listed banks is to raise the share price which requires management to focus on
a targeted ROE. Given that net profits at any point in time is constrained by the bank’s
business model and the level of competition, the target ROE can be achieved by reducing
the capital (K) they hold, so: K*= /ROE*. But K* is also defined as a multiple of RWA assets
in equation 1, dependent on OR, MR and the weights w(i). The latter become endogenous
to the corporate objective of maximizing the share price. As more complexity is added, the
scope for endogenisation of the inputs to the capital and liquidity rules is increased. Banks
can only be expected to take advantage of this. Figure 1 shows the ratio RWA/TA for
27 GSIFI banks (i.e. 21 GSIFI banks defined by the FSB and 6 former GSIFI banks that failed
in the crisis referred to earlier), and 564 non-GSIFI banks. The use of models and
derivatives to lower this ratio is systematic – it has the effect of raising leverage per unit of
capital and improving the ROE.19 Since the trading book reforms of 2008 and during all of
the Basel III consultation process, these trends have continued unabated – the recent RCAP
exercise showing that the capital required to support the identical portfolio of assets varies
so widely between banks is entirely consistent with the time series findings shown here.20
These problems related to complexity and leverage could be removed by moving to a
simple adequate leverage ratio, and leave banks’ VaR modelling to their own internal risk
controls without requiring it to be encompassed in (and hence contaminated by) the
regulatory framework. Leverage, a key component of bank risk, would be controlled
directly, and would depend only on appropriate accounting rules. Unfortunately, however,
the 3% Tier 1 leverage ratio “back-up” goal being considered by the BCBS for 2019 is too lax.
It allows leverage of 33-times capital and, in addition, banks are permitted to net
derivatives transactions when calculating the leverage ratio. This latter arrangement has
always puzzled the present authors: netting is a settlement concept, particularly in the
event of default, and it does not in any way protect a bank from market risk. Hence netted
derivatives are not an appropriate basis on which to base ex-ante capital rules. Leverage
ratios that give rise to capital for ex-ante market risk would be larger than those allowed
under Basel III.
Figure 1. RWA to total assets: GSIFI banks versus non-GSIFI banks
Source: Bloomberg, OECD.
75
70
65
60
55
50
45
40
35
30
25
%
2002 2003 2004 2005 2006 2007 2008 2009 2010 2011 2012
R2 = 96.1%
R2 = 96.3%
GSIFIs Non GSIFIs
BANK BUSINESS MODELS AND THE BASEL SYSTEM: COMPLEXITY AND INTERCONNECTEDNESS
OECD JOURNAL: FINANCIAL MARKET TRENDS – VOLUME 2013/2 © OECD 20148
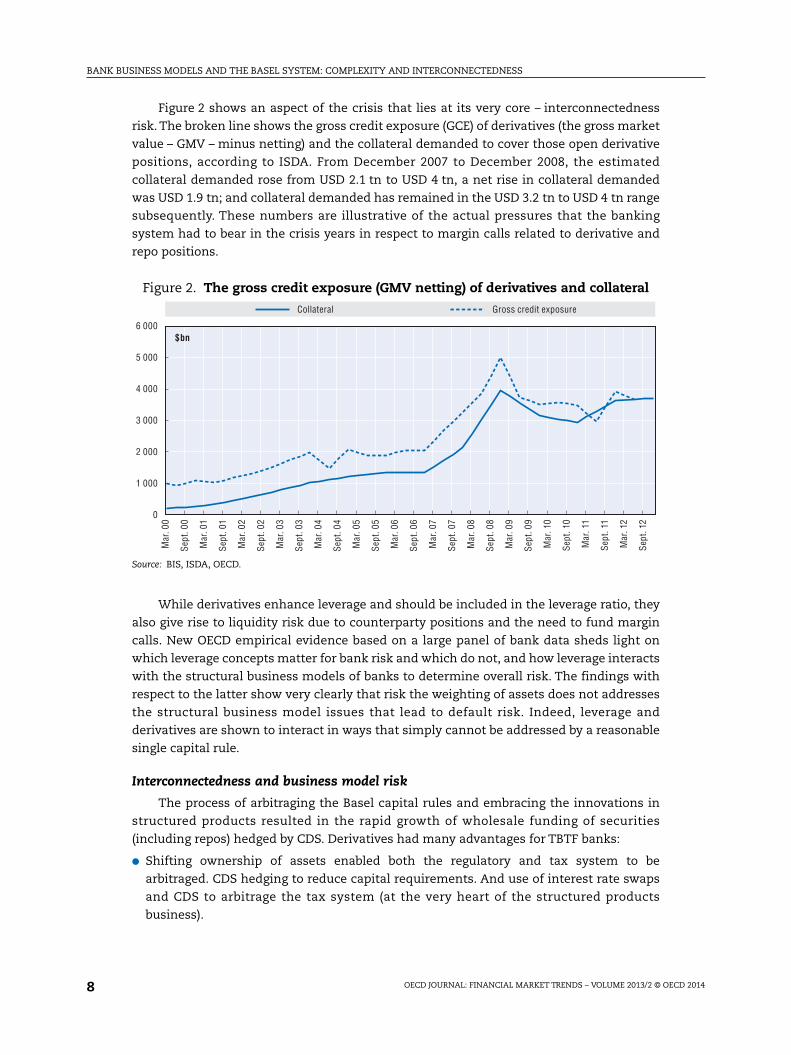
Figure 2 shows an aspect of the crisis that lies at its very core – interconnectedness
risk. The broken line shows the gross credit exposure (GCE) of derivatives (the gross market
value – GMV – minus netting) and the collateral demanded to cover those open derivative
positions, according to ISDA. From December 2007 to December 2008, the estimated
collateral demanded rose from USD 2.1 tn to USD 4 tn, a net rise in collateral demanded
was USD 1.9 tn; and collateral demanded has remained in the USD 3.2 tn to USD 4 tn range
subsequently. These numbers are illustrative of the actual pressures that the banking
system had to bear in the crisis years in respect to margin calls related to derivative and
repo positions.
While derivatives enhance leverage and should be included in the leverage ratio, they
also give rise to liquidity risk due to counterparty positions and the need to fund margin
calls. New OECD empirical evidence based on a large panel of bank data sheds light on
which leverage concepts matter for bank risk and which do not, and how leverage interacts
with the structural business models of banks to determine overall risk. The findings with
respect to the latter show very clearly that risk the weighting of assets does not addresses
the structural business model issues that lead to default risk. Indeed, leverage and
derivatives are shown to interact in ways that simply cannot be addressed by a reasonable
single capital rule.
Interconnectedness and business model risk
The process of arbitraging the Basel capital rules and embracing the innovations in
structured products resulted in the rapid growth of wholesale funding of securities
(including repos) hedged by CDS. Derivatives had many advantages for TBTF banks:
● Shifting ownership of assets enabled both the regulatory and tax system to be
arbitraged. CDS hedging to reduce capital requirements. And use of interest rate swaps
and CDS to arbitrage the tax system (at the very heart of the structured products
business).
Figure 2. The gross credit exposure (GMV netting) of derivatives and collateral
Source: BIS, ISDA, OECD.
6 000
5 000
4 000
2 000
3 000
1 000
0
Collateral Gross credit exposure
$bn
Mar
. 00
Sept
. 00
Mar
. 01
Sept
. 01
Mar
. 02
Sept
. 02
Mar
. 03
Sept
. 03
Mar
. 04
Sept
. 04
Mar
. 05
Sept
. 05
Mar
. 06
Sept
. 06
Mar
. 07
Sept
. 07
Mar
. 08
Sept
. 08
Mar
. 09
Sept
. 09
Mar
. 10
Sept
. 10
Mar
. 11
Sept
. 11
Mar
. 12
Sept
. 12

BANK BUSINESS MODELS AND THE BASEL SYSTEM: COMPLEXITY AND INTERCONNECTEDNESS
OECD JOURNAL: FINANCIAL MARKET TRENDS – VOLUME 2013/2 © OECD 2014 9
● TBTF banks meant that counterparty failure was highly unlikely to result in positions
not being paid out – and certainly this belief was proved valid with the AIG bailout by the
US government. Risk was under-priced. TBTF implicit guarantees affect CDS and other
spreads, and these spreads are built into bank internal risk modelling, systematising the
under-pricing of risk.
● With respect to defaults, both US and EU law exempted all credit collateralised with
securities and any derivatives from the “automatic stay in bankruptcy” and rules on
cross-default clauses. The institutions dealing with these products could in effect front-
run all others in the case of defaults – pushing the risk to other creditors and the
taxpayer – a phenomenon certainly illustrated in the Lehman default.
While GSIFI banks are the core of the derivatives origination business, most banks
were drawn into funding securities with repos, hedging them with CDS, and moving into
the fee-for-sale securitisation businesses. Many mortgage institutions competed for loans
to securitise assets, driving yields down and moving into ever more marginal borrowers. In
this respect it is more correct to say that capital markets banking caused the sub-prime
crisis, rather that the latter causing a crisis in the former.
Counterparty derivatives and repo risk that is separable from leverage rulesIn a complex capital markets banking system a crisis will result in asset price
volatility, and a sharp rise in margin and collateral calls (see Figure 2). These have to be
met. In normal times the repo market and other forms of lending adjust and the system
meets all of its commitments. But in a crisis this lending dries up, and banks fail not
because they are insolvent (even though they may well be) but because liquidity stops
functioning. The central bank responses with respect to quantitative easing in the USA and
LTROs in Europe need to be understood in this context – the inability to meet margin calls
is the rapid path to default.
Collateral calls, tri-partite repos, etc.
Figure 3 shows some elements of the interconnectedness:
● The broker-dealer bank A is engaging in derivative transactions with 2 counterparties B
and C. Following the pale grey arrows for the case of no clearing, bank A is down 100 with
B and up 80 with C. It is therefore exposed to a loss of 80 in the event of the default of C.
For Bank A the Basel III CVA charge would apply to the netting set with C (no offsets in
the simple example, so it applies to the 80).
● A is also down a net 20, when bank B is taken into account, and the crucial point is that
this net 20 margin call has to be funded. Here there are choices, for example: a) If the
bank has a sufficient pool of liquid assets in may sell them for cash, post collateral, and
treat this as a receivable, b) it may use cash to take on offsetting derivatives positions;
and c) it may take short-term repo loan (shown in Figure 3) with a clearing bank. But in a
crisis situation the amounts may too large and liquidity in the repo and derivatives
markets may not be available.21 If the broker dealer can’t meet the margin call
(e.g. Dexia) then it will default.
The typical tri-partite repo transaction may involve a Money Market Fund (MMF)
earning a spread by providing finance to the broker dealer A, with a clearing bank
intermediating and requiring securities as collateral. Liquidity can suddenly dry up due to
a sharp fall in the value of the collateral pool; a refusal of the MMF to roll over a loan; or run
on the deposits of the MMF. In the event of a liquidity halt, the broker dealer will need to

BANK BUSINESS MODELS AND THE BASEL SYSTEM: COMPLEXITY AND INTERCONNECTEDNESS
OECD JOURNAL: FINANCIAL MARKET TRENDS – VOLUME 2013/2 © OECD 201410
have liquid assets on its balance sheet to sell or pledge to meet the call; receive central
bank support; or otherwise default. The tri-partite repo clearing banks centralise risk and
connect multiple institutions, so that interconnectedness risk is a major feature. It is
inconceivable that the authorities in a crisis could allow a clearing bank to fail. This
implicit guarantee to the clearing bank itself causes risk to be under-priced.
Central clearing counterparties (CCPs)
Basel III appears to assume that counterparty risk can somehow be destroyed by
shifting it to a CCP, where the CVA charge is zero. But the CCP needs capital, and it must
model risk and set appropriate margins commensurate with that risk for all of its
counterparties like any other player. Following the dark arrows for the CCP case in Figure 3,
the net exposure is still 20 for the system as a whole, as opposed to gross exposures of 270.
Bank A still needs to sell assets or borrow in the repo market to meet its commitment to
the CCP. The ability of the CCP to guarantee the trades depends on its skill in setting initial
and variation margins, as well as having sufficient capital to cover all default scenarios (the
counterparties are holding a zero CVA charge for these trades). For example, with a major
stress event, suppose that Bank A suddenly owes a net 60, and the clearing bank refuses to
lend it in a crisis. Bank A will fail. The CCP would have to guarantee the trades, but may not
have the capital to do so.
In effect, the CCP is akin to the role of the clearing bank in a tri-partite repo
transaction. Market risk is not destroyed by a CCP, and the problem of the under-pricing of
that risk due to the TBTF implicit guarantee may be significantly worse. The CCP becomes
a vital node, interconnecting multiple players in the financial system. The failure of such a
node would lead to multiple contamination effects compared to bilateral trading.
Governments and central banks could not allow the CCP to fail. Furthermore, since
competition between CCPs can only really take the form of reducing collateral
requirements to make the cost of trading cheaper for counterparties, margins may be
reduced causing systemic risk to rise rather than to fall.
It also needs to be noted that it is the least risky parts of the derivatives market that
can be subject to clearing, e.g. the large standardised and liquid interest rate swap market.
Rather it is the derivatives that cannot easily be cleared that were in the forefront of
problems. The non-cleared derivatives market includes inter alia the following:
● Very long-term interest rate swaps (e.g. 15-19 years) sought after by pension and
insurance companies for liability management. A part of this market is non-standard
and can’t be cleared.
Figure 3. Collateral and margin calls
1090
80
100
1020
20
Tripartiterepo
CCP Broker DealerA
Broker DealerB
Broker DealerC

BANK BUSINESS MODELS AND THE BASEL SYSTEM: COMPLEXITY AND INTERCONNECTEDNESS
OECD JOURNAL: FINANCIAL MARKET TRENDS – VOLUME 2013/2 © OECD 2014 11
● Single name CDS. The CDS has the potential for extreme collateral call shifts when the
probability of the default of the reference entity increases (these are popular for
regulatory and tax arbitrage).
● Swaptions – options on interest rate swaps (the rights to swap fixed and variable interest
rates). This is a large market is crucial in managing long-term interest rate risk across
many industries. For example, if rates were thought to rise in the longer run, then a firm
would have the option (not obligation) by exercising a swaption to pay fixed and receive
the rising floating rate interest payments. These can be up to 30 years maturity and are
highly illiquid. They can’t be eligible for clearing.
● Forward rate agreement market for currencies with long horizons.
● Parts of the overnight index swap market. The floating rate leg is based on the reference
rate of Fed funds or Libor, and it allows very short-term borrowers to manage interest
rate risk inherent in sudden changes in cost of funding and income received on longer-
term assets.
● Many OTC commodity, energy and equity derivatives can’t be cleared.
Consider the following example. If a user takes a position in volatility with a swaption,
the trader will typically hedge the market risk in the position with an interest rate option
notional amount equal to some percentage of the swaption (the maturity and coupon of
the swap would mirror those of the swap on which the swaption is based). But if the swap
in mandated to be cleared with the CCP and the swaption is executed bilaterally, there is
no benefit in clearing the swap from a risk point of view. The greater complexity may raise
risk and will certainly increase collateral costs compared to keeping the swap and the
swaption together bilaterally.22
CVA approach leads to concentration bias
Does the Basel III CVA charge deal adequately with counterparty risk? The CVA charge
applies additively across netting sets. This creates an incentive for increased concentration
in the derivatives market. If B and C are one bank, forming a single new netting set, then
instead of exposure to a loss of 80, bank A will be exposed only to a net loss of 20 within the
netting set, and the CVA charge will be reduced (and reduced to zero if centrally cleared).
The bank will be exposed to the same liquidity risk, but would hold less capital to deal with
it. The Basel III CVA rule will encourage the larger broker dealers to trade with each other,
raising the TBTF problem in the derivatives market and reducing competition. As noted in
respect to leverage ratios, netting is a settlement concept, and it does not in any way
mitigate market risk. Basing an ex ante capital rule on a settlement exposure concept
makes little sense.
IV. New empirical evidence on leverage and interconnectedness riskWhile Basel III has propelled reform of capital rules, there has been no consensus on
what to do about the risks created by the structure of bank business models. Approaches
to the latter include the Vickers recommendations;23 the Dodd-Frank Act Volcker rule;24
and the Liikanen proposal that is influencing decisions in a number of European countries
including France and Germany.25 Most international organizations have focused on
replacing Basel II with Basel III, improved supervision, better disclosure and cross-border
co-operation. Better resolution regimes are proposed to deal with TBTF.26 Academics have
stressed the difficulties of interpreting rules based on separation proposals, and some have

BANK BUSINESS MODELS AND THE BASEL SYSTEM: COMPLEXITY AND INTERCONNECTEDNESS
OECD JOURNAL: FINANCIAL MARKET TRENDS – VOLUME 2013/2 © OECD 201412
been strongly against it.27 These proposals have not, however, been informed by empirical
research on the determinants of sudden moves of banks towards the default point. This
section tests the Basel Tier 1 ratio, alongside a simple leverage ratio (with no Basel II
netting) and the key business model attributes of banks.
The distance-to-default
The starting point is to define a measure of the riskiness of individual banks that can
serve adequately as the dependent variable in the panel regression study. The distance-to-
default (DTD) is a measure that uses a combination of bank reported data, and market
information to calculate the number of standard deviations a bank is from the default
point, where the market values of assets equals the book value of debt. The formula to
calculate the distance-to-default is derived from the option pricing model of Black and
Scholes (1973) and is set out as follows:
DTDt [2]
Where: Vt: Market value of bank’s assets at time t,
rf: Risk-free interest rate,
Dt: Book value of the debt at time t,
2t: Volatility of the bank’s assets at time t,
T: Maturity of the debt.
The calculation is set out in more detail in Appendix 1 of Blundell-Wignall and
Roulet (2012).
From 1997 to 2004 the DTD typically averaged 3 standard deviations in 69 large banks
in the USA, UK, the Euro area and Switzerland.28 The weighted average DTD fell to 0 for
banks in the UK and the USA, implying systemic insolvency, with many individual banks
below the zero point. The average DTD fell to below 1 in Europe, with some major banks
below the solvency point. The USA has recovered more quickly in 2011-12, while many
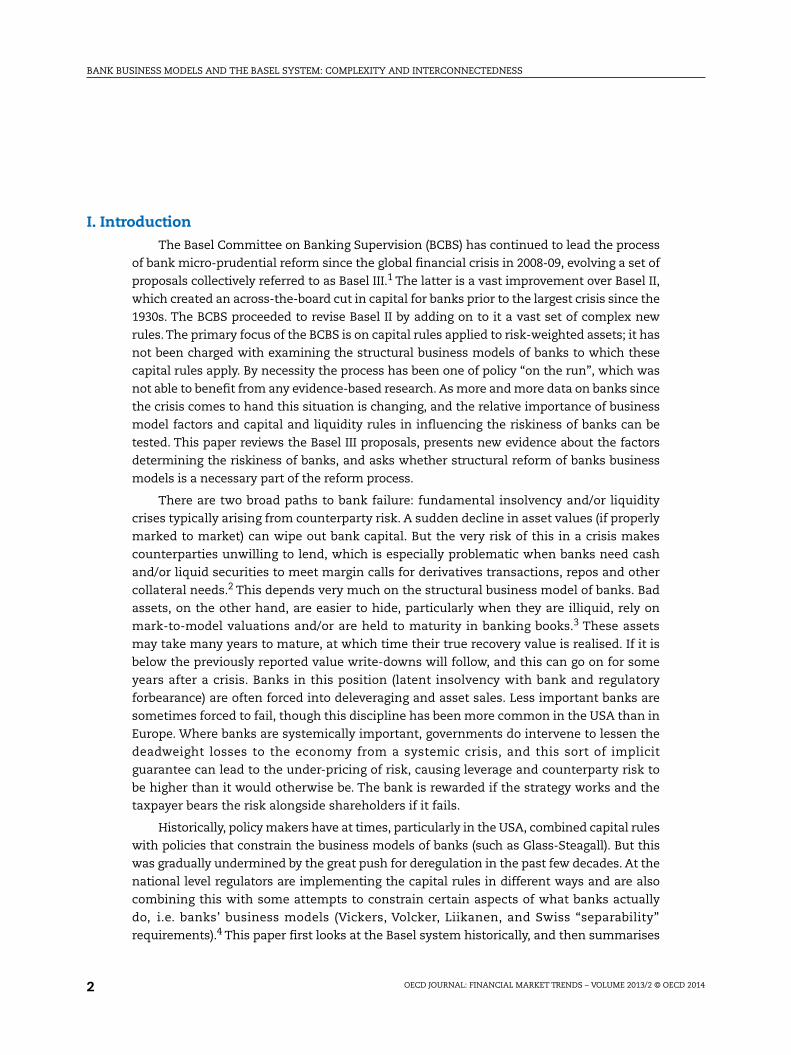
European banks are still not at a safe point. Figure 4 shows the DTD for individual banks
(shown simply with a number on the horizontal axis) for the most recent year 2012 (the UK
and Swiss banks are shown with Europe). It is very clear that the US response to the crisis,
with forced capital injections following proper stress tests on bank assets has led to US
banks moving back well above the safe zone of 3 standard deviations, while European
banks are more vulnerable.29
Modelling the DTD
Recent empirical work by the OECD looks at the effects of the macro cycle and
business model features of banks on their systemic riskiness, and the complex interaction
of these factors bears directly on the debates about micro- and macro-prudential policy.
This study extends the sample to large G20 banks (compared to that for US and European
banks in Blundell-Wignall and Roulet (2012) for which all of the required data (particularly
derivatives) is correctly reported in gross terms. The measure of the riskiness of banks used
in this empirical work is the above concept of the DTD.
log .V
Dr T
T
t
tf
t
t
2
2

BANK BUSINESS MODELS AND THE BASEL SYSTEM: COMPLEXITY AND INTERCONNECTEDNESS
OECD JOURNAL: FINANCIAL MARKET TRENDS – VOLUME 2013/2 © OECD 2014 13
A panel regression approach is used to explain the differences in DTDs across banks
over the period 2005-2012. The sample consists of the top G20 internationally active
commercial banks and broker-dealer banks by equity market capitalisation, for those
banks where all the data required is available. In addition, six banks that failed in the crisis,
but which can be considered as GSIFIs, HBOS, Merrill Lynch, Lehman Brothers, Washington
Mutual, Wachovia and Bear Stearns are included. This is essential, as they are the main
banks of size whose assets were absorbed by others included in the sample – they act
essentially as dummy variables for the M&A activity involved that would otherwise distort
the results with breaks in the data on leverage ratios, etc. – evidence on the robustness of
this procedure is presented in the Annex B. There are a total of 90 banks in the sample,
consisting of 26 FSB GSIFI banks (excluding non-listed banks), 6 failed former GSIFI banks,
and 58 other large banks.
The empirical model takes account of systemic importance, leverage, and business
model aspects. The model is estimated with two alternatives for leverage: the leverage
ratio and the regulatory capital approach of the Basel Tier 1 ratio. The variables and results
are shown in Table 1. LEV corresponds to the simple leverage ratio (total assets TA divided
by core equity, with no risk weighting of assets, no netting of derivatives and US bank
leverage is based on IFRS conversions), which is expected to have a negative sign. T1 is the
Basel Tier 1 ratio based on risk-weighted-assets (T1/RWA), which is expected to have a
positive sign. TD is the sum of the trading book and available-for-sale securities, and is
expected to have a positive sign. The reason for this is that liquidity drives the banks’ path
to default in practice, when margin and collateral calls cannot be met. Liquid assets can be
sold or used as collateral making a bank safer. WFD refers to wholesale funding as a share
of total liabilities and is expected to have a negative sign – higher wholesale funding
typically at a shorter duration is less stable than deposits for funding longer term assets.30
GMV refers to the gross market value of derivatives as a share of the banks’ total assets –
appropriately converting all US banks to the IFRS concept for consistency. GMV is expected
to have a negative sign – this is the quintessential interconnectedness variable where
volatility drives rapid changes in margin requirements. BETA is a systemic importance
variable, defined as the covariance of the firm’s stock price with the national stock market,
Figure 4. Distance-to-default in 2012: US versus Europe
Source: Bloomberg, authors’ calculations.
7
6
5
4
3
2
1
0
-11 3 5 7 9 11 13 15 17 19 21 1 3 5 7 9 11 13 15 17 19 21 23 25 27 29 31 33 35 37 39 41 43 45 47
Std Dev.
At 31 March 2013
European banksUS banks

BANK BUSINESS MODELS AND THE BASEL SYSTEM: COMPLEXITY AND INTERCONNECTEDNESS
OECD JOURNAL: FINANCIAL MARKET TRENDS – VOLUME 2013/2 © OECD 201414
using daily data to calculate annual observations, divided by the variance of the national
stock index. It is expected to have a negative sign, on the grounds that the firm is more
connected to the national macro and asset price cycle. Finally, %HPI refers to the annual
percentage change in the national house price index, and is expected to have a positive
sign as rising prices improve a borrower’s equity in the home and vice versa.
Causality in the model is tested with an error correction model shown at the bottom
of the table: the DTD in the current year adjusts to the gap between the actual DTD and its
predicted level in the previous year. All of the error correction terms are large coefficients
(rapid adjustment within the year) and are significant at the 1% level.31 The full set of
results and stability robustness in the face of different sample periods and the treatment
of M&A through the crisis is presented in the Annex B.
The results may be summed up as follows:
● The Basel Tier 1 ratio appears to find no support as a determinant of the DTD. The simple
leverage ratio case is the preferred model, shown in the first column of the first data
panel.32 LEV is well determined at the 1% level, for all banks, for the GSIFI banks and for
the other large bank panels. A cut in leverage from say 50 (not un-typical of a GSIFI bank)
to the OECD preferred maximum of 20 would raise the DTD by 1.2 standard deviations.
● The macro control variables in house prices and the market BETA are correctly signed
and significant at the 1% level, across all models.
● In terms or arguments relating to the business model, the GMV of derivatives and
wholesale funding have the expected negative signs and are significant at the 1% level
for the full sample and for the GSIFI group. GSIFI banks with derivatives exposure of over
40% of their balance sheet (e.g. banks that engage in prime broking, etc.) are quite
common and are of fundamental systemic significance. The OECD recommends
separating those banks that undertake prime broking, market making, underwriting and
origination once they exceed a GMV derivatives threshold of 10% of the balance sheet. A
reduction from 40% to 10% would raise the DTD by 1 standard deviation using the full
sample model and by 1.4 standard deviations using the GSIFI model.
● Wholesale funding is negatively linked to the DTD: a 20 percentage point cut would raise
the DTD by 0.5 standard deviations.
● Trading assets have the expected positive sign that find support at the 5% level for the
full sample and the GSIFI banks, but not in a sample of traditional banks that excludes
the GSIFIs. A 20 percentage point rise would raise the DTD by 0.9 standard deviations.
The results and policy issues
These results are intended to inform the debate on what matter for bank risk, thereby
filling a gap whereby the regulatory response to the crisis has been made in a more ad hoc
way: i.e. by responding to past events and consulting with the financial industry. Empirical
evidence is important, as it focuses the debate in a more scientific way – if there are
mistakes in the data treatment and model variables, then what are they and what other
hypotheses can be tested?

BANK BUSINESS MODELS AND THE BASEL SYSTEM: COMPLEXITY AND INTERCONNECTEDNESS
OECD JOURNAL: FINANCIAL MARKET TRENDS – VOLUME 2013/2 © OECD 2014 15
Given the process of innovation, it is possible that rules imposed by regulation may be
actively worked around. This appears to be the case for the Basel T1 ratio which is
uncorrelated with bank risk. The leverage ratio on the other hand is highly significant, and
perhaps it too would be worked around were it to become binding. The current authors
believe this is less likely, because the measure used in the study eliminates the
mechanisms that the Basel approach builds explicitly into the capital rules: that banks own
models are used to determine the risk weights, including the way derivatives are modelled
and netted in the bank. If capital is the maximum of T1 or 1/LEV, the T1 can never be
binding in a strong demand environment as banks can always solve for the weights on
assets and use derivatives to ensure that T1 1/LEV. The leverage ratio in conditions of
strong credit demand will be the binding ratio: oddly, it could become both a maximum as
well as a minimum capital rule at such times.
The other interesting feature of the results is that the business model features of
derivatives, wholesale funding and trading securities (related to counterparty exposures,
liquidity issues and the TBTF cross-subsidisation of risk for GSIFI banks) are quite
independent of leverage. These risks can become dominant and need to be treated
separately from leverage.
Table 1. Determinants of bank distance-to-default: Multivariate panel results
All banks GSIFIs banks Other large banks
Constant, 8.17***(7.15)
6.74***(4.75)
11.21***(6.94)
6.55***(8.72)
LEV: TA/Bank Equity -0.04***(-3.30)
- -0.03***(-3.21)
-0.05***(-2.53)
T1: Basel Tier 1 Ratio - 2.24(0.58)
- -
TD: Trading Book plus Available for Sale Securities/TA 4.51 **(2.06)
3.72(1.47)
3.34 **(2.16)
3.79(1.51)
WFD: Wholesale Funding/Total Liabilities -4.14***(-3.04)
-4.54 **(-2.31)
-6.78***(-2.47)
-1.81(-1.30)
GMV: GMV of Derivatives/TA -3.48***(-2.42)
-5.39 **(-2.21)
-4.79***(-3.02)
-3.26(-0.37)
BETA: CoVar Bank Stock Ret. with Ntl. Mkt Ret./Var. Mkt -1.47***(-5.36)
-1.33***(-3.61)
-2.61***(-4.75)
-1.21***(-3.47)
%HPI: House Price Index ann. % change 16.29***(4.98)
17.45***(4.12)
20.10***(6.70)
17.32***(4.75)
DUM_MA: Dummy equals to 1 following M&A, else 0 - - - -
R2 0.69 0.65 0.73 0.67
Fisher Statistic 11.25 9.47 12.58 9.76
P-Value F 0.00 0.00 0.00 0.00
Total Observations 569 569 201 368
VECM 1-year lagged residual (Engel & Granger test) -0.85***(-17.72)
-0.85***(-18.01)
-0.78***(-11.05)
-0.90***(-14.20)
Note: This table shows the results of estimating multivariate regressions for an unbalanced panel of 108 US andEuropean internationally active commercial banks and broker dealers with equity market capitalisation in excess ofUSD 5 bn over the period 2004-12. Cross-section and time fixed effects are used in the regressions as is the Whitediagonal covariance method. *, ** and *** indicate statistical significance at the 10%, 5% and 1% levels, respectively. TheVECM error correction results show adjustment of the current DTD to the previous year gap between the predicted andactual values, allowing one lagged innovation in the standard model. See Ericsson and MacKinnon (2002).

BANK BUSINESS MODELS AND THE BASEL SYSTEM: COMPLEXITY AND INTERCONNECTEDNESS
OECD JOURNAL: FINANCIAL MARKET TRENDS – VOLUME 2013/2 © OECD 201416
No one capital rule will suffice
When the DTD measure is back-engineered to calculate the additional amount
of capital that would be required by banks through the crisis period to keep the level above
3.0 standard deviations (a safe level, implying a less than 1% chance of default, where
extreme market volatility doesn’t take the bank quickly to the zero level) it becomes clear
that any capital rule will be insufficient for the GSIFI banks.33
● In 2009, the 69 large US and European banks in this study had USD 1.6 trillion in capital,
but those below 3 standard deviations in the DTD would have required USD 4.5 trillion
more to stay at the safe level (almost a quadrupling).
● The GSIFI banks in this group had USD 1.1 trillion of the capital, but would have required
USD 3.6 trillion in addition to have been safe: i.e. to not have required capital injections
and “back-door” support on a massive scale by the world’s central banks. The capital rule
cannot possibly come close to making these banks safe without addressing the business
model issues and TBTF.
The issue for GSIFI banks arises because of what they do in the capital markets
unrelated to deposit taking and lending: origination (including derivatives), market making
(prime broking) and underwriting. These are very different businesses, which require
inventories of securities subject to mark-to-market price and volatility shifts, particularly
where margin and collateral calls are concerned and liquidity is critical. To hold capital
even remotely near the levels needed in the good times to be safe in a tail risk event would
seem to be unreasonable.
Where vast differences in business models are concerned it makes no sense to aim for
a one-size-fits-all capital rule (neither Basel T1 nor LEV). Such a single rule does not exist.
It is for this reason that the OECD argues for separating the fundamentally different
business model features in a non-operating holding company (NOHC), where the
subsidiaries are ring-fenced in a legal structure that is binding. In the case of a separation
between a core deposit taking bank and a securities subsidiary, the structure implies
explicitly that the creditors of the latter cannot chase the assets and capital of the former
(and vice versa). This ensures that the risks of these very different businesses will be priced
according to where they are taken, without the implicit subsidy of a TBTF bank. The cost of
capital and credit will rise for the securities subsidiary and the business will be smaller for
the same allocation of capital from the non-operating parent. Different minimum leverage
rules can apply to the deposit bank (at least 5%) and the securities firm (lower). The core
deposit bank will be safer and the securities subsidiary will not be TBTF. If a universal bank
has derivatives exposure that is above 10% of TA on an IFRS basis, it is moving into
businesses that go beyond the normal hedging required for its assets and liabilities and
should be considered for separation.34 The size of trading assets and available for sale
securities is clearly an ameliorating factor, which is very relevant for stand-alone
investment banks. Provided these banks are on a level playing field with NOHC separated
securities subsidiaries of previously universal banks, then the pricing of risk should work
to adjust the size and structure of their businesses over time in all of the right directions.
This would be in strong contrast to the Lehman Brothers episode, where that investment
bank was a direct beneficiary of its treatment under Basel in the interbank market, and was
able to use counterparties where TBTF cross-subsidisation of risk was very much present.

BANK BUSINESS MODELS AND THE BASEL SYSTEM: COMPLEXITY AND INTERCONNECTEDNESS
OECD JOURNAL: FINANCIAL MARKET TRENDS – VOLUME 2013/2 © OECD 2014 17
V. Concluding remarksBasel II proposed changes to the capital requirement rules that allowed large banks to
run their own internal models to calculate the riskiness of the assets to which the capital
rules would apply, introduced pro-cyclicality into those rules, and did so at a time when
financial innovation made it easier for banks to shift risk via securitization, CDS and off-
balance sheet exposures. Banks systematically reduced the ratio of RWA/TA and had
insufficient capital to deal with the crisis as it emerged. This crisis had at its core both
leverage and interconnectedness risk related to the changing business models in banking.
In reforming Basel, the BCBS sought to add linearly greater complexity to the system
utilizing the Basel model properties of portfolio invariance. This complexity has made it
even more difficult to bring capital rules into alignment for all financial institutions – it has
not achieved the regulatory principle that the financial promises should be treated in the
same way no matter where they are shifted. Furthermore, the panel regression results
showed that the DTD is correlated with the simple leverage ratio but not at all with the
Basel Tier 1 ratio; yet despite the evidence, the reform process continues to focus on
allowing banks to run complex models for risk weighting to control leverage, while
business model features that have strong independent effects on the DTD have not been
the subject of co-ordinated global reforms.
The Basel add-on proposals for interconnectedness risk and central clearing are
untested, and there has been no sign of the size of derivatives businesses and repo funding
in GSIFI banks being reduced by current and prospective Basel reforms. The CVA charge
applies at the netting set level, and is additive across netting sets. Like other aspects of
Basel, the approach does not reward diversification. A large number of netting pools will
give rise to less scope for cross-product netting that would risk more positive CVA charges
with volatility events. If larger GSIFI banks choose to deal more and more with each other,
they increase the scope for cross-product netting and reduce the CVA charge possibility.
Hence the Basel rule encourages more concentration in derivatives – it increases the TBTF
problem in derivatives rather than reducing it. Furthermore, netting is a settlement process
concept – netting provides no protection for market risk. Basing capital rules on netting
pool is not in the interests of the future stability of the financial system.
As noted before, the panel regression results suggest that a simple leverage ratio is
essential, but it cannot compensate for the large impact on the DTD of business model
features. This brings the discussion back to the necessity of structural separation and
where the lines for separation should be drawn. The bank regulators paradox is that large
complex and interconnected banks need very little capital in the good times, but they can
never have enough in an extreme crisis. Separation of fundamentally different business
segments is required to deal with this problem. Derivatives should be the most important
flag for a separation rule.
Notes
1. See all of the BCBS references below, all available at www.bis.org/bcbs/index.htm.
2. Similarly, fear of insolvency can lead to a run on deposits. This can be the most rapid path todefault.
3. Such as level 2 and level 3 assets, i.e. assets that do not have a fair market value or are illiquid.
4. See US Congress (2010), ICB (2011), Liikanen (2012) and FINMA (2013).
BANK BUSINESS MODELS AND THE BASEL SYSTEM: COMPLEXITY AND INTERCONNECTEDNESS
OECD JOURNAL: FINANCIAL MARKET TRENDS – VOLUME 2013/2 © OECD 201418
5. See BCBS (1988).
6. Banks may use a default risk weighting or a sophisticated internal model approach to defining howrisk assets are – the lower the risk the lower the weight for capital purposes. A third tier of capitalis defined in the Market Risk Amendment to the original accord.
7. See BCBS (2004).
8. See Jackson (1999).
9. See Gordy (2003).
10. See Gordy (2003). Almost prophetically, he says: “A single factor model cannot capture anyclustering of firm defaults due to common sensitivity to these smaller scale components of theglobal business cycle. Holding fixed the state of the global economy, local events in, for example,France are permitted to contribute nothing to the default rate of French obligors. If there are indeedpockets of risk, then calibrating a single factor model to a broadly diversified international creditindex may significantly understate the capital needed to support a regional or specialized lender.”
11. See for example Blundell-Wignall and Atkinson (2008, 2010, 2011) and OECD (2009).
12. See BCBS (2011).
13. See BCBS (2013c). In fact for portfolios of identical assets the gap between the highest to the lowestcapital needed to support the portfolio was 300%.
14. See Hoenig (2013) and also Norton (2013).
15. See Federal Reserve (2013).
16. See Federal Reserve (2012).
17. See Andrew Haldane (2012, 2013).
18. Basel II permitted sophisticated banks to model the riskiness of their own portfolios to calculaterisk-weighted assets (RWA) to which the capital rules were applied – an approach that continuesunder Basel III. By reducing the ratio of RWA to total assets banks are able to minimise the capitalrequired to conduct their activities and hence to expand leverage. The change in SEC rules in 2004allowed investment banks to be supervised on a consolidated entities basis, in place of the strictSEC limitations on leverage. This was equivalent to the regulatory minimum that US banks wouldneed to operate in Europe. The huge problems with the move to Basel II were at the heart of theproblem. See Blundell-Wignall and Atkinson (2008, 2010, 2011, 2012); Blundell-Wignall et al. (2012);and Blundell-Wignall and Roulet (2012).
19. The BCBS has started to look at risk-weight manipulation via modeling and to take it moreseriously; see BCBS (2013c).
20. Variants of this chart and commentary may be found in Blundell-Wignall and Atkinson (2008, 2011).
21. It is surprising how many economists, bankers and financial analysts point out that these clearingbanks got through the crisis without failing, as though this suggested that the structures were safe.These views make no allowance for the massive support and bailouts that banks received fromgovernments (particularly the US). Allowing AIG to fail for example could have collapsed the entireedifice. This is not the structure that is desirable for the future.
22. In other words, the delta and gamma of a long-dated interest rate hedge may end up residing indifferent silos.
23. Blundell-Wignall et al. (2009). See ICB (2011).
24. See section 619 of Dodd-Frank (US Congress, 2010).
25. Liikanen (2012).
26. For example, see IMF (2011), p. 2.
27. See Duffie (2012) for the former and Goodhart (2011) for the latter.
28. This sample includes the largest publicly traded commercial banks in the USA and in Europe withtotal assets that exceed USD 50 bn. The GSIFI banks comprise 21 of the GSIFI banks in the USA andEurope, as officially defined by the FSB in November 2011. Banks are left out where the data did notextend back to 1997.
29. A standard deviation of 2 implies a 5% chance of default, which is too high for the global financialsystem.

BANK BUSINESS MODELS AND THE BASEL SYSTEM: COMPLEXITY AND INTERCONNECTEDNESS
OECD JOURNAL: FINANCIAL MARKET TRENDS – VOLUME 2013/2 © OECD 2014 19
30. This is short-term (including repo) and some longer-term debt securities that need to be rolled – itexcludes deposits, equity, subordinated debt and derivatives liabilities from total liabilities.
31. The error correction equation takes the lagged residuals of the panel regression, and allows for onelagged change in the dependent variable.
32. The T1 variable is not significant in any of the sub models, and these are not shown for simplicity.
33. See Blundell-Wignall and Roulet (2013) where these calculations are set out in full.
34. For example, Wells Fargo, a large US GSIFI that is very safe, requires only around 7% of its portfolioon an IFRS no-netting basis to run its business. It would not be considered for separation undersuch a proposal.
References
BCBS – Basel Committee on Banking Supervision (1988), International Convergence of Capital Measurementand Capital Standards, July.
BCBS – Basel Committee on Banking Supervision (2004), International Convergence of Capital Measurementand Capital Standards: A Revised Framework, June.
BCBS – Basel Committee on Banking Supervision (2006), International Convergence of Capital Measurementand Capital Standards: A Revised framework – Comprehensive Version, June.
BCBS – Basel Committee on Banking Supervision (2009a), Revisions to the Basel II Market Risk Framework,consultative document, January.
BCBS – Basel Committee on Banking Supervision (2009b), Analysis of the Trading Book Impact Study,October.
BCBS – Basel Committee on Banking Supervision (2011), Basel III: A Global Regulatory Framework for MoreResilient Banks and Banking Systems; revised version, June.
BCBS – Basel Committee on Banking Supervision (2013a), Basel III: The Liquidity Coverage Ratio andLiquidity Risk Monitoring Tools, January.
BCBS – Basel Committee on Banking Supervision (2013b), Revised Basel III Leverage Ratio Framework andDisclosure Requirements, June.
BCBS – Basel Committee on Banking Supervision (2013c), Regulatory consistency assessment programme(RCAP) – Analysis of risk-weighted assets for market risk, January (rev. February).
Black, F., and M. Scholes (1973), “The Pricing of Options and Corporate Liabilities”, Journal of PoliticalEconomy, Vol. 81, Issue No. 3.
Blundell-Wignall, A. and C. Roulet (2012), “Business Models of Banks, Leverage and the Distance toDefault”, OECD Journal: Financial Market Trends, Vol. 2012, Issue No. 2.
Blundell-Wignall, A. and C. Roulet (2013), “Bank Business Models and the Separation Issue”, OECDJournal: Financial Market Trends, Vol. 2013, Issue No. 2.
Blundell-Wignall, A. and P.E. Atkinson (2008), “The Subprime Crisis: Causal Distortions and RegulatoryReform”, in: Lessons From the Financial Turmoil of 2007 and 2008, Kent and Bloxham (eds.), ReserveBank of Australia.
Blundell-Wignall, A. and P.E. Atkinson (2010), “Thinking Beyond Basel III: Necessary Solutions forCapital and Liquidity”, OECD Journal: Financial Market Trends, Vol. 2010, Issue No. 1.
Blundell-Wignall, A. and P.E. Atkinson (2011), “Global SIFIs, Derivatives and Financial Stability”, OECDJournal: Financial Market Trends, Vol. 2011, Issue No. 1.
Blundell-Wignall, A. and P.E. Atkinson (2012), “Deleveraging, Traditional versus Capital MarketsBanking and the Urgent Need to Separate GSIFI Banks”, OECD Journal: Financial Market Trends,Vol. 2012, Issue No. 1.
Blundell-Wignall, A., G. Wehinger and P. Slovik (2009), “The Elephant in the Room: The Need to Focuson What Banks Do”, OECD Journal: Financial Market Trends, Vol. 2009, Issue No. 2.
Blundell-Wignall, A., P.E. Atkinson and C. Roulet (2012), “The Business Models of Large InterconnectedBanks and the Lessons of the Financial Crisis”, National Institute Economic Review, No. 221.
BANK BUSINESS MODELS AND THE BASEL SYSTEM: COMPLEXITY AND INTERCONNECTEDNESS
OECD JOURNAL: FINANCIAL MARKET TRENDS – VOLUME 2013/2 © OECD 201420
Blundell-Wignall, A. and P. Slovik (2010), “The EU Stress Test and Sovereign Debt Exposures”, OECDWorking Papers on Finance, Insurance and Private Pensions, No. 4, August, available at www.oecd.org/dataoecd/17/57/45820698.pdf.
Brunnermeier, M., A. Crockett, C. Goodhart, A.D. Persaud, and H. Shin (2009), The Fundamental principlesof financial regulation, Geneva Report, CEPR.
Duffie, D. (2012), “Market Making Under the Proposed Volcker Rule”, Working Paper, Stanford UniversityGraduate School of Business; available at www.darrellduffie.com/uploads/policy/DuffieVolckerRule.pdf.
Ericsson, N.R. and J.G. MacKinnon (2002), “Distributions of Error Correction Tests for Cointegration”,Econometrics Journal, vol. 5, pp. 285-318.
FDIC – Federal Deposit Insurance Corporation (2005), “Capital and Accounting News... Basel II and thePotential Effect on Insured Institutions in the United States: Results of the Fourth QuantitativeImpact Study (QIS-4)”, Supervisory Insights, Winter, pp. 27-32.
Federal Reserve (2012), Proposed Rules to Strengthen the Oversight of U.S. Operations of Foreign Banks,14 December.
Federal Reserve (2013), Comprehensive Capital Analysis and Review 2013: Assessmant Framework andResults, 14 March.
FINMA (2013), FINMA Position Paper on the Resolution of Systemically Important Banks, Swiss FinancialMarket Supervisory Authority (FINMA), Switzerland, July; available at www.finma.ch/e/aktuell/Pages/mm-pos-sanierung-abwicklung-20130807.aspx.
Goodhart, C.A.E. (2013), “The Optimal Financial Structure”, LSE Financial Markets Group Paper Series,Special Paper 220.
Gordy, M.B. (2003), “A Risk-Factor Model Foundation for Ratings-Based bank Capital Rules”, Journal ofFinancial Intermediation, 12 (3).
Haldane, A. (2012), The Dog and the Frisbee, speech given at the Federal Reserve Bank of Kansas City’s36th Economic Policy Symposium “The Changing Policy Landscape”, Jackson Hole, Wyoming.
Haldane, A. (2013), Constraining Discretion in Bank Regulation, speech given at the Federal Reserve Bankof Atlanta conference on “Maintaining Financial, Stability: Holding a Tiger by the Tail(s)”, FederalReserve Bank of Atlanta.
Hoenig, T. (2013), Basel III Capital: A Well-Intended Illusion, speech delivered to the InternationalAssociation of Deposit Insurers, Basel, April.
ICB – Independent Commission on Banking (2011), Final Report: Recommendations (“Vickers report”);September, London; available at www.hm-treasury.gov.uk/d/ICB-Final-Report.pdf.
Jackson, P. (1999), “Capital Requirements and Bank Behaviour: The Impact of the Basel Accord”, BaselCommittee on Banking Supervision Working Papers, No. 1, April.
Kane, E.J. (2006), “Basel II: a Contracting Perspective”, NBER Working Papers, 12705, November.
Liikanen, E. (2012), High-Level Expert Group on Reforming the Structure of the EU Banking Sector: Final Report;Brussels, October; available at http://ec.europa.eu/internal_market/bank/docs/high-level_expert_group/report_en.pdf.
Norton, J.O. (2013), A More Prominent Role for the Leverage Ratio in the Capital Framework, Remarks by FDICDirector Jeremiah O. Norton to the Florida Bankers Association Orlando, Florida, 6 February 2013;available at http://fdic.gov/news/news/speeches/spfeb0613.html.
OECD (2009), The Financial Crisis: Reform and Exit Strategies, OECD Publishing, Paris; available atwww.oecd.org/dataoecd/55/47/43091457.pdf.
US Congress (2010), Dodd-Frank Wall Street Reform and Consumer Protection Act (2009), H.R. 4173 – 111thCongress; available at www.govtrack.us/congress/bill.xpd?bill=h111-4173.

BANK BUSINESS MODELS AND THE BASEL SYSTEM: COMPLEXITY AND INTERCONNECTEDNESS
OECD JOURNAL: FINANCIAL MARKET TRENDS © OECD 2014 21
ANNEX A
Summary of the Basel III reforms
Main features of the Basel III capital regulation reform● Raising the quality consistency and transparency of the capital base: Basel III stresses that
quality equity is the best form of capital and hence requires multiple deductions from
common equity (goodwill; minority interest; deferred tax assets net of liabilities; bank
investments in its own shares; bank investments in other banks, financial institutions
and insurance companies (with the 10% rule); provisioning shortfalls; and other minor
deductions, such as the banks’ defined-benefit pension scheme holdings of the bank’s
shares. Criteria for Tier 2 capital are toughened: it must be subordinate to depositors,
have a 5-year minimum maturity and there must be no incentives to redeem. Tier 3
capital is abolished. Common Equity T1 (CET1) as a percent of RWA is to be phased in
from 3.5% in 2013 to 4.5% by 2015, and total Tier 1 from 4.5% to 6% over the same period.
● Capital Conservation Buffer: Outside of periods of stress a buffer is to be phased in to 2.5%
above the CET1 minimum by 1 January 2019. This may be run down in periods of stress,
and built up again afterwards (e.g. by reducing discretionary dividend distributions,
buybacks and staff bonus payments).
● Dealing with pro-cyclicality: To deal with this problem, largely introduced by Basel II
anyway, a countercyclical buffer will apply, which can vary in a range of 0-2.5%, based on
national authorities assessment of excess credit growth, weighted by the operations of
the bank in all its different jurisdictions. More forward – looking provisioning shortfalls
to be deducted from equity should also be seen in the context of addressing pro-
cyclicality, as should the longer-run calibration of the PD in modelling risk.1
● The 2019 introduction of a leverage ratio: The BCBS is proposing a parallel run (2013 to 2017)
that could result in a 3% leverage ratio based on Tier 1 capital, maintained on a 3-month-
ended basis from 2019. Banks have begun testing this now to see what it means for their
businesses. Exposure consists of on-balance sheet assets, plus derivatives at
replacement cost with positive values (plus an add-on for potential future exposure, e.g.
5% or 10%), plus securities financing, plus other off-balance sheet exposures (with a
100% credit conversion factor). Legally valid bilateral netting of derivative transactions is
allowed for calculating derivatives exposure.2 For written credit derivatives the full
notional value is to be used in the exposure measure, but any purchased CDS on the
same reference entity can be netted if its remaining maturity is equal to or greater than
the written derivative. Collateral received can’t be netted against derivatives exposure –
the replacement cost of derivatives must be grossed up by any collateral used to reduce

BANK BUSINESS MODELS AND THE BASEL SYSTEM: COMPLEXITY AND INTERCONNECTEDNESS
OECD JOURNAL: FINANCIAL MARKET TRENDS – VOLUME 2013/2 © OECD 201422
its net value. This is because collateral received doesn’t reduce leverage as the bank can
re-hypothecate the collateral received. Collateral provided must gross up the exposure
measure where it would otherwise reduce on-balance sheet exposure: under IFRS the
fall in cash assets is grossed up by a rise in receivables. Under GAAP where derivative
instruments are held off balance sheet the replacement cost is to be arrived at by
summing the positive fair values. For credit derivatives the full notional value of written
contracts must be reduced by any purchased CDS of the same reference entity, where the
maturity of the purchased CDS is greater than the written CDS.
Dealing with systemic risk and interconnectedness● The Trading Book reforms of 2008: An Incremental Risk Charge (IRC) equal to the estimated
default and migration risk of un-securitised products over a 1-year capital horizon,3 to
allow for credit default and migration risk in bank trading books. These types of losses
cannot be captured in banks’ shorter-term VaR modelling. This is aimed at providing for
the sort of losses that resulted from banks unwinding trading book assets in illiquid
markets in 2008; it has the effect of adding to RWA.
Subsequently, Basel III attempts further to deal with interconnectedness risk by better
calibration of the capital rules:
● A capital requirement for counterparty credit risk (CCR): Using stressed inputs, helping to
remove pro-cyclicality that might arise from using current volatility-based risk inputs.
● Credit valuation adjustments (CVA): Capital charges on positive exposures which are
(therefore) associated with the deterioration in the creditworthiness of a counterparty (as
opposed to its outright default), valuing counterparty risk in bond equivalents and
applying the market risk (MR) regulatory charge to such bond equivalents (after deducting
the IRC). Transactions with a Central Clearing Counterparty – CCP – can be excluded, as
can certain non-material securities financing transactions. The CVA is calculated within
each of the netting sets, and is then added across netting sets.4 Banks employ CVA desks
to hedge with external counterparties to get CVA credit offsets to this charge.
● A pillar 1 capital charge for wrong-way risk: Transactions with counterparties, especially
financial guarantors, whose PD is positively correlated with the amount of exposure.
This will be done by adjusting the multiplier applied to the exposure amount identified
as wrong-way risk.
● An asset valuation correlation multiplier (AVC): Of 1.25, to be applied to exposures to
regulated financial firms with assets of at least USD 100 bn (since AVCs were 25% higher
during the crisis for financial versus non-financial firms). This would have the effect of
raising risk weights for such exposures.
● The application of tougher (longer) margining periods: As a basis for determining regulatory
capital when banks have large and illiquid derivative exposures to counterparties.
● A zero risk weight for counterparty risk exposure with exchanges and CCPs: Hence creating an
incentive to use exchanges and CCPs (since higher charges will apply for bilateral OTC
derivatives).
Dealing with liquidity coverage issues5
● The Liquidity Coverage Ratio: Banks are required to maintain a ratio equal to or greater
than 100% of High Quality Liquid Assets (HQLA) to total net cash outflows for the next 30
days (enough to cover a stressed event).
BANK BUSINESS MODELS AND THE BASEL SYSTEM: COMPLEXITY AND INTERCONNECTEDNESS
OECD JOURNAL: FINANCIAL MARKET TRENDS – VOLUME 2013/2 © OECD 2014 23
● HQLA: Consists of level 1 assets which are mostly those used in central bank transactions,
such as cash, central bank reserves, securities backed by some sovereigns and central
banks; plus level 2 assets, category A (certain sovereign debt, covered bonds and corporate
debt), and category B (lower-rated corporate bonds, residential mortgage backed securities,
and certain equities). Level 2 assets can be at most 40% of HQLA and 2B at most 15%.
● Cash net outflow: Consists of payables liabilities (including off-balance sheet commitments)
multiplied by the rates that they are expected to run down in a stressed event, less
receivables times the rate at which they are expected to flow in. Inflows are capped at 75%
of expected outflows to ensure a minimum HQLA holding. In normal periods the ratio is
maintained, but can be used with supervisory approval in the event of a stress event.
Proposals under consideration with respect to stable funding● Net Stable Funding Ratio: While work is still on-going (to be reported in 2014), the proposal
is that banks maintain a ratio equal to or greater than 100% of available stable funding to
required stable funding.
● Available Stable Funding: Is defined as: Tier 1 and Tier 2 capital (100%) + preferred stock not
in Tier 2 with maturity 1 year (100%) + liabilities 1 year (100%) + stable shorter-term retail
and small business funding (with € 1 m per customer) (85%) + less stable (e.g. uninsured
non-maturity) retail and small business funding (70%) + unsecured wholesale funding (50%).
Central bank discounting is excluded to avoid over reliance on central banks.
● The Required Stable Funding (RSF): Is based on balance-sheet and off-balance-sheet
exposures, and is defined as: cash, securities 1year, loans to financial firms 1year (0%)
+ unencumbered marketable sovereign, central bank, BIS, IMF, etc., AA or higher with a
0% Basel III risk weight (20%) + Gold, listed equities, corporate bonds AA- to A- 1year,
loans to non-financial corporate 1year (50%) + loans to retail clients (85%) + all else
(100%). Off-balance-sheet exposures to be included are conditionally revocable and
irrevocable credit facilities to persons, firms, SPVs and public sector entities: a 10% RSF
of the currently undrawn portion. All other obligations will have an RSF set by the
national supervisor.
Notes
1. The Basel III proposals are broadly consistent with the 2009 independent Geneva Report, seeBrunnermeier et al. (2009), which favours leaning into the credit cycle. However, the authorspropose that micro-prudential policy should fall to national Financial Stability Authorities,consolidating all financial institutions at a national level, while macro prudential should fall to thenational central bank, which would co-ordinate site inspections and other roles with the financialstability authority (FSA). National FSAs are recommended, as national authorities pay in the caseof defaults. But international co-ordination should be achieved with supervisory colleges.
2. See BCBS (2013b). The sum of all positive and negative mark-to-market values.But not anycontracts with walk away clauses, e.g. no obligations to a defaulter counterparty.
3. At the 99% confidence interval.
4. The notional of the bond is the EAD of the counterparty (treated as fixed); the maturity of the“bond” is the effective maturity of the longest dated netting set of a counterparty; and the timehorizon is one year (as opposed to the 10-day period for MR).
5. This was softened greatly, compared to the original cash and government bonds focus, as itbecame clear that collateral shortage is a major issue; see BCBS (2013a).

BANK BUSINESS MODELS AND THE BASEL SYSTEM: COMPLEXITY AND INTERCONNECTEDNESS
OECD JOURNAL: FINANCIAL MARKET TRENDS – VOLUME 2013/2 © OECD 201424
ANNEX B
The DTD model and stability tests
The empirical model takes account of macro-prudential influences, leverage, and
business model aspects. The equation is estimated with two alternatives for leverage: the
leverage ratio and the regulatory capital approach of the Basel Tier 1 ratio. The empirical
model is specified in equation (A1); where the subscripts i and t denote the bank and the
period, respectively:
[A1]
K corresponds to the simple rule leverage ratio (LEV), which is expected to have a
negative sign, or to the Basel tier 1 ratio (T1), which is expected to have a positive sign. The
equation is estimated twice, once with LEV, excluding the Basel capital concept, and once
with T1, excluding the simple leverage ratio. Other variables are as defined in the text. The
two equations for the LEV and T1 alternatives are estimated for all banks, the GSIFI banks
and the other large banks in the sample, using ordinary least heteroskedasticity of error,
cross-section and time-fixed effects are introduced into the regression. The regression
results for the full sample period are shown in Table B1.*
The two columns for the “all banks” sample and the first columns (for LEV) in the
“GSIFI banks” and “Other large banks” correspond to those in the main text. Two forms of
stability tests are carried out. First, for the “GSIFI banks” case, the 6 large banks that failed
in the crisis but were absorbed by other GSIFI banks are included to act as dummy variables
for M&A. Otherwise the large jumps in assets and liabilities for the absorbing bank might
distort the results. In the column marked “GSIFI banks-FSB”, only those banks on the FSB
GSIFI list are included, and the panel regression is run with dummy variables that take on
a value of 1.0 from the date of acquisition and 0 elsewhere. There are no significant
differences for the parameters for the GSIFI banks-FSB case.
The second stability test is to run the model over a shorter sample period from
2004-10, which includes sufficient observations for robust estimation, and appropriate
variability of the data in crisis and pre-crisis years. The main features of the results are:
● The leverage ratio has the correct sign and remains significant at the 1% level in all
8 models for the 2 sample periods. The Basel T1 ratio on the other hand remains
insignificant and changes sign between the different panels. The leverage ratio appears
to be stable for the full large sample of GSIFI and non-GSIFI banks. However, for the
* This analysis adds a further year to the one reported in Blundell-Wignall and Roulet (2012).
DTD K TD WFD GMV BETAi t i t i t i t i t i t i t, , , , , , , 2 3 4 5 7 88% ,HPIi t

BANK BUSINESS MODELS AND THE BASEL SYSTEM: COMPLEXITY AND INTERCONNECTEDNESS
OECD JOURNAL: FINANCIAL MARKET TRENDS – VOLUME 2013/2 © OECD 2014 25
Table B1. Determinants of bank distance-to-default: Multivariate panel results2005-12
All banks GSIFIs banks GSIFIs banks - FSB Other large banks
Constant, 8.17***(7.15)
6.74***(4.75)
11.21***(6.94)
10.36***(3.89)
10.57***(4.90)
9.45***(3.86)
6.55***(8.72)
5.74***(4.54)
LEV: TA/Bank Equity -0.04***(-3.30)
- -0.03***(-3.21)
- -0.04***(-4.09)
- -0.05***(-2.53)
-
T1: Basel Tier 1 Ratio - 2.24(0.58)
- -2.49(-0.35)
- 0.10(0.02)
- -1.05(-0.22)
TD: Trading Book plus Availablefor Sale Securities/TA
4.51 **(2.06)
3.72(1.47)
3.34 **(2.16)
1.80(0.80)
3.99***(2.74)
2.43(1.22)
3.79(1.51)
4.44(1.50)
WFD: Wholesale Funding/TotalLiabilities
-4.14***(-3.04)
-4.54 **(-2.31)
-6.78***(-2.47)
-8.46 **(-2.14)
-6.59***(-2.41)
-8.09 **(-2.13)
-1.81(-1.30)
-3.29 *(-1.85)
GMV: GMV of Derivatives/TA -3.48***(-2.42)
-5.39 **(-2.21)
-4.79***(-3.02)
-7.21***(-2.50)
-4.51 **(-2.27)
-6.25 **(-2.05)
-3.26(-0.37)
-4.38(-0.49)
BETA: CoVar Bank Stock Ret.with Ntl. Mkt Ret./Var. Mkt
-1.47***(-5.36)
-1.33***(-3.61)
-2.61***(-4.75)
-2.12***(-3.43)
-2.12***(-3.10)
-1.85***(-3.05)
-1.21***(-3.47)
-1.17***(-2.80)
%HPI: House Price Index ann.% change
16.29***(4.98)
17.45***(4.12)
20.10***(6.70)
21.49***(4.75)
20.31***(4.62)
20.64***(4.36)
17.32***(4.75)
17.19***(4.29)
DUM_MA: Dummy equalsto 1 following M&A, else 0
- - - - -1.22***(-3.94)
-1.05***(-3.32)
- -
R2 0.69 0.65 0.73 0.68 0.72 0.67 0.67 0.64
Fisher Statistic 11.25 9.47 12.58 10.37 12.25 10.25 9.76 8.36
P-Value F 0.00 0.00 0.00 0.00 0.00 0.00 0.00 0.00
Total Observations 569 569 201 201 191 191 368 368
VECM 1-year lagged residual(Engel & Granger test)
-0.85***(-17.72)
-0.85***(-18.01)
-0.78***(-11.05)
-0.80***(-11.56)
-0.77***(-10.66)
-0.81***(-11.24)
-0.90***(-14.20)
-0.70***(-11.88)
Source: Authors’ calculations.
Table B2. The model tested over a shorter sample period: 2007-10
All banks GSIFIs banks GSIFIs banks - FSB Other large banks
Constant, 5.17***(3.80)
3.87***(3.62)
9.88***(7.41)
7.18***(4.17)
7.69***(7.80)
6.80***(4.13)
3.96***(2.36)
4.23***(3.40)
LEV: TA/Bank Equity -0.04***(-3.93)
- -0.03***(-3.31)
- -0.03***(-3.43)
- -0.01***(-3.95)
-
T1: Basel Tier 1 Ratio - -1.60(-0.43)
- 5.14(0.65)
- 4.89(0.60)
- -4.43(-1.27)
TD: Trading Book plus Availablefor Sale Securities/TA
7.59***(4.49)
7.35***(3.35)
6.31***(3.18)
5.50 **(1.96)
7.01***(3.94)
5.71 **(2.04)
2.30 *(1.73)
3.08***(2.36)
WFD: Wholesale Funding/TotalLiabilities
-2.15 *(-1.72)
-2.13(-1.34)
-9.24***(-3.97)
-8.23***(-2.93)
-6.77***(-6.26)
-7.56***(-2.86)
0.73(1.54)
0.28(0.50)
GMV: GMV of Derivatives/TA -4.10***(-3.74)
-6.49***(-4.49)
-5.97***(-3.58)
-7.41***(-5.63)
-4.60***(-2.64)
-7.27***(-5.65)
-6.11(-1.08)
-9.41(-1.44)
BETA: CoVar Bank Stock Ret.with Ntl. Mkt Ret./Var. Mkt
-0.85***(-3.05)
-0.76 **(-2.22)
-1.94***(-4.80)
-1.55***(-8.62)
-1.33***(-3.67)
-1.42***(-8.44)
-0.96***(-2.70)
-0.86 *(-1.83)
%HPI: House Price Index ann. %change
12.39***(3.03)
13.67***(2.62)
11.62***(3.17)
12.70***(2.78)
11.39***(2.65)
11.98***(2.58)
10.57 **(2.24)
10.78 **(2.24)
DUM_MA: Dummy equalsto 1 following M&A, else 0
- - - - -0.40***(-2.47)
-0.14(-0.96)
- -
R2 0.63 0.61 0.71 0.65 0.65 0.61 0.44 0.44
Fisher Statistic 3.86 3.64 4.53 3.85 3.51 3.21 2.64 2.12
P-Value F 0.00 0.00 0.00 0.00 0.00 0.00 0.00 0.00
Total Observations 303 303 104 104 98 98 199 199
Source: Authors’ calculations.

BANK BUSINESS MODELS AND THE BASEL SYSTEM: COMPLEXITY AND INTERCONNECTEDNESS
OECD JOURNAL: FINANCIAL MARKET TRENDS – VOLUME 2013/2 © OECD 201426
“Other large banks” sub-sample the leverage ratio appears to strengthen in the full
sample to a value of -0.05 (Table B1), versus -0.01 in the short sample (Table B2).
● The GMV of derivatives business model feature appears to be robust and stable between
the 2 periods.
● The wholesale funding and trading securities variables for the most part seem well
determined, but have larger (correctly signed) coefficients in the short sample.
● The macro-control variables are very well determined, and have smaller values in the
short sample.
In all cases the causality in the model, tested with an error correction model shown at
the bottom of the table, show large coefficients (rapid adjustment) and are significant at
the 1% level.
It is not surprising that there should be some structural changes in coefficients in
samples that run through the global crisis and sweeping regulatory changes. The current
authors feel it is perhaps surprising how well the model holds up in terms of its basic
insights. This empirical work is not intended to find a stable forecasting model. Rather, it
is intended to provide empirically-based insights for regulators as to what appears to
matter for the safety of banks. Using the full sample, with as much variability of data as
possible is best suited to this end.