Embed Size (px)
Citation preview

THIS REPORT CONTAINS ASSESSMENTS OF COMMODITY AND TRADE ISSUES MADE BY
USDA STAFF AND NOT NECESSARILY STATEMENTS OF OFFICIAL U.S. GOVERNMENT
POLICY
Date:
GAIN Report Number:
Approved By:
Prepared By:
Report Highlights:
Soybean area and production levels for MY 2018/19 (July-June) are projected to increase to 80
thousand hectares (HA) and 152 thousand metric tons (MT) respectively, due to a switch from Boro rice
production. Post’s soybean planting area and production estimates for MY 2017/18 are lowered to 60
thousand HA and 114 thousand MT due to unsuitable conditions for planting at the optimal time, and
the shift of land to Boro rice cultivation due to an expected higher harvest price. MY 2018/19 soybean
and soymeal imports are estimated to increase to 1.1 MMT and 550 thousand respectively, to keep pace
with demand in the feed industry, as well as growth in the livestock and fisheries sectors. The import of
edible oil for MY 2018/19 is forecast at 2.4 MMT on expected lower international prices and fast
growing demand by an increasing population.
Tanvir Hossain, Agricultural Specialist
Mark A. Myers, Agricultural Attaché
2018
Oilseeds and Products Annual
Bangladesh
BG1802
3/19/2018
Required Report - public distribution

Commodities:
Oilseed: Soybean
Production:
Post forecasts marketing year (MY) 2018/19 cultivation area for soybean at 80 thousand hectares (HA).
Assuming normal weather conditions during the planting and growing stage and average yield, soybean
production is forecast to increase by 33 percent to 152 thousand MT in MY 2018/19 (Jul-Jun) due to
increased production area compared to MY 2017/18.
Post estimates a 27 percent reduction in cultivated area to 60 thousand hectares compared to USDA
official estimates in MY 2017/18. Farmers switched to Boro rice cultivation with an expectation of a
higher price for unhusked rice (paddy), and a shortage of seed for planting. In addition, some farmers
were unable to plant soybeans at the appropriate time, as the land was not in optimal condition for
planting due to water stagnation. Soybeans for MY 2017/18 were planted in January-February and will
be harvested by April-May. Post forecasts five percent lower production to 114 thousand MT in MY
2017/18 due to lower cultivated area based on a normal yield of 1.9 MT/ha.
Post also estimates 21 percent lower production to 120 thousand MT in MY 2016/17 due to crops
damaged by heavy rainfall just before the harvest in mid-April 2017. The harvested area in that market
year is also estimated lower at 65 thousand hectares compared to planted area of 81 hectares.
Among oilseeds in Bangladesh, in fiscal year (FY) 2016-17, soybeans are the fourth ranked crop in
terms of total planted area at 9.82% of total oilseed planted area; mustard dominates with 67%, followed
by sesame (10.88%), groundnuts (11.55%) and others (sunflower, linseed) respectively (Figure 2) (See
Table 5). That in large part reflects the priorities of the Bangladesh Agricultural Research Institute
(BARI) and Bangladesh Institute of Nuclear Agricultural (BINA), which are funded by the government
of Bangladesh. These institutes’ current research efforts for soybean are just 10% of total oilseed
research, compared with 70% for mustard.
About 70 percent of soybean farmers are cultivating the variety “Shohag”, which was officially released
in 1990; its average yield is 1.8-2 ton per hectare. Bangladesh Agricultural Research Institute (BARI)
developed variety BARI Soybean-5 and BARI Soybean-6 which is planted by some 30 percent of
soybean farmers. These high yield BARI varieties are popular, but supply constraints limit their impact
in the field and overall yields remain flat, which in turn hinders growth of this subsector.
Poor soil and competing crops limit the area available for soybean cultivation. Soybean competes with
crops like rice (Boro season rice), ground nut, and sunflower in the river basin islands (charland) of the
southern coastal part of the country. Charland is available for soybean cultivation because poor
irrigation facilities and increasing water salinity in the late winter and summer season make charland
unsuitable for Boro season rice production. Soybean cultivation in general requires less irrigation and
less fertilizer. The lower production costs, coupled with good market prices, give farmers a premium for
soybeans and ground nuts compared to other seasonal crops.

Palm cultivation for commercial use is starting at a nascent level. Some farmers are trying to raise palm
at a farm-level scale, but palm production does not receive the support of Bangladesh extension services.
Consumption:
In MY 2018/19 soybean crushing is expected to increase by 4.35 percent to 1.2 million MT due to
gradual increased capacity of millers to meet the steady demand of soymeal for the feed industry, and
the rising demand of animal protein and soybean oil for human consumption.
Human consumption as a grain, or any other non-oil form, is expected to be stable at five thousand MT
in MY 2018/19, driven by production of various soy-based processed foods and food supplements in
relation to more health consciousness by the consumer.
Growth and expansion of the feed industry, as well as the poultry and livestock sectors, is a result of
increasing consumption of meat, eggs and fish. Compared to CY 2010, the per capita consumption of
chicken was increased by 54 percent, egg consumption by 89 percent and fish intake increased by 26
percent in CY 2016 (See Table 6).
Trade:
Post estimates soybean imports in MY 2018/19 are projected to rise by 4.76 percent to 1.1 MMT due to
increasing demand for soymeal as raw materials used in animal feed and for soybean oil use in daily
cooking. In MY 2017/18, imports are expected to rise to 1 MMT on strong demand in the crushing
industry. Soybeans imported from the United States (US) account for 93 percent market share, with 9
percent growth rate annually, with a forecasted rise in imports to 1.05 MMT in MY 2018/19. A poultry
feed sector insider reported that leading poultry producers put emphasis on quality feed that has a higher
protein percentage. Feed with US soybean-sourced soymeal has extra value when farmers demand high
quality feed. Feed used in egg production also prefer US soybean based soymeal, realizing that it
improves egg quality.
Commodity:
Oil Meal: Soymeal
Production:
Domestic soymeal production is shares 64 percent of the demand generated by stable and expanding
feed industries. In MY 2018/19, post forecasts soymeal production to increase by 4.49 percent to 930
thousand MT driven by increasing demand in the feed industries. Feed industries are expanding to
supply feed for not only poultry and other livestock sectors, but also for the aquaculture sector which is
growing nine percent annually and produced 2.33 million MT of fish in FY 2016-17.
The two major oilseed crushing plants in Bangladesh have an estimated capacity of 4,200 MT/day (max
7000 MT/day), with the facility to crush soybean, mustard and rapeseed. Since 100 percent of imported
soybean is crushed to produce meal and oil, the surge in imports of soybean gradually reduces the yearly
percentage increase in imports of soymeal. Sources indicate that the increased tariff on soymeal will

likely lead to capacity expansion and establishment of more crushing plants. Strong soybean imports and
domestic production have enabled soybean crushing plants to increase soymeal production.
Consumption:
Based upon the normal increasing pace of feed demand and consumption in the poultry, aqua and
livestock sectors in MY 2018/19, feed waste and domestic consumption is projected to grow by 3.57
percent to 1.45 MMT. Investment in the aqua and poultry sector is increasing as the sector ramps up to
reach capacities to supply increasing demands for protein consumption. The poultry sector contributes
86 percent of livestock sector production and cultured fisheries share 57 percent of the total fish
production in the country. The growth of contribution to Gross Domestic Product (GDP) by the fisheries
sector is 6.23 percent and 3.31 percent by livestock sector in FY 2016-17, which is higher than
agriculture and forestry sector (1.96 percent).
Industry reports indicate that poultry farms of all sizes number about 65-70 thousand and are growing at
the rate of 10-15% per year. Aquaculture farms number about 2 million and the area under production
(metric tons per hectare) is increasing at 5.7% per year. A total of 100 fully automated feed mills, and 45
small and medium feed mills, produce 7.26 MMT of feed for the livestock sector, including poultry
(3.61 MMT), cattle (2.22 MMT), and aquaculture (1.43 MMT).
Raw materials used for poultry feed production include maize (55-65 percent), soybean meal (20-25
percent), mustard oil cake (10-25 percent), rice bran (rice by product) (10-20 percent), and meat and
bone meal (10-20 percent). According to the report, demand for soybean in poultry feed is forecasted at
1.65 - 1.97 MMT by 2020 (See Table 13).
Trade:
Imports of soybean for crushing, as well as increased domestic soybean production, will marginally
drive soymeal imports by a projected 10 percent rise to 550 thousand MT in MY 2018/19. For the same
reasons, soymeal imports are estimated to be 500 thousand MT in MY 2017/18. India (57%), Brazil
(18%) and the U.S. (17%) are the major players in exporting soymeal to Bangladesh.
Commodity:
Oil: Soybean oil and Palm oil
Production:

In MY 2018/19, projected increases in soybean production and imports will drive total soybean oil
production to rise 4.9 percent to 214 thousand MT. Increases in human consumption through diversified
utilization will drive soybean oil production to an estimated 204 thousand MT in MY 2017/18.
A number of 80 oil refineries have total production capacity of 2.9 million MT, but they are utilizing
only 48% of production capacity. The excess capacity is available to supply the growing demand for
edible oil.
There is no domestic palm oil production industry in the country. Some farmers are cultivating palm
trees on a limited scale and extracting oil in small amounts for retail and family consumption.
Consumption:
Per capita consumption of edible oil was 26.75 grams/day in year 2016. Although total food intake was
reduced to 975.53 grams/day in 2016 from 999.99 grams/day in 2010, edible oil consumption has
increased by 30.4 percent in 2016 from 20.51 grams/day in 2010 to 26.75 grams/day (See Table 6).
Post’s edible oil (soybean oil and palm oil) consumption is forecast to rise by 6.72 percent to 2.7 MMT
in MY 2018/19 owing to an increased population, rising per capita income levels, and increasing oil use
as an ingredient in processed food. Palm oil will constitute 1.58 MMT of consumption; soy oil, 1.12
MMT. Other minor edible oils such as mustard/rapeseed oil, rice bran oil, sesame oil, sunflower oil are
not included in this report.
In February 2018, retail prices of soybean oil ranged from BDT 85-88 (US$1.02-1.06) per liter and palm
oil was BDT 70-72 (US$0.84-0.87) per liter. The soybean price per liter has increased 1.76 percent from
July 2017 to February 2018. On the other hand, palm oil remains unchanged since July 2017.
Most households prefer soybean oil for cooking purposes, but such oil is often blended with palm oil.
Edible oils sold in bulk constitute 75% of the market, a segment in which palm oil dominates, while
soybean oil is the dominant oil in the bottled vegetable oil market.
Besides general cooking purposes, palm oil is also the dominant oil for food processing industries (13%)
and shortening/Vanaspati (fully or partially hydrogenated vegetable cooking oil) industries (20%); it is
also used in the paint industry. Increases in fast food consumption as well as higher incomes in rural
areas have driven consumption of palm-soy oil mixes as well.
Trade:
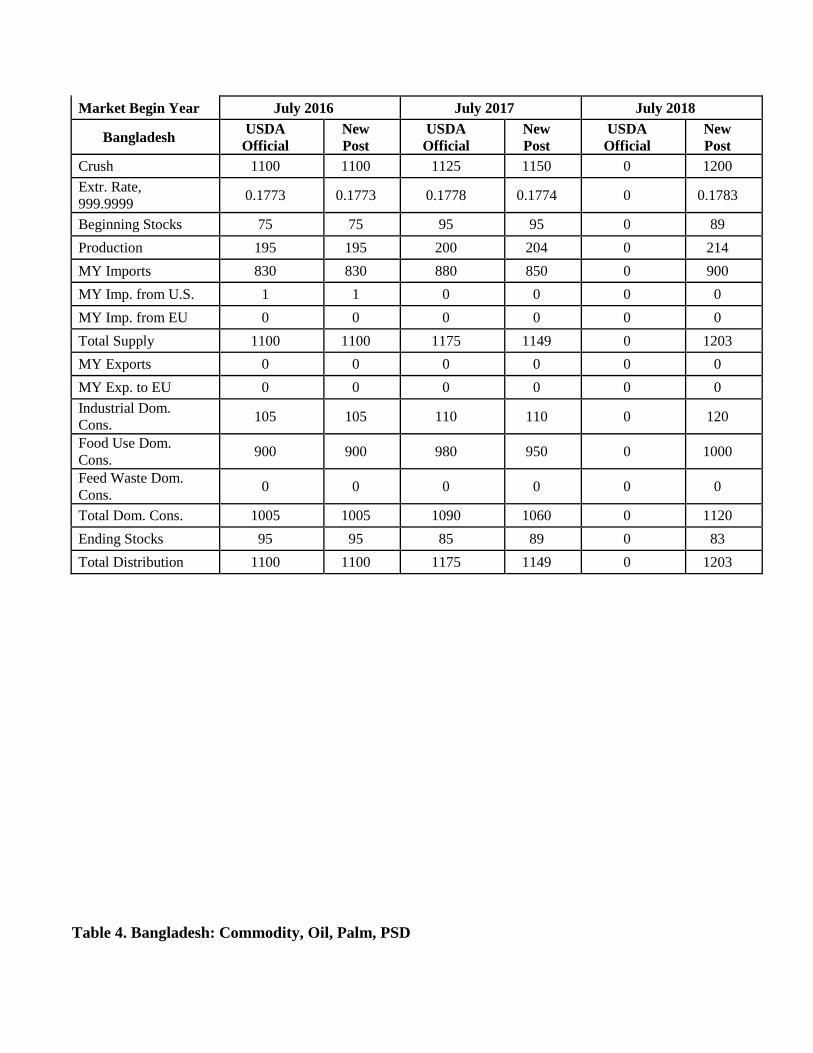
In MY 2018/19, post forecasts a rise in soybean oil imports by 5.88 percent to 900 thousand MT and a
6.9 percent increase in the import of palm oil to 1.55 MMT. The trend in diverse processed foods
consumption, and keeping pace with population and urbanization have fueled the continued rise of
vegetable oil imports.
In MY 2017/18, soybean oil imports are estimated to rise by 2.41 percent to 850 thousand MT which is
3.4 percent lower than the USDA official number. Palm oil imports are forecasted to move up by 10.35

percent to 1.45 million MT owing to continued lower prices in the market and increased consumption in
the upcoming month of Ramadan. Increased vegetable oil import tariff by India, and expected lower
price trend in the international market may support importing more palm oil. Argentina (63%) and
Paraguay (22%) are the major players in the soybean oil export market, while Indonesia (78%) and
Malaysia (22%) supply the largest shares of palm oil to the country. Bangladesh also imports soybean
and mustard in seed form to be crushed and sold locally. Other oil imports include crude soybean oil,
crude palm oil, and crude palm olein.
Policy:
In FY 2017/18, the Government of Bangladesh (GOB) revised its tariff structure for importing soybean,
soymeal, soybean oil and palm oil (See Table 23, 24 and 25). GOB has an open trade policy (no tariffs)
for soybean, but 10% regulatory duty has been imposed on soymeal in FY 2017/18 which was 10%
custom duty in earlier FY 2016/17. The duty shift from custom duty to regulatory duty reduced 0.4
million MT soymeal imports from India under SAFTA trade agreement. Under that agreement,
importers can import tax free soymeal max 0.4 MMT from India when there is 10% custom duty. The
duty free policy for soybeans is intended to support the local crushing industry to ensure local supply of
soymeal at a lower price. But since the duty on soymeal has stifled imports, feed millers are in fact
seeing increased costs for soymeal as a result of collusion and price-fixing among only two domestic
giant seed crushing plants. To control an increasing price in the domestic market and reduce risk of fully
depending on local soymeal producers, feed millers are continuing to import soymeal in moderate
amounts.
Regarding biosafety restrictions, biosafety rules detail guidelines to follow for importing GE product,
but the approval mechanism for importing such shipments is not widely understood nor implemented;
most GE product is not subject to additional inspection requirements.
Table 1. Bangladesh: Commodity, Oilseed, Soybean, PSD
(Area in 1000 hectares and production in 1000 metric tons)
Oilseed, Soybean 2016/2017 2017/2018 2018/2019
Market Begin Year July 2016 July 2017 July 2018
Bangladesh USDA
Official
New
Post
USDA
Official
New
Post
USDA
Official
New
Post

Area Planted 81 81 82 60 0 80
Area Harvested 81 65 82 60 0 80
Beginning Stocks 187 187 46 13 0 17
Production 153 120 156 114 0 152
MY Imports 815 815 1100 1050 0 1100
MY Imp. from U.S. 761 761 1050 1000 0 1050
MY Imp. from EU 0 0 0 0 0 0
Total Supply 1155 1122 1302 1177 0 1269
MY Exports 0 0 0 0 0 0
MY Exp. to EU 0 0 0 0 0 0
Crush 1100 1100 1125 1150 0 1200
Food Use Dom.
Cons. 5 5 5 5 0 5
Feed Waste Dom.
Cons. 4 4 5 5 0 5
Total Dom. Cons. 1109 1109 1135 1160 0 1210
Ending Stocks 46 13 167 17 0 59
Total Distribution 1155 1122 1302 1177 0 1269
Table 2. Bangladesh: Commodity, Meal, Soybean, PSD
(Area in 1000 hectares and production in 1000 metric tons)
Meal, Soybean 2016/2017 2017/2018 2018/2019
Market Begin Year July 2016 July 2017 July 2018
Bangladesh USDA New USDA New USDA New

Official Post Official Post Official Post
Crush 1100 1100 1125 1150 0 1200
Extr. Rate,
999.9999 0.7727 0.7727 0.7778 0.7739 0 0.775
Beginning Stocks 144 144 124 124 0 110
Production 850 850 875 890 0 930
MY Imports 454 454 650 500 0 550
MY Imp. from U.S. 99 99 120 125 0 130
MY Imp. from EU 0 0 0 0 0 0
Total Supply 1448 1448 1649 1514 0 1590
MY Exports 0 0 0 0 0 0
MY Exp. to EU 0 0 0 0 0 0
Industrial Dom.
Cons. 0 0 0 0 0 0
Food Use Dom.
Cons. 4 4 4 4 0 4
Feed Waste Dom.
Cons. 1320 1320 1480 1400 0 1450
Total Dom. Cons. 1324 1324 1484 1404 0 1454
Ending Stocks 124 124 165 110 0 136
Total Distribution 1448 1448 1649 1514 0 1590
Table 3. Bangladesh: Commodity, Oil, Soybean, PSD
(Area in 1000 hectares and production in 1000 metric tons)
Oil, Soybean 2016/2017 2017/2018 2018/2019
Market Begin Year July 2016 July 2017 July 2018
Bangladesh USDA
Official
New
Post
USDA
Official
New
Post
USDA
Official
New
Post
Crush 1100 1100 1125 1150 0 1200
Extr. Rate,
999.9999 0.1773 0.1773 0.1778 0.1774 0 0.1783
Beginning Stocks 75 75 95 95 0 89
Production 195 195 200 204 0 214
MY Imports 830 830 880 850 0 900
MY Imp. from U.S. 1 1 0 0 0 0
MY Imp. from EU 0 0 0 0 0 0
Total Supply 1100 1100 1175 1149 0 1203
MY Exports 0 0 0 0 0 0
MY Exp. to EU 0 0 0 0 0 0
Industrial Dom.
Cons. 105 105 110 110 0 120
Food Use Dom.
Cons. 900 900 980 950 0 1000
Feed Waste Dom.
Cons. 0 0 0 0 0 0
Total Dom. Cons. 1005 1005 1090 1060 0 1120
Ending Stocks 95 95 85 89 0 83
Total Distribution 1100 1100 1175 1149 0 1203
Table 4. Bangladesh: Commodity, Oil, Palm, PSD

(Area in 1000 hectares and production in 1000 metric tons)
Oil, Palm 2016/2017 2017/2018 2018/2019
Market Begin Year July 2016 July 2017 July 2018
Bangladesh USDA
Official
New
Post
USDA
Official
New
Post
USDA
Official
New
Post
Area Planted 0 0 0 0 0 0
Area Harvested 0 0 0 0 0 0
Trees 0 0 0 0 0 0
Beginning Stocks 131 131 131 131 0 111
Production 0 0 0 0 0 0
MY Imports 1314 1314 1600 1450 0 1550
MY Imp. from U.S. 0 0 0 0 0 0
MY Imp. from EU 0 0 0 0 0 0
Total Supply 1445 1445 1731 1581 0 1661
MY Exports 0 0 0 0 0 0
MY Exp. to EU 0 0 0 0 0 0
Industrial Dom.
Cons. 100 100 120 120 0 130
Food Use Dom.
Cons. 1214 1214 1500 1350 0 1450
Feed Waste Dom.
Cons. 0 0 0 0 0 0
Total Dom. Cons. 1314 1314 1620 1470 0 1580
Ending Stocks 131 131 111 111 0 81
Total Distribution 1445 1445 1731 1581 0 1661

Figure 1. Bangladesh: Crop area share in percentage
Figure 2. Bangladesh: Oilseed crop area share in percentage

Figure 3. Bangladesh: Soybean and soymeal import trend
Figure 4. Bangladesh: Soybean oil and palm oil import trend

Figure 5. Bangladesh: Soybean exporter’s share in MY 2016/17
Figure 6. Bangladesh: Soymeal exporter’s share in MY 2016/17

Figure 7. Bangladesh: Soybean oil exporter’s share in MY 2016/17
Figure 8. Bangladesh: Palm oil exporter’s share in MY 2016/17

Table 5. Bangladesh: Oilseed crop area and production in MY 2016/17
Oilseeds Area (ha) Area (%) Production (Thousand MT) Yield (T/ha)
Mustard 5.51 67 705.3 1.28
Ground Nut 0.95 11.55 150.6 1.586
Linseed 0.038 0.46 3.6 0.947
Sesame 0.89 10.88 89.5 1
Soybean 0.808 9.82 105.5 1.306
Sunflower 0.024 0.29 4.2 1.75
Total 8.227 100 1058.7 7.869
Source: Department of Agricultural Extension, Ministry of Agriculture
Table 6. Bangladesh: Per capita food intake gram per day
Food Item
201
6
201
0
200
5
200
0
1995
-96 2016 2010 2005 2000
Inta
ke
Inta
ke
Inta
ke
Inta
ke
Inta
ke
Change
(%)
Change
(%)
Change
(%)
Change
(%)
Total
975.
53
999.
99
947.
75
893.
06
913.
8 -2.45 5.51 6.12 -2.27
Rice
367.
19
416.
01
439.
64
458.
54
464.
3 -11.74 -5.37 -4.12 -1.24
Wheat
19.8
3 26
12.0
8
17.4
4 33.7 -23.73 115.23 -30.73 -48.25
Potato
64.8
3 70.3 63.3
55.4
5 49.5 -7.78 11.06 14.16 12.02
Pulses 15.6 14.3
14.1
9
15.7
7 13.9 9.09 0.78 -10.02 13.45
Vegetables
167.
3
166.
08
157.
02
140.
47
152.
5 0.73 5.77 11.78 -7.89
Edible oil
26.7
5
20.5
1
16.4
5
12.8
2 9.8 30.42 24.68 28.32 30.82
Onion
31.0
4 22
18.3
7
15.4
1 11.6 41.09 19.76 19.21 32.84
Beef 7.54 6.84 7.78 8.3 6.6 10.23 -12.08 -6.27 25.76
Mutton 0.55 0.6 0.59 0.49 1 -8.33 1.69 20.41 -51.00
Chicken/duck
17.3
3
11.2
2 6.85 4.5 4 54.46 63.80 52.22 12.50
Eggs
13.5
8 7.2 5.15 5.27 3.2 88.61 39.81 -2.28 64.69
Fish
62.5
8 49.5
42.1
4
38.4
5 43.8 26.42 17.47 9.60 -12.21
Milk & milk
products
27.3
1
33.7
2 32.4
29.7
1 32.6 -19.01 4.07 9.05 -8.87
Fruits
35.7
8 44.7
32.5
4
28.3
5 27.6 -19.96 37.37 14.78 2.72
Sugar/Gur 6.9 8.4 8.08 6.85 9.2 -17.86 3.96 17.96 -25.54

Fast food
30.7
7
29.8
3
24.7
6
3.15 20.48
Miscellaneou
s
80.6
2
72.7
8
48.3
8
55.4
4 50.9 10.77 50.43 -12.73 8.92
Source: Bangladesh Bureau of Statistics, Household Income and Expenditure Survey, 2016
Table 7. Bangladesh: Number (million) of livestock: Ruminant and poultry
FY Cattl
e (M)
Buffal
o (M)
Shee
p (M)
Goat
(M)
Total
Ruminant
(M)
Chick
en (M)
Duck
(M)
Total
Poultry
(M)
Total
Livestock
(M)
200
7-08 22.9 1.3 2.8 21.6 48.5 212.5 39.8 252.3 300.8
200
8-09 23.0 1.3 2.9 22.4 49.6 221.4 41.2 262.6 312.2
200
9-10 23.1 1.3 3.0 23.3 50.7 228.0 42.7 270.7 321.4
201
0-11 23.1 1.4 3.0 24.1 51.7 234.7 44.1 278.8 330.5
201
1-12 23.2 1.4 3.1 25.1 52.8 242.9 45.7 288.6 341.4
201
2-13 23.3 1.5 3.1 25.3 53.2 249.0 47.3 296.3 349.5
201
3-14 23.5 1.5 3.2 25.4 53.6 255.3 48.9 304.2 357.8
201
4-15 23.6 1.5 3.3 25.6 54.0 261.8 50.5 312.3 366.3
201
5-16 23.8 1.5 3.3 25.8 54.4 268.4 52.2 320.6 375.0
201
6-17 23.9 1.5 3.4 25.9 54.7 275.2 54.0 329.2 383.9
Source: Department of Livestock
Table 8: Bangladesh: Feed status production, demand and gap
Type of
Livestock
Current
Production
(MMT)
Existing
Demand
(MMT)
Demand
Gap
(MMT)
Latent
Demand
(MMT)
Total
Demand
(MMT)
Real gap
(MMT)
Broiler 2.14 2.40 0.26 0.30 2.70 0.56
Layer 1.19 1.3 0.11 0.6 1.9 0.71
Cattle 0.07 0.08 0.01 0.20 0.10 0.03
Total 3.4 3.77 0.37 1.1 4.87 1.47

Source: Poultry industry market assessment-Bangladesh, US Soybean Export Council, 2017
Table 9: Bangladesh: Projected feed demand as per different sectors in poultry
Description 2014
(MT/Year)
2015
(MT/Year)
2020
(MT/Year)
Total DOC (Broiler)/Yr 1,036,800 1,140,480 2,000,504
Layer DOC 1,664,832 1,831,315 3,212,290
Commercial Layer + Broiler 2,701,632 2,971,795 5,212,794
PS (Broiler) 357,500 393,250 689,796
PS (Layer) 27,300 30,030 52,675
GP 7,800 15,600 27,364
Total DOC (PS+ GP) 392,600 438,880 769,835
Total (Broiler +Layer + PS+ GP) 3,094,232 3,410,675 5,982,629
Others (Sonali, Fayoumi, cock, country, etc.) 309,423 341,068 598,263
Total 3,403,655 3,751,743 6,580,891
Source: Feed demand Table, BPICC, November 2014
Table 10: Bangladesh: Feed requirement of poultry and livestock
Animal Type Adult Cattle Unit Feed Requirement (Million MT)
Cattle 18,074 46.18
Buffalo 642 1.64
Sheep 241 0.62
Goat 1,945 4.97
Poultry 388 30.45
Total feed requirement 83.85
Source: FAO-APHCA regional workshop in Bangkok : 13-15 August 2013
Table 11: Bangladesh: Demand supply of feeds
Animal Type Demand (MMT) Supply (MMT)
Total Roughage Concentrate Total Roughage Concentrate
Cattle 46.18 32.33 13.85 13.46 11.47 1.99
Buffalo 1.64 1.15 0.49 0.32 0.25 0.07
Sheep 0.61 0.52 0.09 1.6 1.53 0.07
Goat 4.97 4.22 0.75 12.32 12.23 0.09
Poultry 30.45 0.06 30.39 4.4 0.79 3.61
All 83.85 38.28 45.57 32.1 26.27 5.83
Source: FAO-APHCA regional workshop in Bangkok : 13-15 August 2013
Table 12: Bangladesh: Typical feed formula for broiler pellet feed
Types of Raw materials and ingredients % by quantity

Maize 60%
Soya 25%
Meat and Bone Meal 5%
Rice Polish (DOB) 3-5%
Oil 2%
DCP 1%
CaCO3 1.1%
Vitamin 2-5%
Minerals 0.2%
Methionin 0.2%
Lysine 0.1%
Toxin Binder 0.1%
Sodium bi Carbonate 0.1%
Source: Poultry industry market assessment-Bangladesh, US Soybean Export Council, 2017
Table 13: Bangladesh: Requirement of feed ingredients (Projected)
Ingredients
(Quantity in feed)
2014
(Million MT)
2015
(Million MT)
2020
(Million MT)
Corn/Maize (50-60%) 1.7 - 2.0 1.875 - 2.251 3.290 - 3.948
Meat & Bone meal (3-6%) 0.1 - 0.2 0.112 - 0.225 0.197 - 0.394
Soybean (25-30%) 0.85 - 1.0 0.937 - 1.125 1.645 - 1.974
DDGS (3-5%) 0.1 - 0.17 0.112 - 0.187 0.197 - 0.329
Seed Oil (1-2%) 0.034 - 0.068 0.037 - 0.075 0.065 - 0.131
DORB (3-5%) 0.1 - 0.17 0.112 - 0.187 0.197 - 0.329
Rice polish/bran (4-6%) 0.136 - 0.204 0.150 - 0.225 0.263 - 0.394
Limestone (1-2%) 0.034 - 0.068 0.037 - 0.075 0.065 - 0.131
Medicine (2-2.5%) 6.80 - 8.50 0.075 - 0.930 0.131 - 0.197
Oilseed cake (2-3%) 0.068 - 0.120 0.075 - 0.112 0.394
Others (6%) 0.24 0.225 0.394
Source: Feed requirement table, BPICC, November 2014
Table 14. Bangladesh: Production of fisheries sector
Fiscal Year Capture (MMT) Culture (MMT) Marine (MMT) Fish (MMT) Growth (%)
2005-06 0.93 0.92 0.48 2.33 5.08
2006-07 0.98 0.98 0.49 2.44 4.79
2007-08 1.03 1.04 0.50 2.56 5.05
2008-09 1.09 1.10 0.51 2.70 5.39
2009-10 1.03 1.35 0.52 2.90 7.32

2010-11 1.05 1.46 0.55 3.06 5.60
2011-12 0.96 1.73 0.58 3.26 6.54
2012-13 0.96 1.86 0.59 3.41 4.55
2013-14 1.00 1.96 0.60 3.55 4.04
2014-15 1.02 2.06 0.60 3.68 3.84
2015-16 1.05 2.20 0.63 3.88 5.27
2016-17 1.16 2.33 0.64 4.13 6.60
Source: Ministry of Fisheries and Livestock
Table 15: Bangladesh: Cultural method wise fish production
Productio
n Methods
Production
Range
Number
of Pond
Area Production MT/H
a
Growt
h rate
(%)
Ha % MT %
Extensive <1.5MT/Ha 401,384 45,246 12.15 59,833 3.71 1.322 -23.04
Semi
Intensive
1.5-4
MT/Ha
1,325,67
0
230,75
3
61.96 765,383 47.44 3.317 6.68
Intensive 4>10MT/H
a
389,022 84,878 22.79 503,131 31.19 5.928 6.60
Highly
Intensive
10 >
MT/Ha
51,027 11,521 3.09 284,893 17.66 24.729 10.01
Total 2,167,10
3
372,39
7
100.0
0
1,613,24
0
100.0
0
4.332 5.71
Source: Department of Fisheries and Bangladesh Bureau of Statistics
Table 16: Bangladesh: Aquaculture feed production, demand and gap analysis
Aqua
Type
Current
Production
(MMT)
Existing
Demand
(MMT)
Demand
Gap
(MMT)
Latent
Demand
(MMT)
Total
Demand
(MMT)
Real gap
(MMT)
Fish 1.287 1.38 0.1 1 2.38 1.093
Shrimp 0.143 0.15 0.01 0.12 0.27 0.127

Total 1.43 1.53 0.11 1.12 2.65 1.22
Source: Aquaculture industry market assessment-Bangladesh, US Soybean Export Council, 2017
Table 17. Bangladesh: Protein production
Fiscal Milk Meat Egg
Year Million MT Million MT Billion
2007-08 2.65 1.04 5.6532
2008-09 2.29 1.08 4.6961
2009-10 2.37 1.26 5.7424
2010-11 2.95 1.99 6.0785
2011-12 3.46 2.33 7.3038
2012-13 5.07 3.62 7.6174
2013-14 6.092 4.521 10.168
2014-15 6.97 5.86 10.9952
2015-16 7.275 6.152 11.9124
2016-17 9.283 7.154 14.9331
Growth Rate (%) 16 24 12
Source: Ministry of Fisheries and Livestock
Table 18: Bangladesh: Protein demand and gap
Products Unit Demand* Production Availability Deficiency
Milk Million MT 14.865 9.283 5.582
Ml/day/head 250 15.797
Meat Million MT 7.135 7.154 -0.19
Gm/day/head 120 121.74
Egg Billion 16.9416 14.9331 2.0085
Numbers/year/head 104 92.75
*Estimated population of the country: 16 crores 29 lakhs (As on 1st July, 2017)
Table 19: Bangladesh: Growth of GDP and contributed sector
FY
GDP
Growth
(%)
Agriculture and
Forestry (%)
Crops and
Forestry (%)
Animal
Farming
(%)
Forest and
Related Service
(%)
Fisheri
es (%)
200 6.67 5.44 6.17 2.15 5.46 5.75

5-06
200
6-07 7.06 6.04 7 1.99 5.5 9.41
200
7-08 6.01 3.87 3.98 2.21 5.26 7
200
8-09 5.05 3.09 2.83 2.35 5.54 4.94
200
9-10 5.57 6.55 7.57 2.51 5.34 4.6
201
0-11 6.46 3.89 3.85 2.59 5.56 6.69
201
1-12 6.52 2.41 1.75 2.68 5.96 5.32
201
2-13 6.01 1.47 0.59 2.74 5.04 6.18
201
3-14 6.06 3.81 3.78 2.83 5.01 6.36
201
4-15 6.55 2.45 1.83 3.08 5.08 6.38
201
5-16 7.11 1.79 0.88 3.19 5.12 6.11
201
6-17 7.28 1.96 0.96 3.31 5.6 6.23
Source: Different national statistics publication
Table 20. Bangladesh: Industrial sector’s GDP contribution growth
FY GDP Growth
(%)
Manufacturing
(%)
Large and Medium scale
(%)
Small scale
(%)
2005-
06 6.67 10.81 11.24 9.14
2006-
07 7.06 10.54 10.8 9.48
2007-
08 6.01 7.33 7.38 7.15

2008-
09 5.05 6.69 6.54 7.3
2009-
10 5.57 6.65 6.27 8.17
2010-
11 6.46 10.01 11.11 5.67
2011-
12 6.52 9.96 10.76 6.58
2012-
13 6.01 10.31 10.65 8.81
2013-
14 6.06 8.77 9.32 6.33
2014-
15 6.55 10.31 10.7 8.54
2015-
16 7.11 11.69 12.26 9.06
2016-
17 7.28 10.97 11.2 9.82
Source: Different national statistics publication
Table 21: Bangladesh: Development indicator’s progress
FY
Investment (%
GDP) Per Capita
Income
(US$)
Power Generation
Capacity
(Megawatt)
Food Grain
Production (lakh
MT)
Average
Inflation Pu
bli
c
Pri
vat
e
To
tal
200
5-
06
5.5
6
20.
58
26
.1
4 543 5245 272.7
200
6-
07
5.0
9
21.
08
26
.1
7 598 5202 280.6 9.4
200
7-
08 4.5
21.
7
26
.2 686 5305 352.9 12.3
200
8-
09
4.3
2
21.
89
26
.2
1 759 5719 347.1 7.6
200
9-
10
4.6
7
21.
57
26
.2
4 843 5823 358.1 6.8
201
0-
11
5.2
6
22.
16
27
.4
2 928 7264 360.7 10.9
201 5.7 22. 28 955 8716 368.8 8.7

1-
12
6 5 .2
6
201
2-
13
6.6
4
21.
75
28
.3
9 1054 9151 372.7 6.8
201
3-
14
6.5
5
22.
03
28
.5
8 1184 10416 381.7 7.4
201
4-
15
6.8
2
22.
07
28
.8
9 1317 11534 384.2 6.4
201
5-
16
6.6
6
22.
99
29
.6
5 1465 14429 390 5.9
201
6-
17
7.2
6
23.
01
30
.2
7 1602 15379 396.9 5.4
Source: Different national statistics publication
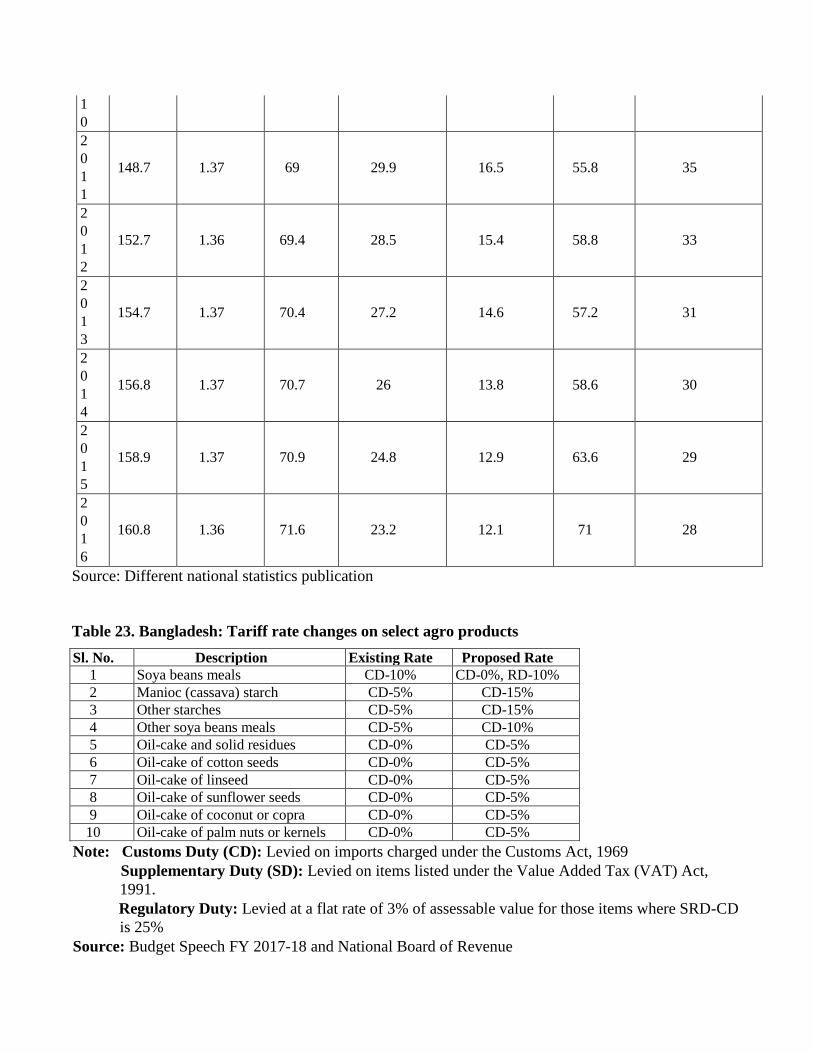
Table 22: Bangladesh: Demographic development
F
Y
Popula
tion
(Millio
n)
Populatio
n Growth
Rate (%)
Life
Expecta
ncy
(Year)
Upper
Poverty Line,
Head Count
(% )
Lower
Poverty Line,
Head Count
(%)
Literacy
Rate (7+
yrs) (%)
Infant Mortality
Rate (per
thousand live
birth)
2
0
0
7
141.8 1.47 66.66 36.8 22.6 56.1 43
2
0
0
8
143.8 1.45 66.8 35.1 20.98 55.8 41
2
0
0
9
146.7 1.36 67.2 33.4 19.3 56.7 39
2
0140.6 1.36 67.7 31.5 17.6 56.8 36
1
0
2
0
1
1
148.7 1.37 69 29.9 16.5 55.8 35
2
0
1
2
152.7 1.36 69.4 28.5 15.4 58.8 33
2
0
1
3
154.7 1.37 70.4 27.2 14.6 57.2 31
2
0
1
4
156.8 1.37 70.7 26 13.8 58.6 30
2
0
1
5
158.9 1.37 70.9 24.8 12.9 63.6 29
2
0
1
6
160.8 1.36 71.6 23.2 12.1 71 28
Source: Different national statistics publication
Table 23. Bangladesh: Tariff rate changes on select agro products
Sl. No. Description Existing Rate Proposed Rate
1 Soya beans meals CD-10% CD-0%, RD-10%
2 Manioc (cassava) starch CD-5% CD-15%
3 Other starches CD-5% CD-15%
4 Other soya beans meals CD-5% CD-10%
5 Oil-cake and solid residues CD-0% CD-5%
6 Oil-cake of cotton seeds CD-0% CD-5%
7 Oil-cake of linseed CD-0% CD-5%
8 Oil-cake of sunflower seeds CD-0% CD-5%
9 Oil-cake of coconut or copra CD-0% CD-5%
10 Oil-cake of palm nuts or kernels CD-0% CD-5%
Note: Customs Duty (CD): Levied on imports charged under the Customs Act, 1969
Supplementary Duty (SD): Levied on items listed under the Value Added Tax (VAT) Act,
1991.
Regulatory Duty: Levied at a flat rate of 3% of assessable value for those items where SRD-CD
is 25%
Source: Budget Speech FY 2017-18 and National Board of Revenue

Table-24: Bangladesh – Increased custom duty
Sl. No. H.S. Code Description of goods Existing Rate (%) Proposed Rate (%)
1 0904.21.90 Other dried or neither crushed or ground 5 10
2 1108.14.00 Manioc (cassava) starch 5 15
3 1108.19.00 Other starches 5 15
4 1208.90.00 Other soya beans meals 5 10
5 1211.90.19 Other plants and parts of plants 5 10
10 2305.00.00 Oil-cake and solid residues 0 5
12 2306.20.00 Of linseed 0 5
13 2306.30.00 Of sunflower seeds 0 5
14 2306.49.00 Other 0 5
15 2306.50.00 Of coconut or copra 0 5
16 2306.60.00 Of palm nuts or kernels 0 5
17 2306.90.00 Other 0 5
18 2309.90.90 Poultry feed finished 5 10
Source: Different national statistics publication
Table 25: Bangladesh: Tariff structure oilseed in budget FY 2016/17
HS Code Items CD SD VAT AIT RD ATV TTI
12019010
Soya beans, whether or not broken other than
Seed, Wrapped/canned up to 2.5 Kg
0 0 15 5 0 4 25.07
12019090
Soya beans, whether or not broken other than
Seed, EXCL. Wrapped/canned up to 2.5 Kg
0 0 0 0 0 0 0
120810 Soya Bean Flours And Meals 0 0 0 5 0 4 10.07
15071000 Crude Soya Bean Oil/Fraction Refine, Whether
or Not Degummed
0 0 15 0 0 4 20.07
15079010 Refined Soya-Bean Oil 0 0 15 0 0 4 20.07
15079090 Other Soya-Bean Oil 5 0 15 0 0 4 26.07
23040000 Oil-Cake And Other Solid Residues, Of Soya-
Bean Oil
0 0 0 0 10 4 15.57
15111010 Crude palm oil imported by VAT registered
edible oil refinery industries
10 0 15 0 0 4 32.07
15111090 Crude palm oil imported by other than VAT
registered edible oil refinery industries
10 0 15 0 0 4 32.07
15119011 Rbd Palm Stearin 10 0 15 5 0 4 37.07
15119019
Solidified Or Hardened By Mechanical
Treatment(Excl. Rbd Palm Stearin)
25 0 15 5 3 4 58.69

15119090
Palm Oil (Exclude) & Its Fractns. Nes. Incld.
Refined Palm Oil
0 0 15 0 0 4 20.07
Note: CD – Custom duty, SD – Supplementary duty, VAT – Value added tax, AIT – Advance Income
Tax RD – Regulatory duty, ATV – Advanced Trade VAT, TTI – Total tax incidence


![[XLS] · Web viewSIC2007 Code Agriculture, Forestry, Fishing, Veterinary Growing crops Cereals, leguminous crops, oilseeds Rice Vegetables, melons, roots, tubers Sugar cane Tobacco](https://img.dokumen.tips/doc/110x75/5b054bf27f8b9a0a548eaad2/xls-viewsic2007-code-agriculture-forestry-fishing-veterinary-growing-crops.jpg)