Embed Size (px)
Citation preview

Bangladesh-India Bilateral Trade: Causes of Imbalance and Measures for Improvement
Mohammad Mafizur Rahman Ph.D. Student and Associate Lecturer
Discipline of Economics University of Sydney, NSW 2006, Australia.
Phone: 61-2- 9036 9188 Fax: 61-2- 9351 4341
Email: [email protected] Abstract: Currently India is the 2nd largest trading partner of Bangladesh, and India’s position is at the top for Bangladesh’s imports trade. So the study underscores the trend, structure and current picture of Bangladesh-India trade. Bangladesh’s trade with India increased tremendously especially in the 1990s. The average annual growth rates of Bangladesh’s trade with India, during 1980 to 1995, were much higher than those with the SAARC and the world. However, Bangladesh has always been trade deficit with India, and recently it has increased exponentially. Limited export base, backward industries, inadequate infrastructure, lower productivity in Bangladesh, appreciation of Bangladesh’s Taka against Indian Rupee, earlier and faster trade liberalization program in Bangladesh compared to India, tariff and non-tariff barriers (NTBs) imposed by the Indian government, huge illegal trade, diversified exports and technologically advanced industrial base of India are identified as the main reasons of this huge trade imbalance. Structural and policy measures such as sound physical, social and economic infrastructure, superior product quality, export diversification, sufficient institutional facilities for banking, credit and insurance, improved law and order situation, labor unrest free environment, an honest and efficient administration, continuous political stability, huge domestic and foreign investments, joint ventures in Bangladesh with buy back arrangements, competitive devaluation of the Bangladesh currency against the Indian currency, removal of illegal trade, tariff and NTBs- free entry of Bangladesh’s exports to Indian market are suggested to improve this trade deficit. Also cordial and productive cooperation between these two nations is crucial to materialize these measures.
Keywords: Bangladesh-India, Bilateral Trade and Trade Imbalance. JEL Codes: F10, F14, F15.
June 2005

2
I. Introduction
Both Bangladesh and India are two major countries of the SAARC and have a long
common historical past and similar cultural and social evolutions. As far as trade relation
is concerned, India is the 2nd largest trading partner of Bangladesh just after USA in
2003. India’s position is at the top for Bangladesh’s imports from the world (IMF:
Direction of Trade Statistics, June 2004). Therefore, an analysis of current trade status
between the two nations, obstacles and opportunities for mutual trade expansion is very
critical for economic development of both countries, especially of Bangladesh, as
Bangladesh has been suffering from historical trade deficit with India since its
independence. The trade deficit has been increasing exponentially since the recent past.
Official data show that compared to 1983, trade deficit in 2003 is more than 46 times
higher1 (IMF: Direction of Trade Statistics). This growing deficit is a cause of serious
concern for Bangladesh and has important economic and political implications. Hence the
importance of the study is realized, and it is expected that the study will help policy
makers to understand the roots of the problems on the way of trade expansion, and to
formulate and execute the appropriate policy measures to mitigate or remove these
problems.
With this objective in mind, this paper makes an attempt to deal with the issues of
bilateral trade relationship between Bangladesh and India. Therefore, the rest of the paper
is organised as follows: Section 2 highlights the historical development of Bangladesh-
India trade relations; Section 3 looks at the trend, structure and current picture of
Bangladesh-India trade; Section 4 discusses some of the main problems that cause the
trade imbalance between the two countries; Section 5 suggests some remedial measures
and attempts to explore for new opportunities, and Section 6 summarizes and concludes.
2. Historical Development of Bangladesh-India Trade Relations
Bangladesh and India signed the “ Treaty of Friendship, Cooperation and Peace” on
March 19, 1972 in Dhaka for 25 years. Owing to this treaty, both countries signed the
first one-year trade agreement on March 28, 1972.In the agreement, fish, raw jute,
1 In 1983, trade deficit of Bangladesh was US$31 million. In 2003, it increased to US$ 1435.83million.
3
newsprint and naphtha were identified as the principle exports of Bangladesh to India.
India’s major export items to Bangladesh, on the other hand, were cement, coal,
machinery and unmanufactured tobacco. The trade between the nations was limited to
government level (Madaan 1996). This agreement also provided border trade between
Bangladesh and Neighboring Indian states; and within 16 kilometers of both countries’
border, free trade was allowed for certain commodities (Hassan 2002).
The expected level of trade was not achieved under the first trade agreement. Also free
border trade between Bangladesh and India led to some illegal trade and hence was
abolished in October 1972 by mutual consent of the both governments. However, to
attain the desired level of trade, the first trade agreement was further extended up to
September 27, 1973 (Madaan 1996).
The first trade agreement of 1972 was replaced by another trade agreement for three
years. This agreement was signed on 5 July 1973 and became effective from 28
September 1973. Raw jute, fish, newsprint, etc were identified as major exportable items
of Bangladesh to India. On the other hand, major exports of India to Bangladesh were
unmanufactured tobacco, cement, coal, raw cotton, cotton yarn, cotton textiles and books.
This agreement provided for a system of Balanced Trade and Payment Arrangement
(BTPA) and ‘most favored nations treatment’ to each other (Madaan 1996 and Hassan
2002).
The desired level of trade between the two nations was not achieved by the agreement of
1973, and trade imbalance increased in the very first year. Rupee trade was found to be a
barrier in the bilateral trade, and thus abolished rupee trade from 1 January 1975 by a
Protocol signed on 17 December 1974. It was decided that trade would be conducted in
free convertible currency.
India and Bangladesh signed another trade Protocol on 12 January 1976 for higher
volume of trade and long-term arrangements for trade of coal and newsprint. BTPA
4
between Bangladesh and India was extended for another three years till 27 September
1979 on 5 October 1976.
On 4 October 1980, the third trade agreement was signed between these two nations
initially for three years. By mutual consent, this agreement was extendable for another 3
years.
On 8 November 1983, Bangladesh and India renewed a Protocol on trade of 1980 for
further three years. In May 1986, the trade agreement of 1983 was extended for another
three years till 3 October 1989. Subsequently this agreement was renewed a number of
times. Based on available information, this agreement was valid up to 3 October 2001.
3. Trend, Structure and Current Picture of Bangladesh-India Trade
One of the important features of Bangladesh- India bilateral trade to be mentioned is that
a large volume of informal or unrecorded trade, both in commodities and services, occurs
every year, and it is growing despite unilateral or regional or multilateral trade
liberalization in these two countries (Pohit and Taneja 2003, Eusufzai 2000). The official
data on trade in services between these nations are, in fact, not available at all. Under this
situation of data paucity with regard to illegal trade and trade in services, our current
analysis will depend on mostly on the official trade data in commodities.
In this section, data on trend, structure and current state of Bangladesh-India trade are
presented. Attention is paid on overall trade relationship; special reference is to be made
to examine the importance of Bangladesh - India trade in the context of SAARC as well
as individual country. Bangladesh’s historical trade deficit with India and the commodity
composition of Bangladesh-India trade over time are also examined.
3.1 Bangladesh-India Trade in SAARC Perspective
As mentioned earlier, both Bangladesh and India are two major trading partners in the
SAARC region. Their combined share in the SAARC trade demonstrates their
importance and high influence in the regional trade. Table 1 shows that the trade share of
5
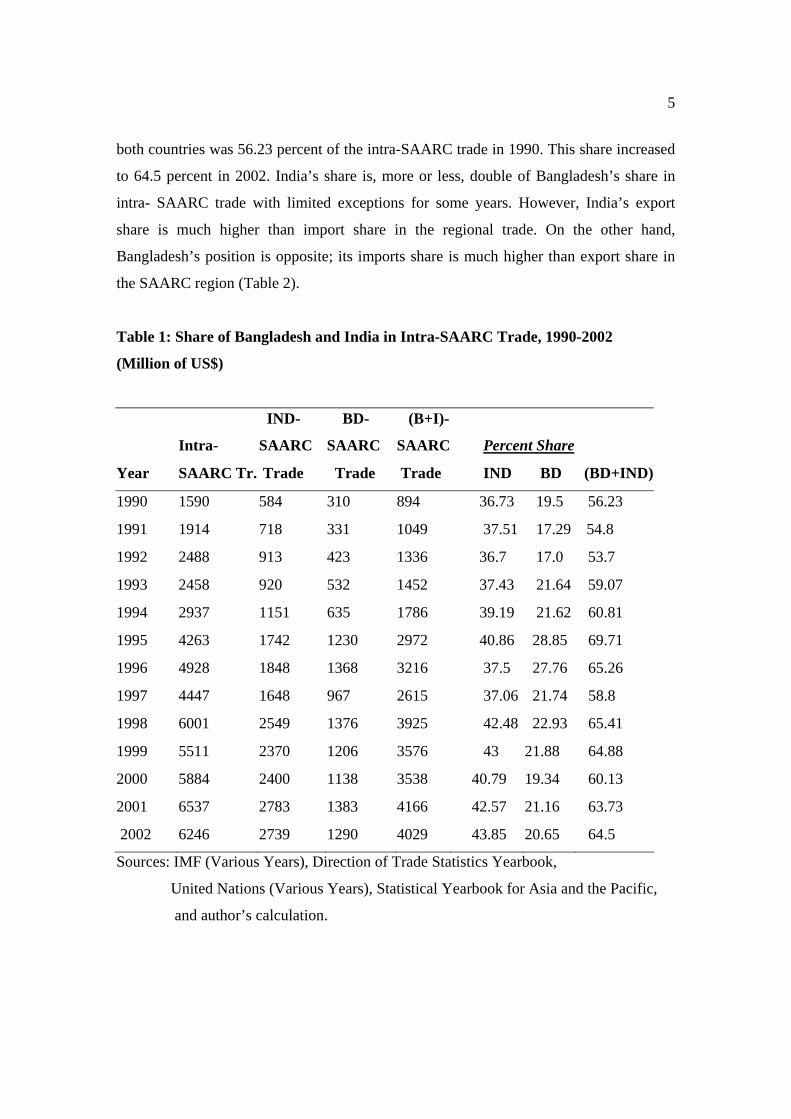
both countries was 56.23 percent of the intra-SAARC trade in 1990. This share increased
to 64.5 percent in 2002. India’s share is, more or less, double of Bangladesh’s share in
intra- SAARC trade with limited exceptions for some years. However, India’s export
share is much higher than import share in the regional trade. On the other hand,
Bangladesh’s position is opposite; its imports share is much higher than export share in
the SAARC region (Table 2).
Table 1: Share of Bangladesh and India in Intra-SAARC Trade, 1990-2002
(Million of US$)
Intra-
IND-
SAARC
BD-
SAARC
(B+I)-
SAARC Percent Share
Year SAARC Tr. Trade Trade Trade IND BD (BD+IND)
1990 1590 584 310 894 36.73 19.5 56.23
1991 1914 718 331 1049 37.51 17.29 54.8
1992 2488 913 423 1336 36.7 17.0 53.7
1993 2458 920 532 1452 37.43 21.64 59.07
1994 2937 1151 635 1786 39.19 21.62 60.81
1995 4263 1742 1230 2972 40.86 28.85 69.71
1996 4928 1848 1368 3216 37.5 27.76 65.26
1997 4447 1648 967 2615 37.06 21.74 58.8
1998 6001 2549 1376 3925 42.48 22.93 65.41
1999 5511 2370 1206 3576 43 21.88 64.88
2000 5884 2400 1138 3538 40.79 19.34 60.13
2001 6537 2783 1383 4166 42.57 21.16 63.73
2002 6246 2739 1290 4029 43.85 20.65 64.5
Sources: IMF (Various Years), Direction of Trade Statistics Yearbook,
United Nations (Various Years), Statistical Yearbook for Asia and the Pacific,
and author’s calculation.

6
Table 2: Export and Import Share of Bangladesh and India in
Intra-SAARC Trade, 1990-2002(Percent)
India's India's BD's BD's
Export Import Export Import
Year Share Share Share Share
1990 30.63 6.1 3.77 15.72
1991 32.55 4.96 4.18 13.11
1992 28.9 7.8 1.81 15.19
1993 33.4 4.03 2.24 19.4
1994 34.8 4.39 1.7 19.92
1995 36.21 4.64 1.95 26.91
1996 33.48 4.02 1.18 26.58
1997 32.92 4.14 1.84 19.9
1998 34.23 8.25 1.72 21.21
1999 36.04 6.97 1.47 20.41
2000 34.31 6.48 1.5 17.84
2001 35.9 6.67 1.39 19.76
2002 34.34 9.51 1.19 19.47
Sources: IMF (Various Years), Direction of Trade Statistics Yearbook;
United Nations (Various Years), Statistical Yearbook for Asia and the Pacific;
and author’s calculation.
3.2 Trade Intensity Indices
The trade intensity indices on both imports and exports demonstrate the bilateral trade
orientation of a country with its trading partner. The import intensity index can be
defined as (Venkatasubbulu (1996) quoted from Kojima (1964)):

7
Mij
---------
Mi
mij = --------------
Xj
---------
Xw-Xi
where
mij = import intensity index of trade of country i with country j,
Mij = Imports of a country i from trading partner j,
Mi = Total imports of country i,
Xj = Total exports of country j,
Xw = Total world exports,
Xi =Total exports of country i.
Export intensity index can also be defined in the same way; that is:
Xij
--------
Xi
xij = ----------------
Mj
------------
Mw- Mi
where
xij = Export intensity index of trade of country i with country j,
Xij = Exports of country i to trading partner j,
Xi = Total exports of country I,
Mj = Total imports of country j,
Mw = Total world imports,
Mi = Total imports of country i.

8
The value of index ranges from 0 to 100. If the value is zero, it implies no trade
relationship between partner countries. On the other hand, if the value of import intensity
index is more (or less) than 100, it indicates that country i is importing more (or less)
from j’th country than might be expected from that country’s share in total world trade. In
the case of exports, the same argument also holds true.
Export and import intensity indices have been calculated for Bangladesh’s trade with
India for some selected years from 1980 to 2003. The results are noted in Table 3.
It is observed that Bangladesh’s export intensities with India were far below than 100 for
all those years under study. This indicates that Bangladesh was exporting extremely less
to India all the time than what it ought to export. The highest index, 3.473031, was
observed in the year 1985. After that the index was continuously declining and reached to
1.364797 in the year 2000. Though it increased slightly in 2001, it started to decline again
and reached to the awful minimum of 0.79651 in the year 2003.
Compared to export intensity indices, Bangladesh’s import intensity indices with India
are quite high. However, it is still far below than the desired level of 100. The index value
almost doubled in 1990 compared to 1980 or 1985. The index value increased
tremendously in 1995 reaching to 25.35823. During 2000 – 2003, the value is, more or
less, around 20.
Therefore, it is revealed from the discussion that India imported much less from
Bangladesh than its exported to Bangladesh. Secondly, very lower indices for exports and
imports, which were far from desired level of 100, imply that Bangladesh - India trade
were not as high as it should be. So there is a scope for mutual trade expansion.

9
Table 3: Bangladesh's Export and Import Intensity Indices with India
Year mij xij
1980 4.885524 1.414912
1985 4.627149 3.473031
1990 8.746103 1.906983
1995 25.35823 1.67226
2000 17.00115 1.364797
2001 20.1086 1.608167
2002 18.81877 1.000879
2003 20.61386 0.79651
Note:
mij = Bangladesh's import intensity index with India
Xij = Bangladesh's export intensity index with India
Sources: IMF (Various Years), Direction of Trade Statistics Yearbook and author's
calculation.
3.3 The Importance of India in Bangladesh’s Trade
India plays an important role in Bangladesh’s trade since the independence, and recently,
especially in 1990s, Bangladesh’s trade with India increased tremendously. The Table 4
compares the growth rates of Bangladesh’s trade with India, SAARC countries and world
for selected years from 1980. It is observed from the table that the average annual growth
rates of Bangladesh’s trade with India, during 1980 to 1995, were much higher than those
with the SAARC and the world. For example, during 1980- 85, while average annual
growth rates of Bangladesh’s trade with the World and SAARC countries, were 2.46 per
cent and –0.11 per cent respectively, this figure was 9.72 per cent with India. During
1985-90 the growth rates with the world, SAARC countries and India were 7.94, 18.68
and 20.63 per cent respectively. The growth rate of trade with India increased very
significantly during 1990-95. While the growth rates with the world and SAARC
countries were 16.70 and 57.85 percent respectively, the growth rate with India was
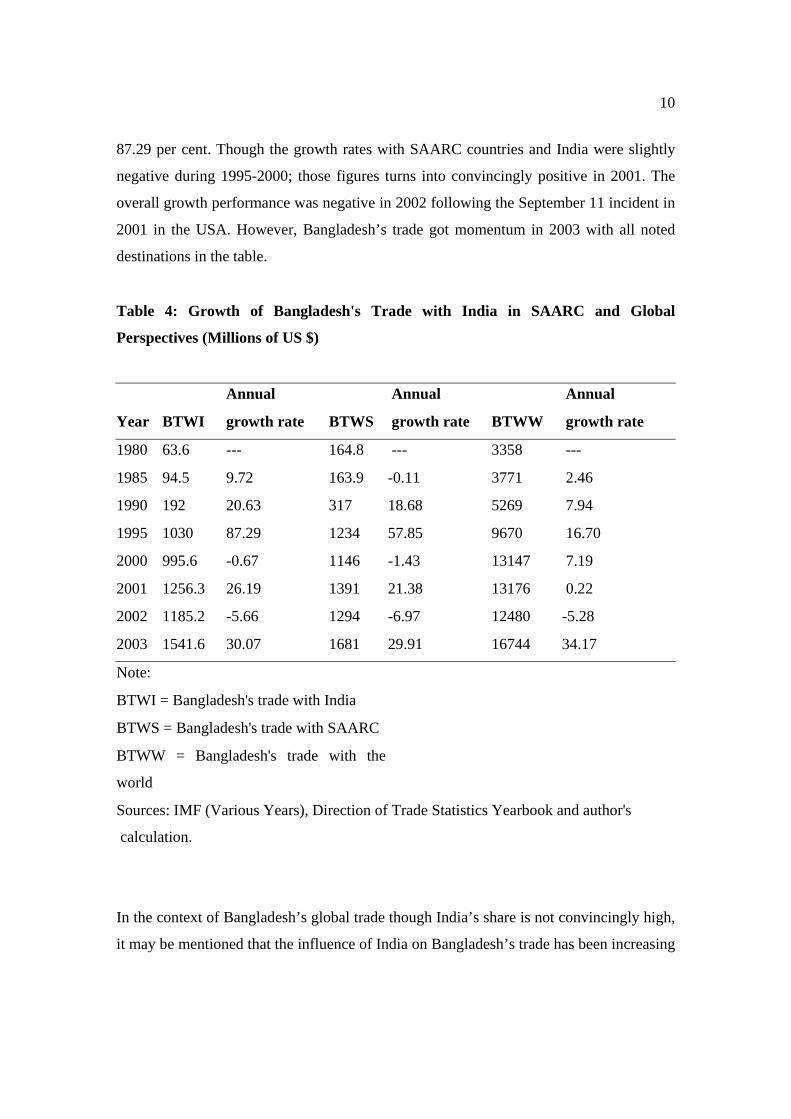
10
87.29 per cent. Though the growth rates with SAARC countries and India were slightly
negative during 1995-2000; those figures turns into convincingly positive in 2001. The
overall growth performance was negative in 2002 following the September 11 incident in
2001 in the USA. However, Bangladesh’s trade got momentum in 2003 with all noted
destinations in the table.
Table 4: Growth of Bangladesh's Trade with India in SAARC and Global
Perspectives (Millions of US $)
Annual Annual Annual
Year BTWI growth rate BTWS growth rate BTWW growth rate
1980 63.6 --- 164.8 --- 3358 ---
1985 94.5 9.72 163.9 -0.11 3771 2.46
1990 192 20.63 317 18.68 5269 7.94
1995 1030 87.29 1234 57.85 9670 16.70
2000 995.6 -0.67 1146 -1.43 13147 7.19
2001 1256.3 26.19 1391 21.38 13176 0.22
2002 1185.2 -5.66 1294 -6.97 12480 -5.28
2003 1541.6 30.07 1681 29.91 16744 34.17
Note:
BTWI = Bangladesh's trade with India
BTWS = Bangladesh's trade with SAARC
BTWW = Bangladesh's trade with the
world
Sources: IMF (Various Years), Direction of Trade Statistics Yearbook and author's
calculation.
In the context of Bangladesh’s global trade though India’s share is not convincingly high,
it may be mentioned that the influence of India on Bangladesh’s trade has been increasing

11
over the years. From the Table 5, it is observed that India’s share in Bangladesh’s global
trade has increased to 10.7 percent in 1995 from 3.6 percent in 1990. Though this share
has slightly decreased in recent years, it is still almost 10 percent.
The important feature is that though India’s share in Bangladesh’s global import has been
increasing over the years, India’s contribution in Bangladesh’s global exports has been
shrinking. For example, India’s share in Bangladesh’s global import increased to 15.5
percent in 2003 from 4.7 percent in 1990. On the other hand, with regard to exports, this
share decreased to 0.7 percent from 1.3 percent during the same period.
As per as Bangladesh’s trade with the SAARC countries is concerned, India certainly
holds an important position, and over the years its dominance has been increasing. India
provided with the 94.1 percent of Bangladesh’s imports from the SAARC countries in
2003. India’s contribution to Bangladesh’s exports to SAARC countries increased to 53.5
percent in 2003 from 36.6 percent in 1990. India’s share in Bangladesh’s total trade with
the SAARC countries increased from 60.6 percent to 91.7 percent during the same period
of time.
Table 5: India’s Share in Bangladesh's Global and SAARC Trade for
Selected Years (Millions of US$)
Item 1990 1995 2000 2001 2002 2003
Global Exports of Bangladesh 1671 3173 4786 4826 4566 7167
Global Imports of Bangladesh 3598 6497 8360 8350 7914 9577
Exports to SAARC 60 83 89 92 73 99
Imports from SAARC 257 1151 1057 1299 1221 1582
Exports to India 22 36 50 61 39 53
Imports from India 170 994 945 1195 1146 1489
(I/W)T 3.6 10.7 7.6 9.5 9.5 9.2
(I/W)X 1.3 1.1 1 1.2 0.8 0.7

12
(I/W)M 4.7 15.3 11.3 14.3 14.5 15.5
(I/S)T 60.6 83.5 86.8 90.2 91.6 91.7
(I/S)X 36.6 43.3 56.1 66.3 53.4 53.5
(I/S)M 66.1 86.3 89.4 91.9 93.8 94.1
Notes:
(I/W)T = India's share in Bangladesh's global trade (per cent)
(I/W)X = India's share in Bangladesh's global exports (per cent)
(I/W)M = India's share in Bangladesh's global imports (per cent)
(I/S)T = India's share in Bangladesh's trade with SAARC countries (per cent)
(I/S)X = India's share in Bangladesh's exports to SAARC Countries (per cent)
(I/S)M = India's share in Bangladesh's imports from SAARC Countries (per cent)
Source: IMF (Various Years): Direction of Trade Statistics Yearbook and author's
calculations.
The importance of India as the source of Bangladesh’s imports can be well understood by
the Table 6. Based on official trade data only, India was the fourth largest importing
source for Bangladesh in 1990 just after Japan, Singapore and the USA. If unofficial
trade were taken into account, India’s position would be higher. The table also reveals
that India topped the list for Bangladesh’s imports in 1995, and since then India
continued to maintain the largest importing source for Bangladesh.
Table 6: India's Position among Top 5 Import Partners (Official Trade) of
Bangladesh for Selected Years (Millions of US$).
Country Imp'90 Country Imp'95 Country Imp'00 Country Imp'03
Japan 482 India 994 India 945 India 1489
Singapore 407 China 601 Japan 850 China 1326
USA 186 Japan 598 Singapore 761 Singapore 910
India 170 Hong Kong 420 China 668 Japan 640
Hong Kong 168 Korea 417 Hong Kong 470 Hong Kong 471

13
Source: IMF (Various Years), Direction of Trade Statistics Yearbook.
3.4 The Importance of Bangladesh in India’s Trade
The importance of Bangladesh to India’s trade can also be examined. Bangladesh’s
contribution to India’s global trade was 0.74% in 1990. In 1995, this share rose to 1.59
percent (Table 7). After that, though this figure decreased marginally, it was still 1.13
percent in 2003. This is the official record of trade; if unofficial trade is also considered,
this ratio would be double or even more.
With regard to exports, Bangladesh’s contribution to India’s global exports is significant.
In 1990, India’s exports to Bangladesh was 297 million i.e. 1.67 percent of India’s global
exports. Within 5 years of time, i.e. in 1995, this ratio increased to 3.14 percent. In 2002
and 2003, Bangladesh’s share in India’s global exports was 2.11 and 2.42 percent
respectively.
As per as import of India is concerned, India imported from Bangladesh only 0.06
percent of its global imports in 1990. This ratio was more or less the same over the years
except in 1995 and 2001 when it rose to 0.23 percent and 0.13 percent respectively
(Table 7).
In the context of India’s trade with the SAARC countries, Bangladesh’s contribution is
significant. Bangladesh constituted 40.91 percent of India’s total trade with the SAARC
countries in 2003. In 1990 and 1995, this ratio was 53.42 and 59.64 percent respectively.
Bangladesh’s share of India’s exports to SAARC countries was 49.64 per cent in 2003. In
2002, it was 52.57 percent. In 1990 and 1995, this ratio was even higher, 60.98 and 62.17
percent respectively. However, Bangladesh’s share of India’s imports from SAARC
countries was not convincing; it was only 8.42 percent in 2003.

14
Table 7: Bangladesh's Share in India's Trade in Global and SAARC
Perspectives for Selected Years (Million of US$)
Item 1990 1995 2000 2001 2002 2003
Global Exports of India 17813 30537 44313 44613 49312 57080
Global Imports of India 23990 34484 52773 51562 56517 71238
Exports to SAARC 487 1544 2018 2347 1982 2786
Imports from SAARC 97 198 381 436 492 748
Exports to Bangladesh 297 960 860 1087 1042 1383
Imports from Bangladesh 15 79 55 67 43 63
(B/W)T 0.74 1.59 0.94 1.2 1.02 1.13
(B/W)X 1.67 3.14 1.94 2.44 2.11 2.42
(B/W)M 0.06 0.23 0.1 0.13 0.07 0.08
(B/S)T 53.42 59.64 38.14 41.47 43.86 40.91
(B/S)X 60.98 62.17 42.61 46.31 52.57 49.64
(B/S)M 15.46 39.9 14.43 15.36 8.73 8.42
Notes:
(B/W)T = Bangladesh's share in India’s global trade (per cent)
(B/W)X = Bangladesh's share in India’s global exports (per cent)
(B/W)M = Bangladesh's share in India’s global imports (per cent)
(B/S)T = Bangladesh's share in India’s trade in SAARC countries (per cent)
(B/S)X = Bangladesh's share in India’s exports to SAARC Countries (per cent)
(B/S)M = Bangladesh's share in India’s imports from SAARC Countries (per
cent)
Sources: United Nations (Various Years): Statistical Yearbook for Asia and the
Pacific,
IMF (Various Years): Direction of Trade Statistics
Yearbook, and author's calculation

15
The importance of Bangladesh for India’s export market can further be realized from the
Table 8. It is observed that India’s largest export market in the SAARC region is
Bangladesh at all the time.
Table 8: Direction of India's Exports to SAARC Countries for Selected Years
(Percent of Total Share)
Country 1990 1995 2000 2001 2002* 2003*
Bangladesh 1.67 3.14 1.94 2.44 2.11 2.42
Bhutan --- 0.04 0.03 0.04 0.01 0.01
Maldives 0.03 0.04 0.09 0.1 0.05 0.08
Nepal 0.22 0.35 0.89 0.97 0.35 0.38
Pakistan 0.24 0.23 0.37 0.49 0.3 0.32
Sri Lanka 0.57 1.25 1.23 1.23 1.2 1.68
SAARC 2.73 5.05 4.55 5.27 4.02 4.89
World 100 100 100 100 100 100
Sources: United Nations (Various Years), Statistical Yearbook for Asia and the Pacific
* IMF (Various Years), Direction of Trade Statistics Yearbook
Author's Calculation
3.5 The Balance of Trade of Bangladesh with India
As mentioned earlier, Bangladesh had always trade deficit with India since its
independence, and recently it has increased significantly. Table 9 and figure 1 provide the
bilateral trade situation between Bangladesh and India for 31 years, 1973-2003. These
figures clearly indicate the unfavorable trade balance of Bangladesh with India. In 1990s,
especially in the 2nd half of the decade, trade deficit of Bangladesh increased very
sharply. In 2003, the trade deficit reached to US$ 1, 435.9 million, which is about 4 times
higher, compared to 1993, and more than 46 times higher compared to 1983. The value of
exports compared to that of imports is always quite low, and in 2002 and 2003, it was 3.4
and 3.6 percent respectively. This is really a disappointing picture for Bangladesh’s
bilateral trade financing as, according to economic theory, country’s exports are to be
used to pay for its imports. Though the export-import relationship should be looked at the

16
world trade level rather than bilateral level, yet this trade imbalance still has some
economic and political implications for Bangladesh.
Table 9: Bangladesh's Trade Balance with India, 1973-2003 (millions of US $)
Year Export Import Deficit Exports as percentage of imports
1973 23.3 114.8 91.5 20.3
1974 0.4 82 81.6 0.5
1975 5.3 83.3 78 6.4
1976 7.1 58.5 51.4 12.1
1977 0.6 55.2 54.6 1.1
1978 2.3 43 40.7 5.4
1979 12.1 40 27.9 30.3
1980 8 55.6 47.6 14.4
1981 20.2 64 43.8 31.6
1982 20.3 43.3 23 46.9
1983 6.9 37.9 31 18.2
1984 28.3 60.1 31.8 47.1
1985 29.6 64.9 35.3 45.6
1986 7.7 57.2 49.5 13.5
1987 11 74.4 63.4 14.8
1988 8.7 90 81.3 9.7
1989 10.7 120.7 110 8.9
1990 22 170 148 12.9
1991 23 189 166 12.2
1992 4 284 280 1.4
1993 13 380 367 3.4
1994 24 467 443 5.1
1995 36 994 958 3.6
1996 20 1138 1118 1.8
1997 37.2 795.6 758.4 4.7

17
1998 55 1178.8 1123.8 4.7
1999 49.5 1023.8 974.3 4.8
2000 50.1 945.5 895.32 5.3
2001 60.8 1195.5 1134.7 5.1
2002 39.3 1145.8 1106.5 3.4
2003 52.9 1488.7 1435.9 3.6
Sources: IMF (Various Years), Direction of Trade Statistics Yearbook and author's
calculation.
Fig. 1: Bangladesh's Trade Picture with India, 1973-2003
-2000
-1500
-1000
-500
0
500
1000
1500
2000
1973 1975 1977 1979 1981 1983 1985 1987 1989 1991 1993 1995 1997 1999 2001 2003
Year
US$
(Mill
ion)
Export Import Trade balance
3.6 Trade Structure of Bangladesh with India
Bangladesh’s exports to India are highly concentrated to a few items. Table 10
demonstrates that the country’s major countable export items were only six in FY 1994-
FY1996. In fact, in FY 1996 only 3 items- chemical fertilizer, raw jute and frozen fish-
constituted about 90 percent of Bangladesh’s exports to India. However, fertilizer and
newsprint are sometimes export items and sometimes import items depending on
domestic production (Eusufzai 2000).

18
On the other hand, India’s exports to Bangladesh are more diversified and export-base is
significantly wide. It is observed from Table 11 that Bangladesh classified a total number
of 5985 items for imports in the First Import Schedule at 8-digit H.S. Code level. Out of
5985 items, in FY 1996, Bangladesh’s imports from the world were 4601 items of which
2129 items were from India alone. In terms of number of commodities imported from
India, India’s contribution to Bangladesh’s global imports was 47.8, 45.8 and 46.3
percent respectively in FY 94, FY 95 and FY 96.
Table 10: Structure of Bangladesh's Exports to India (in percent)
Commodities FY 1994 FY 1995 FY 1996
Chemical Fertilizer 20.6 57 60.7
Raw Jute 48.8 33.1 16.1
Frozen Fish 0.1 3.8 11.8
Other Mfg..Goods 0.1 0.1 5.9
Leather 12.7 4.1 3.3
Tea 3.2 --- 0.9
0thers 14.5 1.9 1.3
Total 100 100 100
Source: Quoted from Rahman, M (1998)

19
Table 11: Number of Commodities Imported by Bangladesh at 8 Digit H.S.
Code Level
Commodities FY 1992 FY 1993 FY 1994 FY 1995 FY1996
Number of commodities
covered under global imports 3708 4056 4404 4533 4601
Number of commodities
covered under imports
from India 1308 1708 2104 2078 2129
Commodities imported from
India as % of global imports 35.3 42.1 47.8 45.8 46.3
Note: Total number of H.S. Code at 8-digit level classified in the
First Schedule of Imports is 5985
Source: Quoted from Rahman, M. (1998)
Table 12 provides data on the imports composition of Bangladesh from India for selected
years during FY 1980 to FY 1996. It is evident from the table that Bangladesh’s major
imports items from India are vegetable products, textile and textile articles, machinery
and transport equipments, chemical and allied products, mineral products, and base
metals. Examining the data of FY 1996 we see that vegetable products constituted 36.64
percent of total imports of which cereals alone accounted for 33.24 percent. The second
largest import category was the textile and textile articles, which constituted 27.43
percent of total imports. This category’s rank was the first in FY 1991, FY 1994 and FY
1995. More than 50 percent of total imports from India were under this category in FY
1991.
Observing data for last three years it is revealed that textile and textile related articles
plus the machinery and transport related equipment constituted for roughly 49 percent of
total imports from India. Thus Bangladesh’s total official imports consist of significant
portion ‘intermediate’ inputs.

20
Table 12: Composition of Bangladesh's Imports from India (in percent)
Item FY 1980 FY 1985 FY 1991 FY 1994 FY 1995 FY 1996
Total Imports 100 100 100 100 100 100
Veg. Products 11.15 8.91 6.52 7.24 13.91 36.64
Of which: Cereals 4.4 0.07 --- 0.02 11.9 33.24
Textile &Textile articles 3.5 15.94 53.42 46.58 35.04 27.43
Of which: Cotton --- --- 27.17 33.39 25.96 21.36
Mach.,Transport
equipment&accessories 32.02 25.79 13.09 10.62 14.82 12.62
Of which:transport 14.36 7.29 3.89 4.84 8.35 6.46
Chemical & Allied
Industries 11.98 10.85 4.32 7.08 8.99 6.21
Of which:Fertilizers 0.01 0.01 0.0003 0.92 3.67 1.91
Base Metals 4.18 2.47 3.11 6.35 7.84 3.62
Of which: Iron or
Steel 0.68 0.51 0.36 2.58 5.61 1.91
Mineral Products 5.37 1.7 11.01 13.75 10.8 6.56
Of which: Cement --- --- --- 9.45 5.68 4
Others 31.8 34.34 8.53 8.38 8.6 6.92
Source: Quoted from Eusufzai, Z. (2000) and author's calculation

21
4. Problems Causing Indo-Bangladesh Trade Imbalance
Although the trade deficit with a particular country is not bad if the over all trade balance
is satisfactory, yet from the distribution aspect of trade policies (the distribution of
benefits and cots among groups of producers and groups of consumers) the growing trade
deficit with India is a great concern for Bangladesh. Bangladesh’s fear is that if this
deficit continues, Bangladesh will be dependent only on a few products for its exports,
and imports from India displace domestic production to such an extent as to de-
industrialize Bangladesh. As a result, it is argued, a severe polarization in Bangladesh and
high levels of unemployment will occur. Therefore, increasing trade deficit with India is
a problem, and attempts are made here to find out the causes of this problem.
4.1 Bilateral Exchange Rate
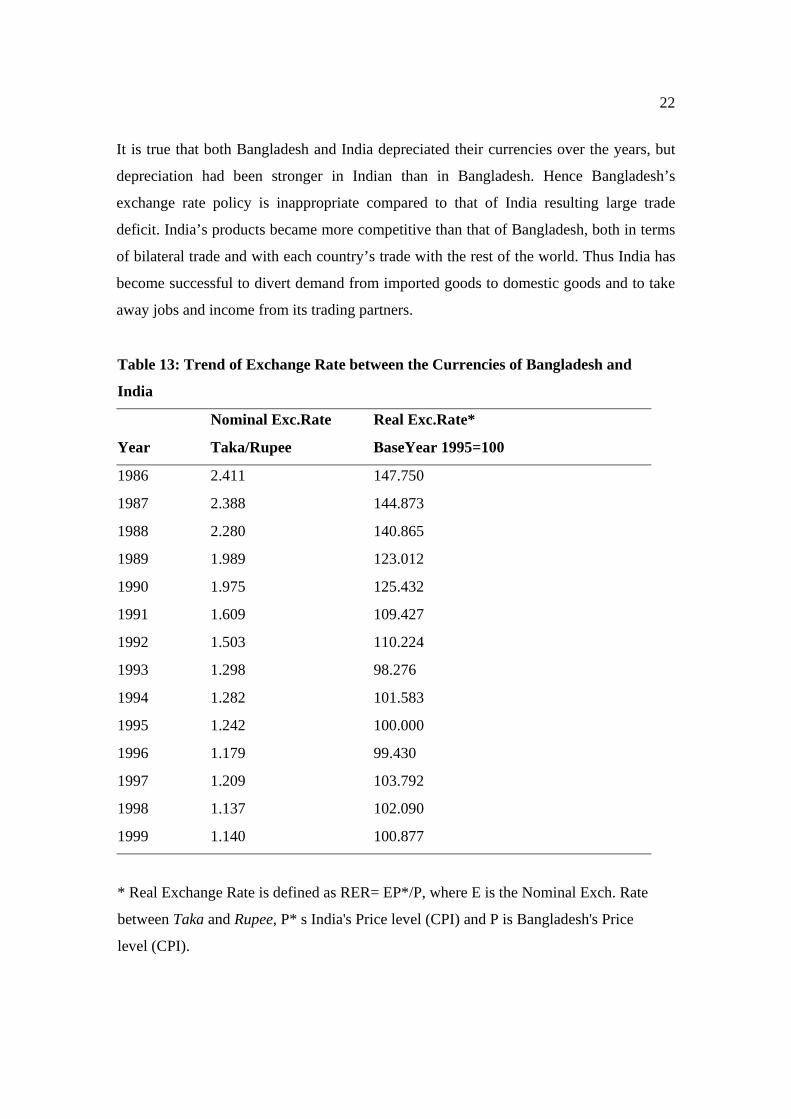
Bilateral exchange rates between Bangladesh and India during 1986 to 1999 have been
presented in Table 13 in order to explore the dynamics underlying this expansion of trade
imbalance between these two countries. Available data exhibit that the nominal and real
values of the Bangladesh’s Taka vis-à-vis the Indian Rupee have been appreciating, with
negligible exceptions, over the years. This appreciation of Taka has a significant positive
effect on the increased trade deficit of Bangladesh with India.
It is evident from the table that the nominal exchange rate, Taka per Rupee, had been
continuously declining right from 1986 to 1996. In 1997, though it increased slightly, it
started to decline again from 1998. This declining trend of the exchange rate implies that
Taka had been appreciating. In nominal term, the exchange rate decreased to 1.140 in
1999 from 2.411 in 1986 indicating a 52.71 percent appreciation of Bangladesh’s Taka
against Indian Rupee during 13 years of time.
The downward trend of real exchange rate was also observed from the Table 13. In real
term, Taka appreciated 31.72 percent against Indian Rupee in 1999 compared to 1986.
Thus the appreciation of Taka, both in nominal and real terms, might have contributed to
the growing trade deficit of Bangladesh.
22
It is true that both Bangladesh and India depreciated their currencies over the years, but
depreciation had been stronger in Indian than in Bangladesh. Hence Bangladesh’s
exchange rate policy is inappropriate compared to that of India resulting large trade
deficit. India’s products became more competitive than that of Bangladesh, both in terms
of bilateral trade and with each country’s trade with the rest of the world. Thus India has
become successful to divert demand from imported goods to domestic goods and to take
away jobs and income from its trading partners.
Table 13: Trend of Exchange Rate between the Currencies of Bangladesh and
India
Nominal Exc.Rate Real Exc.Rate*
Year Taka/Rupee BaseYear 1995=100
1986 2.411 147.750
1987 2.388 144.873
1988 2.280 140.865
1989 1.989 123.012
1990 1.975 125.432
1991 1.609 109.427
1992 1.503 110.224
1993 1.298 98.276
1994 1.282 101.583
1995 1.242 100.000
1996 1.179 99.430
1997 1.209 103.792
1998 1.137 102.090
1999 1.140 100.877
* Real Exchange Rate is defined as RER= EP*/P, where E is the Nominal Exch. Rate
between Taka and Rupee, P* s India's Price level (CPI) and P is Bangladesh's Price
level (CPI).
23
Source: World Bank (2001), World Development Indicator and author's calculation.
4.2 Productivity Issues and Structural Factors
The productivity differences can also best explain trade patterns between countries. India
has productive advantages both in agriculture and industry compared to Bangladesh
because of scale economies (Eusufzai 2000). Structurally Indian economy is much larger,
more diversified and technologically advanced. Indian products now have become
globally competitive both in terms of price and quality. Also geographically India is very
closed to Bangladesh, and Bangladesh’s importers are very familiar with Indian products
and production capacities. All these factors have made Indian products very competitive
in Bangladesh’s market (Hassan 2002). As a result, India’s exports to Bangladesh are
more diversified and consists of high value added manufactured goods. On the other
hand, India’s imports from Bangladesh are limited to a few items, as Bangladesh does not
have a large supply base to offer a wide variety of products to India. The obvious result is
an increase of trade imbalance between the two nations.
4.3 Tariff and Non-Tariff Barriers
Historically, both Bangladesh and India used to follow a similar type of import
substituting industrial policy. They, however, started to move towards more liberal trade
policies since the 1980s along with the worldwide move towards more open economies.
It is generally agreed that Bangladesh has initiated the program of tariff liberalization
earlier than India- in the mid 1980s, and the speed of liberalization in Bangladesh is faster
than that in India. Bangladesh has continued this higher speed of liberalization till recent
years (Rahman 1998 and Eusufzai 2000, Dasgupta 2000). This is evident from the Table
14, which shows a comparison of nominal rates of protection (simple average and import
weighted average) for both countries in three different sectors.

24
The table shows that Bangladesh sharply reduced its tariff rates in all categories of
imports in FY1996 compared to FY19912. For intermediate and capital goods, both for
the unweighted average and the import-weighted average, Bangladesh exhibited a
slightly higher speed of liberalization than India. Tariff reduction in consumer goods
sector though seems higher in India than in Bangladesh during this period, there were
significant quantitative restrictions on consumer goods imports in India.
Table 14: Average Tariff Rates in Bangladesh and India for FY 1991 and FY 1996
FY 1991 FY 1991 FY 1996 FY1996
Sector
Countr
y
Unweighted
Import-
Weighted
Unweighted Import-Weighted
Consumer
B'Desh 124.4 50.0 8.3 25.5
Goods India 145.5 105.9 33.1 39.3
Intermedia
te
B'Desh 79.0 55.0 22.2 24.9
Goods India 129.8 73.8 36.9 33.8
Capital
B'Desh 72.0 47.2 15.0 14.2
Goods India 105.2 92.5 35.3 33.2
Source: Eusufzai (2000)
Recently Indian commodities, compared to the world’s commodities, faces lower average
tariff restrictions in Bangladesh. Table 15 compares the dynamics of decline in the
2 In FY2000, average tariff rate was 22 per cent. Average tariffs on capital goods, intermediate goods and consumer goods are 8.9, 15.5 and 29.2 per cent respectively. Only 2 percent of the items are subject to QRs (Kemal et al 2002).

25
average import weighted tariff imposed by Bangladesh on its imports from the world and
India. It is observed that Indian imports faced a higher rate of tariff (31.16%) compared
to the world average (24.14%) in FY 1992. However, import weighted tariffs on imports
from India were lower (12.05%) than that from the world (17.33%) by FY 1996. This
reverse scenario came because of almost 60 per cent decline of import weighted tariff rate
between FY1994 and FY1995 on imports from India compared to 14.70 per cent decline
on imports from the world (Eusufzai 2000).
Table 15: Dynamics of Decline in Average Import Tariffs of Bangladesh, FY 92- FY 96
Item FY 1992 FY1993 FY1994
FY1995 FY1996
Weighted Average of Tariff for
Global Imports (per cent) 24.14 23.56 24.09 20.79 17.33
Change (per cent) -2.40 2.22 -14.70 -18.20
Weighted Average of Tariff for
Imports from India (per cent) 31.16 23.48 25.09 13.77 12.05
Change (per cent) -2.83 6.63 -59.99 -3.34
Source: Eusufzai (2000)
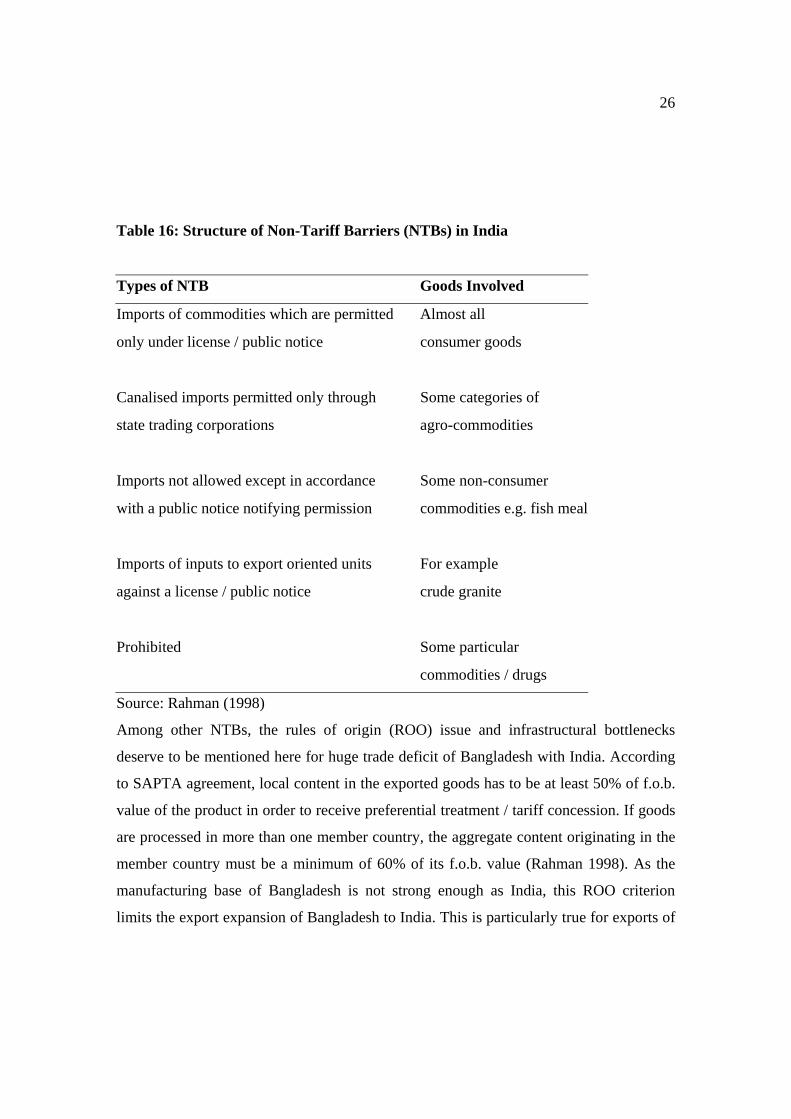
There are many non-tariff barriers (NTBs) in India that Bangladeshi exporters are to face
to enter into Indian markets. These NTBs are real cause of concern for Bangladesh’s
business community. In Table 16, five types of such NTBs are mentioned that are
imposed on imports of India. Rahman (1998) notes that there are thousands of items
under these NTBs, and Bangladeshi exporters are generally unhappy with these NTBs as
there is lack of transparency and clarity with regard to application of these NTBs because
customs authorities in India mainly apply these according to their own discretion. Though
significant fiscal reforms took place in the 1990s in India, trade policy pursued by Indian
government is considered as highly complex and restrictive.
26
Table 16: Structure of Non-Tariff Barriers (NTBs) in India
Types of NTB Goods Involved
Imports of commodities which are permitted Almost all
only under license / public notice consumer goods
Canalised imports permitted only through Some categories of
state trading corporations agro-commodities
Imports not allowed except in accordance Some non-consumer
with a public notice notifying permission commodities e.g. fish meal
Imports of inputs to export oriented units For example
against a license / public notice crude granite
Prohibited Some particular
commodities / drugs
Source: Rahman (1998)
Among other NTBs, the rules of origin (ROO) issue and infrastructural bottlenecks
deserve to be mentioned here for huge trade deficit of Bangladesh with India. According
to SAPTA agreement, local content in the exported goods has to be at least 50% of f.o.b.
value of the product in order to receive preferential treatment / tariff concession. If goods
are processed in more than one member country, the aggregate content originating in the
member country must be a minimum of 60% of its f.o.b. value (Rahman 1998). As the
manufacturing base of Bangladesh is not strong enough as India, this ROO criterion
limits the export expansion of Bangladesh to India. This is particularly true for exports of

27
some cosmetic goods and toiletries, where Bangladesh has achieved notable expertise,
and India has a huge market for this kind of products.
Inadequate infrastructure in Bangladesh also imposes sever limitations on trade
expansion with India. There is severe lack of facilities of infrastructure in all land-routes,
except Benapole. Severe limitations also exist in storage facilities. As a result, enhancing
exports from Bangladesh to India is being constrained.
5 Remedial Measures and Opportunities
Given the current trade scenario with India, the obvious question is now what can be
done to reduce, if not remove, the huge trade deficit of Bangladesh. There is no simple
and shortcut answer to this question. The search for effective solution must be looked at
with due consideration of macroeconomic reality, different policy options and honest will
of cooperation of both countries.
It is important to note that one cannot expect dramatic reduction of trade deficit of
Bangladesh with India within a short span of time even though required policy options
are designed and implemented. This is realized based on the current pattern and trend of
bilateral trade and prevailing state of fundamentals of the Bangladesh economy.
However, in the short run, detrimental impacts of bilateral trade deficit can be minimised
if appropriate steps are taken. For effective and durable solution, medium and long-term
measures must be undertaken too. Below are some remedial measures that could be
considered to improve the trade imbalance between these two neighboring countries.
5.1 Productive Capacity and Economic Efficiency
As mentioned earlier, the internal dimension of the trade deficit problem is related to the
poor economic strength of Bangladesh compared to that of India. So the production
capacity and economic efficiency of Bangladesh must increase in order to meet the
country’s growing demand for importable goods and maximize the export earnings. In
the major economic sectors, efficient import-substituting activities must increase along
with continuous improvement of economic efficiency and competitiveness within an
28
open economic environment. Huge exportable surplus are to be generated and exports
must be diversified taking Indian demand requirements into account. Bangladesh must
earn relative efficiency in the production of exportable goods and services to reduce her
trade deficit.
To gain from bilateral trade, there is no alternative but to increase the productivity in all
sectors as a long run measure. For this purpose, Bangladesh’s agriculture sector urgently
needs a technological spurt. More research and development, transfer of technologies,
market based effective price system and appropriate incentive mechanisms are very
important to enhance the country’s agricultural productivity. To increase the productivity
in the industrial sector, development of the country’s technical base and technological
capacity building are crucial. To develop the technological capacity building, huge
investment, creative intervention of the government, appropriate incentive mechanism to
foster technical education must take place in the country. As regard the productivity
increase in the service sector, quality of education must be increased; quality medical
service within reasonable cost must be ensured. Huge private investment in health and
education with creative government interventions would be very helpful for this purpose.
5.2 Competitive Devaluation of Bangladesh Currency
As noted earlier, Bangladesh currency has been appreciated against Indian currency over
the years both in nominal and real terms, and this may be one of the main reasons of huge
trade deficit of Bangladesh. Therefore, a competitive devaluation of Bangladesh’s
currency is imperative in order to make Bangladesh products price competitive both in
Indian and world markets and thus to reduce trade imbalance. Also trade imbalance has
deteriorated because of huge informal trade; this must be stopped, and reinforcement of
border patrol can help in this regard.
5.3 Tariff and Non-Tariff Concessions
Bangladesh’s trade strategy with India must revolve around the SAPTA tariff
negotiations. In this regard “zero export duty” strategy is getting importance. India should
take necessary steps of unilaterally taking the decision of providing zero-tariff access of

29
Bangladesh’s exports to India. Tariff preference should be given on those items that have
high import value, are actually traded and have high potential for entering into Indian
market. India may exclude those irrelevant items from its concession list for Bangladesh,
which Bangladesh does not produce, or hardly exports.
However, mere tariff concession will not reduce trade deficit of Bangladesh to any
significant extent if NTBs, which are more serious impediments of export expansion of
Bangladesh to India, are not phased out simultaneously. Appropriate measures must be
taken by India in this regard. Such measures would certainly encourage local, Indian and
regional investors to locate investment in Bangladesh targeted to the larger Indian
market.
Because of Bangladesh’s great dependence on imported inputs for its exports, especially
for manufacturing exports, low backward linkages of industries, the domestic value
addition is also low. Hence concession given on the range of goods is extremely limited.
So the ROO requirement should be modified in order to bring change in the local content
requirement. To be eligible for SAPTA concessions, this local content requirement for
Bangladesh’s commodities should be brought down to 25 per cent. These tariff and non-
tariff concessions are, however, short term measures only.
5.4 Joint Ventures
The trade imbalance can greatly and effectively be reduced by cordial and productive
mutual cooperation. There are still many opportunities that could be exploited for the
greater benefit of both countries and thus reducing the trade deficit of Bangladesh with
India. For example, Bangladesh can obtain financial benefits by the greater economic
integration with Indian North-Eastern States (NES), which are geographically situated in
a disadvantageous location from the main land. A system of joint ventures (JVs) with
buy back arrangements is to be developed. Such JVs will stimulate FDI to Bangladesh
and thus productively exploit the opportunities of existing complementarities. To meet
the demand of NES of India, JVs investments in cement, granite and lime stone, paper,
food and fruit processing plants had already been identified. Other identified sectors,

30
where JVs projects could be set up, are textile, fertilizer, newsprint, pharmaceuticals,
small steel plants, chemicals, machine tools, fish processing and leather goods (Rahman
1998). The JVs investments in backward linkage textile sector is very important for
Bangladesh to enhance the local value addition of the country’s major export item, ready
made garments. Both countries can also be benefited from the joint investment in
information, communication and financial services. Also there is a tremendous scope for
Indian private investment in Bangladesh’s education and health sectors. Bangladesh can
reduce its trade deficit by such investment, as trade in services now is mostly one way
(Bangladesh imports service from India). These JVs investments should target regional as
well as world markets. For successful JVs, private sectors in both countries should come
forward and the governments must support by providing adequate incentives,
infrastructures and appropriate policies.
Bangladesh can reduce its trade deficit by allowing sea and road transits to India;
however, the transit issue is very controversial in the country. Both countries must
prepare an appropriate cooperation framework in this regard.
Therefore, potentials and opportunities to improve bilateral trade imbalance between
Bangladesh and India are available. The necessary matters are proper initiatives, policy
measures, mutual cooperation and above all political will of both countries. Maximum
efforts are to be made by the people and the governments of these two countries in order
to attain the highest possible mutual gains from the bilateral trade exploiting all
potentials.
6 Summary and Conclusions
In this chapter, attempts have been made to highlight the importance of study of bilateral
trade relationship between Bangladesh and India. Historically India has been the
important trading partner of Bangladesh since its independence. Currently India is the
2nd largest trading partner of Bangladesh, and India’s position is at the top for
Bangladesh’s imports trade.

31
The study also underscores the trend, structure and current picture of Bangladesh-India
trade. It is observed that India’s export share is much higher than import share, and
Bangladesh’s imports share is much higher than export share in the SAARC regional
trade. Bangladesh’s trade with India increased tremendously especially in the 1990s. The
average annual growth rates of Bangladesh’s trade with India, during 1980 to 1995, were
much higher than those with the SAARC and the world.
India and Bangladesh are very important trading partners in the SAARC region. India
alone provided 94.1 percent of Bangladesh’s imports from the SAARC countries in 2003.
India’s share in Bangladesh’s total trade with the SAARC countries was 91.7 per cent,
and Bangladesh’s share in India’s total trade with the SAARC countries was 40.91 per
cent in 2003. In fact, Bangladesh is the India’s largest exports market in the SAARC
region. .
However, the trade relation between these countries is not balanced. Bangladesh has
always been trade deficit with India, and recently it has increased very sharply. Since this
trade imbalance has some economic and political implications on the Bangladesh
economy, Bangladesh considers it as a matter of great concern. Limited export base,
backward industries, inadequate infrastructure, lower productivity in Bangladesh,
appreciation of Bangladesh’s Taka against Indian Rupee, earlier and faster trade
liberalization program in Bangladesh compared to India, tariff and NTBs imposed by the
Indian government, huge illegal trade, diversified exports and technologically advanced
industrial base of India are the main reasons of this huge trade imbalance.
.
Therefore, current unequal bilateral trade needs to be transformed into mutually
beneficial, balanced and interdependent one. This has to be done for the great interests of
both economies. If Bangladesh cannot improve the situation, the country would
eventually become a market for Indian products, lose the existing industries, experience
high level of unemployment and lose import capacity by losing income from its exports.
On the other hand, for the sake of India’s own interest India should promote
Bangladesh’s export to India. If Bangladesh’s exports were increased, this would induce

32
higher imports of raw materials and intermediate goods from India. The demand for the
Indian consumer goods exports would also increase in Bangladesh due to higher income
from increased exports.
So some remedial measures have been suggested to mitigate this problem. The
governments, private investors and businessmen of both countries must work together to
bring these measures into reality.
The government of Bangladesh must try to remove all structural impediments of exports
expansion. Availability of sound physical, social and economic infrastructure, superior
product quality, sufficient institutional facilities for banking, credit and insurance,
improved law and order situation, labor unrest free environment, an honest and efficient
administration and continuous political stability must be ensured for the country’s export
promotion. To encourage capacity building and to improve productivity and
competitiveness in terms of both quality and cost, domestic and foreign investments must
be attracted through appropriate government policies. Maximum efforts are to be devoted
to diversify the export base.
Bangladesh should further devalue its currency to make its products more competitive.
Measures must be taken to stop illegal trade; tariff and NTBs- free entry of Bangladesh’s
exports to Indian market must be ensured; more Indian investments in Bangladesh in the
form of JVs must be encouraged.
There is no reason to believe that Bangladesh’s exports would flood or disrupt the whole
Indian domestic market if India establishes a unilateral free trade regime for Bangladeshi
products, as Bangladesh’s industrial base is relatively weak. So the Indian government
should also be cordial to remove this trade imbalance.
Trade intensity indices imply that bilateral trade between these two countries was not as
high as it should be. So there is a scope for mutual trade expansion Trade
complementarities between Bangladesh and India can be developed by vertical
33
specialization through production sharing arrangements. It would allow both countries to
strengthen their trade ties and to reap economies of scale by concentrating on a specific
production process in the value-addition chain.
For the economies of two countries a coordinated development approach is also essential.
The two countries can work together in the field of tourism by joint marketing and joint
publicity, and in establishing the price of jute by coordinated holding of stocks, etc.
It is important to remember that bilateral relationship with India needs to be looked at in
conjunction with regional and multilateral cooperation. Hence a cordial and productive
cooperation between these two development partners must be ensured within appropriate
regional and multilateral cooperation framework to reduce the trade imbalance. So it is
crucial to make SAPTA more effective and operational.
Bibliography Bakht, Z. 1998. ‘Recent Export Performance of South Asia’ in Sadrel A.L Reza (ed.) Export-led Growth Strategy for South Asia: Prospects and Challenges, Asian and Pacific Development Centre. Bhattacharyya, B and Pal, P. 1998. Trade Related Joint Ventures Between India and Bangladesh, Indian Institute of Foreign Trade, New Delhi-110016. CII. 1995. ‘Non Tariff Barriers in SAARC Countries’, Research Report, Research Department, Confederation of Indian Industry (CII), New Delhi 110 003. Cookson, Forrest E. 2002. ‘Overview of Sub-regional Economic Cooperation’ in Cookson, Forrest E. and Alam, A.K.M.S. 2002. (ed.) Towards Greater Sub-regional Economic Cooperation. CPD. 2000. ‘SAARC: Present and Future’ Centre for Policy Dialogue(CPD) Report No. 25, Dhaka. CPR .1995. ‘Indo-Bangladesh Dialogue- Economic and Trade Cooperation’, Report, Prepared by Centre for Policy Research (CPR), New Delhi and Centre for Policy Dialogue (CPD), Dhaka.

34
Dasgupta, B. 2000. ‘International Institutions for Global Trade: The Case for South Asian Free Trade association’, in Dutta, D. (ed.) Economic Liberalization and Institutional Reforms in South Asia: Recent Experiences and Future Prospects. Atlantic Publishers and Distributors, New Delhi. Dash, K.C. 1996. ‘ The Political Economy of Regional Cooperation in South Asia’, Pacific Affairs, Vol. 69, No.2. Eusufzai, Zaki. 2000. Liberalisation in the Shadow of a Large Neighbor: A Case of Bangladesh-India Economic Relations. Centre for Policy Dialogue, The University Press Limited, Dhaka, Bangladesh. Fernando, T.S.N. 1990. ‘Trade Expansion in South Asia: Liberalization and Mechanisms-Overview 1’, in V. Kanesalingam and A.R. Kemal (ed.), Regional Study. Colombo, Sri Lanka. Hassan, M.K. 2002. ‘Trade with India and Trade Policies of Bangladesh’ in Cookson, Forrest E. and Alam, A.K.M.S. 2002. (ed.) Towards Greater Sub-regional Economic Cooperation, chapter 10: 349-401. Hassan, M. K. 2001. ‘Is SAARC a Viable Economic Block? Evidence from Gravity Model’, Journal of Asian Economics, Vol. 12, No. 2, North-Holland. IMF 2004. Direction of Trade Statistics (Quarterly), June 2004. IMF. Various Years. Direction of Trade Statistics Yearbook, Washington D,C. Kemal et al 2002. ‘A Plan to Strengthen Regional Trade Cooperation in South Asia’ in T.N. Srinivasan (ed.), Trade, Finance and Investment in South Asia, Social Science Press, New Delhi. Khan, S.M. 1997. ‘ South Asia: Free Trade Area and Trade Liberalization’, Journal of Asian Economics, Vol. 8, No.1:165-177. Kojima, K. 1964. ‘The Pattern of International Trade Among Advanced Countries’, Hitosubashi Journal of Economics, Vol. 5, No.1, June. Madaan, D.K. 1996. Indo-Bangladesh Economic Relations and SAARC, Deep and Deep Publications, New Delhi-110059. Mayer, Jorg & Wood, A. 2001. ‘ South Asia’s Export Structure in a Comparative Perspective’, Oxford Development Studies, Vol. 29, No.1. Mehta, R.1999. ‘Tariff and Non-tariff Barriers of Indian Economy’ A Profile, Research and Information System for the Non-Aligned and Other Developing Countries.

35
Pohit, S and Taneja, N. 2003. ‘India’s Informal Trade with Bangladesh: A Qualitative Assessment’, The World Economy, Vol. 26, No. 8: 1187-1214 (28), Blackwell Publishing. Rahman, M 2000. ‘Bangladesh-India Bilateral Trade: An Investigation into Trade in Services’, Draft Report, Prepared under South Asia Network of Economic Research Institutes (SANEI) Study Program, CPD, Dhaka. Rahman, M.1998. ‘Bangladesh-India Bilateral Trade: Current Trends, New Perspectives, New Challenges’, BIISS Journal, Vol.19, No.1. Rahman, M.1998a. ‘Intra-regional Trade in South Asia: Current Status, Emerging Opportunities and Future Challenges’, in Sadrel A.L. Reza (ed.), Export led Growth Strategy for South Asia: Prospects and Challenges, Asian and Pacific Development Centre. Rahman, S. 1997. ‘Non-Reciprocity in Bangladesh-India Bilateral Trade: A Case for Market Access & Domestic Competitiveness’, BIISS Journal, Vol. 18, No. 3 Rashid, M.A. 1998. ‘Economic Policy Reforms in South Asia’ in Sadrel A.L Reza (ed.) Export-led Growth Strategy for South Asia: Prospects and Challenges, Asian and Pacific Development Centre. Taneja, N. 2001. ‘Informal Trade in the SAARC Region’, Economic and Political Weekly, 17 March. United Nations (Various Years), Statistical Yearbook for Asia and the Pacific. Venkatasubbulu, T.1996. India’s Trade with SAARC Countries, Discovery Publishing House, New Delhi 110 002. World Bank (2001), World Development Indicator, Washington D.C.