Embed Size (px)
Citation preview

I
A research study into the preferences of the inhabitants and the visitors of the City Centre of Leiden to avoid and/or guide overtourism.
Balancing the focus of City Marketing in the fight against Overtourism
Name: Luuk Werff Studentnumber: S1047587 Supervisor: Prof. dr. H. Ernste Date: 31-05-2021

II

III
Balancing the focus of city marketing in the fight against overtourism
A research study into the preferences of the inhabitants and the visitors of the City Centre of Leiden to avoid and/or guide overtourism.
Master thesis Cultural Geography and Tourism
Faculty of Management
Radboud University Nijmegen
Student: Luuk Werff
Student number: S1047587
Supervisor: Prof. Dr. Huib Ernste
Internship: Leiden Marketing
Cover: Emile van Aelst
Date: 31 May 2021
Word count: 32499

IV
Preface
After a special period of hard work, this is my master thesis on overtourism in the city of Leiden. Preparations
for this research have already started in September 2019 and an internship was found. When the internship and
accompanying research started, the Covid-19-virus came into play. A situation where my research suddenly
no longer seemed relevant. I was reminded of the words of Johan Cruijff who said: "Every disadvantage has
its advantage". So, I started looking at the positive aspects of the Covid-19 crisis on my research and found
out that it is precisely at this time that the difference between the appearance of tourists and no tourists can be
properly depicted. However, this advantage only became apparent at the end of my internship period.
Unfortunately, I had to continue my research on my own initiative.
Although, I continued the research on my own initiative, I would still like to thank Leiden Marketing
for the support and the conversation they entered with me. I learned a lot during this special period, and I was
able to experience what city marketing looks like in times of crisis. Besides, I found out that city marketing is
a very dynamic field with more aspects and stakeholders than I thought in advance.
Also, I would like to thank my thesis supervisor Huib Ernste for his professional input during our
conversations and for the feedback he has given me. The flexibility he gave me through the Covid-19 crisis
has greatly contributed to the motivation for my thesis. The digital conversations were inspiring and have had
a positive impact on my product.
Then I would like to thank all my respondents who participated in the survey. These are the 394
respondents of the survey as well as the eight respondents of the interviews. Without their willingness to
cooperate, I would never have been able to do this research. It was particularly special that despite the difficult
times for hotels in Leiden, they were still willing to talk to me about a subject such as overtourism.
Finally, I would like to thank my family and friends with whom I have always been able to have good
conversations about my subject. Their help in setting up the survey and their mental support during this Covid-
19 period have always motivated me to work hard on my thesis. You are all greatly appreciated!
Luuk Werff
Nijmegen, May 2021
V
Executive summary
Just before Covid-19, tourism was one of the fastest growing sectors in the world. In pre-Covid-19 times, this
sector provided a lot of employment and also income for local organizations, such as small businesses and
local governments. The downside of tourism is that city centres become too crowded, which affects the quality
of life in a city. Until 2020, Amsterdam was a city that was overwhelmed by tourists according to both visitors
and residents, causing the quality of living and visits to deteriorate. Such a situation is referred to as
overtourism.
Now that Covid-19 has shut down the entire tourism industry, cities have the opportunity to develop a new
tourism strategy. Spreading visitors, for example to Leiden, is an option to take the pressure off, for example,
Amsterdam. To ensure that Leiden does not suffer from overtourism, it will be necessary to actively look at
the preferences of both residents and visitors to avoid such a situation of overtourism. City marketing
organizations can play an important role in this. This leads to the following question:
To what extent can a balance be found - in the field of tourism - between the wishes of the tourists and the will
of the residents of the city of Leiden and how can Leiden Marketing play a significant role in this?
Indicators for overtourism can be tested using the City Brand Model of Merilees et al. (2009). This model
examines 11 factors that all belong to the quality of life. These indicators were tested and analysed using
interviews (with hotel owners and a tourist office employee) and surveys (with residents). This analysis has
shown that Leiden (in the pre-Covid-19 period) is not yet subject to overtourism. Both visitors and residents
experience the city as pleasant to live and visit. Both groups indicate that safety, culture, heritage, nature and
environmental factors are the most important quality of life factors for a pleasant stay in Leiden. Visitors
indicate that the business position of Leiden also influences the appreciation of the city of Leiden. Leiden
scores well in this respect. However, gains can be made in terms of safety. Besides, the relationship between
the residents and the municipality is moderate. Residents do not feel that they have been heard and they believe
that policy cannot be influenced. A conversation with Leiden Marketing shows that public opinion differs
greatly. This means that a general preference does not exist. The different neighbourhoods in the city centre
all have a different view of tourism. However, it is wise to hold a survey every two years to map out this
opinion. The more because analysis has shown that overtourism is highly subjective and strongly dependent
on public opinion. Overtourism should therefore not be denied and public opinion will have to be taken
seriously. Nevertheless, it is not possible to keep the entire population satisfied and it is therefore important to
properly communicate the choices made to the residents. By maintaining a continuous dialogue with
stakeholders, support is created for choices regarding tourism and overtourism can be detected at an early stage
and possibly avoided.

VI
Table of content
CHAPTER 1 - INTRODUCTION .................................................................................................................. 1
1.1. SOCIETAL RELEVANCE .................................................................................................................... 1 1.2. SCIENTIFIC RELEVANCE ................................................................................................................. 2 1.3. RESEARCH OBJECTIVE AND RESEARCH QUESTIONS ..................................................................... 3 1.4. READING GUIDE ............................................................................................................................... 5
CHAPTER 2 – THE HISTORY OF OVERTOURISM ................................................................................ 7
2.1. THE DEVELOPMENT OF MASS TOURISM ......................................................................................... 7 2.2. TOURISTIC GROWTH IN LEIDEN ..................................................................................................... 8 2.3. THE WORST-CASE SCENARIO FOR LEIDEN ................................................................................... 10
CHAPTER 3 – THEORETICAL FRAMEWORK ..................................................................................... 13
3.1. OVERTOURISM ............................................................................................................................... 13 3.1.1. Scientific definition of overtourism ............................................................................................. 13 3.1.2. Tourist-resident conflict .............................................................................................................. 14 3.1.3. Responsible Tourism: liveability versus economic growth ......................................................... 15
3.2. ROLE OF CITY MARKETING IN GUIDING OVERTOURISM ............................................................. 15 3.2.1. What is city marketing? .............................................................................................................. 16 3.2.2. City marketing: public versus private ......................................................................................... 17 3.2.3. Social and Environmental effects ............................................................................................... 18 3.2.4. Doxey’s Irridex ........................................................................................................................... 20 3.2.5. Tourism carrying capacity .......................................................................................................... 21 3.2.6. City Brand Model ........................................................................................................................ 23
3.3. DETERMINING OVERTOURISM BASED ON LIVEABILITY .............................................................. 24 3.3.1. Definition of liveability ............................................................................................................... 24 3.3.2. Person environment fit ................................................................................................................ 25 3.3.3. Human elements .......................................................................................................................... 26 3.3.4. Environmental elements .............................................................................................................. 27
3.4. CONCEPTUAL MODEL .................................................................................................................... 29
CHAPTER 4 – METHODOLOGY ............................................................................................................... 31
4.1. RESEARCH AREA ............................................................................................................................ 32 4.2. MIXED METHODS RESEARCH ....................................................................................................... 33 4.3. THE QUALITATIVE PART OF THE RESEARCH ............................................................................... 34
4.3.1. Interviews .................................................................................................................................... 35 4.3.2. Operationalization of the interviews with hotel owners and front office employees .................. 36 4.3.3. Operationalization of the interview with Leiden Marketing ....................................................... 38 4.3.4. Transcription process and coding .............................................................................................. 41
4.4. THE QUANTITATIVE PART OF THE RESEARCH ............................................................................. 42 4.4.1. Research units ............................................................................................................................. 42 4.4.2. Sample size .................................................................................................................................. 43 4.4.3. Operationalization of the concepts from the survey ................................................................... 44
4.5. DRAWING CONCLUSIONS ............................................................................................................... 49
CHAPTER 5 – RESULTS ............................................................................................................................. 51
5.1. SATISFACTION OF VISITORS WITH TOURISM IN LEIDEN ............................................................. 51

VII
5.1.1. Type of visitors ............................................................................................................................ 51 5.1.2. Positive aspects of tourism in Leiden ......................................................................................... 53 5.1.3. Negative aspects of tourism in Leiden ........................................................................................ 54 5.1.4. Indicators of overtourism in Leiden according to visitors ......................................................... 56 5.1.5. Reflection .................................................................................................................................... 57
5.2. SATISFACTION OF RESIDENTS WITH TOURISM IN LEIDEN .......................................................... 57 5.2.1. Safety ........................................................................................................................................... 57 5.2.2. Well-being and social cohesion .................................................................................................. 58 5.2.3. Environment ................................................................................................................................ 59 5.2.4. Culture and Heritage .................................................................................................................. 60 5.2.5. Government ................................................................................................................................. 61 5.2.6. Covid-19 for reference ................................................................................................................ 63 5.2.7. Reflection .................................................................................................................................... 63
5.3. INFLUENCE OF TOURISM ON THE QUALITY OF LIFE .................................................................... 64 5.3.1. Liveability regarding human elements ....................................................................................... 64 5.3.2. Liveability regarding environmental elements ........................................................................... 65 5.3.3. Liveability regarding person environmental fit .......................................................................... 66 5.3.4. Ranking of the liveability items ................................................................................................... 67 5.3.5. Reflection .................................................................................................................................... 68
5.4. THE ROLE OF LEIDEN MARKETING .............................................................................................. 70 5.4.1. Positioning of Leiden Marketing ................................................................................................ 70 5.4.2. Influence of residents on policy .................................................................................................. 71 5.4.3. Guiding overtourism ................................................................................................................... 71 5.4.4. Reflection .................................................................................................................................... 73
CHAPTER 6 – CONCLUSION ..................................................................................................................... 75
6.1. COMBATING AND/OR GUIDING OVERTOURISM IN LEIDEN .......................................................... 75 6.2. CRITICAL REFLECTION ................................................................................................................. 78
6.2.1. Research method and choices made ........................................................................................... 78 6.2.2. Recommendation for further research ........................................................................................ 79
BIBLIOGRAPHY ........................................................................................................................................... 80
APPENDIX ........................................................................................................................................................ 1
APPENDIX I: LIST OF RESPONDENTS ........................................................................................................... 1 APPENDIX II: SEMI-STRUCTURED INTERVIEWS .......................................................................................... 2
Appendix II-I: Interviews with hotel owners .............................................................................................. 2 Appendix II-II: Interview with VVV employee ........................................................................................... 3 Appendix II-III: Interview with Leiden Marketing ..................................................................................... 4
APPENDIX III: CODING SCHEME .................................................................................................................. 6 Appendix III-I: Coding scheme of interviews with hotel owners and VVV employee ............................... 6 Appendix III-II – Coding scheme of interview with Leiden Marketing ..................................................... 6
APPENDIX IV: INTERVIEW TRANSCRIPTS ................................................................................................... 7 Appendix IV-I: Interview B&B NR22 ........................................................................................................ 7 Appendix IV-II: Interview B&B Hartje van Leiden ................................................................................. 17 Appendix IV-III: Interview Golden Tulip & Ibis Leiden .......................................................................... 24 Appendix IV-V: Interview Boutique Hotel Leiden ................................................................................... 43 Appendix IV-VI: B&B het Rapenburg ...................................................................................................... 61 Appendix IV-VII: Interview Leiden Marketing ........................................................................................ 71

VIII
APPENDIX V: RESIDENT’S SURVEY ............................................................................................................ 82 APPENDIX VI: REPRESENTATIVENESS ANALYSIS ..................................................................................... 88
Appendix VI-I: Representativeness analysis gender ................................................................................ 88 Appendix VI-II: Representativeness analysis age .................................................................................... 88 Appendix VI-III: Representativeness analysis living ............................................................................... 88 Appendix VI-IV: Representativeness analysis education ......................................................................... 88
APPENDIX VII: ANOVA-TESTS ................................................................................................................. 89 Appendix VII-I: ANOVA - Age ................................................................................................................. 89 Appendix VII-II: ANOVA - Gender .......................................................................................................... 90 Appendix VII-III: ANOVA - Education .................................................................................................... 91 Appendix VII-IV: ANOVA - Living .......................................................................................................... 92 Appendix VII-V: ANOVA – duration of living in Leiden ......................................................................... 93
APPENDIX VIII: MULTIPLE REGRESSION ANALYSIS ................................................................................ 94 Appendix VIII-I – Safety ........................................................................................................................... 94 Appendix VIII-II – Well-being and social cohesion ................................................................................. 95 Appendix VIII-III – Environment ............................................................................................................. 96 Appendix VIII-IV – Culture and Heritage ............................................................................................... 97 Appendix VIII-V – Government ............................................................................................................... 98 Appendix VIII-VI – Liveability ................................................................................................................. 99
APPENDIX IX: PAIRED SAMPLE T-TEST LIVEABILITY AND COVID-19 .................................................. 100
1
Chapter 1 - Introduction
The city, a phenomenon that cannot be described unequivocally. For one person, a certain location may be
chaos, hectic and related to pollution. For the other, it may be a place for socializing, togetherness and
brotherhood. That the city is a well-researched phenomenon is evident from the many works of literature that
have been written about it, for example Jane Jacobs (1961) - with her famous book 'The Death and Life of
Great American Cities' - and Jan Gehl (2010) with the book 'Making Cities for People'. Books that gave a
different view of (then at the time) prevailing thinking about the planning of cities. The books were at odds
with the then-current insights into urban planning, which focused in particular on the major clean-up with the
rational urban planning of post-war modernism. In the present time, these books are still a great inspiration for
further research on cities. However, times have changed. The increased mobility of goods and people has made
it easier to move from A to B. Combined with the extremely low prices for airline tickets, this has made tourism
one of the largest sources of income for residents in cities (Sorupia, 2005). Whereas in the classical urban view
- such as that of Jane Jacobs and Jan Gehl - only the current population of the city was taken into account,
attention has now been broadened with the tourism aspect.
Before Covid-19, tourism was the fastest growing sector in the Netherlands. With an amount of 87.5
billion euro (2018), it accounts for 4.4% of the gross domestic product and contributes to 6.3% of employment,
percentages that only seem to be rising in the future (CBS, 2019). These positive outcomes also have their
downside, because the abundance of tourists seems to create friction between the tourists and the residents of
the city. It is not surprising if you come across texts with "Tourists, Go Home!" in cities such as Amsterdam,
Venice and Barcelona (The Guardian, 2018). Current city marketers of major cities are therefore shifting their
focus to spreading tourists. An example is Leiden, which through its marketing tries to relieve Amsterdam of
the abundance of tourists. With the advent of social media, marketing is essential to approach the tourists, but
does this spread also look at the preferences of the residents? Research by Merrilees, Miller and Herington
(2009) show that the population of the city is not the focal point of the research.
In this master thesis, an attempt is made to find a balance between the wish of the tourists and the
preferences of the population of Leiden to be able to regulate tourist distribution.
1.1. Societal Relevance
Before Covid-19 the tourism sector was growing, which on the one hand has a positive influence on
employment as well as on the income for local businesses. On the other hand, it is stated that this growth in
the tourism sector has led to an increase in the number of tourists in a city (Goodwin, 2017). This growth has
continued to such an extent that there is currently a situation of ‘overtourism’; a situation where both the tourist
and the resident no longer feel comfortable in their area (Walmsley, 2017). As mentioned earlier, there is
overtourism in Amsterdam. As a result of the relief of the city of Amsterdam, there is a plan that states that
this relief will partly take place in the direction of Leiden. At first, spreading tourists is a good intervention to

2
regulate tourist flows. However, new problems arise with the distribution of tourists (Couzy, 2018). These
problems are expressed for the city of Leiden by Marc Newsome (Dutch Labour Party - PvdA). He wants
Leiden to come up with a clear and written vision on guiding tourism. "More and more tourists know where
to find Leiden. That is good for our economy and good for the entrepreneurs in the city. At the same time there
are also disadvantages," says Marc Newsome. "More crowds on the street, more noise and more events, more
Airbnb and more pressure on the housing market," is what he fears. "Tourism in the Netherlands is expected
to rise sharply in the coming years, from 42 to 59 million visitors in 2030. We must prevent tourism from
becoming a curse and putting our liveability under pressure."
Marc Newsome's statement is in line with a trend that has been visible since 2017. More and more
municipalities see the future dangers that tourism can bring to the current population. The consequences of
this are that the local population no longer feels at home in their city and therefore leaves. The residents can
no longer identify themselves with their current environment or they prefer to shop and live in a different city
rather than in their city. Despite the possible side effects of tourism, it must be borne in mind that cities -
including their residents - need tourism to survive and stay alive (Leefmans, 2019). The lively nature is an
aspect for which people go to live in a city; if they are completely opposed to the tourists, this can result in a
decline in liveliness (Benner, 2019). It seems like a fighting relationship, tourists and residents cannot live
with each other and cannot without each other.
In the present, there is situation of Covid-19. A situation that has brought the entire tourist sector to a
standstill. From a social point of view, now it is the time to put things in order. Now that there are no tourists,
new policy can be devised and implemented immediately. Even more important to look at a balance where
tourists can be provided with their experiences and where the population can live in a city without losing their
identity.
1.2. Scientific Relevance
This research tries to find a balance between the preferences of the residents and the wishes of the tourists.
This is necessary because since the emergence of tourism in Europe there has been much discussion about the
lack of proper management of the tourist location (Egresi, 2018). To be able to make statements about this
balance, some key concepts must be explained. The term ‘overtourism’ plays an important role in this.
Overtourism has only been researched since the 90s of the last centuries and is therefore still looking for a
precise definition. The subjectivity of the concept means that overtourism is difficult to define because the
attitude of visitors and residents towards overtourism is different everywhere. It is therefore important for each
location to look separately at the extent to which overtourism takes place and how this can be avoided and/or
guided (Cowell, 2010). According to Hospers (2009), city marketing or city branding has an important role to
play here.
The existing literature on city branding focuses on the comparison between cities in terms of the
cityscape with which they position themselves. A competitive position is being sought that contributes to the

3
attractiveness of a city for residents and others (Hospers, 2009). The gap that can be found in the literature is
that the focus of research is primarily on strengthening the brand image alone. However, various scientists -
including Merrilees et al. (2009) - state that not only the brand image is the most important characteristic, but
especially the attributes that influence the attitude towards a city brand. A broader knowledge of the attributes
not only provides a better understanding of how city branding works, but it also provides a tool for public
policy to manage attitudes towards a city.
The most important contribution of this research is that for the first time a clear ranking is made of
community attributes in terms of their influence on the attitude of residents and tourists towards the brand
image.
Of these attitudes - according to the literature - the factors nature, cultural activities and shopping
facilities would have the greatest influence on the urban image (Parkerson & Saunders, 2009). However, a
study of the Gold Coast City has shown that it is not the aforementioned three attitudes that are the most
important, but the factors social ties, personality and creativity in the business world (Merrilees et al., 2009).
It indicates that each location requires a different view of city marketing and in particular how you should
approach this city marketing and where the focus should be on.
Besides, city marketing is often viewed from a specific point of view, namely from marketers, or from
residents, or business (Hospers, 2009). There is hardly any study where a combination is taking place and
where a balance is found. This is an attempt to achieve unity within urban marketing to avoid problems such
as those in Barcelona, Venice and Amsterdam.
1.3. Research objective and research questions
This research focuses on avoiding and/or guiding overtourism in Leiden. This should make clear what
overtourism means for Leiden, which components of overtourism are present and how a policy from Leiden
Marketing can guide this problem. The research is being conducted at Leiden Marketing, where I did my
internship. Leiden Marketing is responsible for the marketing of the city of Leiden. The purpose of Leiden
Marketing is - apart from the hospitality of the city - to put the brand 'Leiden' on the map, with the desired
result to achieve growth in the number of visitors, congresses and students, but also to establish a connection
between the vital city and its residents. The organization gives substance to the 'Leiden, City of Discoveries'
brand (Leiden Marketing, n.d.).
The focus of this research is primarily on the connection between visitors and residents to put Leiden
– as a brand – on the map. The following main question can be derived from this:
To what extent can a balance be found - in the field of tourism - between the wishes of the
tourists and the will of the residents of the city of Leiden and how can Leiden Marketing
play a significant role in this?

4
To get an answer to the main question, the concept of ‘overtourism’ must be investigated. First of all, the origin
of overtourism will be viewed. What is the origin of the concept and which factors contribute to the
development of overtourism? As mentioned earlier, the concept is highly subjective. The significance of
overtourism for the city of Leiden will, therefore, have to be looked into. Besides, it has to be researched
whether there is a situation of overtourism. The following sub-question can be derived from this:
- Which factors influence (the possible) overtourism for the city of Leiden?
After determining whether there is overtourism, the actors that influence overtourism are considered.
According to the definition of the United Union World Tourism Organization (hereinafter referred to as
UNWTO), overtourism is considered to be: “The impact of tourism on a destination, or parts, that excessively
influences perceived quality of life of citizens and/or quality of visitors' experiences in a negative way”
(UNWTO, 2018). Two actors are involved who influence the phenomenon of ‘overtourism’, namely the
residents of the city and the visitors. It will, therefore, be necessary to look at the behaviour and wishes of both
actors regarding the quality of life in the environment. Two sub-questions can be derived from this:
- To what extent are residents of the city centre of Leiden satisfied with the current quality of life in
their living environment?
- To what extent are visitors to the city centre of Leiden satisfied with the quality of life in the visited
area?
The insights into the liveability of the environment aim to give an impression of the current situation. To map
out the possible consequences of overtourism, the influence of tourism on the quality of life must be tested.
These consequences are important for the study to be able to determine which liveability characteristics are
important for both tourists and residents. These characteristics can then be a guideline for Leiden Marketing
to adjust their policies. The following sub-question follows:
- To what extent does tourism - and associated crowds - influence the quality of life of residents and
tourists in the city centre of Leiden?
To answer the last part of the main question, Leiden Marketing needs to be researched. This should look at the
resources that Leiden Marketing can use to steer tourists and keep residents satisfied. These means are
important to be able to determine how overtourism can be avoided and/or guided in the future. The sub-
question that belongs to this part is:
- To what extent can Leiden Marketing give direction to the satisfaction of residents and visitors of the
city centre in Leiden?

5
Based on the sub-questions mentioned above, it is assumed that the main question can be answered fully and
resolutely.
1.4. Reading Guide
This thesis will start with a context chapter, in which the history of overtourism will be explained and the
current status of tourism in Leiden will be discussed (Chapter 2). Subsequently, Chapter 3 will explain the
theoretical framework. In this chapter scientific perspectives on overtourism are discussed. The resulting
conceptual model will serve as a guideline for the research. Chapter 4 will then explain the methods used in
this thesis. This also clarifies why certain choices have been made and what the execution of the research looks
like. In addition, there will be an operationalization of the most relevant concepts that have been applied in the
interviews and surveys. Chapter 5 will present the results of the interviews and surveys. First, the results are
discussed with the hotel owners and front-office employees, then the results from the surveys with residents
are analysed. Thereafter, the role that Leiden Marketing can assume to combat overtourism will be explained.
This thesis will end with Chapter 6. A concluding chapter answering the main question and critically reflecting
on the completed research. In addition, recommendations will be made for policy on tourism in Leiden and for
further research into overtourism.

6

7
Chapter 2 – The history of overtourism
This chapter examines the (historical) context of the phenomenon of overtourism. First, the historical
development of mass tourism is examined, and it is stated that mass tourism and overtourism are two separate
concepts (2.1.). Subsequently, the growth of tourism in the Netherlands will be discussed, specifically for the
city of Leiden (2.2.). The chapter ends with examples from Barcelona and Venice. This is to indicate what the
worst-case scenario could be for a city if no tourism policy is pursued (2.3.). The context described indicates
the relevance that tourism and in particular the prevention of overtourism is an urgent area of research.
2.1. The development of mass tourism
Mass tourism is a form of tourism where many people visit an attraction at the same time. This can be a specific
city, but also a specific nature reserve or specific building. The origins of mass tourism can be found in the
early 1960s, a period after the Second World War of reconstruction and prosperity. Unemployment was low
and the prosperity of the average Western European rose. More and more people had more money and free
time. This combination has led to more people to spend their free time away from home (Sezgin & Yolal,
2012).
The period in which people get more money and leisure time goes hand in hand with the development
of aviation. Aircraft manufacturer Boeing introduced the Boeing 707 in 1958 and the Boeing 747 was
introduced shortly after. These two planes could carry more people at the same time and also had a longer
range. The costs for a flight could therefore be spread over several people, causing aircraft ticket prices to drop
further. Flying was no longer an activity for the upper class, but this development also enabled the average
family to travel by air (Hall & Williams, 2020).
In addition to the development of larger and more efficient aircraft, aircraft comfort was also adjusted.
Whereas in the 1960s approximately 55% of the aircraft was used for persons, in the 1970s 90% of the aircraft
was used for persons. Chairs were placed closer together, increasing the efficiency of the use of space. Because
more people could board the plane at the same time, ticket prices became even cheaper. From this moment it
became interesting for travel organizations to offer package tours to areas that were too remote to reach by car.
One of the first organizations to do this was Thomas Cook, who offered trips from the UK to the Spanish coast
(Hall & Williams, 2020).
Other factors that contributed to the development of mass tourism are the average increase in income,
the cheaper costs for fuel and the introduction of special holiday pay in the 60s. The latter was, therefore, an
extra income for people, especially to spend during the holiday. People no longer had to take their monthly
income into account, but were legally entitled to extra income. As a result, the demand for package holidays
has increased considerably (Sezgin & Yolal, 2012).

8
The negative effects brought about by this development were first seen in the early 1970s. At that time, many
cheap trips were offered to the Mediterranean. A seaside resort like Malaga and the islands like Ibiza, Sardinia
and Mallorca overflowed with tourists. From that moment on, spreading tourism becomes a point of attention.
This spread mainly focused on locations outside of Europe, especially Thailand was very popular. This also
refers to the beginning of the globalization of mass tourism (Dwyer, 2015). The fact that spreading was desired
at the time indicates that Mediterranean areas became overcrowded. This also indicates the beginning of
overtourism; the point at which residents experience the negative consequences of tourism (Milano, 2018).
Figure 1: Development of international tourist arrivals by world region (UNWTO, 2019)
2.2. Touristic growth in Leiden
The growth in the number of tourists is also strongly visible in the Netherlands. While the Netherlands
welcomed around ten million international guests in 2000, this is 20.1 million international visitors in 2019.
In a period of 20 years, the number of visitors in the Netherlands has doubled (NBTC, 2020). About 70% of
these visitors come from Germany, Belgium or the United Kingdom. 10% of the visitors come from the other
countries of the European Union (EU) and 20% come from all countries outside the EU (NBTC, 2020).
Research by the Netherlands Bureau for Tourism and Conventions (NBTC) shows that this growth in the
number of tourists in the Netherlands - and therefore also Leiden - is partly explained by the decrease in airline
ticket prices and the cheaper rental of accommodations. Low-cost airlines Ryanair and EasyJet as well as
online accommodation platform Airbnb play a major role in this (Smith, Egedy, Csizmady, Jancsik, Olt &
Michalkó, 2017).

9
If we look at the city of Leiden, it can be said that the city has experienced approximately the same
percentage growth as the Netherlands. The number of hotel nights in Leiden can be used as an example (see
Figure 2). This shows that slightly less than 200,000 hotel nights took place in 2001 compared to 386,000 hotel
nights in 2018 (Municipality of Leiden, 2020).
Figure 2: Hotel overnight stays in Leiden (Municipality of Leiden, 2020)
The number of visitors to the eight largest museums in Leiden also shows approximately the same growth. In
2002 there were about 600.000 museum visits compared to more than one million in 2014 (see Figure 3). The
graph shows a slight decrease after 2014 and even shows a decrease of 20% in 2018, this has to do with the
fact that two of the largest museums in Leiden were partly (Naturalis) or completely (Museum De Lakenhal)
closed (Municipality of Leiden, 2020).
Figure 3: Number of museum visits in Leiden (Municipality of Leiden, 2020)

10
In the future vision of the municipality of Leiden up to 2030, the number of visitors is expected to grow in
proportion to the national level. This means that between 2019 and 2030 the number of visitors will increase
with an expected percentage of 65%. However, this percentage is currently being called into question by the
outbreak of Covid-19. Nevertheless, it is expected that once the Covid-19 crisis has ended, the growth of
tourism will continue to grow at the same pace and locations could be jeopardized.
2.3. The worst-case scenario for Leiden
The most famous cities that are inundated by mass tourism are Barcelona and Venice. In these cities, the
population revolt and turn against every tourist who comes to the city. With slogans (see Figure 4) such as
"Tourists go home", "Tourism kills the city" and "Tourist: Your luxury trip is my daily misery", it becomes
clear that the residents are not waiting for the visitors at all. The hustle and bustle, waste and neglect of
authenticity mean that residents feel compelled to leave their environment. The negative consequences mass
tourism can have is a warning to many European cities and leads to active policies on tourism flows (Hughes,
2019).
Also, in Amsterdam is already a situation of overtourism. The current situation in Amsterdam indicates that
the residents are fed up with the behaviour of the tourists. Amsterdam is an attraction for tourists who are
interested in art, culture and parties. However, the popularity of the Dutch capital has led to a surplus of tourists.
The supply is so large that city centres become full and solutions need to be found to limit overcrowding
(Zuidervaart, 2019). In Amsterdam, they want to spread groups of tourists to surrounding areas such as Leiden.
In turn, Leiden is just waiting for this influx of tourists. The city of Leiden is trying to profile itself as a breeding
ground for BioScience and will be the European science city in 2022. Leiden is also trying to attract tourists
by focusing on Rembrandt and the Golden Age (Leiden Marketing, n.d.).
Above mentioned cities have two different strategies regarding tourism. Although Leiden wants the
tourists, the municipality is still wary of the possible consequences of tourism. The municipality wants a clear
Figure 4: Graffiti with anti-tourism texts in Barcelona (tourcert.org, 2018)

11
and written vision of tourism. "More and more tourists know where to find Leiden. That is good for our
economy and good for the entrepreneurs in the city. At the same time, there are also disadvantages," according
to the municipality. "More crowds on the streets, more noise and more events, more Airbnb and more pressure
on the housing market," is what is feared. "Tourism in the Netherlands is expected to rise sharply in the coming
years, from 42 to 59 million visitors in 2030. We must prevent tourism from becoming a curse and putting our
liveability under pressure." (Leefmans, 2019). In the worst-case scenario, according to Amore, Falk and Adie
(2020), the quality of life of residents can be put under such pressure that the connection with the city decreases.
Residents can no longer identify with the living environment in which they live. Besides, the city's popularity
will affect the housing market, causing properties to be bought by wealthy real estate traders. These traders
ensure that the local population no longer has a chance of a home in the centre, which means that they are
forced to live outside the city (Cocola-Gant, 2018). This makes the city a kind of ‘Disneyland’
(Disneyfication): a situation where attractions (cultural heritage) are visited during the day, but where there is
no more life at night (Gorrini & Bertini, 2018). Which is what the city of Leiden emphatically wants to prevent.

12

13
Chapter 3 – Theoretical framework
This chapter discusses the explanations regarding the phenomenon ‘overtourism’ in more detail. First, the
concept of ‘overtourism’ itself will be discussed (3.1.). This part will look at different approaches and questions
that must test and explain the concept. Besides, a precise definition of the concept is given, which guides the
rest of the research. Then the role of city marketing will be considered as part of the problem (3.2.). There will
be a closer look at the effects that city marketing has on the environment and the social consequences.
Subsequently, the theories about the solution possibilities that can stop or guide the problem of overtourism
will be examined and discussed (3.3.). It is concluded with a conceptual framework, which can be drawn up
based on the theoretical framework (3.4.).
3.1. Overtourism
Overtourism research is a relatively new area of research. Although the phenomenon was already detected in
the 1970s, the term overtourism has only been mentioned in various studies since the 21st century. The concept
of overtourism received support from society in 2012. The phenomenon was referred to on Twitter with
‘#overtourism’. The responses with this hashtag were posted from the perspective of both visitors and
residents. In these responses, the quality of life in the city was criticized at the hands of many tourists. On the
one hand, residents complained that the quality of life in the city had been drastically reduced. On the other
hand, tourists felt that the experience of the city visit had deteriorated (Goodwin, 2019). Overtourism can
therefore be viewed from different perspectives. The term can be interpreted broadly and requires further
explanation. First, we look at the definitions given by various organizations and scientists (3.1.1.). Next, the
conflict that has arisen between tourists and residents will be discussed (3.1.2.). To then discuss the conflict
between the quality of life of the residents and the economic growth for the city (3.1.3.).
3.1.1. Scientific definition of overtourism
As mentioned before, the first academic usage of the word overtourism appears in 2008. The Integrated Coastal
Zone Management literature of that year concluded that overtourism has led to overfishing of the surrounding
seas. In this literature, the term was only mentioned but did not explicitly address how overtourism affects
tourists and the local population. According to Capocchi et al. (2019): ‘Overtourism is still at the early stages
of being defined and currently lacking a standardized, recognized characterization’. Milano, Cheer & Novelli
(2018) attempted: “As the excessive growth of visitors leading to overcrowding in areas where residents suffer
the consequences of temporary and seasonal tourism peaks, which have enforced permanent changes to their
lifestyles, access to amenities and general well-being.” The United Union World Tourism Organization
(UNWTO) also speaks of overtourism when: “the impact of tourism on a destination, or parts, that excessively
influences perceived quality of life of citizens and/or quality of visitors' experiences in a negative way”
(UNWTO, 2018). This theme is also dealt with from university education. Professor of Responsible Tourism,

14
Harald Goodwin (2017), speaks of overtourism as follows: “Overtourism is a situation where either local
people or the tourists feel that the place is just over visited and that it is changing its character. So, for the
tourist it loses its authenticity and for the local people it just causes irritation and annoyance.”
It is striking from these approaches that it mainly concerns two aspects: a) overcrowding areas and b)
the influence on the quality of life. However, the limited measurability of the concept ‘quality of life’ makes it
difficult to provide a clear answer to the question of whether there is overtourism or not. Koens et al. (2018)
agrees with this and declares that there is no one-size-fits-all solution for the phenomenon of overtourism.
Besides, he states that overtourism is not only a tourism problem but even more a population problem. The
main reason he gives for this is the subjectivity of the concept. The hustle and bustle at one location mean
overtourism for some people, but at another location, there is no overtourism at the same crowdedness. The
feeling and perception that a local population and/or visitor have concerning the number of visitors is therefore
strongly dependent on a particular location. To gain insight into the degree of overtourism, it will therefore be
necessary to look at a certain limit value for the number of visitors per location to be able to conclude whether
there is overtourism. This limit value can be determined by residents as well as tourists. In line with the
definition of Milano, Cheer & Novelli (2018) and the UNWTO (2018), according to Throsby (2009), making
liveability measurable can be the right way to map the problem of overtourism. Making the liveability of
visitors and residents measurable can provide insight into the elements that determine the limit value of
overtourism. In this way, an attempt can be made to resolve and/or guide the friction that has arisen between
residents and visitors.
3.1.2. Tourist-resident conflict
The friction that arises between residents and visitors is also referred to as ‘the tourist-resident conflict’ (Tsaur,
Yen & Teng, 2018). In recent years, more and more incidents have occurred because of the presence of tourists
in a particular city (see Chapter 2). According to Andereck, Valentine, Knopf and Vogt (2005), the attitude
towards tourists is determined based on the Social Exchange Theory. This theory states that an individual
weigh his or her costs and benefits and thus adopts a positive or negative attitude towards tourism. This
consideration can be taken by all parties involved in tourism, including tourists, residents, government services
and local businesses (Goeldner & Ritchie, 2003; Yang, Ryan, & Zhang, 2013). Costs and benefits can be
interpreted in the broadest sense of the word and are therefore subjective in nature. Brida and Zapata (2009)
argue that these costs and benefits can mainly be distinguished in terms of economic, social and cultural costs
and benefits. Boulding (2018) goes on to state that psychology, ecology and the environment also influence
the attitude of stakeholders towards tourism. When there is a difference in perception of the above costs and
benefits between the parties involved, then there is an imbalance. The tourist-resident conflict can therefore be
called bilateral and indicates an emphatic imbalance between all parties involved.
The impact of this conflict has consequences for the tourism of a particular city. On the one hand,
the result may be that residents turn against the tourists, which can create an unsafe or unpleasant situation for
visitors. On the other hand, visitors can stay away because they do not feel welcome. In that respect, the

15
absence of visitors has economic consequences for both the entrepreneur and the resident (Goodwin, 2019). In
that, tourism policymakers are always looking for a balance between the liveability of the population in a city
and the economic benefits that tourism brings.
3.1.3. Responsible Tourism: liveability versus economic growth
Finding a balance between liveability and economic growth is difficult to find. This has to do with the fact that
each location requires its policy and is therefore not universal. According to Ruth and Franklin (2014), the
degree to which a city focuses more on liveability or economic growth depends on the political preferences of
residents. A more left-leaning population will place more value on the liveability of a city, while for a right-
leaning population the economic status of the city is more important. Following De Hart, Knol, Maas-de Waal
and Roes (2002), the extent to which this is important, is strongly doubtful. After all, it is not only political
preference that influences this, but also the financial status, age, education and gender of residents. Goodwin
(2017) adds that the balance between quality of life and economic growth has to do with responsible tourism.
Tourism should not be seen as a bad thing, but rather a driving force to make a location better to live in and to
visit. Yet Wheeller (1991) notes that this way of looking at tourism is too abstract. Responsible tourism does
not provide tools for steering tourism. There is no specific policy that provides insight into the route to
responsible tourism.
The divisions among the various stakeholders in a city are great, whereby residents will attach more
value to the liveability of the environment, entrepreneurs and government agencies will attach more value to
the economic growth of a city. Government agencies play an important (dual) role in this. On the one hand,
the local government wants to spend as much as possible in its city and then reinvest in local projects with the
taxes received. On the other hand, the local government wants to keep the population satisfied and in the event
of dissatisfaction, the economic importance of tourism will have to be cut. According to Pechlaner, Innerhofer
and Erschbamer (2020), the solution to the conflict between resident and visitor therefore lies with government
institutions and policy on tourism should be established from that institution. The abstractness that Wheeller
(1991) assumes can therefore be made concrete if a city actively researches the preferences of the residents
and the wishes of the tourists. This seems to play a major role in city marketing; a discipline that can influence
visitor flows and involve residents in decision-making.
3.2. Role of city marketing in guiding overtourism
City marketing is a relatively new discipline within the tourism and its original aim was to put cities and regions
in a positive light. With the development of mass tourism and the associated negative effect of overtourism, it
has become necessary that city marketing not only focuses on attracting visitors but also regulating them. Also,
urban marketing is increasingly targeting the local population. The aim of keeping the residents satisfied and
involving them is to bring the city and the surrounding area into a better light. Even though city marketers have
broadened their tasks, it is still unclear what the best way is to tackle the problem of overtourism. Studies

16
focused on combating and/or guiding overtourism often view the problem unilaterally, either from the side of
the residents or the side of the visitors (Koens et al., 2019; Kuscer & Mihalic, 2019; Gonzalez, Coromina &
Gali, 2018). An integrated study involving these groups has not yet taken place. An important role for this is
reserved for the City Marketer, a authority that can influence the image that visitors and residents have of the
city.
3.2.1. What is city marketing?
City marketing focuses on profiling a city, village, shopping street, shopping centre or several urbanized
economically interconnected areas as well as possible. The distinctive strengths and an individual identity
profile are central to this. City marketing focuses on the following three target groups: 1) visitors, 2) companies
and 3) residents. According to Steele (1981), people's background is very important to the experience of a
place. These groups each have their associations with the city. The image people have of a city consists of a
mixture of selective information, impressions, experiences and prejudices. Hospers (2009) defines the concept
as follows: "City marketing is the long-term process and or policy instrument consisting of various,
interrelated activities aimed at attracting and retaining specific target groups for a particular city" (freely
translated from its Dutch definition). This is where the express purpose of city marketing is reflected. It is
therefore not only about improving the quality of life of the inhabitants, but it is also used to improve the
market position of a city or region in certain areas (Ashworth & Voogd, 1990).
To find a balance between the quality of life of the inhabitants and the market position of a particular
city, the image and identity of the city are examined. Where the image mainly encompasses the view of tourists
and visitors to a certain area, the identity is a measure of the population. Identity is based on what the city is,
but also what the city ‘wants’ to be. This is not constant but is an ever-changing and innovative process with
new actors, goals and ideas. The tension that arises between identity and image is simply exposed in their
model by Chernatony & Dall ’Olmo (1998) (see Figure 5). They argue that the position that a city must assume
is nothing more than a field of tension between the producer (the city marketer) and the consumer (residents
and visitors).
Figure 5: Relation between identity, positioning and image of the brand (Chernatony & Dall ’Olmo, 1998)

17
In the vision of Chernatony and Dall 'Olmo (1998), brand identity is described as how an organization (read:
city) presents itself. However, Boer (2007) points to the incompleteness of the concept. He accuses other
authors of not making a distinction between the desired identity and the actual identity of a city. In his model,
he splits the concept of identity into brand identity on the one hand, and brand design on the other. Brand
identity is the desired, ideal representation of the city. The concept indicates how people want to be experienced
by the consumer. Brand design, on the other hand, is the concrete interpretation given to this idealistic vision.
City marketing tries to respond to this by looking at the identity of the population and the history of the city.
The desired identity of the population functions as a brand identity and the brand design is a concrete
elaboration of the preferences of the population.
Figure 6: Model Boer (Boer 2007)
Implementing and describing the effects of this is called ‘city branding’ by Kavaratzis (2004). City branding
aims to add value to a product or service to create a brand of loyalty, preferred by the target groups. This means
that a location must have a certain image to be successful in marketing (Ashworth & Graham, 2005). Besides,
the image that is communicated must correspond to the interests of the residents (Farnum, Hall & Kruger,
2005).
Guaranteeing the loyalty and interests of the actors involved is extremely difficult. This is because the
image and identity of a city are subject to change. The identity of residents is changing because of a) migration,
because b) the city is promoted in a certain way, but also because c) the image of the city can change over the
years. Overtourism, for example, can leave a negative mark on a particular city, keeping potential new visitors
and residents away. It is the task of city marketing to provide a solution for this.
3.2.2. City marketing: public versus private
City marketing thus seems to be the way to combat problems such as overtourism. However, this sounds
paradoxical and is not in line with the goal of city marketing. The original aim of city marketing is to profile
cities as a ‘must be here’ city. Research by Hospers (2014) also shows that city marketing only works well if
a city is clearly positioned and is prepared to think from the perspective of the chosen target group. City

18
marketing aimed at attracting new visitors is most successful here. Dragin-Jensen, Schnittka and Arkil (2016)
also argue that city marketing only works if it relates to progression, i.e., attracting new visitors and residents.
However, with the problem of overtourism, a reverse situation arises. City marketing does not only function
as a city promoter but also as a fighter against the problem. Added to this is the problem of the public-private
hybrid, a hybrid that is city marketing in terms of public administration. This is because an instrument from
the business world (marketing) is used to achieve public objectives (for example to combat overtourism). In
theory, marketing and the public sector do not go well together. Government authorities are in favour of the
public interest and the ideal situation for all actors involved must be considered. Local politicians do not dare
to make sharp choices, for fear of excluding other target groups from the city (Hospers, 2014).
On the one hand, marketing makes sharp choices and is result-oriented. This approach may result in
certain stakeholders benefiting less from the decisions taken in urban promotion. In the above case, the city's
pursuit of profit therefore takes precedence over the liveability and preferences of the resident. City marketing
nowadays works the best if this discipline is in responsibility of an outside municipal organization. For
example, an independent foundation that interferes objectively with society and directs the marketing activities
of local partners (Hospers, 2014). Such foundations mainly depend on funds that flow in via tourist and/or city
tax. According to Braun (2008), this is also where this form of marketing lies. Because these types of
organizations depend on visitors, they will always focus on receiving as much as possible from new residents.
There is also an emphatic gap in the current debate about overtourism. On the one hand, city marketing
yields the greatest return if this is affected privately. On the other hand, the interests of the residents will not
be served if they continue the same footing as is done now. However, the question of how overtourism can be
guided by city marketing remains unanswered. This has to do with the fact that each location is unique and
therefore each has its policy.
The same debate between the public or private approach to city marketing regarding overtourism is
closely related to the model of Chernatony & Dall 'Olmo (1998) and Boer (2007). In this, it can be stated that
the public approach seeks a balance and therefore takes more account of the city's identity, while the private
approach is more focused on the image of the city. This shows that continuous interaction between both
authorities would be most effective if a balance is sought. If the more private approach to city marketing is
continued, this will in the future have an impact on both society and the environment.
3.2.3. Social and Environmental effects
The more private approach of city marketing is extremely effective in terms of income. Movement of people
to the city is associated with consumer behaviour such as the use of transport and accommodation, the purchase
of goods and the use of services (Koens et al., 2018). With the arrival of tourists, sights, cultural-historical
monuments and natural resources can be preserved and reconstructed. Also, tourism provides a lot of
employment, which increases the prosperity of the local population. Research by Richards (2014) even shows
that tourism increases the quality of life for residents. Among other things, the maintenance of the city and the
atmosphere that tourists bring with them, ensure a more pleasant feeling for the residents. Nevertheless, the

19
European Parliament (2018) points to the downside of tourists in the city. In particular, the massiveness leads
to the silting up of cities and roads, noise nuisance, odour, mutual nuisance and irritation between tourists
because of long waiting times at attractions. In addition to these immediately obvious negative effects,
excessive development can also lead to a major infringement of the local identity of, for example, monumental
cities or beach destinations. Moreover, tourism can have adverse ecological effects: erosion and disruption are
some of the consequences of large-scale tourist developments.
Tourism, therefore, has social and environmental consequences for the quality of life of residents.
Cooper (2016) divides the groups that influence these social (and cultural) consequences into three different
categories:
1) Tourists - This group influences the local population through characteristics such as cultural, linguistic and
wealth differences. This leads to a change of both the local individual and the local society.
2) Hosts – This group lives and/or works at the location where tourists come. Facilitate the experience for
tourists and communicate with them.
3) Interaction between hosts and tourists - The gap between both groups is bridged by this interaction. In the
long term, however, there are (negative) consequences.
The influence of these three categories on the social (and cultural) consequences are different. The influence
is strongly dependent on the number of visitors and residents. Mathieson & Wall (1982) state that there are
three forms in which tourists and hosts meet, namely on a) an intensive manner, b) a (short-lived) commercial
manner or c) an informal short-term manner. The seriousness of the social and cultural consequences of this
way of interaction depends on the extent to which this takes place. Here, the negative consequences of informal
short-term interactions are the greatest and intensive interactions the lowest.
Looking specifically at the host, this can also be influenced without interaction between visitor and
resident. A certain attitude towards tourists can also be determined by stories from the community itself.
However, this attitude is highly dependent on the personal characteristics of a particular population group. An
average younger population group has a more positive attitude towards tourism than an older target group
(Szromek, Hysa & Karasek, 2019). Besides, families with children will experience more annoyance than
couples without children and singles. Stories circulating in population groups can encourage changes in
behaviour and living patterns, which makes it important to look at the attitude of residents towards tourism.
To gain insight into the degree of influence that tourists have on the local population, Cohen (in
Mathieson & Wall, 1982) divided tourists into four different categories:
1) The individual mass tourist - A travel organization arranges the vast majority, but the individual still retains
some self-control over his or her trip.

20
2) The organized mass tourist - The control of the visits of tourists to a city is in the hands of a travel company.
This organization can determine where this group is located and therefore influences the number of crowds
at a particular location.
3) The explorer - This group of tourists avoids tourist attractions. Has a strong desire for novelty. He or she
is in contact with the local population but does not want to fully integrate. This group is difficult to steer
by travel organizations and governments.
4) The drifter – This group is completely independent and is not influenced by outside parties. Emphatically
avoids tourist attractions and tries to integrate with the current population. This group only strives for
novelty and is therefore hardly guided by travel organizations and governments.
A classification of tourists provides insight into the extent to which tourists take the current population into
account. While the explorer and the drifter take strong account of the preferences of residents, the individual
and organized mass tourism are highly individualistic and therefore take less account of residents. The type of
tourist therefore influences residents' perception of tourists. Reisinger (2009) states that as a certain group of
tourists grows in an area or city, the irritation of residents increases. This connection is also called ‘Doxey's
theory’, which will be discussed in the following paragraph.
3.2.4. Doxey’s Irridex
The irritation of residents is a measure to indicate to what extent the local population is positive or negative
towards tourists. The degree of irritation is a good indication for policymakers to determine tourism policy.
Doxey divides the level of irritation into four different stages, namely 1) euphoria stage, 2) apathy stage, 3)
annoyance stage and 4) antagonism stage (see Figure 7).
Figure 7: Doxey’s Irridex – Model of Hoste Irritation (Beeton, 2006)
At the first stage (euphoria), the local population is sympathetic to tourism. In that situation, there is little
tourist activity and the presence of tourists is welcome. Partly through city marketing, an attempt will be made
21
to get tourists to the city. If tourism increases, a formal interaction between host and tourist arises. This
interaction is mainly based on promoting the economic situation of the host and the maximum experience for
the tourist. In this situation, there are tourists present, which slightly decreases the interest of the local
population in tourists (apathy). In the next stage, the tourist location is established and the number of tourists
is starting to reach its peak. The population is beginning to worry about crime, the rise in property prices and
the rudeness of tourists (saturation). If the situation deteriorates even more, one enters the ‘annoyance stage’.
The number of tourists leads to extreme irritation and tourists are seen as a burden rather than a pleasure. In
the last phase (antagonism), the hostility of the population towards the visitor increases and leads to the
situation becoming less safe for tourists. The host population blames tourists for all the harm done to them.
The role of governments (and therefore also of city marketing) is crucial in this because it is expected
that governments can estimate the degree of irritation. In practice, it can be seen that in Phase 1 (euphoria) the
government exercises formalized control over the process, while in Phase 2 (apathy) the focus is strongly on
city marketing. The tricky point for governments only arises in Phase 3 (annoyance). In this phase, the
government can go both ways. On the one hand, it can alleviate the irritation by improving the quality of life
of residents, such as improved infrastructure that ensures that the city can cope with the number of tourists
again. On the other hand, it can be considered to keep out tourists, but this will have economic consequences.
According to Calaforra, Fernández-Cortés, Sánchez-Martos, Gisbert and Pulido-Bosch (2003), being able to
estimate this irritation is important to determine the sustainable visitor capacity. This capacity provides insight
into the number of tourists that an area or city can handle based on the liveability criteria of residents and
visitors. This capacity is also referred to as ‘carrying capacity’.
3.2.5. Tourism carrying capacity
To determine the impact of tourists on the environment and residents, the concept of carrying capacity is
considered. The concept has a wide range of origins and is referred to as the ability of an ecosystem to support
biological species. That is to say that the living environment can provide them with a habitat, sufficient food,
water and other necessities for a longer period (Arrow, Bolin, Costanza, Dasgupta, Folke, Holling, Jansson,
Levin, Mäler, Perrings & Pimentel, 1995). However, the term has now been split up and this study only looks
at 'tourism carrying capacity'. Luc Hens (1998) defines the concept as follows: ‘The maximum number of
people that use tourism site without unacceptable effect on environmental resources while meeting the demand
of tourists.’ In my opinion, this definition is not all-inclusive, because the focus is mainly on environmental
factors. The consequences of tourism are not included in this definition and are therefore incomplete.
Chamberlain (1997) does include the residents of a tourist area in their definition of tourism carrying capacity:
‘..the level of human activity an area can accommodate without the area deteriorating, the resident community
being adversely affected or the quality of visitors experience declining’. O'Reilly (1986) shares this view by
arguing that capacity levels are influenced by two factors, namely: a) the characteristics of the tourists and b)
the characteristics of the destination area and its population. In 1994, the World Tourism Organization (WTO)
also focused on the concept of Tourism Carrying Capacity. They came up with a general official definition of
22
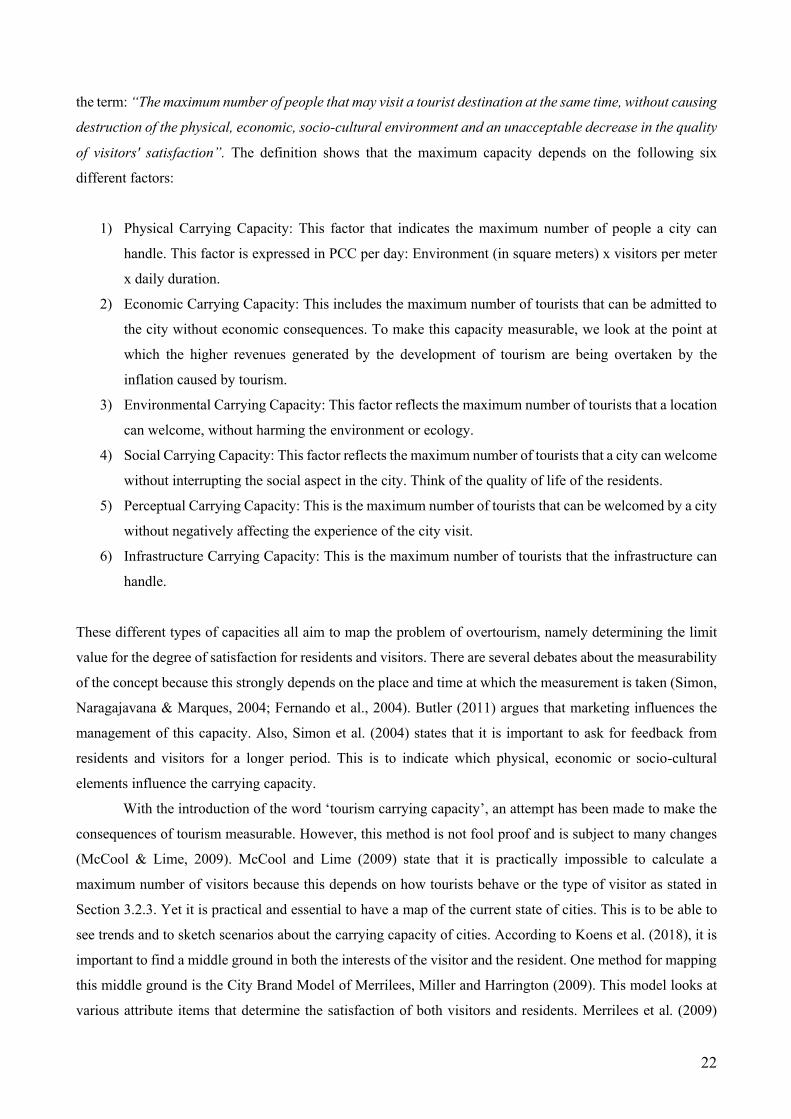
the term: “The maximum number of people that may visit a tourist destination at the same time, without causing
destruction of the physical, economic, socio-cultural environment and an unacceptable decrease in the quality
of visitors' satisfaction”. The definition shows that the maximum capacity depends on the following six
different factors:
1) Physical Carrying Capacity: This factor that indicates the maximum number of people a city can
handle. This factor is expressed in PCC per day: Environment (in square meters) x visitors per meter
x daily duration.
2) Economic Carrying Capacity: This includes the maximum number of tourists that can be admitted to
the city without economic consequences. To make this capacity measurable, we look at the point at
which the higher revenues generated by the development of tourism are being overtaken by the
inflation caused by tourism.
3) Environmental Carrying Capacity: This factor reflects the maximum number of tourists that a location
can welcome, without harming the environment or ecology.
4) Social Carrying Capacity: This factor reflects the maximum number of tourists that a city can welcome
without interrupting the social aspect in the city. Think of the quality of life of the residents.
5) Perceptual Carrying Capacity: This is the maximum number of tourists that can be welcomed by a city
without negatively affecting the experience of the city visit.
6) Infrastructure Carrying Capacity: This is the maximum number of tourists that the infrastructure can
handle.
These different types of capacities all aim to map the problem of overtourism, namely determining the limit
value for the degree of satisfaction for residents and visitors. There are several debates about the measurability
of the concept because this strongly depends on the place and time at which the measurement is taken (Simon,
Naragajavana & Marques, 2004; Fernando et al., 2004). Butler (2011) argues that marketing influences the
management of this capacity. Also, Simon et al. (2004) states that it is important to ask for feedback from
residents and visitors for a longer period. This is to indicate which physical, economic or socio-cultural
elements influence the carrying capacity.
With the introduction of the word ‘tourism carrying capacity’, an attempt has been made to make the
consequences of tourism measurable. However, this method is not fool proof and is subject to many changes
(McCool & Lime, 2009). McCool and Lime (2009) state that it is practically impossible to calculate a
maximum number of visitors because this depends on how tourists behave or the type of visitor as stated in
Section 3.2.3. Yet it is practical and essential to have a map of the current state of cities. This is to be able to
see trends and to sketch scenarios about the carrying capacity of cities. According to Koens et al. (2018), it is
important to find a middle ground in both the interests of the visitor and the resident. One method for mapping
this middle ground is the City Brand Model of Merrilees, Miller and Harrington (2009). This model looks at
various attribute items that determine the satisfaction of both visitors and residents. Merrilees et al. (2009)
23
developed this model because of their criticism of the emerging literature on city branding and the way it is
implemented in the city. According to them, this view has been subject to change, partly because tourism has
been changing significantly in recent years.
3.2.6. City Brand Model
The pillars to be investigated according to the City Brand Model of Merrilees et al. (2009) have a strong
relationship with the different types of carrying capacity of UNWTO. To be able to identify and possibly guide
overtourism, it is important to gain insight into the facets that residents and visitors consider important in the
city. The City Brand Model is a model that gives substance to this. The application of this model provides
several advantages, according to Merrilees et al. (2009): ‘Identifying the determinants of city brand attitudes
affords a deeper understanding of how branding works in this particular context and provides a framework by
which local governments can manage and modify such attitudes for the public good’. Knowledge of the
attributes therefore not only provides a better insight into how city branding works, but it also provides an
instrument for public policy to manage attitudes towards a city. The attitudes that are tested identify the most
important city brand attributes for the resident. The visitor is also involved in this research.
Originally, the model aims to map out the most important facets of the city for the resident. This
provides insight into the most important attributes that contribute to the quality of life in the city. By arranging
these attributes and linking them to the will of the visitor, insight can be gained into the general wishes of both
the resident and the visitor. Because it is explicitly mapped out which elements are important for residents and
visitors, city marketing can respond in a targeted manner.
The City Brand Model, therefore, looks at the specific attitude of residents towards the city. This
includes the following items: a) nature, b) creativity in the business world, c) shopping facilities, d) brand, e)
intentions, f) transport, g) culture, h) government services, i) social bonding, j) safety, k) neat environment and
l) heritage. All these items together provide a picture of how residents view the city. If the importance of each
item is tested, it can be determined where the focus of residents lies. By mapping this focus, an urban policy
can respond to this by stimulating, protecting or adapting items.
The flaw in this model is that it does not specifically look at the influence of the different items on the
phenomenon of overtourism. However, literary science has not yet investigated the relationship between the
different facets of the model and overtourism. It can be said that these items are related to the attitude of
residents towards the city. By linking these items, themselves to the phenomenon of overtourism, an attempt
is made to gain insight into this. The items are linked to the phenomenon of overtourism by subdividing the
various attributes into three liveability categories. Liveability has common ground with both residents and
visitors.

24
3.3. Determining overtourism based on liveability
Based on the City Brand Model, it can be stated that the facets that belong to this model are part of the
liveability of a city. Liveability is a topic that has been the focus of attention in recent years when determining
the value of environments. Not only is this theme high on the political agenda, but it is also frequently discussed
in the scientific literature. However, there is much uncertainty about an unambiguous definition of the concept
of liveability. The catch-all concept strongly depends on the interpretation of societies, groups and individuals.
The term is delineated in this section based on the scientific literature.
3.3.1. Definition of liveability
Liveability is a typical catch-all term, a collective term for quality characteristics of a living environment. The
degree of liveability is determined by individuals themselves and can differ per person. The term has a different
meaning for everyone, but the exact description strongly depends on place and time (Ruth & Franklin, 2014).
Vuchic (2017) attempts to describe the concept. It is stated that liveability consists of a space such as a
neighbourhood, district or metropolitan area, which contributes to economic opportunities and prosperity,
health, ease of use, mobility and recreation. These elements are mentioned in both the United Nations definition
and the Organization for Economic Cooperation and Development (OECD) (Vuchic, 2017). In a broader
interpretation of the concept of liveability, elements such as equality, education, social bonding and income
distribution are included (Lui, Derudder & Liu, 2011). In general, the concept looks at a combination of a
person or community concerning an environment (Veenhoven, 2000). Besides the various elements that
comprise liveability, Okulicz-Kozaryn (2013) divides liveability into two elements, namely subjective
liveability and objective liveability. The objective liveability relates to the registrable situation, such as the
quality of homes, the number of facilities and the labour market. These measurable constructs can represent
how the quality of life is present at those points in space. Besides, there is a subjective liveability that examines
how people experience that actual situation. A model that includes all these elements is the model of
Leidelmeijer, Van Kamp, Marsman and De Hollander (see Figure 8). In this model, the quality of life is based
on 11 pillars with several sub-components. The model shows that an unambiguous definition of the concept of
liveability is difficult to create because it is not possible to place all aspects of liveability in one definition.

25
Figure 8: Model by Leidelmeijer, Van Kamp, Marsman and De Hollander (2003)
Figure 8 shows that Leidelmeijer, Van Kamp, Marsman and De Hollander (2003) subdivide all possible forms
of liveability into three different subcategories, to be called person-environment fit, human and environment.
The attributes of the City Brand Model can also be classified under these headings.
3.3.2. Person environment fit
This category within the quality of life spectrum aims to map out the common denominator of both people and
the environment. Items that belong to this are security, public services, community and economics. These four
items interact strongly with each other, as a high level of safety means that more encounters between residents
take place in the street, which gives the atmosphere and experience of a city a positive input (Gehl, 2013). The
lively feeling that results from this ensure an increase in vitality (and therefore also the economy). However,
Van Aalst (2014) sees nuisance and deterioration as the main characteristics of safety in a city. Nuisance
includes the themes of noise nuisance, drug trafficking and neighbourhood nuisance. These types of nuisances
can cause residents and visitors to feel less safe in the neighbourhood. An unsafe feeling can mean that visitors
and residents no longer dare to take to the street alone or no longer feel strongly connected with the
neighbourhood. In contrast to an unsafe living environment, a safe environment provides a pleasant living
environment, which will increase the liveability of a neighbourhood or city (Ricciardi, Rossignoli & De Marco,
2013).
The presence of tourists therefore influences these pillars. Not only because the hustle and bustle can
lead to less social interaction, but also that this hustle and bustle can cause an unsafe feeling. This unsafe
feeling, in turn, means that fewer tourists want to visit the city and that residents no longer feel comfortable in
their place. The attributes of the City Brand Model are closely related to this, namely:

26
1. The safety element – This looks at the feeling of safety, general safety and safety concerning other
cities.
2. The image – This is about the reputation of the city, the lifestyle and the way a city is promoted
externally
3. The intentions of residents – This attribute addresses the intention to continue to live in a particular
city
4. Culture – This factor provides insight into the number of cultural activities in the city, but also the
feeling that city dwellers have about their city. Whether they think their city is modern.
All four attributes have a combination of objective and subjective liveability and can therefore be moderately
influenced by city marketing. Attributes from the city brand model that can hardly be measured are the humane
elements of the quality of life.
3.3.3. Human elements
Describing the quality of life is complicated by the fact that quality of life is not just a given but differs from
person to person and from place to place. Liveable is different for one person than for another and vice versa.
In other words: quality of life as a characteristic of a place or location is not just an objective fact (Okulicz-
Kozaryn, 2013). What is liveable is highly subjective and depends on the standards and values of the person
who assesses the area. After all, it is about how people experience their neighbourhood or district. The overall
assessment of the living environment, or the subjective liveability of a neighbourhood, is made differently by
different people. This subjectivity is summarized by Van Kamp, Leidelmeijer, Marsman and De Hollander
(2003) in the humane elements of liveability. The subjective factors that they consider partly correspond with
the elements that are tested in the City Brand Model. This is because the following factors are labelled as
human:
1. Social bonding – This attribute examines the relationships between city dwellers and the extent to
which relationships can be established. The city is interesting to come to for family and friends. But
diversity is also tested.
2. The business world – The extent to which the business world has to influence is mapped with this
factor. A positive image for the business world increases the attractiveness of the city, which means
that it can become busier.
However, the City Brand Model does not consider the influence of personal characteristics, something which,
according to Martin, Martinez and Fernández (2018), does influence the attitude of people towards
overtourism. Van Kamp, Leidelmeijer, Marsman and De Hollander (2003) also include this factor in
determining the quality of life. For example, research by Martin et al. (2018) into the factors influencing
27
residents' attitudes towards tourists in Barcelona shows that people in rental properties are more prone to the
impact of tourism in the city. On the other hand, young people and people with a lower income are more
tolerant towards tourists. These personal factors, therefore, have a direct relationship with tourism and thus
determine the policy to be pursued.
The type of tourist who comes to the city also influences the attitude of visitors to the tourists.
According to Van Aalst (2014), residents are mainly irritated by the drunk and nuisance tourists and the least
irritated by individual and small groups of tourists. Sahadat (2018) adds to this by stating that mainly older
tourists who return to their hotel in the evening are the least stressful for residents. These types of tourists can
be divided into the aforementioned categories of Cohen (1982), namely the individual mass tourist, the
organized mass tourist, the drifter and the explorer.
In this research, the subjective elements of the City Brand Model are combined with the personal
characteristics of residents and visitors. Comparative research into the explicit factors of overtourism that
influence residents' perception of liveability has not yet been conducted (Kuscer & Milhalic, 2019). As a result,
various elements from previous studies are combined, so that they can then be used in this study.
3.3.4. Environmental elements
In addition to the human subjective elements of liveability, there are also objective elements that determine
the liveability of residents. Pasquinelli and Trunfio (2020) also refer in their article about making overtourism
measurable to the distinction between objective and subjective liveability. In their view, it is important to map
these factual and measurable manifestations of the phenomenon. Reference is made to the amount of waste on
the street, but also the measurable noise produced by tourists. Also, they see the rise in rental and house prices
as a measurable factor that can determine the degree of overtourism. Koens, Postma and Papp (2018) argue
that it is precisely the objective quality of life elements that are the most important for determining the policy
concerning overtourism. Williams, McDonald, Riden and Uysal (1995) supplement this by arguing that the
objective quality of life elements can be mapped out well and are therefore essential for creating support among
the residents. Koens, Postma and Papp (2018) do state that the meaning of the word environment should be
considered in this category. In their research, they distinguish between the physical environment and the natural
environment. The physical environment can be designated here, such as heritage, transport or available
shopping facilities. The natural environment is not demonstrable here and is a feeling for the environment.
Think of the extent to which an individual finds the present nature sufficient. In this study, the individual items
are included in the humane elements of liveability.
If the objective elements from the City Brand Model are examined, it can be concluded that six
elements are objective and measurable. These elements are:

28
1. Nature – This attribute is about the degree to which a city is demonstrably green, so there are many
city parks, these parks are well maintained.
2. Shop facilities – This concerns the availability of shops, i.e. the number of clothing shops, the number
of quality restaurants, number of department stores. This factor contributes to the popularity of a city
and can influence as a factor of overtourism
3. Transport – The flow of traffic and the condition of the roads are examined
4. Government – This factor looks at the extent to which the government influences the image of the city,
looks at the confidence of residents in the government, the urban services for health needs, and the
public transport in the city.
5. Environment – The cleanliness of the city is discussed here, the city remains clean, government
services try to keep the city tidy and the number of rubbish bins is mapped.
6. Heritage – The satisfaction of residents and visitors about the cultural heritage is tested, so the number
of historic buildings, the maintenance of these buildings and the historic environment of the city.
The main contribution of this research is that a clear ranking is made of community attributes in terms of their
influence on residents' attitudes towards the brand image. By mapping these attributes, it can be established
what the residents of the city value most. By linking these attributes to the requirements of the visitor, a general
decision can be made about the attributes that are important for the city. By ranking the quality requirements
of the resident and the visitor, government agencies including city marketing can take the general preferences
into account. This general preference is essential to gain support for future tourism policy and will influence
the extent to which overtourism will or will not take place.

29
3.4. Conceptual model
The theories and literature discussed above can be summarized in the conceptual model, shown in Figure 9.
The model schematically represents the relationship between the different constructs. These relationships are
the result of a combination of different theories and claims. These relationships tested in this study have not
yet taken place. The focus of city marketing on visitors and the lack of integrated research into all stakeholders
are to blame for this (Hospers, 2009; Egresi, 2018). That is why the characteristics of both the resident and the
visitor are included in this research.
Figure 9: Conceptual framework
The model shows that the demand for tourism can be broken down into different forms of tourism. The extent
to which a tourist location is (negatively) influenced, according to Cohen (1982), strongly depends on the type
of tourist who comes to visit a city. The type of tourist, together with the characteristics of the residents and
characteristics of the tourist, determines the overall image of a tourist location.
According to researchers, the characteristics of residents can be broken down into six sub-items. These
items are age, gender, financial status, level of education, type of home and political preference. Based on
these items, hypotheses can be formulated that map out residents' attitudes towards tourism. These
characteristics influence three pillars. The first pillar is the tourist location; this pillar indicates the popularity
30
of a tourist location. For example, a younger population in a city is generally more interesting for mass tourism
because the tolerance of these residents is higher.
The second pillar is the personal characteristics of residents that influence the Social Exchange
between residents and tourists. The degree of tolerance and interaction between residents and visitors can partly
be explained by the characteristics of residents. For example, residents with a higher education level have more
interaction with tourists and other residents.
The last pillar is the personal characteristics of residents that influence the carrying capacity. The limit
value of irritation can partly be determined by personal characteristics. As an example, residents with a right-
wing political preference often suffer less from tourism because they consider the economic importance of
tourists to the city. Conversely, left-winging residents are more averse to tourists because the quality of life is
more important to them. In the same way, the characteristics of visitors influence the tourist location, the social
exchange and the carrying capacity. For this group mainly the type of tourist, type of activity, level of usage,
level of tourist satisfaction and socio-cultural characteristics of tourists are important.
Figure 9 shows that the degree to which social exchange takes place depends on the tourist location
and the degree of carrying capacity depends on the tourist location and the social exchange between residents
and visitors. The carrying capacity indicates a certain limit value to which tourists can visit a city without
irritation. This carrying capacity affects the quality of life of the residents. This quality of life can be mapped
out by making the concept measurable, this can be achieved by dividing the concept into objective and
subjective characteristics of quality of life. This objective and subjective liveability can in turn be broken down
into human characteristics, person-environmental fit and environment. The environment is objective and
measurable. Person-environment fit is a combination of both objective and subjective and human whole is
subjective. Making liveability measurable is important for city marketing because it allows the policy
concerning tourism to be determined. City marketing considers both the liveability of the resident and the
liveability of the visitor.
Ultimately, city marketing uses all these constructs to create a policy, the brand design. This includes
the actual identity of the city and the desired image. By highlighting these two items, the wishes of the visitor
and the preferences of the resident are included in the policy and will ensure sufficient support in that regard.
The purpose of the brand design is to be able to regulate the tourism flows and in turn influence the number of
tourists.
31
Chapter 4 – Methodology
This method chapter serves as a clarification for the method of the researcher. It states which considerations
have been taken and justifies why certain choices were made. It must be made clear from this chapter how and
where the research took place. In addition, insight is gained into the questions of what and who was
investigated. It is important here to account for each choice. This clarifies the repeatability, openness and
intersubjectivity of the research. First, the research area will be discussed (4.1.). Subsequently, the explanation
of the choice of mixed methods will be explained (4.2.). After that, the qualitative part of the research is
discussed, in which the choice for interviews, the transcription process and coding will be clarified (4.3).
Thereafter, the quantitative part of the research will be explained, in which the choice of the research area,
research units and sample size will be discussed (4.4.). The concepts will also be operationalized here,
providing insight into the questions that will be asked using surveys.
This chapter shows how the research is set up to answer the sub-questions with which answers to the
central main questions are found. Four questions must always be addressed in the methodology. These
questions are (De Goede et al., 2009):
1. Where? – In which setting will the research be carried out, or in which situation or location will the
research take place?
2. How? – How is the research conducted, i.e., which methods and techniques are used to collect and
analyse data?
3. Who? – Who is being investigated, in other words, which persons, groups or events make up the
research units?
4. When? – When does the research take place, or in what period and/or at what time will the research
be conducted?
These questions are answered in the paragraphs below. The chapter ends with a conclusion that should provide
insight into who an overall conclusion can be written with qualitative and quantitative results (4.5.).

32
4.1. Research area
The research area consists of the districts ‘Binnenstad Zuid’ and ‘Binnenstad Noord’ (Figure 10) located in the
city of Leiden. Geographically, both districts lie within the canals of the city and thus represent the tourist
centre of the city.
Figure 10: The districts ‘Binnenstad Noord and ‘Binnenstad Zuid’, including the neighbourhood 'De Waard’ (openstreetmap.org,
2021)
One of the neighbourhoods within the district ‘Binnenstad Noord’ does not belong to the area within the canals,
so the neighbourhood ‘De Waard’ is not included in the research area. The two districts ‘Binnenstad Zuid’ and
‘Binnenstad Noord’ (excluding the district ‘De Waard') are referred to in this study as the city centre of Leiden.
Figure 11: The districts ‘Binnenstad Noord’ and ‘Binnenstad Zuid’, excluding the neighbourhood ‘De Waard’ (openstreetsmap.org,
2021)

33
Not only the Leiden canals indicate the historical boundaries of the old city, but also shopping facilities,
museums, monuments and restaurants. The latter are often found in tourist areas and are therefore a good
indicator for demarcating the research area. With 855 different catering establishments and 565 cultural and
recreation services, the districts ‘Binnenstad Zuid’ and ‘Binnenstad Noord’ have the most catering and cultural
facilities. The number of hotel nights that takes place in these districts is also the highest of all, namely 412.000
overnight stays (Municipality of Leiden, 2020). This means that these two districts can be seen as the tourist
centre of Leiden.
Respectively, the districts ‘Binnenstad Zuid’ and ‘Binnenstad Noord’ have 14.851 and 8.530
inhabitants, spread over 10.812 households. Looking at these households, an average of 75% of these
households consists of single-person households, less than 20 per cent is a multi-person household without
children and only a small percentage is a multi-person household with children. These proportions can be
explained by the fact that just under 70% of residents are younger than 39 years old (Databank Leiden, 2021).
Gender proportions are evenly distributed for both districts, approximately 52.7% of the total
population of both districts is female and 47.3% is male. It can also be stated that the average monthly income
of the district is 10.000 euros lower than the Dutch average (Databank Leiden, 2021). This trend can often be
seen in student cities, where there are many single households. A place with a young population and work
must be combined with study.
4.2. Mixed Methods Research
For this research, it was decided to apply the so-called Mixed Methods Research (MMR). This research method
aims to unify qualitative and quantitative data (Boeije, 2010; Bryman, 2012). The quantitative part of the
research focuses on performing numerical and statistical analyses to make generalizable statements about large
populations, in this case, the residents of the city centre of Leiden. This group of 10.812 households can best
be reached through surveys. The application of this research method will result in a general view on
overtourism, which can be established with 95% confidence. As a result, a priority list can be drawn up for
this target group, so policymakers can see exactly what the residents' liveability wishes are. Before the survey
can take place, a running list is drawn up. The households are selected based on the BAG (Key Register of
Addresses and Buildings), after which a random sample must determine which households must be used for
the survey. To only get the households from the BAG, the addresses are selected using ArcMap. The addresses
that are typed as residential addresses by ArcMap are then exported to an Excel file. Subsequently, a random
sample was taken with Excel. The reason for using a random sample is to give every household an equal chance
of being involved in the sample (Scheepers, Tobi & Boeije, 2016). The data is initially collected through door-
to-door surveys. The questionnaire is issued and can be completed within five to ten minutes. There is a chance
that residents of both neighbourhoods are not at home or do not have the time at the time of approach. For the
survey to be Covid-19-proof, you can choose to complete the same survey online. Notes will be made with a
link to an internet or web survey where it can still be completed. An additional reason for an online alternative
34
is to make the respondent group as large as possible to increase the representativeness. In addition, it is useful
for the respondent to be able to determine their own time to fill in (Scheepers, Tobi & Boeije, 2016).
The qualitative part of the research mainly focuses on collecting in-depth narrative and textual data
from a limited number of respondents to reveal social processes and mechanisms in this way. The latter is used
for the target group of tourists and the city marketer: Leiden Marketing. It can be added that the Covid-19 virus
outbreak contributed to the determination for this method. The reason that at the time of this study the
Netherlands was labelled as code red by neighbouring countries, it is difficult to reach the target group
‘tourists’. As a result, it was decided to interview hotel owners of different hotels, to map the wishes and
preferences of tourists.
In the following paragraphs, it will be explained how the set-up of the various interviews looks like
(4.3.1. & 4.3.2.), how the transcription process works and how coding is done (4.3.4.). For the quantitative
part of the research, it will be explained what the research units are (4.4.1.), how large the sample size will be
(4.4.2.) and the concepts will be operationalized (4.4.3.). Ultimately, it will be explained how you can write a
solid and valid conclusion with both research methods (4.5).
4.3. The qualitative part of the research
During this research, interviews will be conducted for the target groups ‘tourists’ and ‘city marketing’. For the
former target group, hotel owners of various hotels are interviewed to give a good insight into the tourist
perception of the quality of life in the city. Interviewing hotel owners is somewhat necessary because the
Covid-19 pandemic has made the original target audience inaccessible. Due to the lack of the target group
‘tourists’, we looked for the most suitable alternative. This alternative appears to be the hotel owners, as they
interact most with hotel guests when it comes to visiting preferences in the city. This, therefore, concerns an
indication of the expected perceived liveability, because the target group ‘tourists’ is not addressed itself. The
precise preferences of tourists remain open to interpretation. The interviewed hotel owners were chosen based
on the target group, which can vary from small-scale Airbnb’s to a four-star hotel (the highest classification of
hotels in the city of Leiden).
The results gained from the interviews with hotel owners as well as the quantitative part will be
discussed with Leiden Marketing. This conversation has a dual function; on the one hand, it will be asked how
city marketing is expressed in its current form and, on the other hand, the results of this research will be
discussed with them. This can be used to determine whether the current line that Leiden Marketing is pursuing
is sufficient or whether an adjustment is desirable. The interview with Leiden Marketing, therefore, has an
additional function for the research as well as a controlling function.
The additional function of the interview with Leiden Marketing is to compare the current situation and
the preferences of society. This makes it possible to determine whether the policy concerning overtourism is
functional and sufficiently effective. The controlling function is mainly expressed in determining the validity
of the data. If the research results are not in line with the perception of Leiden Marketing, it may be questioned

35
whether the data are valid. In that case, inquiries will be made about how Leiden Marketing can avoid or guide
the possible situation of overtourism.
4.3.1. Interviews
For this study, interviews were held for the target group ‘visitors’ with seven hotel owners and/or front office
managers (an overview of all respondents can be seen in Appendix I). In addition, a final meeting was held
with Leiden Marketing. For the target group of visitors, it was decided to create such a mixed heterogeneous
group that covers all types of visitors. The interviews were held both in person on location and by telephone.
The respondent was given the choice to conduct the interview on location or by telephone, with the reason to
offer the respondent a Covid-19-proof solution and to be able to determine the desired interview setting for
himself. These interviews were then recorded with a mobile phone and subsequently transcribed and worked
out. Table 1 shows an overview of all respondents who participated in this survey.
It was decided to interview owners of large hotels as well as small bed and breakfasts (hereinafter
B&B) because this can accurately reflect the visitors. This looked at the price of hotel rooms and the
appearance of the hotel or B&B. The price in combination with the appearance of the hotel or B&B attracts a
certain type of visitor, namely the budget visitor and the visitor who has more to spend on average. Respondent
4 can be seen as representer of the most budgetary hotel with an average room price on average 77 euro per
room for two people and Respondent 2 is the representer of the most expensive at 144 euro per room. It should
be noted here that these room rates were requested in January 2021, a time when the Netherlands is in lockdown
and tourism is hardly an issue. On average, the price for a hotel room will be higher if the Covid-19 virus
situation did not exist.
During interviews, it became clear that a distinction can be made between two different visitors,
namely the long-stay visitors and the short-stay visitors. As a result, it was decided to interview the front office
employee of the tourist office in Leiden. This employee mainly interacts with people on a day trip and can
therefore give a good insight into the wishes and preferences of this target group.
To increase the validity of the research, a semi-structured interview was used (see Appendix II). The
questions were devised in advance, but there is still room for the respondent to make their additions. This
increases the internal validity because the same group also gets the same questions. The questions about the
length of the visit were only omitted in the interview with the tourist office employee because the tourist office
does not facilitate overnight stays.
In the research, a degree of generalization is done, which does not benefit external validity. The more
than one million visitors (pre-Covid-19 time) are represented by 7 interviews. In addition, the respondent
estimates what the target group thinks, this does not increase external validity (Scheepers, Tobi & Boeije,
2016). It should be noted, however, that the research is being conducted in Covid-19 time in which the
Netherlands is in lockdown, the target group ‘visitor’ cannot be reached, and the best possible alternative has
therefore been examined.

36
The repeatability of the research, and thus the reliability of the research, can be found in the method
that was applied. Several people were asked about the same subject with the same questions which increases
the reliability. It should be noted, however, that there is room for the respondent's input, which does not benefit
reliability (Scheepers, Tobi & Boeije, 2016). However, these questions have been noted afterwards and can be
asked again.
4.3.2. Operationalization of the interviews with hotel owners and front office employees
The questions posed to the hotel owners and front office employees can all be derived from the conceptual
model. This involves looking at four elements, namely the identity of the visitor, the human aspect of
overtourism, the environmental factors of overtourism and the person-environment fit of overtourism. First,
the identity of the interviewee was asked, to validate that the person with whom was spoken has a direct
relationship with the visitor. Subsequently, the purpose of the visit and the general wishes of the visitor were
discussed. Table 1 describes the questions associated with this.
Topic Question(s)
Profile interviewee - Could you introduce yourself?
a) Function
b) How long working
c) Relationship with the visitor
Visitor identity - Can you provide a profile of the visitors who come to your
hotel to stay overnight?
a) Age
b) Gender
c) Group size
d) Short or long stay
Purpose of visit - What is the purpose of the visitor during their stay at your
hotel?
a) Business, museums, city tips, etc
- Where do visitors prefer to go to?
General preferences/facilities - Which items are the most important when visiting Leiden?
- What do visitors miss when visiting Leiden?
- What is suggested by hotels as an activity to do in the city?
- From the visitor's perspective, what grade would you give
to the city of Leiden?
Annoyances - What annoys visitors the most when visiting the city of
Leiden?
Table 1: operationalization of the interviews with hotel owners and front office employees
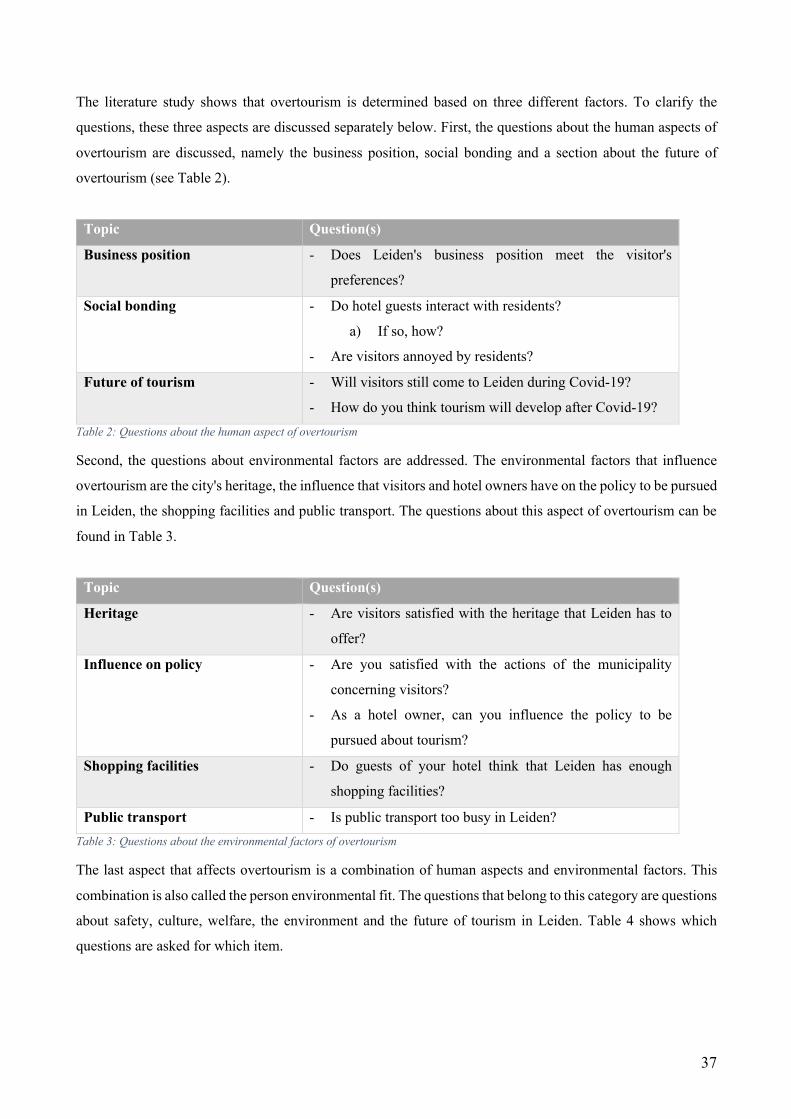
37
The literature study shows that overtourism is determined based on three different factors. To clarify the
questions, these three aspects are discussed separately below. First, the questions about the human aspects of
overtourism are discussed, namely the business position, social bonding and a section about the future of
overtourism (see Table 2).
Topic Question(s)
Business position - Does Leiden's business position meet the visitor's
preferences?
Social bonding - Do hotel guests interact with residents?
a) If so, how?
- Are visitors annoyed by residents?
Future of tourism - Will visitors still come to Leiden during Covid-19?
- How do you think tourism will develop after Covid-19?
Table 2: Questions about the human aspect of overtourism
Second, the questions about environmental factors are addressed. The environmental factors that influence
overtourism are the city's heritage, the influence that visitors and hotel owners have on the policy to be pursued
in Leiden, the shopping facilities and public transport. The questions about this aspect of overtourism can be
found in Table 3.
Topic Question(s)
Heritage - Are visitors satisfied with the heritage that Leiden has to
offer?
Influence on policy - Are you satisfied with the actions of the municipality
concerning visitors?
- As a hotel owner, can you influence the policy to be
pursued about tourism?
Shopping facilities - Do guests of your hotel think that Leiden has enough
shopping facilities?
Public transport - Is public transport too busy in Leiden?
Table 3: Questions about the environmental factors of overtourism
The last aspect that affects overtourism is a combination of human aspects and environmental factors. This
combination is also called the person environmental fit. The questions that belong to this category are questions
about safety, culture, welfare, the environment and the future of tourism in Leiden. Table 4 shows which
questions are asked for which item.

38
Topic Question(s)
Safety - Do visitors feel safe in the city of Leiden?
Culture - Are visitors satisfied with the cultural offer?
- Does the cultural offer meet the visitor's wishes?
Well-being - Do visitors feel comfortable during their visit to Leiden?
Future of tourism - Do you have any advice for the municipality regarding
tourism policy?
Environment - Have you ever heard complaints from visitors about the
hustle and bustle in the city of Leiden?
Table 4: Questions about the Person Environmental fit of overtourism
4.3.3. Operationalization of the interview with Leiden Marketing
The interview with Leiden Marketing aims to discuss the possibilities of preventing or guiding overtourism.
During this conversation, cautious research results are discussed and how Leiden Marketing could get started
with this is discussed. The interview is divided into two parts. Firstly, the current activities and the essence of
Leiden Marketing for the city of Leiden are explained, while the degree of participation of residents during the
decision-making process of campaigns is also discussed. It also discusses to what extent the activities of Leiden
Marketing meet the preferences of residents. The first part aims to provide context, so what does Leiden
Marketing entail and what is their working method. This is to sketch a framework, to subsequently be able to
see whether the policy to be pursued corresponds with the preferences of residents and visitors. The questions
asked in the first part can be found in Table 5.
Topic Question(s)
Profile interviewee - Can you introduce yourself?
a) Function
b) How long working
Leiden Marketing - What exactly does Leiden Marketing entail?
a) What is the relationship between you as Leiden
Marketing and the municipality?
i) And between you and the hotels
ii) Can campaigns be launched without the
consent of the municipality?
iii) Is there a check by the municipality on your
actions?
iv) If not, are your activities monitored?
- What is the essence of Leiden Marketing?

39
a) For the business market
b) For the visitors
c) For the residents
- What are the main goals of Leiden Marketing?
a) What are the goals during Covid-19?
Positive effects - What are the positive effects of your activities for the city
of Leiden?
a) For residents?
b) For visitors?
c) For the business market?
Involvement of residents - To what extent do the preferences of the visitor influence
your work/campaigns?
a) And to what extent are residents involved in this?
b) To what extent can residents influence the policy to be
pursued?
Involvement of other actors - How do you try to align the city promotion with the wishes
of all other actors involved?
a) And how is this effect in practice?
Municipality - The municipality is currently taking stock of what
residents think about day-trippers and other visitors. Based
on this, a visitor economy policy is drawn up. What is your
position in the decision-making process regarding such a
policy document?
a) To what extent can you influence that policy?
b) To what extent are you obliged to take such a
policy document into account?
- The municipality will also continue to push for a merger
between Leiden Marketing and Centrummanagement
Leiden. Do you think that is a good idea?
a) Does this benefit the city marketing of Leiden?
b) What is the most ideal situation for Leiden
Marketing to get the most out of city marketing?
i) Why is that the most ideal situation?
ii) Is that good for residents?
Campagnes - How does campaign decision-making work?
Table 5: Contextual questions for Leiden Marketing

40
After mapping the way Leiden Marketing works, the subject of overtourism can be discussed in more detail.
An attempt is made to sketch a vision for the future based on the results obtained from this research. During
this part, comparisons are also made with the city of Amsterdam and its city marketing organization
Amsterdam & Partners. The reason this organization is used as a comparison is that this organization already
takes overtourism into account. The question is whether measures taken by Amsterdam & Partners are also
interesting for an organization such as Leiden Marketing. The questions posed about the future of Leiden
Marketing are as follows (see Table 6).
Topic Question(s)
Tourism development - How do you think tourism will develop in the coming
years?
a) What are your activities now?
b) What is the highest priority at this moment?
Amsterdam & Partners - Amsterdam & Partners, the former city marketing agency
of Amsterdam, is currently advising to completely
redesign the visitor economy in the coming years.
Recommendations have been made with residents,
entrepreneurs and the cultural sector to ensure that by 2025
more people benefit from the tourist interest in the city and
lead to less inconvenience, especially for city centre
residents.
a) Is the call to change also present in Leiden?
b) Is Leiden susceptible to so-called ‘overtourism’?
- In Amsterdam, a special tax for day-trippers, a discount
pass for residents and a total ban on holiday rentals such
as Airbnb are being considered. Do you think these
measures can contribute to keeping visitors flowing to
Leiden manageable?
a) Will these kinds of measures work for the city of
Leiden?
b) Do you think residents should benefit more from
their city?
c) What kind of option would work for a city like
Leiden to combat overtourism?
Grade for Leiden - What grade do you give the city of Leiden from the
perspective of Leiden Marketing?
a) What do you think could be improved?
Table 6: Questions about the future of Leiden Marketing
41
4.3.4. Transcription process and coding
The interviews were recorded with an iPhone and transcribed by the software of Amberscript. The software
automatically transcribes the submitted sound recordings. However, the interviews were conducted by
telephone, so the software was not always able to properly detect which words were spoken. These errors have
been manually updated from the software. The advantage of this manual update is that you can remember the
contents of the interviews while listening and typing, which is important for encoding the transcripts.
The transcripts were then exported to the Atlas.it software. This program assists the researcher in
creating codes. These codes are answers to questions and/or belong to a specific theme. By using these codes
integrally, an overview can be created of all answers to the question associated with the code. This allows you
to immediately see the results regarding the code for all interviews.
The encryption process is started with so-called ‘open coding’. The interview is read in its entirety and
details of the statements made by the respondent are recorded. Codes are then made of all these statements,
which serve as a guideline for the analysis of the transcripts. Open coding aims to ensure that the interpretation
of the interviews is less influenced by the researcher.
After the codes have been created, the researcher looked at overarching main themes. In this study,
these are the five sub-questions from the study, the three quality of life factors that determine overtourism, the
general quality of life factors and overtourism. This way of coding is also called ‘axial coding’. A sub-code
can belong to several main themes. It has been decided to place these sub-codes with multiple main themes.
This is because no quotation can be overlooked. A comprehensive overview of all codes can be found in
Appendix III.
The codes are closely related to the conceptual model and can therefore give the impression that there
is no room for new information in this research. The interviews were made based on the literature study and
therefore focused on items that are already known. To be sure that new information can be gathered, ‘probing
questions’ were asked based on the answers given by the respondent. The purpose of questioning during the
interview is that new information can be obtained. The information resulting from this is coded as; ‘General
liveability’ and ‘Overtourism’.
Other codes were used for the interview with Leiden Marketing. The codes used to analyse this
interview correspond to the division of the chapter. First, it has been mapped out what Leiden Marketing is,
for this, the code ‘positioning LM’ was used. Subsequently, the influence of residents on tourism policy was
examined, for this the code 'influence of residents on policy' was used. It is concluded with guiding or
combating overtourism. For this last part, the code ‘guiding overtourism’ has been used.

42
4.4. The quantitative part of the research
In addition to the information obtained through interviews, information is also obtained from large-scale field
research. The field research, consisting of a survey, is conducted among a portion of the total number of
households within the canals of the city of Leiden. The part that may participate in the survey will be chosen
based on a random sample. Surveys are the most effective and reliable research method for conducting large-
scale field research. The large-scale field research could provide an overview of what lives and plays among a
specific population or specific parts of a population (Scheepers, Tobi & Boeije, 2016). This method is often
used to describe and explain social phenomena. This applies to determining overtourism in the city centre of
Leiden.
The study uses a general questionnaire, which is distributed to a random group of residents of the city
centre. The method is extremely suitable for gaining insights into relationships between theory and research-
based on validity and validity. In addition, this method was chosen to gain numerical insight into the situation
in the city centre (Bryman, 2012).
An overall picture of the city centre of Leiden is determined using the largest possible database of data.
The quantitative research uses a standardized data collection plan so that all respondents answer the same
questions (Bryman, 2012). Written research was chosen because it is a cheap and fast way to obtain data.
Written research is easy to analyse and leads to few socially desirable answers. The written surveys are
conducted anonymously, which increases the willingness to provide honest answers (Scheepers, Tobi &
Boeije, 2016).
The great advantage of this research method is the fact that many people can be questioned, therefore
a good general picture can be drawn of the situation. On the other hand, in a survey, you cannot go into depth
by asking in-depth questions or asking for a response to the answers given. However, this does not apply
because several liveability items are being tested. These items are listed and need no further explanation.
4.4.1. Research units
In this study, the residents of Leiden's city centre are tested quantitatively. Leiden city centre has a total of
23.381 inhabitants, divided into 10.812 residential addresses (Municipality of Leiden, 2020). It was decided
to look at residents of the city centre of Leiden, who are surveyed based on a random sample from the number
of residential addresses. This method was chosen because the current Covid-19 measures do not encourage
people to go outside. This makes it easier to reach this target group by walking through residential addresses.
For this study, it is accepted to have several people from a household complete the questionnaire, this has to
do with the fact that households in the city centre often consist of several residential units. These units are
mostly self-contained rooms and can be seen as separate household. It is also interesting to obtain the opinion
of both young and old. This allows a household with children to provide insight into the perception of both the
parent and the child. Again, a household contains several age categories that are interesting for this study.

43
It was therefore decided to survey residents of the city centre based on the residential addresses
registered in the BAG register from July 2020. The population is most involved in the city centre and can
accurately indicate the current situation in the area. The data - all residential addresses of the city centre of
Leiden - are entered into the statistical program IBM SPSS Statistics and then one simple random sample is
drawn. The sample is randomly drawn with the reason to give each unit (residential address) an equal chance
to end up in the sample (Clifford, French & Valentine, 2010). In this way, an attempt was made to provide the
best possible reflection of the city centre of Leiden, in other words, the highest possible representativeness.
The random sample was done as follows using the SPSS program:
The above calculation resulted in 2.162 residential addresses that must be visited to receive a sufficient
response. A random sample of 20% from the total population was chosen because previous research showed
that the average response to a survey is approximately 20%. As a result, with this random sample, it is expected
that a sufficient response will be received.
4.4.2. Sample size
However, the above random sample has yet to be tested based on reliability and margin of error. To call the
study reliable, a minimum confidence level of 95% must be achieved. A margin of error of 5% can be taken
into account here. This means that a certain percentage can turn out 5% higher or lower. These margins are
scientifically accepted and serve as a guide for the sample size of this study.
Figure 12: The formula for the minimum number of respondents
n = the number of respondents required.
z = the standard deviation at a given confidence percentage. (= 1.96)
N = the size of the population. (= 23.381)
p = the probability that someone will give a certain answer (= 50%).
F = the margin of error (= 5%)
City Centre of Leiden: Binnenstad Zuid en Binnenstad Noord (excl. Neighbourhood ‘De Waard’) N=10.812 *N= population Data à Select Cases Select à Random Sample of Cases à 20% of all cases

44
The figure above yields an n-value of 378 respondents. This means that a minimum of 378 respondents are
required to guarantee a confidence level of 95% and where the margin of error is a maximum of 5%.
With a minimum number of respondents of 378, it must be assumed that this is approximately 20% of the
number of residential addresses that respond. According to these data, at least 1890 residential addresses (20%
of 1890 = 378) will have to be visited to reach this number. From the random sample described above, 2162
residential addresses were drawn to visit. More than enough to reach the minimum threshold of 378
respondents.
Both neighbourhoods in Leiden do not only consist of individuals of Dutch descent (CBS, 2019). There
is a chance that some residents do not speak the Dutch language, so the survey cannot be completed in Dutch.
For that reason, both the written and the online survey is also elaborated in English. During the door-to-door
survey, the correct language is provided unless this can be done in writing. If a letter with the link is handed
over, there will be an instruction in Dutch and English, which will lead to the correct survey in the correct
language.
There is a possibility that individuals do not speak English and Dutch so that the survey cannot be
completed in both cases. This group is considered non-response because the researcher also does not speak
both languages. Using a translator is possible to translate the survey, but this generally results in a lot of
language and spelling errors, which can give an unprofessional impression of the survey. For this reason, only
an English version and a Dutch version of the survey have been chosen.
4.4.3. Operationalization of the concepts from the survey
The literature has shown that the quality-of-life factors that influence overtourism can be determined based on
three facets, namely 1) the human elements, 2) environmental elements and 3) human environmental fit. These
facets are represented in the survey by five elements. These elements each individually or overlapping suit the
three facets of liveability.
The structure of the survey has been divided in such a way that a start is made on mapping the current
situation, so there is talk of overtourism and how can this possibly be counteracted. Subsequently, the five
created elements of quality of life based on the three facets will be discussed. The survey will be concluded
with personal questions, to be able to draw conclusions about the degree of overtourism experienced in
combination with personal characteristics (see Appendix V for the complete survey).
General questions about tourism
The survey will start with several statements and questions about tourism in Leiden. These statements and
questions reflect the residents' overall perception of the topic of tourism. These statements and questions arise
from the literature study in which the concept of overtourism is defined (Van Kamp, Leidelmeijer, Marsman
& De Hollander, 2003). It has been decided to ask several concrete statements that are directly related to the
subject of (over) tourism. These statements are based on a survey by the Amsterdam Metropolitan Audit Office
(2016) and on reports from the media in which it is stated that there should be a limit on the number of tourists
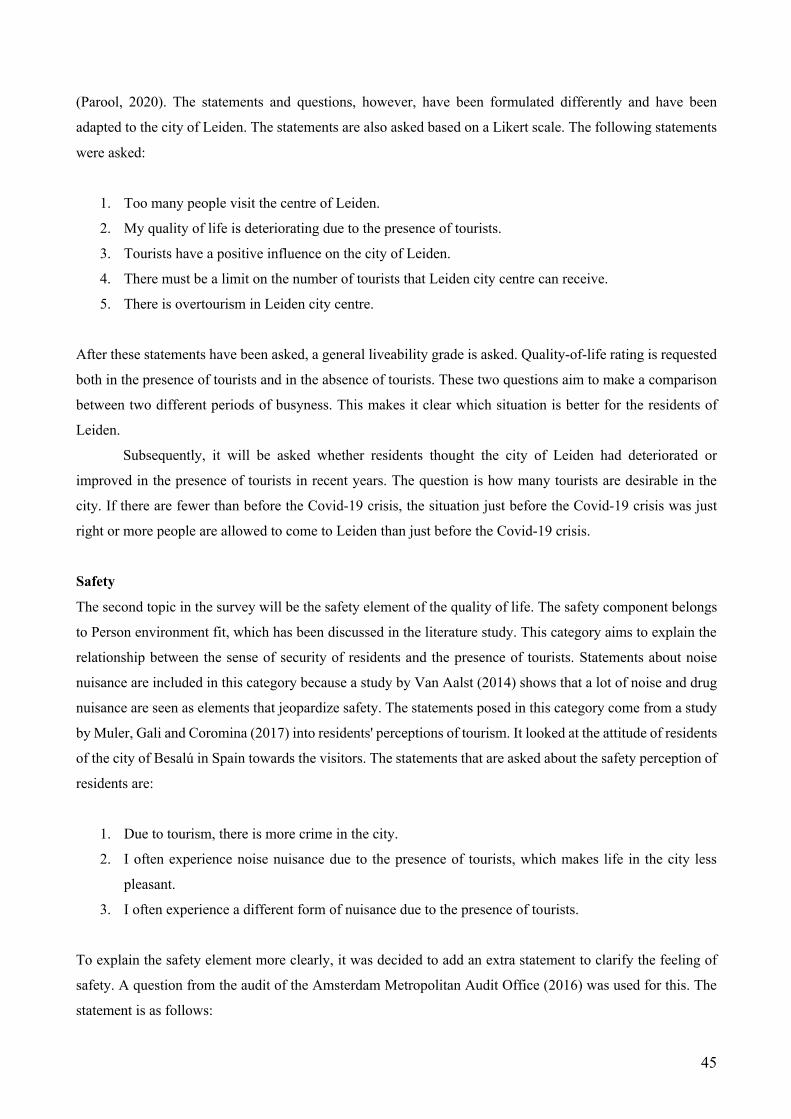
45
(Parool, 2020). The statements and questions, however, have been formulated differently and have been
adapted to the city of Leiden. The statements are also asked based on a Likert scale. The following statements
were asked:
1. Too many people visit the centre of Leiden.
2. My quality of life is deteriorating due to the presence of tourists.
3. Tourists have a positive influence on the city of Leiden.
4. There must be a limit on the number of tourists that Leiden city centre can receive.
5. There is overtourism in Leiden city centre.
After these statements have been asked, a general liveability grade is asked. Quality-of-life rating is requested
both in the presence of tourists and in the absence of tourists. These two questions aim to make a comparison
between two different periods of busyness. This makes it clear which situation is better for the residents of
Leiden.
Subsequently, it will be asked whether residents thought the city of Leiden had deteriorated or
improved in the presence of tourists in recent years. The question is how many tourists are desirable in the
city. If there are fewer than before the Covid-19 crisis, the situation just before the Covid-19 crisis was just
right or more people are allowed to come to Leiden than just before the Covid-19 crisis.
Safety
The second topic in the survey will be the safety element of the quality of life. The safety component belongs
to Person environment fit, which has been discussed in the literature study. This category aims to explain the
relationship between the sense of security of residents and the presence of tourists. Statements about noise
nuisance are included in this category because a study by Van Aalst (2014) shows that a lot of noise and drug
nuisance are seen as elements that jeopardize safety. The statements posed in this category come from a study
by Muler, Gali and Coromina (2017) into residents' perceptions of tourism. It looked at the attitude of residents
of the city of Besalú in Spain towards the visitors. The statements that are asked about the safety perception of
residents are:
1. Due to tourism, there is more crime in the city.
2. I often experience noise nuisance due to the presence of tourists, which makes life in the city less
pleasant.
3. I often experience a different form of nuisance due to the presence of tourists.
To explain the safety element more clearly, it was decided to add an extra statement to clarify the feeling of
safety. A question from the audit of the Amsterdam Metropolitan Audit Office (2016) was used for this. The
statement is as follows:

46
4. Tourism has a negative impact on my safety in the city
The category is concluded with a rating for the perceived safety in the city centre of Leiden. The purpose of
this figure is to be able to explain which element of safety is most decisive for the resident's perception of
safety. This can influence the advice to be written about tourism.
Well-being and social cohesion
The third category that emerged during the survey is a combination of well-being and social cohesion.
According to Kuscer and Milhalic (2019). These two elements fits well together because both subjects are
directly linked. For example: well-being in an environment has a positive effect on the social interaction that
takes place at a particular location. Well-being and social cohesion can be found in the subdivision of quality-
of-life characteristics under the terms human and environment. These components, therefore, cover two parts
of the quality-of-life characteristics. The statements that are asked derived from the research by Kuscer and
Milhalic (2019) into the attitude of residents towards overtourism in Ljubljana. The statements posed herein
are as follows:
1. I feel trapped in my environment by the presence of tourists.
2. The community benefits from the presence of tourists.
3. Due to the presence of tourists, I would like to move to another city.
The statements are supplemented with questions from the aforementioned research by Muler, Gali and
Coromina (2017). The aim of supplementing the statements is to gain a more versatile picture of residents'
perception of well-being and social cohesion. An additional advantage is that it can be better explained which
factors of well-being and social cohesion have the most influence on the experience of overtourism. The
statements below come from the research by Muler, Gali and Coromina (2017):
4. Tourism brings more money to Leiden than any other industry
5. Tourism brings money and jobs, and that is more important than any inconvenience it might bring
6. Tourists get in the way of residents.
This category is also concluded with a general grade for well-being and social cohesion. The grade gives an
overall assessment of this category and can be explained in combination with questions asked.
Environment
The environment is an aspect that belongs to the environmental aspect of the quality of life. The environment
comprises several facets, namely a) nature, b) public space, c) shopping facilities. These facets are tested with
47
five statements from three different studies. The first two statements come from the aforementioned research
by Muler, Gali and Coromina (2017) and relate to the shopping facilities and public space.
1. Shops in the city are for tourists.
2. Tourists litter the city of Leiden.
The next two statements come from research by Merrilees et al. (2009) and relate to the green space in the city
and its maintenance.
3. There is sufficient green space in the area.
4. The landscaping is well maintained.
The last statement in the environment section relates to life in a tourist centre and the degree of satisfaction
with it. This question comes from the research of Kuscer and Mihalic (2019).
5. Living in a tourist place is not nice.
To explain the above statements, a grade for the environment is asked at the end of this section. As with the
previous categories, this grade is used to conclude which item of the environment has the most influence on
the overall grade for the environment.
Culture & Heritage
The penultimate part of overtourism that is tested in the survey is a combination of culture and heritage. These
components belong to by the environmental elements of quality of life and by the Person Environmental fit.
These parts are tested using four statements. The first three statements come from previous research by Muler,
Gali and Coromina (2017). The statements are specified for the city of Leiden and are as follows:
1. Cultural heritage is better maintained through tourism.
2. The fact that tourists of different nationalities come to Leiden makes the city more interesting and
attractive.
3. Leiden has more leisure activities due to tourism.
To better explain the relationship between tourism and the quality of cultural heritage, the statement from the
study by Jeon, Kang and Desmariais (2016) is added to the questionnaire on culture and heritage. The study
by Jeon, Kang and Desmariais (2016) aims to map the quality of life at seasonal tourist sites in this case Salem,
Massachusetts. This tourist location is four times busier than usual in October because this month is all about
the Haunted Happenings. Based on this study, the following statement has been applied to the city of Leiden.
48
4. Tourism influences the quality of cultural heritage.
A final mark is also required for this category. This also explains the relationship between the statements and
the final mark.
Government
The last part of the quality of life that is tested is the government services. The government services related to
the municipality and all its services that it facilitates for the city. Think of the promotion of the city, the flow
of traffic and the influence on tourism policy. Asking about the government services arises from the literature
study in which it is stated that government services influence the quality of life in the city. The theme of public
services can be found in the categorization of the quality of life among the environmental factors of the quality
of life. The first two statements come from the aforementioned study by Kuscer and Mihalic (2019) and deal
with how the municipality takes residents into account.
1. The government takes the residents into account when promoting the city of Leiden.
2. Residents have an influence on tourism policy in the city of Leiden.
The following statements about government services are about traffic, public transport and trust in the local
government. These statements have also been asked in the study by Merilees et al. (2009). The statements
related to this are as follows:
3. Tourism is endangering the flow of traffic.
4. Public transport is too busy due to the number of tourists.
5. I have confidence in the decisions of the local government.
It is concluded with a final mark. This tests the relationship between the statements and the overall grade. The
grade is also used to determine the extent to which government services influence the overall quality of life
grade.
Personal influences on the quality of life
The survey is concluded with a question about the liveability items that are most important to residents and a
few personal questions. First, a Top 3 is chosen from the following items: a) safety, b) image, c) culture, d)
nature, e) shopping facilities, f) transport options, g) government services, h) environment, i) social interaction
with residents and j) the business position of the city of Leiden. These items come from the research of Merilees
et al. (2009) on the City Brand Model. According to Merilees et al. (2009), these items are the most important
in determining your City Brand Model. These items must provide a ranking that can be used to determine
where the residents' priorities lie concerning city branding.
49
To determine which items are important for the city, it is important to know the personal characteristics of
the respondent. This allows conclusions to be drawn about the degree of overtourism experienced in
combination with age, gender, education, income, et cetera. The personal characteristics can also be compared
with the various liveability items that have been tested. Ultimately, conclusions can be drawn with these data.
4.5. Drawing conclusions
The results from the interviews and the survey are first treated separately. This creates an index of priorities
per category. In short, which quality of life characteristics are important for residents and which characteristics
are important for visitors. These results are then presented side by side in a separate section to see where the
similarities are and where the two target groups differ. This information will then be taken to Leiden Marketing
to see to what extent Leiden Marketing can steer the tourism policy and advice will be given to the municipality
to prevent or guide any overtourism.

50
51
Chapter 5 – Results
In this chapter, the results of the research are presented. The results are obtained from a combination of surveys
and interviews. First, the results regarding the visitors will be discussed (5.1.). Based on quotations, a general
picture is sketched of the visitors who come to Leiden and their corresponding preferences regarding their
visit. In addition, the factors that according to visitors cause overtourism are examined to be able to map out
where the pain points lie. Subsequently, the satisfaction of the residents in the historic city centre of Leiden
will be discussed (5.2.). A list will be published with preferences and annoyances that residents have about
tourism. Ultimately, the results of the interviews with visitors and the surveys with residents are compared
(5.3.). This, to determine the corresponding positive factors for the overall quality of life in the city, as well as
the differences between the two target groups. It will be concluded with a section on Leiden Marketing, the
organization that is engaged in creating a specific image for the city of Leiden to attract more visitors to Leiden
(5.4.). It will be examined whether the preferences of residents and visitors correspond with the image that
Leiden Marketing paints of Leiden.
5.1. Satisfaction of visitors with tourism in Leiden
This paragraph looks at the results of the survey from the interviews held with the seven hotel owners / front
office employees. The purpose of this paragraph is to map out the visitors' perception of their visit to Leiden.
First, we will look at the type of visitor who comes to visit Leiden (5.1.1.). The positive aspects of their visit
will then be discussed (5.1.2.). After that, the negative aspects are discussed (5.1.3.) and then concluded with
the indicators that, according to visitors to the city centre of Leiden, cause overtourism (5.1.4.).
5.1.1. Type of visitors
The profile and background of a visitor influence the extent to which overtourism is experienced. Research by
Reisinger (2009) shows that when a certain type of tourist increases in a certain area, the resident's irritation
increases. To determine which group this concerns, first look at the profile of the visitor. The profile of the
visitor includes nationality, as well as the purpose of the visit and the duration of the visit.
The visitors who come to Leiden can be divided into two different groups; 1) the visitor who stays in
Leiden for a longer period, to be called ‘the long-stayer’, and 2) the guest who comes to visit Leiden for a day,
‘the short-stayer’. According to one respondent, dividing guests into these two groups is important because the
type of visitor differs greatly. It is stated that visitors who stay longer in the city are on average over 40 to 50
years old. In addition, Respondent 5 indicated that the city of Leiden focuses on a target group that is over 50
years old and is interested in the versatile culture of the city. This view is confirmed by Respondent 6,
Respondent 2 and Respondent 1. The proportion of younger people (read 18 - 35 years) is less common in
Leiden. According to Respondent 4, this is mainly due to the limited number of nightlife options in the city.
The city presents itself mainly as a city of knowledge and culture and is, therefore, less focused on the younger

52
generation. Respondent 5 adds that this profiling does not always match the preferences of the younger target
group. Respondent 1 also indicates that this target group is looking for a room that matches their budget, a
budget that is on average lower than the budget of the rooms in Leiden. It is also indicated that the facilitation
of budget rooms is stopped, precisely to avoid this target group: “Youth hostels or hostels or whatever you
want to call them. There are none, but there have been initiatives to do so. But that is actually opposed by
residents in particular. And yes, that is perhaps not entirely wrong, because if you have 80 of them together
and they don't have a garden in which to sit, they will of course hang in front of the door.” (Full transcripts
are included in Appendix IV). However, it is not the case that there is no youth at all in the city. Young couples
are indeed staying in Leiden, but this group is relatively smaller than the group that is 40+. In addition, Leiden
is one of the largest university cities in the Netherlands and therefore has relatively more youth living in the
city centre than any other random city in the Netherlands. Youth is therefore present and the visitors/friends
they receive also fall within the target group 18 - 35 years. However, this visit is not registered because they
do not stay in the hotels.
Talking about the visitors who come to Leiden for a day, it can be concluded that they reasonably
correspond to the guests who stay longer, although there is a difference in the purpose with which visitors
come to Leiden. Day trippers (short stay) mainly come to Leiden to enjoy the versatile culture and heritage,
while guests who stay longer can also have a business purpose. About 50% of all overnight stays (pre-Covid-
19 time) are occupied by business guests. These guests enjoy the facilities and activities in the city less than
visitors who are only in Leiden for leisure purposes.
The visitors who come to Leiden for leisure purposes and stay overnight mainly come to visit the city
to enjoy the culture and heritage. This visitor is also referred to as a ‘quality tourist’ by Respondent 1. This is
a visitor who is often more highly educated and has a strong interest in art and culture. Leiden can fully meet
this expectation with 13 national museums and 28 kilometres of canals and canals. This combination ensures
that Leiden is particularly popular with a specified target group interested in museums and buildings. All
respondents indicated that both factors are the main reason why visitors come to Leiden. In third place comes
the factor ‘nature’. With the newly constructed ‘Singelpark’ and the many parks in the city centre, this is a
good base for visitors. Looking specifically at the activities, it can be concluded that visitors mainly go to
museums, take boot trips on the canals, enjoy various catering establishments and take walks through the city.
For the latter factor, the courtyards route is particularly popular, a route in which 12 courtyards in the city
centre are visited.
In addition to the leisure visitor, there is also the business visitor. According to Respondent 4, this
visitor has little or no interaction with the city of Leiden: “You also have people who stay here for one or two
nights, have appointments and continue again. Or someone who, for example, attends a conference and then
makes some appointments, these are also people who are going on a cruise. That they go to Boerhaave
museum, European museum of the year.” Besides these short-term activities, the business guest also makes
use of the catering industry, but they generally have a shorter presence in the city.

53
Both business and leisure visitors mainly come from Belgium, Germany, France, England and
America. It should be noted here that the business visitor is more diverse and comes from other parts of the
world such as Asia and Australia.
Leisure visitors from Belgium, Germany and France often combine their visit with the coast, while
Americans and English mainly determine their visit to Leiden based on history. Around 1600 Leiden was home
to various English separatists (The Pilgrims) who could live, work and practice their faith in Leiden in complete
freedom. As a result, many descendants come to visit the city of Leiden to return to their roots.
The visitors from America and England are visitors who come to the city by organized tours. Organized
tours do not generally occur in Leiden and are therefore more an exception to the rule than that this is done
structurally. In general, the tour groups that visit Leiden are mainly self-organized visits consisting of couples
or small groups.
5.1.2. Positive aspects of tourism in Leiden
The fact that Leiden does not receive many large groups of tourists is seen by visitors as a great advantage.
This has to do with the fact that a) Leiden does not have many hotel places available and b) Leiden can be
visited in a reasonably short time. As a result, visitors do not stay in the centre for a long time, so the crowds
remain relatively limited. A visit to Leiden is often combined with a visit to the region, such as the flower bulb
region and the beach, according to Respondent 1. The small-scale nature of Leiden also means that visitors
generally feel safer than in a large city like Amsterdam, says Respondent 6. This is mainly explained by the
fact that the centre remains clear and easy to handle if something should go wrong.
The small character that
Leiden radiates is, according to
Respondent 7, one of the main
reasons why visitors find their way
to Leiden. Because of the small
scale, the pressure on public
transport is also less pronounced
because the distances in the centre
are easy to walk (see Figure 12).
For visitors arriving by car, Leiden
has two large parking garages and
one large parking lot on the
Haagweg. The latter even offers the
option of a free shuttle bus to the city for free, something that is much appreciated by visitors. In addition,
visitors find the parking rates favourable compared to a city like Amsterdam.
An additional positive aspect, according to visitors, is that Leiden mainly focuses on small shops and
boutiques. These smaller shops attract a specific type of tourist and thus rule out the real shopping tourism of
Figure 12: maximum walking distance from west to east (Google Maps, 2021)

54
the larger chains. For example, Respondent 3 states: "I think that our visitors also think that shops such as
ZARA and Perry Sport, yes how do you say that; Been There, Done That. And that they do not want that." It is
added that visitors are more likely to go for a combination of museums, canal cruise, food and drink than to
come for shopping.
The highest priority of visitors and also the biggest positive aspect of the visit is the versatile culture
and heritage. All respondents indicated that visitors mainly come to the city of Leiden to enjoy the 13 national
museums and the cultural heritage that Leiden has to offer. Respondent 7 says about this: "The people who
come now call it an open-air museum." Visitors particularly notice the surprise effect of the city with its 35
courtyards. In addition, the city of Leiden has the oldest botanical garden in the Netherlands, the Hortus
Botanicus Leiden.
The Hortus Botanicus, like much of the heritage in Leiden, is owned by Leiden University. The
university in Leiden is the oldest in the Netherlands and therefore ensures that the city is a real student city.
According to visitors, Leiden is more attractive because this and creates a certain conviviality. "One in five
walking around here is a student ... they're just reasonable people you can just talk to. When you walk around
in The Hague, for example, it is all much grimmer.", says Respondent 1. Being a student city, therefore, means
that people feel more comfortable in the environment in which they reside.
Leiden also has a good business position because of the university and the BioScience Park. From an
international point of view, many scientists come to Leiden for the university and the European Space Research
and Technology Centre (ESTEC). In addition, there are many medical and internationally oriented companies
at the BioScience Park, such as Janssen Biologics BV.
All in all, it can be said that visitors to Leiden are mainly interested in the culture and heritage of
Leiden, such as the various museums and the courtyards. Besides, Leiden's business position is important due
to the international character of the university and the established companies. According to visitors, the city is
still quiet that it is pleasant to come and visit.
5.1.3. Negative aspects of tourism in Leiden
The pleasant visit experienced by visitors does have some caveats. Some comments were made in particular
about the environment and the public space. First, it is noted that the city centre of Leiden is not always clean,
for example, parts near the Morsstraat and some narrow alleys where garbage accumulates. Also, some parks,
such as the Van der Werfpark, are not always neat because of their use. According to Respondent 7, this can
be better maintained. It is also indicated that visitors find the heritage beautiful, but that some buildings are
very neglected. These are buildings that function as student accommodation and where hardly any maintenance
is carried out.
In addition, there are no public toilets in the public space. This was already a concern before the Covid-
19 crisis, but now that the restaurants are closed, visitors have difficulty finding a public toilet. The platform
‘Gehandicapten Leiden’ (disabled Leiden) has also written a letter to the Municipal Executive about this.
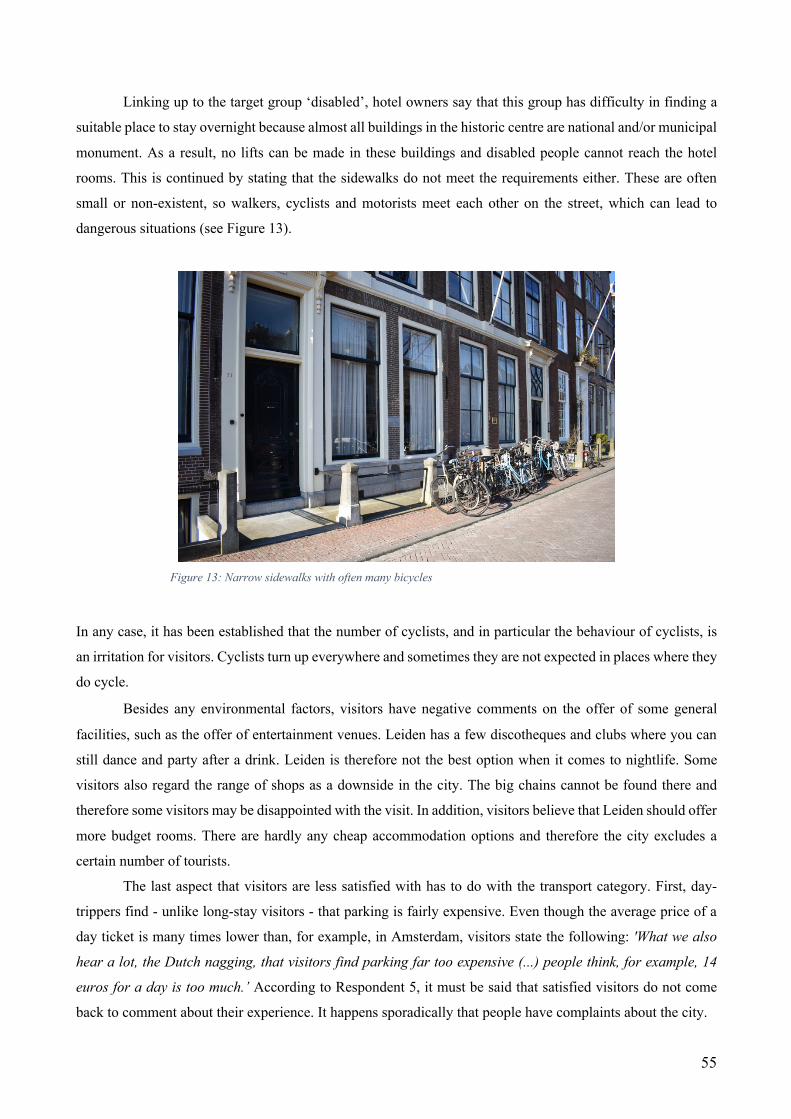
55
Linking up to the target group ‘disabled’, hotel owners say that this group has difficulty in finding a
suitable place to stay overnight because almost all buildings in the historic centre are national and/or municipal
monument. As a result, no lifts can be made in these buildings and disabled people cannot reach the hotel
rooms. This is continued by stating that the sidewalks do not meet the requirements either. These are often
small or non-existent, so walkers, cyclists and motorists meet each other on the street, which can lead to
dangerous situations (see Figure 13).
Figure 13: Narrow sidewalks with often many bicycles
In any case, it has been established that the number of cyclists, and in particular the behaviour of cyclists, is
an irritation for visitors. Cyclists turn up everywhere and sometimes they are not expected in places where they
do cycle.
Besides any environmental factors, visitors have negative comments on the offer of some general
facilities, such as the offer of entertainment venues. Leiden has a few discotheques and clubs where you can
still dance and party after a drink. Leiden is therefore not the best option when it comes to nightlife. Some
visitors also regard the range of shops as a downside in the city. The big chains cannot be found there and
therefore some visitors may be disappointed with the visit. In addition, visitors believe that Leiden should offer
more budget rooms. There are hardly any cheap accommodation options and therefore the city excludes a
certain number of tourists.
The last aspect that visitors are less satisfied with has to do with the transport category. First, day-
trippers find - unlike long-stay visitors - that parking is fairly expensive. Even though the average price of a
day ticket is many times lower than, for example, in Amsterdam, visitors state the following: 'What we also
hear a lot, the Dutch nagging, that visitors find parking far too expensive (...) people think, for example, 14
euros for a day is too much.’ According to Respondent 5, it must be said that satisfied visitors do not come
back to comment about their experience. It happens sporadically that people have complaints about the city.
56
The only thing that the international visitors find consistently annoying is that public transport uses
the OV chip card and it is not possible to pay cash in buses. However, it should be noted that this is a national
issue and cannot be resolved through local government intervention.
5.1.4. Indicators of overtourism in Leiden according to visitors
Indicators that mainly determine the degree of overtourism for visitors are the presence of the number of
tourists and the extent to which original residents still live in the city centre. Respondent 7 says: "When we
spoke to someone who said, no residents live in this street anymore. Then I think it’s annoying. if you live on
a street where you no longer have any real residents." The absence of residents is closely related to what has
been said by all respondents about the presence of Airbnb’s. According to the respondents, the growth of
Airbnb is partly responsible for the overtourism that is experienced. Respondent 6 calls this ‘unregulated
tourism’, tourism that cannot be registered and regulated due to the presence of Airbnb. It must be said that
these opinions come from hotel owners and can therefore be biased and distorted. The visitor has little to do
with this and only observes what can be seen on the street. Visitors are not bothered by the crowds in this
regard. According to the visitor, Leiden is a pleasant city that you can visit in peace. According to them, there
is no question of overtourism. It was said, however, that Leiden should try to stick to its own identity, i.e.,
remain small-scale, focus on the knowledge and culture of the city and should not be influenced by a large city
like Amsterdam.
While Amsterdam needs several centres, this is certainly not the case for the city of Leiden, according
to Respondent 2. According to Respondent 5, this is because Leiden mainly focuses on an older target group
(read 50 and older). A target group of which people generally experience less inconvenience. Visitors only
experience the crowds on the water. On a summer day, visitors flock to Leiden with their boat to enjoy the
Leiden canals and moats. In combination with the tour boats, the boat rental and the local population, it
becomes too busy at such a time and people prefer to leave the city. Respondent 1 says: "On the water, you
see that in extremes because space there is very limited if that is going to happen on the street, I don't think
that would be good."
All in all, visitors are very pleased with the city of Leiden and, according to them, overtourism is not
an issue yet. If this target group can enjoy the culture, the heritage and the environment in peace, they are
satisfied. The business position of the city also plays a major role in this because about 50% of the hotel visitor
has a business purpose. In addition, it is said that if there are no longer people from the region living in the city
centre, visitors will be annoyed. An exodus of residents could therefore mean that overtourism is developing.
57
5.1.5. Reflection
At the time of the reference moment, just before the Covid-19 crisis, there was, according to the visitor, not a
case of overtourism. Leiden is quiet and excels in its small-scale. It is seen as an advantage that Leiden is very
attractive to visitors who are on average older than 50 and therefore cause less nuisance. This target group
visits a museum, takes a cruise, eats at a restaurant and then returns to the hotel. Hanging and screaming visitors
are therefore almost non-existent.
Looking at the type of visitor, it appears that few large-organized groups come to Leiden. As a result,
the massiveness of the visit is limited, and it also looks calmer. According to Cohen's (1982) categorization,
the Leiden visitor can be classified as the individual mass tourist, a visitor who is influenced by information
from organizations but who still has a certain degree of control over the journey. This is expressed in looking
up information about the city and then visiting tourist attractions on personal initiative.
This individual visitor especially values culture, heritage and business position. These aspects are
therefore the most important requirements when looking at the City Brand Model.
5.2. Satisfaction of residents with tourism in Leiden
This paragraph discusses the results of the neighbourhood survey. In the survey, that was provided to more
than 2000 residents of the city centre of Leiden, questions were asked about the relationship between tourism
and their perceived safety (5.2.1.), their well-being and social cohesion (5.2.2.), the environment (5.2.3.), the
culture and heritage (5.2.4.), and the government (5.2.5.). Questions were also asked about welfare during the
Covid-19 crisis and a comparison is made with the situation just before the presence of Covid-19.
Before the results are analysed and interpreted, a representativeness analysis was conducted for the
personal characteristics. This analysis has shown that the personal characteristics of home, education and age
must be weighed. The explicit explanation of this can be found in Appendix VI. When interpreting the quality-
of-life elements, this weighting must be considered.
5.2.1. Safety
The residents' sense of safety is measured based on four statements and a general final grade for safety. Before
the final mark can be explained, it is important to identify the differences in personal characteristics. If, for
example, the classification by age is considered, it can be said that the 65+ feel the least safe when it comes to
their perceived safety in combination with the number of tourists. The 65+ gives the general safety on average
a 7.4, while the age group 27-39 years gives a 7.8 on average. However, it should be noted that these differences
are not statistically significant (p. 0.204) and are therefore a coincidence.
Men and women rate safety roughly equally, on average at 7.63 and 7.57 respectively. The difference
is minimal and not statistically significant (p. 0.713). The distribution by the level of education, on the other
hand, is statistically significant (p. 014) and explains that the more educated people are, the safer they feel in
the city of Leiden. The type of home and how long respondents have been living in Leiden do not seem to

58
influence the degree of perceived safety. These rates are all-around 7.5 on average. It should be noted here that
the rates for how long respondents have been living in Leiden differ statistical significantly (p. 0.424), while
the rates for the type of home do not (p. <0.001). In general, all respondents give on average a 7.6 for safety.
24.5% of the grade for safety in the presence of tourists can be explained by the four statements that
were asked about this. The analysis shows that noise nuisance has the greatest influence on the perceived
safety. This means that the more people agree with the statement, the more the average grade decreases on
average by 0.245. The same negative effect is seen for the category ‘other nuisance’ if people start to
experience more other nuisance, the average grade will decrease on average by 0.178. The crime that rises due
to tourism also harms the safety grade. The more people agree with the statement about crime, the lower the
safety grade will be (-0.097 on average). It should be noted that this coefficient is not statistically significant
(p. 0.067) and is, therefore, a coincidence. There is one factor that has a positive influence on the safety grade.
If residents prefer the presence of tourists, this has a positive influence on the safety rating (+0.102). This
relationship is also statistically significant (p. 0.035).
5.2.2. Well-being and social cohesion
The well-being and social cohesion in combination with the presence of tourists are rated by the residents with
a 7.1 on average. However, this grade has some personal differences. For example, younger respondents are
generally more satisfied with the social cohesion in combination with the presence of tourists than the elderly.
You can also see these differences in the level of education. People with a lower level of education (average
score of 6.75) are less satisfied with social cohesion than people with a higher education level (average score
of 7.13). The same difference can also be observed in gender. Men are more satisfied with social cohesion than
women. No difference can be observed in this respect for the variable 'type of home'. The above differences
are all not statistically significant and are therefore a coincidence. Only one variable is statistically significantly
different (p. 008) and that is the duration of living in the city of Leiden. Respondents who live longer in the
city of Leiden experience more social cohesion.
Figure 14: Ranking of the positive and negative aspects of safety

59
The average grade of all respondents for this category can be explained by 31% by the six statements
that were asked in the survey. Two items with a more positive attitude have a negative influence on the average
grade. These are the extent to which residents feel that the employment and money that tourism brings is
important and the extent to which residents feel the need to move away in the presence of tourists. The other
four items have a positive influence on the grade for social cohesion. The presence of tourists and the extent
to which residents benefit from this has the most influence on the average grade (+0.273). The degree to which
residents feel free in their environment also has a strong positive influence on the average grade. If residents
feel freer, the average grade will increase on average by 0.208. The other items have a moderate influence on
social cohesion (see Appendix VIII-II).
Figure 15: Ranking of the positive and negative aspects of well-being and social cohesion
5.2.3. Environment
The influence of tourism on the environment is rated by the residents on average by 7.15. The internal
differences can be explained by the ANOVA-test based on the different personality traits (see Appendix VIII-
III). The environment is generally less appreciated by elderly respondents. With an on average score of 6.93
for the 65+ category and an average score of 7.38 for the 18-26 age category, a clear difference is demonstrable.
With a significance of 0.033, the difference is also statistically significant. Only the variable age is statistically
significant for this category, the other variables are not statistically significant and are therefore a coincidence.
These variables are gender, education, living and living length. Regarding gender, there are hardly any
differences in the general grade concerning the environment. About education, the higher educated rate the
environment better than the less educated. It can also be seen that tenants appreciate the environment better
(on average: 7.21) than respondents with an owner-occupied home (on average: 7.09). No clear differences are
demonstrable concerning living length. Respondents who have only recently lived in Leiden give roughly the

60
same grade as respondents who have lived in Leiden for a longer period. Again, these averages are not
statistically significant, so firm conclusions about these differences cannot be drawn.
When looking at the influence of the independent variables on the final mark for the environment, it
can be concluded that the degree of maintenance of the landscaping has the greatest effect on the degree of
satisfaction with the environment. In addition, the number of green spaces also has a positive effect on this
satisfaction. The shops that are present in the city have hardly any influence on the satisfaction with the
environment and is also the only ones that deviate from the significance of the coefficient (p. 0.767). The extent
to which tourists pollute the city centre has a major negative effect on the environment (-0.176 on average),
partly as the unpleasantness of life in the city when tourists are present (-0.156 on average). The multiple
regression analysis performed on this indicates that more than 41.7% of the variance of the variable ‘Grade for
the environment' is explained by the five independent variables, and the F-test also shows that the model is
statistically significant in its entirety.
Figure 16: Ranking of the positive and negative aspects of environmental elements
5.2.4. Culture and Heritage
According to visitors, culture and heritage are the two most important criteria for a good visit. Residents also
attach the greatest value to these two items, because culture and heritage are rated on average at 8.02 and thus
has the highest average of all items tested. If we look at the average grade per age group, in case people get
older, heritage and culture are valued less. With a significance of <0.001, these differences are statistically
significant, and it can be stated with certainty that older people value heritage and culture less. As with the
other categories, there is hardly any difference between gender and it can be said that women and men think
the same about culture and heritage. However, a significance of 0.562 on this part means that the difference is
a coincidence.
As the literature has shown, it is estimated that the higher educated will be more interested in heritage
and culture. It is plausible that the higher educated will give a higher mark for this category. Although this has
also been shown by the statistics (on average: 8.06 higher educated versus 7.42 lower educated), this
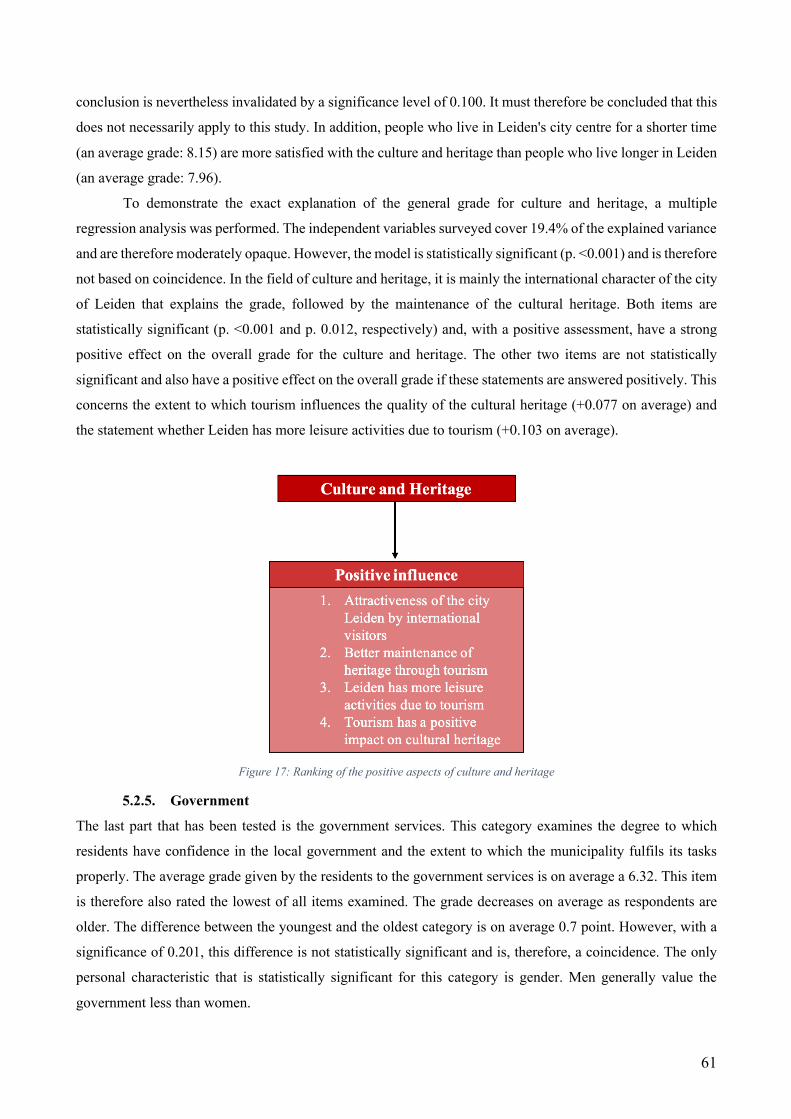
61
conclusion is nevertheless invalidated by a significance level of 0.100. It must therefore be concluded that this
does not necessarily apply to this study. In addition, people who live in Leiden's city centre for a shorter time
(an average grade: 8.15) are more satisfied with the culture and heritage than people who live longer in Leiden
(an average grade: 7.96).
To demonstrate the exact explanation of the general grade for culture and heritage, a multiple
regression analysis was performed. The independent variables surveyed cover 19.4% of the explained variance
and are therefore moderately opaque. However, the model is statistically significant (p. <0.001) and is therefore
not based on coincidence. In the field of culture and heritage, it is mainly the international character of the city
of Leiden that explains the grade, followed by the maintenance of the cultural heritage. Both items are
statistically significant (p. <0.001 and p. 0.012, respectively) and, with a positive assessment, have a strong
positive effect on the overall grade for the culture and heritage. The other two items are not statistically
significant and also have a positive effect on the overall grade if these statements are answered positively. This
concerns the extent to which tourism influences the quality of the cultural heritage (+0.077 on average) and
the statement whether Leiden has more leisure activities due to tourism (+0.103 on average).
Figure 17: Ranking of the positive aspects of culture and heritage
5.2.5. Government
The last part that has been tested is the government services. This category examines the degree to which
residents have confidence in the local government and the extent to which the municipality fulfils its tasks
properly. The average grade given by the residents to the government services is on average a 6.32. This item
is therefore also rated the lowest of all items examined. The grade decreases on average as respondents are
older. The difference between the youngest and the oldest category is on average 0.7 point. However, with a
significance of 0.201, this difference is not statistically significant and is, therefore, a coincidence. The only
personal characteristic that is statistically significant for this category is gender. Men generally value the
government less than women.
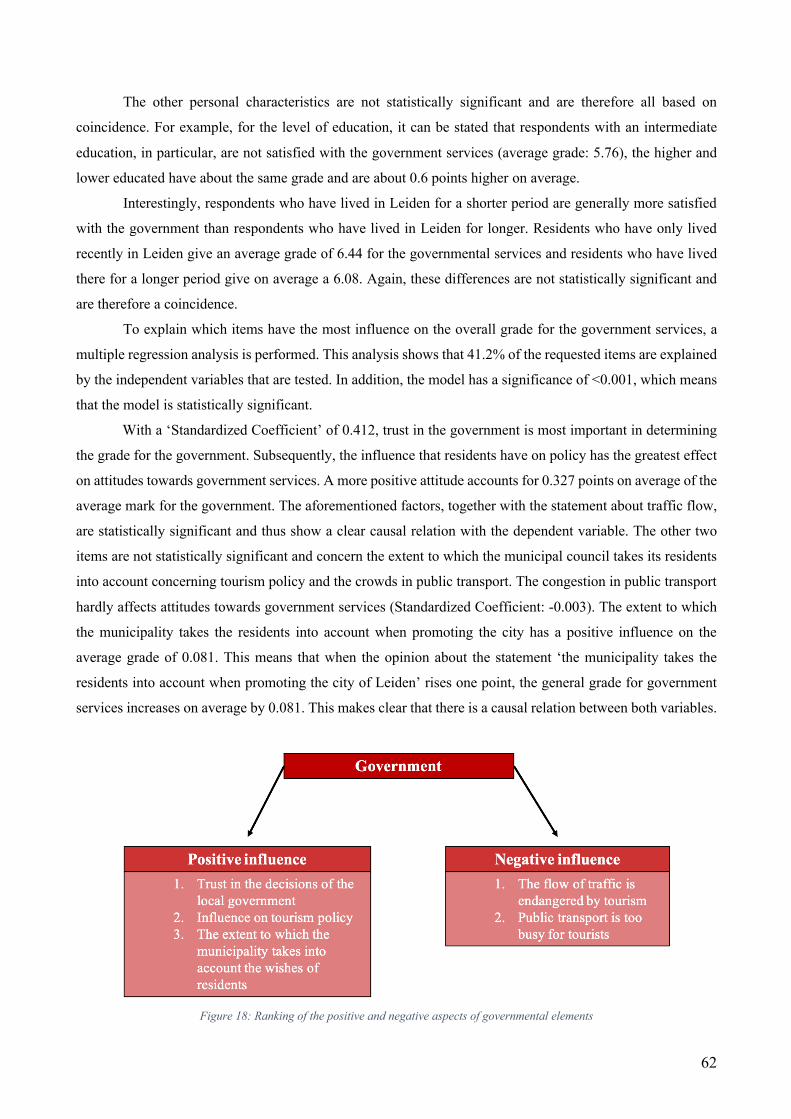
62
The other personal characteristics are not statistically significant and are therefore all based on
coincidence. For example, for the level of education, it can be stated that respondents with an intermediate
education, in particular, are not satisfied with the government services (average grade: 5.76), the higher and
lower educated have about the same grade and are about 0.6 points higher on average.
Interestingly, respondents who have lived in Leiden for a shorter period are generally more satisfied
with the government than respondents who have lived in Leiden for longer. Residents who have only lived
recently in Leiden give an average grade of 6.44 for the governmental services and residents who have lived
there for a longer period give on average a 6.08. Again, these differences are not statistically significant and
are therefore a coincidence.
To explain which items have the most influence on the overall grade for the government services, a
multiple regression analysis is performed. This analysis shows that 41.2% of the requested items are explained
by the independent variables that are tested. In addition, the model has a significance of <0.001, which means
that the model is statistically significant.
With a ‘Standardized Coefficient’ of 0.412, trust in the government is most important in determining
the grade for the government. Subsequently, the influence that residents have on policy has the greatest effect
on attitudes towards government services. A more positive attitude accounts for 0.327 points on average of the
average mark for the government. The aforementioned factors, together with the statement about traffic flow,
are statistically significant and thus show a clear causal relation with the dependent variable. The other two
items are not statistically significant and concern the extent to which the municipal council takes its residents
into account concerning tourism policy and the crowds in public transport. The congestion in public transport
hardly affects attitudes towards government services (Standardized Coefficient: -0.003). The extent to which
the municipality takes the residents into account when promoting the city has a positive influence on the
average grade of 0.081. This means that when the opinion about the statement ‘the municipality takes the
residents into account when promoting the city of Leiden’ rises one point, the general grade for government
services increases on average by 0.081. This makes clear that there is a causal relation between both variables.
Figure 18: Ranking of the positive and negative aspects of governmental elements

63
5.2.6. Covid-19 for reference
With the presence of Covid-19, cities have changed overnight. From busy tourist areas into quiet places where
almost only locals come. For the research into overtourism, this is a favourable situation to be able to map out
how residents experience this. Is Leiden a better place to live during the time of Covid-19 or is the situation
before the Covid-19 better for the quality of life?
In the present time, so in the absence of visitors, the overall quality of life in the city is rated on average
by a 6.64. This mean is statistical significantly (p. 0.013) lower compared to the mean before the Covid-19
crisis, when the quality of life was rated with an average score of 7.21 (see Appendix IX). The difference is
also in line with the residents' view of tourism in Leiden. Only 27.9% of the residents of the city centre think
that Leiden is too crowded before the Covid-19 crisis. In addition, 22.1% of these residents believe that their
quality of life is deteriorating. The reverse is visible: the majority of residents of Leiden's city centre believe
that tourism has a positive influence on the city (57.6%). According to them, there is no question of overtourism
and this is confirmed with the result that
64.7% of the respondents explicitly
indicated this in the survey (See Figure
19). However, the survey asked how
overtourism could be prevented in the
future. A question was asked about the
possibility of setting a limit to prevent
the influx of visitors. The residents are
divided about this: 42.1% disagree with
this, 22.1% have no clear opinion and
35.8% think that a limit on the number
of visitors can be a good addition.
The residents are clearer about the extent to which the neighbourhood has changed in recent years.
Due to the presence of tourists, the neighbourhood has not changed in recent years. In fact, 59.6% of the
respondents think that the neighbourhood has remained the same due to the presence of tourists. And based on
this, residents believe that the number of tourists that Leiden should receive should be even more. 41.1% of
the respondents indicate that more visitors are welcome in the city centre. 36% think that the situation was just
right before the Covid-19 crisis and 22.8% would rather see fewer visitors coming to Leiden.
5.2.7. Reflection
All in all, it can be said that residents of Leiden have a positive attitude towards visitors who want to visit the
city. Residents feel that the situation was better before the Covid-19 crisis than during, indicating that visitors
are more than welcome in the city centre. Looking at the Host Irritation model: ‘Doxey’s Irridex’, it can be
said that visitors are still welcome and that no saturation point has yet been reached. This means that Leiden
is in the Apathy stage, which means that city marketing is very important and the tourism industry is growing
Figure 19: Degree of overtourism in Leiden

64
in power. It should be noted, however, that in this model, Leiden is leaning more towards the saturation stage.
This has to do with the fact that there are already audible noises that state that there is overtourism. In addition,
it is also characteristic for the saturation stage that house prices are rising sharply, which is also the case in
Leiden. Even though more than the majority say that there is no overtourism yet, almost a quarter (23.4%) says
it is already noticeable. Caution seems to be warranted.
Looking at the specific characteristics of overtourism, heritage and culture are numerically the best-valued
factors of liveability in Leiden. The item safety is in second place, followed by environmental factors, social
cohesion and closed with the lowest rated item government services. The next section examines the extent to
which these items affect the overall quality of life, to determine where the focus of urban policy should be.
5.3. Influence of tourism on the quality of life
In this paragraph, the research results of the visitor and resident data are presented side by side to be able to
conclude where the pros and cons of the quality of life lie. First, the human elements of the quality of life will
be examined (5.3.1.), then the environmental factors that influence the quality of life will be inspected (5.3.2.)
and will be concluded with the person environmental fit (5.3.3.). Based on a multiple regression analysis of
the quality of life and the tested elements of this quality of life (see Appendix VIII-VI), a Top 5 has been made
from the factor with the most influence up to the factor with the least influence (see Figure 22). Based on this,
it can be determined for the residents where the focus of the tourism policy should be (5.3.4.).
The most important liveability items for visitors are determined using a tally sheet. The 11 items
resulting from the literature study are compared with the interviews. If an item appears in the text as an
important item for the visitor, the corresponding item will be counted. This gives a ranking from most common
item to least common item. Subsequently, the rankings of the resident and the visitor will be placed side by
side.
5.3.1. Liveability regarding human elements
According to the literature, the liveability of the human element encompasses the aspects of social bonding
and the business world. The residents consider the human element of the quality of life least important when
looking at the influence of social cohesion on the overall quality of life. The multiple regression analysis (see
Appendix VIII) shows that when a resident grades social cohesion one whole point better on a scale from one
to ten, the grade for the total quality of life only increases on average by 0.136. This causal relation is
statistically significant (p. 0.011) and thus indicates that this increase is not a coincidence. A final grade was
not specifically requested for the item ‘business position’. However, residents believe that the presence of
many different nationalities has a positive influence on the attractiveness of the city. What may indicate a
positive outlook on the business position. However, this has not been proven.
Visitors also find this element of the quality of life the least important. In the six interviews conducted,
both items appear only three times. This concerns the interaction with residents and the business position. One

65
of the respondents did indicate that 50% of the capacity is occupied by business visitors. In addition, Leiden
will be the 'European City of Science' in 2022 and this item will therefore become increasingly important for
the city of Leiden.
Looking at the future policy in this regard, it can be concluded that these two items have little or no
influence on the experienced overtourism. Visitors and residents have the least interest in this and these factors
hardly influence the overall quality of life. Despite this, Leiden is the European city of Science in 2022. It is
interesting to keep an eye on the item 'business position' in particular. In 2019, Leiden was in 30th place for a
city with the best business position. As a result, Leiden's business position is relatively low compared to the
major cities of the Netherlands. With the title European City of Science, Leiden tries to strengthen this business
position in the hope that more business visitors will visit Leiden (this is based on a situation in which the
Covid-19 virus is under control). This will go hand in hand with fuller hotel occupancy and a busier city centre,
which means that the item 'business position' can play a more important role in determining the quality of life
for residents.
All in all, this is not yet the case at present. The policy does not need to be adjusted to this for the time
being. The business position and social cohesion are not the priority of both the resident and the visitor.
Overtourism does not appear to be an issue based on these two factors.
5.3.2. Liveability regarding environmental elements
The environmental factors seem to have more influence on the perceived quality of life in Leiden's city centre.
According to the literature, this category consists of nature, shopping facilities, transport, government, the
environment and heritage. Looking at the respondents about the visitors' opinion, visitors especially value the
nature that can be found in Leiden, the general environment and the heritage. Visitors consider the environment
and heritage to be the most important and after that comes the item ‘nature’. These factors are mainly expressed
in the visits to the various parks in Leiden, the walks through the historic centre of Leiden and the overall
positive impression of the area.
The environmental factors of quality of life are also more important for residents than the human
elements. This can be deduced from the multiple regression analysis that was performed (see Appendix VIII).
In the model, which determines the variance of the variable ‘quality of life rate’ for 32.9%, it is stated that
heritage is the second most important / most influential element for determining the quality-of-life rate (+0.186
on average). The environment plays a less important role in this with an average ‘Standardized Coefficient’ of
0.072. However, it should be noted that the causal relation between the quality-of-life grade and the grade for
heritage is statistically significant, while the regressive coefficient between the quality-of-life grade and the
grade for the environment is not. As a result, the regressive coefficient between the environment and the
liveability rate is coincidental.
Unlike visitors, residents do value the influence of the government on tourism policy. Visitors hardly
ever named this category, while residents appreciate this item the least. There is, therefore, room for
improvement for this category. However, the multiple regression analysis shows that a higher government

66
rating does not by definition lead to increased satisfaction of the perceived quality of life in the city centre
(+0.151 on average). Investing in these variables does not immediately lead to major progress in the quality of
life and is, therefore, in fourth place out of five in determining the most influential factor.
The shopping facilities and transport are considered less interesting by both residents and visitors and
therefore have little influence on the perceived quality of life in Leiden. It has been said that the shopping
facilities meet the visitor's wishes, but that shopping for the visitor is often not the explicit goal of a visit to
Leiden. In addition, Leiden is easy to walk, making public transport less a factor that influences overtourism.
In conclusion for environmental factors of the quality of life, it can be stated that this factor has more
influence on the perceived quality of life and overtourism in Leiden. Nature, environment and heritage are
points of attention to include in decision-making regarding overtourism. Both residents and visitors attach
great value to this, it must be said that heritage is the most important, followed by the environment, nature and
the municipality.
5.3.3. Liveability regarding person environmental fit
The category that has the most influence on the perceived liveability – and can therefore also strongly influence
the perceived overtourism – are the elements that belong to the person environmental fit of the liveability.
These elements are safety, image and culture. For both the visitor and the resident, safety is one of the top three
most important elements for the perceived quality of life. This is the most important item for residents, with
an average ‘Standardized Coefficient’ of 0.242 (p. <0.001). This means that when the average safety grade
increases or decreases by one point (out of ten), this makes a 0.242-point difference for the overall quality of
life on average. This category therefore strongly determines the quality of life in the city. Current safety is
rated by residents with a 7.6, which means that there is still some improvement to be made in terms of safety.
The profit can have a direct influence on the overall quality of life. It is therefore important for Leiden to pay
attention to safety to strengthen this item, which has a positive effect on the overall quality of life.
Safety is also essential for visitors. Analysis of the interviews with hotel owners shows that visitors
come to visit Leiden partly because of the small scale of the city, which makes them feel more pleasant and
safe. Leiden excels in this element. It is therefore important to continue to guarantee this high standard of
safety.
In addition to safety, both residents and visitors consider the cultural aspect to be very important. For
visitors, this is in Place 1 and for residents this category (in combination with heritage) is in Place 2. As far as
culture is concerned, Leiden does not need to change much, visitors are satisfied with this and residents rate
this category on average by 8.01. The influence that culture has on the overall quality of life is statistically
significant. If culture is rated one point higher or lower on average (on a scale from one to ten), then the average
quality of life rating will increase or decrease on average by 0.186 (p. <0.001). It is therefore important that
the focus on culture is maintained to keep the quality of life rating good and to satisfy visitors.
The last item that belongs to the ‘person environmental fit’ category is the image of the city. For both
residents and visitors, this factor has less influence on the quality of life and any overtourism, than, for example,

67
culture and safety. It is stated, however, that the image of the city of Leiden is mainly determined by the
tranquillity and the small-scale that Leiden radiates. This image is mainly due to the many museums, the history
and because the focus from the city is mainly on the target group 40 - 50+.
5.3.4. Ranking of the liveability items
Based on the above data, a ranking can be made. This ranking can be confirmed by the results of the surveys
with residents and the interviews with hotel owners. The survey asked for the Top 3 most important quality of
life factors. Residents could choose between safety, image, culture (and heritage), nature, shopping facilities,
transport options, government services, environment, social interaction and the business position. This top
three is awarded three, two or one point(s). If a respondent has placed an item in Position 1 by a respondent,
this item will receive three points because this item is the most important. An item in Position 2 gets two points
and an item in Position 3 gets one point. This results in a certain ranking, which can be seen in Figure 20.
Figure 20: Ranking of the liveability items for residents
The figure shows that safety is the most important quality of life for residents, followed by culture and heritage.
The top three ends with the environment.
The same Top 3 can be made for visitors. Figure 21 shows that culture and heritage is the most
important item for visitors, followed by safety, nature and the environment. Unlike residents, the business
position and the shopping facilities have more priority for visitors.
0
100
200
300
400
500
600
700
Safety
Culture
& Heri
tage
Enviro
nment
Nature
Social i
nterac
tion
Transpo
rt
Busines
s posi
tion
Shopp
ing fa
cilitie
s
Govern
ment se
rvices
Imago
Ranking of the liveability items for residents
#1 #2 #3
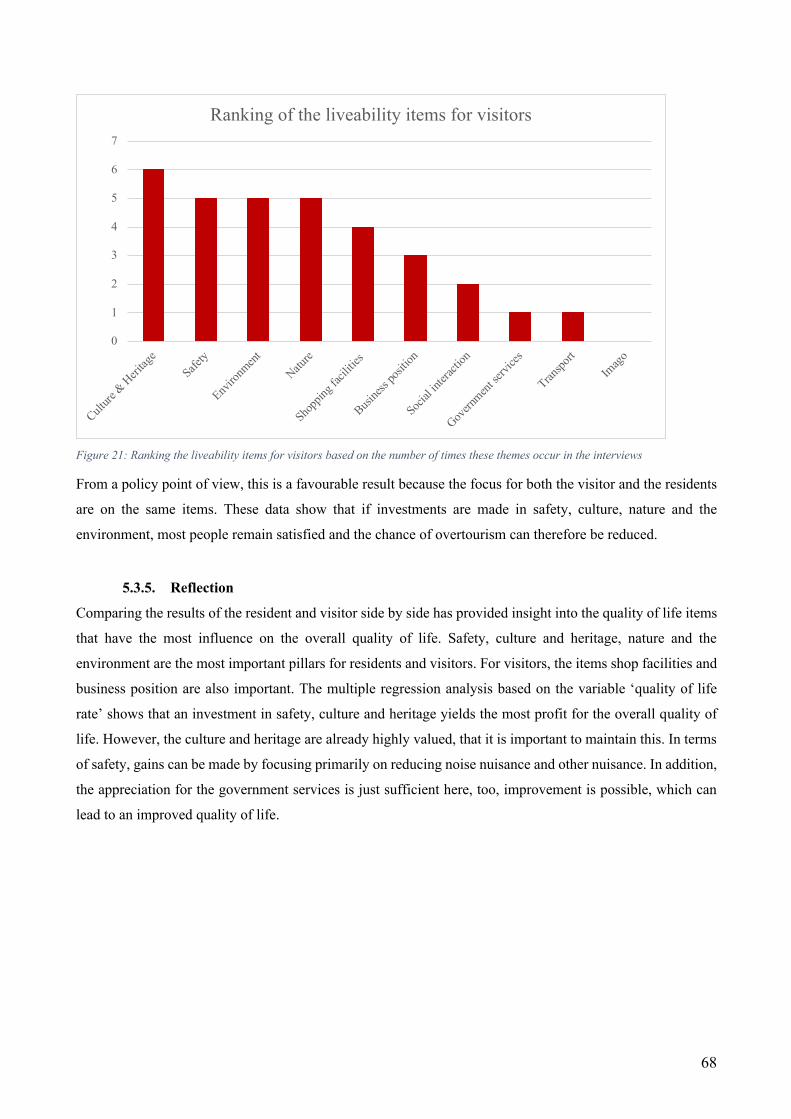
68
Figure 21: Ranking the liveability items for visitors based on the number of times these themes occur in the interviews
From a policy point of view, this is a favourable result because the focus for both the visitor and the residents
are on the same items. These data show that if investments are made in safety, culture, nature and the
environment, most people remain satisfied and the chance of overtourism can therefore be reduced.
5.3.5. Reflection
Comparing the results of the resident and visitor side by side has provided insight into the quality of life items
that have the most influence on the overall quality of life. Safety, culture and heritage, nature and the
environment are the most important pillars for residents and visitors. For visitors, the items shop facilities and
business position are also important. The multiple regression analysis based on the variable ‘quality of life
rate’ shows that an investment in safety, culture and heritage yields the most profit for the overall quality of
life. However, the culture and heritage are already highly valued, that it is important to maintain this. In terms
of safety, gains can be made by focusing primarily on reducing noise nuisance and other nuisance. In addition,
the appreciation for the government services is just sufficient here, too, improvement is possible, which can
lead to an improved quality of life.
0
1
2
3
4
5
6
7
Culture
& Heri
tage
Safety
Enviro
nment
Nature
Shopp
ing fa
cilitie
s
Busines
s posi
tion
Social i
nterac
tion
Govern
ment se
rvices
Transpo
rtIm
ago
Ranking of the liveability items for visitors

69
Figure 2
2: D
egree o
f infl
uence o
f the v
arious te
sted q
uali
ty o
f life
item
s o
n t
he t
otal q
ua
lity o
f lif
e

70
5.4. The role of Leiden Marketing
Based on the results obtained through the visitor and resident research, a conversation was started with Leiden
Marketing to determine how overtourism can be avoided or guided in the future. First, the position of Leiden
Marketing in the playing field of overtourism is determined (5.4.1.). Subsequently, the extent to which the
residents influence urban policy will be examined (5.4.2.), to determine how overtourism can be avoided in
the future (5.4.3.).
5.4.1. Positioning of Leiden Marketing
Leiden marketing is an independent foundation called ‘Stichting Stadspartners Leiden’ (Leiden City Partners
Foundation). The organization consists of various parts, such as a campaign team aimed at branding the image
of Leiden, the VVV, the expat centre and a convention bureau. All have the ultimate goal to increase prosperity
and well-being in the city. As Respondent 8 says: "Establishing your image as a city to create awareness is
the starting point of city marketing". Leiden Marketing tries to contribute to the (visitor) economy, for example,
freeing up money to keep the city cleaner and safer. In addition, an improved economy also ensures that a park
such as the Singelpark can be built and that museums remain open, which also benefits residents.
Leiden marketing is an autonomous organization that is financed both publicly and privately. On the
one hand, this means that basic subsidies are offered from the municipality (is public) for, for example, a tourist
office, assignment subsidies are offered for events such as ‘de Nacht van Ontdekkingen’ (the Night of
Discoveries) and that there is project financing from various programs. On the other hand, Leiden Marketing
also receives contributions from, for example, Rabobank, Arriva and the University of Leiden (is private) to
finance campaigns and branding.
In addition to these two cash flows, there is also a separate arrangement that is facilitated by the
municipality, the hotels of Leiden and Leiden Marketing. This form of financing should be seen as a private
contribution through public channels. For clarification, the city council has decided to make the tourist tax
available to the hotels, who then have to spend it on city marketing. The hotels of Leiden decided to make the
entire amount available to Leiden Marketing. This means that the public money is made available to Leiden
Marketing by private authority. This subsidy is approximately one third of the total funding and is accountable
to the city's entrepreneurs. The entrepreneurs are not clients in this respect. Leiden Marketing is free to spend
the money but to continue the good cooperation, an account is given for the choices made. In the spring of
every year, there is an inventory round, a concept marketing plan is drawn up and the hotels will respond to
this. In addition to consultations with the hotels, twice a year, strategic consultations are held with the hotels
and the supervisory board, where the long-term vision is established. This serves as a guideline for the policy
to be pursued, but in the precise elaboration of this, Leiden Marketing is free to spend the money. Respondent
8 adds to this; "He (Prof. Hospers) once introduced the term ‘liefdevolle verwaarlozing’ (affectionate neglect)
in his book and that is literally what we are doing." This means that the city council is at a distance from the
71
implementation of city marketing. As a result, long-term agreements can be made, and the vision does not
depend on political changes.
The tension between the public and private domain makes decision-making about (tourism) policy an
interesting issue. On the one hand, because of their independence. Leiden Marketing is free to spend the funds
to project they think is good for the city. On the other hand, the question arises to what extent the public interest
is safeguarded in the free use of the money. As a result, the municipality recently started a study into the visitor
economy. This will result in a vision that will serve as a guideline for future tourism policy. Residents will be
involved in the realization of this vision through a public survey.
5.4.2. Influence of residents on policy
From the above, it becomes clear that Leiden Marketing is an independent foundation and is therefore not
obliged to be accountable to residents, the municipality and other stakeholders. There is no such obligation,
but strategic consultations do take place between the various stakeholder to safeguard the general interest.
Leiden Marketing is a social midfield. Often Leiden Marketing sits around the table with residents to hear
residents' noises, but residents are unable to help build or contribute to the policy to be pursued. These
conversations only serve to take stock of the opinion of the residents. This choice was made in particular
because it was found that there is no such thing as a good representation of residents. This has to do with the
fact that the residents of the city centre cannot be seen as a homogeneous group and public opinion can
therefore differ greatly. As Respondent 8 says: "But we cannot use the input of residents at the front as a
leitmotif, because they do not speak with one voice. Every neighbour has a different opinion and there is no
such thing as the inner city resident because those are 15.000 students who really think something different
than a retiree in the Pieterswijk."
However, it is said that one should not be naive, because it is noted that overtourism is increasingly a
topic of discussion in the city. The sentiment must be given a place because it makes no sense to deny this
public opinion. According to Respondent 8, giving a place can be done through a biannual survey on public
opinion about visitors and the state of overtourism. Such surveys should not be conducted too often, as the
residents will then be unable to recognize the large movements. This survey measures public opinion, but the
decision-making on overtourism remains in the hands of organizations such as Leiden Marketing and the
municipality.
5.4.3. Guiding overtourism
The discussion about overtourism has become increasingly present in the public debate in recent years.
Nuisance is experienced and this nuisance cannot be denied. However, the question is where this perceived
nuisance comes from because it cannot be demonstrated that people experience nuisance from visitors. The
question is also whether it is the visitors who cause more crowds or whether it has to do with the growth of
Leiden as a city. In recent years, more and more people have come to live in Leiden and, for example, the
number of terraces has tripled, which means that the public space is experienced differently. Respondent 6

72
adds to this that ‘perception is reality’, so even though there is no actual overtourism, this is raised by images
in the media. The image that one sees in Europe creates fear and residents take over that fear. The problem of
overtourism can be refuted in Leiden, but that does not take away the problem that prevails among the residents.
This observation is supported by Respondent 6, who makes a distinction between the subjective and objective
character of overtourism. It is argued that the psychological dynamics cause people to think that it is too busy
because they hear from others and pick them up from the media. It can be said here that the problem of Leiden
is mainly related to the subjective character of overtourism because there is no question of objective
overtourism. Respondent 8 gives an example of this: "The experience will also be different; the city is now
empty. It is not that it is a busy city that is getting busier. No, it is an empty city that suddenly becomes very
busy again. So the perception, the public opinion, I am a little concerned about that."
So, it's about perception and not actual overtourism. It is added that Leiden does not have a policy on
coaches with many visitors and large groups of visitors chasing an umbrella. The facilities in Leiden do not
link up with this form of tourism and therefore this form of mass tourism is hardly visible. This is mainly due
to the limited number of hotel beds available in Leiden. This number will not increase, provided the Airbnb’s
are controlled. However, this is a municipal task and is therefore not part of Leiden Marketing's portfolio.
In addition to the fact that objective/actual overtourism is not expected in Leiden, it is good to continue
to monitor the subjective character of overtourism. As indicated, this could be a biannual survey, in which the
preferences and annoyances of residents are tested. The results of this can be included in the decision-making
regarding tourism policy. According to Leiden Marketing, mapping public opinion is a government task and
therefore a task for the municipality. Leiden Marketing will hear the results of this in strategic meetings and
try to take this into account as much as possible. According to Leiden Marketing, this is all about
communication with residents and stakeholders. It will have to be explained why certain choices are made and
indicate what advantages this has for the residents. According to Respondent 8, this is mainly the task of Leiden
Marketing. It was indicated that a lot still needs to change and that a lot more attention needs to be paid to the
sustainability of your product and your marketing. Communication to the public is essential for this.
In addition to communication, it is stated that residents should benefit more from their city. Not only
to be able to enjoy the environment more, but also to see what is happening in Leiden regarding tourism. One
way to achieve this is to not only tax the multi-day visit but also the days of people. Think of an entertainment
tax, where a visitor pays a small fee for the use, for example, a museum or a tour boat. The proceeds from this
must then flow back to the city, which is what residents can benefit from. Another option is a discount pass
for Leiden residents. A discount pass with which a discount is obtained on outings and activities in their city.
The reason for this is to keep residents more satisfied and therefore to benefit more from their city. However,
this task is in the hands of the municipality and cannot be taken on by Leiden Marketing.
73
5.4.4. Reflection
This paragraph aims to map out what Leiden Marketing is, how it involves residents in decision-making and
how overtourism can be avoided or guided. It has emerged from this that Leiden Marketing finds itself in a
public and private field of tension. Despite the fact that Leiden Marketing is an independent organization that
does not have to justify itself to a municipality, strategic consultation does takes place in which the vision and
purpose of the municipality are discussed. Even if it is not mandatory for Leiden Marketing to adhere to this,
this vision and goals are nevertheless strongly considered. Obviously to draw a line in the policy to be pursued.
Leiden Marketing is also in conversation with residents to hear voices from public opinion, with the
reason to also keep residents satisfied with the campaigns being conducted in Leiden. Leiden Marketing has a
target group that focuses on knowledge and culture and therefore avoids the nuisance causing visitor. With
this, Leiden tries to influence the visitor who comes to Leiden.
According to Leiden Marketing, there is no question of overtourism, but it is believed that good
communication to residents and benefits for residents can contribute to the (subjective) problem of
overtourism. A biannual survey among residents is also envisaged to continue mapping overtourism and to be
able to establish when the perception of residents changes. This to be able to respond directly to the opinion
of the residents. Maintaining and mapping this opinion is a government task and will therefore not be carried
out by Leiden Marketing.

74

75
Chapter 6 – Conclusion
This chapter lists the main conclusions and briefly reflects on the detailed research. First, an answer will be
given to the main question that was central to this research (6.1.). This will be done based on the five sub-
questions that lead to an answer to the main question. Subsequently, the research will be critically reflected to
be able to make recommendations for following research on overtourism (6.2.).
6.1. Combating and/or guiding overtourism in Leiden
Tourism was one of the largest growing sectors in the Netherlands in 2019. Nowadays, due to the presence of
Covid-19, it is easy to see what the tourism sector means for the Netherlands. Amusement parks, museums
and catering are closed and many entrepreneurs have trouble keeping their businesses profitable. The downside
of the Covid-19 virus is also noticeable in Leiden, and entrepreneurs yearn for visitors to continue paying their
costs. The special contradiction between the current time and 2019, the record year of the number of visitors
to Leiden, is considerable. Overtourism was a topic of discussion in 2019 and cities are trying to adjust their
policy accordingly. Today the situation of overtourism no longer exists and the problem seems to have been
temporarily resolved. However, tourism will return and cities will be used extensively again. Cities are starting
from scratch and this can be anticipated by mapping out the preferences of residents and visitors. This with the
reason to be able to recognize any overtourism at an early stage in the future and to be able to combat the
problem if necessary. In this research, an answer is sought to this problem, so the following question is central:
To what extent can a balance be found - in the field of tourism - between the wishes of the tourists and the will
of the residents of the city of Leiden and how can Leiden Marketing play a significant role in this?
First of all, it should be mentioned that there are several theories about overtourism. The theme has come to
the attention of researchers since the 1990s, but an unambiguous definition cannot yet be given. The extent to
which overtourism takes place is highly subjective and differs per location (Cowell, 2010). The UNWTO
speaks of overtourism as: “The impact of tourism on a destination, or parts, that excessively influences
perceived quality of life of citizens and/or quality of visitors' experiences in a negative way”. It states that the
quality of life of residents and visitors will change negatively when too many visitors are present.
Liveability is thus a contributing factor to the problem of overtourism. Szromek, Hysa and Karasek
(2019) state that the type of tourist who comes to a city also influences the degree to which overtourism can
occur. Young people causing nuisance are a stronger factor for overtourism than older people. This is the same
for Leiden because by focusing on the knowledge and culture visitor, young people are not explicitly recruited
to come to the city. This is different when it comes to new prospective students. This group is actively recruited,
but this group is not seen as a visitor because they do not come to the city for leisure purposes.

76
The results of the liveability survey among residents show that 64.7% of the respondents explicitly
indicate that there is no overtourism in Leiden. In addition, 57.6% of all respondents think that tourism has a
positive influence on the city of Leiden. Only 22.1% of the residents think that Leiden is too busy and that
there is overtourism. It is also clear from the interviews with hotel owners that visitors to the city centre do not
think the city of Leiden is overcrowded. The city is mainly visited because of its small scale and tranquillity.
According to visitors, there is no question of overtourism. According to Beeton (2009), the degree of
overtourism experienced can be divided into certain degrees of irritation, such as the Doxey's Irridex. This
index divides the degree of irritation into five different categories. The categories range from the Euphoria
stage, in which residents have a positive attitude towards visitors, to the Antagonism stage, where an enormous
amount of irritation is experienced. Analysis shows that Leiden is in Phase 2 and already shows characteristics
of Phase 3. This means that residents still have a positive attitude towards visitors and city marketing is still
desirable. However, there are already signals from residents that the city centre is becoming overcrowded,
which is already causing a degree of irritation. The latter means that Phase 3, the irritation stage, is already in
sight.
Caution is advised and public opinion must be considered in order not to increase the level of irritation.
To counter this, Chamberlain (1997) argues that a ‘carrying capacity’, a maximum of human activities that an
area can handle without the area being neglected, the visitor experience deteriorating or the residents becoming
dissatisfied, must be sought. This maximum can be determined with the elements of the City Brand Model by
Merilees et al. (2009). The pillars investigated in this model are very similar to the different types of carrying
capacity, so this model can provide insight into the extent to which overtourism is present. Besides, this model
can detect overtourism at an early stage.
The City Brand Model examines the elements of safety, image, the intention of residents, culture,
social cohesion, the business position, nature, shopping facilities, transport, government, environment and
heritage. According to Leidelmeijer, Van Kamp, Marsman and De Hollander (2003), all these elements
correspond to the quality of life characteristics and therefore say something about the perceived quality of life
within a city centre. In addition, to mapping the liveability of residents and visitors, the City Brand Model has
the advantage that the results can serve as input for local authorities to adjust policy accordingly.
In this study, these items were tested for both residents and visitors. It has emerged that residents
consider safety, culture, heritage, the environment and nature to be the most important for their quality of life.
Residents share this opinion and consider culture, safety, nature and the environment to be the most important.
However, there is a difference in what residents and visitors find important and how they value these items.
Visitors rate the city on average at 8.14 and are therefore generally very satisfied with their visit. A quality
improvement is therefore not necessary for visitors, but it is argued that more public toilets, making the city
centre car-free and making it more accessible to the disabled, for example on the pavements, can lead to quality
improvement. However, according to this target group, there is no question of overtourism.
The residents rate the overall quality of life as lower than the visitors, with an average score of 7.21,
this grade is almost one point lower. 32.9% of this grade is explained by the five factors safety, culture and

77
heritage, social cohesion, environment and government. This shows that residents are most satisfied with the
culture and heritage. These items are on average rated at 8.02. This grade has a strong influence on the overall
quality of life. It is therefore important to keep the supply and maintenance of culture and heritage under the
attention. If this is neglected, it will have major consequences for the overall quality of life.
The item that most influences the overall quality of life is safety. The safety is rated by the residents
on average at 7.6. There is therefore still room for improvement in the safety aspect, an improvement that will
have a major (positive) influence on the overall perceived quality of life. The gains can mainly be achieved
concerning noise nuisance and general nuisance. However, it may be questioned whether this is a nuisance
from tourists or students living in the city centre. By paying more attention to this nuisance, the quality of life
in the city centre will increase more, which in turn creates a higher tolerance towards tourists.
More gains can also be made in the field of social cohesion. This item is rated on average at 7.1 and
has a moderate impact on the overall quality of life. The profit that can be achieved is mainly due to the extent
to which residents benefit from the presence of visitors. By focusing more on this, residents will appreciate the
social interaction better, which leads to an improved quality of life.
The only thing residents do not appreciate is the government services, such as participation and the
degree of involvement in city promotion. With an average grade of 6.32, there is a lot to be gained here. This
grade is mainly determined by the moderate confidence in the local government and the extent to which
residents influence the tourism policy in Leiden. An improvement in this regard will lead to a moderate
improvement in the overall quality of life rate. If the grade for public services increases by one point (out of
ten) the total quality of life increases on average by 0.151 points. However, the most profit can be made here,
and it is sensible to listen to residents to create more support for city marketing purposes.
The latter is also linked to Leiden Marketing, which states that better communication is the ‘key factor’
to be able to combat overtourism. If it is explained why certain choices are made, greater support will be
created. Although Leiden Marketing is not obliged to render this account due to its independent position, it is
necessary to do so. Participation in tourism policy is not applicable, according to Leiden Marketing, because
a public opinion differs greatly. However, the public survey shows that residents think that little account is
taken of residents concerning city marketing and that the influence that residents have on this is also moderate.
There seems to be an enormous profit to be made here, by entering more dialogue with each other and showing
that the opinion is being heard. In addition, it is important to show what has been done with the opinion and to
explain why certain choices are made.
All in all, it can be said that both residents and visitors have never seen overtourism in the city of
Leiden. There are signs that people are starting to find it busier, but this is mainly based on the subjectivity of
overtourism. Hearing and saying leads to people starting to notice it. From an objective point of view, only the
waters in Leiden are overcrowded during the summer season.
Visitors are very satisfied with their visit. If Leiden continues to excel in its culture, safety, nature and
environment, there is nothing to worry about for visitors. Keeping residents satisfied requires more priority.
By seeking more dialogue and strengthening safety, overtourism in Leiden can be combated. In addition, it is

78
important for city marketing to safeguard the image of Leiden. Stick to Leiden's small-scale identity, stay
focused on the quality tourist and keep the masses of people who come to Leiden by coaches out of the city.
Only then tourism will be a blessing and the chance of overtourism will remain virtually nil.
6.2. Critical reflection
The study attempted to find a balance between the preferences of visitors and the will of the residents to be
able to combat or guide overtourism. Some items emerged that, according to residents and visitors, are
important for visiting/living in a city as pleasantly as possible. With these items, advice has been formulated
for Leiden Marketing and for the government to combat any overtourism. However, it is important to reflect
critically on the research to see improvements and gaps for further research. This will be discussed in the next
section (6.2.1.). Recommendations are also made for further research on this topic (6.2.2.).
6.2.1. Research method and choices made
The research into overtourism in Leiden is a so-called mixed methods research. At the time of the study both
qualitative (interviews) and quantitative (survey) research was used. Initially, the research would be largely
quantitative. Both residents and visitors would be asked (by using a survey) about the same about the liveability
items and then the results would be compared. As a result, statistical conclusions could be drawn and something
substantive could be said about the relationship between residents and visitors. Preparation for the study started
in September 2019, a period when the Covid-19 virus did not yet affect society. The original goal was to
conduct this research during my internship at Leiden Marketing. This internship started in March 2020, the
month in which the Netherlands went into lockdown and tourism came to a complete standstill. As a result, it
was no longer relevant to investigate at that time and the investigation came to a halt. Over time, the realization
came that it is interesting to conduct such research because it could demonstrate the ultimate difference
between the presence of visitors and no visitors. However, my internship had already come to an end and there
was no more room to research this. I decided to continue the research under my own title. The choice to
continue had the consequence that I was not able to approach the visitor directly. It was then decided to do
interviews with respondents who have a direct relationship with the visitors, in this case, hotel owners and an
employee of the tourist centre in Leiden. This is an attempt to provide the best possible picture of the
preferences of the visitors. The research among the residents was able to take place in its original form, with
the reason to get the best possible picture of this large target group. This also makes the limitation of the
research visible. First, the data from the survey and the interviews cannot be compared statistically and no firm
conclusions can be drawn about the general wishes. In addition, seven respondents participated in an interview.
These seven respondents represent more than a million visitors that Leiden annually attracts. The results from
the interviews can therefore give a distorted picture of the general population.
In addition, it became clear in the study that the construction between Leiden Marketing and the
municipality is more complex than expected and that Leiden Marketing does not necessarily have to follow

79
the residents' opinion. Leiden Marketing is an independent foundation and therefore determines its own course.
In most municipalities, city marketing is a municipal task and thus covers public opinion. The public interest
in Leiden is covered by the municipality and not by Leiden Marketing, while Leiden Marketing does have a
direct influence on the image of Leiden. A created image that leads to an increase in the number of visitors,
which influences the perceived overtourism of residents. As a result, the final meeting could have taken place
better with the municipality than with Leiden Marketing.
6.2.2. Recommendation for further research
Having a final interview with the municipality is the first piece of advice that can be given for any follow-up
investigation. Only if a municipality has its city marketing in own hand, a conversation can take place with the
city marketing department. This is because a city marketing organization managed by the municipality directly
shares the public interest. In the case of Leiden Marketing, this is not necessarily the case and they do not need
to listen to public opinion formally. An opinion that is essential in combating or guiding overtourism.
In addition - as stated in Section 6.2.1. - this research would be qualitatively better if both residents
and visitors were surveyed. Both target groups are large and therefore a survey is more representative of the
general target group. In addition, statistical conclusions can be drawn about both target groups, making the
research more reliable and valid.
The research also showed that hotel owners mainly see Airbnb as the culprit of the experienced
overtourism. The reason for this is that visitors no longer stay regulated in certain places, but that they can be
found all over the city. A recommendation for further research is to investigate whether Airbnb leads to more
overtourism. Hotel owners are coloured on this issue because Airbnb is a direct competitor of this group.
However, it is plausible that Airbnb could play a role, something that could be further investigated.
It has also been indicated that a hotel stop is one of the options to combat overtourism, the effects
should also be considered here. In addition, it is not yet possible to indicate in numbers what the maximum
capacity of a particular environment is. The aspect of ‘carrying capacity’ seems difficult to discern. A study of
the maximum number of visitors per square meter might be a solution to better map out what a historic centre
can handle in terms of visitors. However, this will have to be investigated if tourism is back to its old level.

80
Bibliography
Aalst, I. van (2014). ‘Als de nacht valt’ (3); de economie van de nacht. Geografie, 5(1), 23-25. Andereck, K.L., Valentine, K.M., Knopf, R.C. & Vogt, C.A. (2005). Residents' perceptions of community tourism
impacts. Annals of Tourism Research, 32(4), 1056-1076. Arrow, K., Bolin, B., Costanza, R., Dasgupta, P., Folke, C., Holling, C.S., Jansson, B-O., Levin, S., Mäler, K.G., Perrings,
C. & Pimentel, D. (1995). Economic growth, carrying capacity, and the environment. Ecological Economics, 15(2), 91-95.
Ashworth, G.J. & Graham, H. (2005), Senses of place: Senses of time, Hampshire: Ashgate. Ashworth, G.J & Voogd, H. (1990). Selling the city. London: Belhaven. Benner, M. (2019). From overtourism to sustainability: A research agenda for qualitative tourism development in the
Adriatic. Heidelberg: Heidelberg University Boeije, H. (2010), Analysis in qualitative research. London: Sage Boer, R. (2007). Brand design: voor beleid in merkidentiteit. Amsterdam: Pearson education Benelux. Boulding, K.E. (2018). Conflict and Defense: A General Theory. Whitefish: Literary Licensing, Llc. Braun, E. (2008). City Marketing: Towards an integrated approach. Rotterdam: Erasmus University Rotterdam. Brida, J.G. & Zapata, S. (2010). Cruise tourism: economic, socio-cultural and environmental impacts. International
Journal of Leisure and Tourism Marketing, 1(3), 205-226. Bryman, A. (2012). Social Research Methods. New York: Oxford University Press. Calaforra, J.M., Fernández-Cortés, A., Sánchez-Martos, F., Gisbert, J. & Pulido-Bosch, A. (2003). Environmental control
for determining human impact and permanent visitor capacity in a potential show cave before tourist use. Environmental Conservation, 30(2), 160-167.
Capocchi, A., Vallone, C., Pierotti, M., Amaduzzi, A. & Capocchi, A. (2019). Overtourism: A Literature Review to Assess Implications and Future Perspectives. Sustainability, 11(12), 1-18.
Centraal Bureau voor de Statistiek [CBS] (2019). Toeristische bestedingen 87,5 miljard euro in 2018. The Hague: Centraal Bureau voor de Statistiek.
Chamberlain, K. (1997). Carrying capacity. UNEP Industry and Environment 8, UNEP, Paris. Chernatony, L. De & Dall’Olmo, R. (1998). Defining a brand: Beyond the literature with experts’ interpretations. Journal
of Marketing Management, 14(5), 417-443. Clifford, N., French, S. & Valentine, G. (2010). Key Methods in Geography. London: SAGE. Cocola-Gant, A. (2018). Tourism Gentrification. In: Handbook of Gentrification Studies by L. Lees and M. Phillips.
Cheltenham: Edward Elgar Publishing Ltd. Cooper, C. (2020). Essentials of Tourism. Londen: SAGE Publications Ltd. Couzy, M. (2018, 10 October). ‘Spreiding toerisme: geschikt wapen of excuus voor groei?’. Het Parool. Retrieved from:
https://www.parool.nl/nieuws/spreiding-toerisme-geschikt-wapen-of-excuus-voor-groei~bccbbf76/?referer=https%3A%2F%2Fwww.google.com %2F
Cowell, R. (2010). Wind power, landscape and strategic, spatial planning – The construction of acceptable locations’ in Wales. Land Use Policy, 27(2). 222-232.
Databank Leiden (2021). Bevolking wijk. Leiden: Databank Leiden in cijfers. Databank Leiden (2021). Inkomen en uitkeringen. Leiden: Databank Leiden in cijfers. Dragin-Jensen, C., Schnittka, O. & Arkil, C. (2016). More options do not always create perceived variety in life:
Attracting new residents with quality- vs. quantity-oriented event portfolios. Cities, 56(1), 55-62. Dwyer L. (2015). Globalization of tourism: Drivers and outcomes. Tourism Recreation Research, 40(3), 326-339 Egresi, I. (2018). "Tourists go home!" - Tourism overcrowding and "tourismophobia" in European cities (Can tourists
and residents still co-habitate in the city?). TAW2018 International Scentific Conference. Retrieved from: https://www.researchgate.net/publication/327883652_Tourists_go_home_-_Tourism_overcrowding_and_tourismophobia_in_European_cities_Can_tourists_and_residents_still_co-habitate_in_the_city
Farnum, J., Hall, T., and Kruger, L.E. (2005), Sense of Place in Natural Resource Recreation and Tourism: An Evaluation and Assessment of Research Findings, Portland: Pacific Northwest Research Station
European Parliament [EP], (2018). Research for TRAN Committee - Overtourism: impact and possible policy responses. Burssel: Eupean Union.
81
Gehl, J. (2010). Making Cities for People. Washington: Island Press. Gehl, J. (2013) Cities for people. Washington: Island Press. Gemeente Leiden (2020). Trends in Leiden 2020. Leiden: Gemeente Leiden. Goeldner, C.R., & Ritcher, J.R.B. (2003). Tourism: Principles, practices philosophies (9th edn.). Hoboken, NJ: John
Wiley & Sons, Inc. Gonzalez, M., Coromina, V. & Galí, N. (2018) Overtourism: Residents’ perceptions of tourism impact as an indicator of
resident social carrying capacity - Case study of a Spanish heritage town. Tourism Review, 73(3), 277-296. Goodwin, H. (2017). The Challenge of Overtourism. Responsible Tourism Partnership Working Paper4. Retrieved from:
https://haroldgoodwin.info/pubs/RTP'WP4Overtourism01'2017.pdf Goodwin, H. (2019). Overtourism: Causes, Symptoms and Treatment. Tourismus Wissen - Quarterly, 16(1), 110-114. Gorrini, A. and Bertini, V. (2018), "Walkability assessment and tourism cities: the case of Venice", International Journal
of Tourism Cities, Vol. 4 No. 3, pp. 355-368. Hall, M.C. & Wililams, A.M. (2020). Tourism and Innovation. New York: Routledge. Hart, J. de, Knol, F., Maas-de Waal, C. & T. Roes, red. (2002), Sociale cohesie, leefbaarheid en veiligheid. Den Haag:
Sociaal en Cultureel Planbureau. Hens, L. (1998). Tourism and Environment. Brussel: Free University of Brussels. Hospers, G.J. (2009). Citymarketing in perspectief. Lelystad: IVIO Wereldschool. Hospers, G.J. (2014). Citymarketing: wat werkt wel en wat werkt niet? Retrieved from:
https://www.researchgate.net/publication/301649533_Citymarketing_wat_werkt_wel_en_wat_werkt_niet Hughes, N. (2018). Tourist go home’: anti-tourism industry protest in Barcelona. Social Movement Studies, 17(4), 471-
477. Jacobs, J. (1961). The Death and Life of Great American Cities. New York: Random House Kamp, I. van, Leidelmeijer, K., Marsman, G. & Hollander, A, de. (2003). Urban environmental quality and human well-
being: Towards a conceptual framework and demarcation of concepts; a literature study. Landscape and Urban Planning, 65(1), 5-18.
Kavaratzis, M. (2004). From city marketing to city branding: Towards a theoretical framework for developing city brands. Place Branding, 1(1), 58-73.
Koens, K., Postma, A. & Papp, B. (2019). Is Overtourism Overused? Understanding the Impact of Tourism in a City Context. Sustainability, 10(12). 1-15.
Kuscer, K. & Mihalic, T. (2019). Residents’ Attitudes towards Overtourism from the Perspective of Tourism Impacts and Cooperation - The Case of Ljubljana. Sustainability, 11(6), 1-16.
Larsen, S. (2007). Aspects of a Psychology of the Tourist Experience. Scandinavian Journal of Hospitality and Tourism, 7(1). 7-18.
Leefmans, L. (2019). Ook PvdA wijst op nadelen van toerisme in Leidse binnenstad. Leidsche dagblad. Retrieved from: https://www.leidschdagblad.nl/cnt/dmf20190910_99140939/ook-pvda-wijst-op-nadelen-van-toerisme-in-leidse-binnenstad?utm_source=google&utm_mediu m=organic
Leiden Marketing, (n.d.). Leiden Marketing. Retrieved from: https://www.visitleiden.nl/nl/leiden-marketing/over-leiden-marketing
Liu, X., Derudder, B. & Liu, Y. (2011), Featured graphic: GDP, livability, population, and income inequality of world cities. Environment and Planning A, 43(10), 2255-2256.
Martin, J.M.M., Martinez, J.M.G. & Fernández, J.A.S. (2018). An Analysis of the Factors behind the Citizen’s Attitude of Rejection towards Tourism in a Context of Overtourism and Economic Dependence on This Activity. Sustainability, 10(8), 1-18.
Mathieson, A. & Wall, G. (1982). Tourism: Economic, Physical, and Social Impacts. Michigan: Longman. McCool, S.F. & Lime, D.W. (2009). Tourism Carrying Capacity: Tempting Fantasy or Useful Reality? Journal of
Sustainable Tourism, 9(5), 372-388. Merrilees, B.; Miller, D. & Herington, C. (2009). Antecedents of residents’ city brand attitudes. Journal of Business
Research, 62, pp. 362-367. Milano, C., Cheer, J.M., & Novelli, M. (2018). Overtourism a Global Problem. Retrieved from:
https://www.researchgate.net/profile/Claudio_Milano3/publication/326573468_Overtourism_a_growing_global_problem/links/5b570f2a45851507a7c4e29a/Overtourism-a-growing-global-problem.pdf
Milano, C. (2018). Overtourism, social unrest and tourismphobia. A controversial debate. PASOS: Revista de Turismo y Patrimonio Cultural, 16(3), 551-564.
82
Nederlands Bureau voor Toerisme en Congressen [NBTC]. (2020, 22 january). ‘Internationaal toerisme blijft groeien in
Nederland’. Retrieved from: https://www.nbtc.nl/nl/home/newsroom/internationaal-toerisme-blijft-groeien-in-nederland-.htm
Okulicz-Kozaryn, A. (2013). City Life: Rankings (Livability) Versus Perceptions (Satisfaction). Social Indicator Research, 110(2), 433-451.
O'Reilly, A.M. (1986). Tourism carrying capacity: concepts and issues. Tourism Management, 7(3), 254-258. Parkerson, B. & Saunders, J. (2009). City branding: can goods and services branding models be used to brand cities?
Place Branding, 1(2005), 242-264. Pasquinelli, C. & Trunfio, M. (2020). Reframing urban overtourism through the Smart-City Lens. Cities, 102(1), 1-8. Pechlaner, H., Innerhofer, E. & Erschbamer, G. (2020) Overtourism: tourism management and solutions. New York:
Routledge. Pine, B.J. & Gilmore, J.H. (1999). Welcome to the Experience Economy. Harvard: Harvard Business Review Press. Reisinger, Y. (2009). International Tourism: Cultures and Behavior. Oxford: Elsevier. Ricciardi, F., Rossignoli, C. & Marco, M. de, (2013). Participatory networks for place safety and livability: organisational
success factors, International Journal of Networking and Virtual Organisations, 42-62. Richards, G. (2014). Creativity and tourism in the city. Current Issues in Tourism, 17(2), 119-144. Ruth, M. & Franklin, R.S. (2014). Liveability for all? Conceptual limits and practical implications. Applied Geography,
49(1), 18-23. Sahadat, I. (2018). Help de stad verzuipt in de toeristen en zo lossen we dat op. De Volkskrant. Retrieved from:
https://www.volkskrant.nl/nieuws-achtergrond/help-de-stad-verzuipt-in-de-toeristen-en-zo-lossen-we-dat-op~b42a1c43/
Scheepers, P., Tobi, H. & Boeije, H. (2016). Onderzoeksmethoden. Amsterdam: Boom uitgeverij Sezgin, E. & Yolal, M. (2012). Golden Age of Mass Tourism: Its History and Development. In: Visions for Global
Tourism Industry by M. Kasimoglu. Rijeka: InTech. Simón, F. J. G., Narangajavana, Y., & Marqués, D. P. (2004). Carrying capacity in the tourism industry: a case study of
Hengistbury Head. Tourism Management, 25(2), 275–283. Smith, M.K., Egedy, T., Csizmady,A., Jancsik, A., Olt, G. & Michalkó, G. (2017). Non-planning and tourism
consumption in Budapest’s inner city. Tourism Geographies, 20(3), 524-548. Sorupia, E. (2005). Rethinking the Role of Transportation in Tourism. Melbourne: University of Melbourne Steele, F. (1981). The Sense of Place. Boston: CBI Publishing Company. The Guardian, (2018, 25 June). 'Tourists go home, refugees welcome': why Barcelona chose migrants over visitors.
[Newspaper] Retrieved from: https://www.theguardian.com/cities/2018/jun/25/tourists-go-home-refugees-welcome-why-barcelona-chose-migrants-over-visitors
Throsby, D. (2009). Tourism, Heritage and Cultural Sustainability: Three ‘Golden Rules’. In Cultural Tourism and Sustainable Local Development by L. Fusco and P. Nijkamp. Farnham: Ashgate Publishing Limited.
Toffler, A. (1970). Future Shock. New York: Random House Tsaur, S.H., Yen, C.H. & Teng, H.Y. (2018). Tourist–resident conflict: A scale development and empirical study. Journal
of Destination Marketing & Management, 10(1), 152-163. United Nation World Tourism Organisation [UNTWO], (2018). Overtourism? Understanding and Managing Urban
Tourism Growth beyond Perceptions, Madrid: UNWTO. Veenhoven, R. (2000). Leefbaarheid: betekenissen en meetmethoden. Retrieved from: http://hdl.handle.net/1765/8786 Vuchic, V. (2017). Transportation for Livable Cities. London: Routledge. Walmsley, A. (2017). Overtourism and underemployment: a modern labour market dilemma. Proceedings of the
Responsible Tourism in Destinations, 13. Wheeller, B. (1991). Tourism’s troubled times: Responisble tourism is not the answer. Tourism Management, 12(2),
91-96. Williams, D.R., McDonald, C.D., Riden, C.M. & Uysal, M. (1995). Community attachment, regional identity and resident
attitudes toward tourism. In: Proceedings of the 26th Annual Travel and Tourism Research Association Conference Proceedings. Wheat Ridge, CO: Travel and Tourism Research Association: 424-428
Yang, J., Ryan, C., & Zhang, L. (2013). Social conflict in communities impacted by tourism. Tourism Management, 35(1), 82-93.

83
Yuan, Y.H. & Wu, C. (2008). Relationships among Experiential Marketing, Experiential Value and Customer Satisfaction. Journal of Hospitality & Tourism Research, 32(3), 387-410.
Zuidervaart, B. (2019, 6 september). Groeiende toeristenstroom bedreigt leefbaarheid. Trouw. Retrieved from: https://www.trouw.nl/binnenland/groeiende-toeristenstroom-bedreigt-leefbaarheid~b7a4e4d9/